
Submitted:
18 October 2024
Posted:
21 October 2024
You are already at the latest version
Abstract
The current study explores for the first time an eco-friendly solution casting method using a green solvent, Ethyl Acetate, to prepare feedstock/filaments from Polylactic Acid (PLA) biopolymer reinforced with carbon nanotubes (CNTs), followed by 3D printing and surface activation for biosensing applications. Comprehensive thermal, electrical, rheological, microstructural, and mechanical properties of developed feedstock and 3D printed parts were performed and analyzed. Herein, adding 2 wt.% CNTs to the PLA matrix marked the electrical percolation, achieving conductivity of 8.3×10⁻³ S.m-1, thanks to the uniform distribution of CNTs within the PLA matrix facilitated by the solution casting method. Rheological assessments paralleled these findings; the addition of 2 wt.% CNTs transitioned the nanocomposite from liquid-like to a solid-like behavior with a percolated network structure, significantly elevating rheological properties compared to composite with 1 wt.% CNTs. Mechanical evaluations of the printed samples revealed improvement in tensile strength and modulus compared to virgin PLA by a uniform distribution of 2 wt.% CNTs into PLA, with an increase of 14.5% and 10.3%, respectively. To further enhance the electrical conductivity and sensing capabilities of developed samples, an electrochemical surface activation treatment was applied to as-printed nanocomposite samples. Field-emission scanning electron microscopy (FE-SEM) analysis confirmed that this surface activation effectively exposed the CNTs to the surface of 3D-printed parts by removing a thin layer of polymer from the surface, thereby optimizing the composite's electroconductivity performance. The findings of this study underscore the potential of the proposed eco-friendly method in developing advanced 3D printed bio nanocomposites based on carbon nanotubes and biopolymers, using a green solution casting and cost-effective material extrusion 3D printing method, for electrochemical sensing applications.
Keywords:
Fused Deposition Modeling
; 3D Printing
; Sustainable materials
; Nanocomposites
; Electrochemical sensors
1. Introduction
Biosensors are known as analytical devices designed to convert biochemical reactions into measurable electrical signals. These signals are directly proportional to the concentration of a particular substance, referred to as an analyte, within the reaction matrix [1]. Biosensors are an alternative to traditional clinical diagnostics systems like magnetic resonance imaging (MRI), and computerized tomography (CT), presenting more feasible point-of-care diagnosis due to their selectivity, sensitivity, cost-effectiveness, and ease of manufacturing. Their application spans across a variety of sectors, including environmental monitoring and the medical industry [1,2,3]. However, several challenges persist in the development and production of biosensors, such as significant time consumption, constraints on production scalability, and substantial costs [1]. These challenges could be closely linked to fabrication techniques and material selection [4]. Among the available biosensor fabrication techniques, some of the commonly used ones are photolithography, screen printing, coating/drop casting, laser cutting, injection molding, and additive manufacturing [5,6,7]. Additive manufacturing (AM), among others, that recently grabbed the attention of scientists and researchers in biosensor development offers design flexibility, rapid fabrication, low material costs, and minimal waste, making it ideal for fabricating compact, complex, and efficient biosensing devices [8,9,10]. Among AM methods, Fused Deposition Modeling (FDM) is predominant for its simplicity, affordability, and minimal waste production. FDM typically employs non-conductive thermoplastics filaments like polylactic acid (PLA), which despite its biodegradability and biocompatibility, has limited functionality in biomedical applications due to its insulating nature [11,12,13].
Integrating nanomaterials (such as graphene, carbon nanotubes (CNTs), etc.) into thermoplastic polymers effectively enhances their properties like conductivity and mechanical strength. Polymer nanocomposites (PNCs) exhibit improved electrical, thermal, mechanical, optical, and antibacterial properties, due to the synergistic effects between nanomaterials and polymer matrices. Such advancements have expanded PNC applications for next-generation nano devices like biosensors and electronics. Using sustainable bio-renewable polymers for PNCs offers an eco-friendly alternative to traditional petroleum-based polymers, contributing to reduced plastic consumption and a greener environment [13,14,15,16].
Reinforcing CNTs to biopolymer matrices in a nanocomposite configuration enhances polymer properties, while preserving polymer biodegradability. The unique features of CNTs, including high aspect ratio, lightweight, and superior electrical and mechanical properties, are ideal to enhance polymer properties for biosensing applications. This includes facilitating electron transfer, enhancing sensitivity and selectivity, providing electrochemical stability, and ensuring biocompatibility [17]. However, challenges with CNT dispersion in the polymer matrix could restrain the electrical conductivity and electrochemical performance of the biosensor. Addressing these challenges involves selecting suitable mixing methods to enhance CNTs dispersion within polymer, along with modifying CNT surfaces for optimal integration [18,19,20]. Achieving PNCs with a lower percolation threshold is also of interest for enhancing biosensor properties such as mechanical strength, electrical conductivity, and thermal stability. The low percolation threshold effectively offsets the manufacturing complexities and degradation of mechanical properties commonly associated with high reinforcement concentrations. Additionally, it reduces reliance on expensive nanomaterials, addressing environmental concerns linked to the overuse of nanomaterials, thus establishing a balance between improved performance, cost-effectiveness, and environmental sustainability [21,22].
Melt mixing and melt extrusion blending are well known approaches for incorporating CNTs into polymer matrices, as explored by Ivanov et al. [23] and Mora et al. [24] in their studies on FDM 3D printed PLA:CNTs composites. Ivanov et al. [23] observed a conductivity increased from about 8×10⁻¹⁰ to 2.1×10⁻² S.m-1 by adding 0 to 6 wt.% CNTs to PLA. Mora et al. [24] illustrated a low percolation threshold at 0.23 vol.% CNT in FDM printed composites with the conductivity of around 5×10⁻⁷ S.m-1. Despite the effectiveness of melt mixing in these studies to prepare PLA:CNTs feedstock for FDM printing, it could lead to potential CNT and polymer degradation due to high temperatures, impacting the composites properties for sensor applications. Alternatively, solution casting method offers controlled CNT dispersion within polymer at lower temperatures, facilitates ease of operation, and achieves more effective dispersion of CNTs within the polymer matrix at lower concentrations of CNTs, in comparison to melt mixing [25,26]. Solution casting method, used by Kim et al. [27] to make PLA:CNT filaments using dichloromethane (DCM) as solvent for PLA, resulted in a conductivity of 1×10⁻⁴ S.m-1 by adding 1 wt.% CNTs compared to baseline PLA matrix. Furthermore, the Young’s modulus of the composite exhibited an increase with the successive addition of CNTs. Notably, an enhancement of up to 50.34% in Young’s modulus was observed when 4 wt.% of CNTs were incorporated into PLA, in comparison to the baseline PLA matrix. Junpha et al. [28] achieved a conductivity of 110 S.m-1 using a 10 wt.% CNT concentration within PLA using solution casting process with chloroform as a PLA solvent, while the lower concentrations were not examined. However, the use of toxic solvents like DCM [27], and chloroform [28] in the solution mixing process in these studies poses health risks due to their toxicity and carcinogenic potential, raising sustainability concerns [29,30]. Moreover, among these studies, only Junpha et al. [28] explored the electrochemical sensing capabilities of FDM printed PLA:CNTs samples towards potassium hexacyanoferrate (K4Fe(CN)6), hydrogen peroxide (H2O2), and nicotinamide adenine dinucleotide (NADH) at varying concentrations, to the best of authors’ knowledge. Particularly, a high CNTs loading of 10 wt.% was used in this study, enabling the 3D printed PLA:CNTs electrode to detect potassium ferricyanide (K4Fe(CN)6), NADH, and H2O2 with detection limits of 9.8 μm, 2.9 μm, and 5.3 μm, respectively.
Therefore, a knowledge gap exists regarding how an appropriate eco-friendly solution to prepare CNT-biopolymer-based feedstock for material extrusion 3D printing can enhance the dispersion of fillers within the polymer matrix, leading to improved conductivity and mechanical properties of 3D printed parts. Uniform distribution of CNT within the polymer matrix enhances electrical conductivity of 3D printed components with a lower amount of CNT content (decreased percolation threshold). To address this gap, in this study, for the first time, an eco-friendly solution casting method using green ethyl acetate solvent, was employed to prepare PLA:CNTs nanocomposite for FDM 3D printing working electrode in electrochemical biosensor. This motive is based on the need to move away from traditional, toxic solvents in preparing CNT-polymeric nanocomposites that pose significant environmental and health risk. Ethyl acetate not only aligns with the principles of green chemistry but also proves to be a highly effective solvent for PLA [31,32]. Its adoption over hazardous solvents like chloroform and DCM represents a significant stride towards safer, more sustainable industrial and scientific practices.
After optimization of PLA:CNTs nanocomposite feedstock formulation, a low-cost desktop Filabot extruder was used to make 3D printable filaments and a desktop Prusa MK3S+ FDM printer was subsequently used to 3D print electrode samples. Thermal, rheological, morphological, and electrical conductivity of developed feedstocks and 3D printed parts were examined fully with varying CNT concentrations. To further enhance electrical conductivity of printed parts for electrochemical sensing applications, an innovative electrochemical surface activation method was employed to remove a thin layer of polymer PLA from the surface and expose the embedded CNTs onto the surface of samples. Electrochemical analysis was conducted on both activated and as-printed electrode samples using 5 mM ferro/ferricyanide analyte, as the electroactive probe. It was demonstrated that the ferro/ferricyanide redox couple agent, upon interacting with the activated electrodes, showed an oxidation peak with a current density of 17.6 μA.cm-2 compared to the as-printed electrode, which exhibited no noticeable current density peak. The successful preliminary results of this study, marked by enhanced mechanical properties, electrical conductivity, and electrochemical activity, demonstrated the possibilities of developing and 3D printing high conductive bio-nanocomposites using a sustainable approach for the advancement of the next generation of nanodevices like carbon based polymeric nanocomposite biosensors with the lowest possible percolation threshold.
2. Materials and Methods
2.1. Materials
The Luminy LX175 PLA was supplied from Total Corbion (Total Energies Corbion, The Netherlands) with a melt flow index (MFI) and a density (ρ) of 6 g/10 mins (at 210 ℃/2.16 kg) and 1.24 g/cm3, respectively. Carboxyl functionalized multiwalled carbon nanotubes (MWCNT-COOH) were sourced from Cheap Tubes Inc. (Grafton, VT USA) with a purity of 99.9 wt.%, an outer diameter ranging from 10-20 nm, and a length of 10-30 µm. High-performance liquid chromatography (HPLC) grade methanol and ethyl acetate were provided by Fisher Chemical.
2.2. Methods
2.2.1. Polymeric Nanocomposite (PNC) Preparation
In this study, MWCNTs-COOH were reinforced into PLA polymeric matrix using a green phase-inversion process known as non-solvent-induced phase separation (NIPS) [12]. To prepare polymeric nanocomposites, PLA pellets were first dried overnight at 70 ℃ in an oven to remove moisture content. Subsequently, the dried PLA pellets were dissolved in ethyl acetate at 80 °C for 4 hours, maintaining a PLA to ethyl acetate ratio of 1:10 (w/v) under magnetic stirring. Once cooled to ambient temperature, MWCNTs-COOH was added into the solution and stirred for another 4 hours. This mixture was then subjected to an IKA® T25 digital ULTRA-TYRRAX® homogenizer equipped with an S 25 N–10 G dispersing tool, operating at 12,000 rpm for 30 minutes. Subsequently, the PLA:CNTs:EA mixture was added to methanol under magnetic stirring, facilitating the phase separation and resulting in the precipitation of the PLA:CNTs nanocomposite. After filtration, the composite was rinsed thoroughly with methanol to eliminate residual ethyl acetate. The prepared nanocomposite feedstock was then dried overnight at 50°C in an oven to ensure complete methanol evaporation. All composite formulations, including a code chart, were tabulated in Table 1.
2.2.2. Filament Fabrication and FDM 3D-Printing
All formulations detailed in Table 1 were extruded using a Filabot EX2 single-screw extruder, featuring a 1.75 mm nozzle diameter, operating at a nozzle temperature of 152.5±2.5 ℃, to produce standard 1.75±0.1 mm filaments suitable for FDM 3D-printing. A desktop 3D printer, Prusa MK3S+, was used for 3D printing. The conversion of STL files to the compatible G-code format for 3D-printer was achieved using Cura Slicer software. Printing parameters were the same for all samples, with bed and nozzle temperatures of 60 ℃ and 200 ℃, respectively, with a 0.4 mm nozzle diameter, 0.2 mm layer height, 100% infill density, and a printing speed of 10 mm/s. All samples were printed in a flat-on-bed orientation. Table 2 provides a summary of the printing parameters.
3. Characterization Tests
3.1. Attenuated Total Reflection—Fourier Transform Infrared Spectroscopy (ATR-FTIR)
FTIR spectroscopy of formulations from Table 1 was carried out using a PerkinElmer Spectrum 100 FT-IR Spectrometer equipped with horizontal attenuated total reflectance (HATR) accessory (Waltham Massachusetts, United State). No additional preparation was required for the formulations. Infrared spectra were captured in absorption mode, covering a wavenumber range of 600 to 4000 cm-1, with a 4 cm-1 resolution, averaging 16 scans.
3.2. Thermal Analysis
All filaments from Table 1 formulations underwent thermal analysis using a differential scanning calorimetry (DSC) Q20 instrument (TA Instruments, New Castle, DE, USA) in a nitrogen atmosphere at a flow rate of 50 mL/min. Roughly 5 mg of each ground sample was placed in an aluminum Tzero pan for DSC analysis. The samples were heated at 10 ℃/min to 200 ℃, maintained for three minutes, cooled to 30 ℃ at the same nitrogen flow rate, and again held for three minutes for thermal equilibrium. This process was followed by a second heating cycle up to 200 ℃ at 10 ℃/min. For this study, the melting temperature (Tm), cold crystallization temperature (TCC), and glass transition temperature (Tg) were noted for both heating cycles. The second cycle was specifically analyzed to eliminate any influence from the processing thermal history. The crystallinity percentage of PLA (%XCrPLA) was determined using Equation 1, with the value set at 93.7 J/g (representing the heat of fusion for 100% crystalline PLA) and values HCCPLA and HmPLA for cold crystallization and melting enthalpy of PLA, respectively [33].
Contrarily, thermal stabilities of all filaments were investigated using thermogravimetric analysis (TGA) with a TGA Q50 instrument (TA Instruments, New Castle, DE, USA). For each test, an average of 3.5 mg sample was heated from 30 to 600 ℃ at 10 ℃/min in a nitrogen atmosphere, with a nitrogen flow rate of 40 mL/min.
3.3. Rheological Characteristics
For the rheological study of all formulations in Table 1, ASTM D4440 standard was employed while using a Discovery HR-2 Rheometer (TA Instruments, New Castle, DE) with a sample height and radius of 2 and 12.5 mm, respectively. An oscillation frequency sweep, in angular frequency, of 0.1 to 100 rad/s at 190 C was performed for all 3D printed samples with a strain of 0.5 % and a plate gap of 1.0 mm. Following the frequency sweep, the modified Cross model was employed to obtain the zero-shear viscosity (Equation (2)) for all formulations, where η is the viscosity, η0 is the zero-viscosity, γ is the shear rate, τ0 is the yield stress, and m is the consistency index [34].
3.4. Electrical Characteristics
Three cylindrical specimens of CNT-reinforced polymeric composites, each with different weight percentages of CNTs, were FDM 3D printed. Each specimen had a diameter of 20 mm and a thickness of 0.3 mm. To moderate contact resistance, a uniform layer of conductive silver ink (M.E. Taylor Engineering Inc., Rockville, USA) was applied to the grip areas on the surface of each specimen. The electrical conductivity of the specimens was subsequently evaluated using a Keysight E4990A Impedance Analyzer.
3.5. Mechanical Properties
Tensile tests were conducted up to the point of rupture on five replicates of each dog bone-shaped sample as per ASTM D 638-14 Type V specifications [35]. A Universal Testing Machine (Instron® 3400 series, MA, US) was used with a crosshead speed of 1 mm/min. Dog-bone-shaped Type V samples were FDM 3D printed based on the formulations detailed in Table 1, using the printing parameters listed in Table 2. Following the tests, properties such as tensile modulus (E), tensile strength (σmax), elongation at break (ε%), toughness, and resilience were assessed.
3.6. Morphology and Electrochemical Performance
The surface morphology of the PNCs was thoroughly analyzed using a Schottky SU7000 Field-Emission Scanning Electron Microscopy (FE-SEM) with ultra-high resolution, with no need for sputter coating.
An electrochemical surface activation method was utilized to selectively dissolve the insulating PLA layer from the electrode’s surface, thereby exposing the conductive CNTs on the surface, using a Gamry Reference 600 potentiostat/galvanostat controlled by Gamry framework. To this end, cyclic voltammetry (CV) was conducted in a 0.5 M sodium hydroxide (NaOH) solution, recognized for its capability to dissolve PLA through saponification [36]. To ensure the effective removal of PLA from the electrode surfaces, a potential window ranging from -1.0 V to +1.4 V was employed over 250 cycles, with respect to an Ag/AgCl reference electrode at a scan rate of 50 mV/s.
After the surface activation, the electrochemical performance of the FDM 3D printed specimens was precisely evaluated using cyclic voltammetry (CV), to detect 5 mM [Fe(CN)6]4-/3- redox couple agent. This study aimed to highlight the effectiveness of the electrochemical activation technique in augmenting the performance of FDM 3D-printed parts for sensing applications.
4. Results and Discussion
4.1. FT-IR Spectroscopy
Figure 1 illustrates the Fourier Transform Infrared (FT-IR) spectroscopy analysis of both Virgin PLA and PNCs. Virgin PLA displays a characteristic absorption band at 1449 cm-1 for CH3 stretching and a C-H deformation vibration at 1388 cm-1 [33]. The PNCs FT-IR spectra reveal minor spectral alterations after CNT incorporation, particularly a slight shift and sharpening of bands in the 1300-1450 cm-1 range. This suggests molecular interactions between CNTs and polymer chains, possibly arising from PLA helical structure that forms a coiling polymer film around CNTs [37]. Additionally, the typical C-O stretching vibration from PLA, originally at 1162 cm-1, shifted to a lower wavenumber in the PNCs samples. This signifies a potential adhesion between CNTs and the PLA matrix, likely due to interactions between the hydroxyl groups of PLA and hydroxyl on the CNT surface, facilitated through solution mixing [38]. As a conclusion, The FTIR spectra of PNCs display all the characteristic vibration bands associated with both CNTs and PLA.
4.2. Thermal Analysis
DSC analysis revealed distinct thermal behaviors in PLA and D-PLA. PLA exhibited a single melting point without clear crystallization temperature during cooling, suggesting incomplete crystal formation (Figure 2a,b). Conversely, D-PLA showed two melting points at 147 °C and 153 °C, likely due to different crystalline phases in PLA altered by ethyl acetate dissolution (Figure 2a). Rapid cooling of D-PLA resulted in imperfect crystal formation, with less stable crystals that are melting at lower temperatures during heating, followed by more stable crystals formed during recrystallization that are melting at higher temperatures [39].
DSC curves were also evaluated to investigate the effect of CNTs incorporation on the crystallization properties of PNCs (Figure 2a–c). In general, CNTs are known to serve as effective nucleating agents that upon dispersion of CNTs in PNCs enhance the crystallization rate of PLA [40,41]. During the first heating scan, a noticeable shift of the TCC to a lower temperature relative to virgin PLA was observed, which could be attributed to the nucleating effect of the well-dispersed CNTs (Figure 2a). Moreover, there was a successive increase in the %XCrPLA with increasing CNTs concentration, suggesting that CNTs act as nucleating agents in PLA, facilitating the crystallization process (Table 3) [20]. Subsequently, the PNC samples were subjected to a cooling scan, where no obvious crystallization peak was observed (Figure 2b).
Upon the second heating scan, the %XCrPLA was successively increased with an increasing concentration of CNTs. However, in contrast to the first heating scan, the TCC exhibited a positive temperature shift (Figure 2c). Within this context, it was observed that cold crystallization of PNCs consistently occurs at a faster rate (lower temperature) during the first heating scan (Figure 2a), while it happens at a slower rate (higher temperature) during the second heating scan (Figure 2c), in comparison to virgin PLA. More precisely, during the first heating scan, the PLA would melt, erasing the thermal history of the sample. The subsequent cooling scan promotes a more ordered crystal structure; Therefore, the more ordered crystal structure necessitates greater energy, and subsequently a higher temperature, to initiate cold crystallization during the second heating scan [41,42].
Additionally, the Tg and Tm values in PNCs were found to be either equal or varied by only a difference of 2 ℃ compared to virgin PLA, across both the first and second heating scans (as illustrated in Table 3). This observation suggests that the incorporation of CNTs filler has a minimal impact on the mobility of the polymer chains, as evidenced by the minimal impact of CNTs filler on Tg and Tm. Thus, the observed changes in cold crystallization (TCC) could primarily be attributed to variations in nucleation effect of CNTs rather than the change in mobility of polymer chains [41].
To further validate the DSC findings, the density and crystallinity (from the second heating cycle) of D-PLA and PNCs were measured to assess variations in PLA crystallinity (as illustrated in Figure 2d). With increasing CNT concentration, the PLA density exhibited a linear rise, moving from 1.24 g/cm3 to 1.255 g/cm3 (Figure 2d). Concurrently, the crystallinity ratio also increased in accordance with the CNT concentration, aligning with the DSC tabulated results (Table 3).
According to the thermogravimetric analysis (TGA) presented in Figure 3, the onset degradation temperature of PLA is around 300 ℃. This is primarily attributed to the loss of end groups (esters) from the main chain, culminating in complete decomposition at 380 ℃ [33]. In contrast, D-PLA reveals a comparable behavior, with an onset degradation temperature identical to PLA at 320 ℃, but a decreased offset at 370 ℃. This slight variation could be ascribed to the thermal history of D-PLA and the solution mixing and filament making process, which also influenced the crystallinity and structure of PLA. Furthermore, the incorporation of CNTs into the PLA matrix positively influenced its thermal stability. This is evident from the 6.67% shift in the onset degradation temperature, moving from 300 ℃ to 320 ℃ across all PNCs. Such enhanced thermal stability could likely be attributed to the superior thermal characteristics of CNTs, combined with the strong interfacial interaction between CNTs and the polymer matrix. Moreover, the ash content at 500 ℃ increased from roughly 1.5 wt.% in PLA to 4.6 wt.% in PNC-4, highlighting the presence and stability of CNTs even at 500℃ [43].
4.3. Rheology Characteristics of FDM 3D Printed PNCs
The rheological properties of FDM 3D printed samples, as detailed in Table 1, were examined and depicted in Figure 4, while the resulting zero shear viscosity for each specimen was tabulated in Table 4. PLA exhibited typical non-Newtonian shear-thinning behavior, with decreasing complex viscosity at higher angular frequencies [44]. D-PLA exhibited a similar behavior but with increased viscosity, potentially due to alterations in polymer structure and crystallinity from dissolution and solidification processes (Figure 4a). By contrast, PNC samples displayed significantly higher viscosity compared to PLA, particularly in PNC-3 and PNC-4, highlighting the reinforcing effect of CNTs (Figure 4b). This increase in viscosity with rising CNT concentration, noted from PNC-1 to PNC-4, can be attributed to the high aspect ratio of CNTs and their capacity to form interconnected networks within the PLA matrix. Notably, the rheological distinction observed between PNC-2 and PNC-3 suggests the occurrence of CNT percolation. At a 2 wt% concentration of CNT within PLA (PNC-3), CNTs form a continuous path throughout the PLA matrix, thereby enhancing properties such as electrical conductivity and complex viscosity [12,45]. PNC-3 exhibited significantly steeper slopes and higher complex viscosity compared to PNC-2, implying that as the concentration of CNTs increases, the interaction between CNTs and PLA enhances. Consequently, the composite gradually approaches the percolation threshold (PNC-3, 2 wt.%), leading to a pronounced increase in complex viscosity.
Figure 5a,b illustrate the storage (G’; representing the elastic part of material) and loss modulus (G”; representing the viscous part of material) of PNCs composites, PLA and D-PLA. For both PLA and D-PLA, there is a consistent rise in the G’ and G” moduli as angular frequency increases. Particularly, D-PLA demonstrates a marginally higher modulus than PLA, potentially due to the alteration in PLA structure during the dissolution and solidification process. Furthermore, the increase in storage and loss modulus with increased CNTs concentration underscores CNTs reinforcing capability (Figure 5a,b). The reinforcing effect is further evident in shear viscosity (shown in Figure 5c), where CNTs concentration amplifies the inherent shear-thinning behavior of PLA [44,45].
Specifically, for most of the PNCs samples, the loss modulus consistently remains higher than the storage modulus across all frequencies. However, a lower loss modulus was observed for PNC-3 at lower frequencies which surpass the storage modulus at higher frequencies. In contrast, PNC-4 maintains a superior storage modulus throughout all frequencies. For both storage and loss modulus, as the CNTs concentration surpasses 1 wt.%, the modulus curve slopes for the PNCs experience a notable alteration. G’ remains nearly frequency-independent, indicating a pseudo-solid-like CNTs network within the polymer matrix. The transition from liquid-like to solid-like viscoelastic behavior in the lower frequency range, particularly observed between PNC-2 and PNC-3, highlights the considerable restriction of long-range motion in polymer chains. This is attributed to the influence of the CNTs network within the composite. Furthermore, the frequency-dependent behavior of G” also shows the same tendency as G’ [45].
Figure 5d presents the variation of the loss tangent (Tan δ) across different CNT concentrations, a parameter crucial for assessing material viscoelasticity. Tan δ, more sensitive to relaxation changes than storage and loss modulus, displayed a distinct response to varying CNT concentrations. For PNC-1 and PNC-2, Tan δ decreased with increasing frequency, typical of viscoelastic liquids. However, PNC-3 and PNC-4 showed a moderate Tan δ increase with frequency, indicating a predominantly elastic response. This shift implies that beyond a specific CNT concentration, likely between 1 and 2 wt.%, Tan δ becomes frequency-independent, marking the formation of a CNT percolation network [45].
4.4. Electrical Conductivity of FDM 3D Printed PNCs
Figure 6 illustrates that the electrical conductivity of FDM 3D printed PNCs significantly increases with the addition of CNTs. The increased conductivity in PNCs is attributed to the inherent electrical properties of CNTs. Once integrated into the polymer matrix, CNTs form a conductive network that enhances electron transfer. CNTs high aspect ratio and surface area are also critical for establishing percolation pathways that boost conductivity, even at low CNT concentrations [19,20,21].
A notable increase in conductivity, from 5×10⁻¹⁰ S.m-1 at 1 wt.% CNTs to 0.0083 S.m-1 at 2 wt.%, indicates the onset of percolation around 1 wt.% CNTs. Introducing just 0.5 wt.% CNTs shifted conductivity from 1×10-12 S.m-1 (in virgin PLA) to 1×10⁻¹⁰ S.m-1, with minimal changes up to 1 wt.% CNTs; beyond which, a clear percolation effect is observed. The conductivity values of 0.0083 and 0.05 S.m-1 for 2 and 3 wt.% CNTs, respectively, underscore the formation of an interconnected conductive network of CNTs within the PLA matrix.
4.5. Mechanical Characteristics of FDM 3D Printed Specimens
The effect of reinforcing CNTs into the PLA matrix on the mechanical properties of FDM 3D printed samples was evaluated. Results were compared with FDM 3D printed Virgin PLA specimen (Figure 7). The virgin PLA showcased an average tensile strength of 56 MPa, a tensile modulus of 2.62 GPa, and an elongation at break of 4.1%. By successive addition of CNTs to PLA, a notable improvement in mechanical properties was observed, as detailed in Table 5. Herein, the applied tensile force to the PNCs was effectively transferred to the CNTs, resulting in an enhancement in both the tensile strength and modulus of the 3D printed PNC samples. Notably, the incorporation of 3 wt.% CNTs into PLA (referred to as PNC-4) resulted in a 27.24% increase in tensile strength and a 17.78% enhancement in modulus compared to virgin PLA. A similar pattern was evident in other mechanical properties, where the elongation at break, toughness, and resilience faced an increase of 73%, 27.63%, and 73.5%, respectively.
4.6. Electrochemical Performance and Morphology
The electrochemical characteristics of a 3D printed PNC-3 (2 wt% of CNTs) were particularly examined to evaluate its potential applicability in electrochemical sensing applications. To this end, the samples were electrochemically surface activated using cyclic voltammetry in a 0.5 M NaOH electrolyte for 250 cycles and compared with as-printed samples (Figure 8 and Figure 9a). Oxidation peaks in Figure 9a (red-line), subsequent to the 250-cycle voltammetry in NaOH, attributed to the formation of oxygen-containing functional groups on the CNT surface and/or electrochemical degradation of PLA while reduction peaks can be attributed to the reduction of oxygen-containing functional groups on the CNTs, representing electrode’s electrocatalytic activity. By contrast, the as-printed PNC-3 electrode exhibited almost no response peak, as illustrated in Figure 9a (black-line) which signifies the presence of the insulating PLA layer on the as-printed surface.
Field emission scanning electron microscopy (FE-SEM) was employed to assess the morphology of the surface of the PNC-3 before and after surface activation in NaOH (Figure 8). The FE-SEM image presented in Figure 8a demonstrate a complete surface coverage of the polymer matrix, with CNTs embedded within. Figure 8b illustrates a homogeneously distributed layer of CNTs on the surface, resulting from the electrochemical activation process that effectively removed the PLA layer from the surface.
As a proof of concept, Figure 9b illustrates the cyclic voltammetry behavior of both as-printed (black-line) and electro-activated (red-line) 3D printed PNC-3, in a 5 mM [Fe(CN)6]4-/3- redox agent solution, at a 50 mV/s scan rate. The redox peaks observed are the characteristics of the reversible electron transfer reactions between ferricyanide Fe (CN)63- and ferrocyanide Fe(CN)64- species, showing the electrochemical performance of 3D printed CNT-base PLA nanocomposite electrode and its catalytic efficiency, conductivity, and electrochemical stability [12]. Notably, the activated electrode exhibited an oxidation peak with a current density of 17.6 μA.cm-2.
To compare the outcome of this study with the open literature, Table 6 compares similar works, highlighting measured conductivity of FDM printed samples at different CNT concentrations within PLA matrix. While there are some studies using melt mixing method that achieved low percolation threshold with high conductivity (e.g., 0.5 wt.% of CNTs and conductivity of 5×10⁻⁷ S.m-1 [24], 1.5 wt.% CNTs and conductivity approximately 1×10⁻⁸ S.m-1 [46]), our study represents an eco-friendly solution casting approach for the first time, utilizing ethyl acetate as green solvent, to uniformly distribute CNTs inside polymer, without using high temperature, and achieve low percolation threshold onset of 1 wt.% of CNT (5×10⁻¹⁰ S.m-1). The only two other studies that using solution casting methods available in the literature used toxic solvents to prepare their feedstock, Dichloromethane (DCM) and chloroform [27,28]. Out of the two studies mentioned, one did not report the percolation threshold [27], while the other study investigated only adding 10 wt.% CNTs [28]. Furthermore, our study expands the scope of comprehensive investigation beyond the property evaluations (e.g., thermal, mechanical, and electrical properties), by further studying and comparing the electrochemical response of the developed 3D printed nanocomposites, an area that has been scarcely addressed previously.
5. Conclusion
The current study investigates for the first time the feedstock/filament preparation, 3D printing, and surface activation of a high-performance nanocomposite based on PLA biopolymer and multi-walled carbon nanotubes, using an eco-friendly approach. Introducing a green phase-inversion process marks this study as the first practice of using an environmentally friendly solvent, ethyl acetate, in a solution casting method to fabricate bio nanocomposite feedstocks compatible with a low-cost desktop 3D printer. Various formulations with varied CNT concentrations (0.5 to 3 wt.%) were developed and investigated to examine CNTs impact on the physio-chemical and mechanical properties of 3D-printed parts. The results revealed that electrical conductivity of developed nanocomposite significantly enhanced from nearly 1×10-12 S.m-1 for virgin PLA to 8.3×10⁻³ S.m-1 by adding of only 2 wt.% CNTs, thanks to the uniform distribution of CNTs inside the polymer following the green solution casting method. This shift indicates a percolation threshold at 2 wt.% CNTs, where the conductivity was 8.3×10⁻³ S.m-1. The rheological analysis showed an increase in complex and shear viscosity as a result of the sequential addition of CNTs filler inside polymer that could be attributed to the reinforcing effect of CNTs within the PLA matrix. Specifically, a notable increase in complex viscosity from PNC-2 to PNC-3 (from 717 to 15940 Pa.s) is indicative of a percolated network of CNTs within the polymer matrix, suggesting enhanced interaction between the CNTs and the polymer chain. Additionally, the degree of crystallinity of the PNCs exhibited a progressive increase with successive addition of CNTs, evident in both the initial and subsequent heating scans. The mechanical properties of 3D printed samples exhibited a progressive improvement with successive incorporation of CNTs into PLA matrix. Specifically, the PNC-3 sample, which contained 2 wt.% CNTs in the PLA matrix, demonstrated a significant increase in mechanical performance compared to virgin PLA, where a 14.5% enhancement in tensile strength and a 10.3% increase in modulus was observed. To enhance conductivity and electrochemical response of 3D printed samples, electrochemical surface activation was performed, and the results showed improved electrochemical activity towards ferro/ferricyanide redox agent. The promising results of this study highlight the potential of using developed 3D printed PLA:CNTs bio-nanocomposite through sustainable feedstock preparation and affordable 3D printing approaches for practical application in electrochemical sensing, which is currently under study by our group.
Author Contributions
Conceptualization J.S, H.F, G.R.; Methodology, J.S, H.F, G.R.; Validation, J.S, H.F, G.R.; Investigation, J.S.; Writing-Original Draft Preparation, J.S.; Writing-Review and Editing, J.S, H.F.; Visualization, J.S, H.F, G.R.; supervision, H.F, G.R. All authors have read and agreed to the published version of the manuscript.
Funding
No relevant financial or non-financial interests to disclose.
Institutional Review Board Statement
Not applicable.
Informed Consent Statement
Not applicable.
Data Availability Statement
All data generated and/or analyzed during this study are included in the published article.
Conflicts of Interest
The authors declare no conflicts of interest.
References
- Erdem A, Yildiz E, Senturk H, Maral M (2023) Implementation of 3D printing technologies to electrochemical and optical biosensors developed for biomedical and pharmaceutical analysis. J Pharm Biomed Anal 230:115385. [CrossRef]
- Mohammadpour-Haratbar A, Zare Y, Rhee KY (2022) Electrochemical biosensors based on polymer nanocomposites for detecting breast cancer: Recent progress and future prospects. Adv Colloid Interface Sci 309:102795. [CrossRef]
- Son MH, Park SW, Sagong HY, Jung YK (2022) Recent Advances in Electrochemical and Optical Biosensors for Cancer Biomarker Detection. BioChip J 2022 171 17:44–67. [CrossRef]
- Thakur PS, Sankar M (2022) Nanobiosensors for biomedical, environmental, and food monitoring applications. Mater Lett 311:131540. [CrossRef]
- Jiang Y, Islam MN, He R, et al. (2023) Recent Advances in 3D Printed Sensors: Materials, Design, and Manufacturing. Adv Mater Technol 8:2200492. [CrossRef]
- Sharifi J, Fayazfar H (2021) Highly sensitive determination of doxorubicin hydrochloride antitumor agent via a carbon nanotube/gold nanoparticle based nanocomposite biosensor. Bioelectrochemistry 139:107741. [CrossRef]
- Han T, Kundu S, Nag A, Xu Y (2019) 3D Printed Sensors for Biomedical Applications: A Review. Sensors 2019, Vol 19, Page 1706 19:1706. [CrossRef]
- Karimi N, Fayazfar H (2023) Development of highly filled nickel-polymer feedstock from recycled and biodegradable resources for low-cost material extrusion additive manufacturing of metals. J Manuf Process 107:506–514. [CrossRef]
- Tan LJ, Zhu W, Zhou K (2020) Recent Progress on Polymer Materials for Additive Manufacturing. Adv Funct Mater 30:2003062. [CrossRef]
- Martins P, Pereira N, Lima AC, et al. (2023) Advances in Printing and Electronics: From Engagement to Commitment. Adv Funct Mater 33:2213744. [CrossRef]
- Sharma A, Faber H, Khosla A, Anthopoulos TD (2023) 3D printed electrochemical devices for bio-chemical sensing: A review. Mater Sci Eng R Reports 156:100754. [CrossRef]
- Sharifi J, Rizvi G, Fayazfar H (2024) Sustainable 3D printing of enhanced carbon nanotube-based polymeric nanocomposites: green solvent-based casting for eco-friendly electrochemical sensing applications. Int J Adv Manuf Technol 131:4825–4837. [CrossRef]
- Shinyama K (2018) Influence of Electron Beam Irradiation on Electrical Insulating Properties of PLA with Soft Resin Added. Polymers (Basel) 10:1–5. [CrossRef]
- Azizi-Lalabadi M, Jafari SM (2021) Bio-nanocomposites of graphene with biopolymers; fabrication, properties, and applications. Adv Colloid Interface Sci 292:102416. [CrossRef]
- Shameem MM, Sasikanth SM, Annamalai R, Raman RG (2021) A brief review on polymer nanocomposites and its applications. Mater Today Proc 45:2536–2539. [CrossRef]
- Carroccio SC, Scarfato P, Bruno E, et al. (2022) Impact of nanoparticles on the environmental sustainability of polymer nanocomposites based on bioplastics or recycled plastics—A review of life-cycle assessment studies. J Clean Prod 335:130322. [CrossRef]
- Karimi F, Karimi-Maleh H, Rouhi J, et al. (2023) Revolutionizing cancer monitoring with carbon-based electrochemical biosensors. Environ Res 239:117368. [CrossRef]
- Ma PC, Siddiqui NA, Marom G, Kim JK (2010) Dispersion and functionalization of carbon nanotubes for polymer-based nanocomposites: A review. Compos Part A Appl Sci Manuf 41:1345–1367. [CrossRef]
- Soni SK, Thomas B, Kar VR (2020) A Comprehensive Review on CNTs and CNT-Reinforced Composites: Syntheses, Characteristics and Applications. Mater Today Commun 25:101546. [CrossRef]
- Mi D, Zhao Z, Bai H (2023) Improved Yield and Electrical Properties of Poly(Lactic Acid)/Carbon Nanotube Composites by Shear and Anneal. Materials (Basel) 16:. [CrossRef]
- Khan T, Irfan MS, Ali M, et al. (2021) Insights to low electrical percolation thresholds of carbon-based polypropylene nanocomposites. Carbon N Y 176:602–631. [CrossRef]
- Ong YT, Tan SH (2019) Carbon nanotube-based biodegradable polymeric nanocomposites: 3Rs (Reduce, Reuse, and Recycle) in the design. Handb Ecomater 4:2787–2802. [CrossRef]
- Ivanov E, Kotsilkova R, Xia H, et al. (2019) PLA/Graphene/MWCNT Composites with Improved Electrical and Thermal Properties Suitable for FDM 3D Printing Applications. Appl Sci 2019, Vol 9, Page 1209 9:1209. [CrossRef]
- Mora A, Verma P, Kumar S (2020) Electrical conductivity of CNT/polymer composites: 3D printing, measurements and modeling. Compos Part B Eng 183:107600. [CrossRef]
- Ke K, Wang Y, Liu XQ, et al. (2012) A comparison of melt and solution mixing on the dispersion of carbon nanotubes in a poly(vinylidene fluoride) matrix. Compos Part B Eng 43:1425–1432. [CrossRef]
- Spinelli G, Lamberti P, Tucci V, et al. (2018) Morphological, Rheological and Electromagnetic Properties of Nanocarbon/Poly(lactic) Acid for 3D Printing: Solution Blending vs. Melt Mixing. Mater 2018, Vol 11, Page 2256 11:2256. [CrossRef]
- Kim HG, Hajra S, Oh D, et al. (2021) Additive manufacturing of high-performance carbon-composites: An integrated multi-axis pressure and temperature monitoring sensor. Compos Part B Eng 222:109079. [CrossRef]
- Junpha J, Wisitsoraat A, Prathumwan R, et al. (2020) Electronic tongue and cyclic voltammetric sensors based on carbon nanotube/polylactic composites fabricated by fused deposition modelling 3D printing. Mater Sci Eng C 117:111319. [CrossRef]
- Torkelson TR, Oyen F, Rowe VK (1976) The toxicity of chloroform as determined by single and repeated exposure of laboratory animals. Am Ind Hyg Assoc J 37:697–705. [CrossRef]
- Schlosser PM, Bale AS, Gibbons CF, et al. (2014) Human Health Effects of Dichloromethane: Key Findings and Scientific Issues. Environ Health Perspect 123:114–119. [CrossRef]
- Vergaelen M, Verbraeken B, Van Guyse JFR, et al. (2020) Ethyl acetate as solvent for the synthesis of poly(2-ethyl-2-oxazoline). Green Chem 22:1747–1753. [CrossRef]
- Han W, Rao D, Gao H, et al. (2022) Green-solvent-processable biodegradable poly(lactic acid) nanofibrous membranes with bead-on-string structure for effective air filtration: “Kill two birds with one stone.” Nano Energy 97:107237. [CrossRef]
- Jubinville D, Sharifi J, Mekonnen TH, Fayazfar H (2023) A Comparative Study of the Physico-Mechanical Properties of Material Extrusion 3D-Printed and Injection Molded Wood-Polymeric Biocomposites. J Polym Environ 31:3338–3350. [CrossRef]
- Dealy JM, Wissbrun KF (1999) Melt Rheology and Its Role in Plastics Processing. Melt Rheol Its Role Plast Process. [CrossRef]
- ASTM D638, Standard test method for tensile properties of plastics.
- Rocha DP, Rocha RG, Castro SVF, et al. (2022) Posttreatment of 3D-printed surfaces for electrochemical applications: A critical review on proposed protocols. Electrochem. Sci. Adv. 2:e2100136. [CrossRef]
- Park SG, Abdal-Hay A, Lim JK (2015) Biodegradable poly(lactic acid)/multiwalled carbon nanotube nanocomposite fabrication using casting and hot press techniques. Arch Metall Mater 60:1557–1559. [CrossRef]
- De Bortoli LS, de Farias R, Mezalira DZ, et al. (2022) Functionalized carbon nanotubes for 3D-printed PLA-nanocomposites: Effects on thermal and mechanical properties. Mater Today Commun 31:103402. [CrossRef]
- Zhang C, Lan Q, Zhai T, et al. (2018) Melt crystallization behavior and crystalline morphology of Polylactide/Poly(ε-caprolactone) blends compatibilized by lactide-caprolactone copolymer. Polymers (Basel) 10:. [CrossRef]
- Petrovics N, Kirchkeszner C, Patkó A, et al. (2023) Effect of crystallinity on the migration of plastic additives from polylactic acid-based food contact plastics. Food Packag Shelf Life 36:101054. [CrossRef]
- Papadopoulos L, Klonos PA, Terzopoulou Z, et al. (2021) Comparative study of crystallization, semicrystalline morphology, and molecular mobility in nanocomposites based on polylactide and various inclusions at low filler loadings. Polymer (Guildf) 217:123457. [CrossRef]
- Li Y, Yin D, Liu W, et al. (2020) Fabrication of biodegradable poly (lactic acid)/carbon nanotube nanocomposite foams: Significant improvement on rheological property and foamability. Int J Biol Macromol 163:1175–1186. [CrossRef]
- Ali F, Ishfaq N, Said A, et al. (2021) Fabrication, characterization, morphological and thermal investigations of functionalized multi-walled carbon nanotubes reinforced epoxy nanocomposites. Prog Org Coatings 150:105962. [CrossRef]
- Jubinville D, Sharifi J, Fayazfar H, Mekonnen TH (2023) Hemp hurd filled PLA-PBAT blend biocomposites compatible with additive manufacturing processes: Fabrication, rheology, and material property investigations. Polym Compos 1–16. [CrossRef]
- Xu Z, Niu Y, Yang L, et al. (2010) Morphology, rheology and crystallization behavior of polylactide composites prepared through addition of five-armed star polylactide grafted multiwalled carbon nanotubes. Polymer (Guildf) 51:730–737. [CrossRef]
- Lamberti P, Spinelli G, Kuzhir PP, et al. (2018) Evaluation of thermal and electrical conductivity of carbon-based PLA nanocomposites for 3D printing. AIP Conf Proc 1981:. [CrossRef]
- Vidakis N, Petousis M, Kourinou M, et al. (2021) Additive manufacturing of multifunctional polylactic acid (PLA)—multiwalled carbon nanotubes (MWCNTs) nanocomposites. Nanocomposites 7:184–199. [CrossRef]
Figure 1.
FTIR-ATR spectra of PLA, PNC1, PNC2, PNC3, and PNC4.
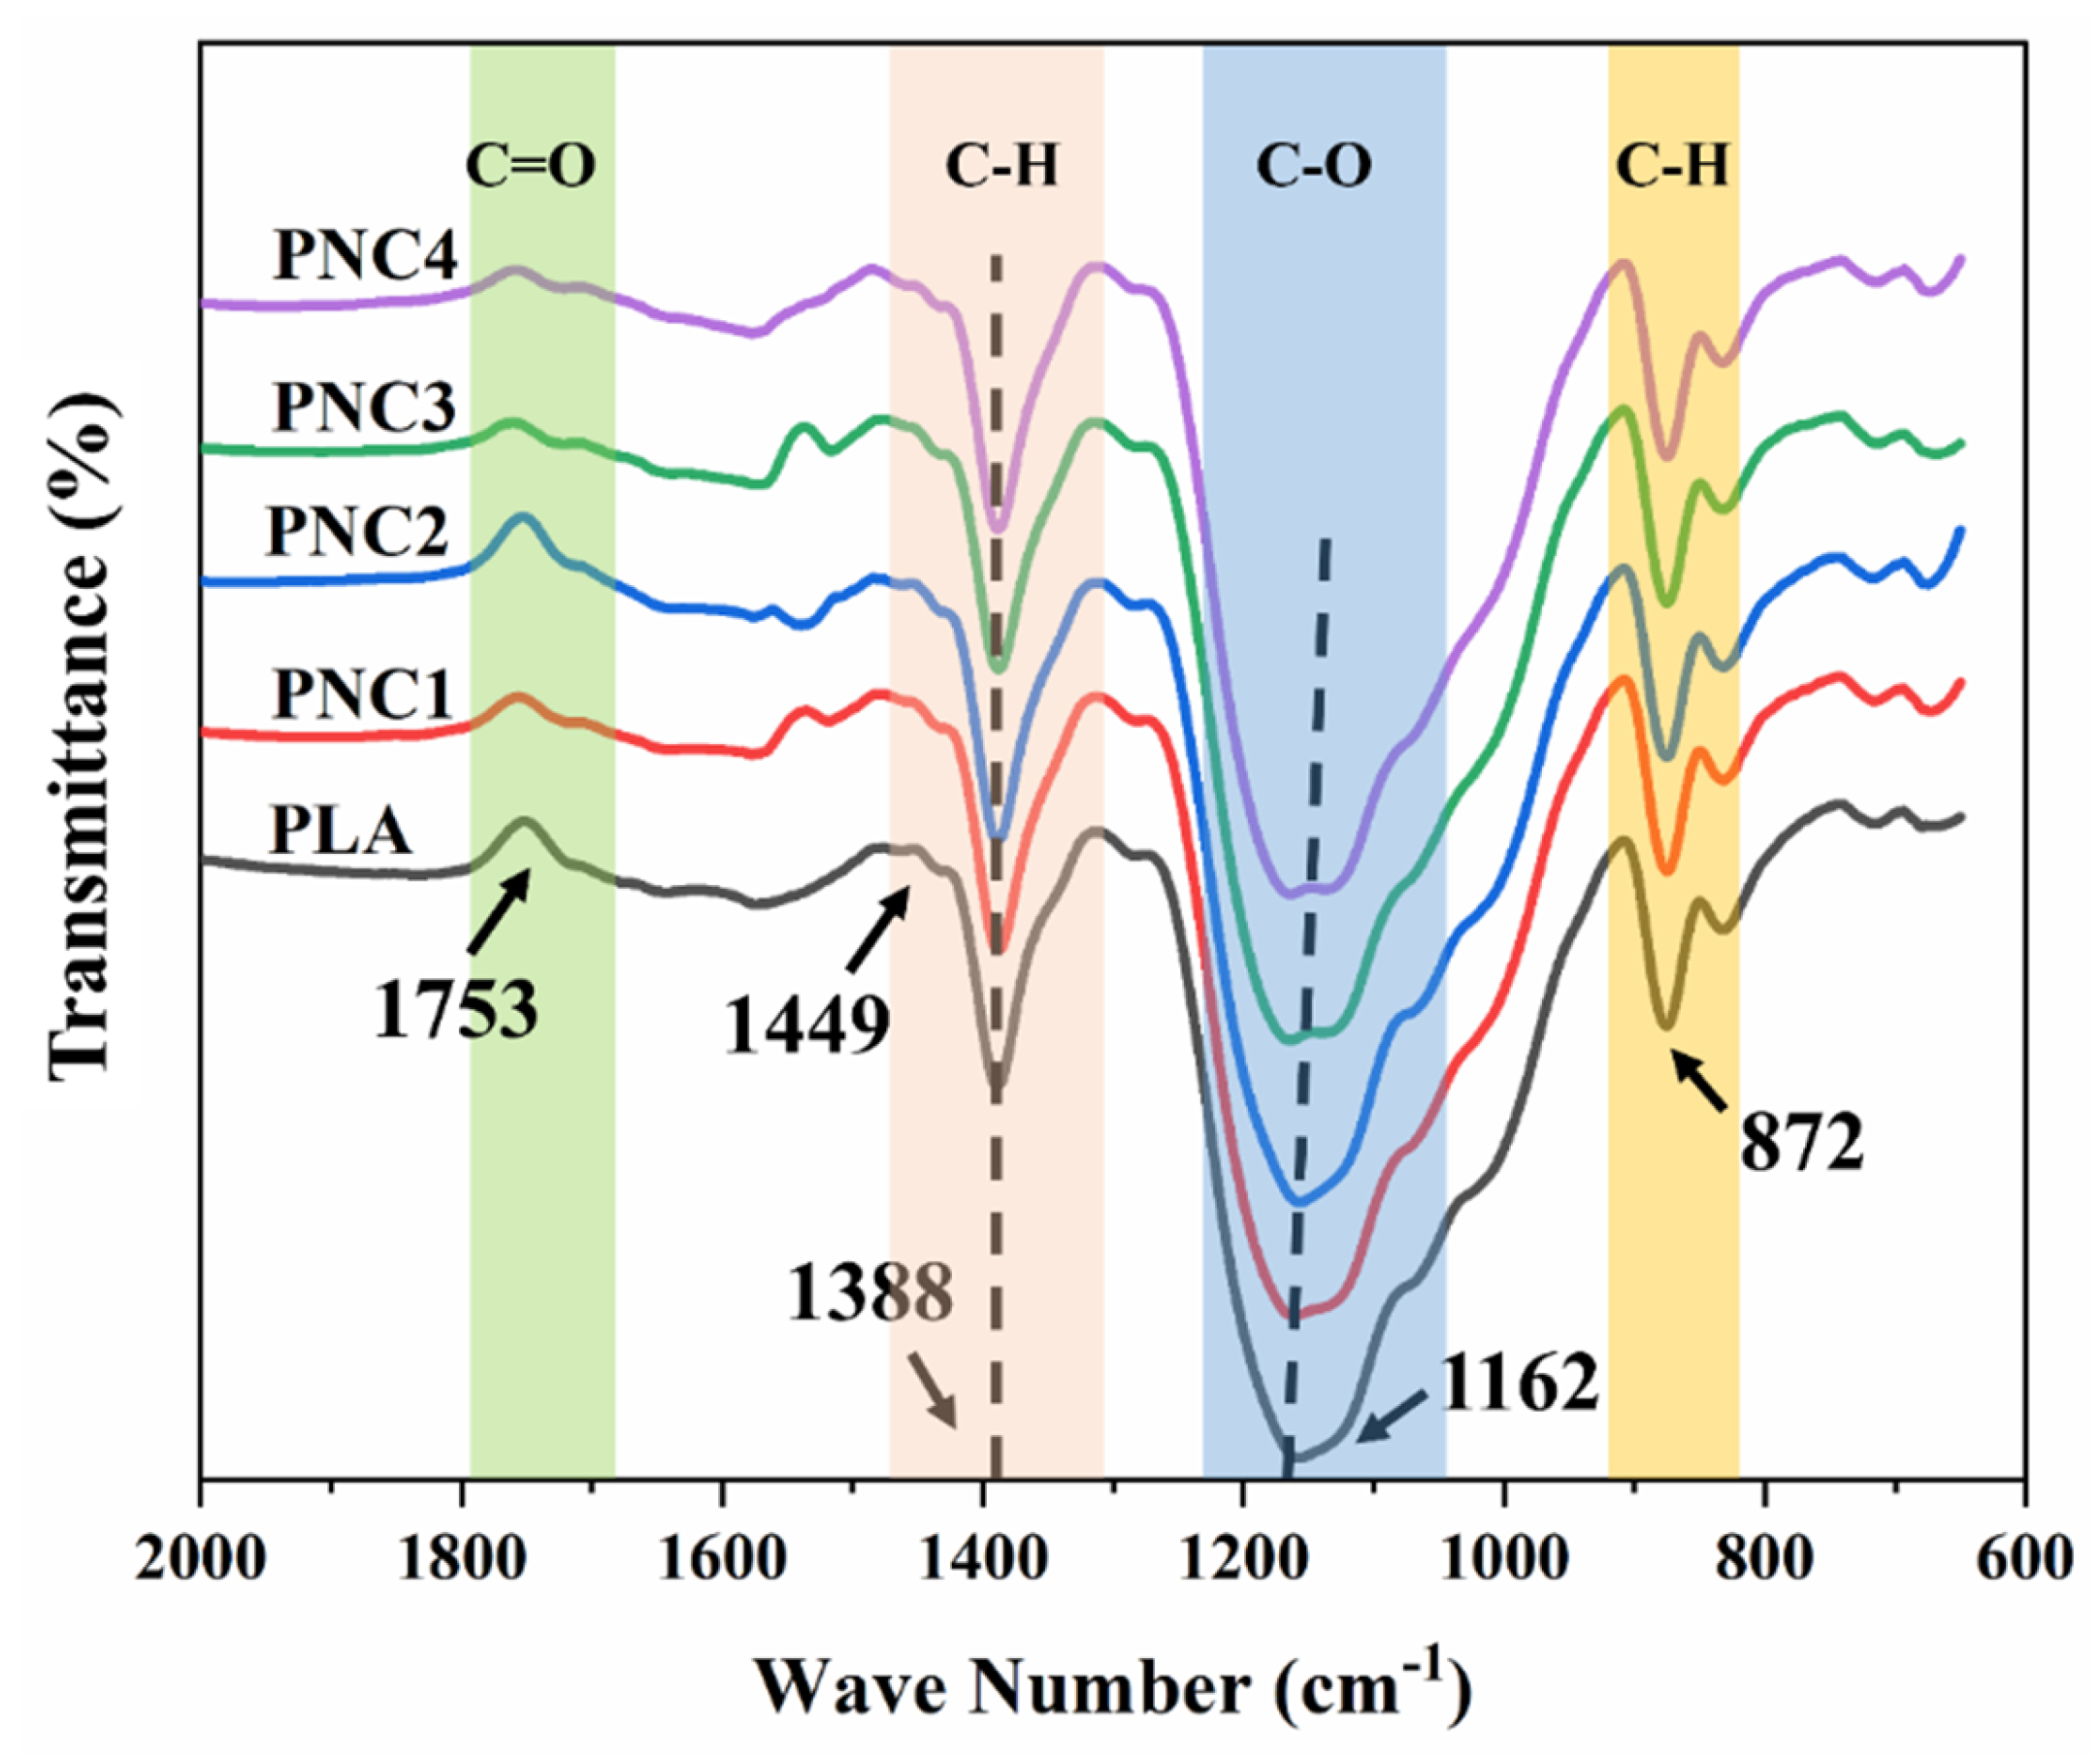
Figure 2.
Differential Scanning Calorimetry of PNCs composites, (a) first heating scan, (b) first cooling scan, (c) second heating scan, and (d) Influence of CNT concentrations on density and crystallinity ratio (%XCrPLA/%XCrPNC) of PNCs.
Figure 2.
Differential Scanning Calorimetry of PNCs composites, (a) first heating scan, (b) first cooling scan, (c) second heating scan, and (d) Influence of CNT concentrations on density and crystallinity ratio (%XCrPLA/%XCrPNC) of PNCs.
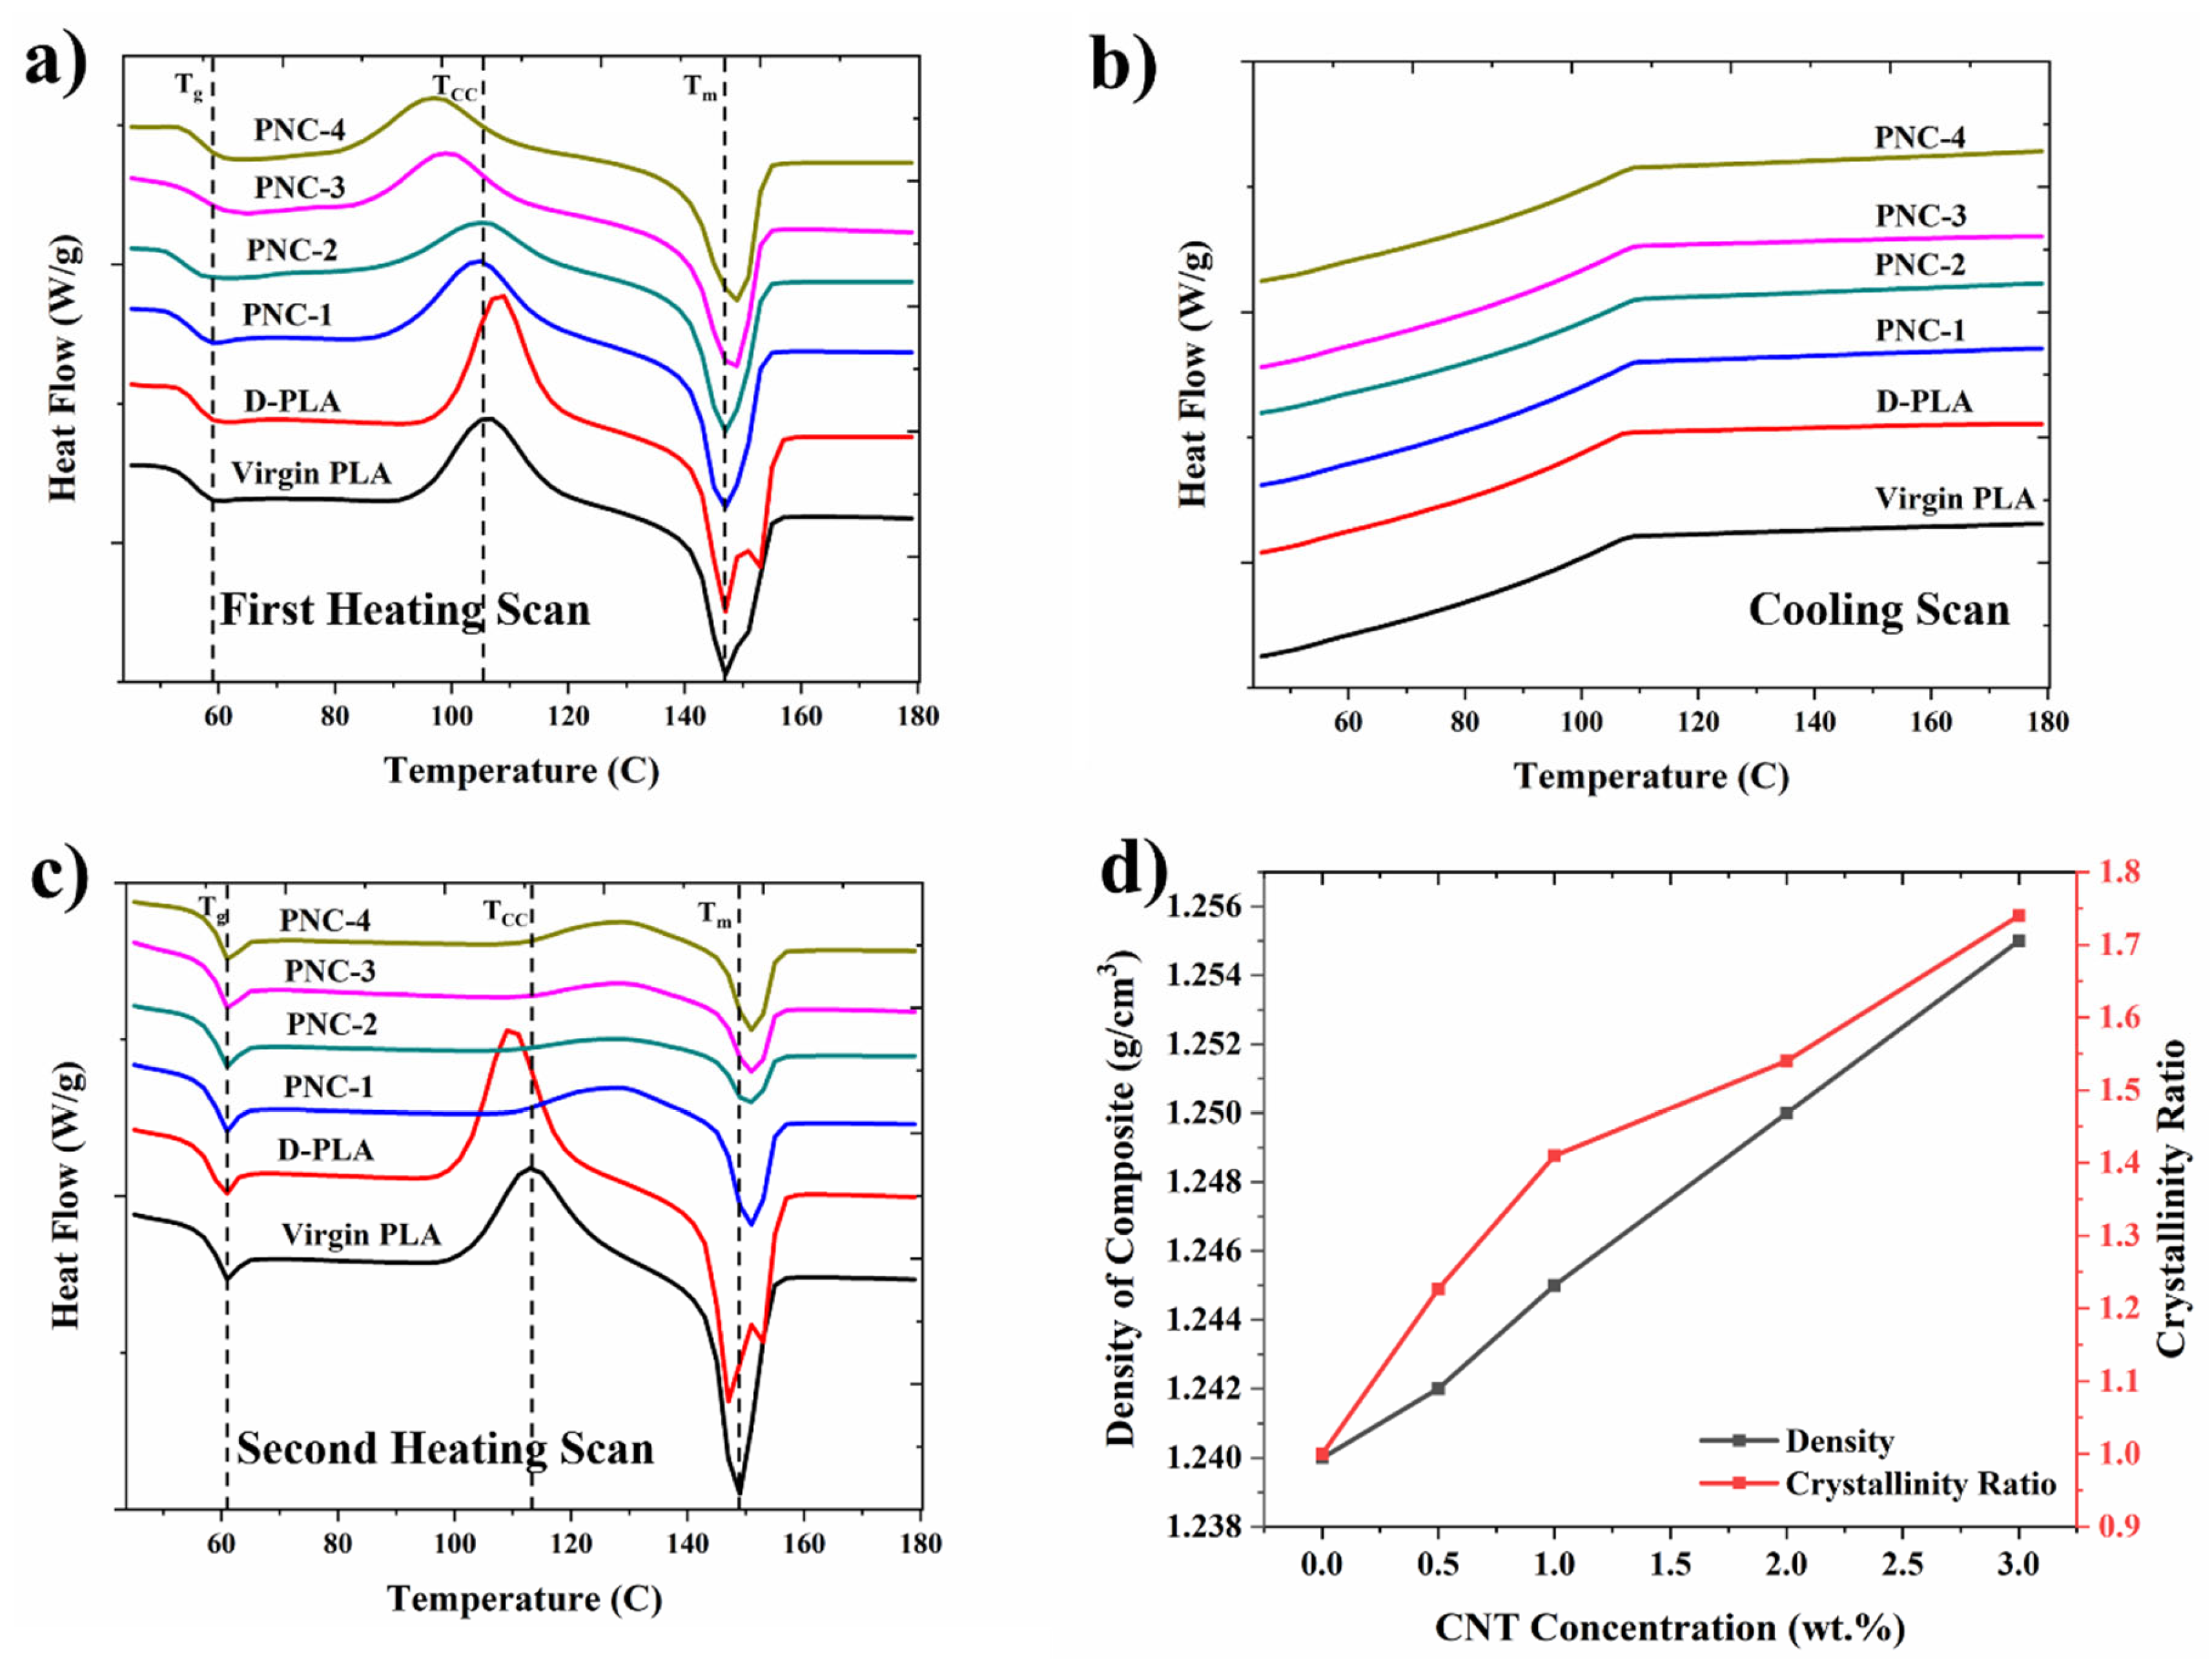
Figure 3.
TGA thermograms of (a) virgin PLA and D-PLA, and (b) PNCs.
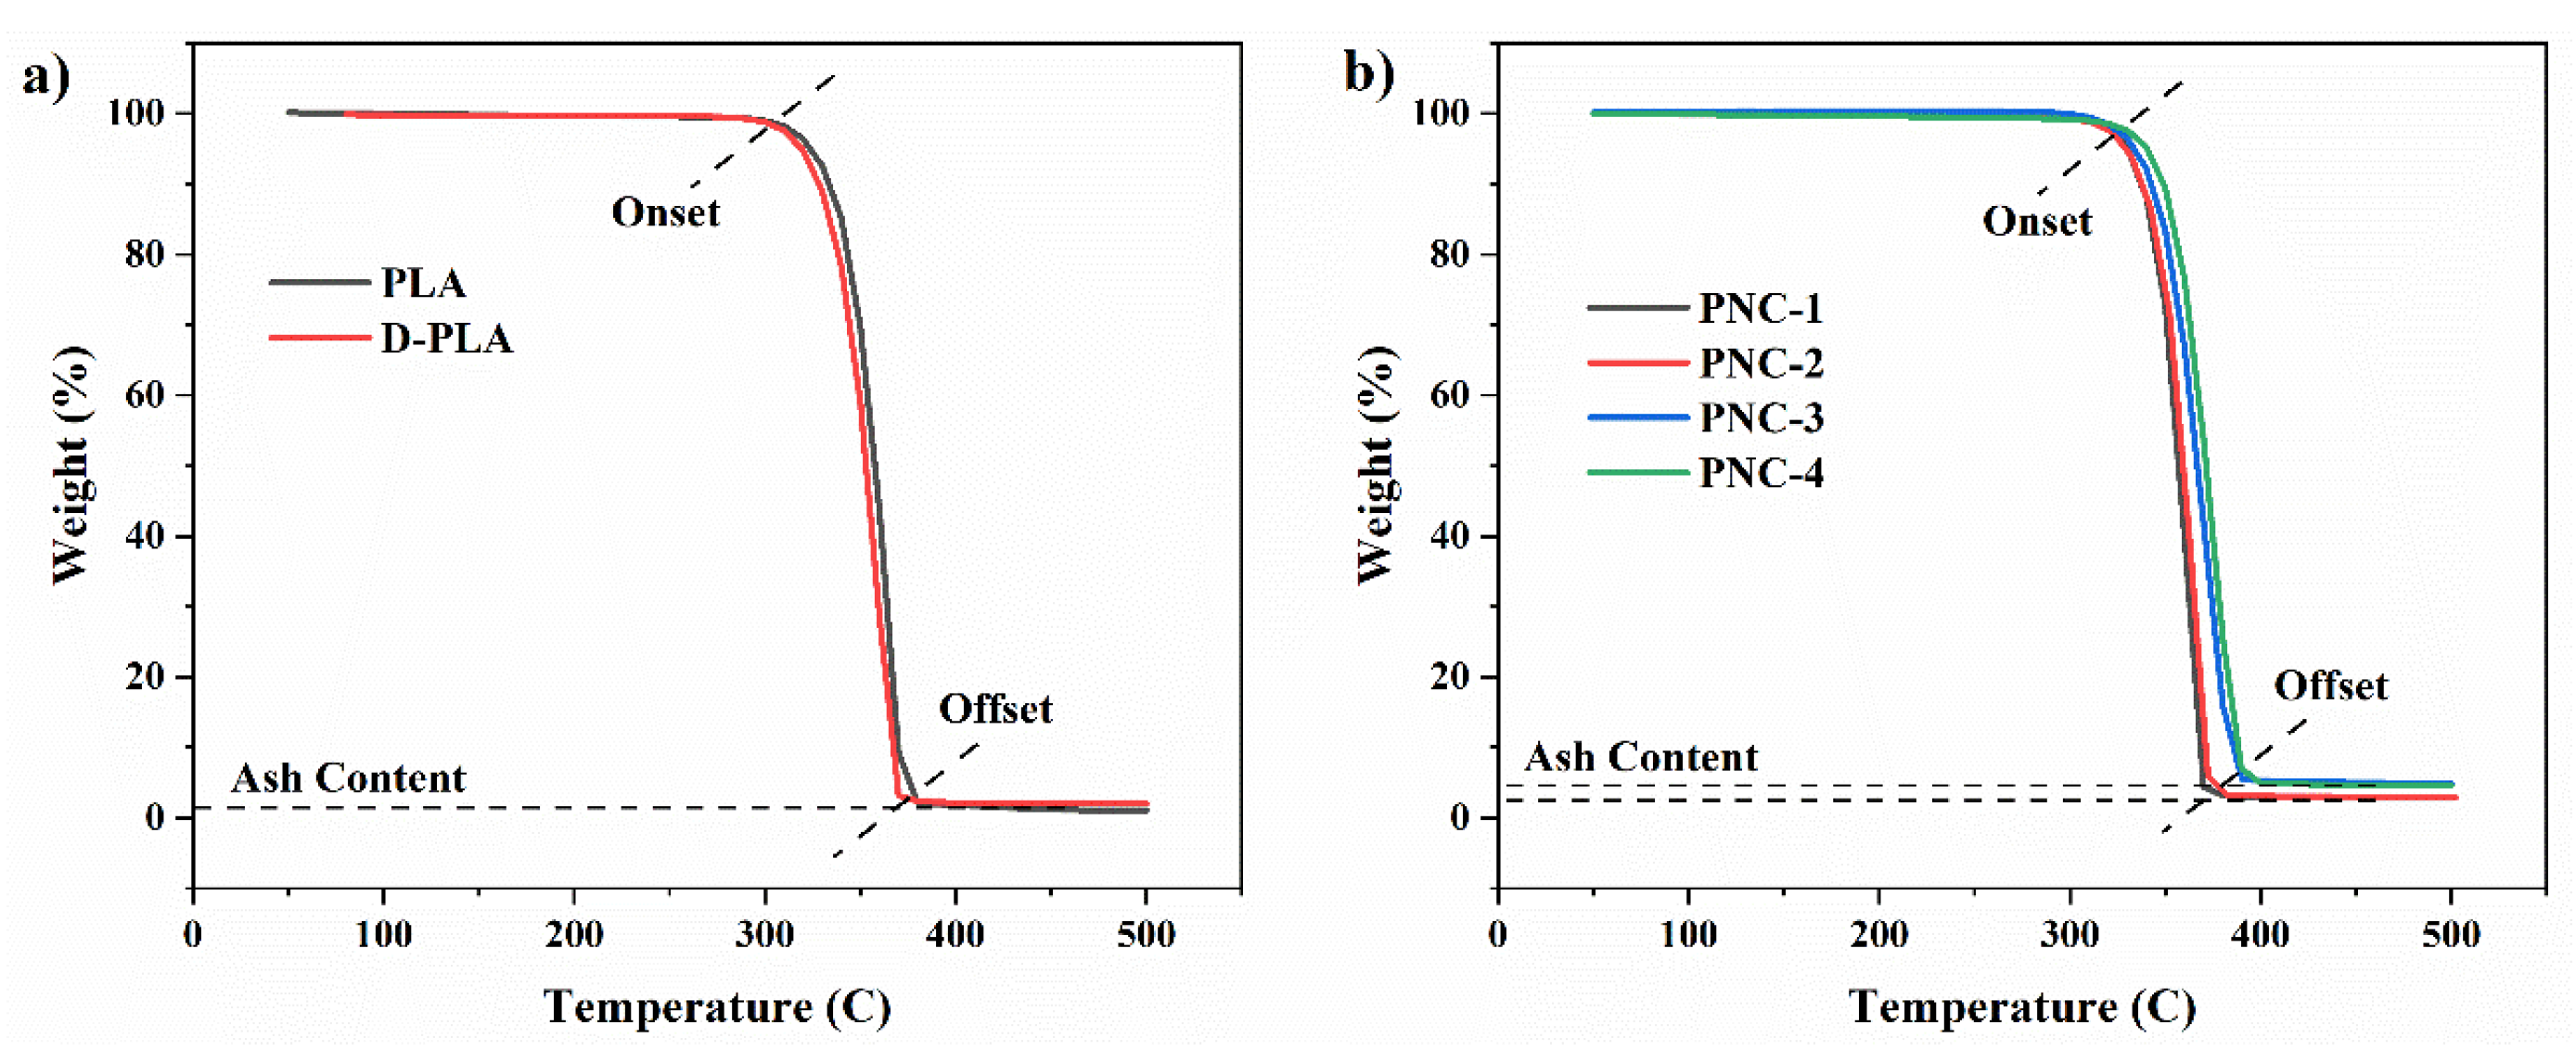
Figure 4.
Complex Viscosity of (a) PLA and D-PLA, and (b) PNCs.
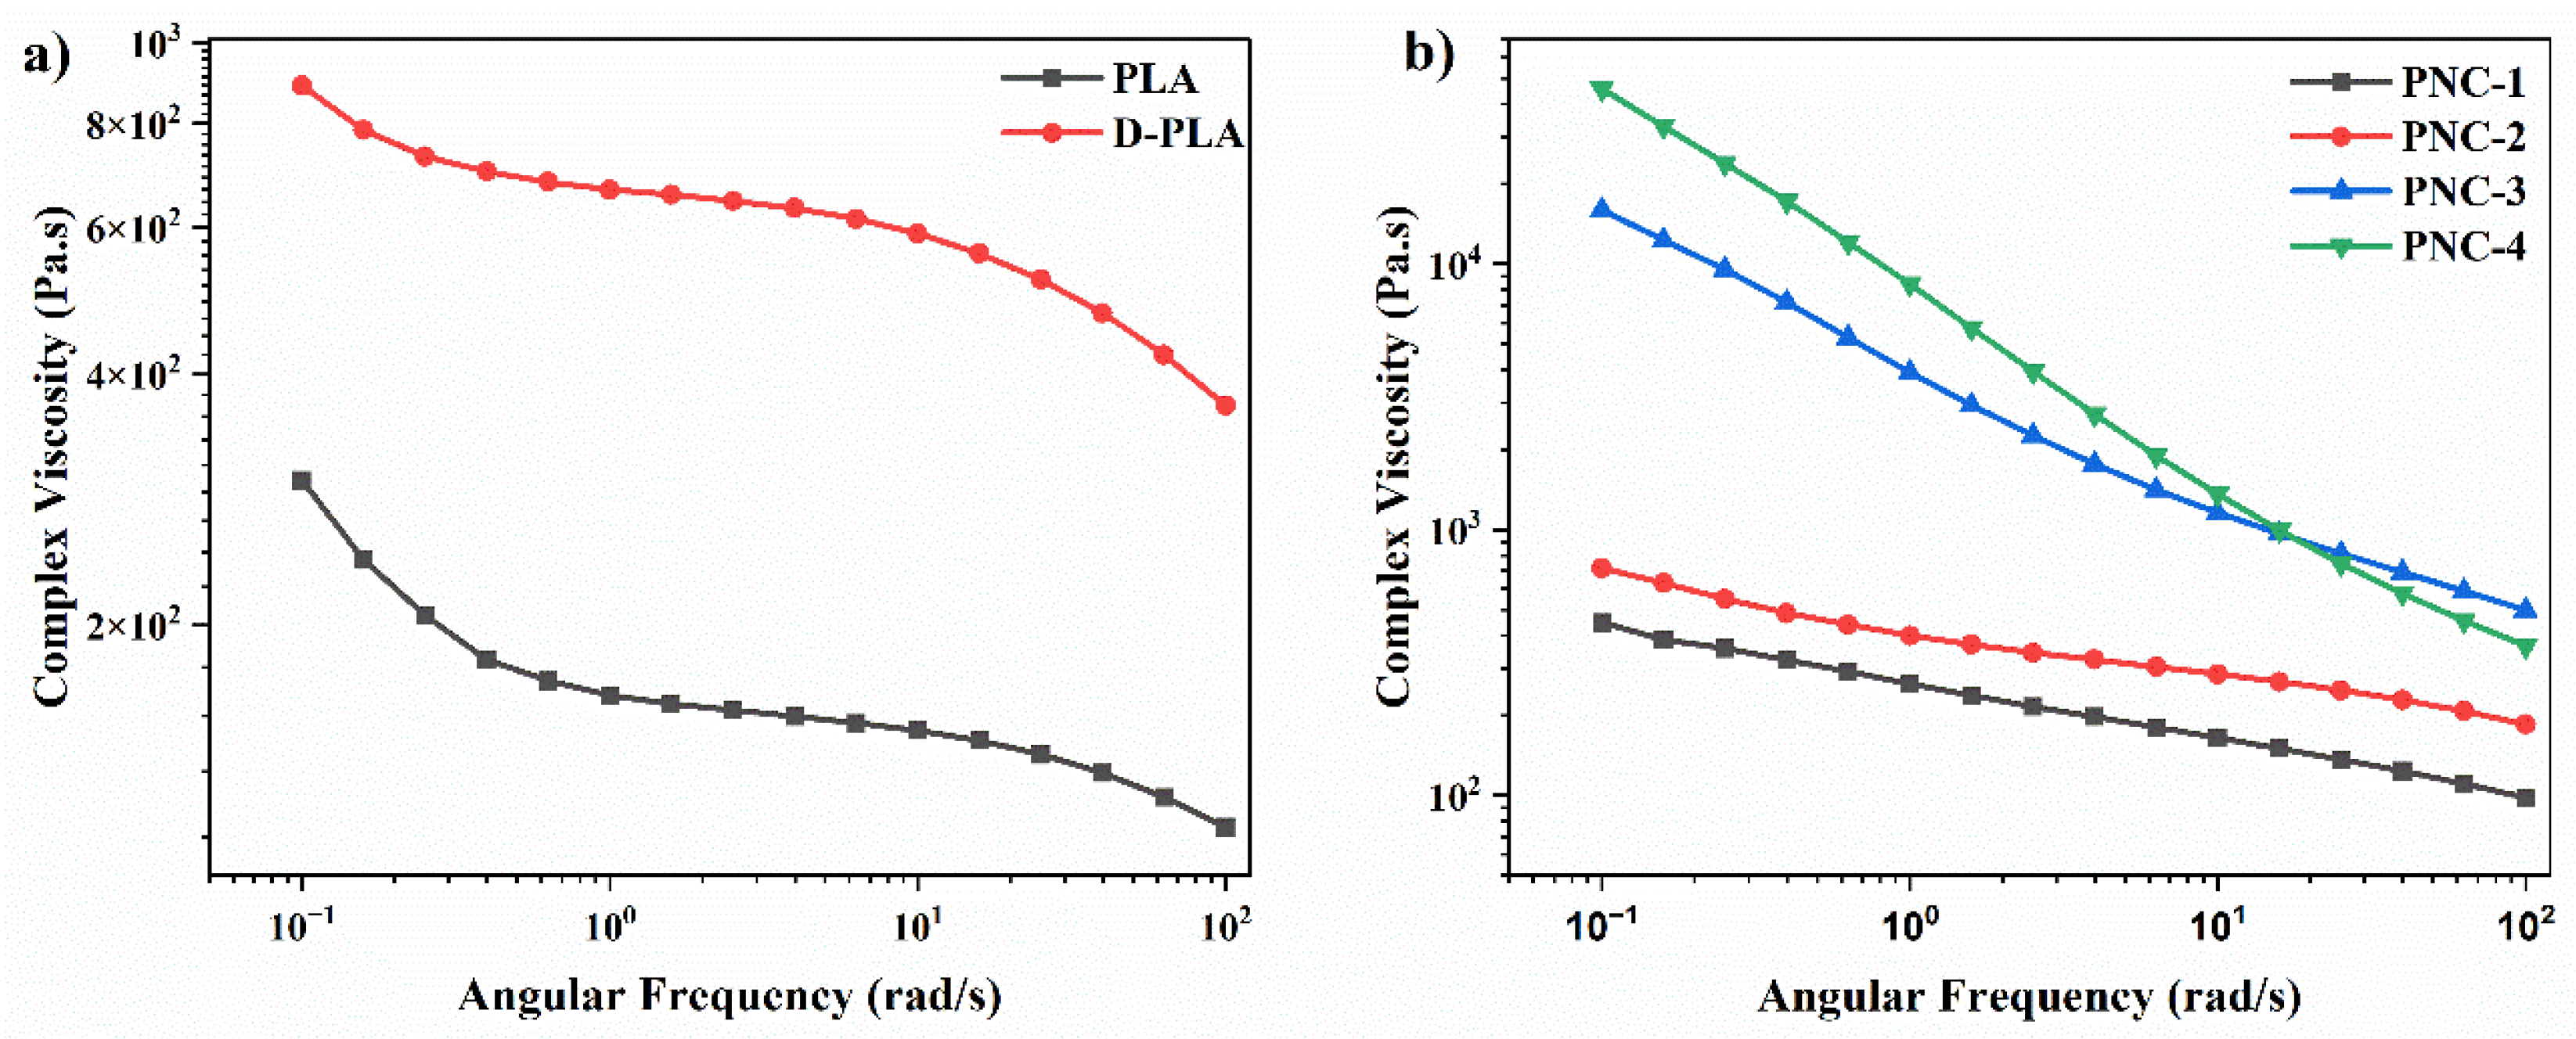
Figure 5.
(a) Storage modulus, (b) loss modulus, (c) shear viscosity (Pa.S), and (d) Tan δ for different samples.
Figure 5.
(a) Storage modulus, (b) loss modulus, (c) shear viscosity (Pa.S), and (d) Tan δ for different samples.
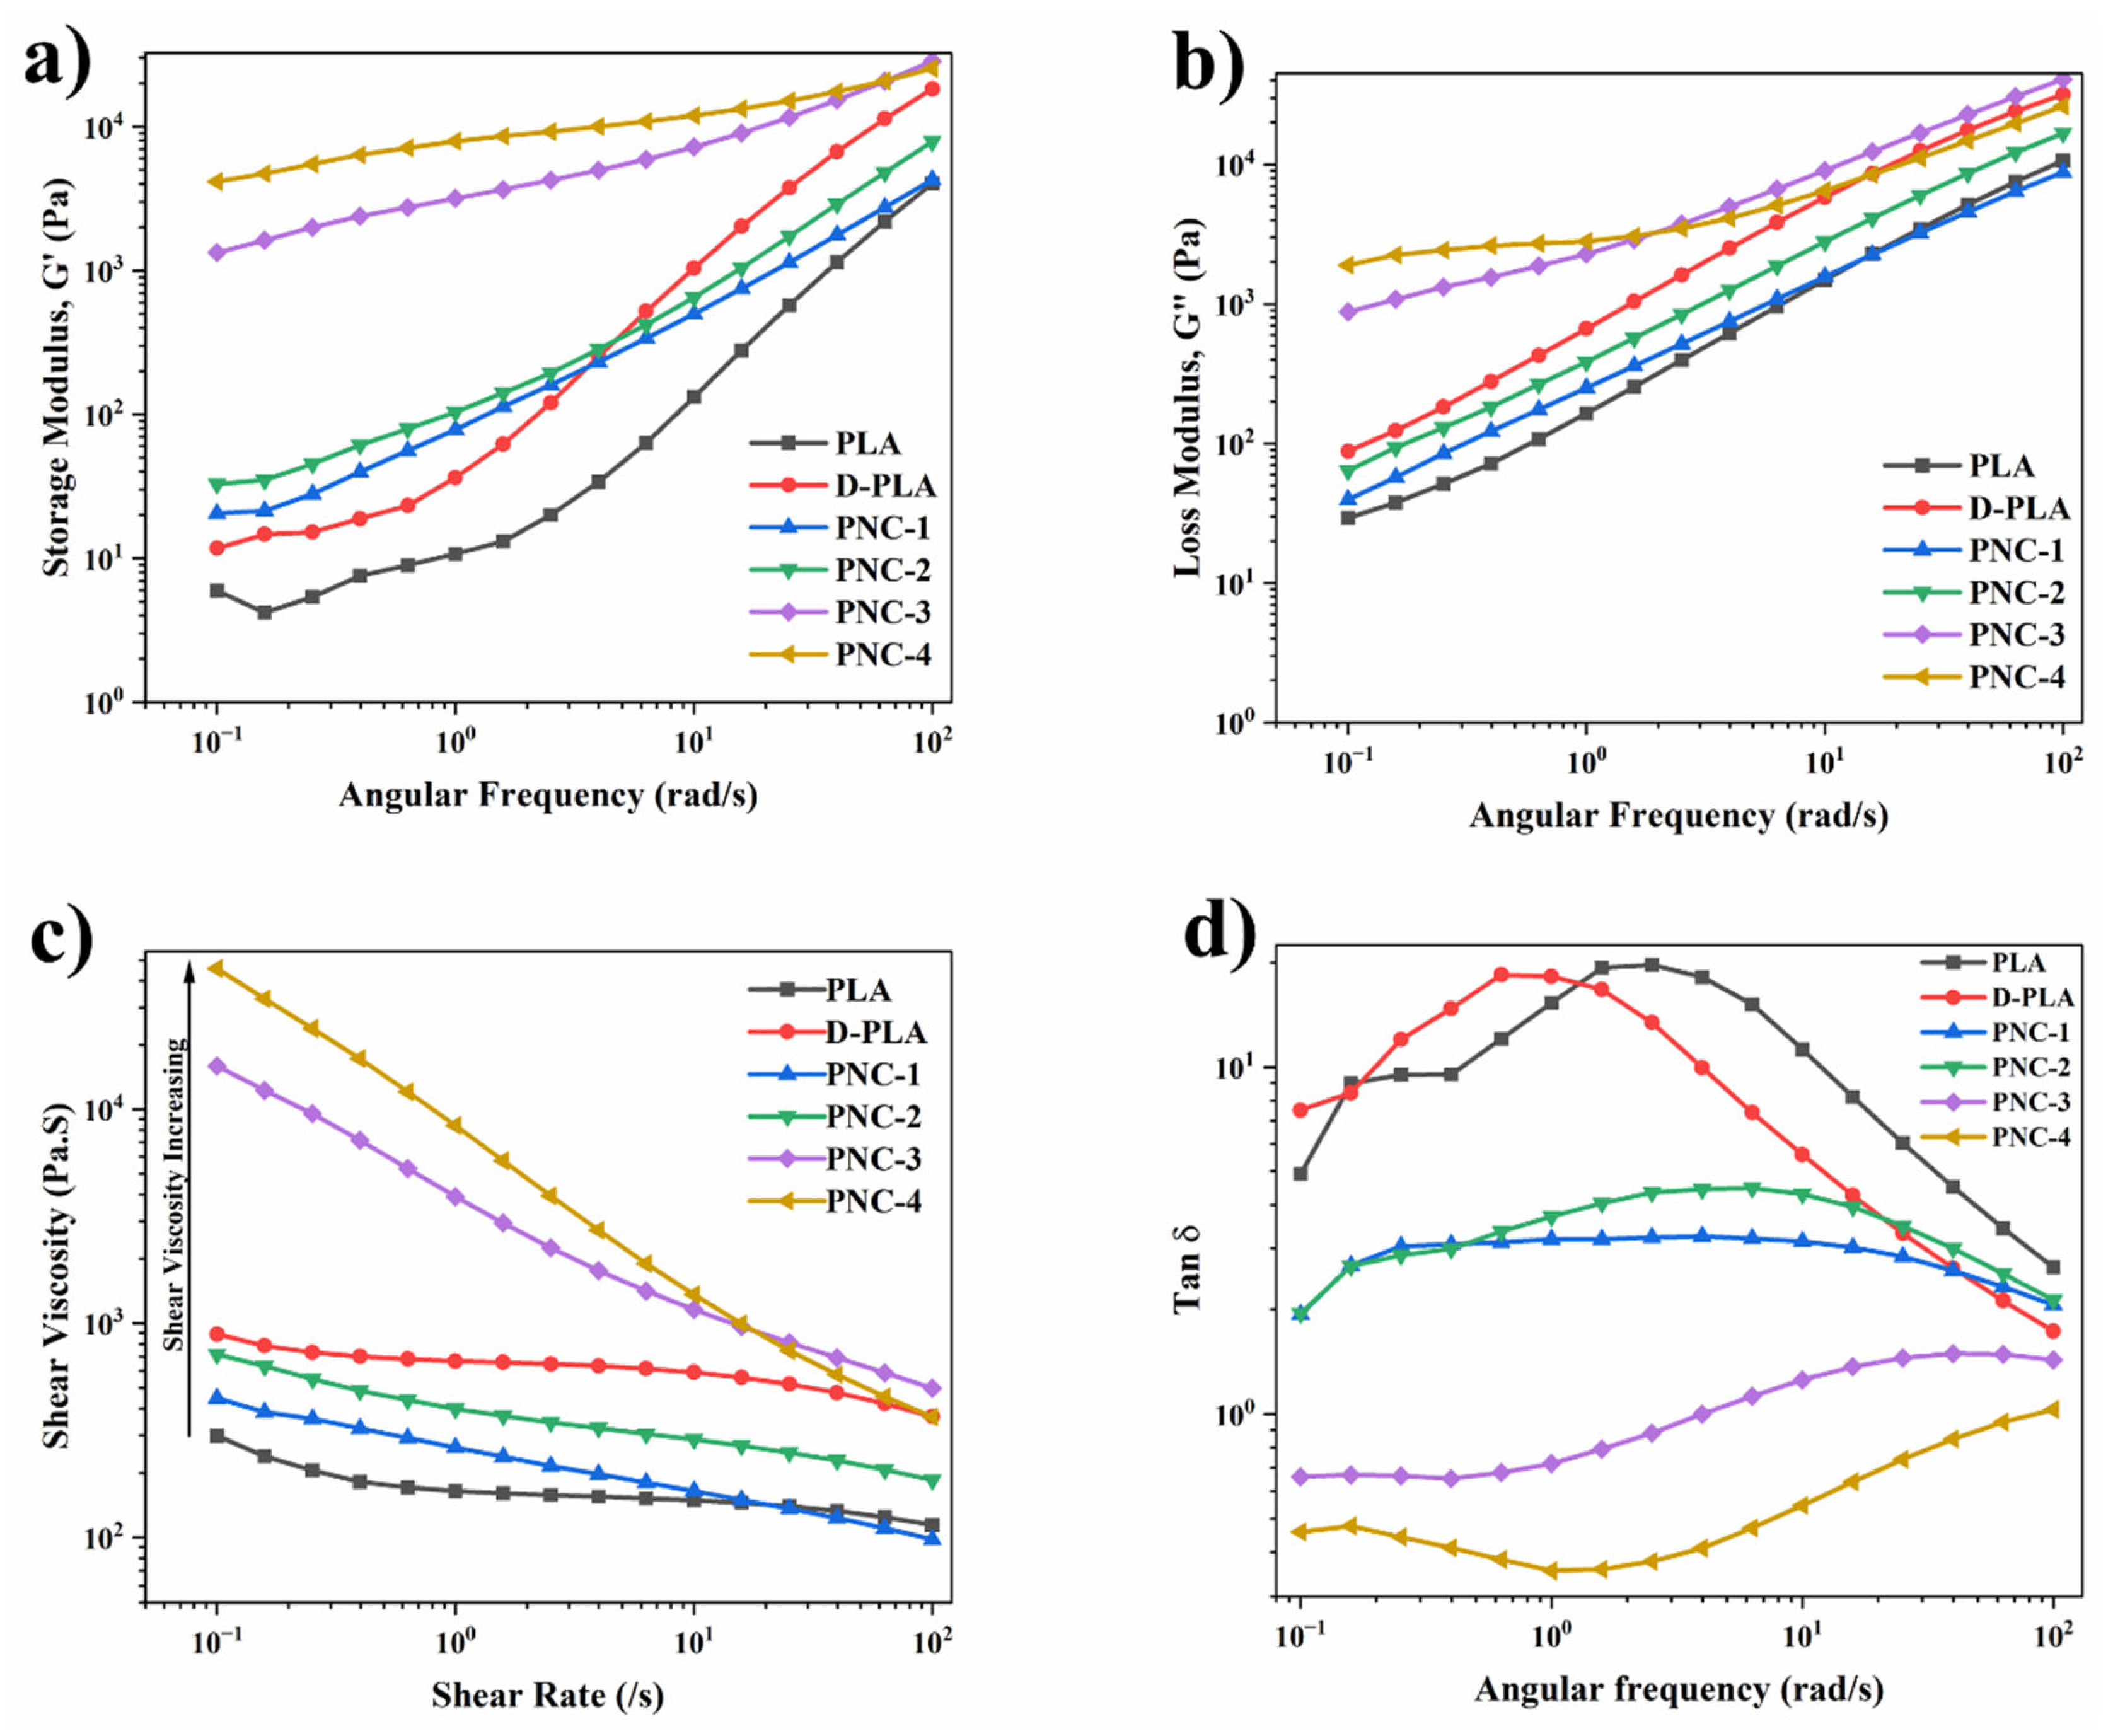
Figure 6.
Electrical conductivity of FDM 3D printed PNCs.
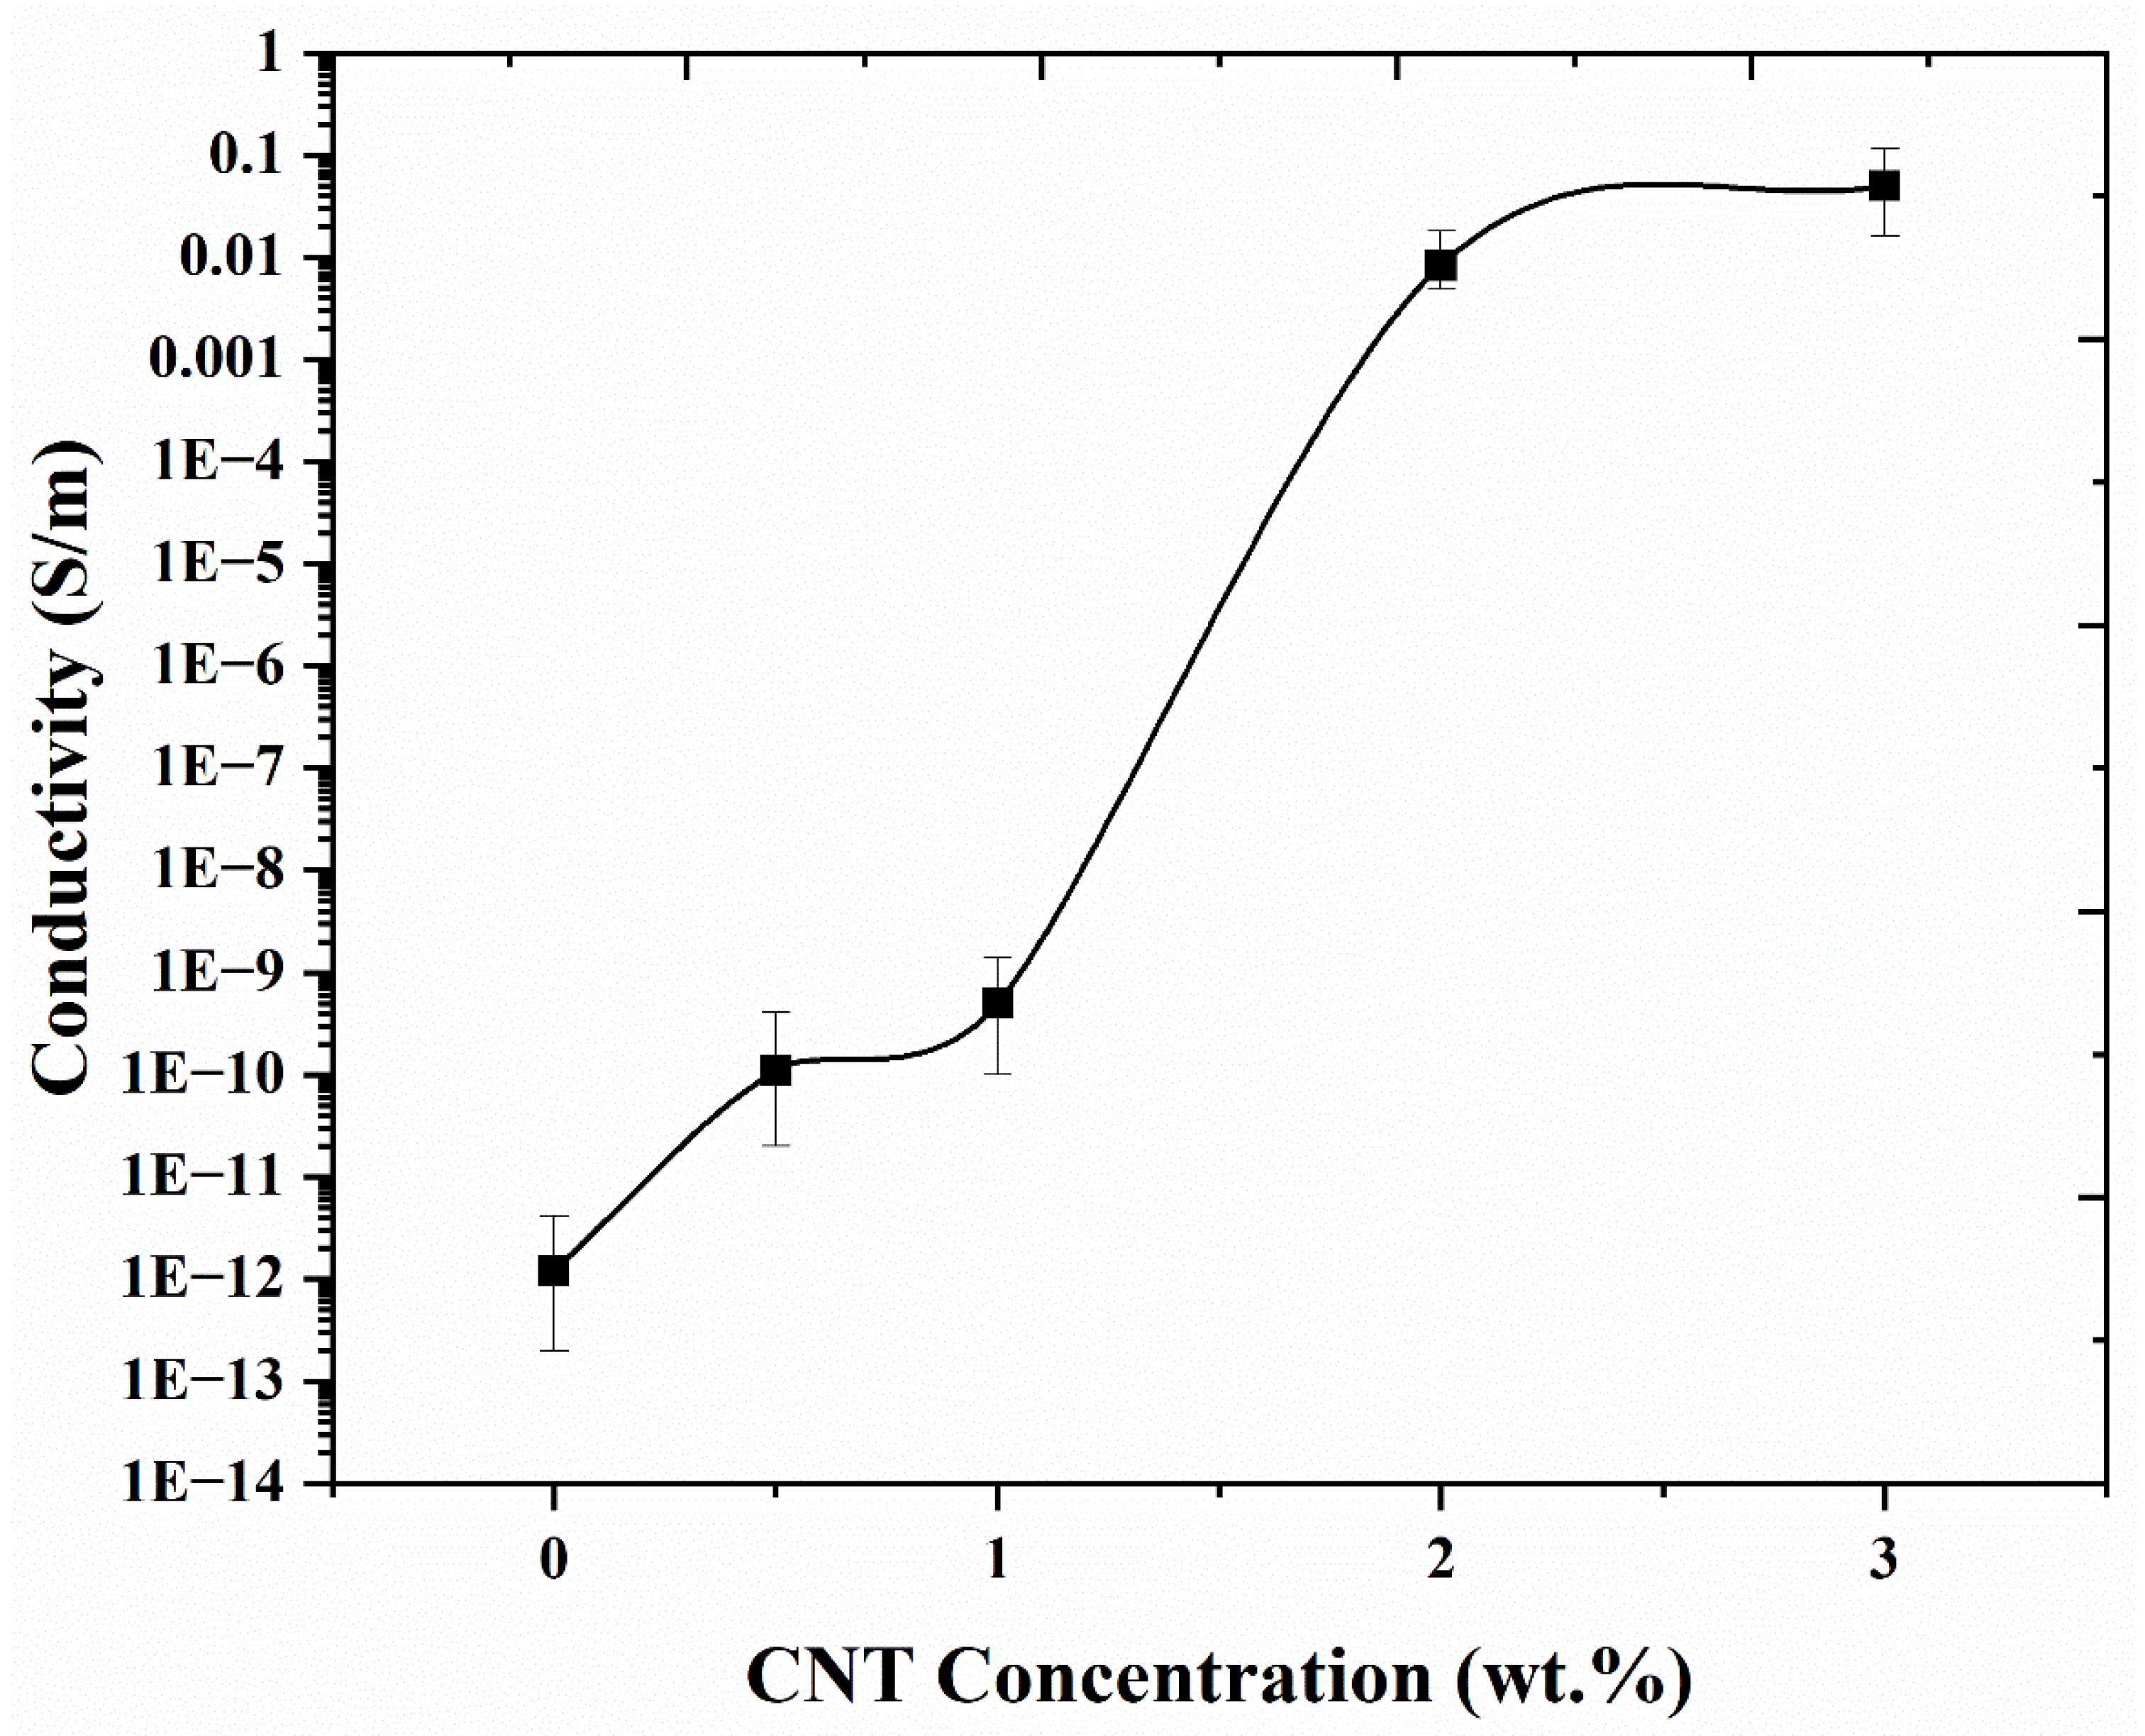
Figure 7.
(a) Tensile strength and Tensile Modulus, as well as (b) Toughness and Resilience of PLA, PNC-2, PNC-3, and PNC-4 FDM-3D-printed samples.
Figure 7.
(a) Tensile strength and Tensile Modulus, as well as (b) Toughness and Resilience of PLA, PNC-2, PNC-3, and PNC-4 FDM-3D-printed samples.
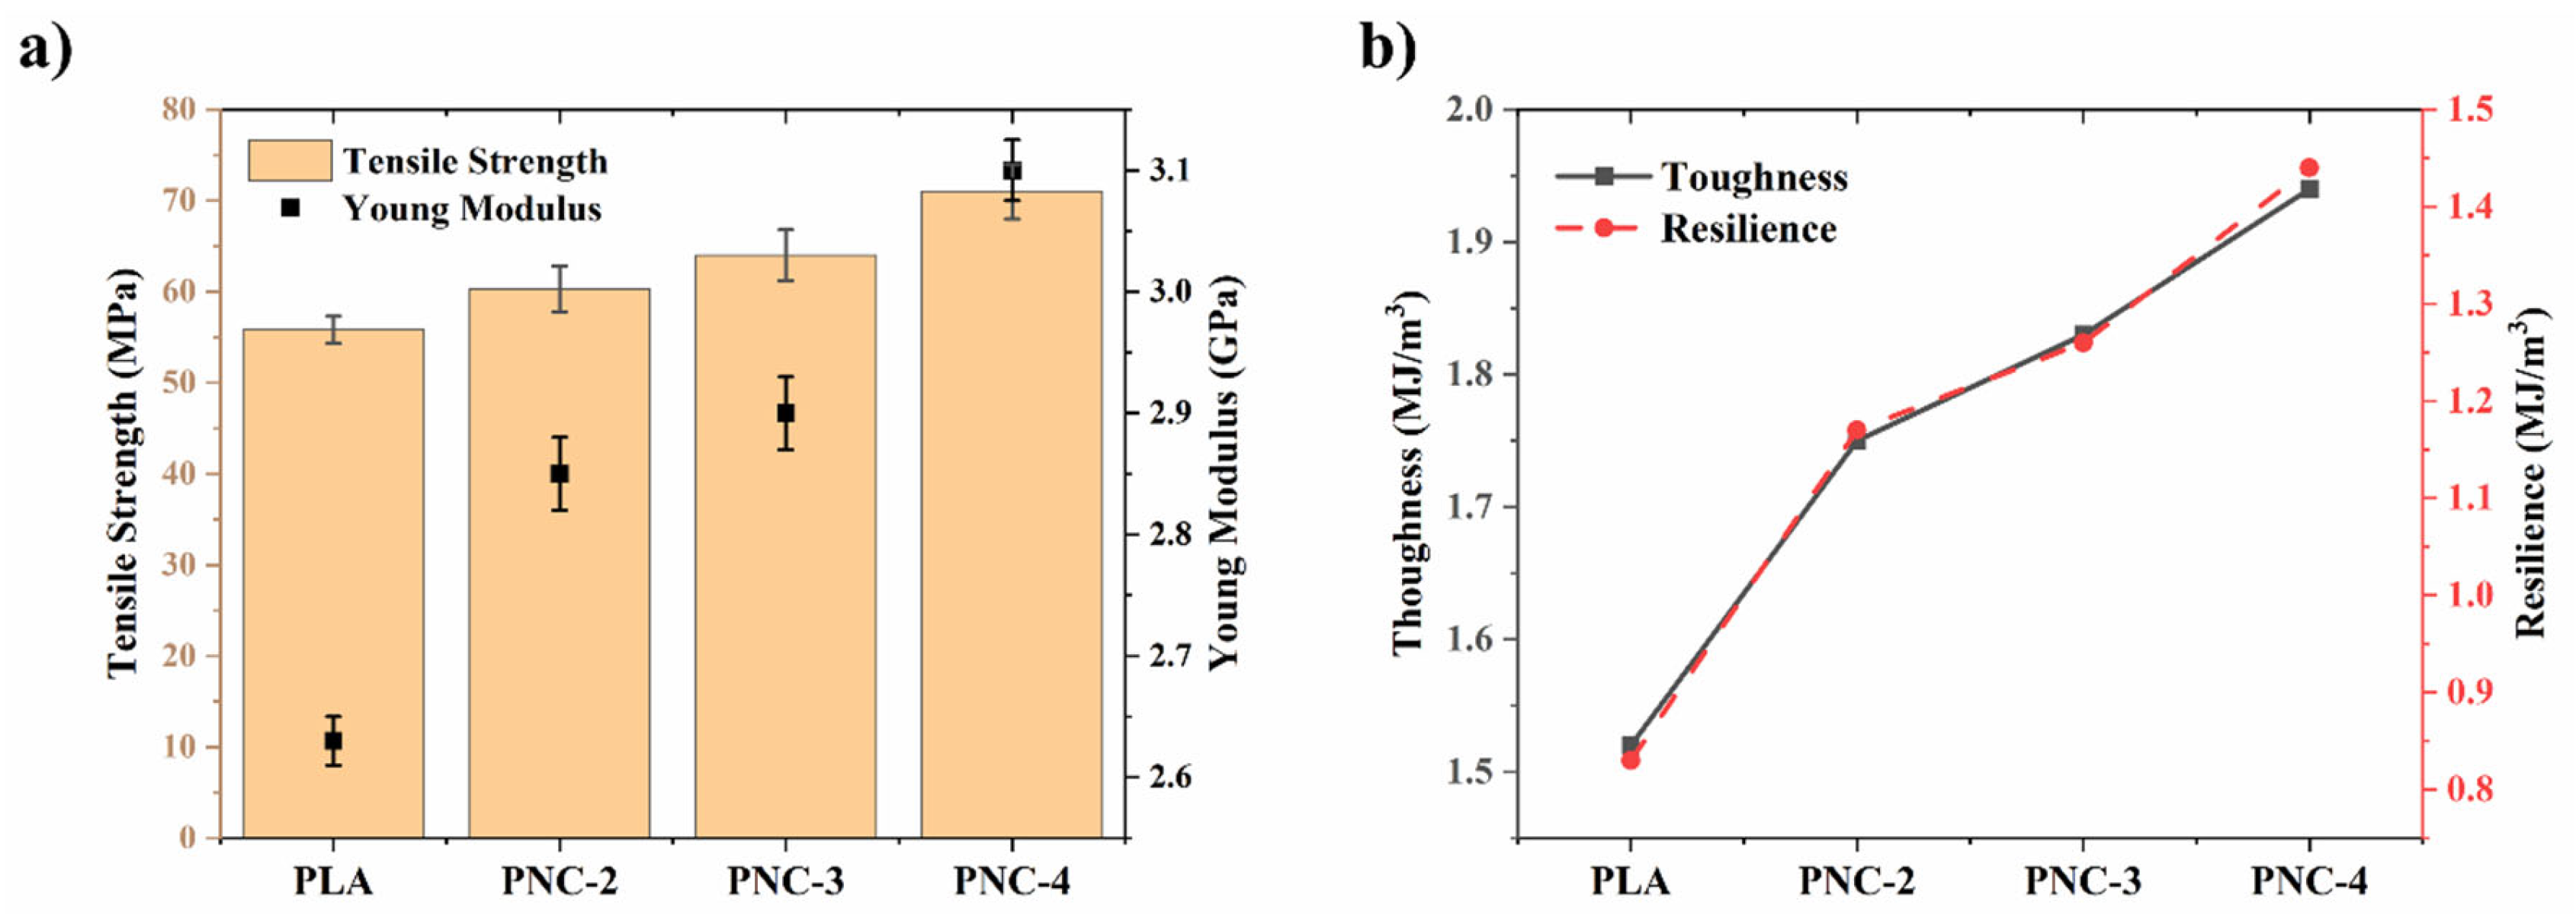
Figure 8.
SEM micrographs of (a) as-printed and (b) electrochemical activated FDM 3D printed PNC-3.
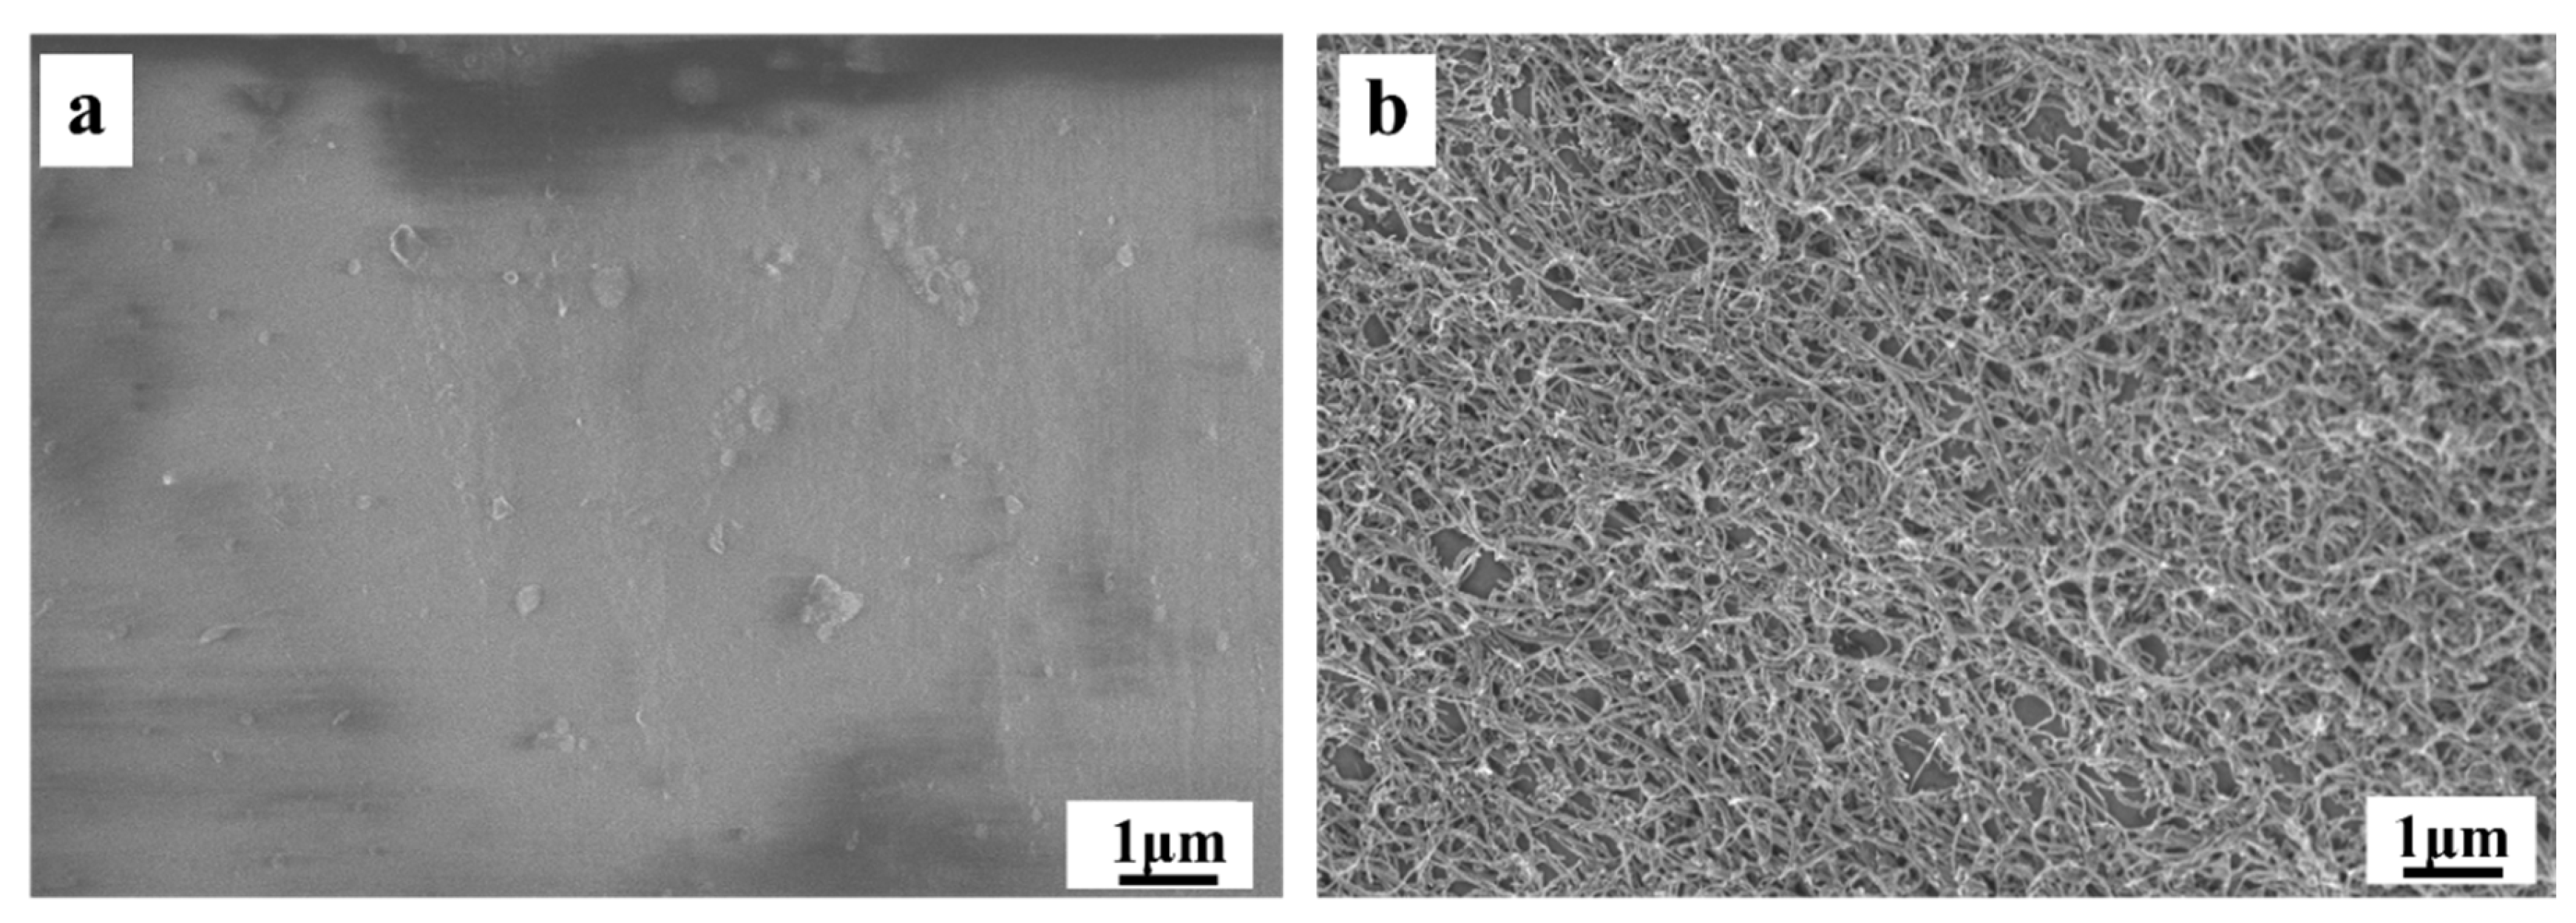
Figure 9.
(a) Cyclic voltammograms obtained with 3D-printed PNC-3 sensor in 0.5 M NaOH solution before (black-line) and after electrochemical activation for 250 cycles (red-line). Scan rate: 50 mV/s; step potential: 10 mV. (b) Cyclic voltammograms obtained in the present of ferro/ferricyanide redox couple before (black-line) and after (red-line) electrochemical activation of PNC-3 working electrode in NaOH 0.5 M. Scan rate: 50 mV/s; step potential: 10 mV.
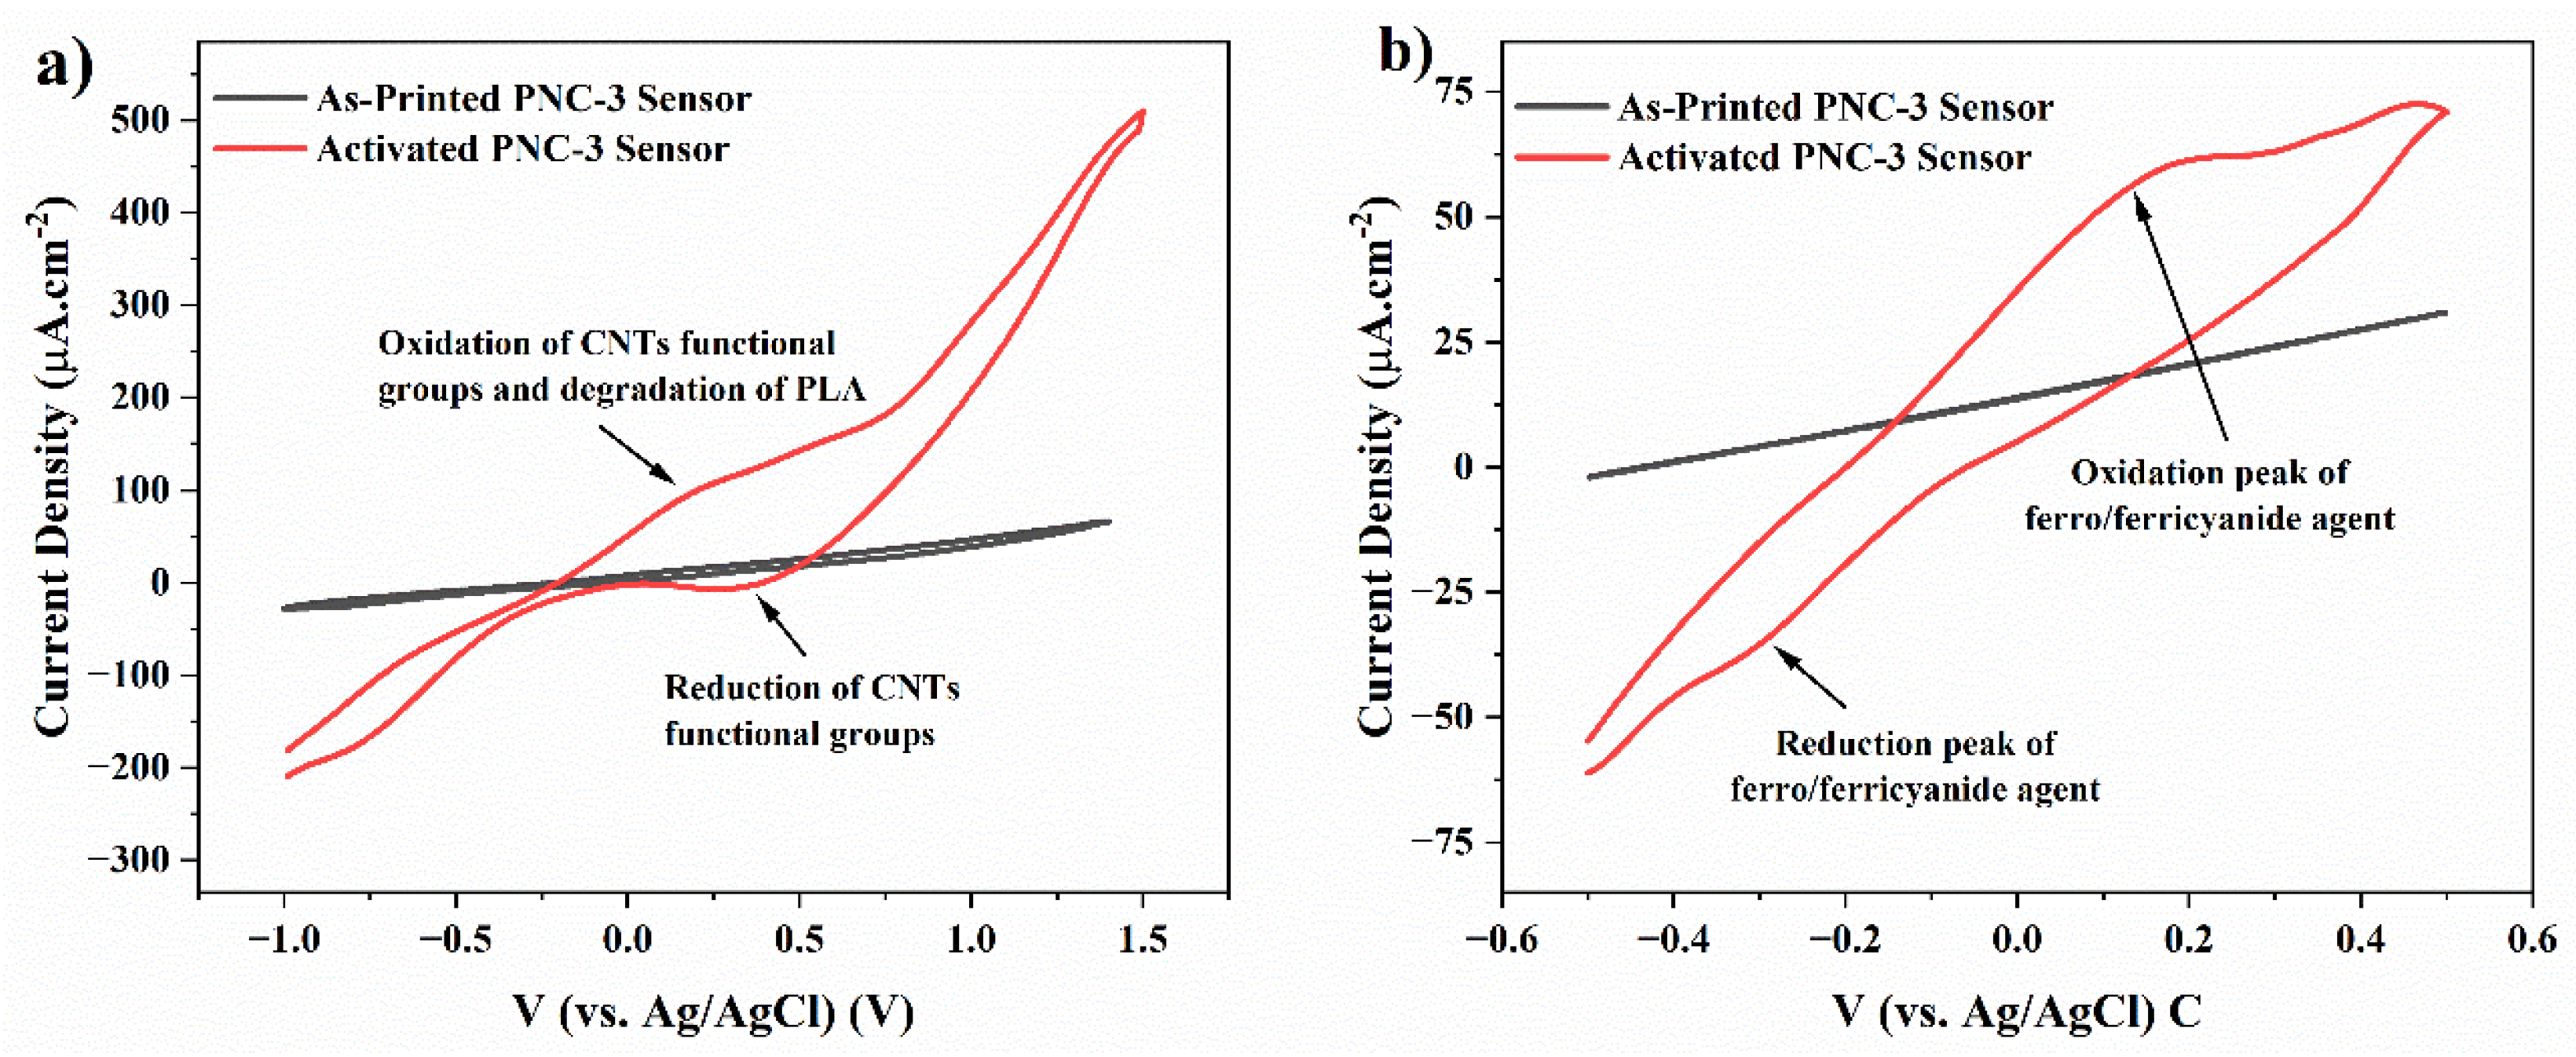

Table 1.
Composite Formulations and Code Chart.
| Code Chart | PLA (wt.%) | MWCNTs-COOH (wt.%) |
|---|---|---|
| PLA | 100 | 0 |
| D-PLA | 100 | 0 |
| PNC-1 | 99.5 | 0.5 |
| PNC-2 | 99 | 1 |
| PNC-3 | 98 | 2 |
| PNC-4 | 97 | 3 |
*D-PLA: Dissolved PLA in Ethyl Acetate. *PNC: Polymeric Nano Composite.
Table 2.
FDM 3D-printing Parameters.
| Printing Parameters | |
|---|---|
| Nozzle diameter | 0.4 mm |
| Nozzle temperature | 200 ℃ |
| Bed temperature | 60 ℃ |
| Infill density | 100 % |
| Layer height | 0.2 mm |
| Raster angle | 45° |
| Print speed | 10 mm/s |
| Flow rate | 100 % |
Table 3.
DSC tabulated results and calculated degree of crystallinity (%XCr).
| First Heating Cycle | Second Heating Cycle | |||||||
|---|---|---|---|---|---|---|---|---|
| Tg (℃) | TCC (℃) | Tm (℃) | %XCr | Tg (℃) | TCC (℃) | Tm (℃) | %XCr | |
| PLA | 59 | 106 | 147 | 6.96 | 61 | 113 | 149 | 4.1 |
| D-PLA | 59 | 108 | 147* | 3.49 | 61 | 109 | 147* | 3 |
| PNC-1 | 59 | 106 | 146 | 5.3 | 61 | 127 | 151 | 3.68 |
| PNC-2 | 59 | 105 | 147 | 14.95 | 61 | 128 | 151 | 4.23 |
| PNC-3 | 60 | 99 | 148 | 15.78 | 61 | 129 | 151 | 4.62 |
| PNC-4 | 60 | 97 | 149 | 16.45 | 61 | 130 | 151 | 5.22 |
*D-PLA
illustrated two distinct melting peaks, at 147 and 153 °C for both first and second heating rate.
Table 4.
Zero-shear viscosity data.
| Zero Shear Viscosity (Pa.S) | R2 | |
|---|---|---|
| PLA | 3.03×10⁵ | 0.93 |
| D-PLA | 9.39×10² | 0.96 |
| PNC-1 | 1.76×10⁵ | 0.99 |
| PNC-2 | 2.81×10⁵ | 0.99 |
| PNC-3 | 6.46×10⁵ | 0.99 |
| PNC-4 | 1.6×10⁵ | 0.99 |
Table 5.
Mechanical properties of FDM 3D-printed PLA, PNC-2, PNC-3, and PNC-4.
| PLA | PNC-2 | PNC-3 | PNC-4 | |
|---|---|---|---|---|
| Tensile Strength (MPa) | 55.8±1.4 | 60.5±2.35 | 63.9±2.8 | 71±3.2 |
| Tensile Modulus (GPa) | 2.63±0.1 | 2.84±0.05 | 2.9±0.1 | 3.1±0.07 |
| Elongation at Break (%) | 4.1±0.2 | 5.32±0.5 | 6.5±0.3 | 7.1±0.2 |
| Toughness (MJ/m3) | 1.52±0.01 | 1.75±0.03 | 1.83±0.01 | 1.94±0.02 |
| Resilience (MJ/m3) | 0.83±0.01 | 1.17±0.02 | 1.26±0.01 | 1.44±0.04 |
Table 6.
Comparison of FDM 3D printed PLA:CNTs composite developed in this study with open literature.
Table 6.
Comparison of FDM 3D printed PLA:CNTs composite developed in this study with open literature.
| Nanocomposite feedstock preparation method | CNTs wt.% and related Conductivity (S.m-1) | Percolation Threshold Onset | Ref | ||||
|---|---|---|---|---|---|---|---|
| 0.5 | 1 | 2 | 3 | Wt.% | Conductivity (S.m-1) | ||
| Solution Casting using Ethyl Acetate | 1×10⁻¹⁰ | 5×10⁻¹⁰ | 8.3×10⁻³ | 5×10⁻² | 1 | 5×10⁻¹⁰ | Our Work |
| Melt Extrusion | N/A | N/A | N/A | 1×10⁻² | 1.5 | 1×10⁻⁸ | [46] |
| Melt Extrusion | N/A | N/A | N/A | 7.8×10⁻⁴ | 1.5 | 1.4×10⁻⁸ | [23] |
| Melt Extrusion | 5×10⁻⁷ | 1.5×10⁻³ | 3×10⁻³ | 1 | 0.5 | 5×10⁻⁷ | [24] |
| Mechanical Mixing of PLA Powder with CNTs | 1×10⁻⁹ | 5×10⁻⁵ | N/A | N/A | 0.5 | 1×10⁻⁹ | [47] |
| Solution Casting using DCM | N/A | 1×10⁻⁴ | 1×10⁻¹ | 5×10⁻¹ | N/A | N/A | [27] |
| Solution Casting using Chloroform* | N/A | N/A | N/A | N/A | N/A | N/A | [28] |
*Solution
mixing with the aid of incorporating polycaprolactone (PCL) and
poly(styrene-butadiene-styrene) (SBS) into the mixture (each 10 wt.%). Also,
the only paper evaluated the sensing performance of the developed electrode.
Disclaimer/Publisher’s Note: The statements, opinions and data contained in all publications are solely those of the individual author(s) and contributor(s) and not of MDPI and/or the editor(s). MDPI and/or the editor(s) disclaim responsibility for any injury to people or property resulting from any ideas, methods, instructions or products referred to in the content. |
© 2024 by the authors. Licensee MDPI, Basel, Switzerland. This article is an open access article distributed under the terms and conditions of the Creative Commons Attribution (CC BY) license (http://creativecommons.org/licenses/by/4.0/).
Copyright: This open access article is published under a Creative Commons CC BY 4.0 license, which permit the free download, distribution, and reuse, provided that the author and preprint are cited in any reuse.


