
Submitted:
28 April 2025
Posted:
29 April 2025
You are already at the latest version
Abstract
This study develops highly flexible, biodegradable polymer blends using bio-based polyhydroxyalkanoate (PHA) polymers for Fused Deposition Modeling (FDM) 3D printing. A Design of Experiments (DoE) approach optimized blend compositions by varying crystallinity levels of three PHAs, processed via twin-screw extrusion. Rheological analysis revealed that PHA blends exhibited 30–50% lower viscosity than PLA at low shear rates, ensuring improved processability. Tensile testing confirmed favorable mechanical properties, with elongation at break exceeding 2000%, significantly surpassing PLA (29%). Differential Scanning Calorimetry (DSC) indicated partial miscibility and crystallinity reductions of up to 50%, influencing printability. Optimized 3D printing parameters demonstrated minimal warping for blends with crystallinity below 18%, ensuring high-dimensional stability. In home-composting tests, PHA blends showed significant degradation within two months, whereas PLA remained intact. Scanning Electron Microscopy (SEM) confirmed microbial degradation. Cytotoxicity tests demonstrated that the blends were non-toxic, supporting applications in tissue engineering. These findings highlight the potential of PHA-based blends as sustainable, high-performance materials for biomedical, packaging, and environmental applications.
Keywords:
PHA
; 3D printing
; bio-based
; home-compostable
; flexible
; tissue engineering
1. Introduction
Three-dimensional (3D) printing, also known as additive manufacturing (AM), is an advanced fabrication technology that enables the production of intricate structures with complex architectures. This method has revolutionized production by enabling rapid engineering design, cost efficiency, and improved product quality control [1,2]. Moreover, 3D printing has transformed the manufacturing sector, shifting from prototype development to the rapid production of final products [3,4]. Unlike conventional manufacturing, which often involves subtractive techniques that generate excess waste, 3D printing follows an additive approach, constructing objects layer by layer with precise material usage. This minimizes material waste, enhances sustainability and production efficiency, and makes 3D printing a highly advantageous and environmentally responsible solution [5,6].
Fused Deposition Modeling (FDM) is among the most widely utilized additive manufacturing techniques. In this method, a thermoplastic filament is heated and extruded through a nozzle, building objects layer by layer [7,8]. Compared to other 3D printing techniques, FDM offers multiple advantages, including a wide selection of material options, ease of operation, and relatively low production costs. These characteristics make FDM particularly suitable for industrial applications and small-scale manufacturing [9,10].
FDM printing commonly utilizes thermoplastics such as polylactic acid (PLA), acrylonitrile butadiene styrene (ABS), and thermoplastic polyurethanes (TPU) [11,12,13]. Bio-based polymers like PLA have gained attention as sustainable alternatives to petroleum-derived plastics. PLA is favored for its printability, high mechanical performance, and biodegradability [13,14] However, PLA exhibits limited biodegradability under natural environmental conditions and requires industrial composting for efficient decomposition [15,16,17]. Studies indicate that PLA undergoes minimal degradation after 4–5 months of soil burial [18,19,20].
ABS and TPU are also widely used in FDM due to their excellent mechanical properties. TPU is known for its high flexibility and abrasion resistance, while ABS offers strength and heat resistance. Both materials are easily extruded and compatible with standard FDM printers, making them popular choices for diverse applications [21,22].However, as petroleum-based, non-biodegradable polymers, they pose challenges in waste management and long-term sustainability[23,24].
These environmental concerns highlight the need for materials that combine excellent 3D printing capabilities with enhanced sustainability. Developing biodegradable alternatives could mitigate the impact of plastic waste accumulation in landfills and ecosystems, addressing long-term pollution and waste management challenges [25,26].
Polyhydroxyalkanoates (PHAs) have attracted significant attention due to their sustainability, biodegradability, and potential applications in fields such as biomedical engineering, agriculture, food packaging, and cosmetics. PHAs are biopolymers produced by bacterial fermentation and degrade under aerobic and anaerobic conditions [27,28]. Among PHAs, polyhydroxybutyrate (PHB) is one of the most widely produced and commercially available variants. PHB exhibits properties comparable to polypropylene, including crystallinity, melting and glass transition temperatures, strength, and modulus. It can be processed using conventional melt processing techniques, such as 3D printing, extrusion, injection moulding, and thermoforming [29,30]. Additionally, PHB demonstrates good moisture resistance and superior oxygen barrier properties compared to polyolefins, making it a promising alternative to synthetic polymers [31]. However, native PHB has limitations such as brittleness and a narrow processing window[32] .
To address this issue, PHB can be blended with more flexible polymers like polyhydroxy butyrate-co-valerate (PHBV), polybutylene succinate-co-adipate (PBSA), or polycaprolactone (PCL), or modified with toughening agents to improve flexibility and processability [33,34,35]. Hlavacikova et al. investigated biodegradable materials suitable for FDM 3D printing by blending PHB and PHBV with PLA and modifying additives using a twin-screw extruder. The resulting blends exhibited improved elongation at break and lower crystallization temperatures compared to pure PHB or PHBV. While unmodified PHB and PHBV filaments showed poor flow behavior and warping, the prepared blends demonstrated enhanced flowability and enabled high-quality 3D printing [36].
Furthermore, PHBVs with medium hydroxy valerate (HV) content have gained interest due to their balanced flexibility and mechanical stability, addressing brittleness issues associated with high HB content [37,38,39]. The presence of medium HV concentrations improves 3D printing performance while maintaining eco-friendly properties [40,41].For example, Yichao Ma et al. developed biodegradable active packaging materials by blending PLA with PHB. The addition of PHB enhanced the mechanical properties, particularly elongation at break and toughness, thereby overcoming PLA’s inherent brittleness. Their study demonstrated that the PLA-PHB blend effectively preserved salmon freshness, showcasing its potential as an eco-friendly packaging alternative [42].
While biodegradable polymers have gained significant attention, the influence of blending PHAs with different crystallinity levels on 3D printing performance remains largely unexplored. This study aims to fill this gap by developing and characterizing fully bio-based and biodegradable polymer blends with tailored crystallinity to improve printability, mechanical strength, and environmental sustainability.
Herein, PHA polymers were blended using a twin-screw extruder, and the Design of Experiments (DoE) approach was applied to systematically assess how composition influences material properties. Crystallinity and glass transition temperatures were analysed through differential scanning calorimetry (DSC), while mechanical properties and 3D printing performance were evaluated in detail. The study further examines the role of medium and low-crystallinity PHAs in shaping rheological behaviour, printability, and biodegradability under real home composting conditions. Additionally, biocompatibility assessments, including agar diffusion and contact cytotoxicity tests, were conducted to explore the suitability of these flexible, 3D-printable materials for applications in biomedical engineering, sustainable packaging, and agriculture.
2. Materials and Methods:
2.1. Materials
Polyhydroxyalkanoates (PHAs) – Three types of PHAs were delivered by company Panara a.s., Nitra, Slovakia. PHA1 – polyhydroxyalkanoate with high crystallinity (52%), Tg = 5.1°C, Tm = 166.7°C, in powder form. PHA2 – amorphous polyhydroxyalkanoate with 0% crystallinity, Tg = -14.9°C, Tm not detectable on DSC. PHA3 – polyhydroxyalkanoate with medium crystallinity (36.2%), Tg = 2.4°C, Tm = 148.6°C. PLA filament for 3D printing, delivered by the company Turtle, s.r.o., Slovakia, was considered as the reference material for 3D printing.
2.2 Methods
2.2.1. Blend preparation
- a)
- Design of Experiment
As the first step, the various formulations of blends containing three different types of PHAs were investigated to determine the optimal compositions for materials suitable for Fused Deposition Modelling (FDM) 3D printing. The primary objective was to develop materials that are 100% bio-based, home-compostable, biocompatible, and flexible. For this purpose, the Design of Experiments (DoE) methodology was employed. A two-factor, five-level DoE was designed, the factors were chosen as follows:
The first factor (x1) was PHA2-to-(PHA1 + PHA3) mass ratio (PHA2/(PHA1 + PHA3)) and second factor of the experiment (x2) was the PHA3-to-PHA1 mass ratio. Table 1 presents the encoded values of both factors based on their actual real values and Table 2 present composition in encoded values of all prepared blends. The limit values in coded levels -1.141 and 1.141 correspond with the limit composition of the samples, while the mean value is located at the coded coordinate 0. The confidence interval for evaluation of results was 95%.
All measured and evaluated properties were analysed using the DoE methodology. The regression coefficient of Equation (1) was calculated, and an Analysis of Variance (ANOVA) was performed for the DoE.
Parameters x1 and x2 represent independent DoE factors and regression coefficients bi, bii, and bij were calculated for each property from the statistical and regression analysis together with the calculation of critical values used for statistical significance evaluation.
In general, from ANOVA analysis for all the tests in this paper, the important parameters will be discussed as follows:
F1 – Fischer – Snedecor criteria for testing of significance of linear part of equation (1) for given property
F2 – Fischer – Snedecor criteria for testing of significance of non-linear part of equation (1) for given property
FLF - Fischer – Snedecor criteria for testing of significance of equation (1) accuracy (Lack of Fit criteria)
sE+/- – experimental standard deviation
sLF+/- – Lack of fit standard deviation (inaccuracy of regression equation (1)
b) Experimental Blending
All blending components were introduced into the hopper of a laboratory twin-screw extruder (Labtech, Thailand) with a screw diameter of 16 mm and a length-to-diameter (L/D) ratio of 40. The screw geometry incorporated three kneading zones, and atmospheric venting was positioned at the 38D mark on the barrel. Extrusion was conducted at a screw speed of 150 RPM, with the temperature profile along the barrel set to 70-120-170-180-190-190-190-180-175-170°C from the hopper to the die.
The extruded melt was cooled in a water bath maintained at 20°C. After exiting the water bath, surface moisture was removed by vacuum suction, and the strand was pelletized using a pelletization cutter. The pellets were then dried in a hot air oven at 50°C for 24 hours before further processing.
2.2.2. Rheology Measurement
The samples were placed in the biconical chamber of the rheometer, and the testing program was initiated. After sealing the chamber, the temperature was set to 180°C, and the samples were preheated for 1.5 minutes at an oscillation angle of 6° and an oscillation frequency of 60 CPM. Following the preheating stage, the temperature was adjusted to 160°C, and the flow curve measurement began at the same oscillation frequency of 60 CPM. The oscillation angle was gradually increased from 2° to 50°, resulting in shear rates ranging from 1.34 to 40 s⁻¹. The complex viscosity was recorded using the rheometer software, and the relationships between complex viscosity and shear rate were evaluated for all samples. Thermal properties measurements
The thermal properties of all blends were determined using a differential scanning calorimeter (DSC 1, Mettler-Toledo Inc., USA). Key thermal characteristics, including the glass transition temperature (Tg), crystallization temperature (Tc), and melting temperature (Tm), were evaluated from measurements conducted on blend pellets..
A sample weighing 10–15 mg was placed in a standard aluminum pan and inserted into the measurement chamber, while an empty aluminum pan was used as a reference. Nitrogen was employed as the inert gas with a flow rate of 50 mL/min. The measurement protocol was as follows:
- Isothermal hold at -70°C for 3 min
- First heating cycle: -70°C to +200°C at a heating rate of 10 K/min
- Isothermal hold at +200°C for 3 min
- Cooling cycle: +200°C to -70°C at a cooling rate of 10 K/min
- Isothermal hold at -70°C for 3 min
- Second heating cycle: -70°C to +200°C at a heating rate of 10 K/min
The heat flow dependency on temperature was recorded as the output of the measurement. All investigated thermal parameters were analyzed using DSC curves, processed with the SW STARe 16.40 evaluation software (Mettler-Toledo Inc.). Flow curves for all samples were recorded at 160°C. Complex viscosity as well as plastic and elastic part of viscosity were evaluated for all 13 blends and PLA standard.
2.2.3. Preparation of Filaments for 3D Printing
Filaments suitable for Fused Deposition Modeling (FDM) 3D printing were produced from pre-dried pellets using a single-screw extruder (Plasticorder Brabender, Germany). The extruder was equipped with a 19 mm diameter screw, an L/D ratio of 25, and a compression ratio of 1:2. The extrusion process was conducted at a screw speed of 20 RPM, with a barrel temperature profile ranging from 160°C to 190°C (from the hopper to the die).
The extruder head was fitted with a round die of 2.0 mm diameter, and the extruded filaments were cooled in a water bath maintained at 45°C. The filament diameter was regulated through a variable pulling speed on the pull-off device, ensuring a final filament diameter of 1.75 mm ± 0.15 mm.
2.2.4. 3D Printing Procedure
All prepared samples in filament form were tested for 3D printability, and all specimens for mechanical testing were fabricated using 3D printing technology. For this purpose, an FDM 3D printer (Ender 3, Creality, China) was employed. The printer was modified to enable printing with elastic filaments, featuring a direct-drive extruder and a dual 4010 cooling fan.
All samples were printed using a standard 0.4 mm nozzle on a textured PEI print bed, which was not heated during the printing process (resulting in a bed temperature range of 23-29°C). 3D lac spray was applied to enhance bed adhesion when necessary.
The print parameters were as follows:
- cooling fan speed: 100%,
- print speed: 10 mm/s (0.7 - 0.5 mm³/s),
- layer height: 0.2 mm.
Each sample was 3D printed at optimal temperature, determined through temperature tower printing. Using FDM technology, temperature towers were printed for each biodegradable PHA polymer blend. For each material, a temperature tower was fabricated within a temperature range of 220°C to 170°C, with a temperature gradient of 10°C per printed layer (Figure 15). The optimal printing temperature and overall print quality were assessed by analyzing geometric features such as interlayer bridges, overhangs, and the rounding of the outer wall.
The temperature tower consists of multiple levels, with each level printed at a different temperature. The first level was printed at 220°C, and each subsequent level was printed at a temperature 10°C lower until a printing temperature of 170°C was reached. The quality of each level was visually inspected, and the optimal printing temperature for the polymer blend was determined based on the best-performing level. The design of the temperature tower is shown in Figure 1.
2.2.5. Warping Test
The warping tendency of each prepared sample was evaluated by 3D printing a specially designed test object (Figure 2) with a low contact surface at the optimal printing temperature. The printed object had a triangular cross-section prism shape, with an apex angle of 60° and a prism length of 6 cm.
The printing procedure was as follows:
- The first layer, with a width of 0.4 mm and a thickness of 0.2 mm, was applied to the bed, forming the apex of the triangular cross-section of the prism.
- Each subsequent layer was wider, ensuring that the apex angle remained at 60°.
- The height of each printed layer was 0.2 mm
With each additional layer, the bending force acting on the bottom layer, due to the volumetric shrinkage of the cooled material, caused the edges of the prism to lift away from the build plate (bed). The printing process was monitored to determine at which layer the edges of the bottom layer detached from the bed. No warping effect was observed if the number of layers reached the maximum (43 layers) without detaching the edges of the bottom of the prism from the bed.
After each printing procedure, the build plate was thoroughly cleaned with water and degreased with isopropanol (IPA). The warping effect was evaluated based on the number of printed layers at which the first detachment from the bed was observed.
2.2.6. Tensile Test
For the test, dog-bone tensile bars (STN ISO 37, Type 2) were 3D printed using an FDM 3D printer. For each polymer blend, 8 tensile bars were printed at the optimal printing temperature with a layer height of 0.2 mm. Each sample was then tested using a universal testing machine (Zwick Roell, Germany) according to STN ISO 37 standards. The grip separation was set to 50 mm, with the contact extensometer working distance set to 30 mm. The cross-head speed was set to 50 mm/min. Yield stress, tensile strength at break, Young’s modulus, and tensile strength at break were evaluated from the tensile curves.
Tensile tests were also conducted on 3D filaments. The same universal testing machine was used for testing the filaments as for the tensile bars. The grip separation was set to 20 mm, with a cross-head speed of 50 mm/min. Elongation was determined from the grip separation at the point of break.
2.2.7. Bending Test
For the determination of Young’s modulus in bending mode (flexural modulus), the three-point bending test was applied according to ISO 178. The specimens, in a bar shape, were printed using an FDM 3D printer at the optimal temperature, with dimensions of 80 x 10 x 4 mm. The three-point bending test was performed on a universal testing machine (Zwick Roell, Germany) by ISO 178. The distance between the support points was set to 64 mm, and the load was applied using a load pin at the center of the span, with a cross-head speed of 5 mm/min. During the test, the stress-strain dependency of the specimen was recorded, and the flexural modulus was determined according to the ISO 178 standard.
2.2.8. Hardness Testing
The same specimens used for the bending test were employed for hardness measurements according to ISO 868. For each sample, 3 measurements were performed on each of the 8 specimens, resulting in a total of 24 measurements. The hardness was measured using the Shore D scale.
2.2.9. Impact Strength Testing
The same 3D printed bars used for the bending and hardness tests, with dimensions of 80 x 10 x 4 mm, were utilized for Charpy impact strength testing according to ISO 179. For each polymer blend, 5 bars were printed at the optimal printing temperature with a layer height of 0.2 mm. The test was performed using an impact pendulum tester (Instron, USA). The specimens were unnotched, and before testing, all specimens were cooled to -30°C for 30 minutes. The potential energy of the pendulum used was 5 J.
2.2.10. Home Composability in Real Conditions
The composability test was conducted under real conditions using a home compost system. Specially designed with varying wall thicknesses (increasing from 0.2 mm to 1.2 mm) and a sample with a thickness of 0.2 mm in a square shape were 3D printed from selected polymer blends as well as from standard PLA for reference (The slicer models of the 3 printed specimens are shown in Figure 3a and b.
Each specimen was placed separately in a perforated cage with dimensions of 20 x 20 x 20 cm (Figure 3c), along with a specific marker for identification. The specimens were positioned in the center of the cage, surrounded by substrate from a home composter (Figure 3d). These cages were then evenly distributed in a regular composter (dimensions: 1x1x1 m), placed at the middle height, and surrounded by the same substrate (Figure 3e). The composter was left outdoors in the garden, uncovered.
Each week, fresh vegetable scraps and cut-offs were added to the composter and incorporated into the substrate. If the top layer became dry, the composter was thoroughly watered. The composting process took place over two months, with average temperatures ranging from 0 to 15°C at night and 10 to 20°C during the day.
At the end of the experiment, the specimens were carefully removed from the compost and cleaned under water. Decomposition was evaluated visually, and surface destruction was analysed using scanning electron microscopy (SEM).
2.2.11. Scanning Electron Microscopy (SEM)
Scanning Electron Microscopy was used for surface observation of samples before and after the home compostability test. Surface changes on the tested specimens before and after composting were observed using JEOL F 7500 SEM (JEOL, Tokyo, Japan). Samples were coated by a gold/platinum alloy using Balzers SCD 050 sputtering equipment.
2.2.12. Cytotoxicity Testing
The agar diffusion test was performed in accordance with the ISO 10993-5 standard to evaluate cytotoxicity. Gingival fibroblasts (GFs) were seeded as a suspension at a concentration of approximately 0.5 × 10⁶ cells per Petri dish in sterile 60 mm Petri dishes. The cells were incubated at 37°C in a 6% CO₂ atmosphere until they reached confluence.
Once confluence was achieved, the culture medium was aspirated, and the scaffolds, along with the negative and positive controls, were placed at the center of each Petri dish. The negative control consisted of cells without a matrix, while the positive control was a piece of sterile gauze (1 × 1 cm) moistened with a 20% sodium dodecyl sulfate (SDS) solution. The samples and controls were subsequently covered with 4 mL of agar medium, composed of 1% agar in DMEM with 2% FBS, and incubated at 37°C for 24 hours.
After incubation, the cells were stained with 1% agar containing 0.2% neutral red. The samples were tested in triplicate, and the cytotoxicity was evaluated at 24 and 48 hours based on cellular uptake of neutral red. This dye preferentially stains the acidic regions of viable cells, particularly lysosomes, resulting in red coloration. The cytotoxicity of the scaffolds was assessed by measuring the width of the unstained zone around the samples, which corresponds to areas where cell membranes were compromised. The response index was calculated as the ratio of the zone index to the lysis index.
2.2.13. Contact Toxicity Testing (TCT)
Contact toxicity testing was conducted according to the ISO 10993-5 standard. A cell suspension of gingival fibroblasts (GFs) was prepared at a concentration of 0.5 × 10⁵ cells/mL. The polymer scaffolds, fabricated via 3D printing, were sterilized by UV radiation before testing. Each scaffold was placed at the center of a sterile 60 mm Petri dish and fixed in place with a sterile U-shaped glass. To each Petri dish, 1 mL of the cell suspension and 4 mL of DMEM were added.
Cell morphology was observed daily under an inverted microscope. At the end of the experiment, the cells were trypsinized using 0.25% trypsin and 0.02% EDTA, and the cell count was determined using a Bürker counting chamber. For evaluating cell proliferation in the presence of the tested polymer samples, negative and positive controls were included. The negative control (NC) consisted of a 1 × 1 cm sterile gauze piece, while the positive control (PC) was a sterile gauze piece moistened with a 20% sodium dodecyl sulfate (SDS) solution. Each sample was tested in triplicate.
3. Results and Discussion
3.1. Rheology
Rheological analysis of the polymeric blends was conducted to examine their viscoelastic properties in the molten state. Typical flow curves for blend with highest and blend with lowest viscosity are in Figure 4. together with flow curve for PLA.
As figures, prepared samples, including the PLA standard material, exhibit shear-thinning behaviour. The melts predominantly display plastic behaviour, with minimal elastic deformation during flow. In general, the viscosities of PHA blends are significantly lower than those of PLA, particularly at lower shear rates. Compared to PLA, PHA blends exhibit a lower contribution of elastic viscosity.
Unlike prior studies that primarily focus on the bulk rheological behaviour of PHA-based blends [43,44], this research systematically investigates the correlation between crystallinity and viscosity reduction, demonstrating a significant improvement in low-shear-rate processability. The findings reveal that increasing the amorphous PHA content leads to a tuneable shear-thinning profile, which can be tailored for specific 3D printing applications, ensuring better filament extrusion and layer adhesion.
To assess the influence of composition on the rheological behaviour of PHA blends, complex viscosity, as well as the elastic and plastic components of viscosity at a shear rate of 15 s⁻¹, were evaluated using the Design of Experiments (DoE) method. Regression analysis and statistical evaluation through ANOVA are presented in Table 3, and the response surfaces for all three viscosity components are depicted as 3D diagrams in Figure 5.
Statistical and regression analyses confirmed the high plasticity and low elasticity of the studied blends, with the response surface being significantly lower than the viscosity of PLA. Within the experimental range, the viscosity of PHA blends is strongly influenced by both factors, with the ratio of PHA₂/(PHA₁+PHA₃) having the most significant effect. Amorphous PHA is the primary component determining the viscosity of the blend.
Compared to PLA, one of the most commonly used materials for 3D printing due to its suitable printability, the lower viscosity values observed in PHA blends suggest that these materials can be processed efficiently via 3D printing without significant challenges. In general, a low level of elastic flow in polymer melts results in reduced die swelling, which is beneficial for maintaining dimensional accuracy during extrusion-based processes[45,46]. Notably, the minimal elastic flow exhibited by PHA blends indicates a low likelihood of die swelling, further supporting their suitability for 3D printing applications.
3.2. Thermal Properties and Crystallinity
Thermal properties were evaluated based on DSC measurements. Typical DSC record is visible on Figure 6. The first heating cycle was conducted solely to eliminate the sample’s thermal history. Crystallization parameters were evaluated during the cooling phase, while the glass transition temperature (Tg), melting temperature (Tm), and melting enthalpy (ΔHm) were determined from the second heating cycle.
Each PHA exhibits its own Tg; however, thermograms of the blends revealed only two Tg values, which differed from those of the pure components. This observation confirms the miscibility of the PHAs. The Tg, Tm, and ΔHm values for all samples and individual components, as determined by DSC measurements, are presented in Table 4.
Based on the measured thermal parameters, particularly the Tg values, full miscibility between PHA₃ and PHA₁ can be assumed, as none of the samples exhibited three distinct Tg values. Instead, each sample displayed a Tg of approximately -15°C or lower. The presence of two Tg values suggests the existence of two phases within the blend, with each phase representing at least partial miscibility between two or three PHAs.
All measured and calculated thermal parameters from Table 4 were analyzed using the Design of Experiments (DoE) method. The results, including regression analysis and ANOVA, are presented in Table 5, and response surfaces are illustrated in Figure 7.
Tg₁ represents the modified Tg of PHA₂, and its shift to lower values indicates the existence of miscibility between PHA₂ and/or PHA₁ and PHA₃ in the blends. This suggests that polymer segments interact with each other, behaving as plasticizers. The Tg₁ temperature is strongly influenced by both independent variables, showing both linear and quadratic effects, which further supports molecular interactions among all three polymers. In contrast, Tg₂ depends only on factor x₁, i.e., the content of amorphous PHA₂, and is unaffected by the ratio of the two semicrystalline PHAs (PHA₃/PHA₁). This suggests that PHA₁ and PHA₃ form a single phase within the blend, which is partially miscible with PHA₂. The strong dependence of Tg shifts on concentration ratios indicates partial miscibility of the blended polymers.
The melting temperature (Tm) is significantly influenced only by the ratio of semicrystalline polymers, decreasing as the PHA₃ content increases, as PHA₃ exhibits a lower Tm than PHA₁. Figure 6 clearly shows that, despite the sufficiently different Tm values of PHA₁ (166.7°C) and PHA₃ (148.6°C), only a single melting peak is present, with no double peak formation. This suggests that PHA₁ and PHA₃ are miscible in the molten state, forming a mixed crystalline structure that is not influenced by the amorphous phase. Amorphous PHA₂ primarily affects the crystallinity of the blend, with crystallinity decreasing as the PHA₂ concentration increases. In contrast, the PHA₃/PHA₁ ratio has a much weaker impact on overall crystallinity.
3.3. Optimal Printing Temperature and Warping
Before 3D printing, the optimal printing temperature and warping properties as crucial pre-printing features, were examined. It is important to note that these properties were not evaluated using Design of Experiments (DoE). As described in the methodology section, the optimal 3D printing temperature was determined through visual inspection of the printed temperature tower. An example of a 3D printed temperature tower for the sample B8 is shown in Figure 8.
It is evident that the sample is not easily extrudable through the 3D printer nozzle at lower temperatures (170°C), and the temperatures of 180°C and 190°C still do not yield optimal results. Moreover, at higher temperatures (210–220°C), bending is observed at the centre of the bridge. In contrast, the sample at 200°C exhibits significantly improved 3D printing performance.
Consequently, the warping behaviour during 3D printing was assessed for all samples within their optimal printing temperature range. The optimal printing temperatures, determined through temperature tower evaluation, along with the warping effects, are summarized in Table 6.
It is evident, that the optimal printing temperature for all prepared PHA blends ranges between 200°C and 210°C, comparable to that of standard (or even slightly lower). However, the warping tendency, expressed as the number of layers at which detachment from the print bed occurs, varies significantly across the blends. Lower values indicate poorer printability due to increased warping, and analysis revealed that warping behaviour is strongly dependent on the crystallinity content of the material. Therefore, Figure 9 illustrates the evaluated relationship between warping and crystallinity.
The findings indicate that PHA-based blends with crystallinity levels below 18% exhibit no warping, which is essential for maintaining precision in biodegradable final products fabrication (Figure 10). By optimizing the composition of PHA blends, this study presents a material design strategy that improves both printability and mechanical performance. It is worth mentioning that, while previous research [36] has primarily assessed printability through qualitative methods, this study presents a material design strategy that improves both printability and mechanical performance.
In the subsequent step, rectangular stair-shaped specimens were printed according to the optimized conditions for each sample. Figure 10 illustrates a typical 3D-printed specimen, representing the architecture of a) all PHA-based samples and b) PLA sample. Overall, all PHA-based blends were successfully 3d printed, compare to slicer model (in Figure 3 a and b), demonstrating the excellent 3D printing capability of the novel PHA-based blends.
In fact, the optimal 3D printing temperature, low warping tendency, and precise 3D printing capability of these novel PHA-based blends position them as promising candidates for 3D printing processes, offering a competitive alternative to PLA.
3.4. Tensile Properties of Filaments and 3D-Printed Samples
Tensile properties of biodegradable blends were evaluated using two types of specimens: prepared filaments for 3D printing and printed dog bone specimens for tensile testing. The properties measured on filaments represent the intrinsic material characteristics, whereas the values obtained from printed specimens also account for interlayer adhesion forces and the orientation of printed layers. Regression and statistical evaluations based on the DoE method for both specimen types are presented in Table 7, while the corresponding response surfaces are illustrated in Figure 11.
All tensile properties measured on 3D filaments are significantly influenced by factor x₂, which corresponds to the content of amorphous PHA in the blend. These results demonstrate that the blends are highly flexible, with a high elongation at break. The elongation at break for PHA blends is dramatically higher compared to the negligible elongation observed for pure PLA filament. The elongation values for PHA blends can reach several thousand percent, in contrast to only 29% for PLA. Given their high flexibility and significant elongation at break, these PHA blends exhibit promising mechanical properties that make them particularly suitable for soft tissue engineering applications, where materials need to closely mimic the flexibility and stretchability of biological tissues[49,50].
Logically, strength parameters—both yield stress and tensile strength at break—are significantly lower than those for pure standard PLA filament, but they remain sufficiently high for practical applications. The mechanical properties of 3D-printed specimens show slightly different results. While yield strength is solely dependent on the amorphous PHA content in the blend, the PHA₃/PHA₁ ratio does not have as significant an effect as in the filaments. The yield stress of printed specimens is comparable to that of the filaments, with layer adhesion and arrangement having no substantial influence on this property. In contrast, tensile strength at break, as the ultimate property, is strongly influenced by layer adhesion and layer arrangement. Final values for tensile strength at break are significantly lower in the 3D printed specimens compared to the filaments.
Regarding elongation at break, neither of the two factors significantly influences the results, due to high experimental variability, as reflected by the experimental standard deviation of ±348%. As a result, a response surface for elongation at break is not provided in Figure 6, as the surface lacks interpretive value. The high experimental error and the lower absolute values of both ultimate properties (tensile strength and elongation at break) for printed specimens, as compared to 3D filaments, can be attributed to layer delamination during the tensile tests at high deformation levels, which was observed during testing.
The results from the DoE evaluation of tensile testing demonstrate that the investigated PHA blends exhibit a wide range of mechanical properties, particularly a broad spectrum of flexibility, which is dependent on the blend composition. This offers a simple method for producing 3D printing materials with a diverse range of tensile properties, allowing for customization according to specific application requirements.
3.5. Hardness, Flexural Modulus and Impact Strength
The flexibility of the material is well represented by hardness, while the toughness is reflected by the impact strength. Shore D hardness, flexural modulus (measured in a three-point bending arrangement), and Charpy unnotched impact strength were measured following the procedures outlined in method part. Impact strength was tested at -30°C, as at the ambient temperature of 23°C, all specimens were sufficiently flexible that, under the impact of the pendulum, they bent over the supporting holders to the opposite side without any defects. Regression and statistical evaluation values, based on the DoE method, for all evaluated parameters are presented in Table 8, and the corresponding response surfaces are shown in Figure 12.
The hardness of PHA blends is significantly lower than that of PLA and is predominantly influenced by the content of amorphous PHA₂, which causes a rapid decrease in hardness. The ratio of the two semicrystalline PHAs, PHA₃/PHA₁, has a weaker effect on the hardness of the blends. Logically, hardness slightly decreases as the relative concentration of the less crystalline PHA (PHA₃) increases. While hardness primarily reflects the surface properties of the samples, the flexural modulus is more indicative of the bulk properties of the specimens. The flexural modulus of the PHA blends within the experimental range defined by the DoE is several times lower than that of PLA, with the lowest value being more than ten times lower. The flexural modulus of the studied PHA blends decreases rapidly with increasing amorphous PHA₂ content, similar to hardness, but with a more pronounced curvature along the x₂ axis.
An interesting behavior is observed in the impact strength, as determined by the unnotched Charpy impact test at -30°C. While hardness and flexural modulus are significantly influenced only by the amorphous content of the blend, impact strength is determined by both factors. A relatively strong interaction between the two factors was confirmed through regression and statistical evaluation. The ratio of PHA₃/PHA₁ fine-tunes the crystallinity of the blend. It is evident that when the blend contains a small amount of amorphous PHA₂ (low values of x₂), increasing the PHA₃ content in the PHA₃/PHA₁ blend enhances impact strength. Conversely, at higher PHA₂ content, a higher PHA₃/PHA₁ ratio leads to a decrease in impact strength. The highest impact strength in the investigated blends is observed at the highest PHA₂ content and the highest PHA₁ content within the PHA₃/PHA₁ ratio.
The results show that neither very high amorphous content nor very high crystallinity yields the highest impact strength. Instead, an optimal ratio of amorphous and crystalline content is necessary for the best performance. In any case, the investigated PHA blends offer several times higher impact resistance than standard PLA material.
Therefore, PHA blends can be regarded as a viable alternative to PLA, given their significant enhancements in hardness, flexural modulus, and impact strength.
3.6. Biodegradability in Real Home Compost Conditions
Biodegradability testing is essential for assessing the environmental impact of materials, particularly alongside the development of sustainable alternatives to conventional plastics. Following a two-month exposure to composting conditions, the samples were extracted from the compost. Photographs of all the tested samples, taken immediately upon removal, are presented in Figure 13.
It should be noted that for or home composability in real conditions for samples from DoE scheme were selected according to Table 9:
All small square-shaped samples with a thickness of 0.2 mm, printed from PHA blends, underwent complete decomposition during home composting and were no longer present in the compost. In contrast, rectangular stair-shaped specimens exhibited varied degradation behaviours. Notably, while all PHA-based samples demonstrated substantial degradation in the first step of the rectangular structures (0.2 mm thickness), the PLA sample remained intact, highlighting the difference in compostability between these materials.
Visual assessment of the exposed samples suggests that the higher proportion of amorphous PHA₂ in sample B6, compared to its lower content in B5, contributed to a more rapid degradation rate. Crystallinity analysis further indicates that lower crystallinity enhances biodegradation, supporting the premise that the structural organization of the polymer influences its compostability. However, variations in the PHA₃/PHA₁ ratio in the other two samples demonstrate that a higher PHA₁ content is more favourable for home composting. Despite sample B7 exhibiting greater crystallinity than sample B8, it degraded more rapidly, suggesting that biodegradation rates are influenced by factors beyond crystallinity alone.
To gain a more detailed understanding of the degradation process, SEM analysis was conducted on all samples post-composting. Figure 14 presents the untouched surface of a sample B5 before composting as a reference, with all other samples displaying a similar initial surface morphology.
The results depicted in Figure 15 present the degradation trends of the analysed samples following a two-month home composting period. The SEM images captured at 50X and 500X magnifications reveal substantial decomposition in the PHA-based blends (samples B5–B8), as evidenced by significant material loss from the surface. In contrast, the PLA sample remains largely unaltered, exhibiting no visible signs of degradation under the same conditions. This difference in degradation behaviour can be attributed to the intrinsic properties of polyhydroxyalkanoate (PHA) polymers, which are known for their rapid biodegradation in composting environments. PHA polymers are a class of biodegradable materials synthesized by various microorganisms as intracellular energy storage compounds. According to the literature, their microbial origin makes them highly susceptible to enzymatic degradation by a diverse range of bacteria and fungi present in composting systems[51,52].
Figure 15.
SEM photos of surfaces of samples B5- B8 and PLA after composting. (the magnification is given in the first row).
Figure 15.
SEM photos of surfaces of samples B5- B8 and PLA after composting. (the magnification is given in the first row).
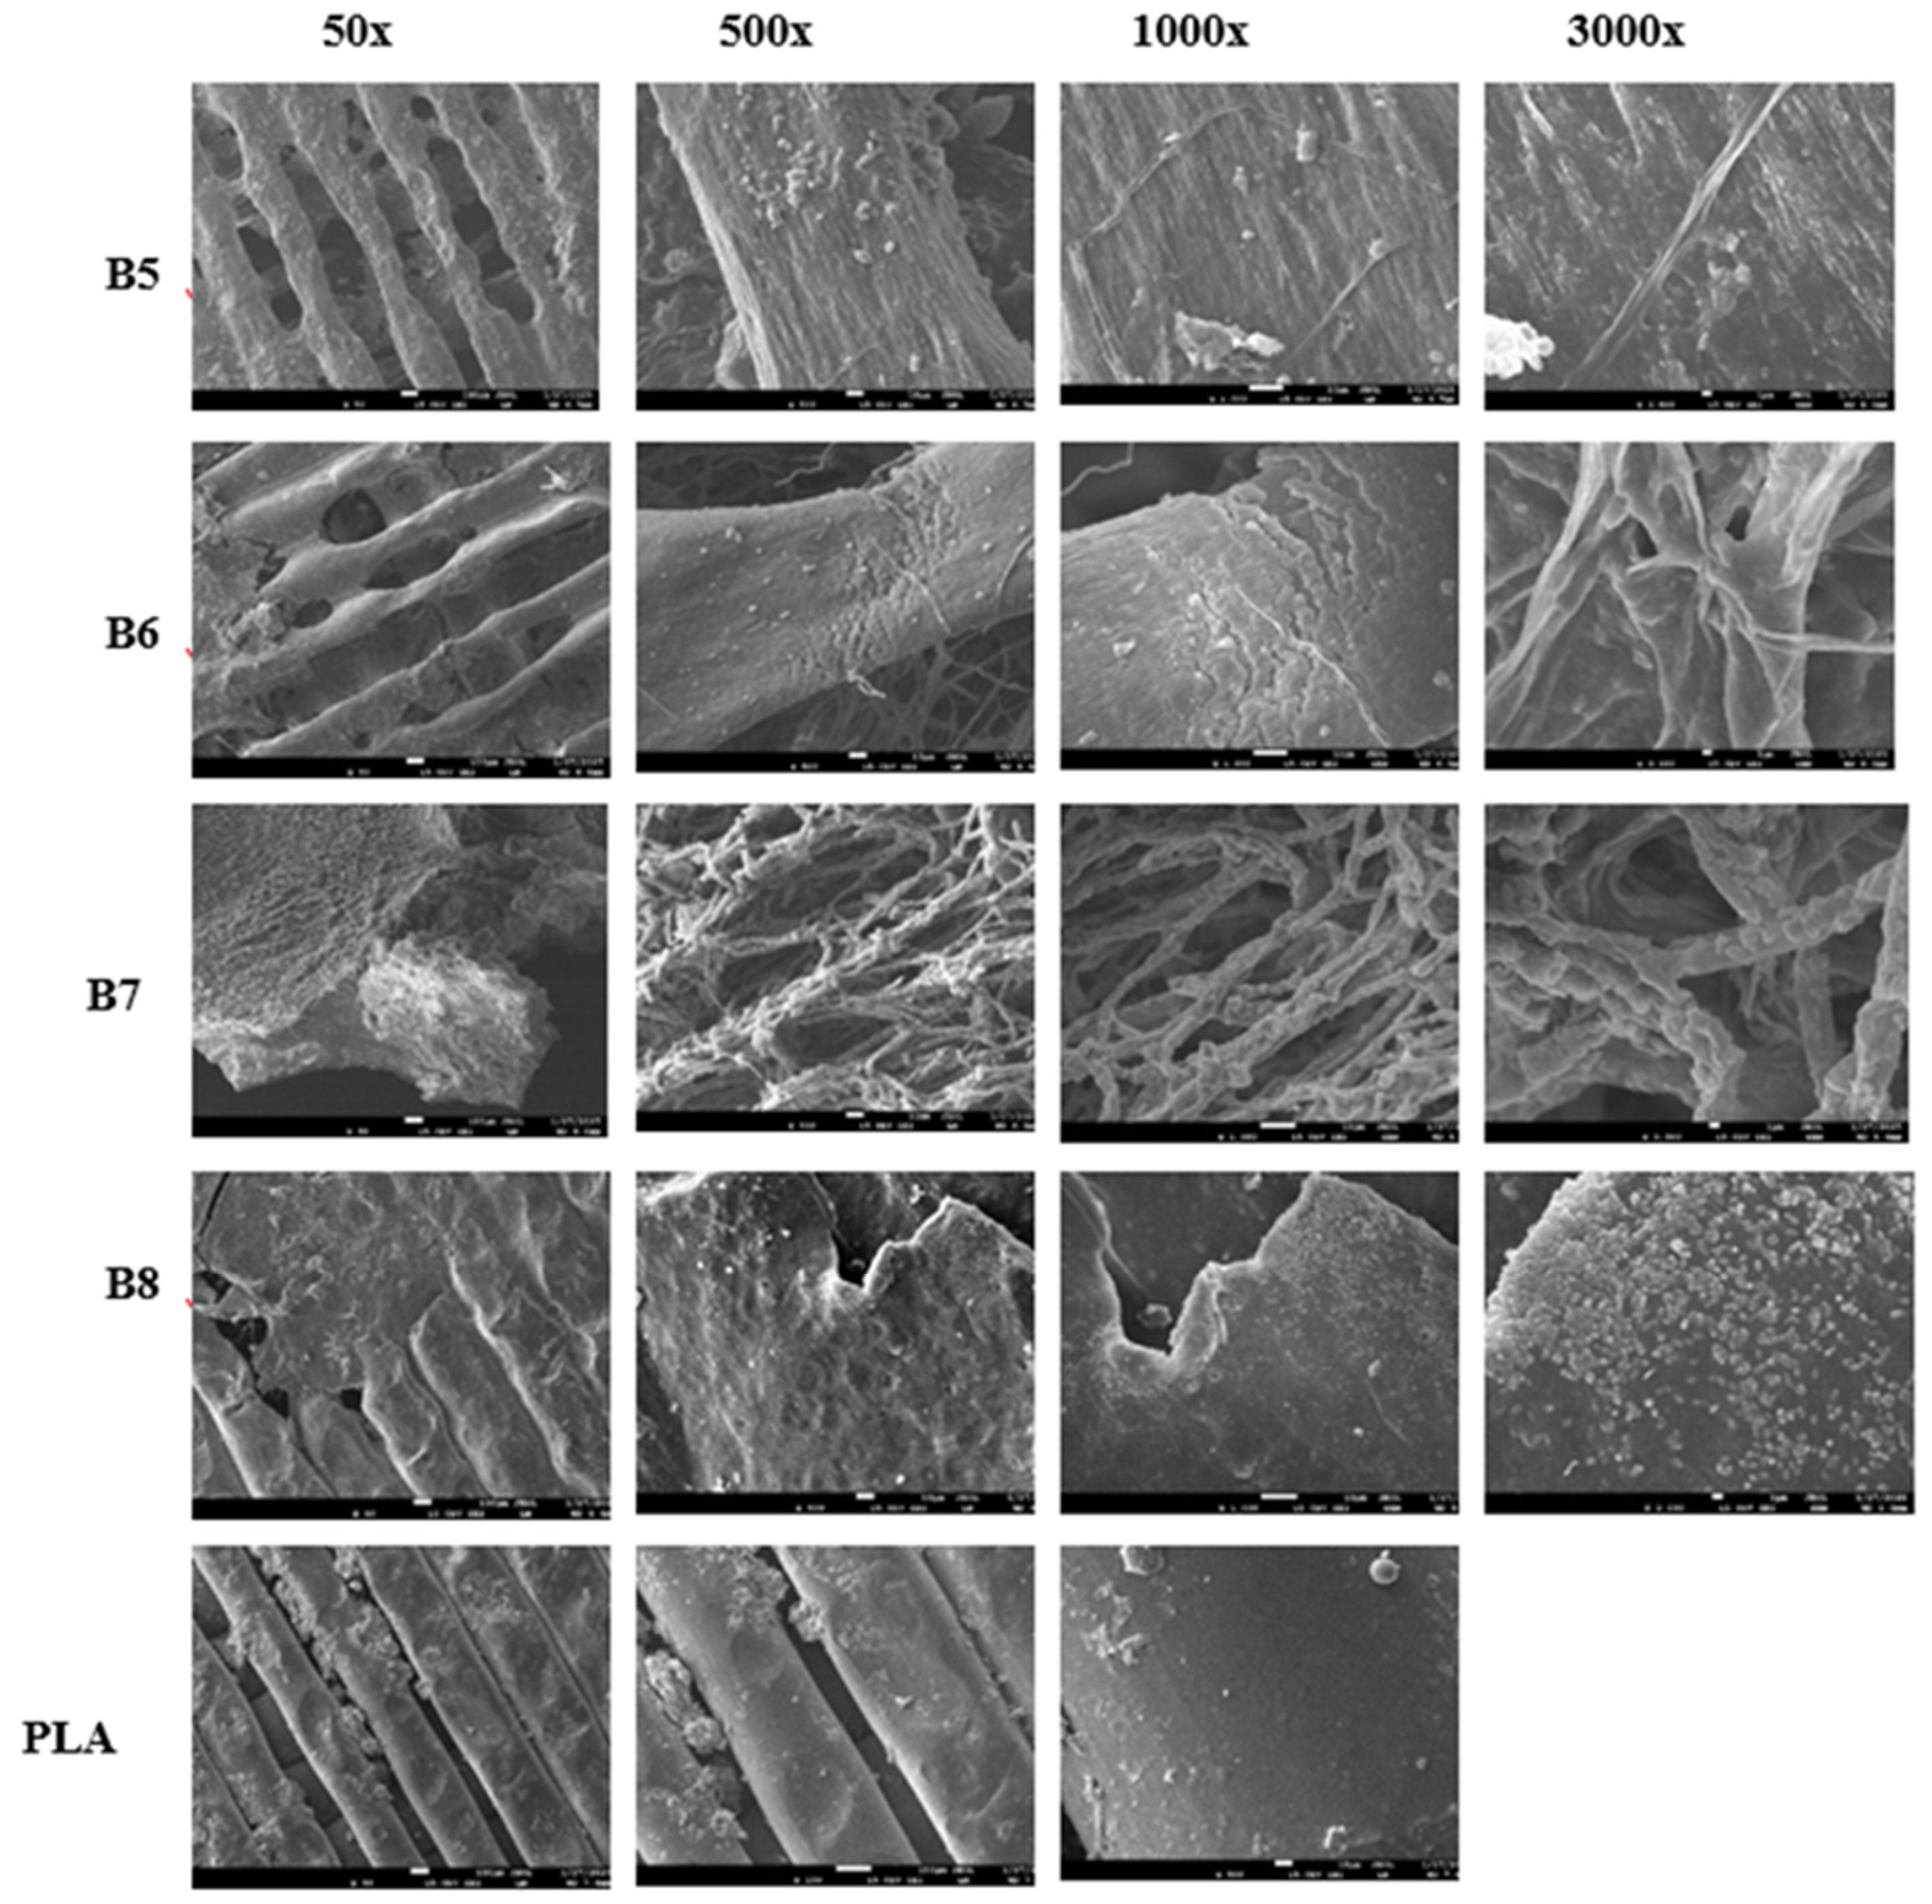
Figure 15 shows that at higher magnifications (1000X and 3000X), filamentous fungi are observed in small quantities on samples B5 and B6, while sample B7 shows a substantial portion of the surface covered by these fungi, indicating strong microbial adhesion to the sample surfaces. Furthermore, in Figure 16, sample B8, which exhibited substantial degradation, displays numerous bacterial colonies at 1000X to 3000X magnification. Higher magnifications (5000X, 20,000X, and 100,000X) were also examined to confirm the presence of these bacterial colonies.
The observed microbial activity aligns with existing literature emphasizing the pivotal role of bacteria and fungi in accelerating composting processes. Bacteria are the dominant microorganisms during all stages of composting, actively breaking down easily degradable organic materials. Their metabolic activities facilitate the decomposition of complex organic compounds, thereby enhancing the composting efficiency[53]. Furthermore, fungi, particularly filamentous types, are instrumental in degrading complex which are more resistant to bacterial decomposition. Their extensive
hyphal networks enable them to access and break down organic residues that are not readily available to bacteria, thus contributing significantly to the composting process[54]. The presence of bacterial colonies observed on sample B8 corroborates findings that these microorganisms are responsible for the rapid decomposition of materials during composting. Similarly, the extensive fungal coverage on sample B7 underscores the fungi’s role in breaking down complex organic substances, thereby facilitating the composting process. Therefore, the combination of microbial and fungal activity and the intrinsic biodegradability of PHApolymers facilitates the efficient breakdown of PHA-based materials and efficient decomposition compared to PLA in composting environments.
3.7. Cytotoxicity
The biodegradable and bio-based nature of the studied highly flexible polymer blends suggests their potential application in the fabrication of scaffolds for soft tissue engineering. Three-dimensional (3D) printing provides a promising approach for the precise customization of scaffold structures to accommodate patient-specific requirements. Blends B5 and B8 were selected for cytotoxicity evaluation as a fundamental assessment of their suitability for tissue engineering applications.
Cytotoxicity was analyzed using the agar diffusion test, followed by an in vitro contact toxicity test, both performed in accordance with ISO 10993-5 standards, as detailed in Section 2.2. Figure 17 presents images of the negative and positive controls, as well as samples B5 and B8, after 24 hours of exposure to the agar diffusion test.
The absence of noticeable discoloration in the periphery of samples B5 and B8 (Figure 17c) indicates a lack of cytotoxic response. The response index for Zone/Lysis was determined to be 0/0, confirming the non-cytotoxic nature of both polymer blends. This suggests that B5 and B8 do not adversely affect the viability of gingiva fibroblasts. Figure 18 and Figure 19 illustrate the results of the in vitro contact toxicity test, conducted over 72 hours.
After 72 hours, fibroblast cells exhibited normal growth and morphology in the vicinity of both B5 and B8 samples, comparable to the negative control (sterile gauze). No significant morphological alterations or signs of cytotoxicity were observed in fibroblasts exposed to the test materials. In contrast, in the positive control group, which contained SDS-treated gauze, extensive cell lysis was observed, with an almost complete absence of viable cells. The results depicted in Figure 18.
To further assess the biocompatibility of the tested materials, quantitative cell proliferation analysis was conducted by determining the viable cell count after 72 hours. As it is depicted in Figure 19 the relative cell number was normalized to the negative control, allowing for a comparative assessment. The results indicate that samples B5 and B8 supported fibroblast proliferation at levels comparable to or exceeding those observed in the negative control group. This suggests that the presence of these materials may have a neutral or potentially supportive effect on cellular proliferation.
Based on these findings, the studied highly elastic, bio-based, biodegradable polymer blends exhibit non-cytotoxic behavior and can be considered promising candidates for the fabrication of 3D-printed scaffolds for tissue engineering applications. Further studies, including long-term biocompatibility assessments and in vivo evaluations, are warranted to validate their suitability for clinical applications.
4. Conclusion
This study introduces a new class of biodegradable polyhydroxyalkanoate (PHA) blends designed for Fused Deposition Modeling (FDM) 3D printing, offering an environmentally friendly alternative to conventional thermoplastics. By carefully adjusting the crystallinity of PHA components, we achieved better processability, reduced viscosity, and enhanced shear-thinning behavior, leading to smoother extrusion and improved layer adhesion. Compared to polylactic acid (PLA), these blends demonstrate greater flexibility, superior elongation at break, and enhanced impact resistance, addressing key limitations of existing biodegradable 3D printing materials. A major advantage of these formulations is their rapid degradation under real home composting conditions, where complete breakdown occurred within two months—far surpassing PLA, which remained intact. Additionally, cytotoxicity tests confirmed their biocompatibility, making them strong candidates for biomedical applications, particularly bioresorbable scaffolds for tissue engineering. This research provides one of the first in-depth analyses of how PHA crystallinity directly influences 3D printability, biodegradation, and mechanical performance, paving the way for more sustainable material innovations in fields such as packaging, agriculture, and medicine. Future studies should explore further refinement of these formulations and evaluate their long-term performance in demanding applications.
Author Contributions
Conceptualization, Michal Ďurfina, Ján Kruželák and Nafiseh Babaei; methodology, Michal Ďurfina, Zuzana Vanovčanová and Nafiseh Babaei; investigation, Nafiseh Babaei, Zuzana Vanovčanová, Jozef Feranc and Vojtech Horváth; data curation, Nafiseh Babaei and Zuzana Vanovčanová; formal analysis, Ján Kruželák, Nafiseh Babaei and Ida Vašková; writing—original draft preparation, Nafiseh Babaei and Roderik Plavec; writing—review and editing, Michal Ďurfina and Roderik Plavec; supervision, Roderik Plavec; project administration, Michal Ďurfina; funding acquisition, Jozef Feranc. All authors have read and agreed to the published version of the manuscript.
Data Availability Statement
Data will be made available on request.
Acknowledgments
This work was supported by the grant of Research and Development Agency APVV-23-0221
Conflicts of Interest
The authors declare that they have no conflict of interest.
References
- Attaran M (2017) The rise of 3-D printing: The advantages of additive manufacturing over traditional manufacturing. Bus Horiz 60:677–688.
- Bose S, Akdogan EK, Balla VK, Ciliveri S, Colombo P, Franchin G, Ku N, Kushram P, Niu F, Pelz J (2024) 3D printing of ceramics: Advantages, challenges, applications, and perspectives. Journal of the American Ceramic Society 107:7879–7920.
- Jandyal A, Chaturvedi I, Wazir I, Raina A, Haq MIU (2022) 3D printing–A review of processes, materials and applications in industry 4.0. Sustainable Operations and Computers 3:33–42.
- Berman B (2012) 3-D printing: The new industrial revolution. Bus Horiz 55:155–162.
- Wu P, Wang J, Wang X (2016) A critical review of the use of 3-D printing in the construction industry. Autom Constr 68:21–31.
- Bai X, Liu Y, Wang G, Wen C (2017) The pattern of technological accumulation: The comparative advantage and relative impact of 3D printing technology. Journal of Manufacturing Technology Management 28:39–55.
- Kristiawan RB, Imaduddin F, Ariawan D, Ubaidillah, Arifin Z (2021) A review on the fused deposition modeling (FDM) 3D printing: Filament processing, materials, and printing parameters. Open Engineering 11:639–649.
- Dudek P (2013) FDM 3D printing technology in manufacturing composite elements. Archives of metallurgy and materials.
- Wickramasinghe S, Do T, Tran P (2020) FDM-based 3D printing of polymer and associated composite: A review on mechanical properties, defects and treatments. Polymers (Basel) 12:1529.
- Ntousia M, Fudos I (2019) 3D printing technologies & applications: an overview. In: Proceedings of the CAD 2020 Conference, Singapore. p 248.
- Desai SM, Sonawane RY, More AP (2023) Thermoplastic polyurethane for three-dimensional printing applications: A review. Polym Adv Technol 34:2061–2082.
- Thavornyutikarn B, Aumnate C, Kosorn W, Nampichai N, Janvikul W (2023) Acrylonitrile butadiene styrene/thermoplastic polyurethane blends for material extrusion three-dimensional printing: Effects of blend composition on printability and properties. ACS Omega 8:45013–45025. [CrossRef] [PubMed]
- Cuiffo MA, Snyder J, Elliott AM, Romero N, Kannan S, Halada GP (2017) Impact of the fused deposition (FDM) printing process on polylactic acid (PLA) chemistry and structure. Applied Sciences 7:579. [CrossRef]
- Bhagia S, Bornani K, Agrawal R, Satlewal A, Ďurkovič J, Lagaňa R, Bhagia M, Yoo CG, Zhao X, Kunc V (2021) Critical review of FDM 3D printing of PLA biocomposites filled with biomass resources, characterization, biodegradability, upcycling and opportunities for biorefineries. Appl Mater Today 24:101078.
- Karamanlioglu M, Preziosi R, Robson GD (2017) Abiotic and biotic environmental degradation of the bioplastic polymer poly (lactic acid): A review. Polym Degrad Stab 137:122–130. [CrossRef]
- Wu F, Misra M, Mohanty AK (2021) Challenges and new opportunities on barrier performance of biodegradable polymers for sustainable packaging. Prog Polym Sci 117:101395. [CrossRef]
- Kalita NK, Damare NA, Hazarika D, Bhagabati P, Kalamdhad A, Katiyar V (2021) Biodegradation and characterization study of compostable PLA bioplastic containing algae biomass as potential degradation accelerator. Environmental Challenges 3:100067. [CrossRef]
- Vasile C, Pamfil D, Râpă M, Darie-Niţă RN, Mitelut AC, Popa EE, Popescu PA, Draghici MC, Popa ME (2018) Study of the soil burial degradation of some PLA/CS biocomposites. Compos B Eng 142:251–262.
- Meereboer KW, Misra M, Mohanty AK (2020) Review of recent advances in the biodegradability of polyhydroxyalkanoate (PHA) bioplastics and their composites. Green Chemistry 22:5519–5558.
- Kanabenja W, Passornraprasit N, Aumnate C, Osswald TA, Aht-Ong D, Potiyaraj P (2024) Enhancing 3D printability of polyhydroxybutyrate (PHB) and poly (3-hydroxybutyrate-co-3-hydroxy valerate)(PHBV) based blends through melt extrusion based-3D printing. Addit Manuf 86:104205. [CrossRef]
- Samykano M, Selvamani SK, Kadirgama K, Ngui WK, Kanagaraj G, Sudhakar K (2019) Mechanical property of FDM printed ABS: influence of printing parameters. The International Journal of Advanced Manufacturing Technology 102:2779–2796.
- Shin EJ, Jung YS, Choi HY, Lee S (2022) Synthesis and fabrication of biobased thermoplastic polyurethane filament for FDM 3D printing. J Appl Polym Sci 139:e52959. [CrossRef]
- Mangal M, Rao CV, Banerjee T (2023) Bioplastic: an eco-friendly alternative to non-biodegradable plastic. Polym Int 72:984–996.
- Kirby B, Kenkel JM, Zhang AY, Amirlak B, Suszynski TM (2021) Three-dimensional (3D) synthetic printing for the manufacture of non-biodegradable models, tools and implants used in surgery: a review of current methods. J Med Eng Technol 45:14–21.
- Mazhandu ZS, Muzenda E, Mamvura TA, Belaid M, Nhubu T (2020) Integrated and consolidated review of plastic waste management and bio-based biodegradable plastics: Challenges and opportunities. Sustainability 12:8360. [CrossRef]
- Saalah S, Saallah S, Rajin M, Yaser AZ (2020) Management of biodegradable plastic waste: A review. Advances in Waste Processing Technology 127–143.
- Tan G-YA, Chen C-L, Li L, Ge L, Wang L, Razaad IMN, Li Y, Zhao L, Mo Y, Wang J-Y (2014) Start a research on biopolymer polyhydroxyalkanoate (PHA): a review. Polymers (Basel) 6:706–754.
- Żur-Pińska J, Gładysz MZ, Ubels D, Siebring J, Włodarczyk-Biegun MK (2023) Smart and sustainable: Exploring the future of PHAs biopolymers for 3D printing in tissue engineering. Sustainable materials and Technologies 38:e00750.
- Sharma V, Sehgal R, Gupta R (2021) Polyhydroxyalkanoate (PHA): properties and modifications. Polymer (Guildf) 212:123161.
- Gigante V, Cinelli P, Seggiani M, Alavarez VA, Lazzeri A (2020) Processing and thermomechanical properties of PHA. The Handbook of Polyhydroxyalkanoates 91–118.
- Angelini S, Cerruti P, Immirzi B, Santagata G, Scarinzi G, Malinconico M (2014) From biowaste to bioresource: Effect of a lignocellulosic filler on the properties of poly (3-hydroxybutyrate). Int J Biol Macromol 71:163–173.
- Schmidt A, Bittmann-Hennes B, Montero B, Wetzel B, Barral L (2023) Green bionanocomposites based on polyhydroxybutyrate and filled with cellulose nanocrystals: Melting processing and characterization. J Polym Environ 31:4801–4816. [CrossRef]
- Abdelwahab MA, Flynn A, Chiou B-S, Imam S, Orts W, Chiellini E (2012) Thermal, mechanical and morphological characterization of plasticized PLA–PHB blends. Polym Degrad Stab 97:1822–1828.
- Avella M, Martuscelli E, Raimo M (2000) Review Properties of blends and composites based on poly (3-hydroxy) butyrate (PHB) and poly (3-hydroxybutyrate-hydroxyvalerate)(PHBV) copolymers. J Mater Sci 35:523–545. [CrossRef]
- Garcia-Garcia D, Ferri JM, Boronat T, López-Martínez J, Balart R (2016) Processing and characterization of binary poly (hydroxybutyrate)(PHB) and poly (caprolactone)(PCL) blends with improved impact properties. Polymer Bulletin 73:3333–3350. [CrossRef]
- Hlaváčiková S, Omaníková L, Horváth V, Alexy P, Jančovičová V, Baco A, Mikolajová M, Fogašová M, Tomanová K, Feranc J (2024) The possibility of using the regranulate of a biodegradable polymer blend based on polylactic acid and polyhydroxybutyrate in FDM 3D printing technology. Results in Materials 21:100511. [CrossRef]
- Laycock B, Halley P, Pratt S, Werker A, Lant P (2013) The chemomechanical properties of microbial polyhydroxyalkanoates. Prog Polym Sci 38:536–583.
- Reddy CSK, Ghai R, Kalia V (2003) Polyhydroxyalkanoates: an overview. Bioresour Technol 87:137–146.
- Philip S, Keshavarz T, Roy I (2007) Polyhydroxyalkanoates: biodegradable polymers with a range of applications. Journal of chemical technology & biotechnology: International research in process, Environmental & clean technology 82:233–247. [CrossRef]
- Sudesh K, Abe H, Doi Y (2000) Synthesis, structure and properties of polyhydroxyalkanoates: biological polyesters. Prog Polym Sci 25:1503–1555. [CrossRef]
- Noda I, Green PR, Satkowski MM, Schechtman LA (2005) Preparation and properties of a novel class of polyhydroxyalkanoate copolymers. Biomacromolecules 6:580–586.
- Ma YiChao MY, Li Li LL, Wang YiFen WY (2018) Development of PLA-PHB-based biodegradable active packaging and its application to salmon.
- Larsson M, Markbo O, Jannasch P (2016) Melt processability and thermomechanical properties of blends based on polyhydroxyalkanoates and poly (butylene adipate-co-terephthalate). RSC Adv 6:44354–44363. [CrossRef]
- Höhnemann T, Windschiegl I (2023) Influence of rheological and morphological characteristics of polyhydroxybutyrate on its meltblown process behavior. Materials 16:6525. [CrossRef] [PubMed]
- Locati G (1976) A model for interpreting die swell of polymer melts. Rheol Acta 15:525–532.
- Yue-Jun L (2006) Elastic behavior analysis of polymer melt extruding through capillary with an additional sinusoidal vibration. Polymer Bulletin 56:599–606.
- Zhang C, Lan Q, Zhai T, Nie S, Luo J, Yan W (2018) Melt crystallization behavior and crystalline morphology of polylactide/poly (ε-caprolactone) blends compatibilized by lactide-caprolactone copolymer. Polymers (Basel) 10:1181. [CrossRef] [PubMed]
- Chan CH, Kummerlöwe C, Kammer H (2004) Crystallization and melting behavior of poly (3-hydroxybutyrate)-based blends. Macromol Chem Phys 205:664–675.
- Yousefi AM, Wnek GE (2024) Poly (hydroxyalkanoates): emerging biopolymers in Biomedical Fields and Packaging Industries for a Circular Economy. Biomedical Materials & Devices 1–26. [CrossRef]
- Chen Q, Liang S, Thouas GA (2013) Elastomeric biomaterials for tissue engineering. Prog Polym Sci 38:584–671.
- Kim J, Gupta NS, Bezek LB, Linn J, Bejagam KK, Banerjee S, Dumont JH, Nam SY, Kang HW, Park CH (2023) Biodegradation studies of polyhydroxybutyrate and polyhydroxybutyrate-co-polyhydroxyvalerate films in soil. Int J Mol Sci 24:7638.
- Volova TG, Prudnikova S V, Vinogradova ON, Syrvacheva DA, Shishatskaya EI (2017) Microbial degradation of polyhydroxyalkanoates with different chemical compositions and their biodegradability. Microb Ecol 73:353–367.
- Nemet F, Perić K, Lončarić Z (2021) Microbiological activities in the composting process–A review. COLUMELLA–Journal of Agricultural and Environmental Sciences 8:41–53.
- Galitskaya P, Biktasheva L, Saveliev A, Grigoryeva T, Boulygina E, Selivanovskaya S (2017) Fungal and bacterial successions in the process of co-composting of organic wastes as revealed by 454 pyrosequencing. PLoS One 12:e0186051. [CrossRef] [PubMed]
Figure 1.
Temperature tower for optimal 3D printing temperature determination –Slicer designed model for 3D printing.
Figure 1.
Temperature tower for optimal 3D printing temperature determination –Slicer designed model for 3D printing.
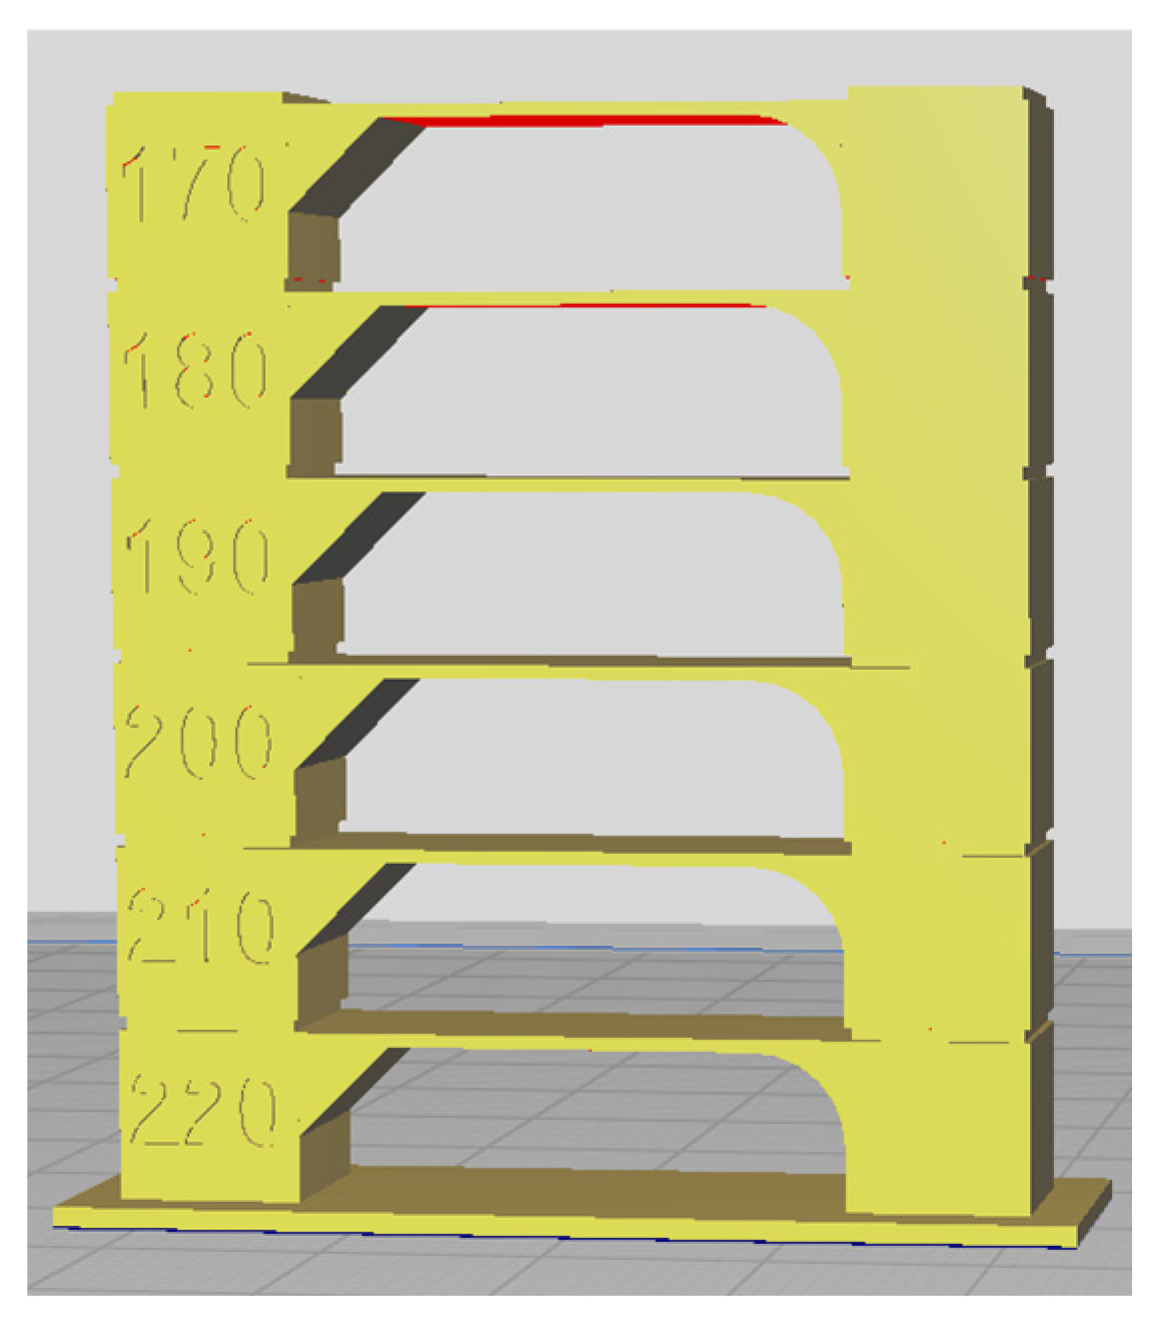
Figure 2.
Triangular prism for warping test A – Slicer model for 3D printing.
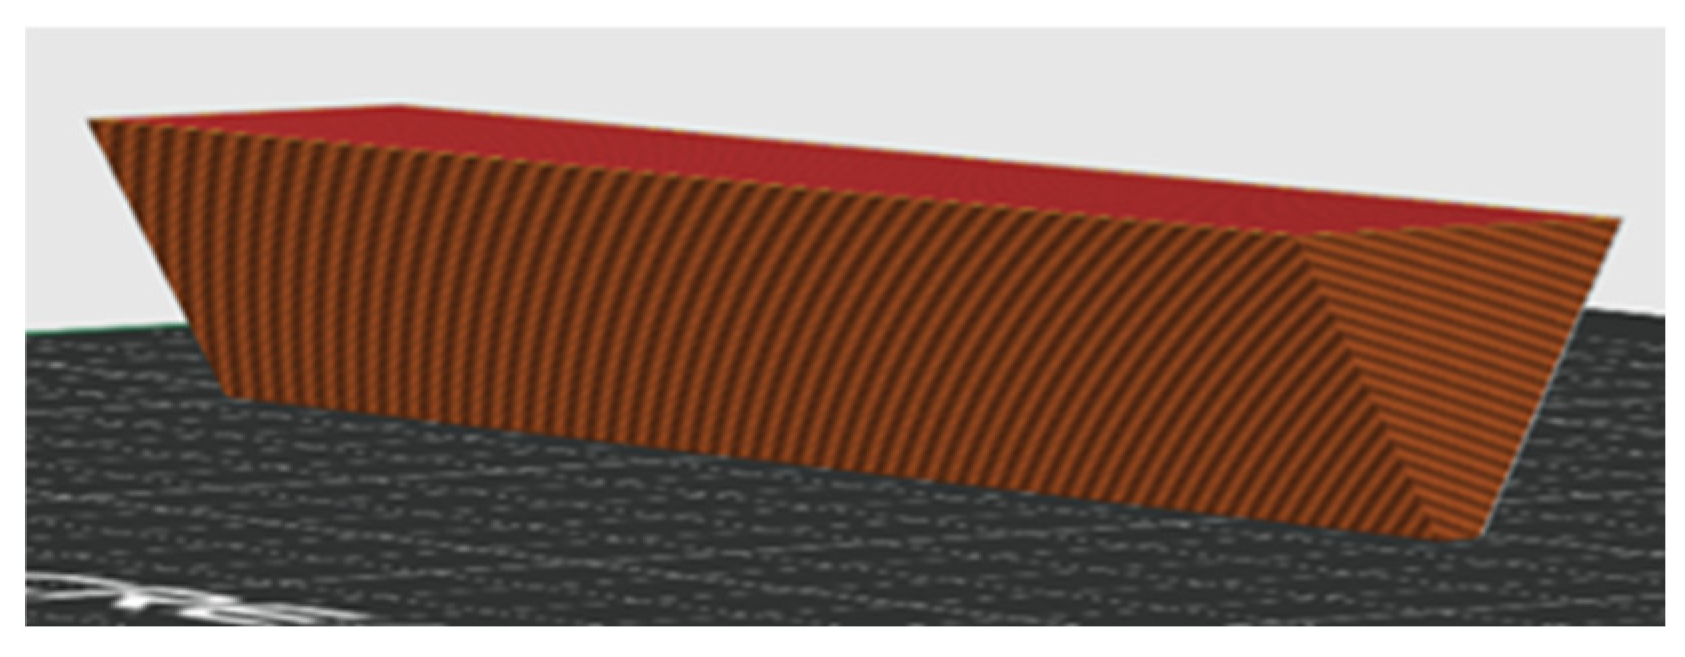
Figure 3.
a) Slicer models of 3D-printed samples in square and rectangular shape from a) top view and b) side view ( to show increase in thickness ), and c,d and e) conditions for composting test according to experiment arrangement.
Figure 3.
a) Slicer models of 3D-printed samples in square and rectangular shape from a) top view and b) side view ( to show increase in thickness ), and c,d and e) conditions for composting test according to experiment arrangement.
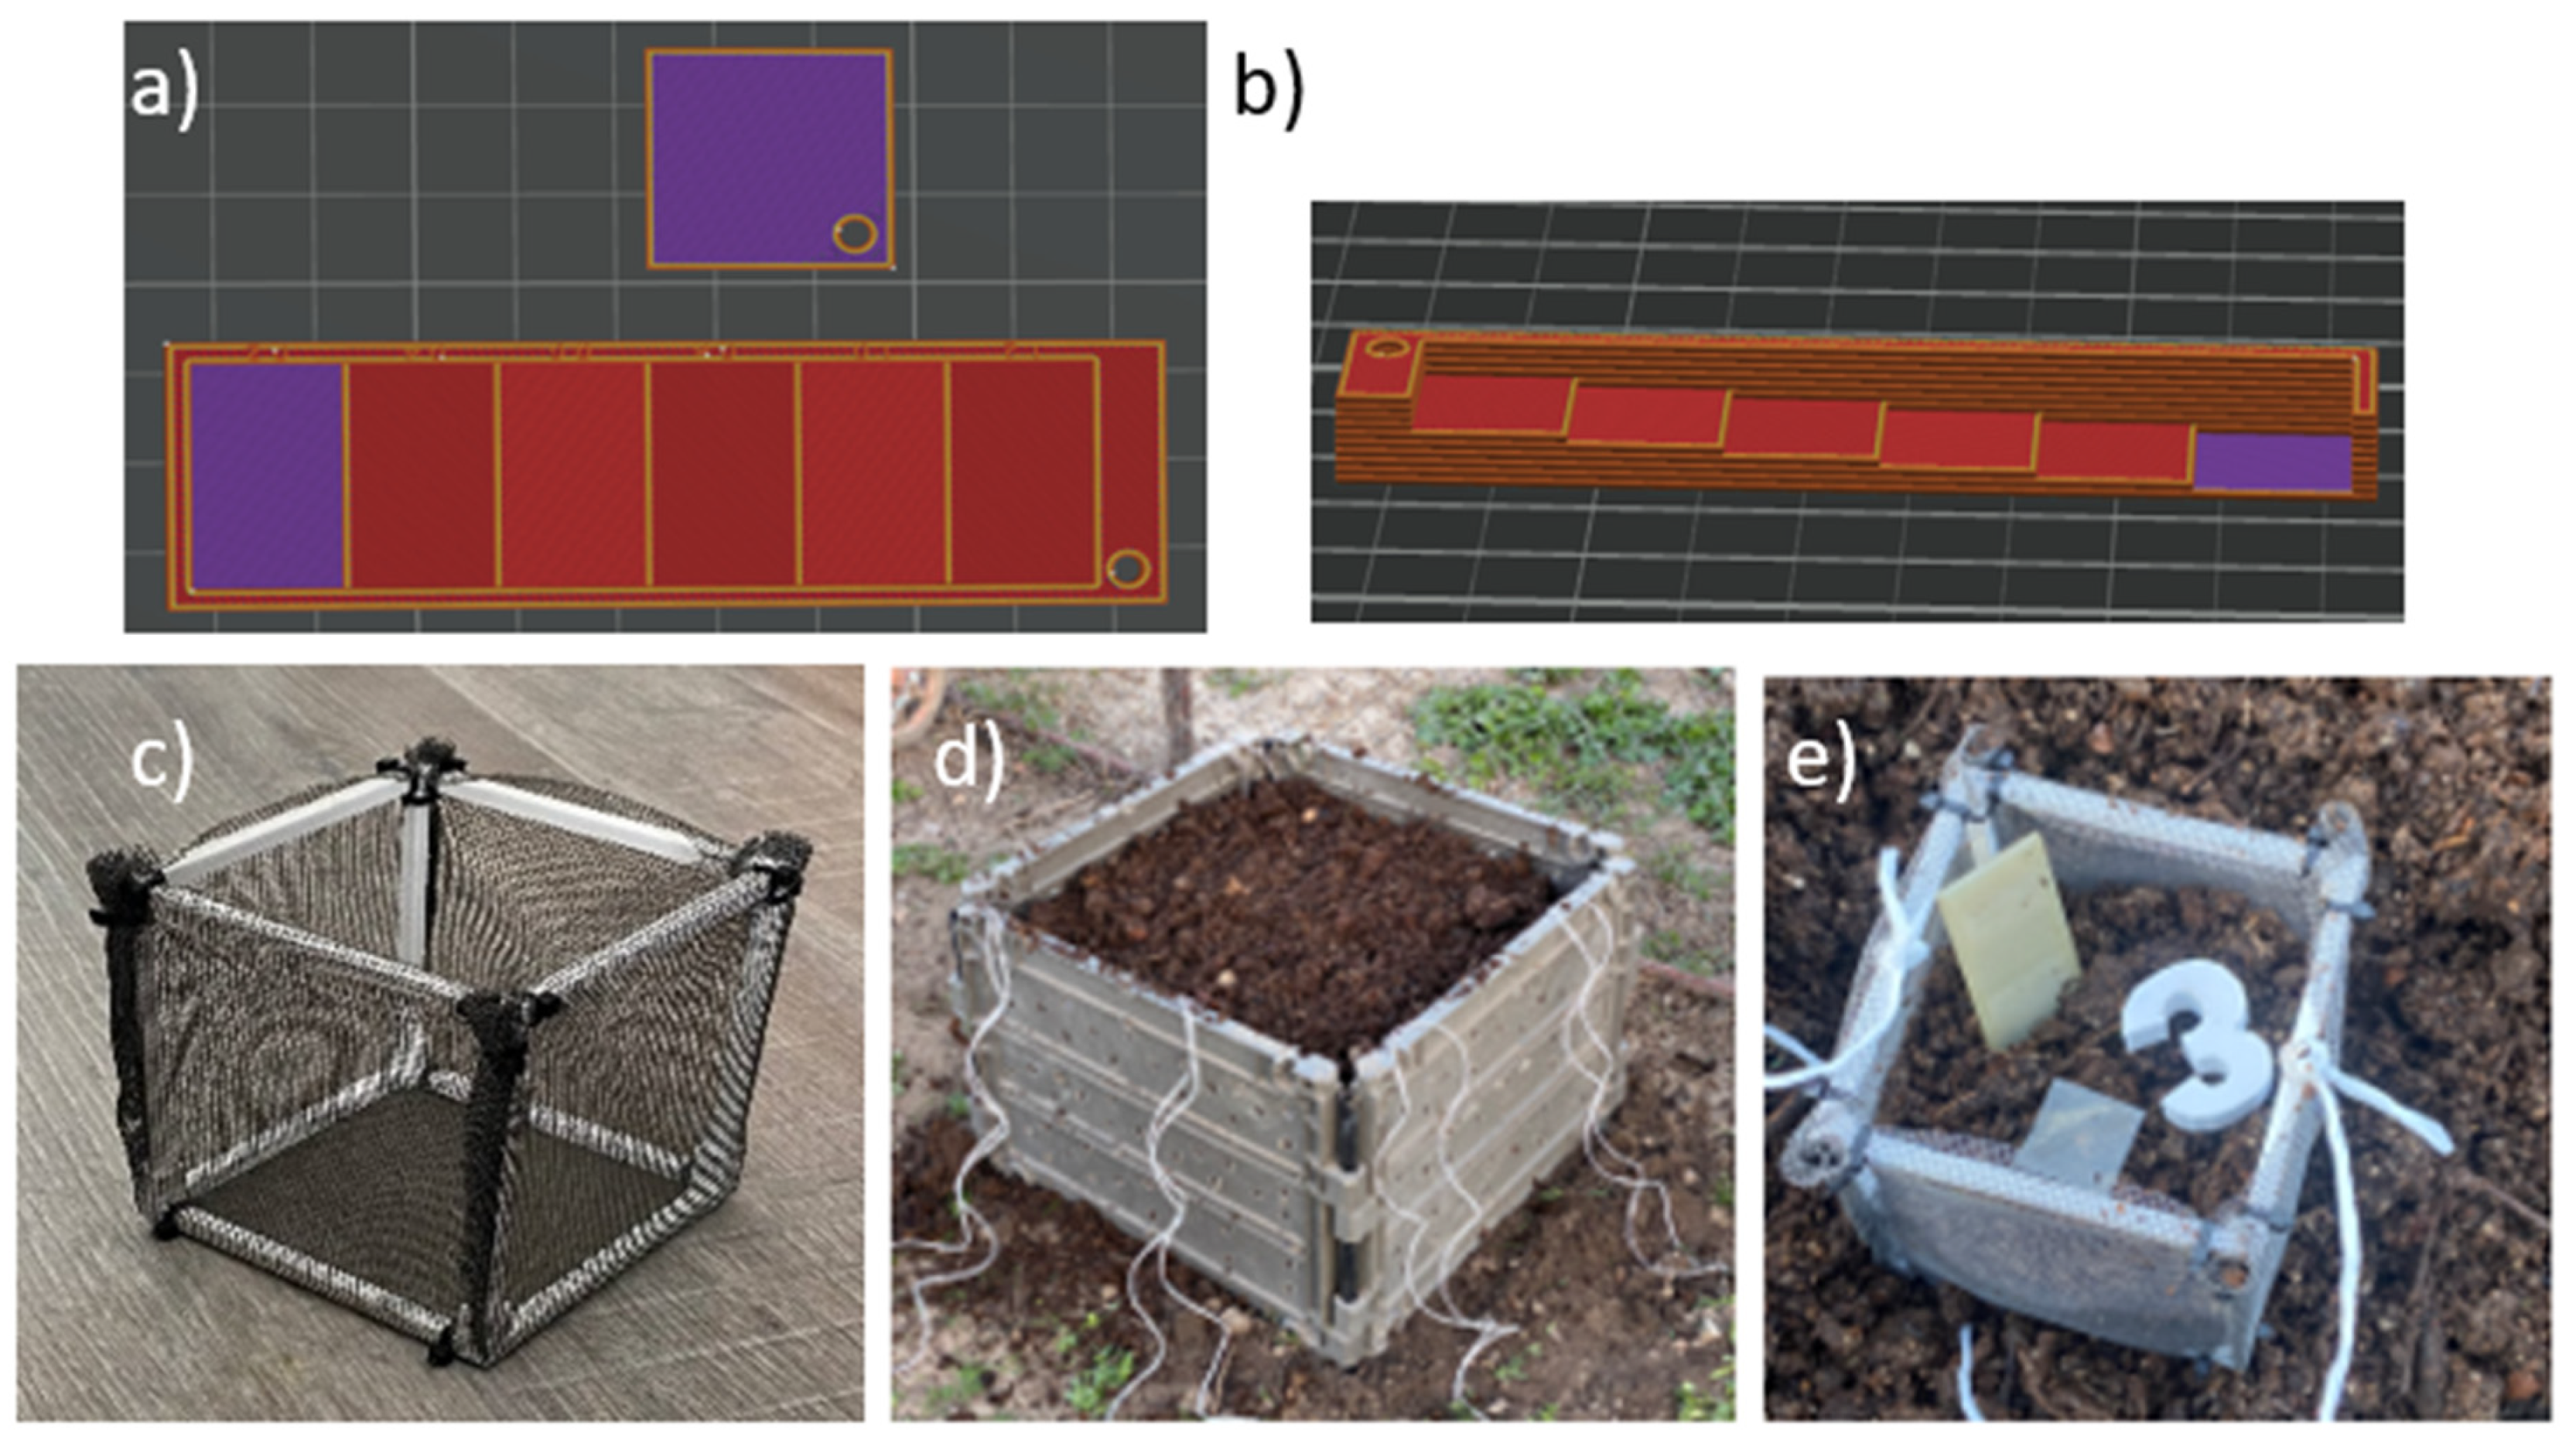
Figure 4.
Typical flow curves of prepared blends expressed as dependency of a) complex viscosity, b) plastic part of viscosity c) elastic part of viscosity at 160°C for PLA, B5 and B7 blends.
Figure 4.
Typical flow curves of prepared blends expressed as dependency of a) complex viscosity, b) plastic part of viscosity c) elastic part of viscosity at 160°C for PLA, B5 and B7 blends.
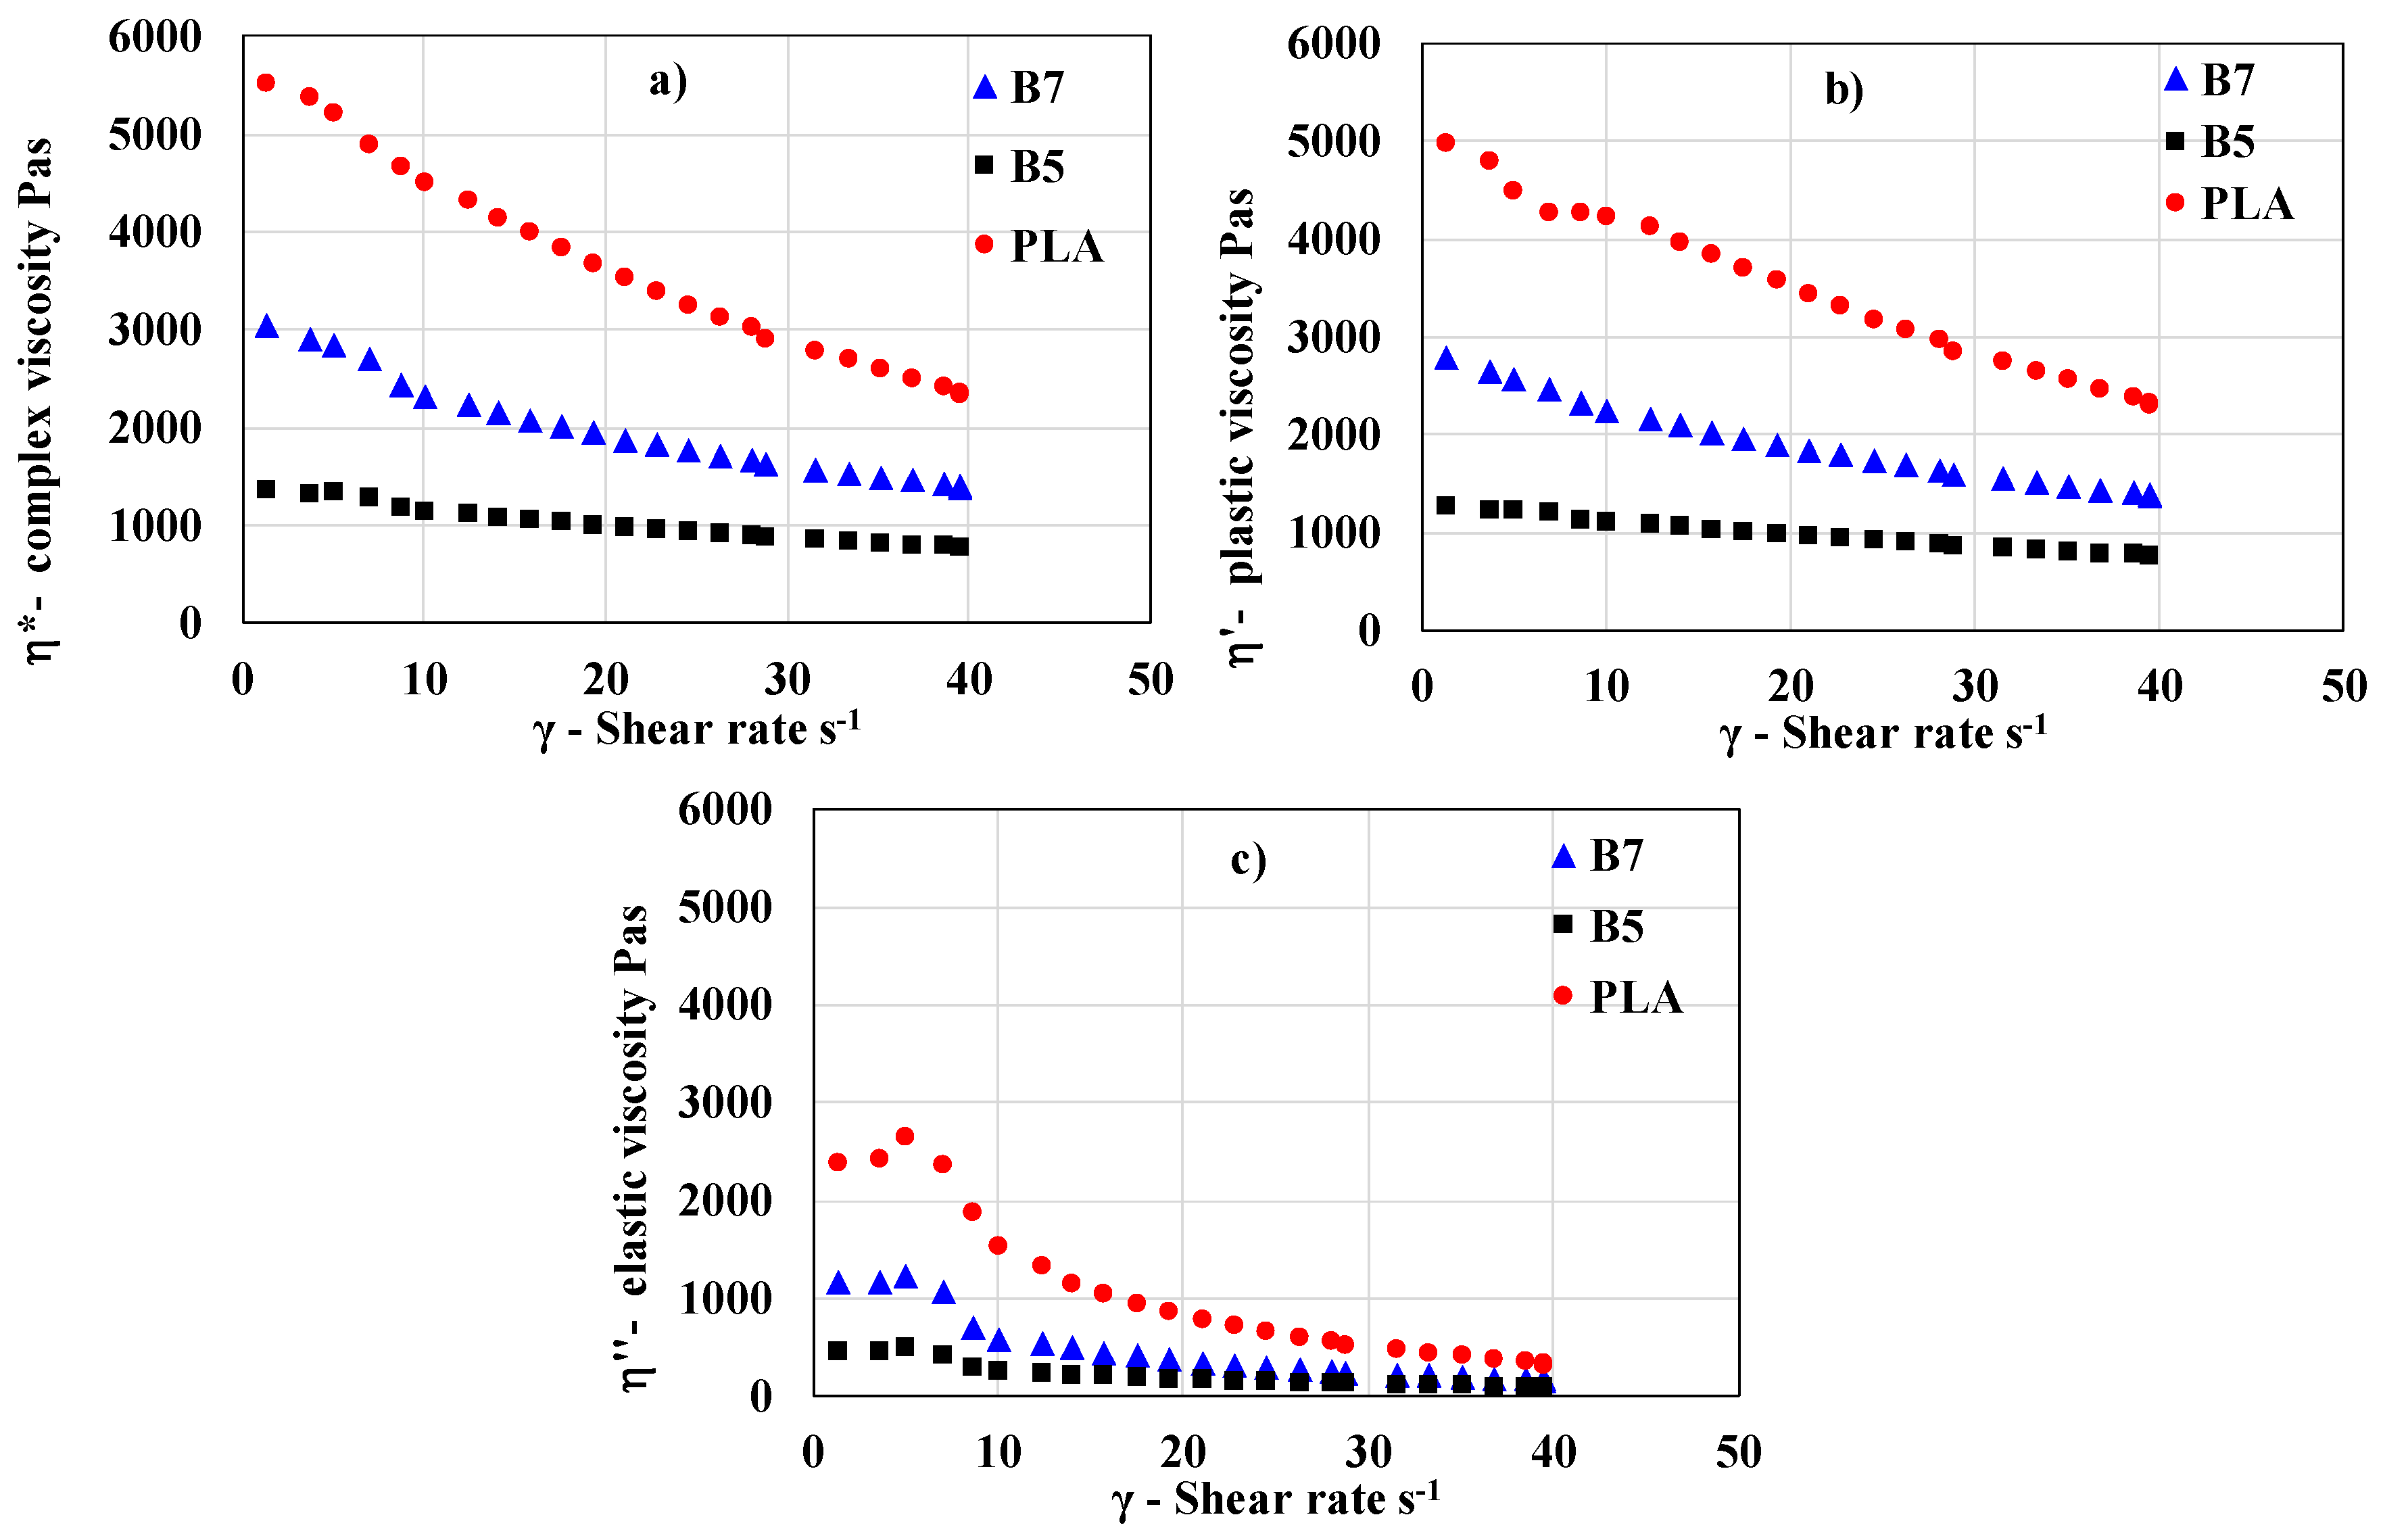
Figure 5.
Response surfaces for a) complex, b) elastic and c) plastic viscosity evaluated for shear rate 15 s-1 and temperature 160°C. Dashed plane represent value for PLA.
Figure 5.
Response surfaces for a) complex, b) elastic and c) plastic viscosity evaluated for shear rate 15 s-1 and temperature 160°C. Dashed plane represent value for PLA.
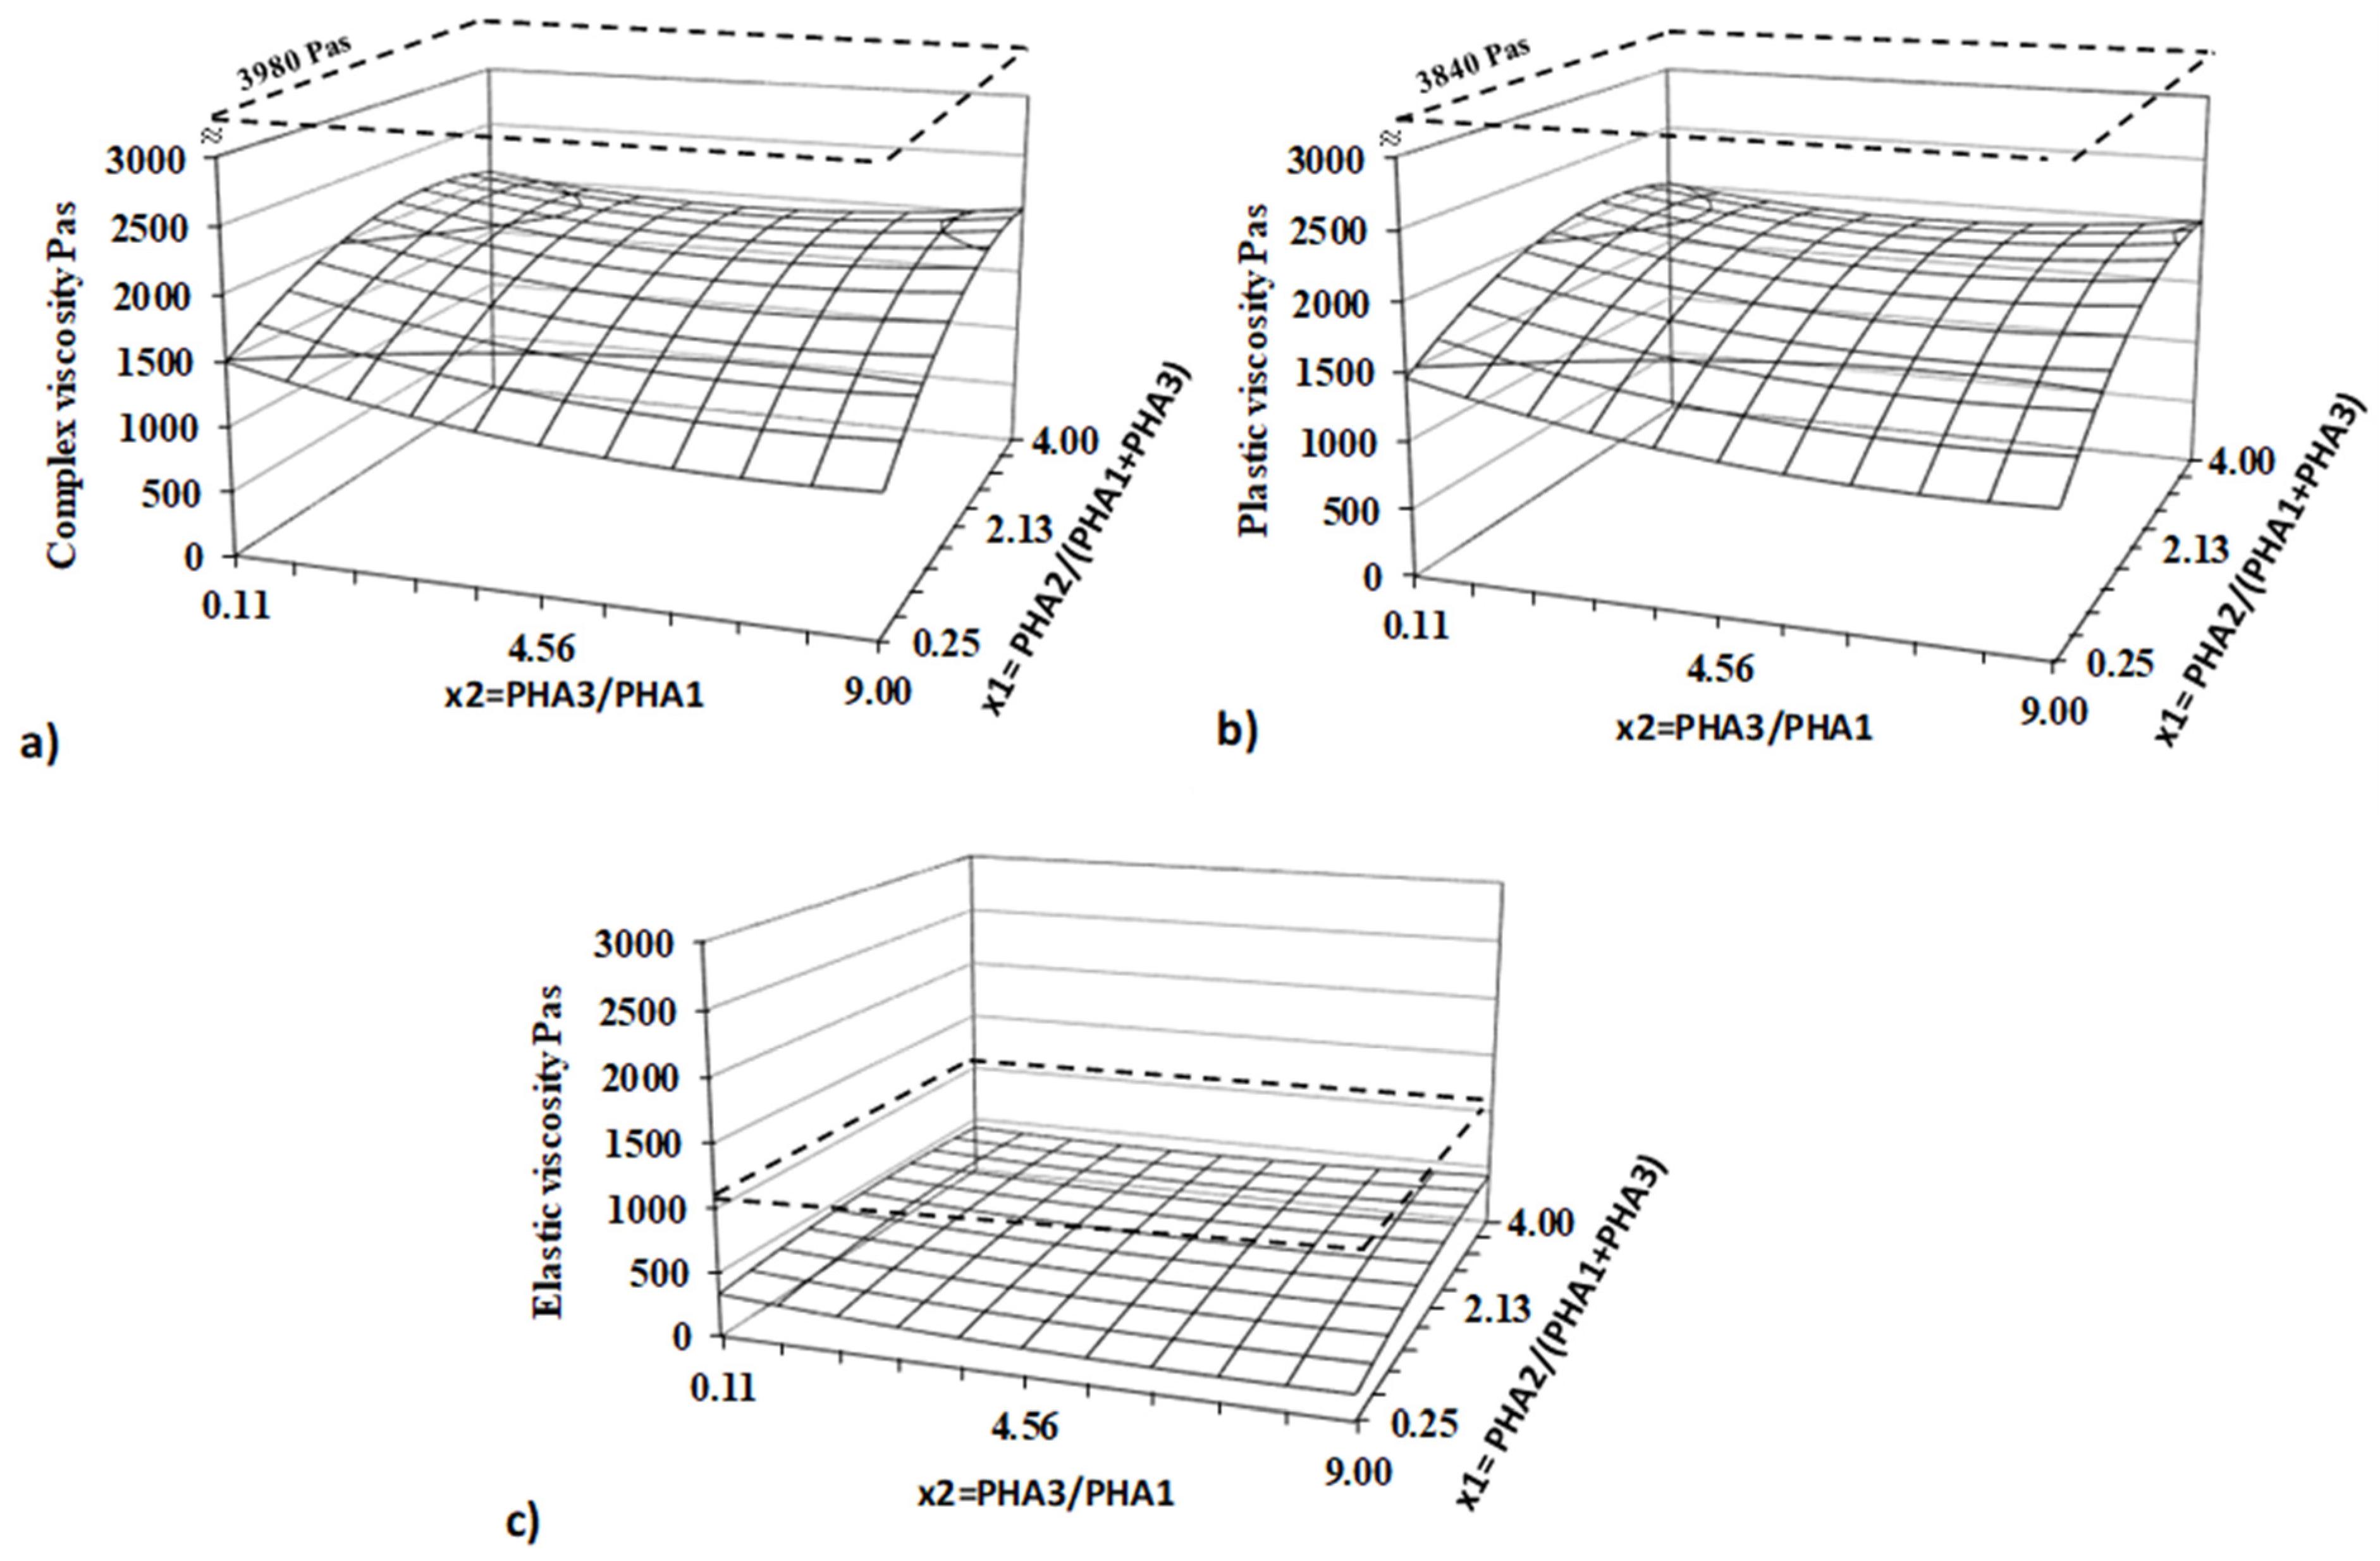
Figure 6.
Typical DSC record of PHA blends.
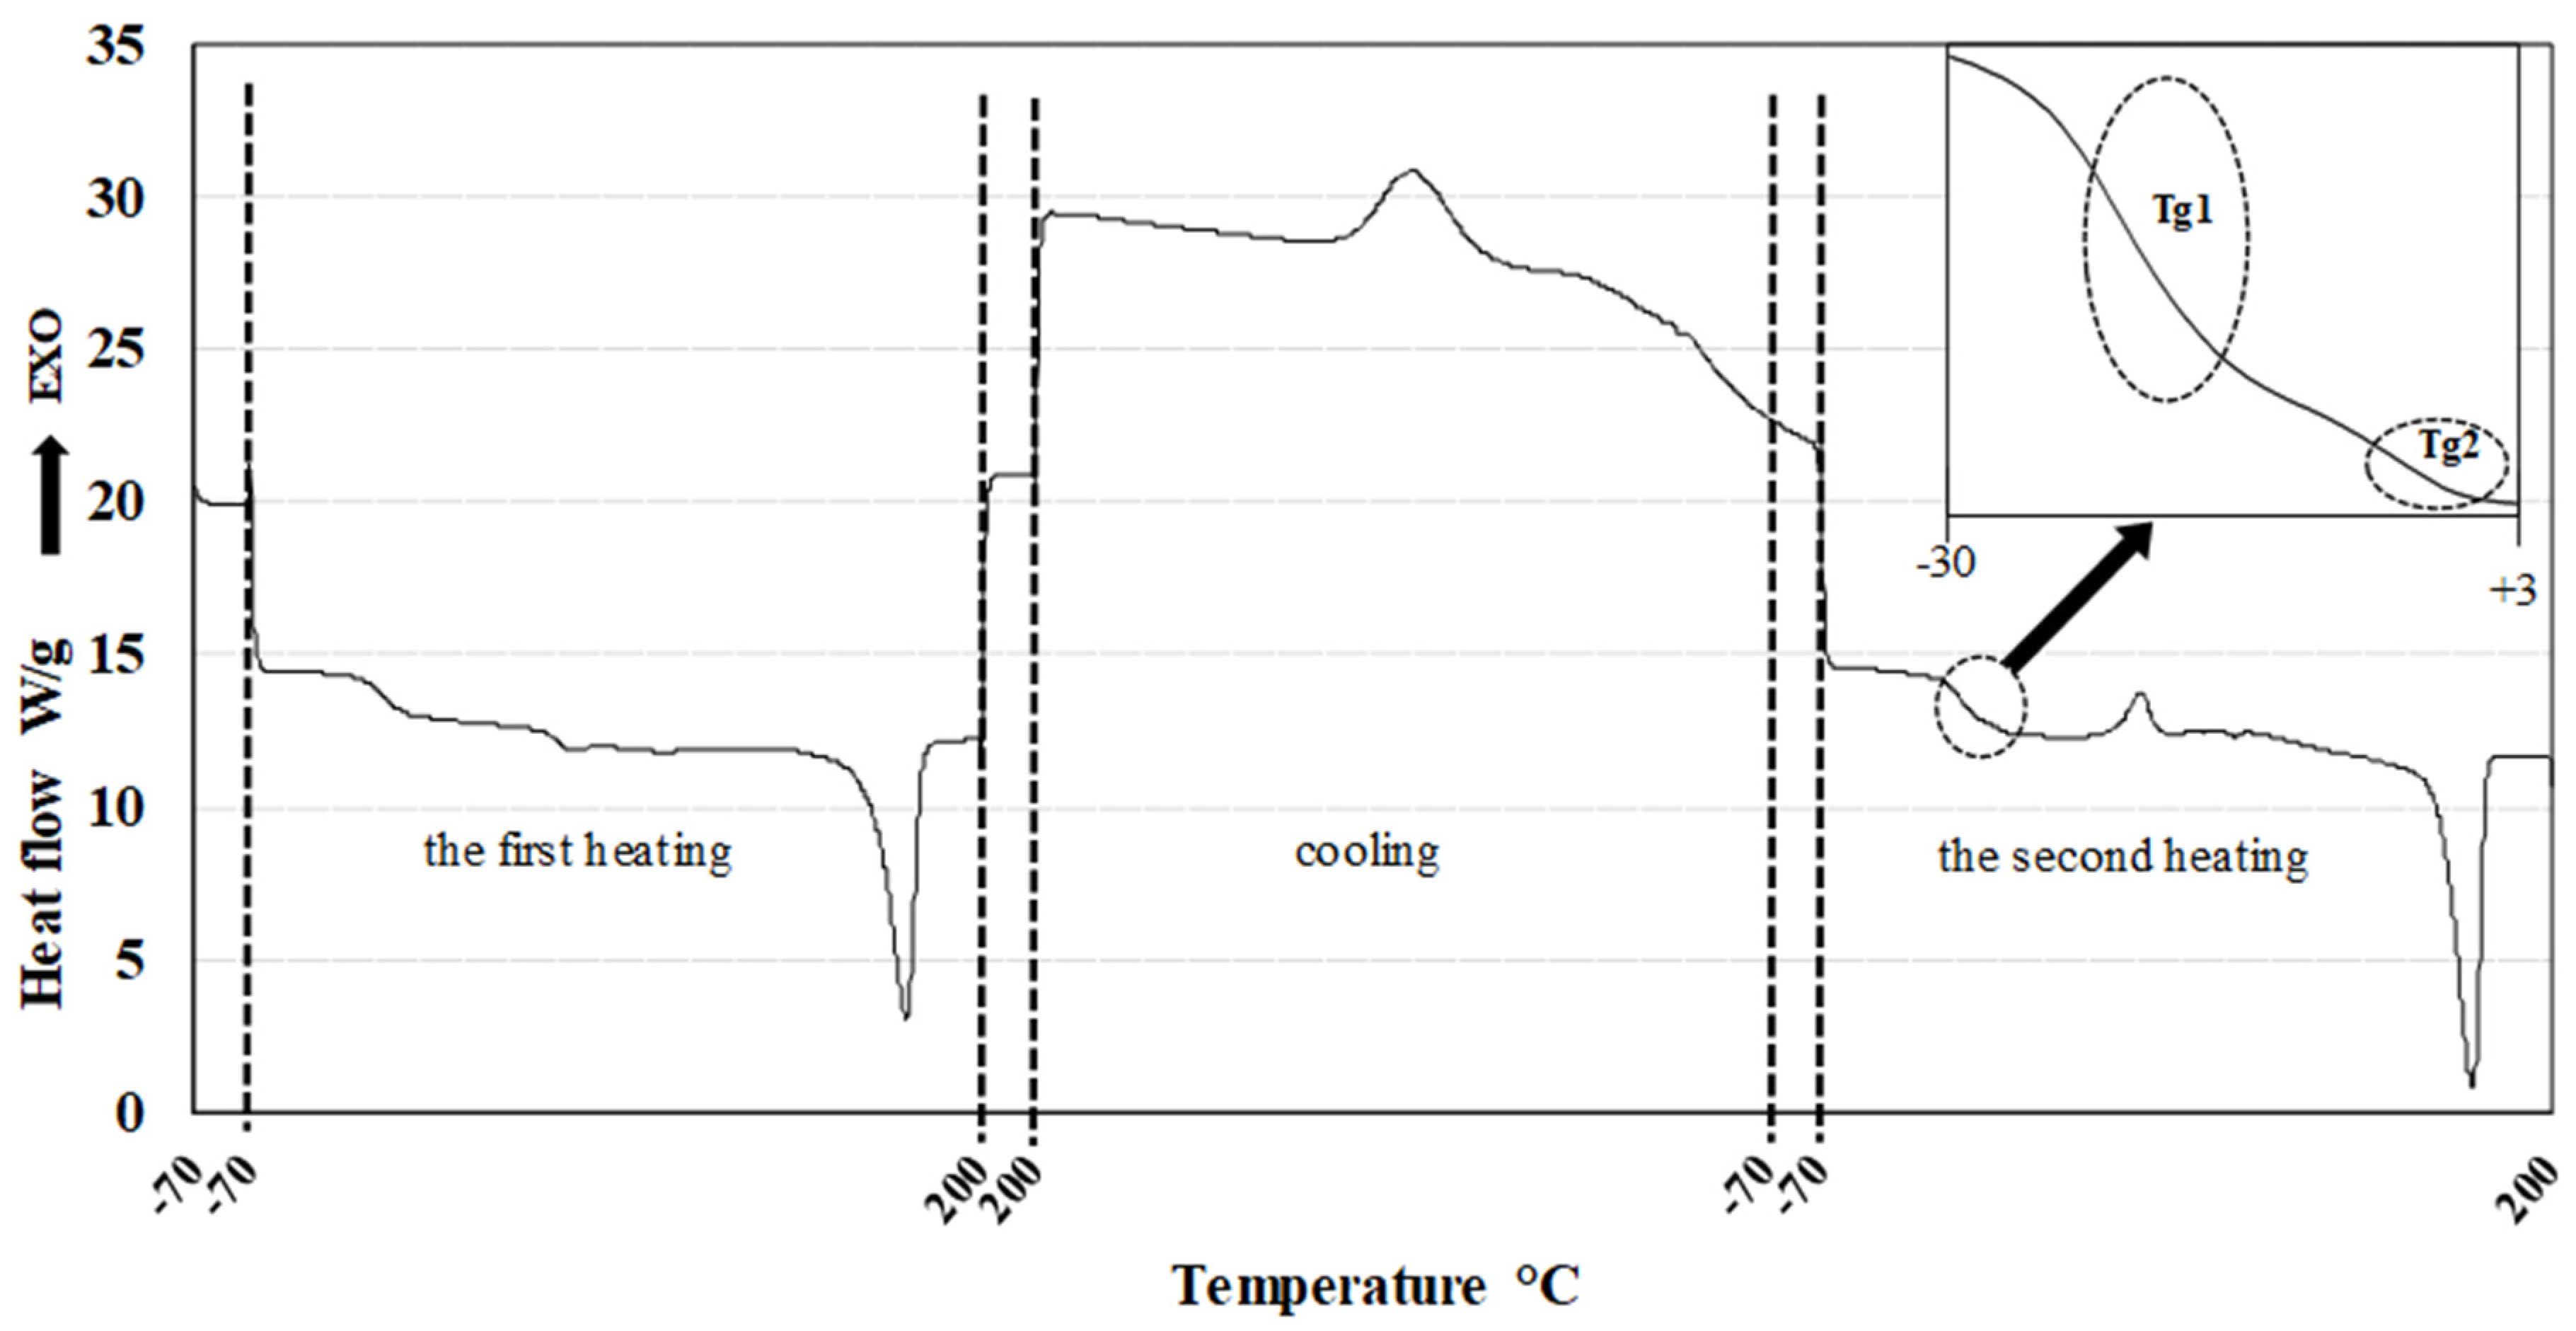
Figure 7.
Response surfaces for thermal properties and crystallinity – a) lower Tg 1 b) higher Tg c) melting temperature d) crystallinity Dashed line represents value for PHA2, dotted lines for PLA.Regression and statistical analysis of the Tg values further confirm strong physical interactions between PHA polymers in the blend. A significant nonlinear deviation from the original Tg of PHA₂ (-14.9°C) is observed for Tg₁, which originally belongs to PHA₂. Additionally, the two Tg values corresponding to PHA₁ (+5.1°C) and PHA₃ (+2.4°C) disappear from the DSC curves, replaced by a single Tg₂, which does not exceed 0°C.
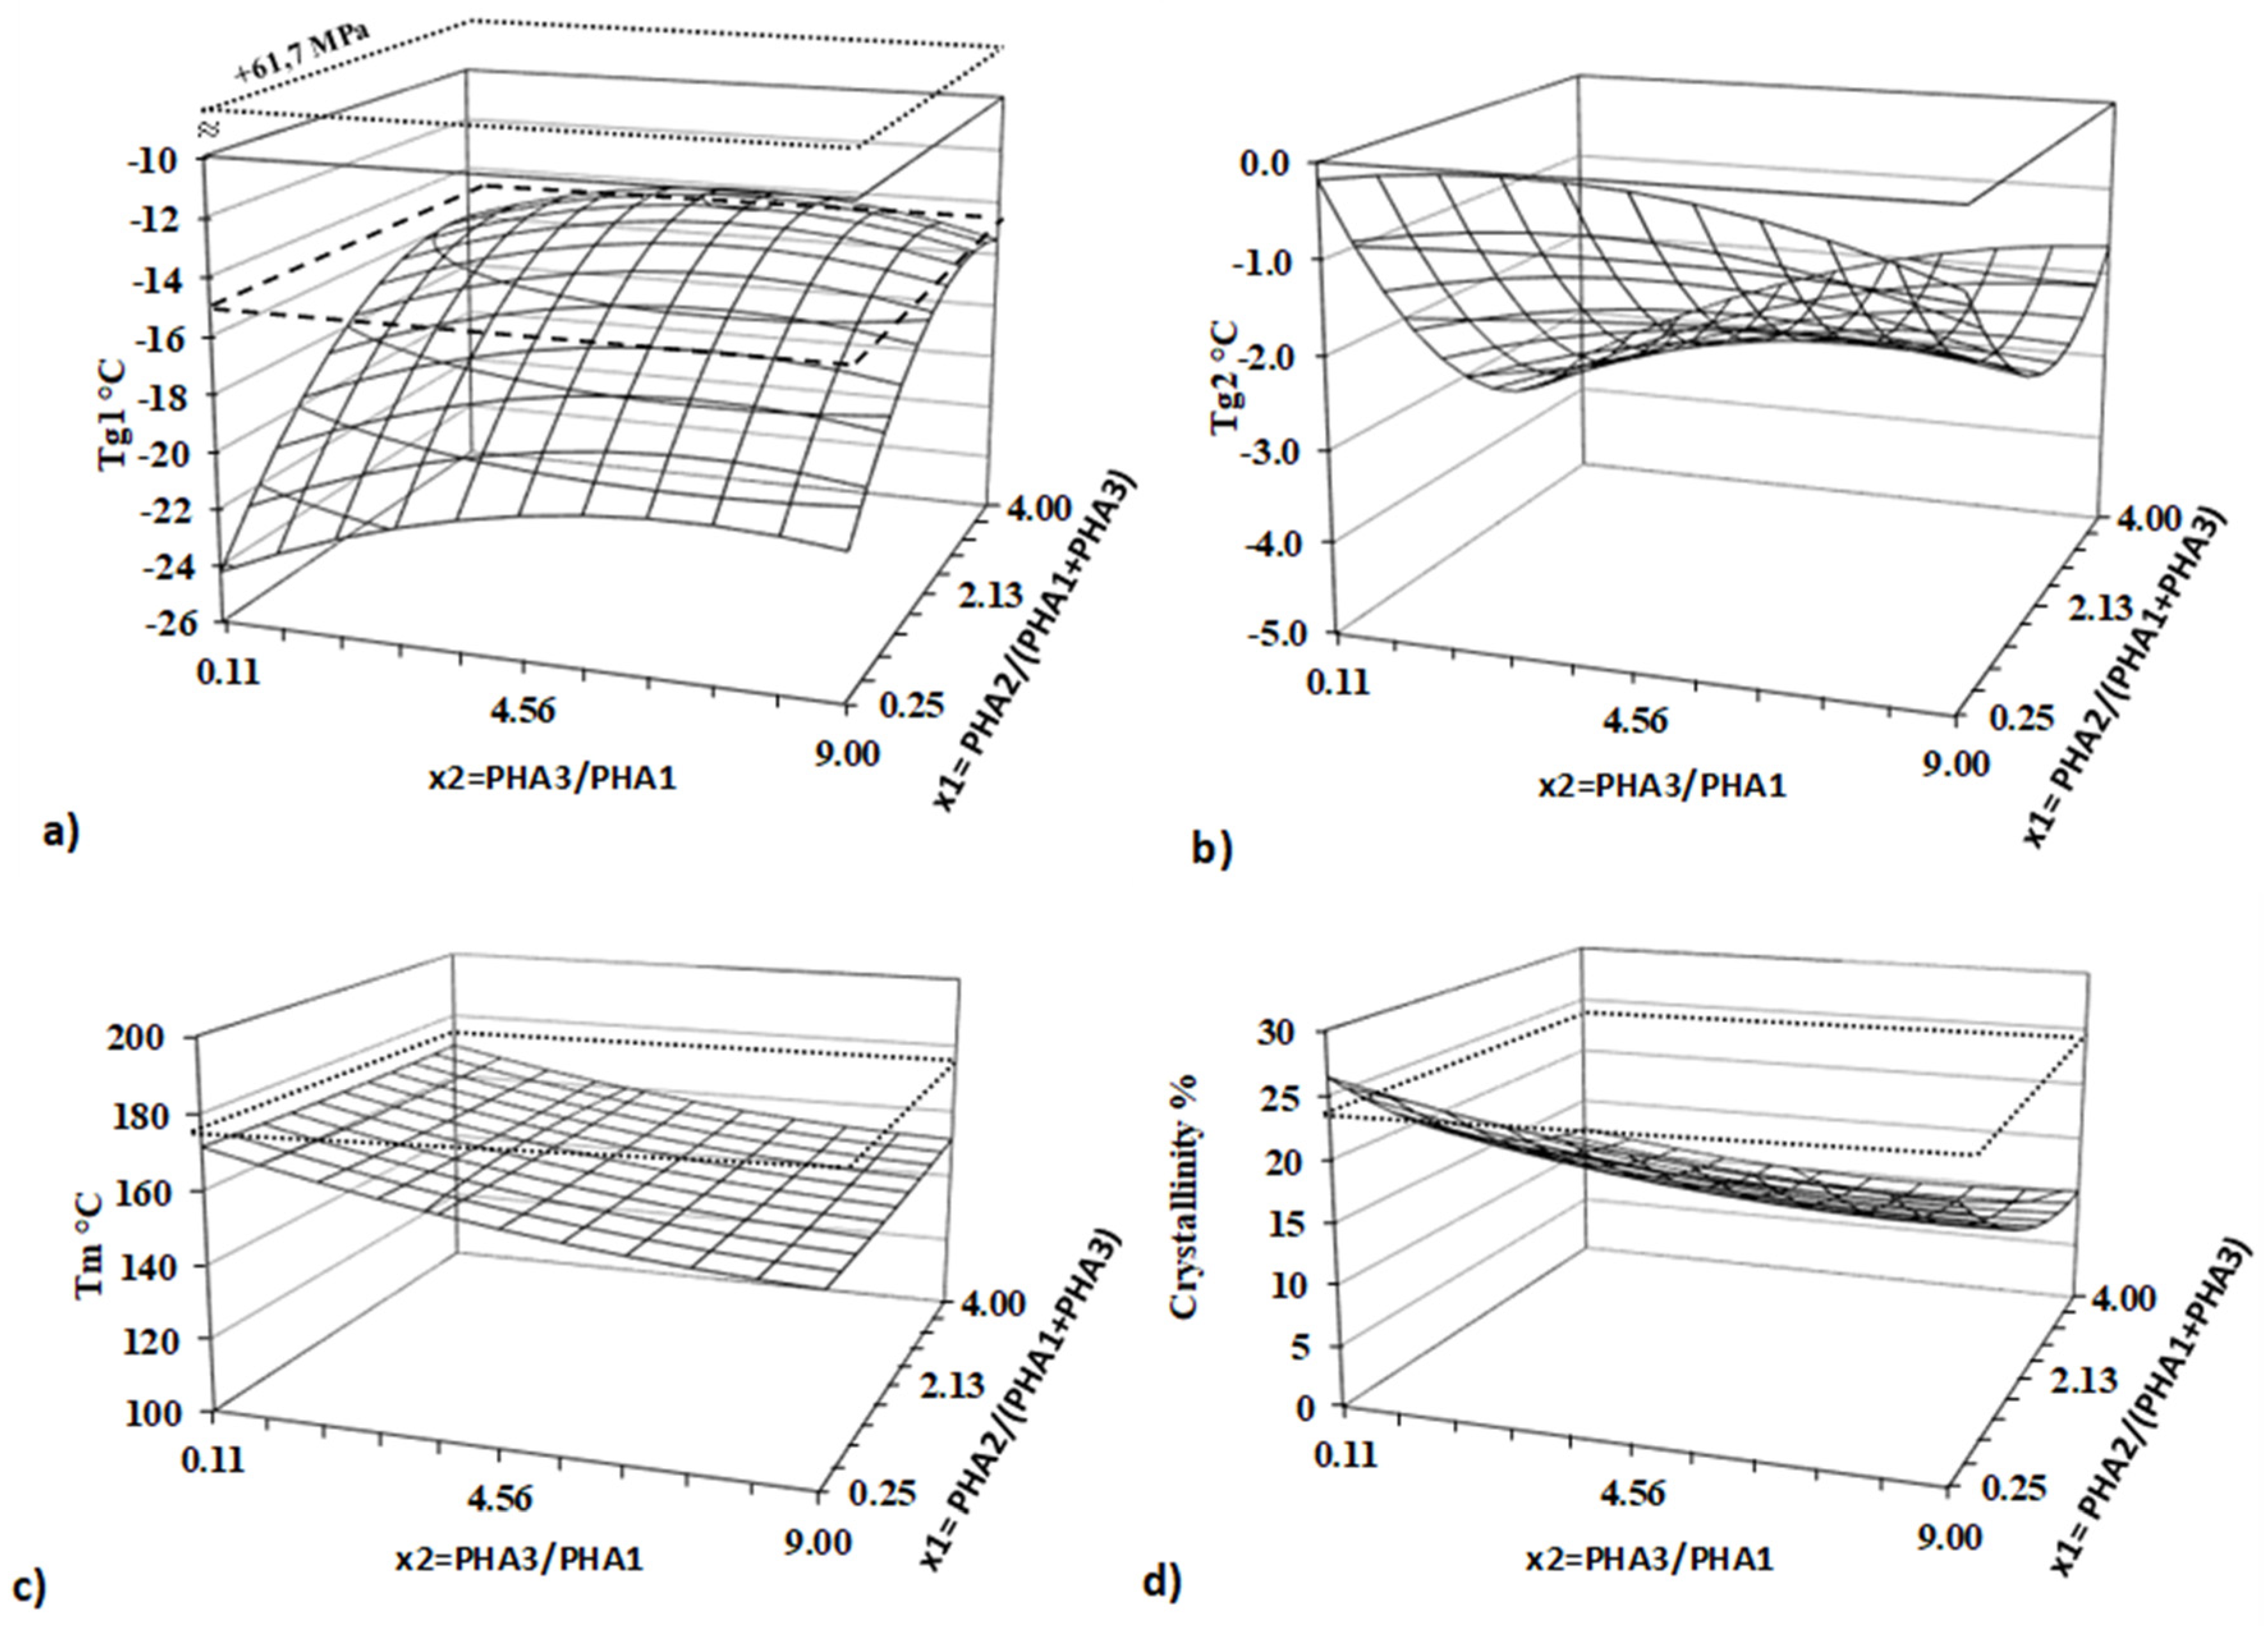
Figure 8.
3D printed temperature tower for the sample B8 in temperature range from 170 °C to 220 °C.
Figure 8.
3D printed temperature tower for the sample B8 in temperature range from 170 °C to 220 °C.
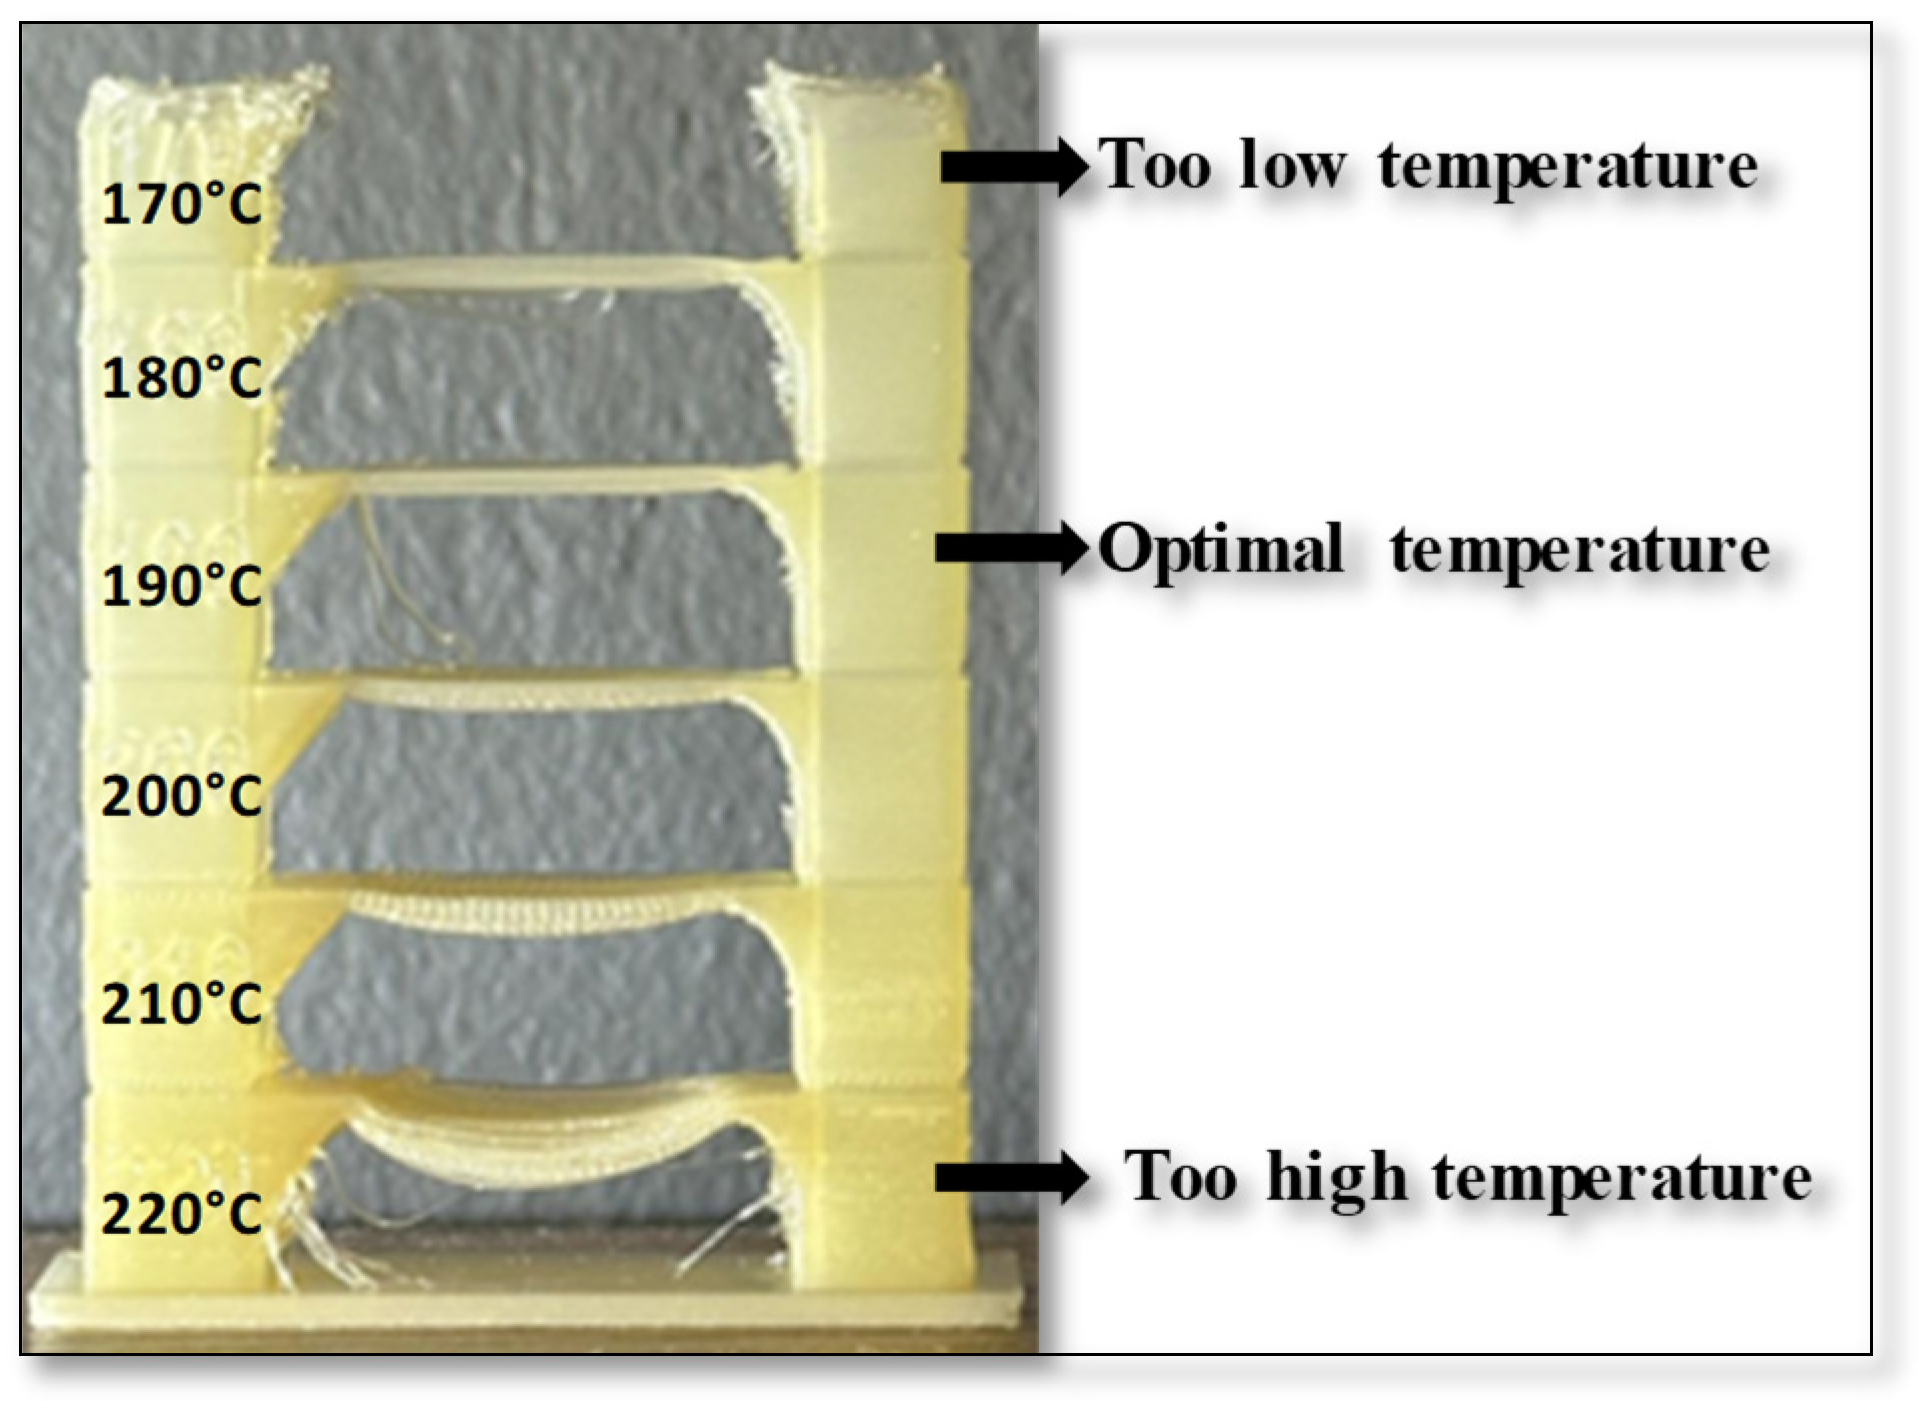
Figure 9.
Dependency of warping effect expressed as number layer when detachment from bed appears on crystallinity. Value 43 of warping layer number indicate no warping effect.
Figure 9.
Dependency of warping effect expressed as number layer when detachment from bed appears on crystallinity. Value 43 of warping layer number indicate no warping effect.
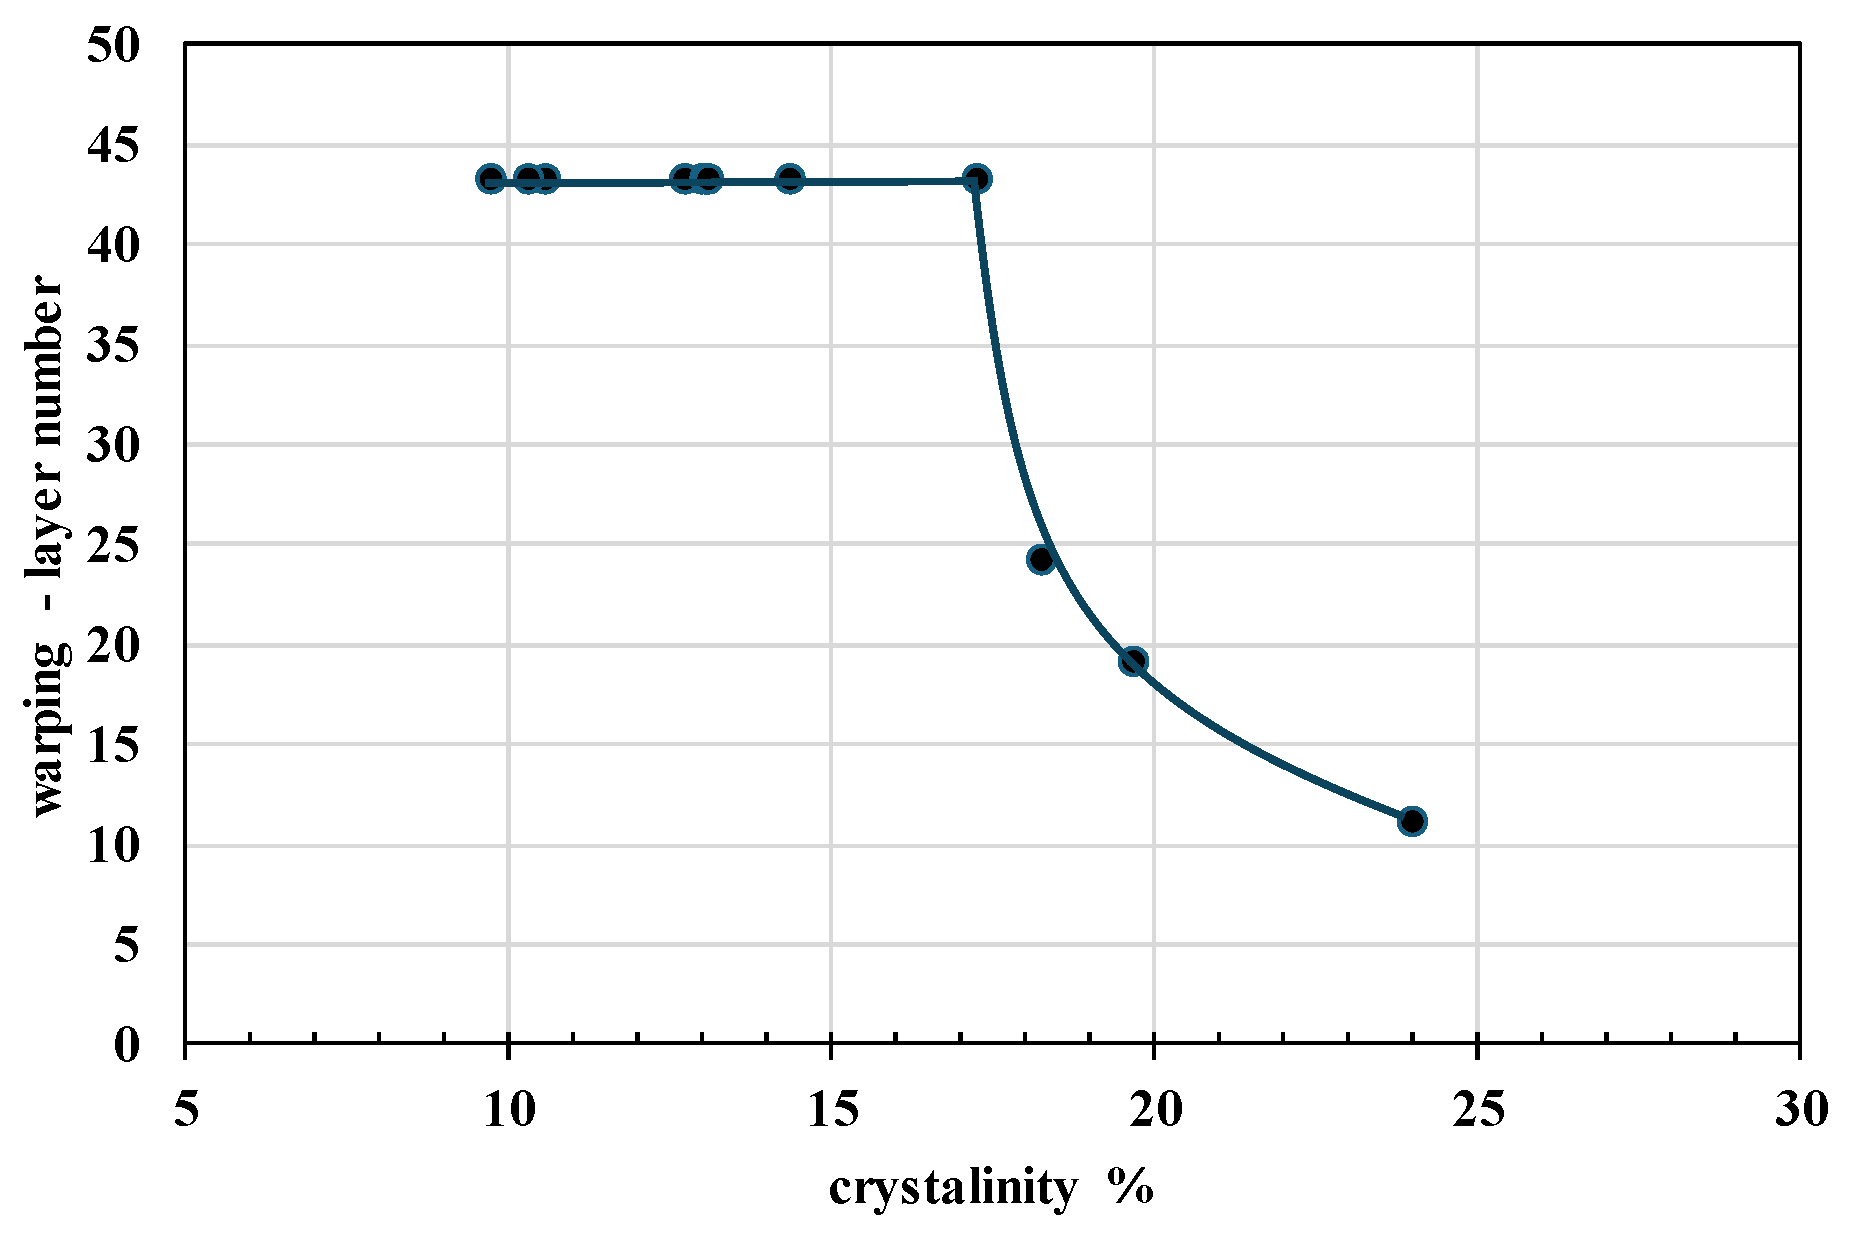
Figure 10.
Typical structure of FDM 3D printed a) PHA-based blends (for sample B8) and b) PLA sample in rectangular stair-shaped design.
Figure 10.
Typical structure of FDM 3D printed a) PHA-based blends (for sample B8) and b) PLA sample in rectangular stair-shaped design.
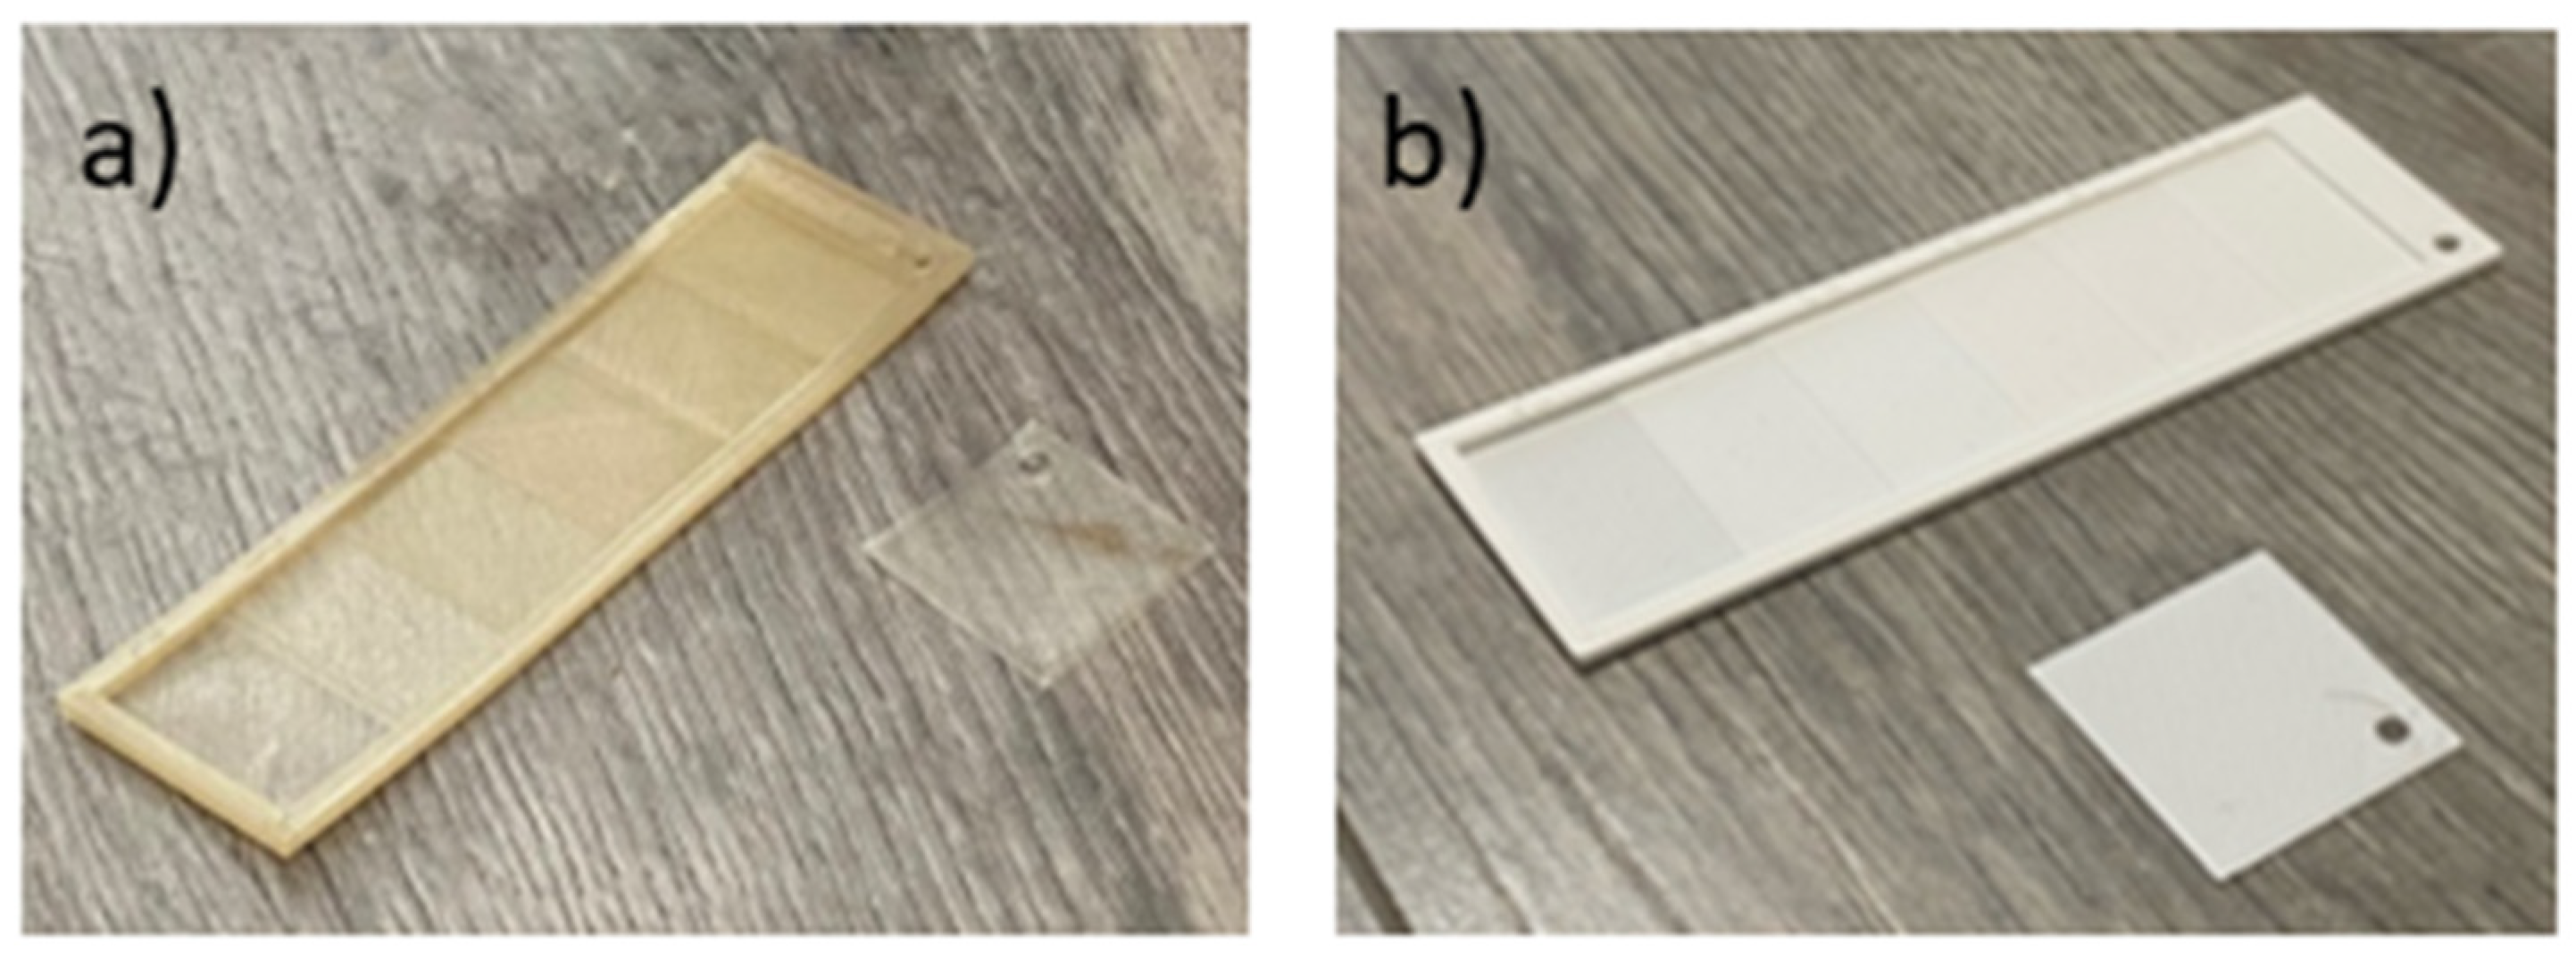
Figure 11.
Response surfaces for tensile properties measured on 3D filaments (left side) a) young modulus, c) yield strength, e) tensile strength at break, g) elongation at break and on 3D printed specimens (right side) b) young modulus, d) yield strength, f) tensile strength at break. Dashed lines represent values for PLA.
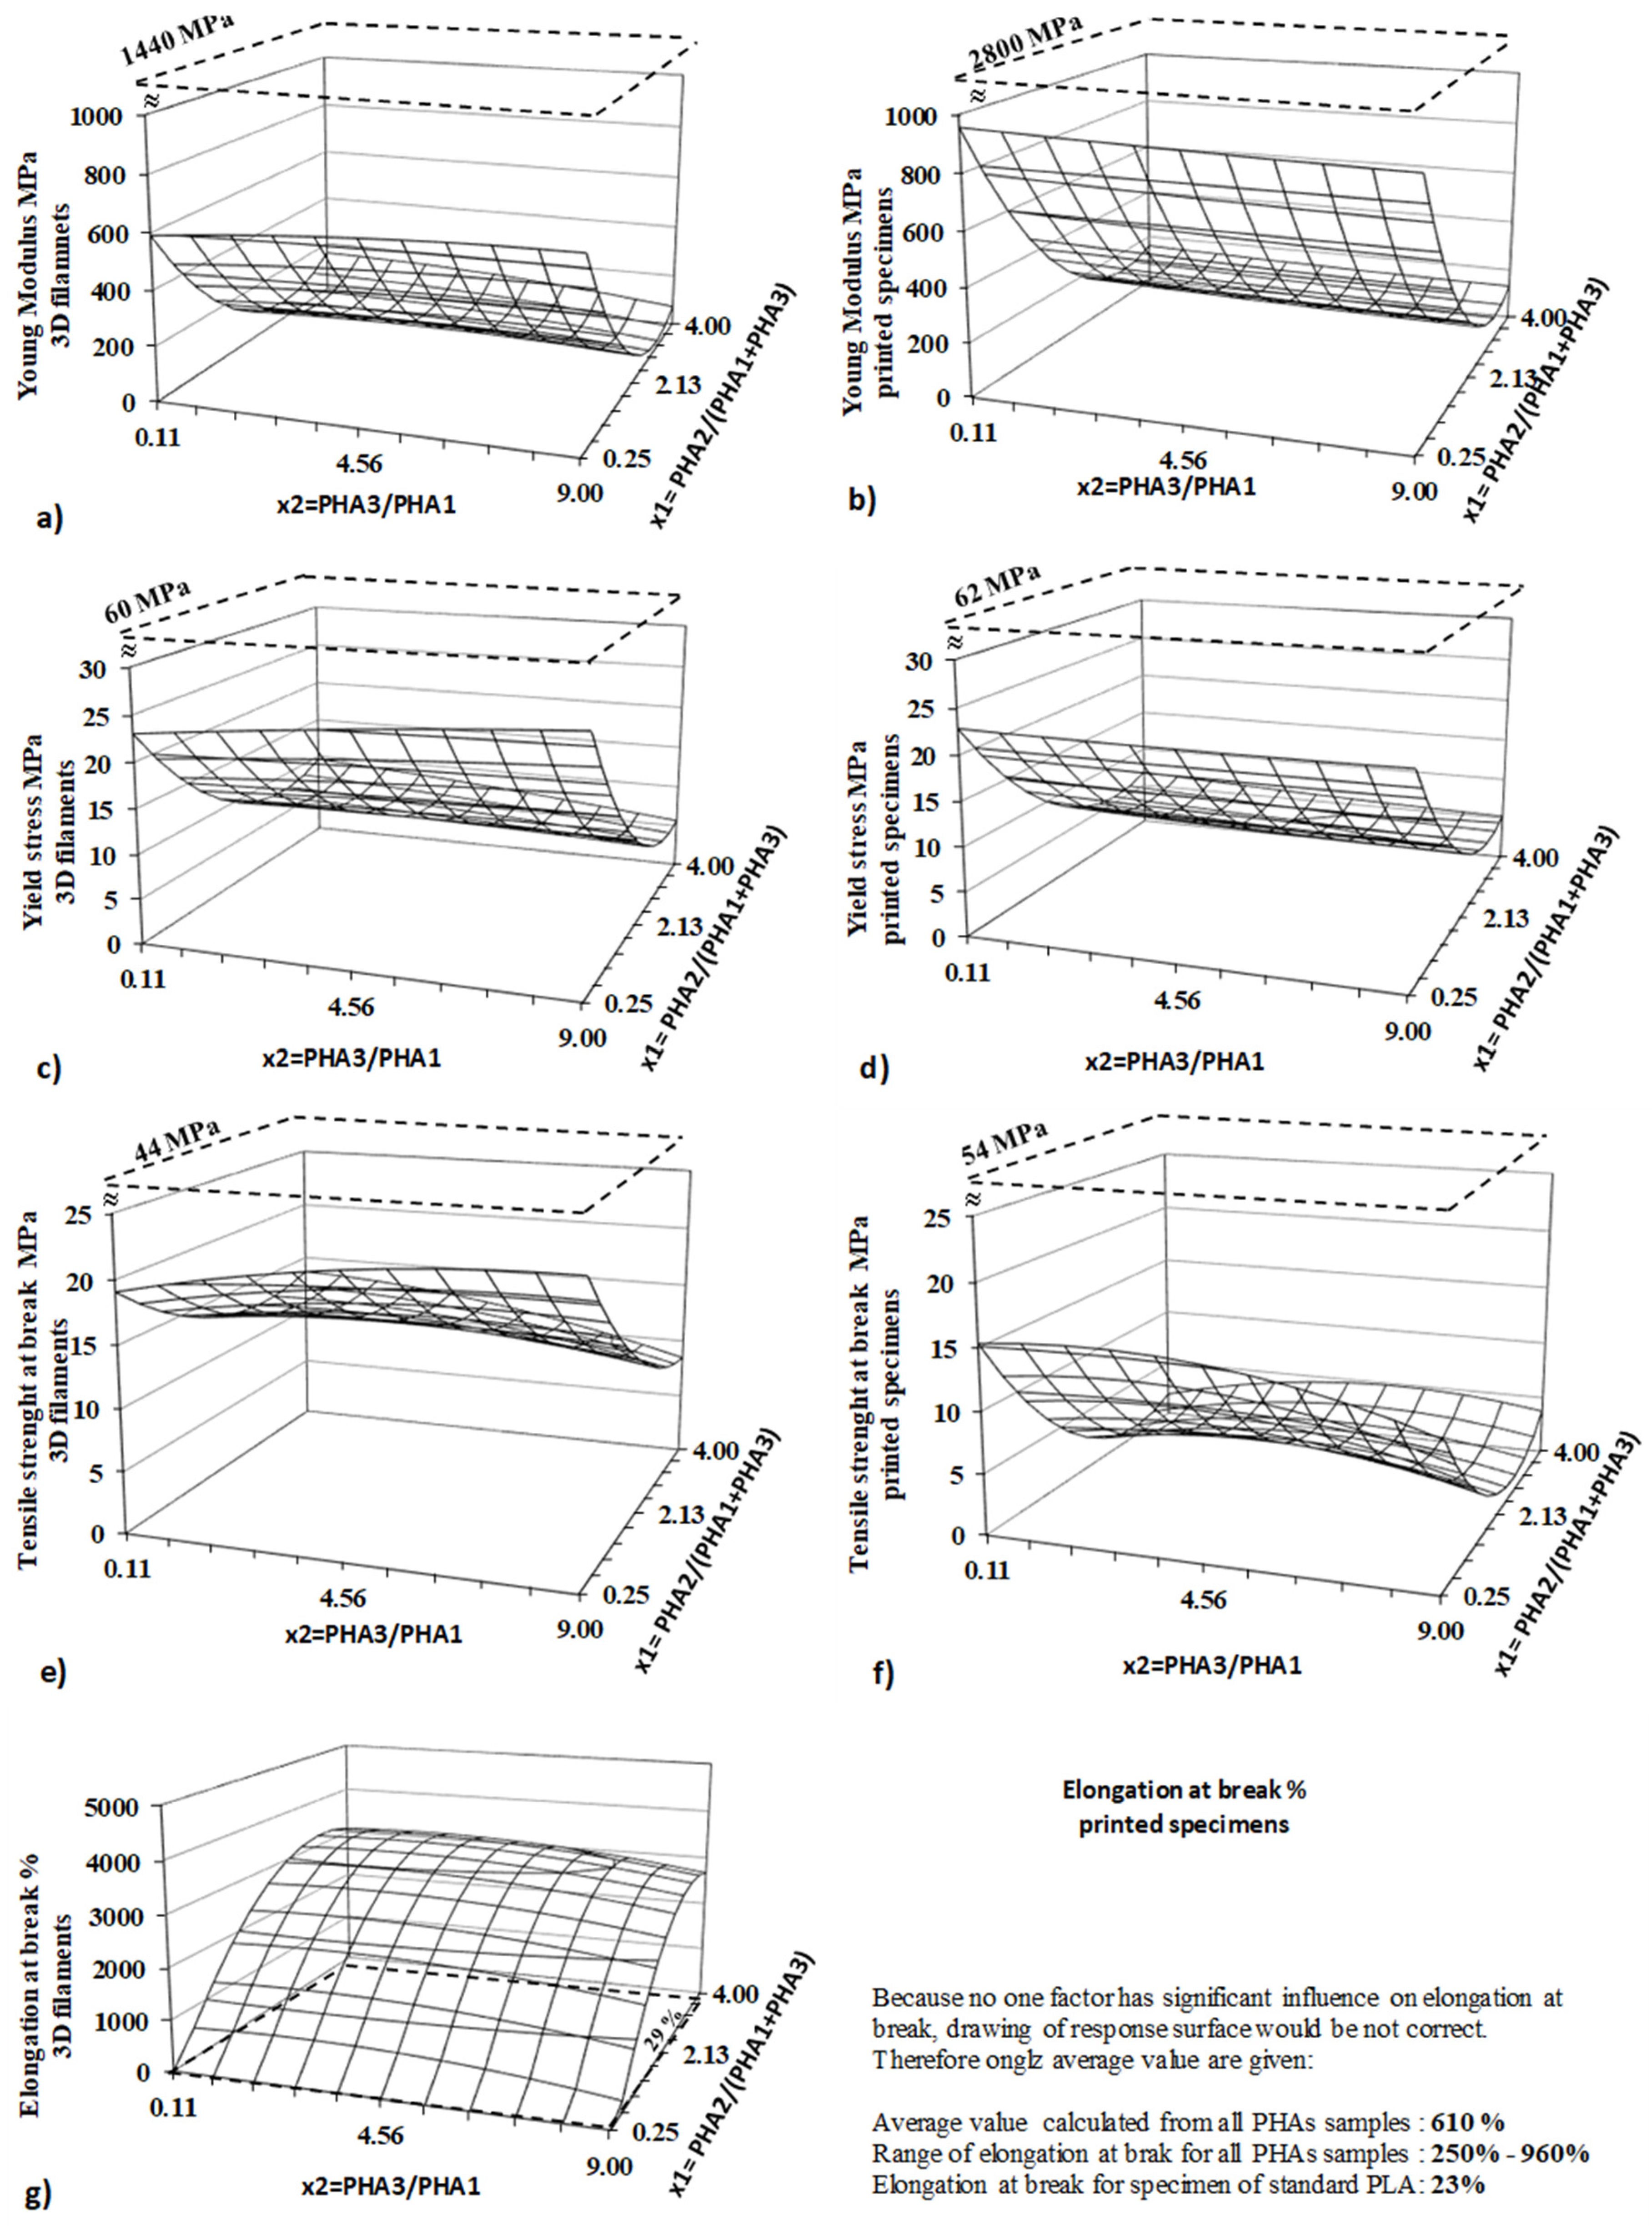
Figure 12.
Response surfaces for a) hardness, b) flexural modulus and c) impact strength. Dashed lines represent values for PLA.
Figure 12.
Response surfaces for a) hardness, b) flexural modulus and c) impact strength. Dashed lines represent values for PLA.
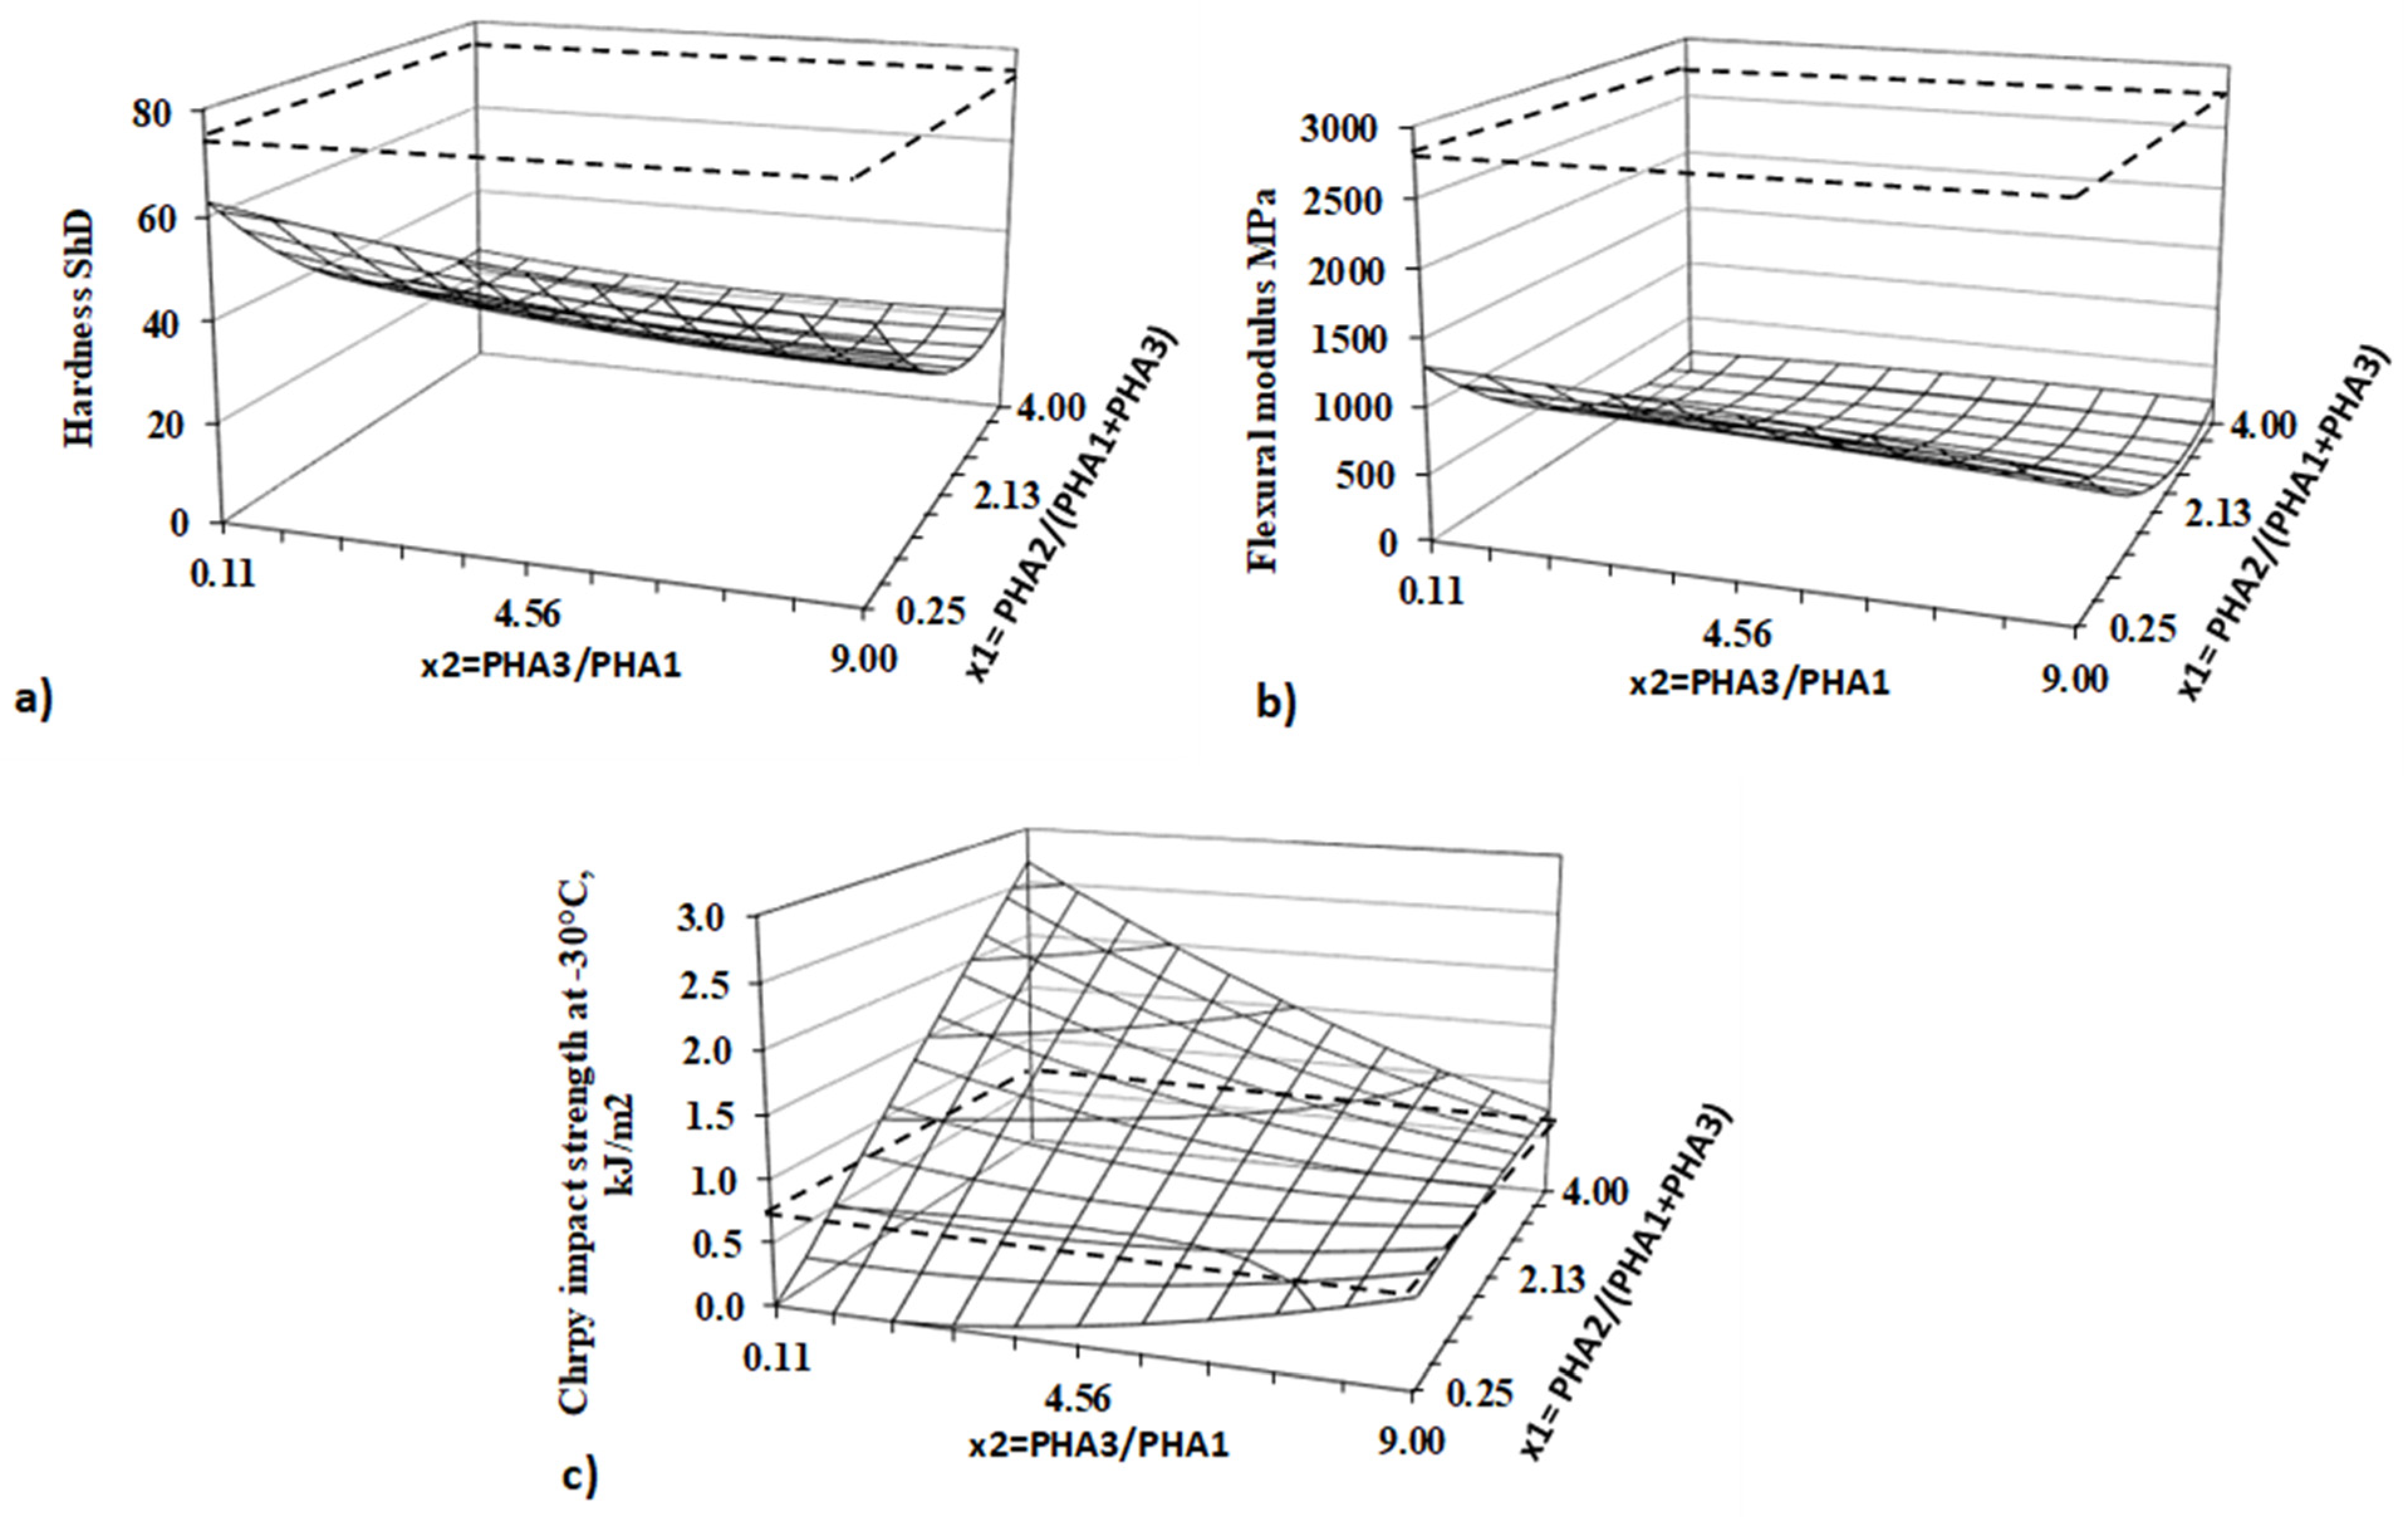
Figure 13.
Visual inspection of composting of 3D printed Samples: I-before composting, II – after 2 months of home composting for samples of B5, B6, B7, B8, and PLA with values of crystallinity 24.1, 10.4, 18.3. 13.1 and 25 %, respectively).
Figure 13.
Visual inspection of composting of 3D printed Samples: I-before composting, II – after 2 months of home composting for samples of B5, B6, B7, B8, and PLA with values of crystallinity 24.1, 10.4, 18.3. 13.1 and 25 %, respectively).
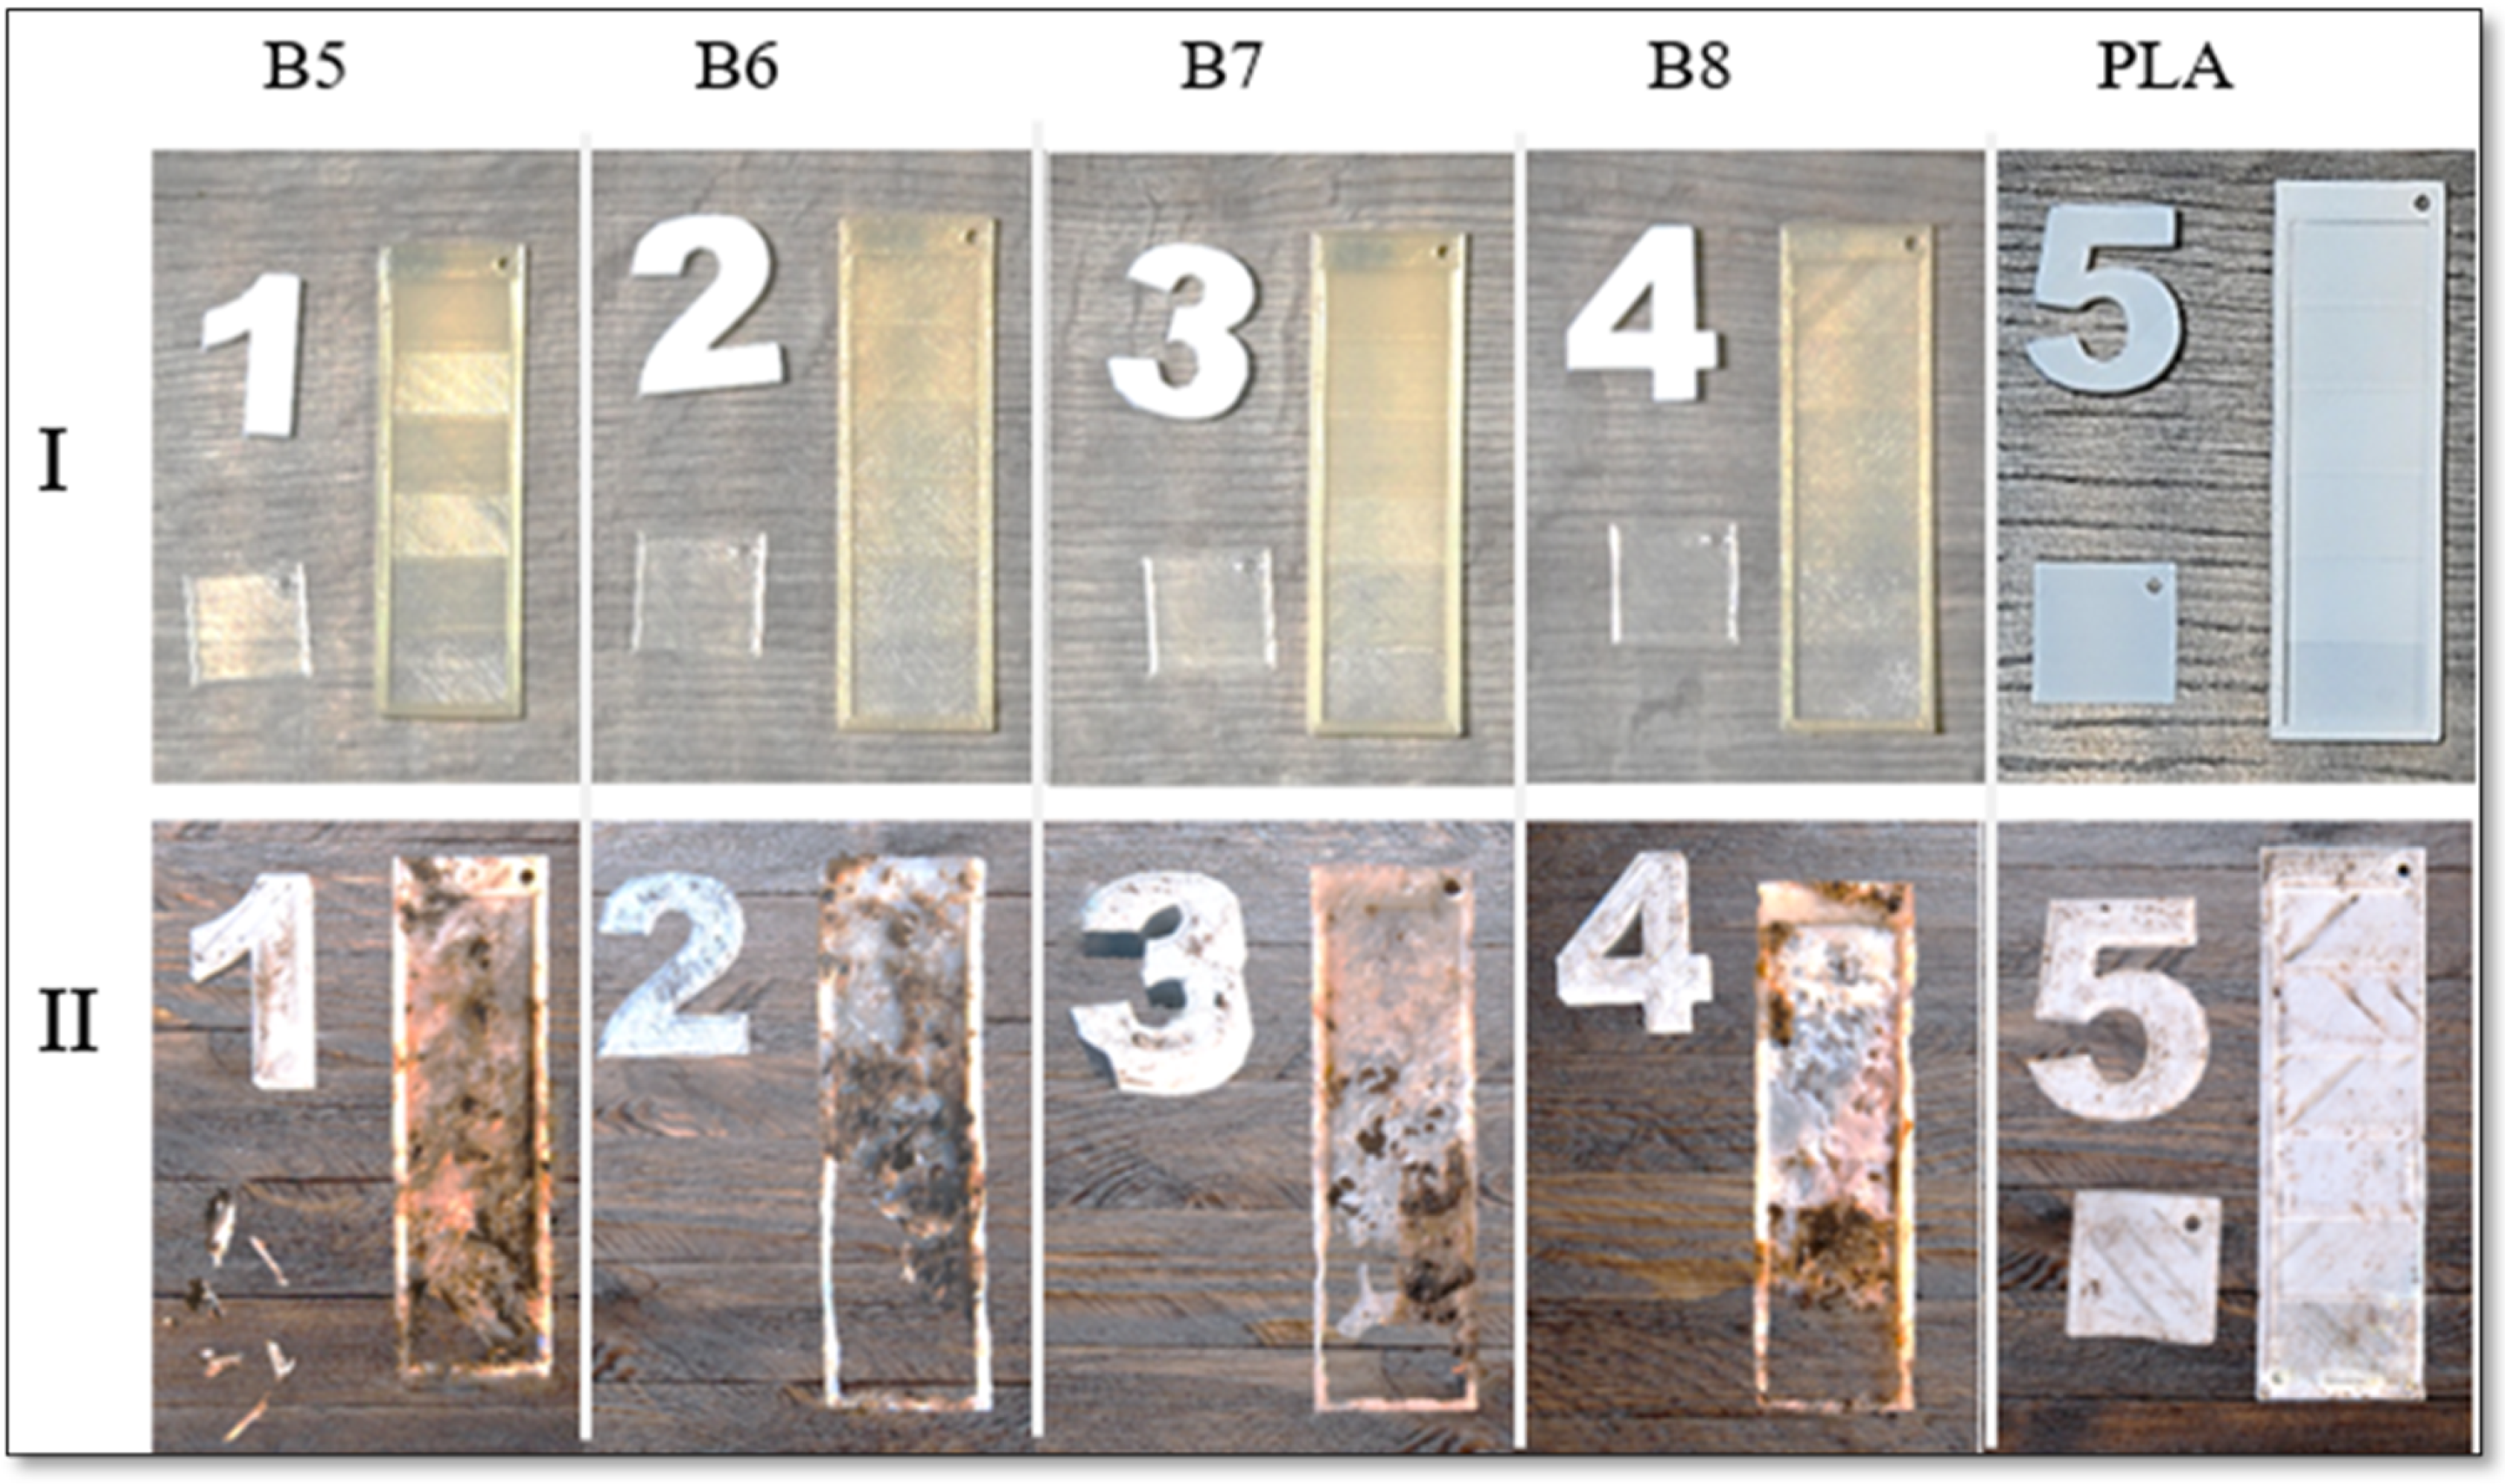
Figure 14.
Typical SEM photos of surfaces of samples B5 before composting in different magnifications.
Figure 14.
Typical SEM photos of surfaces of samples B5 before composting in different magnifications.
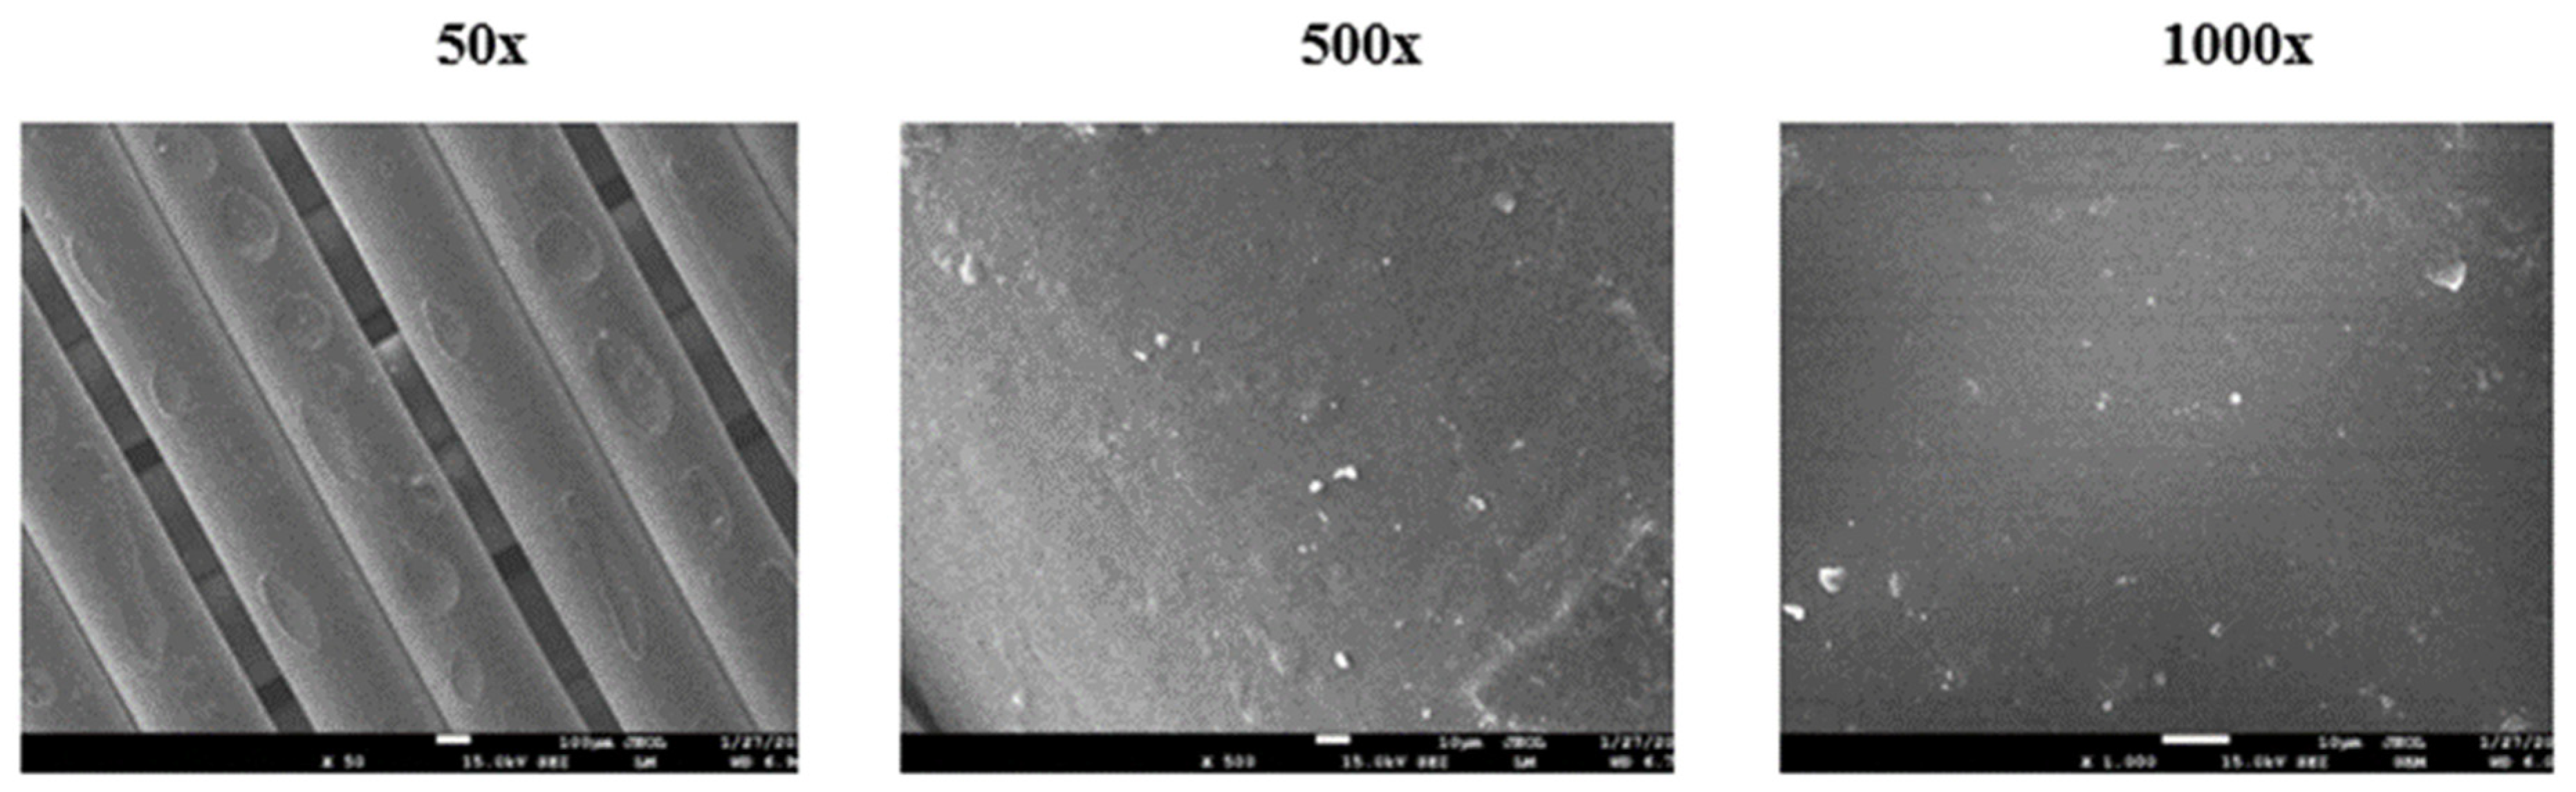
Figure 16.
SEM photos for identification of bacteria colony on sample B8 surface in different magnifications (the magnification is given above the photo).
Figure 16.
SEM photos for identification of bacteria colony on sample B8 surface in different magnifications (the magnification is given above the photo).
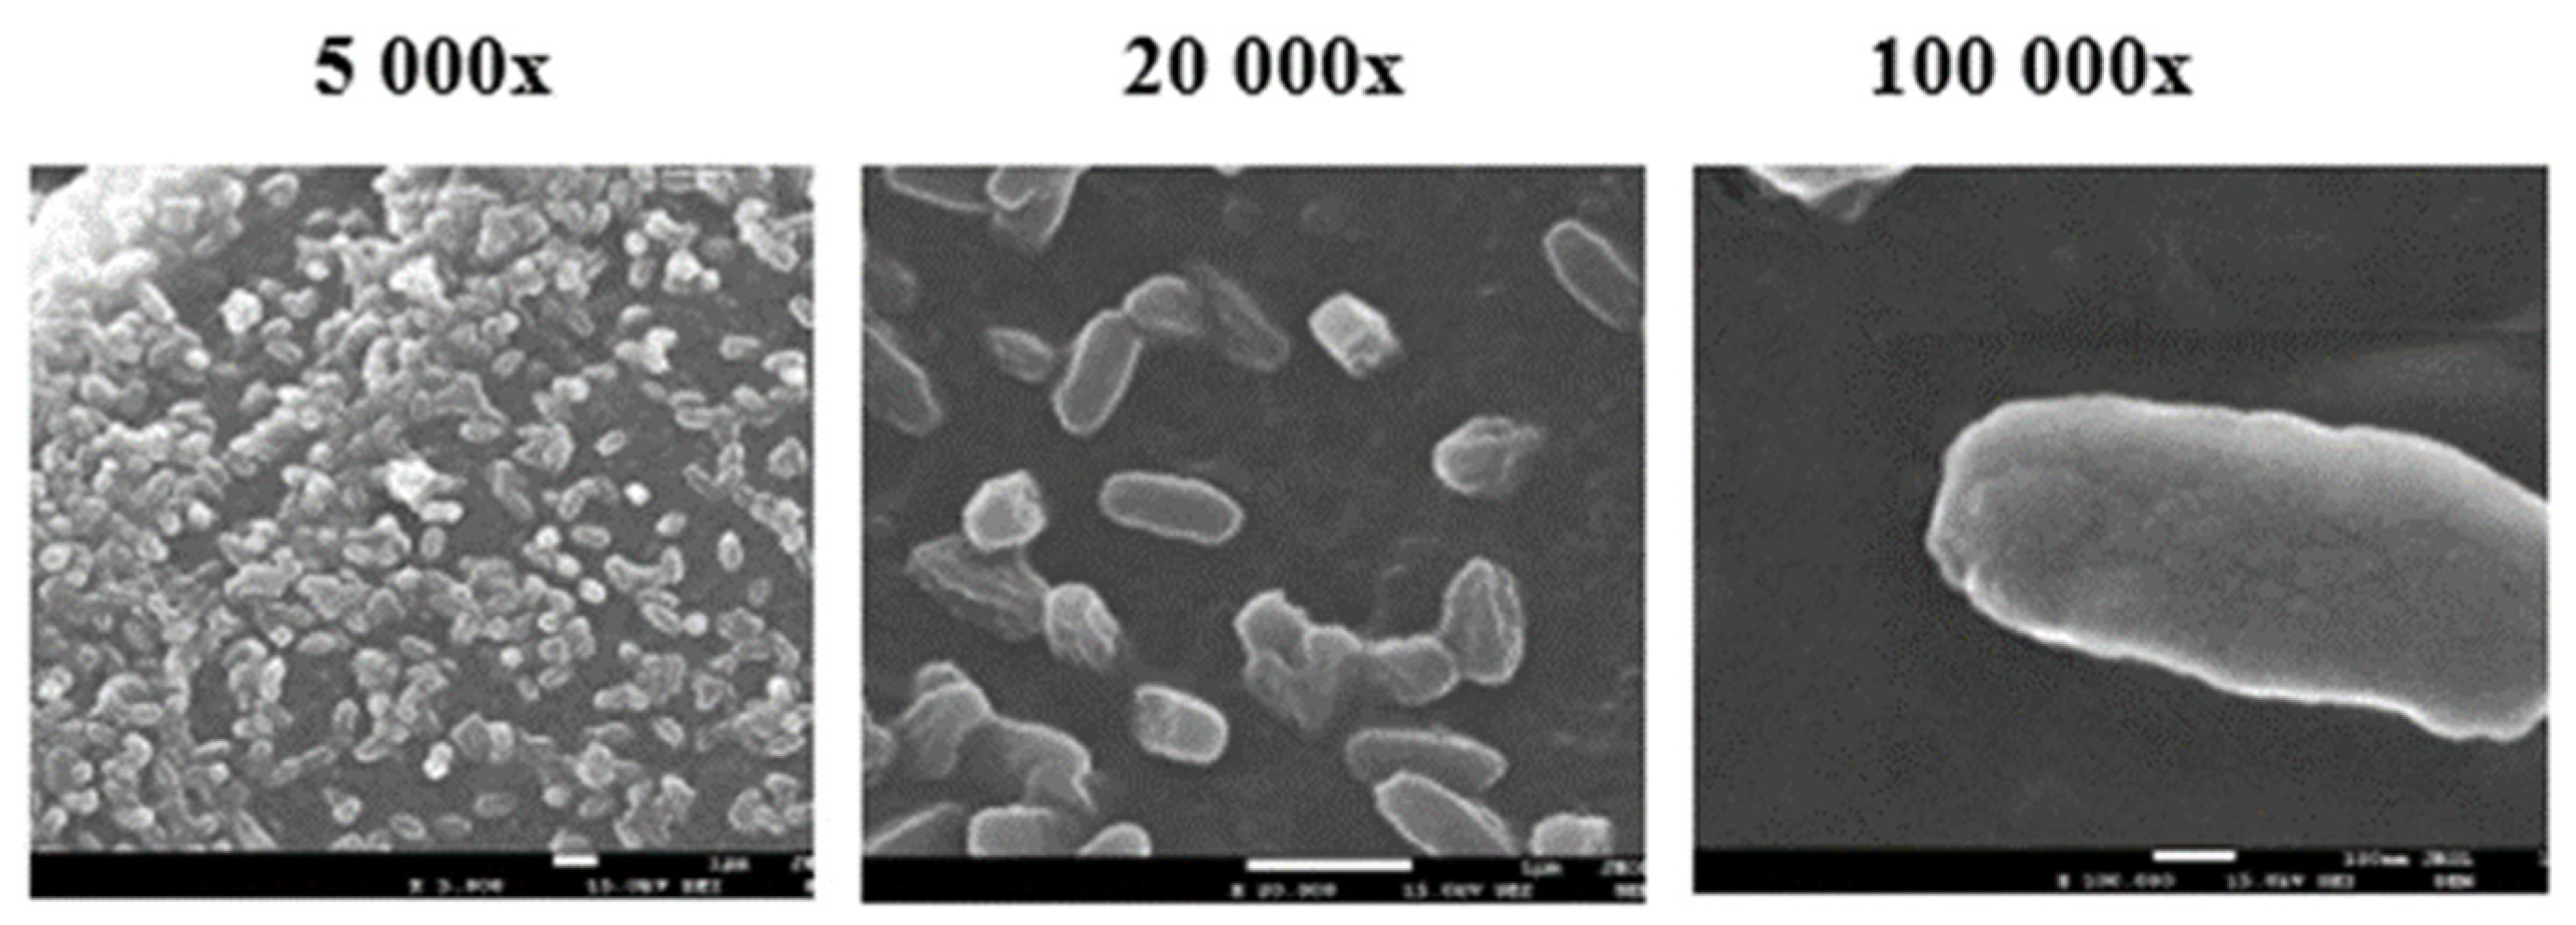
Figure 17.
Results of the Agar Diffusion Test for Sample B5. a) Negative control (only cells) (A (0/0), b) Positive control (gauze moistened with SDS) (B (4/4)), c) Sample B5 (C (0/0)), d) Sample B8 (D (0/0)). The response index (Zone/Lysis) is indicated in parentheses.
Figure 17.
Results of the Agar Diffusion Test for Sample B5. a) Negative control (only cells) (A (0/0), b) Positive control (gauze moistened with SDS) (B (4/4)), c) Sample B5 (C (0/0)), d) Sample B8 (D (0/0)). The response index (Zone/Lysis) is indicated in parentheses.
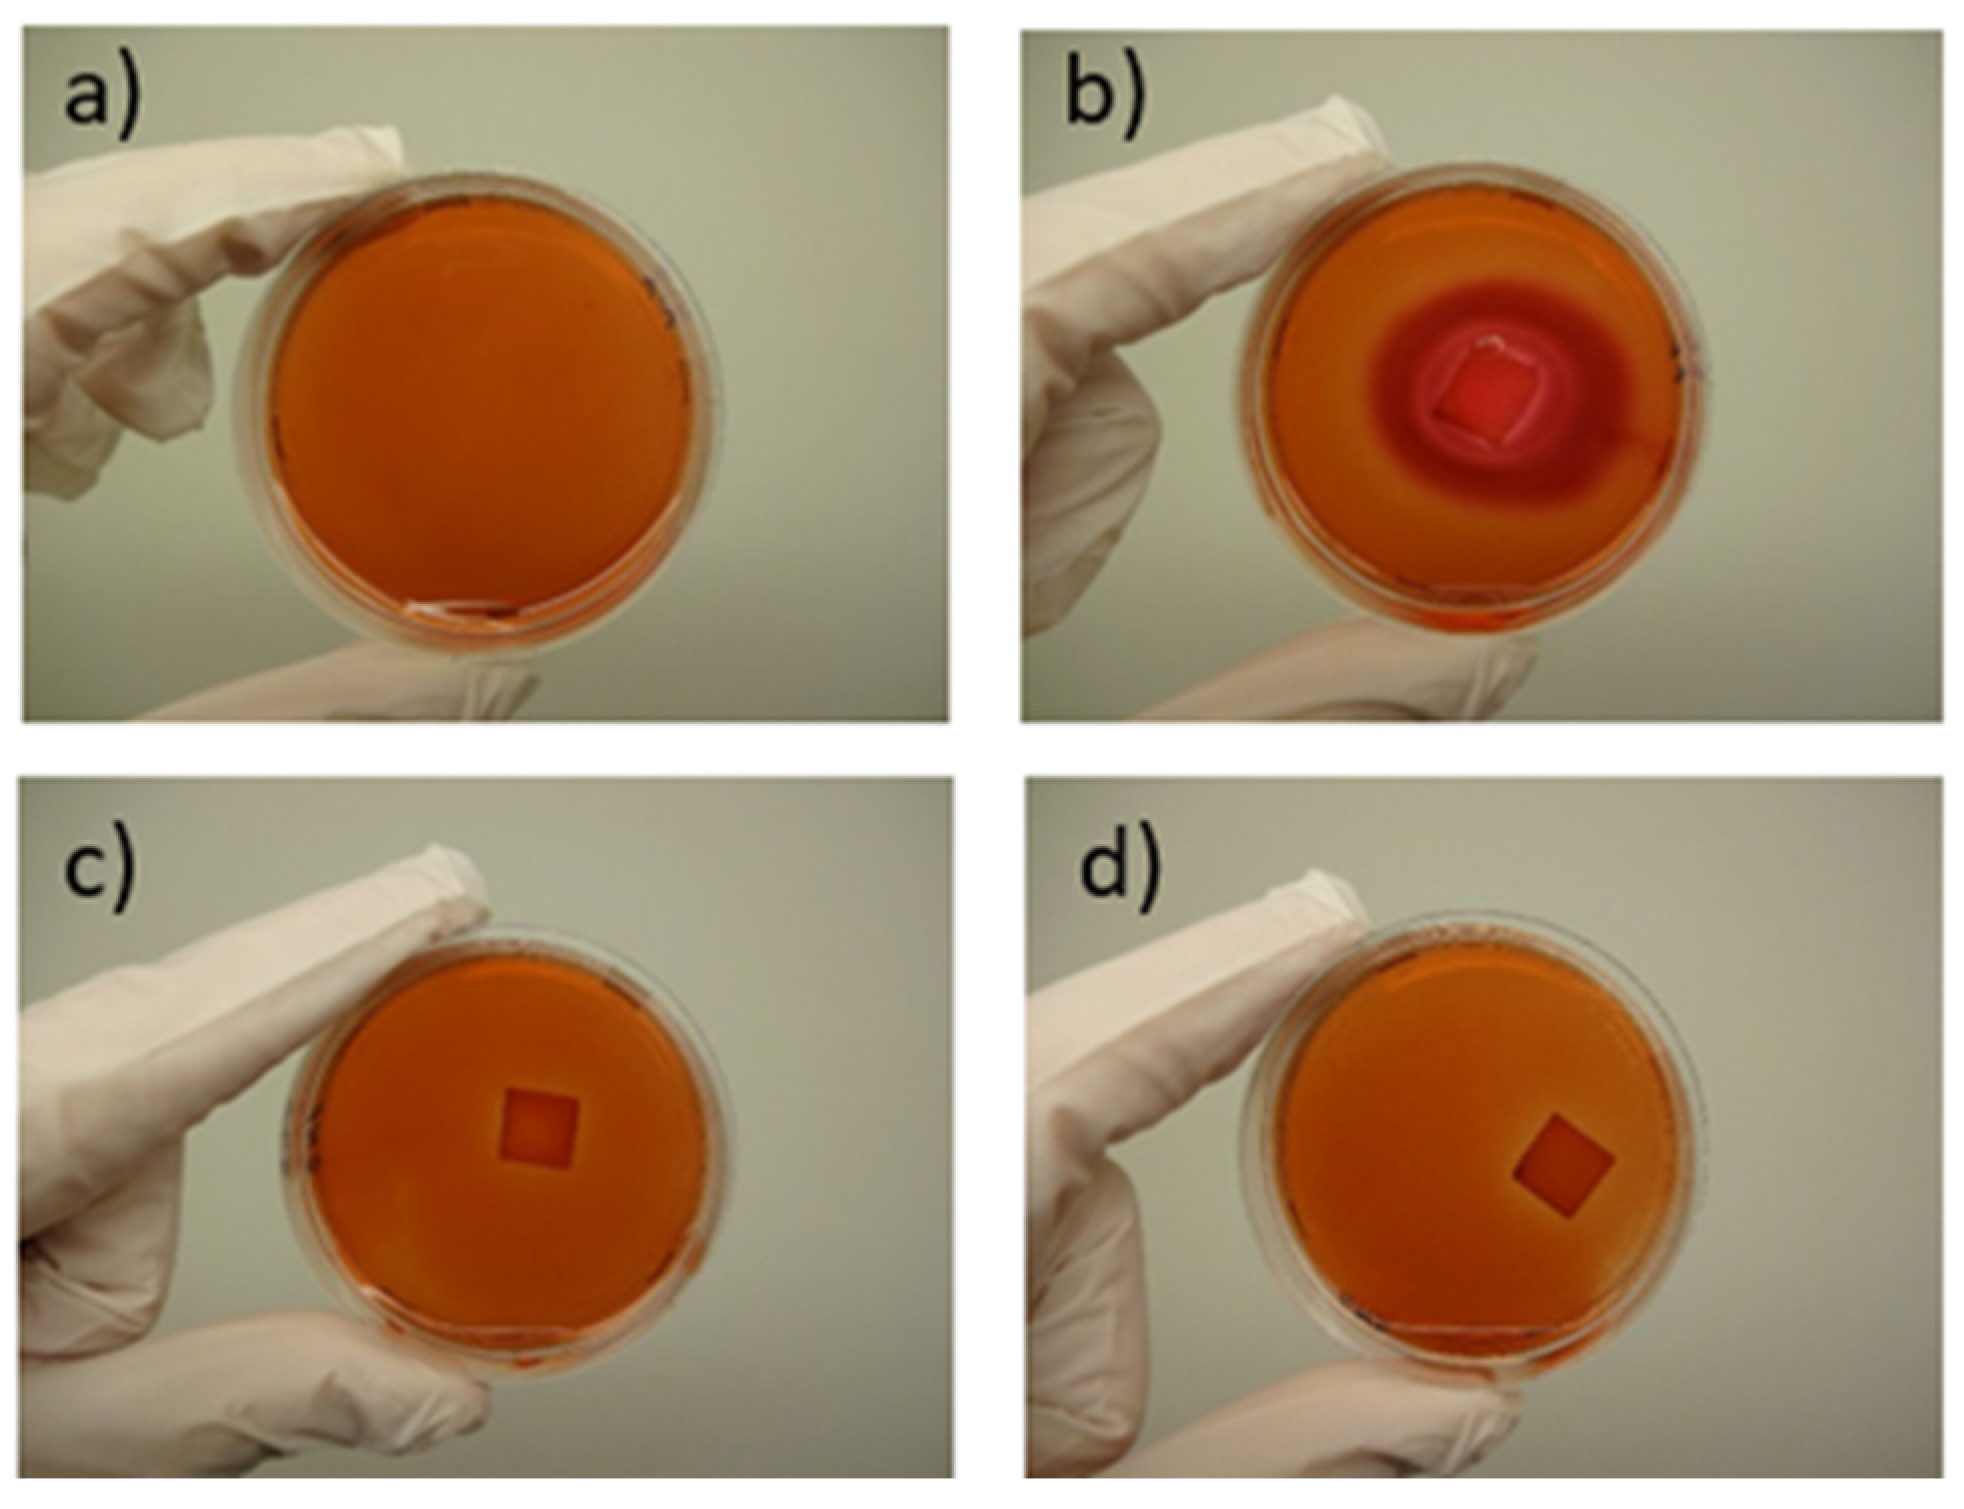
Figure 18.
Microscopic images of cells cultivated in the presence of samples B5 and B8, alongside negative and positive controls, after 72 hours of the in vitro contact toxicity test.
Figure 18.
Microscopic images of cells cultivated in the presence of samples B5 and B8, alongside negative and positive controls, after 72 hours of the in vitro contact toxicity test.
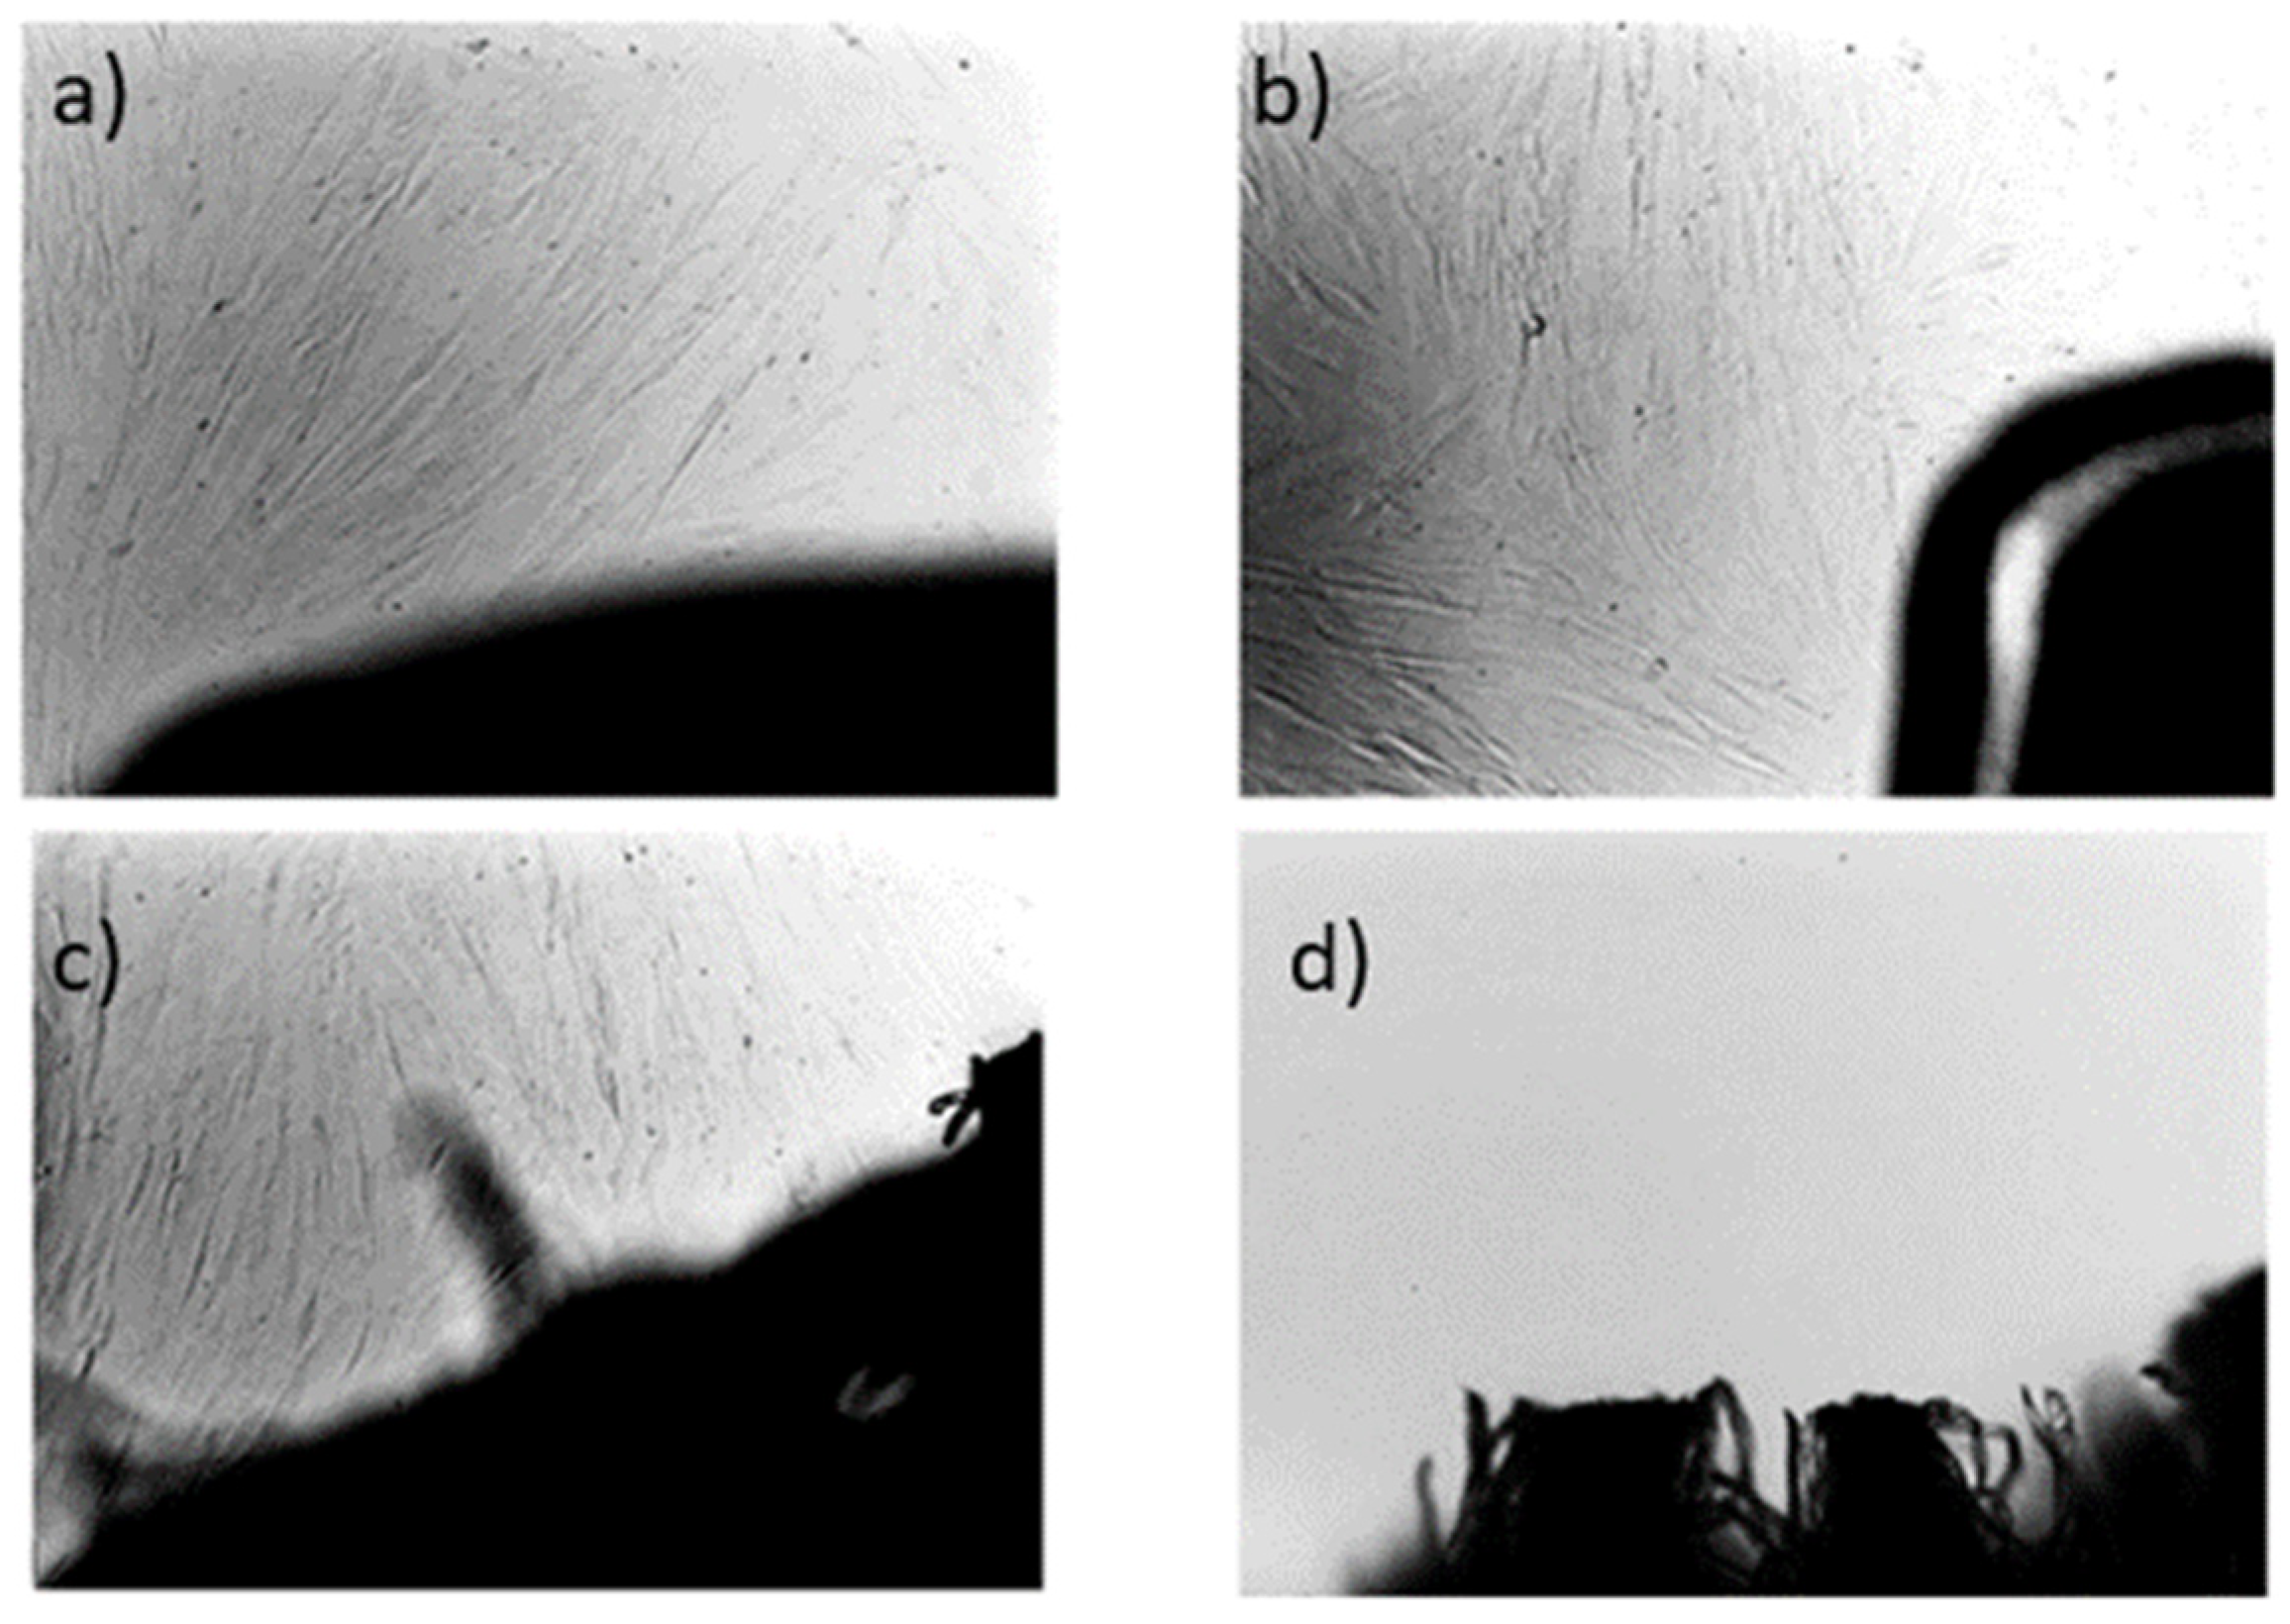
Figure 19.
Cell proliferation after 72 hours of in vitro contact toxicity test expressed in relative number (%) related to negative control with sterile gauze (100%).
Figure 19.
Cell proliferation after 72 hours of in vitro contact toxicity test expressed in relative number (%) related to negative control with sterile gauze (100%).
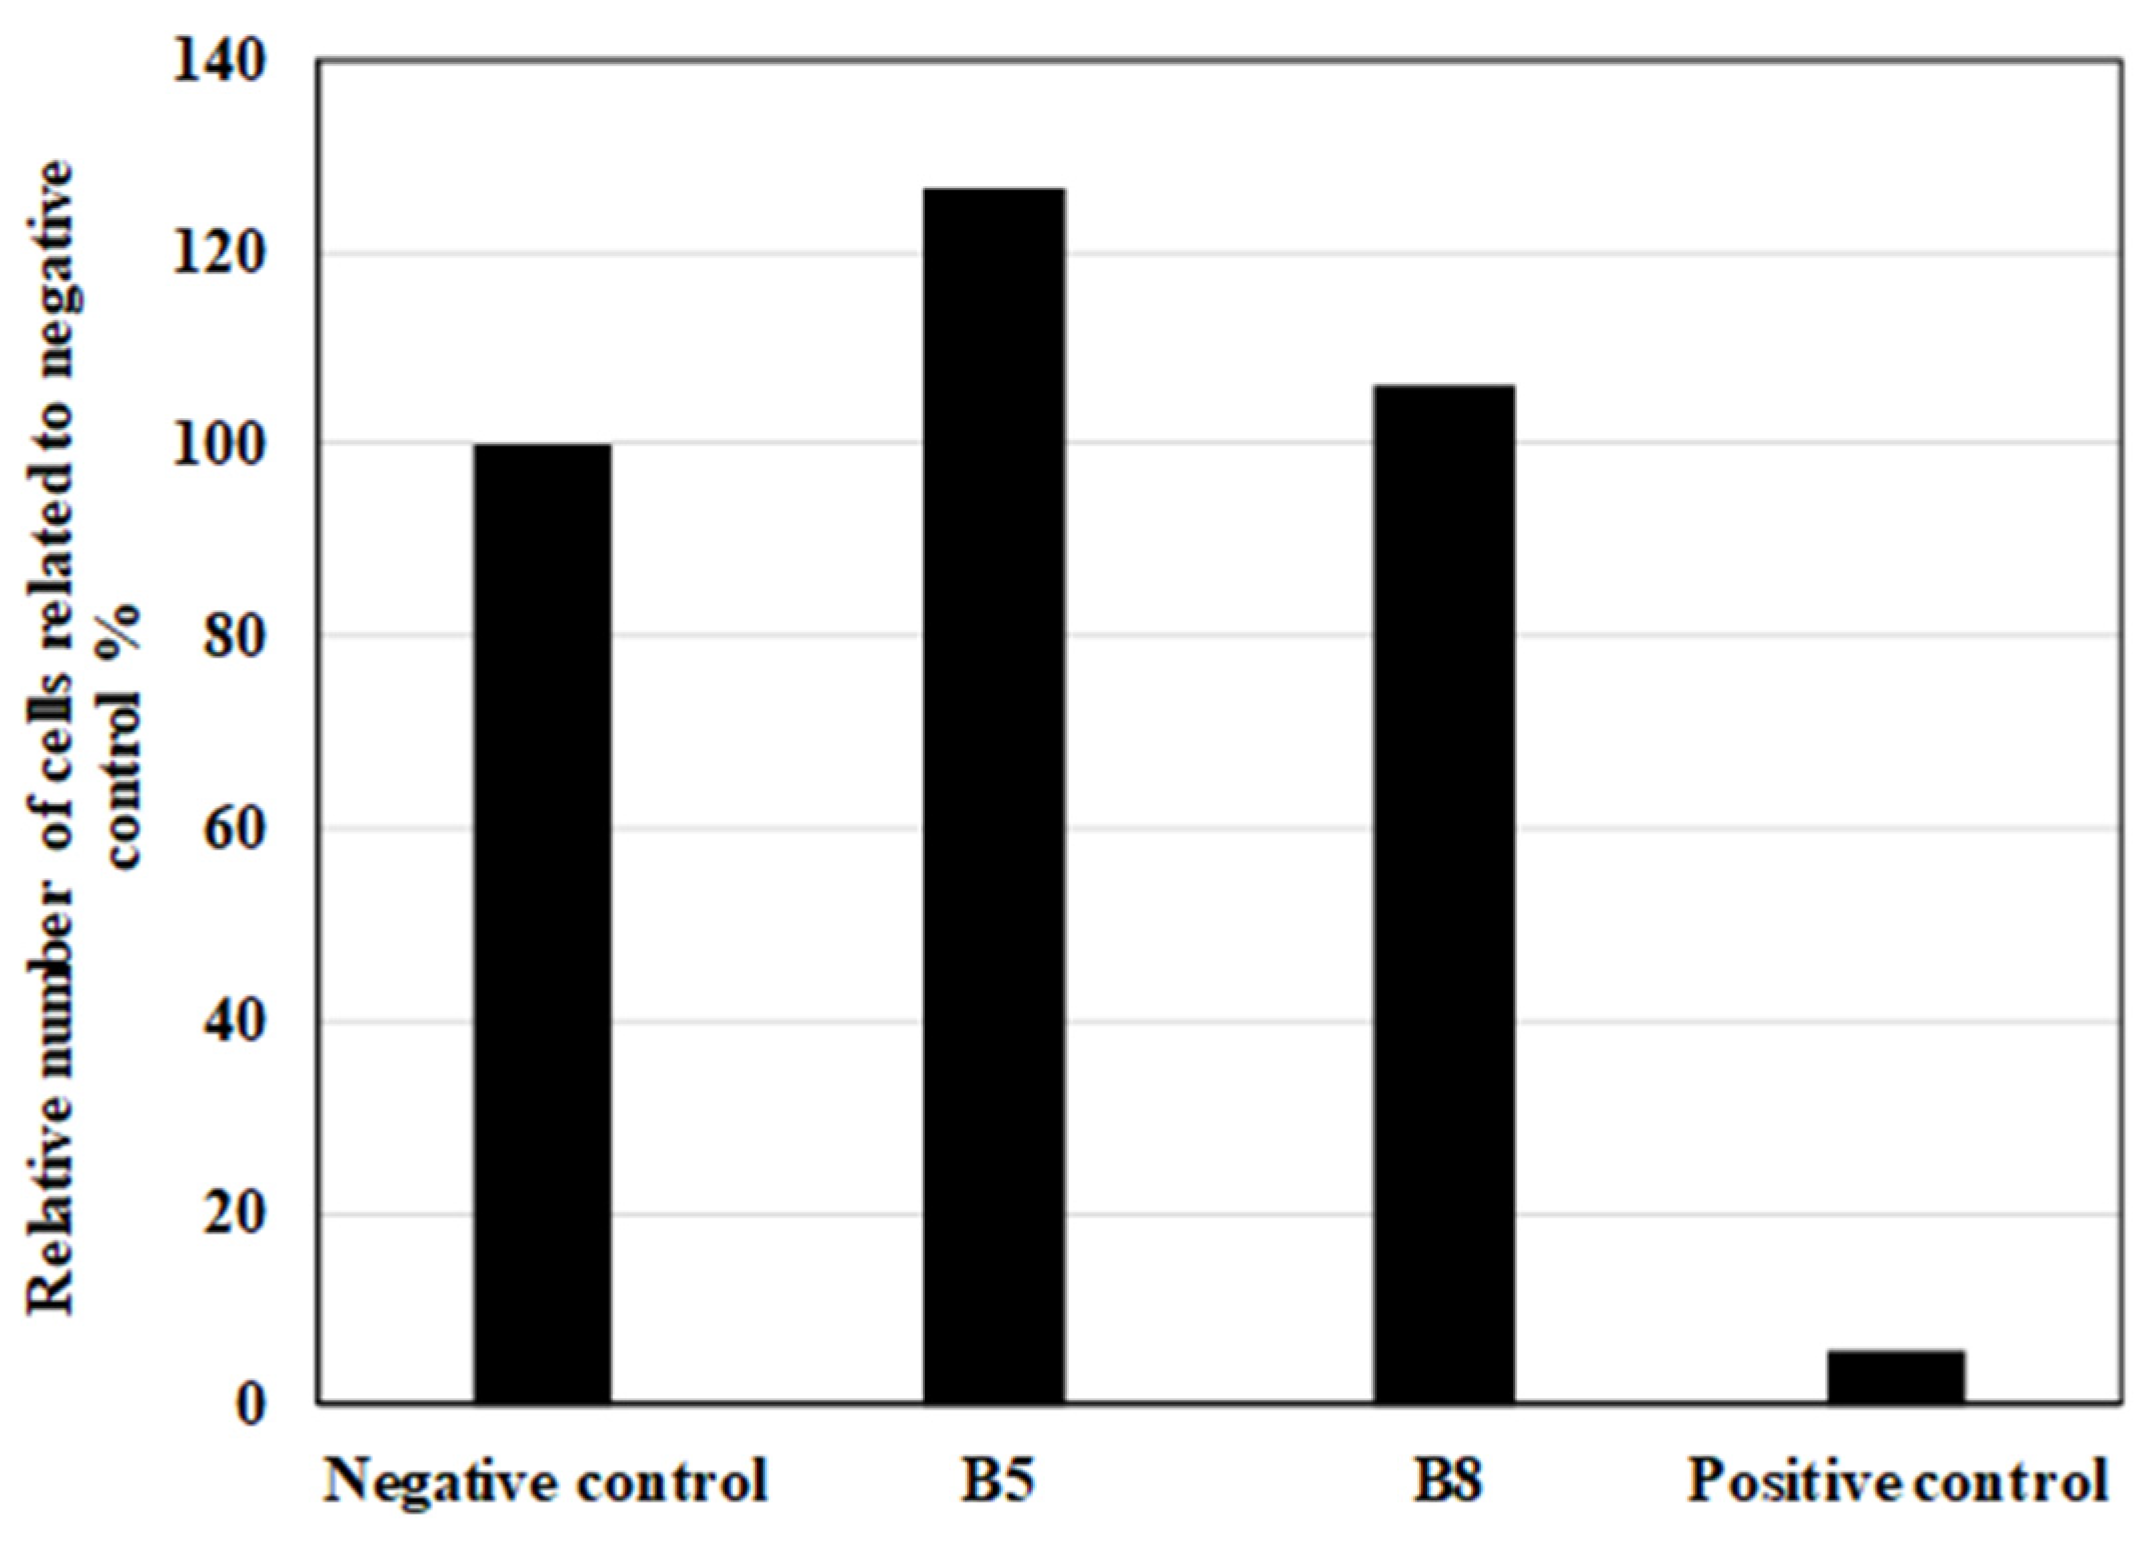

Table 1.
Conditions of experiment.
| Coded levels | |||||||
| -1.141 | -1 | 0 | 1 | 1.414 | |||
| Factor | Real values | Central value | step | ||||
| x1 | 0.25 | 0.80 | 2.13 | 3.45 | 4 | 2.13 | 1.33 |
| x2 | 0.11 | 1.412 | 4.56 | 7.70 | 9 | 4.56 | 3.14 |
Table 2.
Composition of the blends in DoE experiment.
| Samples | Coded values | Real values | ||
| x1 | x2 | x1 | x2 | |
| PHA2/(PHA1+PHA3) | PHA3/PHA1 | PHA2/(PHA1+PHA3) | PHA3/PHA1 | |
| B1 | -1 | -1 | 0.80 | 1.412 |
| B2 | +1 | -1 | 3.45 | 1.412 |
| B2 | -1 | +1 | 0.80 | 7.7 |
| B4 | +1 | +1 | 3.45 | 7.7 |
| B5 | -1.414 | 0 | 0.25 | 4.56 |
| B6 | +1.414 | 0 | 4 | 4.56 |
| B7 | 0 | -1.414 | 2.13 | 0.11 |
| B8 | 0 | +1.414 | 2.13 | 9 |
| B9 | 0 | 0 | 2.13 | 4.56 |
| B10 | 0 | 0 | 2.13 | 4.56 |
| B11 | 0 | 0 | 2.13 | 4.56 |
| B12 | 0 | 0 | 2.13 | 4.56 |
| B13 | 0 | 0 | 2.13 | 4.56 |
Table 3.
Regression and statistical parameters evaluated for viscosity. (Values significant at 95% probability (α=0.05) are in bold.).
Table 3.
Regression and statistical parameters evaluated for viscosity. (Values significant at 95% probability (α=0.05) are in bold.).
| Fcrit 0.05 | Complex viscosity | Plastic viscosity | Elastic viscosity | |
| F1 | 6.9 | 88.5 | 91.2 | 52.8 |
| F2 | 6.6 | 23.0 | 23.4 | 18.5 |
| FLF | 6.6 | 1.0 | 1.0 | 0.9 |
| sE+/- | 62 | 59 | 17 | |
| sLF+/- | 61 | 60 | 16 | |
| b0 | 1817 | 1781 | 361 | |
| b1 | 278 | 272 | 55 | |
| b2 | -81 | -77 | -25 | |
| b11 | -160 | -156 | -34 | |
| b12 | 54 | 51 | 18 | |
| b22 | 81 | 77 | 25 |
Table 4.
Tg values of prepared blends and their components.
| sample | Tg1 (°C) | Tg 2 (°C) | Tm (°C) | ΔHm (J/g) | 1Crystallinity (%) |
| PHA1 | 5.1 | - | 166.7 | 75.9 | 52.0 |
| PHA2 | -14.9 | - | - | - | - |
| PHA3 | 2.4 | - | 148.6 | 52.8 | 36.2 |
| B1 | -19.7 | -1.1 | 166.3 | 28.9 | 19.8 |
| B2 | -14.2 | -2.7 | 165.4 | 15.5 | 10.6 |
| B3 | -18.6 | -1.7 | 151.2 | 25.3 | 17.3 |
| B4 | -14.5 | -2.1 | 151.2 | 14.3 | 9.8 |
| B5 | -21.7 | 0.3 | 156.9 | 35.1 | 24.07 |
| B6 | -14.6 | -2.6 | 157.3 | 15.1 | 10.4 |
| B7 | -18.9 | -3.4 | 170.4 | 26.7 | 18.3 |
| B8 | -15.7 | -2.1 | 149.9 | 19.1 | 13.1 |
| B9 | -14.5 | -1.3 | 157.8 | 19.1 | 13.1 |
| B10 | -15.2 | -2.4 | 153.3 | 18.7 | 12.8 |
| B11 | -15.6 | -2.6 | 163.0 | 21.1 | 14.4 |
| B12 | -15.2 | -2.6 | 155.7 | 19.2 | 13.1 |
| B13 | -15.6 | -2.8 | 153.2 | 19.2 | 13.1 |
| PLA ref. | 61.16 | - | 151.8 | 23.4 | 25.0 |
Table 5.
Regression and statistical parameters evaluated for Thermal properties and crystallinity. Values significant at 95% probability (α=0.05) are in bold.
Table 5.
Regression and statistical parameters evaluated for Thermal properties and crystallinity. Values significant at 95% probability (α=0.05) are in bold.
| Fcrit 0.05 | Tg1 | Tg2 | Tm | Crystallinity | |
| F1 | 6.9 | 154.72 | 154.72 | 12.36 | 212.69 |
| F2 | 6.6 | 26.51 | 26.51 | 0.48 | 13.35 |
| FLF | 6.6 | 7.17 | 7.17 | 0.01 | 9.43 |
| sE+/- | 0.41 | 0.41 | 4.1 | 0.64 | |
| sLF+/- | 1.10 | 1.10 | 0.4 | 1.98 | |
| b0 | -15.24 | -15.24 | 156.6 | 13.31 | |
| b1 | 2.46 | 2.46 | 0.0 | -4.50 | |
| b2 | 0.68 | 0.68 | -7.1 | -1.33 | |
| b11 | -1.20 | -1.20 | 0.3 | 1.43 | |
| b12 | -0.34 | -0.34 | 0.3 | 0.41 | |
| b22 | -0.79 | -0.79 | 1.8 | 0.67 |
Table 6.
Values of optimal printing temperature as well as values of warping effect.
| Warping | Optimal printing temperature | |
| Sample | (layer number) | (°C) |
| B1 | 19 | 200 |
| B2 | 43 | 200 |
| B3 | 43 | 200 |
| B4 | 43 | 205 |
| B5 | 11 | 200 |
| B6 | 43 | 210 |
| B7 | 24 | 200 |
| B8 | 43 | 200 |
| B9 | 43 | 200 |
| B10 | 43 | 200 |
| B11 | 43 | 205 |
| B12 | 43 | 200 |
| B13 | 43 | 205 |
| PLA | 43 | 210 |
Table 7.
Regression and statistical parameters evaluated for tensile properties of 3D filaments and 3D printed specimens. Values significant at 95% probability (α=0.05) are in bold.
Table 7.
Regression and statistical parameters evaluated for tensile properties of 3D filaments and 3D printed specimens. Values significant at 95% probability (α=0.05) are in bold.
| 3D filaments | 3D printed specimens | ||||||
| Fcrit 0.05 | σY1 | σB2 | εB3 | σY | σB | εB | |
| F1 | 6.9 | 260.6 | 26.7 | 30.9 | 230.6 | 170.8 | 2.9 |
| F2 | 6.6 | 49.5 | 4.6 | 5.1 | 42.6 | 76.2 | 0.6 |
| FLF | 6.6 | 7.4 | 8.5 | 0.4 | 2.1 | 95.9 | 0.5 |
| sE+/- | 0.77 | 1.4 | 420 | 0.79 | 0.58 | 348 | |
| sLF+/- | 2.09 | 4.0 | 249 | 1.15 | 5.69 | 240 | |
| b0 | 9.89 | 14.0 | 2662 | 7.64 | 4.14 | 610 | |
| b1 | -6.20 | -3.5 | 1158 | -5.96 | -3.78 | 289 | |
| b2 | -0.02 | -0.2 | -142 | -0.30 | -0.35 | -60 | |
| b11 | 3.42 | 1.6 | -623 | 3.35 | 2.99 | -90 | |
| b12 | -1.00 | -1.1 | -8 | -0.17 | 0.72 | -44 | |
| b22 | -0.14 | -0.5 | -94 | 0.09 | -0.96 | 136 | |
1σY – yield stress, 2σB – tensile strength at break, 3εB – elongation at break.
Table 8.
Regression and statistical parameters evaluated for hardness, flexural modulus and impact strength according to Charpy unnotched method at -30°C. (Values significant at 95% probability (α=0.5) are in bold.).
Table 8.
Regression and statistical parameters evaluated for hardness, flexural modulus and impact strength according to Charpy unnotched method at -30°C. (Values significant at 95% probability (α=0.5) are in bold.).
| Fcrit 0.05 | Hardness | Flexural modulus | Impact strength at -30°C | |
| F1 | 6.9 | 210.2 | 367.0 | 43.1 |
| F2 | 6.6 | 29.3 | 79.6 | 6.3 |
| FLF | 6.6 | 3.4 | 11.8 | 3.3 |
| sE+/- | 1.7 | 37 | 0.17 | |
| sLF+/- | 3.1 | 126 | 0.30 | |
| b0 | 26.6 | 290 | 0.89 | |
| b1 | -11.8 | -351 | 0.50 | |
| b2 | -2.7 | -41 | -0.22 | |
| b11 | 5.9 | 210 | -0.02 | |
| b12 | 1.0 | 36 | -0.34 |
Table 9.
Caption.
| Sample number in compost | Sample number in DoE | Sample description |
| 1 | B5 | sample with the lowest PHA2 amorphous PHA content at medium PHA3/PHA1 ratio |
| 2 | B6 | sample with the highest PHA2 amorphous PHA content at medium PHA3/PHA1 ratio |
| 3 | B7 | sample with lowest PHA3/PHA1 ratio at medium PHA2 content |
| 4 | B8 | sample with highest PHA3/PHA1 ratio at medium PHA2 content |
| 5 | PLA | Commercial PLA sample |
Disclaimer/Publisher’s Note: The statements, opinions and data contained in all publications are solely those of the individual author(s) and contributor(s) and not of MDPI and/or the editor(s). MDPI and/or the editor(s) disclaim responsibility for any injury to people or property resulting from any ideas, methods, instructions or products referred to in the content. |
© 2025 by the authors. Licensee MDPI, Basel, Switzerland. This article is an open access article distributed under the terms and conditions of the Creative Commons Attribution (CC BY) license (http://creativecommons.org/licenses/by/4.0/).
Copyright: This open access article is published under a Creative Commons CC BY 4.0 license, which permit the free download, distribution, and reuse, provided that the author and preprint are cited in any reuse.


