
Submitted:
29 November 2025
Posted:
02 December 2025
You are already at the latest version
Abstract
This study presents an integrated analytical approach that combines Space Syntax metrics with user-experience data to examine spatial patterns, perceptual tendencies, and sustainability-related considerations on university campuses. Using the Balkan Campus as a case study, the analysis reveals a pronounced center–periphery structure shaped by the campus’s historical growth and linear development pattern. Background: The study is situated within broader discussions of how spatial configuration influences user perceptions and sustainability-related experiences in campus environments. Methods: Higher integration, connectivity, and visibility values occurred in areas that respondents more frequently described as offering either clear or unclear navigational conditions, reflecting overlapping spatial and perceptual tendencies without implying causation. Regression analyses identified notable associations between user satisfaction and factors such as wayfinding difficulty, the availability of social spaces, and cleanliness–hygiene conditions. Results: Social and green areas were also closely associated with positive evaluations, paralleling themes discussed in sustainability and environmental-psychology literature. The combined interpretation of spatial and perceptual data provides a complementary perspective for understanding campus environments and may offer contextual insight for future planning discussions related to accessibility, environmental comfort, perceived safety, and spatial equity. Conclusions: The proposed integrated framework holds potential relevance not only for university campuses but also for broader applications in urban-design research and public-space assessment.

Keywords:
sustainable campus
; spatial configuration
; walkability
; accessibility
; space syntax
; user experience
1. Introduction
University campuses are not merely settings where academic activities take place; they are complex spatial environments that must simultaneously support users’ physical, social, and psychological needs [1]. Beyond their educational and research functions, campuses include facilities for recreation, accommodation, sports, and social interaction, all of which play a significant role in shaping users’ spatial experiences [1,2]. Despite this, studies that systematically examine how spatial organization relates to user experience—particularly those integrating both quantitative and qualitative approaches—remain limited [3]. Existing research has discussed spatial organization as being associated with patterns of mobility, wayfinding, accessibility, social interaction, and spatial perception [4].
In the literature, university campuses are typically categorized into five spatial typologies:
- Urban-integrated campuses (e.g., Sorbonne, New York University), which merge with the surrounding urban fabric;
- Centralized campuses (e.g., Harvard, Oxford), which cluster academic and social functions around a core;
- Linear campuses (e.g., MIT), organized along a primary circulation axis;
- Dispersed campuses (e.g., University of London, University of California), composed of spatially separated units; and
- Cluster campuses (e.g., Stanford, Bilkent), structured around discipline-based clusters [5].
These typologies have been associated with variations in accessibility, wayfinding, social interaction, and spatial perception [6]. Previous studies have reported relationships between spatial structures and patterns of social interaction and walkability, while fragmented or peripheral layouts are frequently linked to reduced spatial legibility and weaker social engagement [7,8]. Environmental cues such as signage, landscape elements, and spatial layout further contribute to the formation of mental maps and wayfinding strategies [6]. Similarly, locating functional units within walkable distances has been reported as supporting campus usability and socially sustainable mobility patterns [9,10,11].
Sustainability-oriented campus design increasingly emphasizes spatial attributes such as access to green spaces, restorative environmental quality, energy-efficient building configurations, and walkable pedestrian routes [9]. Well-designed green and open spaces are associated with psychological well-being and user satisfaction [9,10,11,12], whereas sustainability indicators—including land-use efficiency, environmental comfort, and active mobility—form central components of contemporary campus planning [13]. For these strategies to be effective, interactions between spatial configuration and user experience must be understood not only at the physical level but also through cognitive, social, and perceptual dimensions [3,4,5,6,7,8,9,10,11,12,13,14].
In this context, integrating spatial analysis tools with user-oriented data is essential for understanding how individuals perceive, navigate, and interact with campus environments. However, studies evaluating spatial organization through such a holistic lens remain limited. This study addresses this gap by examining associations between spatial organization, accessibility, wayfinding, and user experience within an integrated framework that combines Space Syntax, VGA, and empirical user data.
Based on this aim, the research addresses the following questions:
- How is spatial organization related to user experience?
- How are spatial accessibility and wayfinding features associated with users’ spatial perception?
- Does the Space Syntax method provide meaningful insight into spatial accessibility patterns?
- Is there a significant relationship between user experience and Space Syntax analyses?
- Can university campus layouts be evaluated for potential improvement through spatial reconfiguration?
Based on these questions, the following relational hypotheses were formulated:
H1: Campus spatial organization is associated with variations in users’ spatial perception.
H2: Consistent with patterns reported in previous research, higher integration values were expected to be associated with higher levels of user satisfaction.
H3: Spaces with low connectivity were expected to be less positively evaluated by users.
H4: Improvements in spatial organization were anticipated to be associated with increased wayfinding clarity and greater spatial satisfaction.
These hypotheses were designed to examine relationships between Space Syntax metrics, accessibility, wayfinding, and social interaction [4,5,6,7,8,9,10,11,12,13,14,15]. Integrating these datasets enables spatial organization to be considered simultaneously as a measurable system and as a human-centered experience, offering a more comprehensive analytical approach to understanding campus environments.
1.1. Literature Review
Studies on spatial organization are generally approached through two major perspectives: analytical–structural methods and user-oriented frameworks. Analytical–structural approaches investigate the systematic properties of spatial environments using tools such as modular design, spatial geometry, and mathematical configuration [16,17]. In contrast, user-oriented research focuses on subjective dimensions, including spatial perception, environmental cognition, user experience, and human–environment interaction. Early studies examined how cognitive and perceptual processes influence individuals’ understanding of space [18,19,20], while subsequent research reported associations between cognitive mapping, accessibility, and mobility patterns [21]. Additional work has highlighted relationships between spatial organization and patterns of function, form, creative performance, and movement behavior [22,23]. Several studies further suggest that variations in spatial configuration are linked to differences in navigation, social interaction, and sustainability-related outcomes—particularly walkability and mobility efficiency [24,25]. Visibility has also been recognized as a key factor associated with wayfinding performance and spatial legibility [26].
A substantial body of literature examining relationships between spatial configuration and user experience relies on the Space Syntax methodology. Foundational studies demonstrated that spatial configuration corresponds with social relations, movement patterns, and spatial cognition [27]. More recent research has shown that Space Syntax metrics are effective for evaluating accessibility, pedestrian flows, spatial integration, and visibility fields in built environments [27,28]. Collectively, these studies indicate that syntactic properties such as integration and connectivity are strongly correlated with patterns of user mobility and spatial experience [29]. Additional studies have explored the use of Space Syntax in digital and multi-agent simulation environments, demonstrating its relevance for evidence-based design and post-occupancy evaluation in complex indoor settings, particularly in hospital environments [30,31,32]. Research on healthcare facilities has similarly reported associations between wayfinding performance, spatial organization, and levels of accessibility [33,34,35].
Within educational environments—and particularly in university campuses—Space Syntax research has contributed to understanding spatial–behavioral relationships. Several studies have shown that spatial configuration is associated with variations in students’ and academics’ mobility patterns, wayfinding strategies, and social interaction zones [36,37,38]. In campus design, Space Syntax supports data-informed assessment by identifying spatial constraints and potential movement tendencies. Other studies have examined the functional and formal characteristics of campus layouts in relation to their spatial organization [37,38], while further research has explored associations between spatial accessibility, perceptual tendencies, and navigation behavior [3,4,5,6,7,8,9,10,11,12,13,14,15,16,17,18,19,20,21,22,23,24,25,26,27,28,29,30,31,32,33,34,35,36,37,38,39,40]. Previous work has also highlighted the importance of addressing poorly connected spaces, as such areas are often associated with reduced walkability and weakened sustainable mobility [39,40]. Evidence additionally suggests that wayfinding behavior differs between multi-story and single-level buildings, underscoring the complex relationship between spatial cognition and vertical circulation [41,42].
Overall, existing literature approaches spatial organization through both systematic and user-centered perspectives [42,43]. However, methodological studies that integrate Space Syntax metrics with user experience data remain limited [28,29,30,31,32,33,34,35,36,37,38,39]. Three major components typically appear in these interdisciplinary studies:
- comparing these datasets to examine perceptual and functional dimensions of spatial organization [48].
Within the context of sustainability, recent studies emphasize that spatial configuration is associated with walkability, social interaction, mobility efficiency, and overall spatial comfort—key indicators for sustainable campus environments [24,25,26,27,28,29,30,31,32,33,34,35,36,37,38,39,40,41,42,43,44,45,46,47,48,49]. Meta-analyses further indicate that spatial integration and connectivity metrics correspond with campus walkability and low-carbon mobility patterns [49,50,51]. Accordingly, integrating user perceptions with analytical spatial metrics provides a more comprehensive basis for understanding how built environments perform from spatial and environmental sustainability perspectives [52].
In line with this, the present study addresses a critical gap by integrating Space Syntax analyses with user-experience data within a comparative and multidisciplinary framework. By combining human-centered insights with quantitative spatial analyses, the study evaluates spatial organization as both a measurable system and an experiential environment, offering a conceptual basis primarily applicable to university campuses, with potential relevance for exploratory work in broader urban contexts.
2. Materials and Methods
This research employed a mixed-methods design to examine associations between spatial organization and user experience within a university campus. Integrating quantitative and qualitative approaches allowed for the simultaneous consideration of spatial configuration and users’ perceptual, behavioral, and sustainability-related evaluations.
(1) Research questions and spatial data documentation
Research questions were formulated based on gaps identified in the literature regarding spatial configuration, accessibility, wayfinding, and perceived environmental quality. Spatial data—including building footprints, pathways, open spaces, and circulation networks—were documented through on-site observations, GIS-based mapping, and photographic records.
(2) Survey data collection and field observations
A structured questionnaire was administered in both online and face-to-face formats. The survey collected demographic characteristics and user perceptions related to accessibility, wayfinding, spatial satisfaction, environmental comfort, safety, and sustainability awareness. Field observations were conducted to document pedestrian movement tendencies, spatial barriers, visibility characteristics, and environmental comfort conditions.
Sampling frame and response characteristics
Participants were approached through simple random sampling within the accessible campus population. However, because of the mixed distribution method (online and face-to-face), a practical sampling frame was defined as students, academic staff, and administrative personnel present on campus or reachable through institutional communication channels during the data-collection period.
No stratification or quota procedures were applied. The final sample reflects voluntary participation, and invalid questionnaires were excluded based on predefined criteria (e.g., missing more than 20% of mandatory items, patterned responses, contradictory answers).
These factors introduce potential forms of sampling bias, which should be considered when evaluating the generalizability of the findings.
(3) Spatial analysis using Space Syntax techniques
Spatial configuration was analyzed using DepthmapX 0.50. Axial and segment-based analyses were performed to compute Integration, Connectivity, Choice (betweenness), Mean Depth, Line Length, and Control values. Visibility Graph Analysis (VGA) was carried out using a 2 m grid resolution and an eye height of 1.6 m, with both global (Rn) and local (R3) radii.
Justification of parameter and processing choices
The selected parameters reflect established practice in campus-scale Space Syntax research.
- A 2 m VGA grid provides a balance between computational efficiency and pedestrian-scale visibility.
- An eye height of 1.6 m represents the average adult visual horizon used widely in syntax studies.
Spatial data were processed in WGS84/UTM Zone 35N, and building footprints and pathways were topologically cleaned prior to analysis.
Vegetation handling:
Seasonal vegetation (trees, shrubs, foliage) was excluded from obstruction modeling to avoid short-term variability; only built structures were treated as occluding elements, consistent with outdoor VGA conventions. This decision follows common campus-scale visibility research, where vegetation is excluded because its occlusion properties vary seasonally and do not represent long-term structural barriers.
High-resolution satellite imagery (Google Earth, 2024; approx. 0.5–1.0 m resolution) was used to generate the VGA layer. The acquisition date and season were checked to ensure minimal interference from temporary foliage. Only permanent built structures were retained as visibility obstacles. Sensitivity tests with 1 m and 3 m grids yielded stable spatial hierarchies, supporting the robustness of selected parameters.
Visibility analysis was extended southward only to the main vehicular corridor forming the functional campus boundary. Areas beyond this threshold were excluded because they fall outside pedestrian-accessible zones. As a result, the visibility findings and center–periphery distinctions reflect only pedestrian-accessible campus spaces.
Normalization and metric scaling
All Space Syntax metrics were normalized following standard syntactic conventions:
- Integration values were normalized using RRA (Real Relative Asymmetry).
- Connectivity values represent raw counts of directly connected segments.
- Choice values were normalized using the standard DepthmapX choice formula.
- Mean Depth and Control values reflect DepthmapX-normalized outputs.
Metric ranges (e.g., Integration ≈ 0.50–1.60; Connectivity ≈ 1–14; Choice ≈ 0–1 normalized) are provided in Table 1 and Table 5 to support interpretability. Building-level integration values in Table 5a correspond to RRA-normalized global integration metrics.
Importantly, spatial indicators represent campus-level configurational characteristics and were not matched to individual participants’ exact locations or movement paths. Thus, syntactic metrics capture environmental structure, not person-level spatial exposure.
(4) Qualitative analysis of open-ended responses
Open-ended responses were analyzed using an inductive qualitative content analysis approach.
Two independent coders conducted open coding to identify recurring concepts related to accessibility, wayfinding, environmental comfort, social spaces, and sustainability. The coding framework was refined through axial coding until thematic categories were established.
Intercoder reliability was assessed using Cohen’s Kappa (κ = 0.82), indicating strong agreement.
Discrepancies were resolved through discussion. Codes were then applied to the full dataset.
Frequency summaries and representative excerpts were used to describe key themes, with qualitative interpretations treated as descriptive support, not quantifiable effects.
(5) Statistical analysis integrating user-based and spatial metrics
Survey data were analyzed using descriptive statistics, Pearson correlations, and multiple linear regressions to examine associations between user perceptions and spatial conditions. Diagnostic checks were conducted for normality, heteroscedasticity, and multicollinearity.
Open-ended responses were analyzed using descriptive content analysis to identify recurring themes related to accessibility, environmental quality, and sustainability awareness.
Regression diagnostics included:
- residual normality (Shapiro–Wilk test, Q–Q plots),
- heteroscedasticity (Breusch–Pagan, White tests),
- multicollinearity (Variance Inflation Factors, tolerance, condition indices),
- influence diagnostics (Cook’s distance, leverage, standardized residuals).
No severe violations were detected, allowing regression results to be interpreted within acceptable diagnostic thresholds.
Missing data handling
The dataset was screened for missing values.
Cases with more than 10% missing responses were excluded.
Item-level missingness remained below 3% for all variables.
Little’s MCAR test indicated no systematic missingness (p > 0.05).
Thus, listwise deletion was used. Sensitivity checks with pairwise deletion produced almost identical coefficient directions and significance patterns, suggesting missing-data handling did not materially affect results.
No correction for multiple comparisons was applied. Therefore, p-values in the 0.05–0.10 range are interpreted cautiously and not treated as evidence of significance.
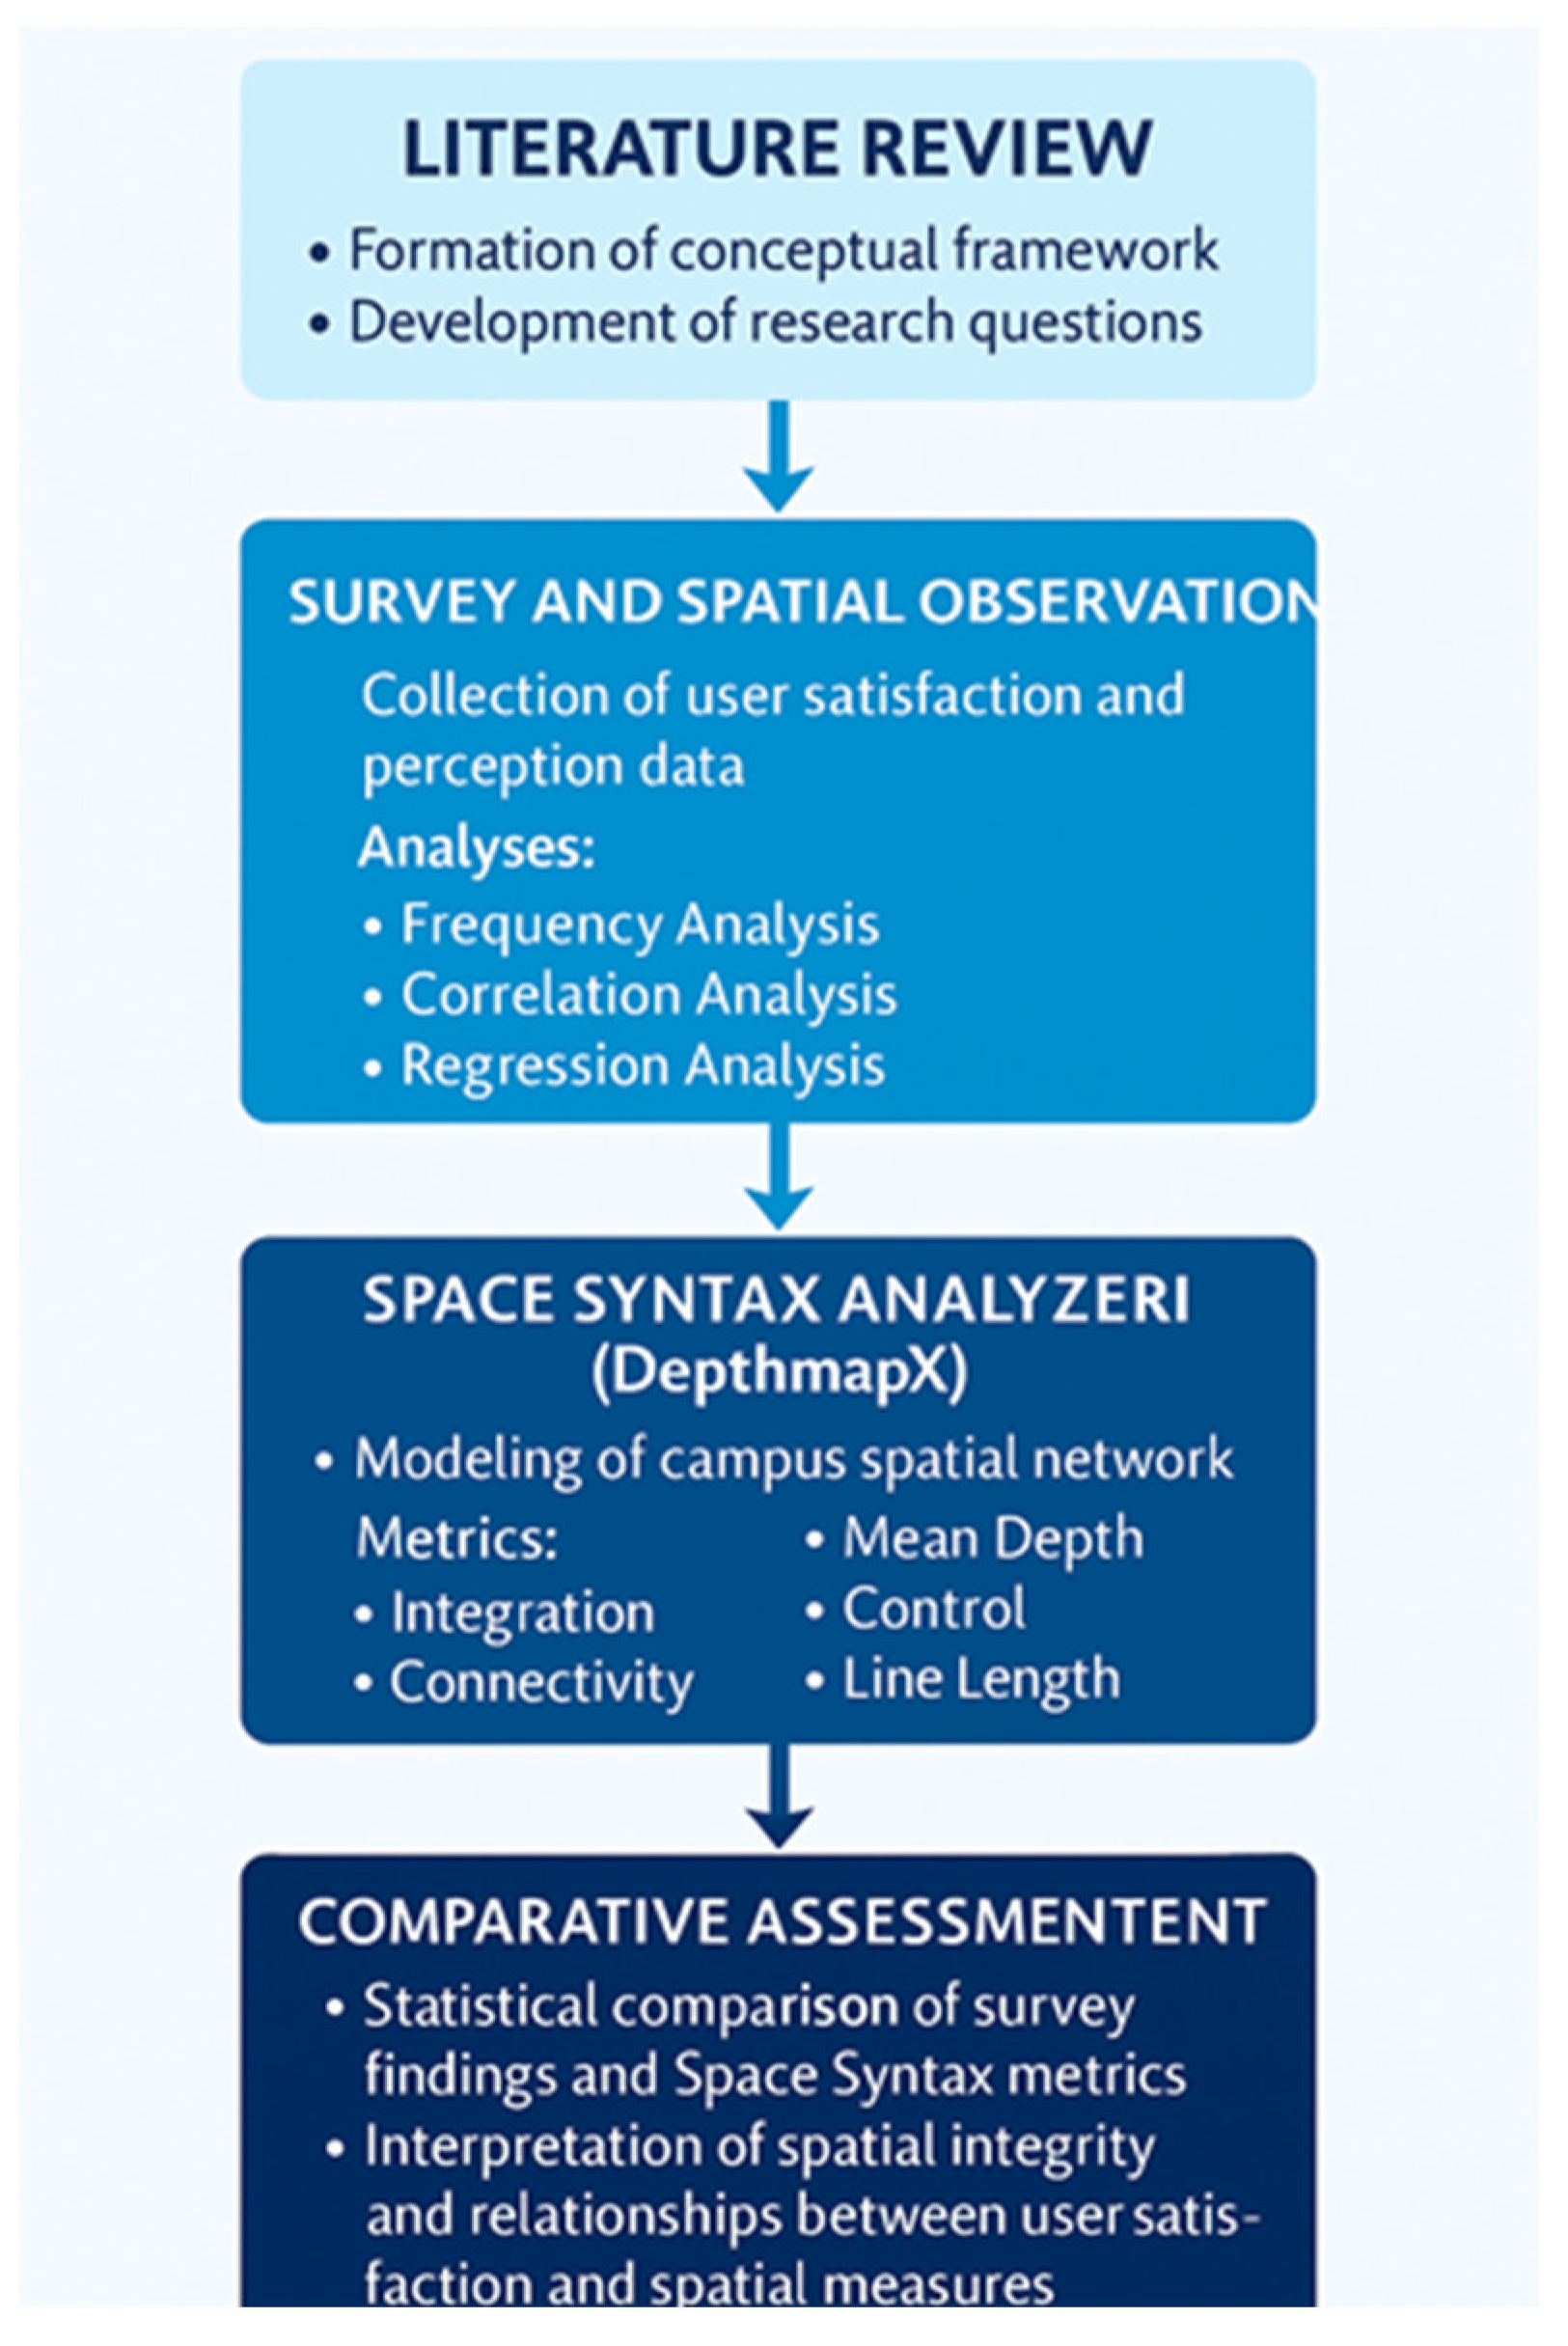
Figure 1.
Schematic representation of research stages.
2.1. Study Area: Trakya University Balkan Campus
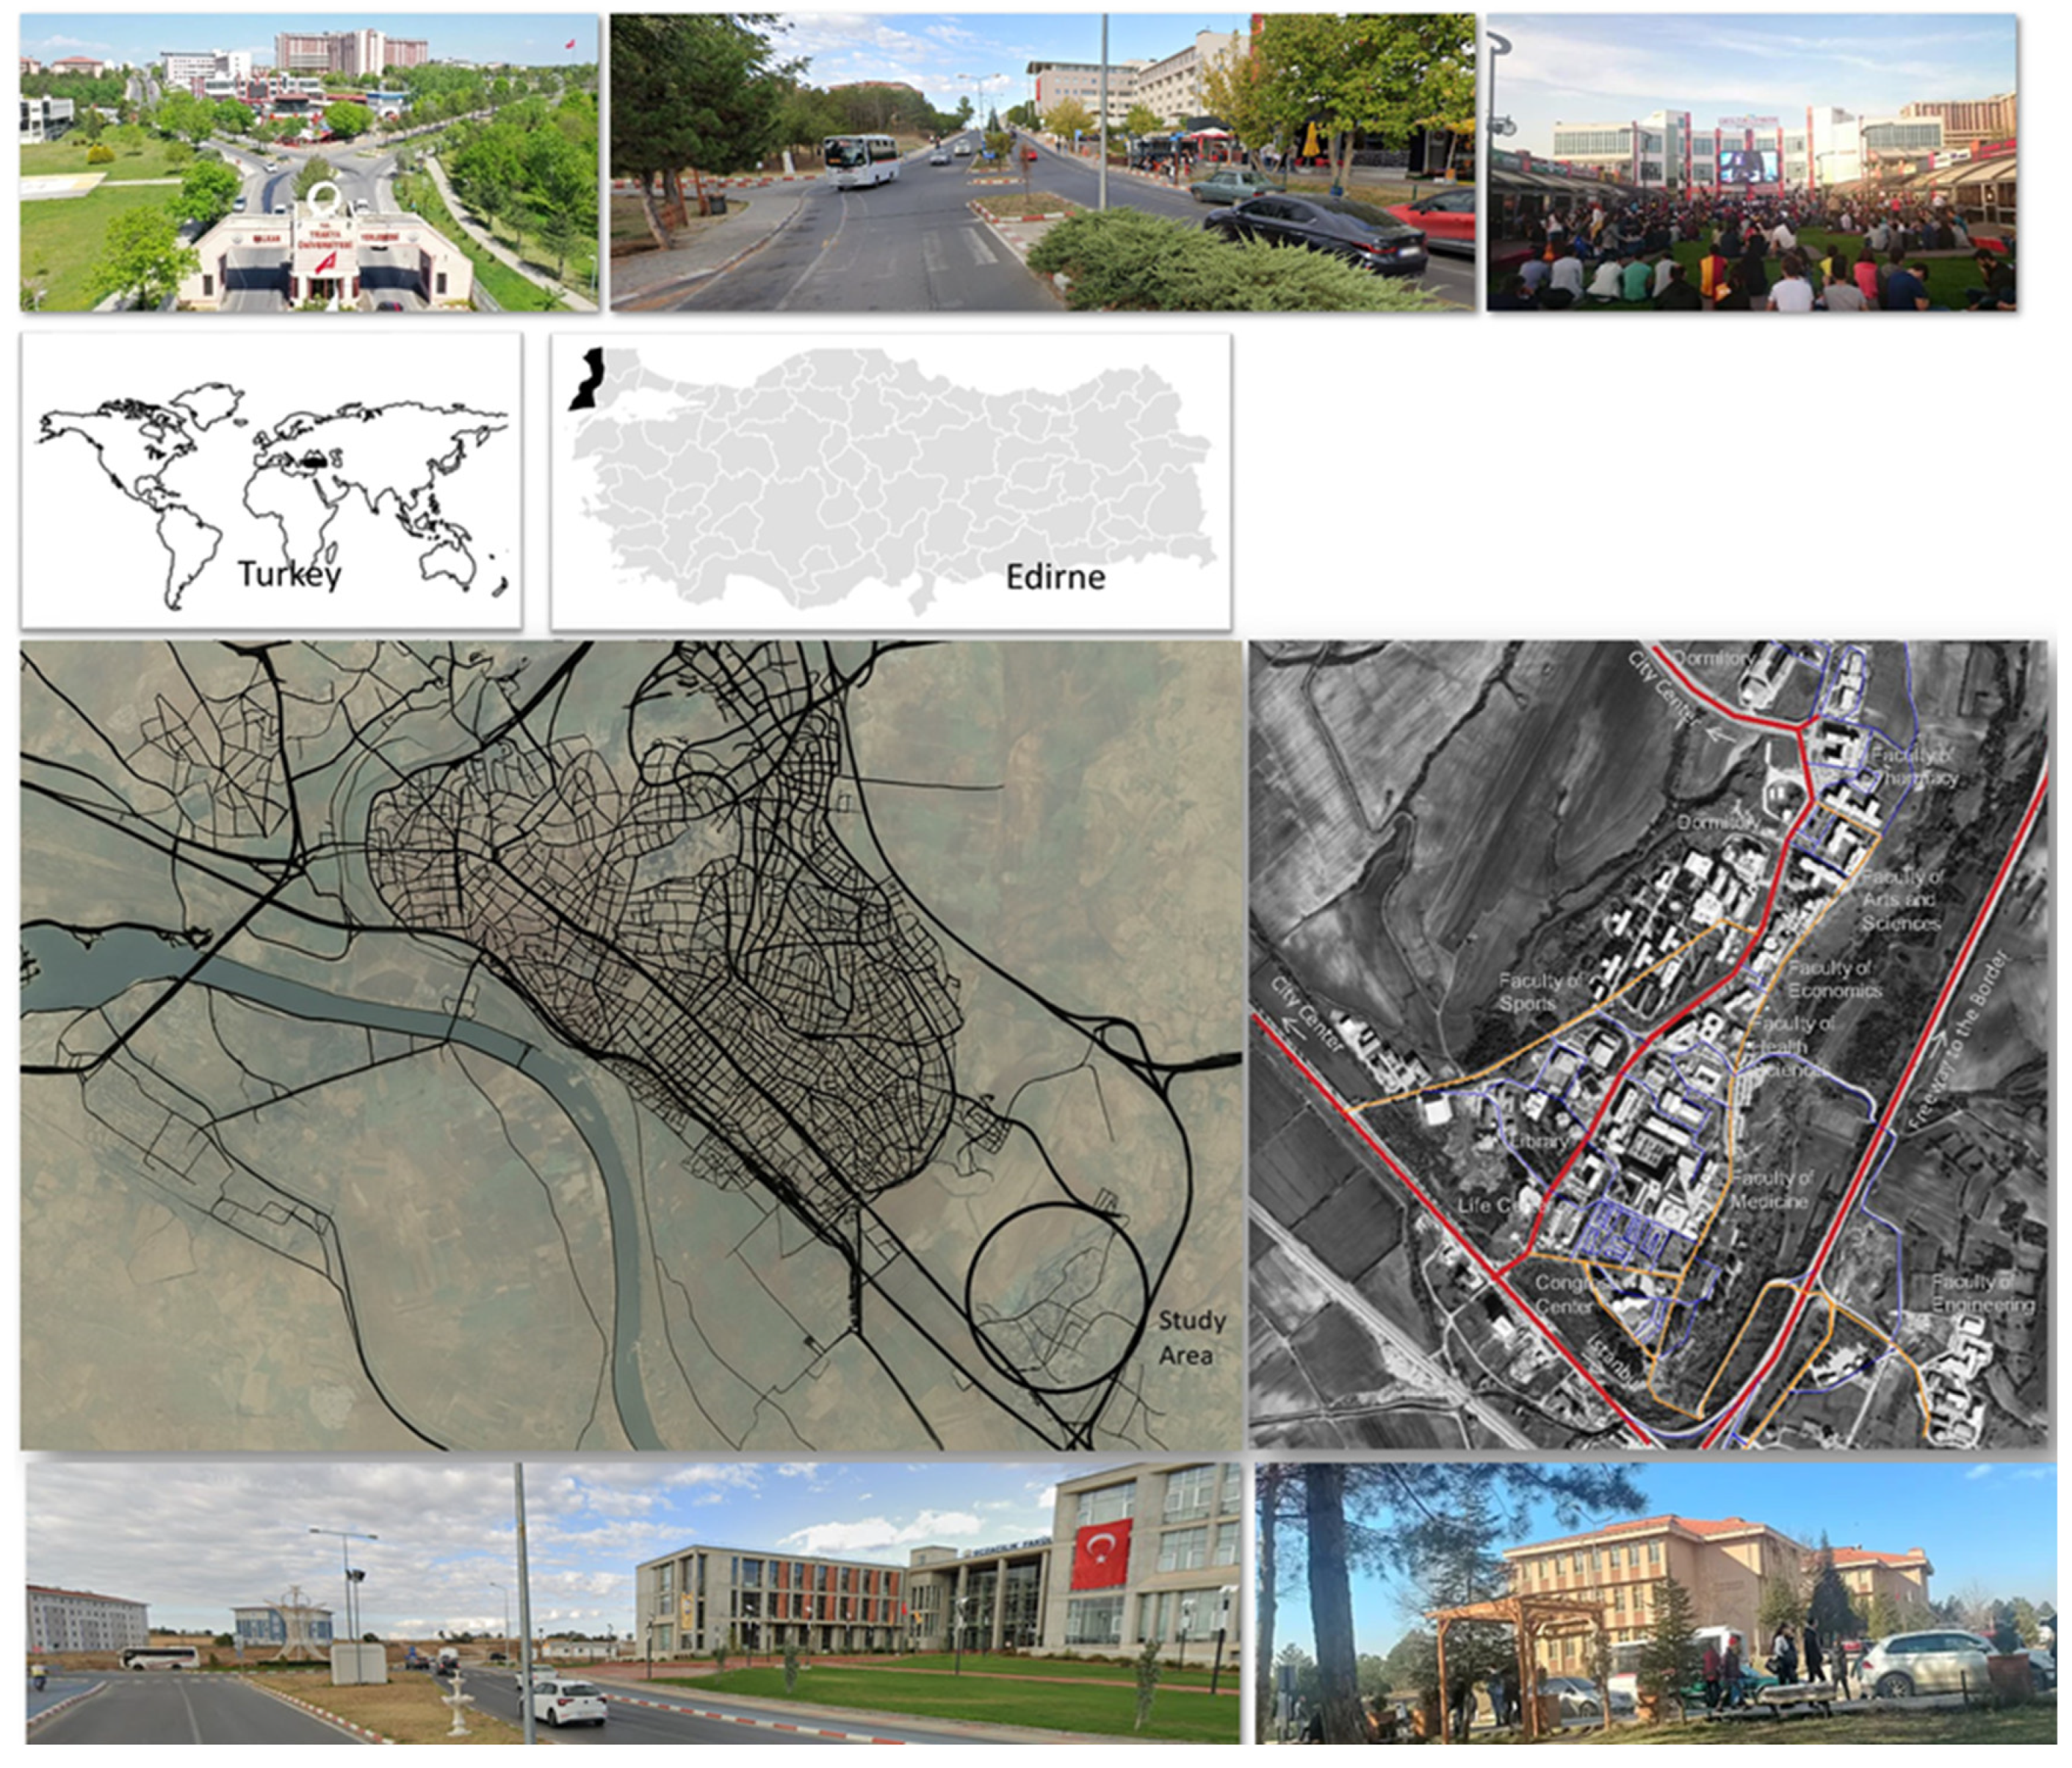
The study was conducted on the Balkan Campus of Trakya University, located in Edirne, Türkiye. Covering approximately 221.5 hectares, it is the university’s largest and most functionally diverse campus. It hosts 14 faculties, 1 conservatory, 5 institutes, 4 schools, 10 vocational schools, and a variety of social and administrative facilities [53]. Buildings constructed over different periods since the 1970s have produced a spatial structure that appears fragmented in several areas, where discontinuities between buildings, interrupted pedestrian axes, limited social interaction zones, and various wayfinding challenges are observed. Although scattered green areas support student well-being, landscape and open-space arrangements lack overall cohesion and do not fully reflect a unified sustainability-oriented planning strategy. While the library, dining halls, and social facilities function as major activity nodes, some faculty zones display patterns of social isolation, potentially related to limited gathering spaces and reduced spatial legibility.
The campus accommodates approximately 35,000 students, 2,500 academic and administrative staff, and numerous daily visitors, representing diverse demographic and experiential profiles. Although the campus is accessible via public transportation and private vehicles, discontinuous pedestrian routes, insufficient signage, and remote parking areas have been associated with reduced accessibility and challenges for sustainable mobility. As outlined in the TR21 Regional Development Plan, the Balkan Campus is identified as a priority area where improvements in functional integration, pedestrian continuity, and environmentally sustainable spatial planning are recommended [54]. These characteristics position the campus as an appropriate case for examining user-centered parameters such as accessibility, wayfinding, environmental comfort, social interaction, and spatial satisfaction [55].
Figure 2.
Urban location of Trakya University Balkan Campus, satellite view, and distribution of existing buildings.
Figure 2.
Urban location of Trakya University Balkan Campus, satellite view, and distribution of existing buildings.
2.2. Data Collection
A structured questionnaire was administered between March and May 2025 using both face-to-face and online formats. Participants were invited through simple random selection from the institutional registry; however, the final sample reflects voluntary participation rather than a fully representative stratified sample. To reduce possible selection bias associated with the mixed distribution method (online + in-person), individuals were randomly contacted through institutional e-mails and approached at multiple on-campus locations. Because the study employed a cross-sectional, non-experimental design, no causal inference was attempted; all analytical interpretations focus on associations rather than cause–effect relationships.
The survey included sections on demographics, wayfinding, accessibility, spatial satisfaction, social interaction, safety, environmental comfort, and sustainability-related perceptions. It consisted of multiple-choice, open-ended, and 5-point Likert-type items. A pilot study with 50 participants yielded a Cronbach’s Alpha of 0.85, demonstrating strong internal consistency.
Scale reliability and construct validity
For the full sample, Cronbach’s Alpha values for all multi-item perception scales ranged from 0.78 to 0.88, indicating acceptable to good internal consistency across accessibility, wayfinding, spatial satisfaction, environmental comfort, safety, and sustainability awareness. Exploratory Factor Analysis (EFA) was conducted using principal axis factoring with oblimin rotation, and all retained items loaded above 0.40 without substantial cross-loadings. Because predefined latent constructs were not employed, confirmatory factor analysis (CFA) was not performed. Key questionnaire items and factor loading summaries are provided in Supplementary Table X to support transparency and construct-validity assessment. Following the pilot, three items were refined for clarity. Ethical approval was obtained from the Trakya University Ethics Committee (Approval No: 2025.03.19).
Spatial data were collected through field observations, photography, and digital mapping. Analyses were carried out using DepthmapX 0.50, applying axial/segment analyses and Visibility Graph Analysis (VGA). The VGA grid size (2 m) and eye height (1.6 m) were selected based on established syntactic research on outdoor campus environments and to balance resolution with computational efficiency. Global (Rn) and local (R3) radii were used to compute Integration, Connectivity, Choice (betweenness), Control, Mean Depth, and Line Length. These spatial metrics were used to describe configurational patterns related to potential movement tendencies discussed in the literature.
2.3. Statistical Analysis
Survey data were analyzed using SPSS 27.0. Descriptive statistics (frequency, mean, standard deviation) were computed, and Pearson correlations were used to examine associations between spatial integration and wayfinding-related perceptions. Multiple linear regression analyses were conducted to identify predictors of user satisfaction, including accessibility, environmental comfort, and sustainability-related perceptions. All regression results were interpreted as correlational rather than causal due to the cross-sectional nature of the dataset.
Model diagnostics were performed to ensure analytical validity. Residual normality was assessed using Q–Q plots and the Shapiro–Wilk test; homoscedasticity was examined through residual–fitted value plots and the Breusch–Pagan test; and multicollinearity was evaluated using Variance Inflation Factors (VIFs), all of which remained within acceptable thresholds (VIF < 3). Model robustness was further supported by ANOVA-F statistics and Durbin–Watson values. Open-ended responses were analyzed through descriptive content analysis. A two-stage coding procedure was employed in which two independent coders developed the coding framework; intercoder reliability, assessed using Cohen’s Kappa (κ = 0.81), indicated strong agreement.
Because the Space Syntax methodology does not incorporate material, environmental, or socio-psychological variables, its limitations were addressed by triangulating syntactic indicators with survey responses and qualitative observations. This integrative approach enhanced the ecological and perceptual validity of the study and aligned the methodological framework with contemporary sustainability-oriented campus research [50].
3. Results
This section presents the combined findings of the Space Syntax analyses—including Integration, Connectivity, Choice, Mean Depth, Line Length, Control, and VGA—and the user survey results. Evaluating these datasets simultaneously provides an integrated framework for interpreting spatial patterns, accessibility conditions, and visibility structures across the Balkan Campus, along with their associations with reported wayfinding, accessibility, spatial satisfaction, and sustainability-related perceptions.
3.1. Spatial Integration Analysis
The axial and segment-based Space Syntax analyses revealed a clearly differentiated spatial hierarchy across the Balkan Campus, shaped by both its historical development pattern and its current circulation structure. Global Integration (Rn) values were concentrated along the central north–south spine connecting the Rectorate, Library, and the main pedestrian boulevard (Figure 3a). These segments appeared as the most accessible and permeable within the syntactic representation, reflecting structural properties of the model rather than observed user movement.
In contrast, peripheral faculties—particularly the Engineering Faculty, Pharmacy Faculty, and the dormitory clusters—displayed markedly lower integration values (Figure 3a), indicating less central positions within the overall configuration and reduced syntactic accessibility. Connectivity results paralleled these patterns: highly connected segments were situated around central academic and administrative buildings (Figure 3b), whereas peripheral buildings occupied visually and functionally more isolated locations in the spatial system.
The uneven distribution of intersecting pathways observed in the connectivity map suggests varying levels of potential pedestrian movement and structural continuity across the campus, rather than a uniform pattern. Local Integration (R3) values further underscored this differentiation, with dense clusters appearing around central facilities and shallower relational depth toward peripheral units. Collectively, these syntactic patterns indicate a spatial structure in which core areas exhibit higher configurational centrality, while peripheral zones show lower levels of spatial integration and reduced network coherence.
Figure 3.
a-b. Integration and Connectivity maps of Balkan campus: (a) Integration, (b) Connectivity. Note: Red tones indicate higher metric values, while blue tones represent lower values. The Rectorate area exhibits the highest values within the campus network, whereas the dormitory clusters and the Engineering Faculty correspond to zones with consistently lower values.
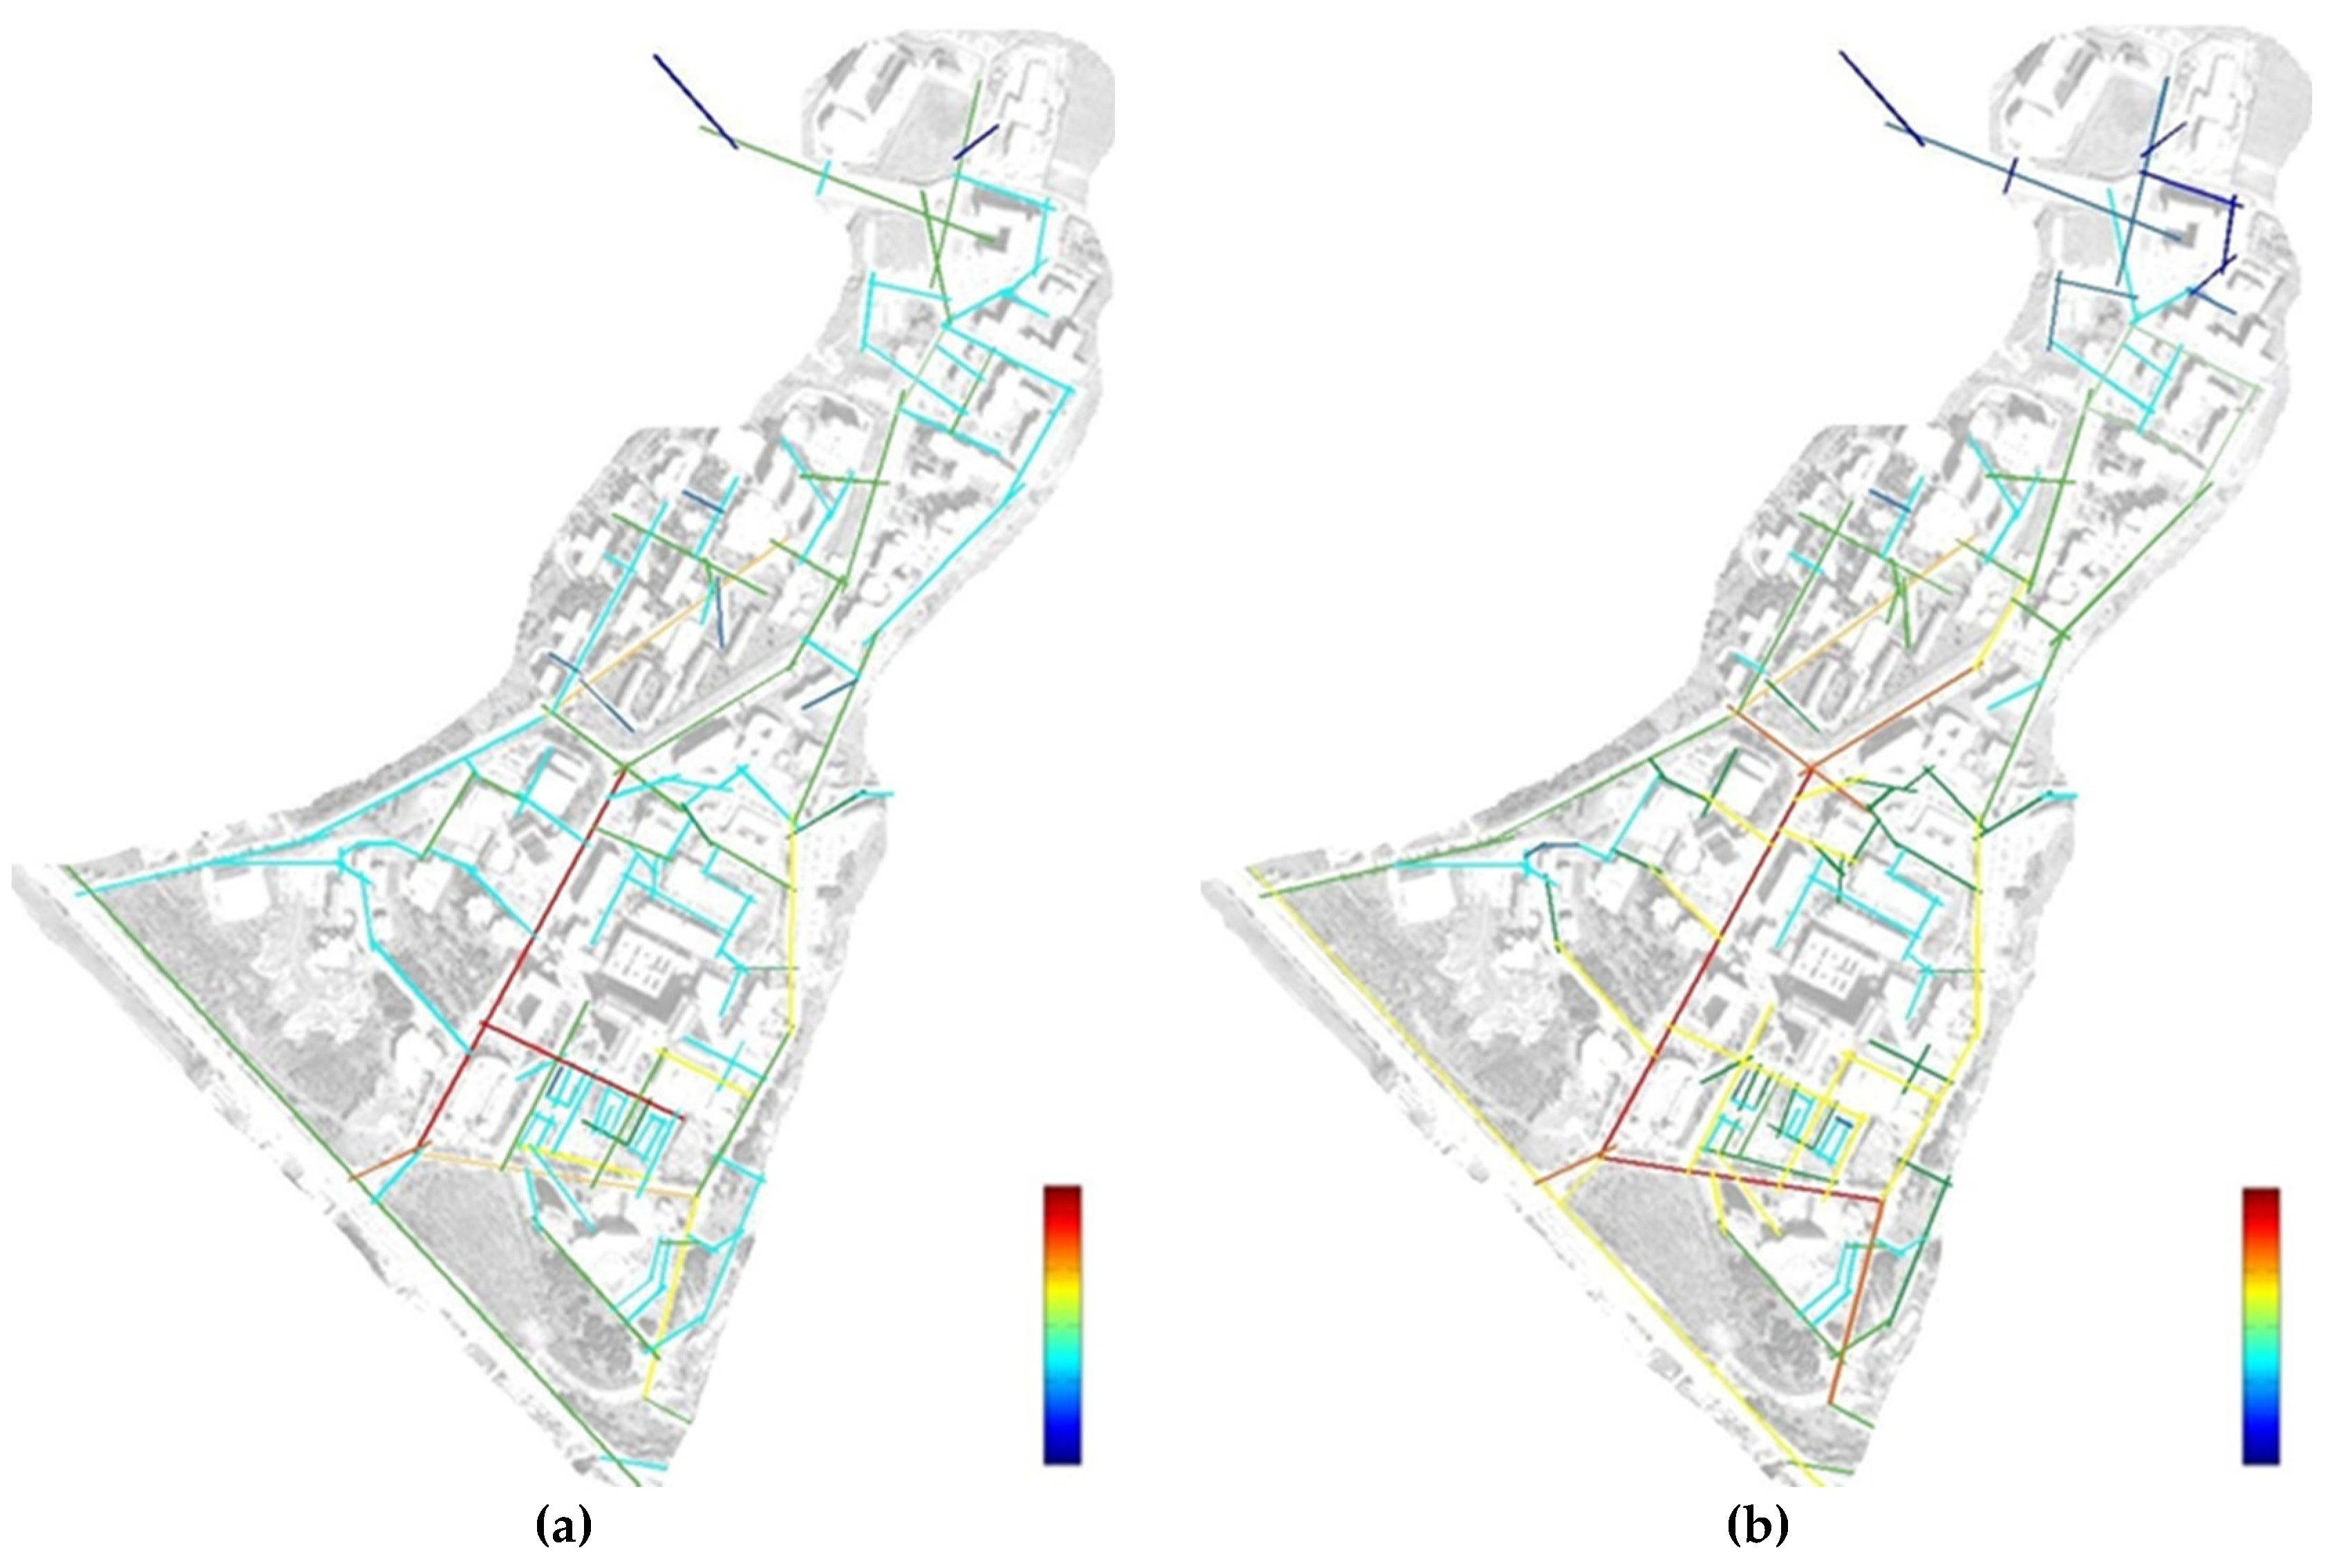
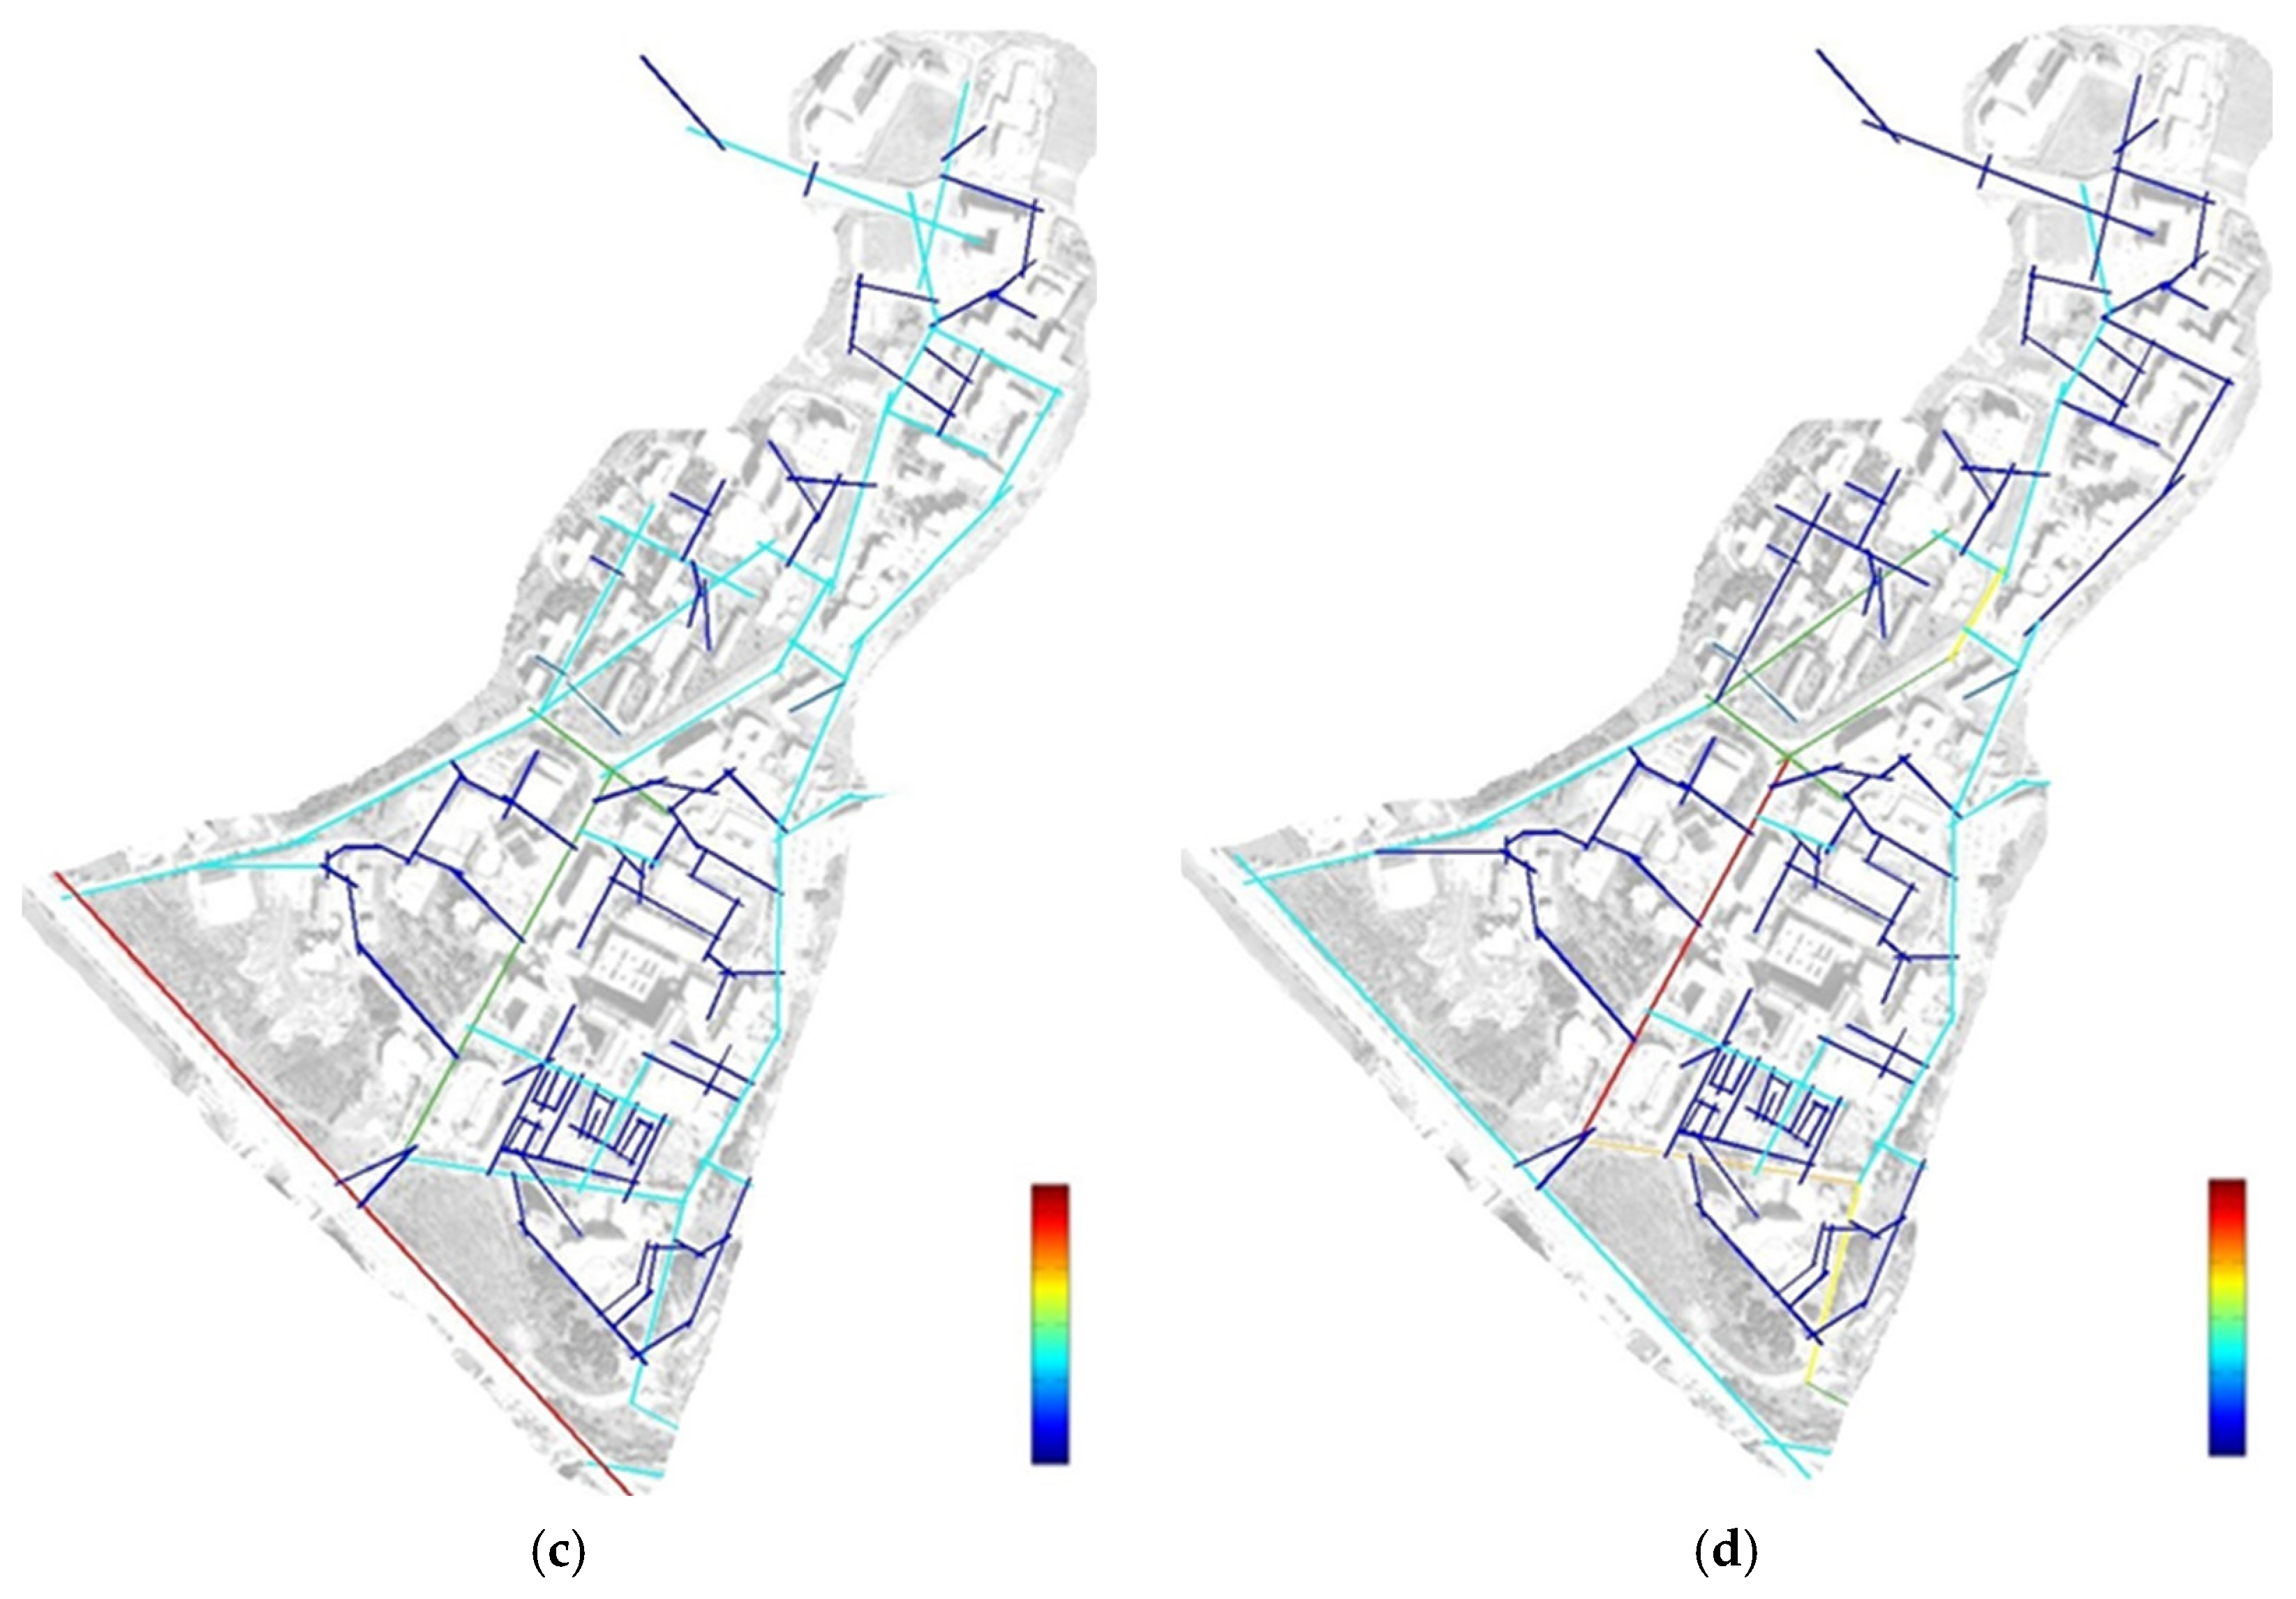
Choice (betweenness) values, presented in Figure 3c, showed that the central spine functions as the segment with the highest concentration of route alternatives within the campus network. Only a small subset of pathways exhibited high choice values, suggesting that potential route diversity is more limited outside the main campus core. Line Length variations shown in Figure 3d further illustrate discontinuities, particularly in peripheral areas where longer linear segments transition into narrower or visually constrained routes. These transitions occurred in zones that respondents also described as areas where navigation felt less clear, indicating a descriptive overlap rather than any directional or causal relationship. Rather than implying direct effects, these syntactic patterns and user-reported perceptions converge in identifying areas with comparatively lower spatial continuity and reduced visual openness.
Figure 3.
c–d. Choice and Line length maps of Balkan Campus: (c) Choice, (d) Line Length. Note: Yellow–red areas represent segments with higher centrality and greater syntactic accessibility, whereas blue tones indicate more peripheral zones with lower accessibility values.
Figure 3.
c–d. Choice and Line length maps of Balkan Campus: (c) Choice, (d) Line Length. Note: Yellow–red areas represent segments with higher centrality and greater syntactic accessibility, whereas blue tones indicate more peripheral zones with lower accessibility values.
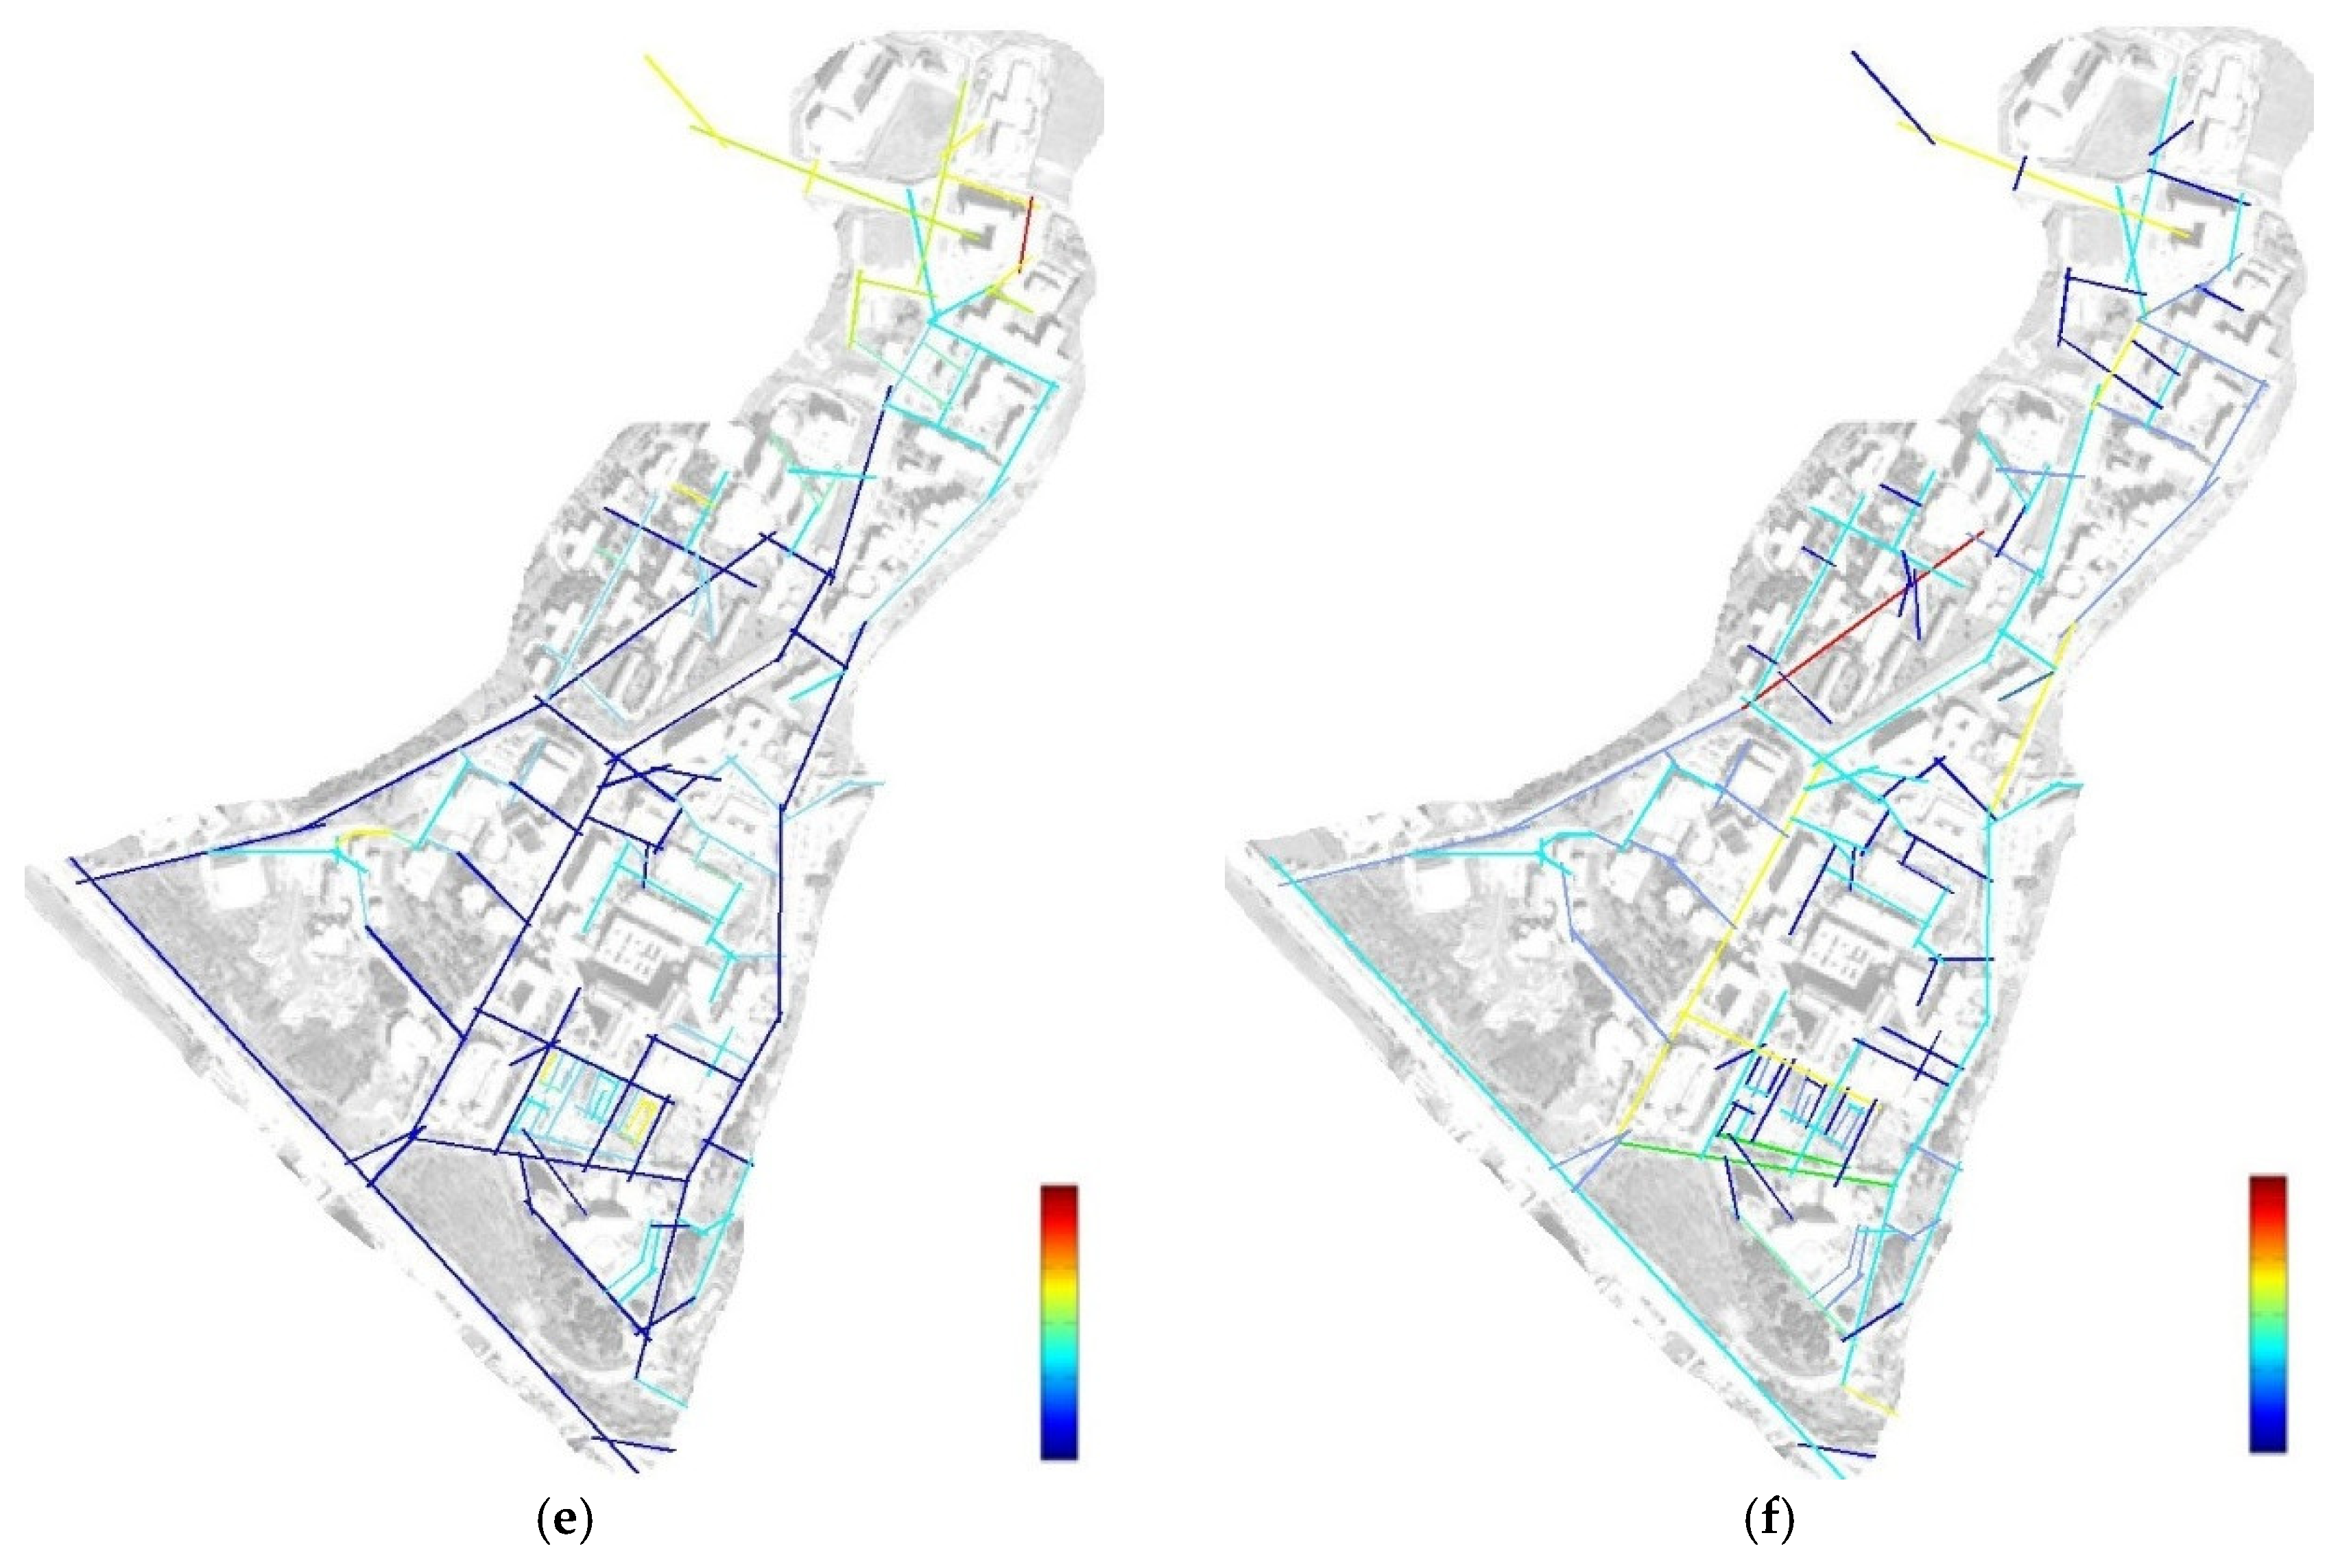
The Mean Depth metric, which represents the average number of steps required to reach a segment from all other segments, illustrates clear depth variations across the campus. As shown in Figure 3e, the lowest depth values (5/5) appear around the Rectorate and Library zone, corresponding to the most integrated areas in the syntactic model. In contrast, higher depth values (1–2/5) are concentrated along the northwestern axis, particularly around the Engineering Faculty, Pharmacy Faculty, and dormitory clusters. Although this metric does not directly indicate movement behavior, these depth patterns occurred in locations that respondents also described as more demanding to navigate, reflecting descriptive similarities rather than predictive relationships. From a sustainability perspective, depth differences are often discussed in relation to longer walking distances and less direct pedestrian routes—issues frequently noted in studies on mobility efficiency and equitable access in campus environments.
The Control metric evaluates the extent to which a segment influences route choices within its immediate surroundings. As illustrated in Figure 3f, the main north–south spine exhibits high control values, consistent with its central position in the configurational system. Peripheral roads show lower control values, indicating more limited local route alternatives. While these syntactic patterns do not, by themselves, determine user movement, they correspond with survey findings suggesting that central areas are perceived as more straightforward to navigate. In sustainability-oriented discussions, lower control values in peripheral areas relate to themes of spatial vitality, as such zones are often described in user feedback as less frequented or less connected. Within this interpretive framework, the spatial distribution of control values contributes insight into how different parts of the campus are experienced in terms of accessibility and perceived social activity.
Figure 3.
e-f. Mean depth and Control maps of Balkan Campus (e) Mean depth, (f) control. Note: High control values are represented in red tones, whereas low control values are shown in blue tones
Figure 3.
e-f. Mean depth and Control maps of Balkan Campus (e) Mean depth, (f) control. Note: High control values are represented in red tones, whereas low control values are shown in blue tones
Overall, the Mean Depth and Control analyses indicate a campus structure in which spatial accessibility and movement-related clarity vary across different areas. Rather than implying direct effects or prescriptive interventions, these syntactic patterns provide an interpretive basis for understanding how specific campus zones are positioned within the broader spatial system. In sustainability-oriented planning discussions, such patterns are often referenced when examining issues related to transversal connectivity, depth distribution, or the availability of local route options. Within this interpretive framework, the findings may serve as analytical inputs for broader evaluations of accessibility, mobility conditions, and spatial equity across the campus.
3.2. VGA (Visibility Graph Analysis)
The results of the Visibility Graph Analysis (VGA) indicate notable variations in visual accessibility across the Balkan Campus. As illustrated in Figure 4, the central pedestrian axis and its adjacent open spaces exhibit the highest visibility values (top 20–10%), forming wide visual fields within the syntactic model. These areas include the zones surrounding the Rectorate, Library, and the main pedestrian corridor, where open sightlines and broad spatial envelopes are present. In contrast, peripheral academic units—particularly those located toward the northern and northwestern edges of the campus—demonstrate substantially lower VGA scores. These segments appear in the VGA as areas with reduced visual connectivity, indicating narrower modeled sightlines.
These visibility patterns parallel user reports, showing locations where configurational and perceptual tendencies appear in similar campus zones, without implying any explanatory or causal relationship. The VGA results also show that segments with higher visual connectivity tend to align with the campus’s primary integration and connectivity structures, illustrating spatial correspondence among multiple syntactic measures. Conversely, low-visibility zones overlap with areas of higher mean depth and lower connectivity, indicating multiple layers of configurational disadvantage in these peripheral segments.
From a sustainability-oriented interpretive perspective, the VGA patterns relate to several themes frequently discussed in social, environmental, and mobility-focused planning literature:
- Social sustainability
High-visibility environments are often associated in the literature with perceptions of openness and social presence. In user responses, such areas were more frequently linked to feelings of clarity and comfort, whereas low-visibility zones were more commonly associated with uncertainty and reduced ease of navigation. While VGA does not generate behavioral predictions, these parallel patterns provide contextual insight into how different campus areas may be perceived socially.
- Environmental and mobility sustainability
Clear and continuous visual fields are frequently referenced in sustainable mobility research as conditions that may relate to perceived walking ease or route choice. In the present study, peripheral areas with lower VGA values corresponded with user reports describing more complex or less direct walking experiences. These associations do not indicate causation but illustrate how configurational visibility and perceptual responses intersect within mobility-focused sustainability discussions.
- Design resilience and long-term campus planning
VGA results highlight spatial zones where visual continuity is limited, which may be relevant when evaluating long-term design flexibility or adaptability in campus planning. Peripheral areas with restricted visibility correspond to places users described as less central or less connected. Within planning frameworks, such patterns may serve as analytical inputs when considering strategies related to spatial coherence, the usability of circulation networks, or design resilience.
Taken together, the VGA findings demonstrate that visual accessibility varies considerably across the campus and aligns with several patterns identified in the integration, connectivity, and depth analyses. Although VGA does not determine behavioral or sustainability outcomes directly, the identified visibility structures provide an interpretive basis for understanding user experiences and for informing broader discussions about environmental comfort, perceived safety, spatial cohesion, and campus-scale sustainability.
The distribution of Space Syntax metrics for specific buildings is presented in Table 1, while their comparative spatial patterns are illustrated in Figure 5. The heatmap reveals a pronounced core–periphery distinction in integration, connectivity, and visibility. These spatial patterns correspond with user-reported differences in perceived accessibility, safety, and spatial satisfaction, as respondents more frequently associated central areas with greater ease of movement and peripheral areas with various navigational challenges. Central areas with higher syntactic values overlap with zones identified in user responses as more socially active or frequently used, whereas peripheral areas exhibit higher depth, lower connectivity, and reduced visual integration. Within sustainability-oriented planning discussions, such spatial contrasts are often referenced when examining variations in mobility conditions and perceived accessibility across campus environments.
Overall, the findings indicate that the spatial configuration of the Balkan Campus exhibits notable variations in accessibility, visibility, and configurational centrality. These patterns correspond with user-reported differences in perceived accessibility, safety, wayfinding clarity, and mobility experiences across different campus zones. Within this framework, distinctions between central and peripheral areas can be interpreted as spatial conditions that align with how various parts of the campus are perceived or used. Sustainability-focused planning literature frequently references such contrasts when evaluating mobility conditions, spatial equity, and campus cohesion.
The Space Syntax analyses further illustrate a spatial structure characterized by a pronounced center–periphery differentiation. High Integration, Connectivity, and Choice values clustered around the Rectorate, Library, and the main circulation spine correspond with areas users identified as more socially active or frequently visited. Peripheral zones—including the Engineering and Pharmacy Faculties and the dormitory clusters—exhibit lower Integration and Connectivity values and fewer route alternatives. These configurational tendencies align with user reports describing these areas as less legible or less central in everyday movement.
Control and Choice analyses show that segments along the main spine occupy structurally prominent positions within the circulation network. User feedback describing these areas as busy or highly frequented parallels this syntactic prominence. The VGA results add another dimension of spatial differentiation: visually open environments around the Rectorate and Library correspond with user-reported feelings of orientation and clarity, whereas peripheral zones characterized by narrower visual corridors align with reports of disorientation or reduced perceived safety.
Taken together, these configurational and perceptual patterns highlight spatial conditions that may be considered in broader planning and design discussions. Themes such as transversal connectivity, the distribution of open spaces, visual continuity, and wayfinding elements are frequently referenced in sustainability-oriented campus design literature when evaluating spatial coherence, perceived accessibility, or long-term adaptability. Within this interpretive context, the findings presented here can serve as analytical inputs for future assessments of campus structure, mobility experiences, and sustainability-related planning strategies.
3.2. User Survey Findings
The user survey, completed by 398 participants, provides an overview of how different campus users perceive accessibility, wayfinding, social interaction, and overall spatial experience on the Balkan Campus. As shown in Table 2, the sample includes individuals from a range of age groups, academic roles, and campus usage patterns. This diversity offers a broad perspective on user experience and supports the interpretation of perceptual differences across distinct campus zones, without implying any causal relationships between spatial configuration and user responses.
Participants reported varying levels of satisfaction with different aspects of the campus environment. Issues related to wayfinding difficulty, the availability of social spaces, and concerns about cleanliness and hygiene appeared frequently in the dataset. These areas of dissatisfaction correspond with the spatial contrasts identified in the syntactic analyses, particularly in peripheral zones characterized by higher depth values, lower connectivity, and reduced visibility. These parallels indicate that user perceptions and configurational patterns intersect in several parts of the campus, without implying direct causal relationships.
A multiple regression analysis was conducted to examine the associations between user-reported challenges and satisfaction with the spatial layout. The dependent variable was the 5-point Likert-scale item: “How satisfied are you with the layout of the buildings on campus?” The model was statistically significant (F(10, 387) = 4.728, p < 0.001) and accounted for 10.9% of the variance in satisfaction (R2 = 0.109, Adj. R2 = 0.086). Given the modest explanatory power of the model, the results should be interpreted as correlational rather than causal. As shown in Table 3, three variables exhibited statistically significant associations with lower satisfaction: availability of social spaces, wayfinding difficulty, and cleanliness/hygiene concerns:
Lack of social spaces (β = 0.340, p = 0.001)
Wayfinding difficulty (β = 0.463, p = 0.003)
Cleanliness and hygiene issues (β = 0.258, p = 0.021)
Although the model explains a modest proportion of variance, these statistically significant associations relate to thematic dimensions frequently discussed in sustainability-oriented research:
(1) Mobility-related considerations
User reports of wayfinding difficulty align with configurational tendencies observed in the Space Syntax and VGA analyses, particularly in areas with greater spatial depth or reduced visual continuity. This association does not imply directionality but highlights overlapping spatial and perceptual characteristics.
(2) Social sustainability considerations
Concerns about the availability of social spaces reflect user perceptions of opportunities for interaction, collaboration, and gathering across different campus zones.
(3) Environmental quality considerations
Cleanliness and hygiene issues relate to user perceptions of comfort and the physical quality of shared open spaces.
Variables related to transportation, parking, study spaces, dining, technological infrastructure, safety, and dormitory conditions were not statistically significant (p > 0.05). Within this dataset, these factors did not show strong associations with overall spatial satisfaction compared with the three variables noted above.

Table 3.
The Effect of Perceived Difficulties on Campus Satisfaction (Multiple Regression Analysis).
Table 3.
The Effect of Perceived Difficulties on Campus Satisfaction (Multiple Regression Analysis).
| Variable | B | Std. Error | t | p |
| Constant | 2.840 | 0.085 | 33.60 | .000*** |
| Transportation | 0.180 | 0.100 | 1.79 | .074 |
| Parking | –0.028 | 0.123 | –0.23 | .820 |
| Study areas | –0.150 | 0.110 | –1.37 | .172 |
| Cafeteria | –0.128 | 0.111 | –1.15 | .250 |
| Social spaces | 0.340 | 0.104 | 3.27 | .001*** |
| Hygiene | 0.258 | 0.111 | 2.32 | .021* |
| Technological infrastructure | –0.090 | 0.115 | –0.78 | .433 |
| Wayfinding | 0.463 | 0.154 | 3.00 | .003** |
| Security | 0.229 | 0.121 | 1.90 | .059 |
| Dormitory and accommodation | 0.261 | 0.140 | 1.86 | .063 |
*p < .05, **p < .01, ***p < .001.R = .330 R2 = .109 Adj. R2 = .086 F(10, 387) = 4.728, p < .001.
According to the regression model, wayfinding difficulty displayed the strongest statistical association with lower satisfaction (β = 0.463, p = 0.003). This association suggests that user perceptions of campus navigation may relate to multiple experiential factors, including the spatial arrangement of buildings, the availability and distribution of social spaces, maintenance conditions, and the clarity of wayfinding systems. These tendencies parallel the configurational results, as areas with lower integration were also described by users as more challenging to navigate, indicating descriptive convergence rather than explanatory linkage. Rather than implying any causal relationship, these parallels represent descriptive overlaps between syntactic patterns and user-reported experiences, highlighting locations where spatial configuration and perceived conditions coincide without suggesting explanatory or prescriptive implications.
Within this interpretive framework, wayfinding, the availability of social spaces, and hygiene conditions appear as perceptual dimensions that show notable associations with overall spatial satisfaction. These findings indicate that user satisfaction is associated with multiple experiential aspects and is not limited to the architectural layout alone. The statistical significance of the model supports the presence of observable associations, although its explanatory power remains modest.
Table 3.
a. Overall Model Significance (ANOVA-F Test).
| Statistic | Value | Interpretation |
| F-statistic | 4.728 | Indicates that the regression model is statistically significant overall. |
| p-value (F-test) | 0.00000212 → p < 0.05 | Shows statistical significance but only modest explanatory power. |
| Durbin–Watson | 2.07 → within 1.5–2.5 range | Shows that there is no autocorrelation problem; the model is reliable. |
A second multiple regression model was applied to explore the statistical associations between participants’ most appreciated campus features and their satisfaction with the overall spatial layout. The results of this model are presented in Table 4. The model was statistically significant (F(10, 387) = 4.194, p < 0.001) and accounted for 9.6% of the variance in satisfaction (R2 = 0.096, Adj. R2 = 0.073). Given its modest explanatory power, the results should be interpreted as correlational rather than causal. As shown in Table 4, two variables—social spaces (β = –0.510, p = 0.001) and green areas (β = –0.327, p = 0.013)—displayed statistically significant associations with satisfaction. The negative β coefficients reflect an inverse relationship within the regression model’s coding structure, indicating that higher ratings of these features correspond to lower scores on the dissatisfaction scale for the spatial layout. These associations align with themes widely discussed in sustainability literature, where social and green spaces are frequently emphasized as important perceptual components of campus experience; however, the relationships observed here do not imply direct effects or causal mechanisms.
The regression findings indicate that social spaces and green areas exhibited the strongest statistical associations with satisfaction among the variables included in the model. In sustainability-oriented literature, these elements are frequently described as important components of campus experience, as they are often associated with opportunities for interaction, environmental comfort, and perceived well-being. In the present study, user responses rated these areas positively, and higher satisfaction with social and green spaces corresponded to lower scores on the dissatisfaction scale. These associations align with earlier research emphasizing the perceived value of open and green spaces in restorative campus environments [9,10,11]. Academic buildings and event/student club spaces showed borderline significance, suggesting that their perceived contribution to spatial experience varies across users. The negative trend associated with event and club areas may relate to user perceptions of distribution, proximity, or clustering of activity spaces. Other variables—such as sports facilities, libraries, technological infrastructure, transportation systems, and cafeteria services—did not show statistically significant associations, indicating relatively neutral or secondary roles within the regression structure.
The analysis also identified several statistically significant relationships between demographic characteristics and perceived spatial challenges. Age demonstrated the strongest association with parking-related difficulties (r = 0.39, p < 0.001) and showed a weaker but significant positive relationship with wayfinding difficulty (r = 0.12, p = 0.019). These patterns indicate that older participants more frequently reported challenges in these domains. Institutional position showed significant negative correlations with several difficulty areas—including cleanliness and hygiene (r = –0.24, p < 0.001), technological infrastructure (r = –0.18, p < 0.001), safety (r = –0.16, p = 0.001), parking (r = –0.25, p < 0.001), and wayfinding (r = –0.10, p = 0.039)—suggesting that participants in higher academic or administrative roles reported fewer such difficulties. Length of stay on campus exhibited low-level positive correlations with perceived issues related to cleanliness and hygiene (r = 0.10, p = 0.043), technological infrastructure (r = 0.12, p = 0.020), and parking (r = 0.14, p = 0.007), reflecting a pattern in which long-term users may be more aware of existing spatial inefficiencies. Gender showed minimal associations, with transportation satisfaction exhibiting a marginal trend (r = 0.09, p = 0.060) that did not reach statistical significance. All correlation results are provided in Supplementary Table S1 and visualized in Supplementary Figure S1. These findings provide insight into how perceptual evaluations vary across demographic groups, without indicating any causal direction [56].
To explore demographic patterns related to accessibility, additional correlations were examined between age, gender, institutional position, length of stay, and key accessibility indicators including signage, inter-building pathways, pedestrian routes, and building layout. These results are presented in Supplementary Table S2. Age showed a low-level negative association with satisfaction regarding pedestrian routes (r = –0.15, p = 0.019). Gender demonstrated a statistically significant association with signage satisfaction (r = –0.15, p = 0.014), indicating that female participants tended to report slightly lower satisfaction scores for signage compared with male participants. These associations reflect low-to-moderate correlation strengths and should be interpreted as indicative rather than explanatory.
Length of stay demonstrated negative correlations with satisfaction regarding inter-building pathways (r = –0.12, p = 0.028), pedestrian routes (r = –0.17, p = 0.002), and building layout (r = –0.11, p = 0.038). These low-level associations indicate that participants with longer campus tenure tended to report lower satisfaction scores for these accessibility-related features. The accessibility indicators themselves showed moderate-to-strong positive intercorrelations (r = 0.31–0.62, all p < 0.001), suggesting that signage clarity, pathway continuity, pedestrian route organization, and building layout frequently co-occur as related perceptual components within user evaluations of sustainable accessibility.
3.2.1. Open-Ended Responses and Findings
This section presents the frequency distributions of participants’ open-ended responses regarding their campus experiences and their observations related to sustainability practices. The responses highlight campus features that users value, the challenges they frequently report, expectations for improvement, and their observations about recycling and sustainability-related initiatives.
Participants most commonly appreciated ease of transportation (24.12%), followed by events and student clubs (22.11%) and dormitory and accommodation facilities (19.35%). Green spaces and landscaping (17.59%) and academic buildings (17.09%) were also frequently mentioned. These patterns suggest that users associate multiple aspects of campus life—including accessibility, opportunities for social engagement, and environmental quality—with their overall experience (see Supplementary Table S3). The positive emphasis on green areas parallels findings in sustainability literature, where natural elements are often linked to perceptions of environmental quality and comfort.
Nearly half of the respondents (46.48%) identified a lack of social spaces as the most frequently mentioned challenge. Transportation issues (37.44%), cleanliness and hygiene (33.42%), study areas (31.66%), and technological infrastructure (30.40%) were also commonly reported. These responses reflect concerns spanning both spatial and service-related dimensions (see Supplementary Table S4). The prominence of social and service-related issues aligns with broader discussions in campus sustainability research, where social interaction, maintenance, and service provision are considered alongside physical design.
The most frequently mentioned improvement priority was the expansion of social spaces (56.78%), followed by green areas (50.75%). Study areas (46.48%), technological infrastructure (43.97%), and transportation (43.22%) were also identified as areas where respondents desired improvements. The emphasis on expanding green areas aligns with sustainability discourses that highlight ecological quality and outdoor usability (see Supplementary Table S5). Among suggested improvements, increasing green spaces (59.8%) was the most common, followed by enhancements to dining services (51.26%) and additional social events (50.75%). Improvements in cleanliness and hygiene (47.74%) and technological infrastructure (46.48%) were also frequently noted (see Supplementary Table S6). Collectively, these responses illustrate the aspects of campus life that users consider most meaningful for their daily experience.
Most participants (59.05%) reported noticing recycling bins for paper, plastic, and glass, suggesting moderate visibility of basic recycling facilities. Awareness was considerably lower for battery waste bins (19.60%), electronic waste bins (7.79%), oil collection (5.28%), and organic waste composting (3.52%). Additionally, 4.77% of participants stated that they had not observed any recycling practices. These responses indicate varying levels of awareness regarding sustainability-related infrastructure (see Supplementary Table S7).
Among sustainability-focused features, bicycle and pedestrian arrangements (37.44%) and sustainability education for students and staff (36.43%) were the most frequently mentioned. Green area expansion (22.61%) was also noted, whereas electric charging stations (3.77%) and energy-efficient building systems (3.27%) appeared less frequently (see Supplementary Table S8). This distribution suggests that visibly accessible sustainability practices tend to be more salient to users than technologically embedded measures.
Overall, the open-ended responses indicate that campus users’ perceptions encompass physical, social, environmental, and service-related dimensions. Concerns such as limited social spaces, transportation challenges, and hygiene issues were recurrent, while strong interest in green areas and social activities was also evident. These findings align with themes commonly addressed in sustainability literature, which emphasize the interplay between spatial conditions, environmental quality, and service provision in shaping campus experiences. While the responses highlight user priorities and perceptions, they do not imply direct causal relationships or prescriptive planning outcomes; rather, they provide contextual insights into the aspects of campus life that users identify as meaningful.
3.3. Integrated Evaluation of Spatial and User Data
The integration values calculated for the faculties and key functional buildings of the Balkan Campus are presented in Table 5a. The results indicate a heterogeneous spatial structure, particularly in relation to configurational centrality and accessibility. The highest integration values were observed around the Delta Life Center (1.5158) and the Faculty of Theology (1.4153), where the syntactic measures suggest relatively central positions within the campus network. In contrast, the Faculty of Engineering (0.5497) and the Faculty of Pharmacy (0.6771) displayed lower integration values, corresponding to more peripheral locations in the configurational model. These patterns are consistent with discussions in the literature describing how core–periphery distinctions often align with variations in perceived accessibility and movement tendencies in campus environments [15,16,17,18,19,20,21,22,23,24,25,26,27,28].
Table 5.
a. Integration Values of Buildings in the Balkan Campus.
| Building | Integration Value |
| Delta Life Center | 1.5158 |
| Faculty of Arts and Sciences | 0.7904 |
| Faculty of Theology | 1.4153 |
| Fine Arts Vocational School | 1.1745 |
| Hostel | 0.7872 |
| Faculty of Engineering | 0.5497 |
| Faculty of Health Sciences | 1.3429 |
| Faculty of Medicine | 1.1939 |
| Faculty of Pharmacy | 0.6771 |
| Kırkpınar Faculty of Sports Sciences | 0.9609 |
| Institutes | 1.3482 |
| Faculty of Economics and Administrative Sciences | 1.0727 |
| Library | 1.1727 |
| Refectory | 0.9505 |
Note: All integration values in Table 5a represent normalized global integration (RRA) outputs generated in DepthmapX. The values fall within the campus-wide numerical range of approximately 0.55–1.52, enabling direct comparison among buildings of different sizes and functional types. These normalized values reflect relative configurational centrality within the overall campus network.
The relationships between spatial metrics and user experience were examined through correlation analyses, and the results are summarized in Table 5b. As illustrated in Figure 6, the correlations exhibit a consistent pattern within the integrated analytical framework. Wayfinding difficulty, directional signage quality, building layout organization, and integration values displayed the most notable associations with user satisfaction. These patterns indicate points of correspondence between configurational measures and user-reported perceptions of environmental quality, without implying causal directionality.
Table 5.
b. Significant Correlations Between User Experience Parameters and Integration Values.
| Variables | Correlation Coefficient (r) | p-value | Interpretation |
| Wayfinding × Directional Signage | –0.28 | <0.000 | Participants who reported greater wayfinding difficulty also tended to evaluate signage less positively. |
| Wayfinding × Building Layout | –0.17 | 0.001 | Participants who experienced higher wayfinding difficulty also reported lower satisfaction with the spatial organization of buildings |
| Wayfinding × Integration Values | 0.12 | 0.013 | Wayfinding difficulty showed lower levels in areas with higher integration values, indicating that navigation experiences differed across configurational contexts. |
| Perceived Safety × Directional Signage | –0.13 | 0.009 | Respondents who evaluated signage less favorably also tended to report lower perceptions of safety. |
| Perceived Safety × Building Layout | –0.14 | 0.006 | Lower satisfaction with building layout was associated with lower perceived safety. |
Note: Negative coefficients indicate that increases in the corresponding variables are associated with lower user satisfaction, whereas positive coefficients correspond to higher levels of satisfaction.
Specifically:
- A significant negative correlation was found between wayfinding difficulty and directional signage (r = –0.28, p < 0.001). Individuals who reported greater difficulty navigating the campus also tended to evaluate signage less positively. Within sustainability-focused discussions, such co-occurring patterns are often examined in relation to perceived walking ease, without implying causal influence.
- A significant negative correlation was observed between wayfinding difficulty and building layout (r = –0.17, p = 0.001). Participants who expressed higher levels of wayfinding difficulty also tended to report lower satisfaction with the spatial organization of buildings. These associations align with broader literature noting that variations in spatial order and continuity may be reflected in user evaluations of pedestrian environments.
- A weak but statistically significant positive correlation between wayfinding difficulty and integration values (r = 0.12, p = 0.013) indicates that reported navigation experiences differ across areas with varying configurational characteristics. Such patterns parallel discussions in spatial and sustainability research, where more integrated environments are often described as being perceived as easier to navigate, without implying causal direction.
- Significant negative correlations between perceived safety and both directional signage (r = –0.13, p = 0.009) and building layout (r = –0.14, p = 0.006) indicate that respondents who evaluated signage and spatial organization less favorably also tended to report lower perceptions of safety. Similar relationships have been identified in studies examining visual clarity, spatial legibility, and user comfort in campus settings.
These associations illustrate how perceptions of wayfinding, signage, safety, and spatial organization vary together within the dataset, without indicating any causal relationships. No significant associations were found between lack of social spaces and the spatial parameters examined (p > 0.05). This pattern suggests that participants’ evaluations of social space availability may reflect experiential or contextual factors that are not captured by geometric configuration alone.
The visual distribution of correlations presented in Figure 6 shows that core areas with higher integration values are more frequently associated with favorable evaluations of wayfinding and safety, whereas peripheral areas show lower ratings across several perceptual measures. These patterns align with the center–periphery contrasts identified in the spatial analyses, reflecting overlapping configurational and perceptual characteristics rather than direct functional effects.
Overall, the spatial analysis and user data indicate a parallel between configurational centrality and the patterns identified in participants’ perceptions. Core areas were more frequently associated with reports of higher accessibility, activity, and navigational clarity, whereas peripheral zones were more often linked to perceptions of limited connectivity, wayfinding difficulty, and lower safety. These parallels reflect corresponding tendencies across the spatial metrics and user feedback, without suggesting direct causal relationships. Within sustainability-focused campus literature, such patterns are often referenced when discussing connectivity, wayfinding clarity, distribution of amenities, and spatial legibility. In this context, considerations commonly addressed include alternative connection routes, clarity of wayfinding information, spatial organization of building clusters, and the distribution of social and green areas. The associations observed in this study may therefore serve as informative inputs for broader planning discussions concerning environmental comfort, perceived safety, and campus-wide accessibility.
4. Discussion
The findings of this study indicate that the historical and incremental development of the Balkan Campus is reflected in a pronounced center–periphery structure, accompanied by variations in configurational centrality and user-reported experiences. The Rectorate, Library, and the main circulation spine consistently emerged as syntactic cores in the Space Syntax analyses, aligning with previous research describing hierarchical spatial structures in campus environments [15,16,17,18,19,20,21,22,23,24,25,26,27,28,29,30,31,32,33,34,35,36,37,38,39,40,41,42,43,44,45,46,47,48,49,50,51,52]. Comparable patterns have also been identified in studies of historical Ottoman civic complexes, where central nodes often coincide with socially active or perceptually prominent locations within the built environment [53].
In contrast, peripheral areas—including the Engineering and Pharmacy Faculties and the dormitory clusters—exhibited lower integration and higher mean depth values. These spatial tendencies were more frequently associated with user reports of wayfinding difficulty and lower perceived safety. Similar co-occurring patterns between visual accessibility and perceived safety have been documented by Vilar et al. and Arslan & Ergener [41]. Within the present context, both VGA outcomes and user responses revealed parallel tendencies in areas characterized by restricted sightlines or limited visibility.
However, the explanatory strength of these associations remains limited, as the regression model accounted for only a modest proportion of variance (R2 ≈ 0.10). Accordingly, the identified correspondences should be interpreted as indicative rather than explanatory.
The survey findings also paralleled the spatial disparities identified in the syntactic analyses. In the regression model, wayfinding difficulty, availability of social spaces, and cleanliness–hygiene concerns exhibited the strongest statistical associations with dissatisfaction. These observations align with earlier studies noting that perceived limitations in signage, social activity areas, or maintenance conditions often influence user evaluations of campus environments [9,10,11,12,13,14,15,16,17,18,19,20,21,22,23,24,25,26,27,28,29,30,31,32,33,34,35,36,37,38].
Wayfinding issues were reported more frequently in zones that also exhibited lower integration values, indicating areas where configurational and perceptual characteristics overlap. However, these statistical associations represent modest effects and should not be interpreted as evidence of strong explanatory power.
Social and green spaces demonstrated significant associations with user satisfaction in the regression model. These findings align with research emphasizing that natural landscapes and shared activity areas are frequently perceived as key components of environmentally and socially supportive campus environments [9,10,11,12,13,14,15]. From an environmental psychology perspective, previous studies have also linked green spaces with perceptions of comfort, environmental quality, and restorative experiences [53,54,55,56,57]. In the present study, respondents similarly emphasized the importance of green areas and social activity zones, particularly in relation to daily campus use.
Demographic analyses further revealed systematic differences in how user groups perceive spatial conditions. Older participants more frequently reported challenges related to parking and wayfinding—a pattern also highlighted in age-inclusive design literature [35]. Participants in higher institutional positions tended to report fewer difficulties across multiple categories, which may relate to greater familiarity with the campus or different patterns of spatial use. Users with longer campus tenure identified more issues concerning hygiene, infrastructure, and maintenance, consistent with studies suggesting that prolonged exposure can heighten awareness of spatial or operational limitations [38].
It is important to note that several demographic associations—particularly those with marginal p-values in the 0.05–0.10 range—should not be interpreted as statistically significant. These trends do not provide a basis for strong theoretical or planning implications, especially in the absence of corrections for multiple comparisons.
A notable contribution of this study is the identification of consistent correspondences between Space Syntax metrics and user perceptions. Areas with lower integration and connectivity values were more frequently associated with user-reported wayfinding difficulty and lower perceived safety. These parallels align with earlier research demonstrating how configurational properties can correspond to perceptual, cognitive, and experiential evaluations of place [25,26,27,28,29,30,31,32].
Integrating spatial metrics with user responses, as suggested by Lee et al. [28], provides a complementary methodological perspective that may support more comprehensive assessments of campus environments. The findings may also hold relevance for campuses with similar developmental trajectories. Within sustainability-oriented planning literature, recurring themes include transversal connectivity, clarity of circulation systems, distribution of social and green spaces, and long-term maintenance strategies.
The patterns observed in this study may therefore serve as analytical inputs to these discussions, particularly in evaluations concerning environmental comfort, spatial equity, accessibility, and perceived safety.
This study has several methodological limitations. First, respondents’ specific locations or movement paths were not matched with corresponding spatial metrics; therefore, the spatial–perceptual correspondences identified here reflect campus-level patterns rather than individual-level associations. Likewise, the study did not geolocate participants or link their responses to particular buildings, pathways, segments, or VGA cells. As a result, the associations presented here reflect global configurational tendencies instead of fine-grained, geocoded exposure data. This limits the spatial granularity of the findings and indicates that the correlations should be interpreted as broad tendencies rather than precise spatial alignments.
Second, the Space Syntax approach does not directly incorporate material characteristics, microclimatic conditions, or psychosocial dimensions. Future research may therefore benefit from complementing syntactic measures with dynamic movement observations, thermal comfort analyses, digital wayfinding systems, and multisensory environmental evaluations. Additional topics—such as vertical circulation in multi-story buildings [58] and the integration of digital signage—also represent promising directions for further inquiry.
A third limitation concerns potential confounding factors that were not directly measured or controlled for in the survey. Individual differences such as daily time spent on campus, frequency and pattern of movement, modes of transportation, familiarity with the campus layout, academic schedules, and personal navigation strategies may influence spatial perceptions and satisfaction. Because the regression models were constrained by the variables included in the questionnaire, these unmeasured factors may partially account for the observed associations. Accordingly, the findings should be interpreted as reflecting broad perceptual tendencies rather than effects adjusted for all possible confounders.
5. Conclusion & Recommendations
This study proposes an integrated methodological approach that combines Space Syntax metrics with user experience data to provide a joint interpretive framework for examining spatial tendencies, perceptual evaluations, and sustainability-related considerations on university campuses. In the case of the Balkan Campus, the historical and linear pattern of development corresponds with a pronounced center–periphery structure observed in the configurational model. These spatial tendencies occurred in the same areas that respondents more frequently described as involving challenges related to wayfinding, accessibility, safety, or overall satisfaction, indicating descriptive overlap rather than explanatory relationships. The Rectorate, Library, and main circulation spine consistently emerged as central components within the spatial network, whereas peripheral zones—such as the Engineering, Pharmacy, and dormitory areas—were characterized by lower integration and reduced visual accessibility. These contrasts mirrored user reports describing navigational difficulty, limited clarity, or lower perceived safety, reflecting parallel tendencies between configurational patterns and user-reported experiences without implying directionality or causal influence.
The regression analyses showed that wayfinding difficulty, availability of social spaces, and cleanliness–hygiene concerns exhibited the strongest statistical associations with overall satisfaction. Social and green spaces were also closely associated with positive evaluations, consistent with sustainability and environmental psychology literature that highlights their role in supporting comfort, environmental quality, and well-being. Demographic variables revealed some differences in reported challenges: older participants and long-term campus users more frequently reported navigation and infrastructure-related difficulties. However, these associations should be understood as statistically observable correspondences rather than strong explanatory effects, given the modest variance explained by the models. Findings based on marginal p-values were interpreted cautiously and were not used to derive planning recommendations. Regression diagnostics indicated no violations of normality, heteroscedasticity, multicollinearity, or influential outliers, suggesting that the coefficients are statistically stable within the limits of the model’s modest explanatory power.
A key contribution of this study is demonstrating how spatial metrics and user-centered data can be examined within a unified analytical framework. This combined perspective provides a descriptive basis for understanding how spatial configuration and user-reported experiences co-occur, offering conceptual insight without implying predictive or prescriptive guidance for decision-making. While the approach may be informative in other settings where spatial structure and user experience intersect, it should be viewed as an exploratory tool rather than a prescriptive model. Given that this study is based on a single campus with a distinct developmental, geographic, and cultural context—and uses cross-sectional data—its transferability is inherently limited. The framework presented here may offer conceptual guidance but does not provide empirical evidence for direct generalization across different settings.
The findings may hold relevance for sustainability-oriented campus discussions addressing circulation clarity, distribution of social and green spaces, age-inclusive design principles, and maintenance policies. Although the present study does not propose specific interventions, the spatial and perceptual patterns identified here should be interpreted as descriptive tendencies rather than actionable planning inputs.
Future research may benefit from incorporating complementary analytical tools such as real-time movement tracking, environmental comfort assessments, digital wayfinding technologies, and sensor-based data collection systems. Additionally, examining vertical circulation and navigation patterns in multi-story academic buildings across diverse climatic and cultural contexts may broaden the applicability of the integrated framework.
In summary, the Balkan Campus case illustrates how spatial configuration and user perceptions can be jointly interpreted to inform discussions surrounding sustainable, accessible, and user-oriented campus development. The integrated analytical framework utilized in this study may also serve as a conceptual reference point for exploratory applications in urban design, district-scale planning, and public-space governance, rather than as a directly transferable template.
Supplementary Materials
The following supporting information can be downloaded at the website of this paper posted on Preprints.org. The study contains eight supplementary tables (Supplementary Tables S1–S8) and one supplementary figure (Supplementary Figure S1).
Author Contributions
Conceptualization, Aslı Zencirkıran and Onur Şuta; Methodology, Aslı Zencirkıran and Onur Şuta; Software, Aslı Zencirkıran and Onur Şuta; Validation, Aslı Zencirkıran and Onur Şuta; Formal analysis, Aslı Zencirkıran and Onur Şuta; Investigation, Aslı Zencirkıran and Onur Şuta; Resources, Aslı Zencirkıran and Onur Şuta; Data curation, Aslı Zencirkıran and Onur Şuta; Writing—original draft preparation, Aslı Zencirkıran and Onur Şuta; Writing—review and editing, Aslı Zencirkıran and Onur Şuta; Visualization, Aslı Zencirkıran and Onur Şuta; Supervision, Aslı Zencirkıran and Onur Şuta; Project administration, Aslı Zencirkıran and Onur Şuta.
All authors have read and agreed to the published version of the manuscript.
Funding
This research received no external funding, and the APC was funded by the authors.
Institutional Review Board Statement
The study was conducted in accordance with the Declaration of Helsinki and approved by the Ethics Committee of Trakya University (protocol code: E-29563864-050.04-811336], date of approval [10 March 2025]).
Informed Consent Statement
Informed consent was obtained from all subjects involved in the study.
Data Availability Statement
The data presented in this study are available on request from the corresponding author. The data are not publicly available due to privacy and ethical restrictions.
Conflicts of Interest
The authors declare no conflicts of interest. The funders had no role in the design of the study; in the collection, analyses, or interpretation of data; in the writing of the manuscript; or in the decision to publish the results.
Appendix A
Appendix A.1
This appendix includes eight supplementary tables.
Table A1.
Correlation Between Demographic Variables and Campus-Related Challenges (r value / p value).
Table A1.
Correlation Between Demographic Variables and Campus-Related Challenges (r value / p value).
| Challenge | Age | Gender | Position | Duration of Stay on Campus |
| Lack of social areas | 0.08 / 0.107 | -0.00 / 0.987 | -0.15 / 0.004 | 0.09 / 0.086 |
| Transportation | -0.08 / 0.111 | 0.09 / 0.060 | 0.12 / 0.021 | -0.04 / 0.409 |
| Cleanliness and hygiene | 0.07 / 0.148 | 0.02 / 0.696 | -0.24 / 0.000 | 0.10 / 0.043 |
| Working areas | -0.05 / 0.330 | 0.03 / 0.536 | -0.09 / 0.063 | 0.05 / 0.291 |
| Cafeteria services | 0.02 / 0.723 | -0.09 / 0.074 | -0.08 / 0.101 | -0.05 / 0.348 |
| Technological infrastructure | 0.05 / 0.351 | -0.03 / 0.618 | -0.18 / 0.000 | 0.12 / 0.020 |
| Security | 0.02 / 0.735 | 0.04 / 0.424 | -0.16 / 0.001 | 0.05 / 0.314 |
| Parking | 0.39 / 0.000 | -0.01 / 0.891 | -0.25 / 0.000 | 0.14 / 0.007 |
| Dormitory and accommodation | -0.17 / 0.001 | -0.15 / 0.002 | 0.08 / 0.127 | -0.09 / 0.090 |
| Wayfinding | 0.12 / 0.019 | 0.03 / 0.521 | -0.10 / 0.039 | 0.03 / 0.536 |
Table A2.
Correlation Between Demographic Variables and Accessibility Satisfaction Factors (r and p values).
Table A2.
Correlation Between Demographic Variables and Accessibility Satisfaction Factors (r and p values).
| Variables | Satisfaction with Wayfinding Signage | Satisfaction with Inter-Building Connections | Satisfaction with Pedestrian Paths | Satisfaction with Building Layout |
| Age | r = -0.06 (p = 0.263) | r = -0.07 (p = 0.177) | r = -0.15 (p = 0.019) | r = -0.09 (p = 0.103) |
| Gender | r = -0.15 (p = 0.014) | r = -0.05 (p = 0.336) | r = -0.03 (p = 0.552) | r = -0.03 (p = 0.610) |
| Position in the institution | r = 0.01 (p = 0.850) | r = -0.02 (p = 0.680) | r = -0.02 (p = 0.689) | r = -0.01 (p = 0.876) |
| Duration of stay on campus | r = -0.09 (p = 0.066) | r = -0.12 (p = 0.028) | r = -0.17 (p = 0.002) | r = -0.11 (p = 0.038) |
| Satisfaction with wayfinding signage | — | r = 0.36 (p < 0.001) | r = 0.31 (p < 0.001) | r = 0.31 (p < 0.001) |
| Satisfaction with inter-building connections | — | — | r = 0.46 (p < 0.001) | r = 0.56 (p < 0.001) |
| Satisfaction with pedestrian paths | — | — | — | r = 0.62 (p < 0.001) |
Table A3.
Most Appreciated Features of the Campus.
| Feature | Frequency | Percentage (%) |
| Ease of transportation | 96 | 24.12 |
| Events and student clubs | 88 | 22.11 |
| Dormitories and accommodation |
77 | 19.35 |
| Green areas and landscape | 70 | 17.59 |
| Academic buildings | 68 | 17.09 |
Table A4.
Major Challenges Encountered on Campus.
| Challenge | Frequency | Percentage (%) |
| Lack of social areas | 185 | 46.48 |
| Transportation | 149 | 37.44 |
| Cleanliness and hygiene | 133 | 33.42 |
| Working areas | 126 | 31.66 |
| Technological infrastructure | 121 | 30.40 |
Table A5.
Areas and Services Identified as Needing Improvement on Campus.
| Feature / Service | Frequency | Percentage (%) |
| Social areas | 226 | 56.78 |
| Green areas | 202 | 50.75 |
| Working areas | 185 | 46.48 |
| Technological infrastructure | 175 | 43.97 |
| Transportation | 172 | 43.22 |
Table A6.
Suggestions for Improving Satisfaction on Campus.
| Suggestion | Frequency | Percentage (%) |
| More green areas | 238 | 59.80 |
| Improved cafeteria service quality | 204 | 51.26 |
| More social activities | 202 | 50.75 |
| Better cleanliness and hygiene | 190 | 47.74 |
| Advanced technological infrastructure | 185 | 46.78 |
Table A7.
Existing Recycling Practices on Campus.
| Type of Practice | Frequency | Percentage (%) |
| Recycling bins (paper, plastic, glass) | 235 | 59.05 |
| Battery waste bin | 78 | 19.60 |
| Electronic waste bin | 31 | 7.79 |
| Oil collection (vegetable waste oil) | 21 | 5.28 |
| Organic waste composting | 14 | 3.52 |
| Textile/clothing waste bin | 8 | 2.01 |
| Not aware / Have not seen recycling | 19 | 4.77 |
| Other (unspecified/single responses) | 7 | 1.76 |
Table A8.
Sustainability Practices Implemented on Campus.
| Practice | Frequency | Percentage (%) |
| Practices to promote bicycle and pedestrian paths | 149 | 37.44 |
| Sustainability training for students and staff | 145 | 36.43 |
| Efforts to expand green areas | 90 | 22.61 |
| Electric vehicle charging stations | 15 | 3.77 |
| Energy-efficient building systems | 13 | 3.27 |
Appendix B
This appendix includes eight supplementary tables and one supplementary figure.
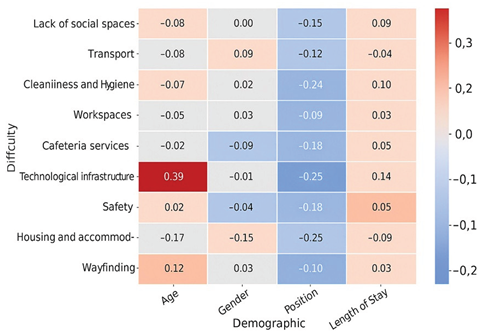
References
- Özkan, D. G., Özlü, S., & Dedeoğlu Özkan, S. (2022). Measuring place satisfaction by university campus open space attributes. A|Z ITU Journal of the Faculty of Architecture, 19(1), 137–149. [CrossRef]
- Peker, E., & Ataöv, A. (2020). Exploring the ways in which campus open space design influences students’ learning experiences. Landscape Research, 45(3), 310–326. [CrossRef]
- Nehme, J. B., Rodríguez, E., & Yoon, S. (2020). Spatial user experience: A multidisciplinary approach to assessing physical settings. Journal of Interior Design, 45(3), 7–25. [CrossRef]
- Sailer, K., & Koutsolampros, P. (2021). Space syntax: Understanding human movement, co-presence and encounters in relation to the spatial structure of workplaces. In R. Appel-Meulenbroek & V. Danivska (Eds.), A handbook of theories on designing alignment between people and the office environment (pp. 248–260). Routledge.
- Calvo-Sotelo, P. C. (2014). From typological analysis to planning: Modern strategies for university spatial quality. CIAN – Revista de Historia de las Universidades, 17(1), 31–58.
- Shi, Y., & Zhou, X. (2025). Evaluating the effectiveness of different directional signage systems in indoor wayfinding: A human-centered experiment conducted in virtual reality. In T. Ahram, W. Karwowski, C. Martino, G. Di Bucchianico, & V. Maselli (Eds.), Intelligent human systems integration (IHSI 2025): Integrating people and intelligent systems. AHFE (2025) International Conference, AHFE Open Access (Vol. 160). AHFE International. [CrossRef]
- Sutkaitytė, M. (2020). Human behaviour simulation using space syntax methods. Architecture and Urban Planning, 16(1), 84–92. [CrossRef]
- Askarizad, R., Lamíquiz Daudén, P. J., & Garau, C. (2024). The application of space syntax to enhance sociability in public urban spaces: A systematic review. ISPRS International Journal of Geo-Information, 13(7), 227. [CrossRef]
- Micheli, S. (2024). Green spaces and student well-being: Evidence from European university campuses. Building and Environment, 238, 110842.
- Agrawal, P., & Yadav, M. (2021). Campus design of universities: An overview. Journal of Design and the Built Environment, 21(3), 37–51. [CrossRef]
- Lee, Ju Hyun; Ostwald, Michael J.; Zhou, Ling (2023). “Socio-Spatial Experience in Space Syntax Research: A PRISMA-Compliant Review”. Buildings, 13(3), 644. [CrossRef]
- Guo, W., Wen, H., & Liu, X. (2023). Research on the psychologically restorative effects of campus common spaces from the perspective of health. Frontiers in Public Health, 11, 1131180. [CrossRef]
- Dawodu, A., Dai, H., Zou, T., Zhou, H., Lian, W., Oladejo, J., & Osebor, F. (2022). Campus sustainability research: Indicators and dimensions to consider for the design and assessment of a sustainable campus. Heliyon, 8(12), e11864. [CrossRef]
- Günaydın, A. S., & Yücekaya, M. (2020). An investigation of sustainable transportation model in campus areas with Space Syntax method. ICONARP International Journal of Architecture and Planning, 8(1), 262–281. https://doi: 10.15320/ICONARP.2020.113.
- Buttimer, A., & Seamon, D. (2015). The human experience of space and place (Routledge Revivals ed.). Routledge.
- Hillier, B., & Hanson, J. (1984). The social logic of space. Cambridge University Press.
- Nes, A., & Yamu, C. (2017). Space syntax: A method to measure urban space related to social, economic and cognitive factors. In The virtual and the real in planning and urban design (pp. 136–150). Routledge.
- March, L., & Steadman, P. (1971/2020). The geometry of environment: An introduction to spatial organization in design. Routledge.
- Green, M., & Penn, A. (1997). Socio-spatial analysis of four university campuses: The implications of spatial configuration on creation and transmission of knowledge. In Proceedings of the 1st International Space Syntax Symposium. University College London.
- Kubovy, M., & Pomerantz, J. R. (Eds.). (2017). Perceptual organization. Lawrence Erlbaum Associates.
- Montello, D. R. (1993). Scale and multiple psychologies of space. In Spatial information theory: A theoretical basis for GIS (pp. 312–321). Springer Berlin Heidelberg.
- Golledge, R. G. (Ed.). (1999). Wayfinding behavior: Cognitive mapping and other spatial processes. Johns Hopkins University Press.
- Gür, Ş. Ö. (2024). Architecture as spatial organization. Livenarch+ Journal, 1(1), 5–13.
- Zavoleas, Y., & Taylor, M. (2021). Patterns and spatial organisation: Culture, history and future perspectives. Nexus Network Journal, 23(1), 1–4. [CrossRef]
- Ishikawa, T., & Montello, D. R. (2006). Spatial knowledge acquisition from direct experience in the environment: Individual differences in the development of metric knowledge. Cognitive Psychology, 52(2), 93–129. [CrossRef]
- Popov, A. V. (2019). Architectural examination of student accommodation in Russia and the CIS. Amazonia Investiga, 8(19), 179–190. https://amazoniainvestiga.info/index.php/amazonia/article/view/219.
- Dalton, R. C., Hölscher, C., & Turner, A. (2012). Understanding space: The nascent synthesis of cognition and the syntax of spatial morphologies. Environment and Planning B: Planning and Design, 39(1), 7–11. [CrossRef]
- Zhang, Y., Lin, H., Sun, Y., Zhu, W., & Li, H. (2024). The role of strategic visibility in shaping wayfinding efficiency: Evidence from virtual environment experiments. Scientific Reports, 14, 15528. [CrossRef]
- Lee, J. H., Ostwald, M. J., & Zhou, L. (2023). Socio-spatial experience in space syntax research: A PRISMA-compliant review. Buildings, 13(3), 644. [CrossRef]
- Lee, J. H., & Ostwald, M. J. (2024). Latent Dirichlet allocation (LDA) topic models for space syntax studies on spatial experience. City, Territory and Architecture, 11(3), Article 3. [CrossRef]
- Karimi, K. (2023). The configurational structures of social spaces: Space Syntax and urban morphology in the context of analytical, evidence-based design. Land, 12(11), Article 2084. [CrossRef]
- Khasraghi, G. S. (2020). Developing a multi-agent based simulation model of users’ wayfinding as a representation and post-occupancy evaluation (POE) tool in a hospital. Prometheus: Buildings, Cities, and Performance II, 4, 102–105.
- Gil, J., Varoudis, T., Karimi, K., & Penn, A. (2015). The Space Syntax Toolkit: Integrating depthmapX and exploratory spatial analysis workflows in QGIS. In Proceedings of the 10th International Space Syntax Symposium (SSS10). University College London. https://discovery.ucl.ac.uk/1490063/.
- Varoudis, T. (2012). depthmapX: Multi-platform spatial network analysis software. https://spacegroupucl.github.io/depthmapX/.
- Haq, S., & Luo, Y. (2012). Space syntax in healthcare facilities research: A review. HERD: Health Environments Research & Design Journal, 5(4), 98–117. [CrossRef]
- Bate, P., & Robert, G. (2023). Bringing user experience to healthcare improvement: The concepts, methods and practices of experience-based design. CRC Press.
- Jamshidi, S., Ensafi, M., & Pati, D. (2020). Wayfinding in interior environments: An integrative review. Frontiers in Psychology, 11, 549628. [CrossRef]
- Hillier, B. (1996). Space is the machine: A configurational theory of architecture. Cambridge University Press.
- Alitajer, S., & Nojoumi, G. M. (2016). Privacy at home: Analysis of behavioral patterns in the spatial configuration of traditional and modern houses in the city of Hamedan based on the notion of space syntax. Frontiers of Architectural Research, 5(3), 341–352. [CrossRef]
- Vilar, E., Rebelo, F., Noriega, P., & Filgueiras, E. (2022). A human-centered architecture: Considering usability and user experience in architectural design. In Handbook of usability and user-experience (pp. 197–216). CRC Press.
- Zhou, X., Zheng, G., & Cao, Y. (2022, December). A study of negative space accessibility of university campus based on spatial syntax theory: Take Hubei University of Technology as an example. In Proceedings of the 2nd International Conference on Computer Technology and Media Convergence Design (CTMCD 2022) (pp. 678–688). Atlantis Press.
- Arslan, H. D., & Ergener, H. (2023). Comparative analysis of shopping malls with different plans by using space syntax method. Ain Shams Engineering Journal, 14(9), Article 102063. [CrossRef]
- Beek, V. A., Duives, D. C., Feng, Y., & Hoogendoorn, S. P. (2024). Comparison of pedestrian wayfinding behavior between a real and a virtual multi-story building: A validation study. Transportation Research Part C: Emerging Technologies, 163, Article 104650. [CrossRef]
- Ilako, C. (2020). The influence of spatial attributes on users’ information behaviour in academic libraries: A case study. In Proceedings of ISIC, the Information Behaviour Conference, Pretoria, South Africa, 28 September–1 October 2020. Information Research, 25(4), paper isic2029. http://informationr.net/ir/25-4/isic2020/isic2029.html (Archived at https://bit.ly/3gJ0HKU).
- Smith, A. W. (2019, October). User experience design for older adults: Experience architecture and methodology for users aged 60+. In Proceedings of the 37th ACM International Conference on the Design of Communication (pp. 1–9).
- Erap, B. B. N., Hilmioğlu, S., & Kariptaş, F. S. (2021). Kamusal mekânlarda deneyim ve kullanıcı merkezli tasarım. Sanat ve Tasarım Dergisi, (28), 335–347.
- Wang, T. (2023, November). An investigation into the architectural environment of university campuses based on space syntax analysis: A case study conducted on the campus of Hubei University of Technology. In International Conference on Advanced Civil Engineering and Smart Structures (pp. 283–294). Springer Nature Singapore.
- Harte, R., Glynn, L., Rodríguez-Molinero, A., Baker, P. M., Scharf, T., Quinlan, L. R., & ÓLaighin, G. (2017). A human-centered design methodology to enhance the usability, human factors, and user experience of connected health systems: A three-phase methodology. JMIR Human Factors, 4(1), e8. [CrossRef]
- Bozdağ, A., Gümüş, M. G., Gümüş, K., & Durduran, S. S. (2020). Evaluating spatial legibility of the university campus using GIS. Aksaray University Journal of Science and Engineering, 4(2), 127–147.https://doi: 10.29002/asujse.767122.
- Darwish, I. I. (2022). Enhancing outdoor campus design by utilizing space syntax theory for social interaction locations. Ain Shams Engineering Journal, 13(1), 101524. [CrossRef]
- Khorsheed, J. B., & Goriel, W. A. S. (2021). Analytical study of university campuses’ walkability using space syntax analysis: University of Duhok (UoD) as a case study. Journal of Engineering Research, 9(ICRIE).
- Huang, J., & Wang, H., & Guo, Y. (2025). Using BERTopic modelling to map the evolution of space syntax research. Building and Environment, Advance online publication. [CrossRef]
- Trakya Üniversitesi Rektörlüğü. (2025, September 22). Tarihçe. Trakya Üniversitesi. https://www.trakya.edu.tr/tarihce.
- Trakya Kalkınma Ajansı. (2013). TR21 Trakya bölge planı 2014–2023. Trakya Üniversitesi Yayınları.
- Aydın, M. F. (2025). Provincial interpretations and regional diversification dynamics in the classical period of Ottoman architecture: The case of Vezirhan Köprülü Mehmet Pasha Mosque. Frontiers of Architectural Research. [CrossRef]
- Ulrich, R. S. (1984). View through a window may influence recovery from surgery. Science, 224(4647), 420–421. [CrossRef]
- Hartig, T., Mitchell, M., de Vries, S., & Frumkin, H. (2014). Nature and health. Annual Review of Public Health, 35, 207–228. 2007; Volume 3, pp. 154–196. [CrossRef]
Figure 4.
Visual Graph Analysis (VGA) map of Balkan Campus. Note: Red areas indicate zones with higher visual accessibility, whereas blue tones represent areas with lower visual accessibility.
Figure 4.
Visual Graph Analysis (VGA) map of Balkan Campus. Note: Red areas indicate zones with higher visual accessibility, whereas blue tones represent areas with lower visual accessibility.
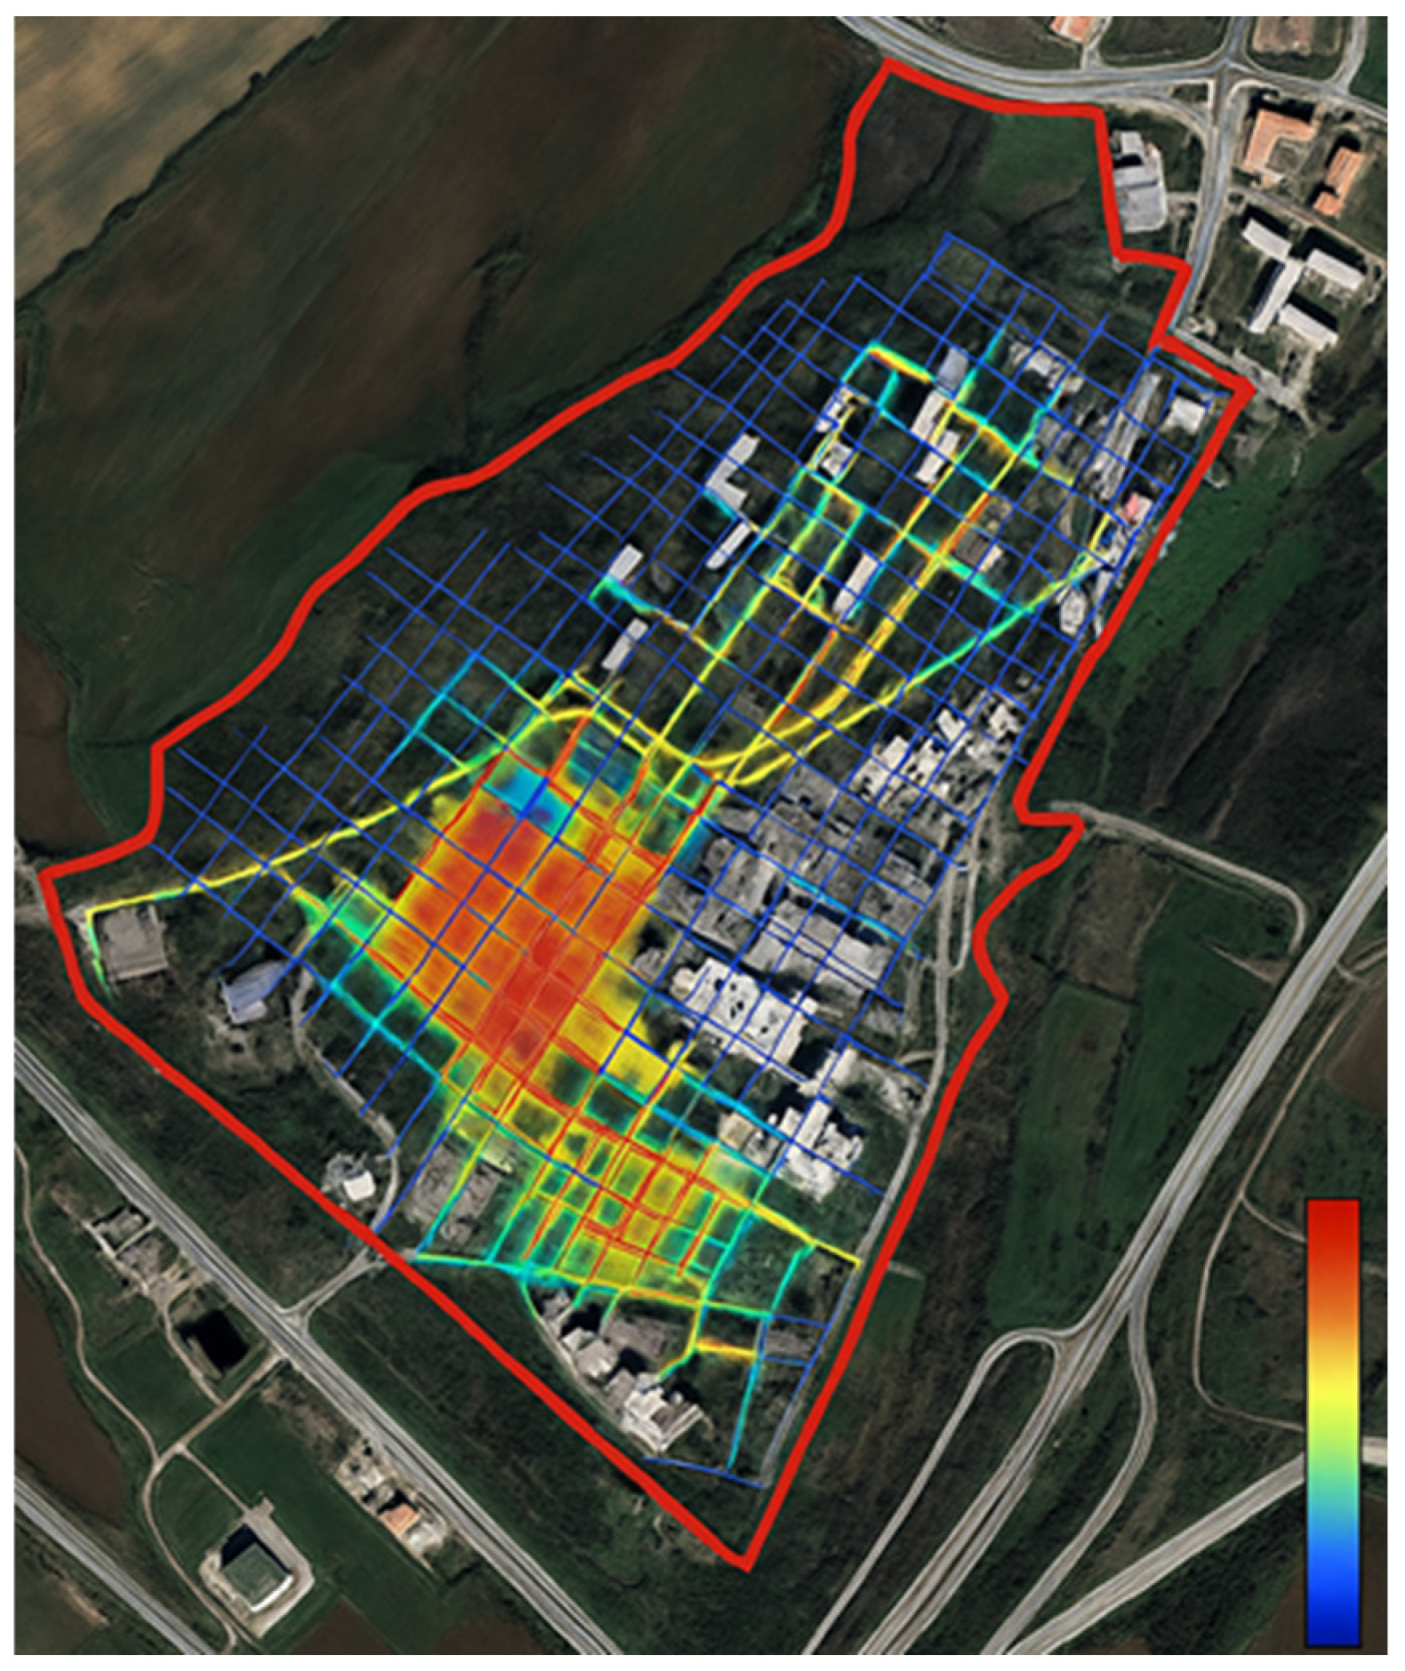
Figure 5.
Heatmap of Space Syntax Metrics of the Buildings in the Balkan Campus.
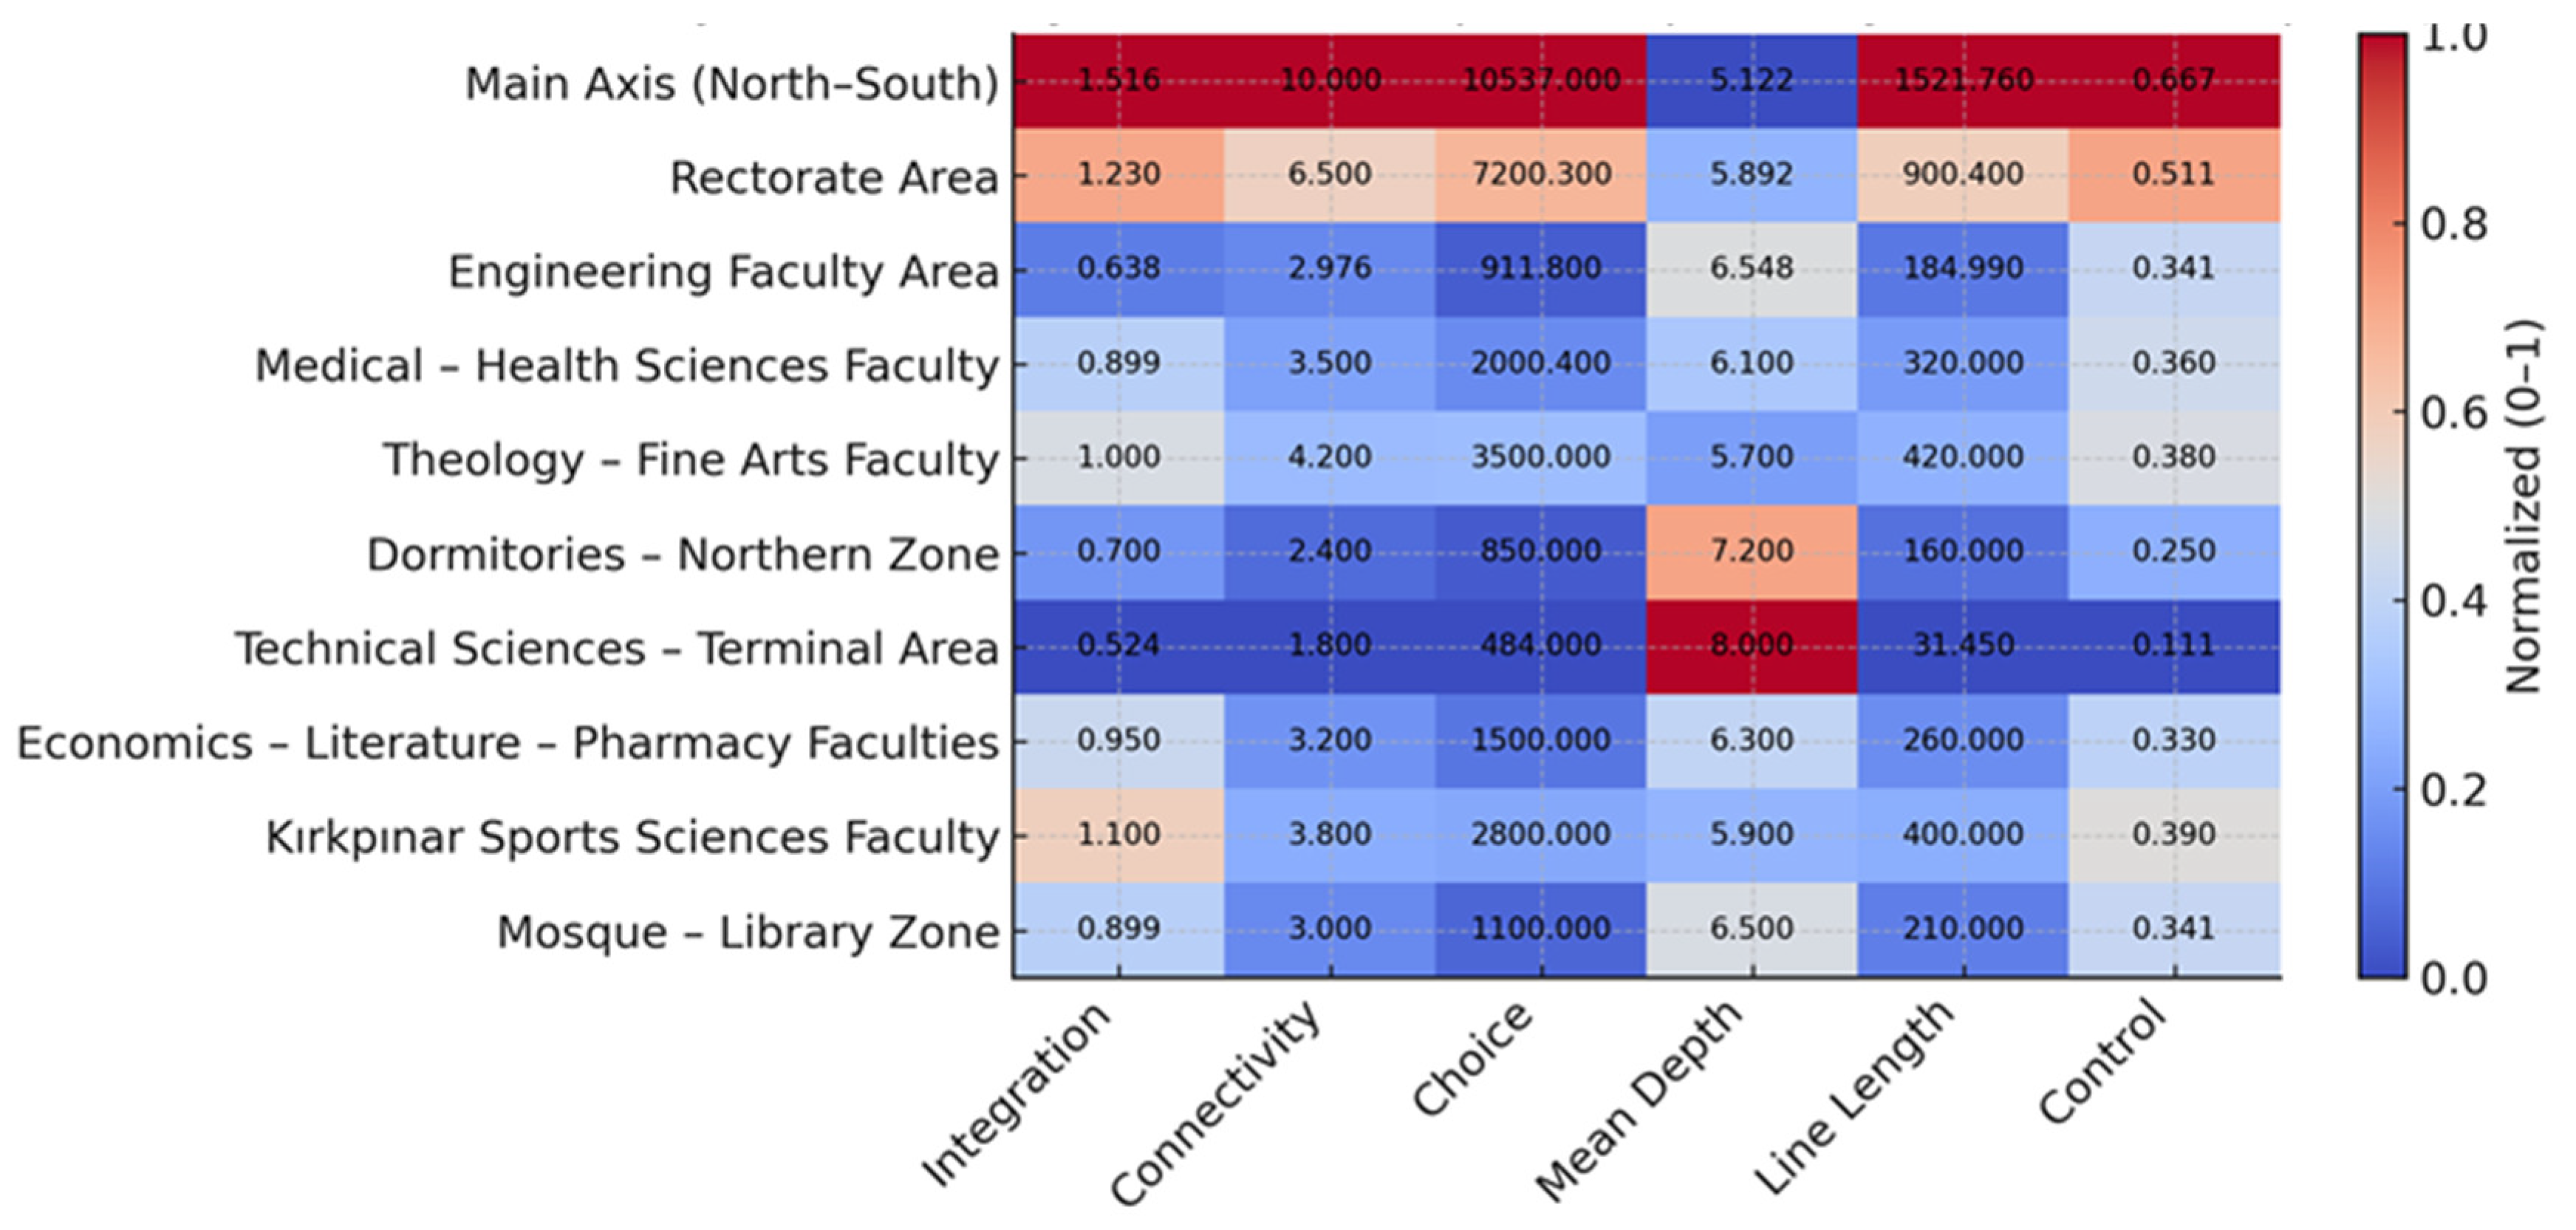
Figure 6.
Heat Map of the Correlation Between User Experience Parameters and Integration Values. Note: Red tones indicate high positive correlations, whereas light yellow tones represent negative correlations.
Figure 6.
Heat Map of the Correlation Between User Experience Parameters and Integration Values. Note: Red tones indicate high positive correlations, whereas light yellow tones represent negative correlations.
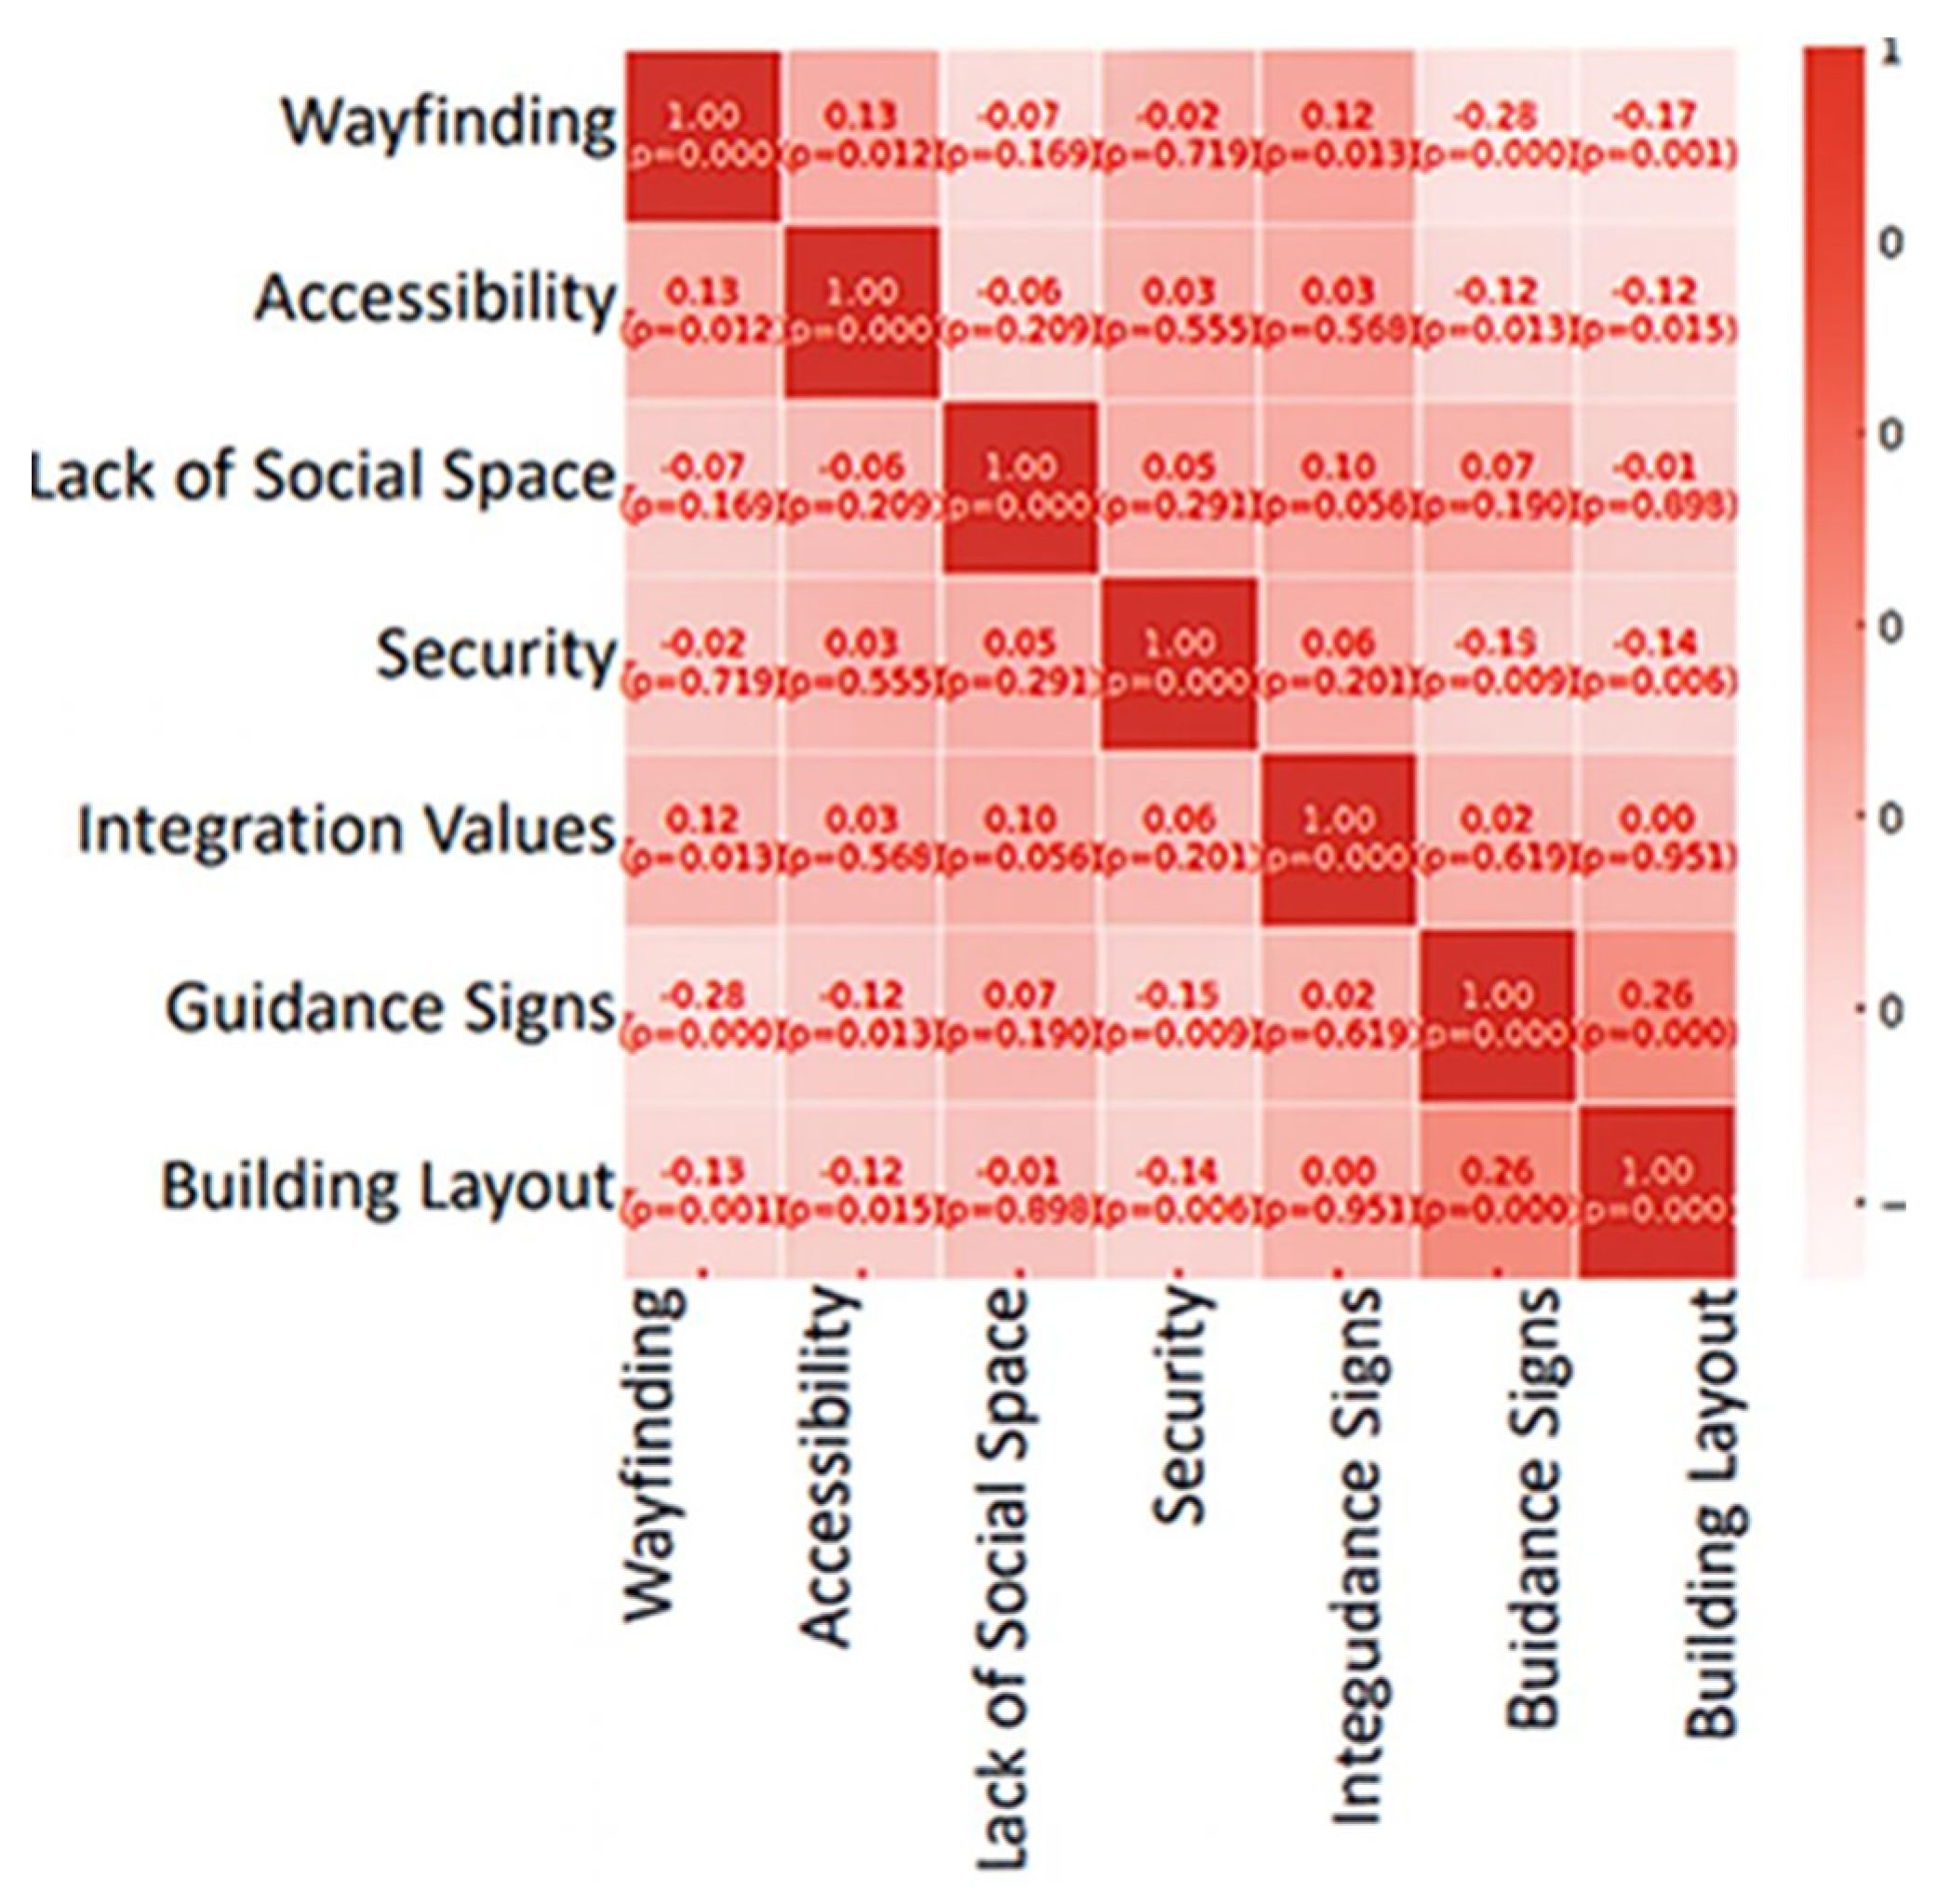
Table 1.
Balkan Campus Space Syntax Results (All metrics in normalized DepthmapX units except Connectivity = degree and Line Length = meters).
Table 1.
Balkan Campus Space Syntax Results (All metrics in normalized DepthmapX units except Connectivity = degree and Line Length = meters).
| Region / Area | Integration | Connectivity |
Choice (raw betweenness) |
Mean Depth | Line Length | Control |
| Main Axis (North–South) | 1.5159 | 10.0000 | 10537.00 | 5.1220 | 1521.76 | 0.6667 |
| Rectorate Area | 1.2300 | 6.5000 | 7200.30 | 5.8920 | 900.40 | 0.5110 |
| Engineering Faculty Area | 0.6385 | 2.9759 | 911.80 | 6.5478 | 184.99 | 0.3413 |
| Medical – Health Sciences Faculty | 0.6500 | 3.5000 | 2000.40 | 6.1000 | 320.00 | 0.3600 |
| Theology – Fine Arts Faculty | 1.0000 | 4.2000 | 3500.00 | 5.7000 | 420.00 | 0.3800 |
| Dormitories – Northern Zone | 0.7000 | 2.4000 | 850.00 | 7.2000 | 160.00 | 0.2500 |
| Technical Sciences – Terminal Area | 0.5236 | 1.8000 | 484.00 | 8.0000 | 31.45 | 0.1111 |
| Economics – Literature – Pharmacy Faculties | 0.9500 | 3.2000 | 1500.00 | 6.3000 | 260.00 | 0.3300 |
| Kırkpınar Sports Sciences Faculty | 1.1000 | 3.8000 | 2800.00 | 5.9000 | 400.00 | 0.3900 |
| Mosque – Library Zone | 0.8993 | 3.0000 | 1100.00 | 6.5000 | 210.00 | 0.3413 |
Note: The table presents the raw DepthmapX outputs for Integration, Connectivity, Choice (raw betweenness), Mean Depth, Line Length, and Control. Normalized interpretive ranges are reported in the Methods section.
Table 2.
Demographic Characteristics of the Participants.
| Variable | Value | Frequency | Percentage (%) |
| Age | 18-24 | 273 | 68.59 |
| 35-44 | 36 | 9.05 | |
| 45-54 | 35 | 8.79 | |
| 25-34 | 34 | 8.54 | |
| 55 and above | 20 | 0.03 | |
| Gender | Female | 253 | 63.57 |
| Male | 136 | 34.17 | |
| Prefer not to say | 5 | 1.26 | |
| Other | 4 | 1.01 | |
| Position in the institution | Undergraduate student | 292 | 73.37 |
| Academic staff | 78 | 19.6 | |
| Administrative staff | 18 | 4.52 | |
| Graduate student | 10 | 2.51 | |
| Duration of presence on campus | 1-3 years | 168 | 42.21 |
| 4-6 years | 79 | 1.85 | |
| Less than 1 year | 78 | 19.6 | |
| 7 years or more | 73 | 18.34 |
Table 4.
Multiple Regression Results for Preferred Campus Features Predicting Spatial Satisfaction.
| Independent Variable | Coefficient(β) | p-value |
| Social spaces | –0.510 | 0.001 ** |
| Green areas | –0.327 | 0.013 * |
| Academic buildings | –0.243 | 0.061 † |
| Library and study areas | –0.027 | 0.845 |
| Sports facilities | –0.151 | 0.306 |
| Technological infrastructure | –0.392 | 0.142 |
| Transportation convenience | –0.191 | 0.262 |
| Dormitories and accommodation | 0.046 | 0.714 |
| Events and clubs | 0.231 | 0.058 |
| Security | 0.083 | 0.612 |
Note: *p < .05, **p < .01, †marginally significant (p ≈ .06).
Disclaimer/Publisher’s Note: The statements, opinions and data contained in all publications are solely those of the individual author(s) and contributor(s) and not of MDPI and/or the editor(s). MDPI and/or the editor(s) disclaim responsibility for any injury to people or property resulting from any ideas, methods, instructions or products referred to in the content. |
© 2025 by the authors. Licensee MDPI, Basel, Switzerland. This article is an open access article distributed under the terms and conditions of the Creative Commons Attribution (CC BY) license (http://creativecommons.org/licenses/by/4.0/).
Copyright: This open access article is published under a Creative Commons CC BY 4.0 license, which permit the free download, distribution, and reuse, provided that the author and preprint are cited in any reuse.


