
Submitted:
09 January 2025
Posted:
10 January 2025
You are already at the latest version
Abstract
This study introduces a concise questionnaire designed to evaluate the quality of urban public spaces as a simplified method for collecting community needs and perspectives, enabling these insights to be effectively combined with metrics and viewpoints from policymakers and decision-makers. The case study was carried out in one of the smallest municipalities of Attica, in the small town of Kaisariani (Athens), with an emphasis on the central square and the park of the area. Findings show that the majority of respondents prioritize improving the vegetation and lighting of Kaisariani Square, as well as demands for more benches and cultural/art elements. The most important starting experience was the feeling of neglect and lack of cleanliness. Concerns about lighting and lack of care/cleanliness were also key at the park. Addressing current gaps in the public space assessment literature, the study lays the groundwork for future research and supports the creation of easy-to-use quality assessment tools. Unlike existing methods, the proposed tool offers a more accessible and efficient way of collecting data on urban space quality. As the urban environment grows, the adoption of such techniques will become increasingly important in creating viable, sustainable communities that promote the well-being of citizens.
Keywords:
urban public spaces
; urban space quality
; users’ perceptions
; urban square
; urban park
1. Introduction
1.1. Background Information and Problem Statement
Urban public spaces are an integral part of city life, significantly influencing the well-being of residents [1]. These spaces facilitate social interactions, economic activities, and environmental sustainability [2,3,4,5]. In addition, they preserve cultural heritage, promoting community identity [6,7]. However, contemporary urbanization confronts several challenges, including environmental degradation, socioeconomic inequities, and insufficient efforts to control development, all of which are contributing to a reduction in the quality of public space throughout the world [8,9].
Given the importance of public places, it is clear that they must be assessed; nevertheless, this evaluation is multifaceted and enigmatic. Despite the importance of urban space evaluation, there is a lack of universal methodologies that combine qualitative and quantitative analyses effectively. The availability (the actual number of spaces, the ratio per resident, etc.), accessibility and walkability of these spaces, safety, maintenance and cleanliness, urban equipment, greenery, comfort, inclusion, the element of culture and identity (city branding), etc. are some of the very specific elements that compose the quality of public space [1,10,11]. Traditionally, attempts to evaluate these factors have required extensive surveys and the use of complicated tools for data collecting, which may be challenging and time-consuming for both respondents and researchers [10,12]. Therefore, it is imperative to develop new, comprehensive, and efficient methods of data collection that will encourage public participation and involvement in issues related to public space quality [10,13]. Overall, these strategies may be applied in a wide range of dimensions, from gathering data for municipal investigations and business planning to community debates and decision-making for urban solutions [14,15]. To address this need, a short survey for measuring the quality of urban spaces is proposed in the present article.
The inspiration for this study is the difficulties posed by current evaluation techniques, especially in light of the quickly changing urban landscapes and the growing need for immediate, practical solutions [16,17,18]. By utilizing recent developments in survey design, we want to create a brief yet effective tool that quickly conveys the essential aspects of urban space quality. This strategy fits in with the larger movement toward adaptable and responsive planning techniques that prioritize data-driven decision-making and stakeholder involvement [19].
1.2. Literature Review
Urban spaces are a key aspect of city operations and frequently have several effects on the quality of life for residents [20]. Given suitable urban planning and well-regulated administration of all linked challenges, there is an urgent need to recognize and analyze the quality of public green spaces [10]. The findings are based on an overview literature study of methodologies and instruments for assessing the quality of the urban environment.
Primary research on the idea of public space alongside the way its attributes affect users was done by Whyte (1980) [21], who also looked at behavioral patterns, how public spaces interact with the physical environment, and how these factors affect social interactions and citizen mobility [21]. A decade later, Carr and Francis (1992) [22] provided a thorough analysis of public space, with particular emphasis on its social component and providing information on best planning and management techniques [22]. They underlined the importance of taking into account the requirements of the actual users of the public space, the physical parameters of the public space as well as the search for active meanings during the design and management phases. Public space management is a set of procedures meant to maintain its operation while attending to the various requirements and interactions of users [23]. These procedures involve controlling usage and settling disputes, upholding safety and sanitation standards, funding upgrades, and organizing interventions. Good management maintains safety and usefulness while promoting public spaces as centers of social interaction via continuing maintenance and curation of key elements [9]. However, even with a diverse set of assessment approaches, the evaluation of public space quality is typically fragmented, focusing on certain features at different times and locations, resulting in specialized but limited perspectives [24].
The emphasis on the elements that influence how people perceive their experiences in public places has led to a great deal of study being done to define precise quality standards and requirements for developing inclusive spaces that satisfy a range of demands. From an anthropocentric perspective, modern research has also attempted to update conventional models, like Montgomery’s (1998) [25], highlighting the interaction between the built environment’s characteristics and the activities occurring within these spaces. This method clarifies social dynamics and user-space interactions [25,26]. More specifically, the Danish Gehl Institute has developed a thorough framework of 12 criteria that emphasize the significance of user-centered design when evaluating the sustainability of public space [27]. Broader analyses also emphasize the significance of digital technology integration and multi-criteria approaches in the study and design of public space interventions. Tools like the “Public Space Quality Index (PSQI)” offer a strong basis because they provide a framework that is flexible enough to adjust to various situations and can take changing criteria into account [28]. However, there are still challenges, particularly when it comes to balancing data from many stakeholders, collecting data that may be complicated, accessing data that requires time, etc [10,28]. The evaluation of public space quality needs to be updated regularly to take into account changing social requirements and new issues like the COVID-19 pandemic, climate change, and humanitarian and economic crises. The idea of establishing lively public areas has gained popularity as a human-centered strategy for transforming public areas into resilient, sustainable, and welcoming communities, especially in sizable modern centers. The reasoning presented in this article guarantees the examination of important quality characteristics using a brief questionnaire that can be readily customized to meet the specific requirements of any situation. Examples of questions found in many research are included in the variables that have been chosen; these questions were influenced by current issues arising from recent occurrences like the pandemic and the global warming crisis [12,29].
Local knowledge frequently enhances certain environmental quality metrics, as shown in Adams’ (2014) [30] study, highlighting the need to consider both viewpoints. Understanding well-being in urban areas requires a grasp of the relationship between subjective and objective understanding [30]. Similarly, different people have different ideas about what constitutes a high-quality public space, and user views are influenced by physical, social, and symbolic characteristics. Additionally, ideas like urban sustainability are developed by the experiences and ideals of both individuals and groups, and they are relative to different situations. A more holistic approach to comfort is being adopted, one that challenges the visual-centric focus of urban design by taking into account other sensory experiences in urban environments, such as hearing, smell, touch, etc [31,32,33,34]. It acknowledges how perception, thought, and emotion influence how individuals see space. Since there is a known link between well-designed urban settings and people’s health and well-being, all of the previously mentioned variables contribute to the circumstances of well-being in urban environments [30].
The exploration of public spaces through questionnaire surveys reveals a landscape of diverse methodologies aimed at evaluating key dimensions such as accessibility, availability, safety, inclusivity, comfort, and identity. In recent years, comprehensive indices like the Public Space Index (PSI) have been developed and applied, enabling systematic evaluations of public spaces across multiple dimensions [35,36]. Studies utilizing the PSI, such as those by Evans et al., have extended its application to varied environments, providing empirical evidence on dimensions like inclusiveness, safety, and comfort [37]. Advancements in technology have led to the integration of digital tools and geospatial methods into survey methodologies. Geo-questionnaires, which incorporate spatial data within questionnaires, have been highlighted for their ability to capture spatially explicit participant feedback and preferences in urban planning contexts. Similarly, digital tools for remote audits have been employed for cost-effective and extensive data gathering, particularly in accessibility assessments [38,39]. Complementing these technological advancements, participatory approaches have been increasingly incorporated into survey designs, emphasizing the engagement of diverse user groups. Studies such as those by Dhasmana et al. and Selanon et al. have employed mixed-methods approaches encompassing qualitative and quantitative elements to holistically understand diverse stakeholder needs in public space design [40,41]. This methodological blend is considered effective for capturing comprehensive user experiences and addressing inclusivity. Several studies focus specifically on the inclusivity and accessibility of public spaces for vulnerable groups, including those with disabilities or specific gender considerations [40,42,43]. Research by Mrak et al. and Ahmad et al. underscores the significance of tailoring surveys to understand accessibility barriers, emphasizing the need for stratified sampling methods to include various demographic groups [43,44]. Cultural and contextual nuances also play a pivotal role in public space assessment, with research highlighting variations in perceptions and preferences across different socio-cultural settings. Cross-cultural studies, such as those by Belaroussi et al., examine how cultural biases may influence public space satisfaction, indicating the complexity and necessity of context-sensitive assessment methodologies [45]. Questionnaire surveys in public space assessment are marked by a blend of traditional and innovative methodologies designed to encapsulate user experiences comprehensively. While instruments like the PSI offer structured frameworks, emerging digital and participatory approaches provide new dimensions to this field. These developments emphasize the intricate balance required in addressing diverse user needs within public spaces and reinforce the continued evolution of survey methodologies to meet these challenges. In summary, the literature underscores the need for comprehensive assessment tools that consider users’ subjective experiences while integrating multi-criteria evaluation for a balanced approach.
1.3. Research Objectives
More specifically, the primary objectives of this research are:
- To offer a simplified method for collecting community needs and perspectives on public spaces, enabling these insights to be effectively combined with metrics and viewpoints from policymakers and decision-makers. By bridging the gap between community feedback and official evaluations, this approach facilitates more informed, responsive urban planning and fosters better alignment between public expectations and policy initiatives.
- To develop a concise questionnaire for collecting essential data on the quality of public spaces (e.g., squares, parks) as a practical and user-friendly tool for public space evaluation.
- To ensure the questionnaire is brief and accessible, citizens can complete it either through a short on-site interaction during their use of the space or online.
- To provide a foundational structure for the questions, ensuring adaptability to different contexts and needs.
- To establish guidelines for assessing public space quality, focusing on gathering data about the current conditions, identifying vulnerabilities, exploring potential interventions based on user needs, and comparing outcomes before and after any renovations.
- To analyze the collected data through a real case study, extracting useful insights that can inform evidence-based improvements and planning decisions.
1.4. Structure of the Paper
The structure of this research will be organized as follows: The introduction presents the study’s main objectives and provides a comprehensive literature review on public space quality assessment methodologies. The materials and methods section will outline the study’s overall design, focusing on using short questionnaires to evaluate public space quality. This section will highlight how the tool is designed to gather key data efficiently from users in various settings. Following this, the analysis will include a detailed statistical examination of the case study where the questionnaire was applied, offering insights into the practical outcomes of the research. The discussion section will critically interpret the results, comparing them with existing literature and assessing the implications of the findings for both the methodology and broader public space planning. Finally, the results section will present the findings of the study, summarizing the effectiveness of the tool and its potential impact on public space planning and management.
2. Materials and Methods
2.1. Study Design
The development and validation of the questionnaire followed a structured, multi-phase process. Initially, an extensive literature review was conducted to identify key factors relevant to the quality of public spaces, which guided the conceptualization of the questionnaire items. Following this, the questionnaire was drafted, and the sample for the study was determined. The questionnaire was distributed through a combination of face-to-face distribution in public spaces (in situ and door-to-door) and via e-mail. After collecting the responses, the data were entered into SPSS for statistical processing. The final results provided insights into both the effectiveness and reliability of the questionnaire itself, as well as valuable findings specific to the quality of the public space in the area studied. This study seeks to address the existing literature gap, highlighting the need for a more comprehensive and methodologically robust approach to developing quality assessment questionnaires for public open spaces. While numerous studies advocate for a structured, multidimensional approach, challenges persist in ensuring thorough coverage of all relevant quality dimensions. By integrating user perceptions with structured observational frameworks, this study aims to offer valuable insights that can enhance urban planning efforts and improve the overall quality of public spaces.
2.2. Questionnaire Development
Researchers often prioritize a multidimensional approach that balances user perceptions with objective evaluations when developing quality questionnaires for assessing public open spaces. Surveys and structured observations are widely regarded as effective methods [46]. Carmona’s framework highlights the importance of function, form, and appearance, promoting public spaces that support diverse uses and foster community interaction [23,47]. Gehl’s work emphasizes human scale, social interaction, and the need for spaces encouraging social activities, aligning closely with studies focused on user experience and comfort [11,20]. A recurring theme in the literature is integrating multi-criteria analysis and developing indices for comprehensive spatial quality assessments. In the context of Algerian urban spaces, long-term structured observations contributed to creating the Public Space Index (PSI), which evaluates inclusiveness, safety, and comfort [48]. Similarly, the Public Space Quality Index (PSQI) has synthesized user feedback and observational data, illustrating the synergy between qualitative and quantitative methods [49]. User perception surveys are commonly employed to capture subjective experiences, underscoring their importance in public space assessments [50,51]. The critical dimensions frequently assessed in these studies include availability, accessibility, safety, comfort, urban equipment features and maintenance, identity value, etc [10,52]. However, some studies place less emphasis on other dimensions, such as identity value or negative experiences, indicating opportunities for broader evaluation [53]. Best practices in questionnaire design stress the need for clarity, relevance, and inclusiveness. Nonetheless, references to pilot testing or cognitive interviewing—a key aspect of methodological rigor—are rarely detailed in the existing literature, highlighting a gap in the research [54]. Additionally, cultural sensitivity is seldom discussed, indicating a need for future studies to adapt questionnaires to diverse user demographics and cultural contexts more effectively [55].
One of the primary principles of the current methodology is that the questionnaire’s format should be clear, concise, and take the least amount of time to complete. Longer surveys have been demonstrated to cause respondent weariness, decreased focus, and a higher chance that the findings won’t accurately represent reality since respondents will provide fewer thoughtful replies [56,57,58]. Therefore, there isn’t an absolute standard for when to terminate respondents’ interest since human attention spans might differ based on several variables, including the study topic, the respondents’ demographics, and the research setting. Nonetheless, it is widely acknowledged that to reduce respondent tiredness and preserve the quality of the data, surveys should be brief, lasting no more than 20 minutes [59]. A series of controlled research examining how survey length affected the quality of responses in online survey environments is interesting. The results demonstrated that the quality of the responses began to deteriorate after the 10-minute mark, which, depending on the platform, equates to around 40–50 questions. A drop in the quality of replies to open-ended questions, a move toward more neutral responses, an increase in randomized responses, and a decline in respondent satisfaction ratings were among the noteworthy developments [60].
2.3. Evidence Generation
The questionnaire was developed based on an extensive review of relevant literature, identifying key factors. These theoretical frameworks informed the generation of questions aimed at assessing both general perceptions of urban spaces and specific experiences within the area being studied. The questions were designed based on the most common challenges highlighted in the literature, to ensure they address users’ core needs.
2.4. Questionnaire Structure
The questionnaire was structured into several sections:
a. Research Information and Consent: Participants were first introduced to the study and provided a consent form to ensure informed and voluntary participation.
b. Questions on the Wider Area/Neighborhood: This section focused on participants’ broader perceptions of their neighborhood, such as:
- Sufficiency and quality of public spaces
- Frequency of use/visits
- Awareness of upcoming renewals or urban developments
- Receptiveness to planned metro extensions
c. Questions on Specific Public Spaces: Participants evaluated key public spaces within the municipality (e.g., central square, parks), with questions targeting:
- The overall quality of the space
- Accessibility and walkability
- Safety during both day and night
- Quality of urban equipment (benches, bins, lighting, flooring)
- Quantity and quality of greenery/vegetation
- Open-ended improvement suggestions (“If I could improve something in this space, it would be...”)
- Evaluation of the space’s role in contributing to the identity of the city/neighborhood
- Reporting any negative experiences
This section also allowed for a comparative analysis between public spaces, focusing on two major sites—Central Square and Skopeftirio Park—as case studies for the questionnaire’s effectiveness and adaptability.
d. Demographics: To explore how demographic factors influenced participants’ assessments of public space quality, this section collected information on:
- Gender identity
- Age
- Presence of disabilities
- Parental status (whether participants had minor children)
- Educational background
- Relationship with the municipality (whether participants were permanent residents, worked in the area, or frequently visited for other reasons)
These demographic factors provided additional context for understanding how different groups perceive and experience public spaces. To ensure the questionnaire effectively captured both the quality of public spaces and relevant demographic information, a series of meetings were held with experts in inclusion and anthropological data analysis. These experts provided critical insights into formulating questions that were not only comprehensive but also accessible to diverse populations. Their contributions focused on identifying the most efficient and deductive approaches for collecting meaningful data, with an emphasis on maximizing the amount of useful information while minimizing the number of questions. This collaborative approach helped to ensure that the questionnaire was both inclusive and streamlined, enabling the collection of rich, actionable data from a broad range of respondents.
2.5. Study Population and Data Collection
a. Location
Urban planning and community engagement have become pivotal themes in discussing sustainable development and socio-cultural resilience in cities. This review pivots on studies conducted in Athens, Greece, highlighting insights applicable to the specific context of Kaisariani, an area known for its historical, cultural, and environmental heritage. While the studies highlighted provide broad insights into urban planning and community engagement in Athens, a specific focus on Kaisariani remains underexplored. The identified themes point toward sustainable planning practices and participatory governance as crucial pathways for future research specific to its unique attributes.
Kaisariani is an urban municipality in the Central Sector of Athens, located just 3 kilometers east of the city center at an elevation of 130 meters, on the northwest slopes of Mount Hymettus. It shares borders with the municipalities of Zografou and Athens to the north, Vyronas and the Pagrati district of Athens to the south, and Athens again to the west. To the east lies Mount Hymettus, offering a natural backdrop. The municipality covers approximately 8,500 acres, of which 7,500 acres consist of mountainous forest and green spaces, while the remaining 1,000 acres are residential and communal areas. The actual habitable area is around 780 acres. Kaisariani is triangular in shape and well-planned, with a central avenue and a network of horizontal and vertical streets radiating from it. According to the 2021 census, the population of Kaisariani was 26,269 [61] (Figure 1). The urban identity of Kaisariani is closely intertwined with the historical developments that marked modern Greece, culminating in the Asia Minor Catastrophe and the issue of refugee resettlement, during the interwar period. The settlement’s evolution can be distinguished in three phases; the first phase spans from the initial settlement in 1922 to 1935. The second phase, from 1935 to 1960, saw the development of the eastern part of the area around the Skopeftirio and the National Gymnasium, with expansion along the main avenue (Ethnikis Antistaseos Av.). The third phase, from 1960 to the present, is characterized by the settlement extending towards the foothills of Mount Hymettus [62].
b. Sampling
For this study, a representative sample was determined based on the area’s population (municipality of Kaisariani, Athens), which was 26,269 according to the 2021 census. Using a sample calculation system, it was determined that 379 or more responses would be required to achieve a 95% confidence level, ensuring that the true population values fall within ±5% of the measured values. A total of 458 questionnaires were collected, exceeding the minimum required sample size, thus enhancing the reliability of the data. The questionnaire was distributed across various groups and locations within the municipality of Kaisariani to ensure a diverse and representative sample. Distribution points included the main Square during field research, businesses along Kaisariani’s main Avenue, employees of local companies and schools, KAPI (the municipal seniors’ center), and the municipality’s cultural center. In addition to an in-person collection, the questionnaire was distributed door-to-door and via email to cultural and sports associations, as well as to other interested citizens who expressed a willingness to participate in the research. This approach ensured a broad coverage of different social and demographic groups in the area.
c. Instructions for Respondents
Participants were provided with the following instructions to guide them through completing the questionnaire:
i. Purpose: The questionnaire is designed to assess the quality of public spaces in your area. Your answers will help us better understand and explore the needs of the real users of these public spaces, allowing for improvements that reflect the community’s actual needs.
ii. Confidentiality: All answers are anonymous and will be used solely for research purposes. No personal information will be linked to your responses.
iii. Eligibility: You must be an adult (18 years or older) and agree to voluntarily participate in this survey.
iv. Completeness: Please answer all questions to the best of your ability. There are no right or wrong answers, and your honest input is important.
v. Response Format: Some questions require selecting an option, while others allow for open-ended responses. For multiple-choice questions, choose the option that best reflects your view. For open-ended questions, feel free to provide additional details or suggestions.
vi. Time Required: The questionnaire should take no more than 5 minutes to complete.
These instructions ensured that participants understood their role in providing valuable insights into the quality and needs of public spaces, as well as the steps for completing the questionnaire.
2.6. Validation Process
a. Pilot Tests
A preliminary version of the questionnaire was tested to assess its clarity, ease of use, and effectiveness in collecting relevant data. Based on feedback from participants and initial findings, several improvements were made. These adjustments included refining certain questions to reduce ambiguity and adjusting the response scales to improve clarity and relevance. This ensured that the final version of the questionnaire was more concise and effective at capturing the desired information about public space quality.
b. Statistical Validation
To validate the reliability and accuracy of the questionnaire, several statistical methods were employed:
- Reliability Testing: Cronbach’s alpha was used to assess the internal consistency of the questions about the quality of Kaisariani Square, ensuring that the items within each construct were measuring the same underlying concept. This method also helped evaluate the potential impact of any missing questions on the overall reliability of the scale.
- Factor Analysis: Factor analysis was conducted to explore the dimensional structure of the questionnaire, determining which items clustered together to form significant constructs related to public space quality.
- Content Validity: Expert reviews and pretests were carried out to ensure that the questionnaire adequately measured the intended factors related to the quality of urban spaces. This ensured that the content covered all relevant aspects of the study’s objectives.
- Construct Validity: The questionnaire was tested against existing theories and measures of urban space quality to confirm that it accurately reflected the constructs it aimed to measure. This process helped ensure that the instrument was aligned with established research in urban planning and public space analysis.
c. Statistical Methods and Data Analysis
- Quantitative Variables: Expressed as mean (Standard Deviation) to summarize central tendencies and variability.
- Qualitative Variables: Reported as absolute and relative frequencies to provide an overview of categorical data distributions.
- Spearman Correlation Coefficients: Used to assess the correlation between ordinal variables, such as the relationship between frequency of use and perceived quality of public spaces.
- Kruskal-Wallis Test: This non-parametric test was employed to compare qualitative variables across more than two groups, ensuring robust comparisons across different segments of the population.
d. Statistical Significance
All p-values were two-tailed, with statistical significance set at p<0.05. Data analysis was conducted using SPSS statistical software (version 25.0), ensuring that the findings were statistically robust and reliable.
3. Results
In this specific application, a 24-question survey was created, following the detailed guidelines outlined in the field materials and methods, includes several key sections: an informational text about the research along with a consent form, questions related to the broader Kaisariani area, questions focused on specific public spaces within the municipality (such as Panagiotis Makris and Kimiseos Theotokou (Pangitsa) Square, and the Skopeftirio Park), demographic questions, and a section for open-ended comments. Questions 1, 2, 3, 4, and 17 focus on the broader area of Kaisariani, addressing topics such as the adequacy of public open spaces, their overall quality, frequency of use or visits, awareness of upcoming renovations (e.g., the redevelopment of Kaisariani Square), and residents’ receptiveness to the planned metro expansion (Athens Metro Line 4).
Also, a pilot survey was first conducted with a sample of 10 citizens to assess the questionnaire’s validity and reliability. Based on the feedback, revisions were made, focusing primarily on simplifying the wording and adjusting the coding of the questions for better clarity. Additionally, a section was introduced at the end of the questionnaire, allowing respondents to leave comments aimed at gathering more comprehensive insights. Based on insights from the pilot survey and previous experience, it was observed that participants, particularly in face-to-face settings, were more inclined to complete the questionnaire when it began with research-related questions rather than personal or demographic ones. This approach increased engagement and willingness to participate. The questionnaire was distributed across various groups and locations within the municipality of Kaisariani to ensure a diverse and representative sample. Key distribution points included the main square during fieldwork, local businesses along the central avenue, employees of nearby companies and schools, KAPI (the municipal senior center), and the municipality’s cultural center. In addition to these in-person methods, the survey was delivered door-to-door and e-mailed to cultural and sports associations, as well as to interested citizens who volunteered to participate. This multi-faceted approach ensured broad coverage of different social and demographic groups in the area.
Following these, the questionnaire includes questions related to specific public spaces within the municipality. These focus on the two central squares of Kaisariani, where the research was conducted (questions 5-13), and Skopeftirio Park (questions 14-16) to gather more targeted data on user experiences. These questions assess the general quality of the spaces, accessibility and walkability, safety during day and night, the condition of urban amenities (benches, bins, lighting, paving materials, etc.), and the quantity and quality of greenery. Respondents are also asked to suggest improvements for these key areas by selecting from multiple options or providing open-ended feedback. Additional questions evaluate the spaces’ significance to the city’s identity and record any negative experiences. Finally, questions 18 to 24 focused on demographic data to explore the respondent’s level of connection to the municipal unit. These questions investigated whether the participant is a permanent resident working elsewhere, works in the area but lives elsewhere both lives and works in the area, or visits frequently for family or other reasons. Additional demographic information gathered included gender identity, age, presence of a disability, parental status (specifically if they have minor children), and educational background. Responses were gathered using two formats: a Likert-type scale ranging from 1 (strongly disagree) to 5 (strongly agree), and close-ended multiple-choice questions. This approach provided a balance between capturing nuanced opinions and enabling clear, easy-to-interpret responses. Additionally, participants were allowed to add their comments at the end, offering further insights and suggestions that enriched the data collected.
The sample consisted of 458 participants, whose demographic characteristics are presented in Table 1. Most of the participants were women (67.7%), Bachelor’s holders (36.7%), and permanent residents of Kaisariani (44.1%). Moreover, 25.8% of the participants were 41-50 years old, and 60.7% did not have underaged children. Furthermore, 84.1% of the participants were not business owners in Kaisariani, and 73.6% did not have difficulties with movement.
When asked about the availability of free public spaces in Kaisariani, a significant portion of respondents (41.6%) indicated that there are several such spaces, including parks, squares, and playgrounds. Another 29.8% felt that the number of public spaces is moderate, neither too many nor too few. However, 16.4% of participants believe that the availability of free public spaces is limited, while 4.2% perceive it as very limited. Only 8% of respondents felt that Kaisariani offers a wide range of free public spaces (Figure 2).
Regarding the frequency of use, the majority of respondents visit public spaces frequently, with 40% reporting daily visits, and a notable portion (25,1%) visiting often (3 to 4 times a week). Additionally, 18.6% visit twice a week, while 12% pass through public spaces once a week. Only 3.7% (17 respondents) stated that they never choose to visit these spaces (Figure 3).
When asked about the quality of free public spaces, the majority of respondents (59.2%) rated them as mediocre. Another 18.3% described the quality as poor, while 16.4% viewed it as good. A smaller portion, 5.9%, rated the quality of public spaces in Kaisariani as very poor (Figure 4).
Regarding the redevelopment of Kaisariani Square, most respondents were aware of the project but expressed skepticism (28.8%), while 28.6% viewed it positively. Additionally, 16.7% were aware of the redevelopment but had no opinion, and 13.6% were unaware of it entirely. A smaller group (12.3%) reported being well-informed through presentations by the Municipality, local newsletters, the internet, and other sources (Figure S1). Regarding the construction of the metro station in Kaisariani, 36.6% of respondents viewed the project positively, though they noted some negative aspects. Another 33.6% considered it highly positive for the area. Meanwhile, 14.9% felt the project had an equal mix of positive and negative outcomes, while 7.6% believed it was mostly negative, with a few positive elements (Figure S2).
A Spearman’s rank-order correlation was conducted to examine the relationship between age, business ownership, having children under 18, and education level with opinions regarding the square of Kaisariani and Skopeftirio. Results showed a weak but statistically significant negative correlation between age and perceptions of free public spaces (Spearman’s rho = -0.105, p = 0.025), suggesting that older respondents tend to perceive fewer public spaces compared to younger ones. Similarly, there was a weak but statistically significant negative correlation between age and the perceived quality of the square in Kaisariani (Spearman’s rho = -0.127, p = 0.007), indicating that older individuals rated the square’s quality lower than their younger counterparts. A comparable weak but statistically significant negative correlation was found between age and perceptions of urban equipment quality (Spearman’s rho = -0.103, p = 0.029), meaning that older respondents tended to rate urban equipment slightly lower than younger individuals. Conversely, a weak to moderate, statistically significant positive correlation was observed between age and the view of the square as a key part of Kaisariani’s identity (Spearman’s rho = 0.192, p = 0.000). This suggests that older respondents might have a stronger attachment to or sense of the square’s significance as part of Kaisariani’s identity. Additionally, a statistically significant positive correlation (Spearman’s rho = 0.207, p = 0.000) between age and opinions about the new metro station in Kaisariani indicates that older individuals tend to hold more favorable views of the metro station than younger respondents (Table 2). There was a statistically significant positive correlation between business ownership and the frequency of passing per week from the square in Kaisariani (Spearman’s rho = 0.156, p = 0.001), indicating that individuals who own or plan to own a business tend to visit the square more often than those who do not. Additionally, a positive correlation was found between business ownership and the perceived quality of the square (Spearman’s rho = 0.159, p = 0.001), suggesting that business owners or prospective owners tend to rate the square’s quality higher compared to non-business owners. There was a statistically significant negative correlation between having children under 18 and the perceived quality of free public spaces (Spearman’s rho = -0.116, p = 0.014), indicating that as the number of children under 18 in a household increases, perceptions of public space quality tend to decline. A positive correlation between having children under 18 and the frequency of visits to the square in Kaisariani (Spearman’s rho = 0.099, p = 0.036) suggests that individuals with children are more likely to visit the square more often than those without children.
Additionally, there was a negative correlation between having children under 18 and perceived safety at the square during the day (Spearman’s rho = -0.105, p = 0.026), implying that households with more children under 18 tend to feel less safe at the square during the day. Finally, a negative correlation was found between having children under 18 and the perceived quality and quantity of greenery in the square (Spearman’s rho = -0.099, p = 0.035), suggesting that households with more children tend to view the greenery in the square as being of lower quality and quantity.
There was a statistically significant negative correlation between education level and perceptions of regeneration in Kaisariani (Spearman’s rho = -0.161, p = 0.001), indicating that individuals with higher education levels tend to have less positive or informed views on regeneration efforts. Additionally, a positive correlation between education level and perceived safety in the square at night (Spearman’s rho = 0.101, p = 0.034) suggests that those with higher education levels are more likely to feel safer in these urban spaces during the night. A negative correlation was also observed between education level and the perceived quality and quantity of greenery in the square (Spearman’s rho = -0.128, p = 0.007), suggesting that as education increases, perceptions of the greenery’s quality and abundance tend to decline.
Table 3 summarizes participants’ opinions on how to improve Kaisariani Square. Better accessibility and walkability were favored by 38.2% of women and 42.8% of men, with a total of 39.7% expressing this preference. In terms of safety, 36% of respondents overall wanted the square to feel safer, with 37.2% of women and 33.8% of men highlighting this concern.
More than half of the women (55%) and men (53.1%) indicated that improved lighting was important, with 54.4% overall supporting this idea. The majority of participants also emphasized the need for upgrades to the greenery, with 79% of women and 77.9% of men in favor (78.7% overall). The addition of water features was desired by 38.2% of women and 35.2% of men, resulting in an overall preference of 37.3%. Regarding noise reduction, 37.2% of women and 39.3% of men wanted a quieter square (37.9% overall). Weather protection was another common request, with 43.4% of women and 37.2% of men calling for this improvement (41.4% overall). When it came to seating and rest areas, 60.5% of women and 56.6% of men expressed a need for more benches (59.4% overall). Waste disposal was a concern for 49.5% of women and 34.5% of men, totaling 44.7%. Cultural and artistic elements were also desired, with 59.5% of women and 49.7% of men supporting this enhancement (56.6% overall). Access to free Wi-Fi was requested by 37.5% of women and 42.1% of men (39% overall). Exercise equipment was less popular, with 13.9% of women and 9% of men advocating for its addition (12.5% overall). Public toilets were desired by 24.3% of women and 32.4% of men, contributing to a 27% overall preference. Finally, 46.9% of women and 35.9% of men wanted designated areas for children (43.4% overall), while 5.8% of women and 4.8% of men suggested other improvements (5.7% overall).
Table 4 summarizes the participants’ negative experiences in Kaisariani Square, ranked from most to least common. A feeling of neglect or lack of cleanliness was reported by 46.5% of participants (48.1% of women and 43.1% of men). Discomfort from extreme temperatures or loud noise affected 18.2% overall (19% of women and 16% of men). Difficulty crossing the square was noted by 18.1% of respondents (15.8% of women and 23.6% of men), and fear due to poor lighting was felt by 13.2% (14.8% of women and 9.7% of men). Fall-related accidents were experienced by 10.3% (11.9% of women and 6.9% of men), while theft affected 6.4% overall (5.8% of women and 7.6% of men). Harassment incidents were reported by 2.9% (3.5% of women and 1.4% of men), with racist attacks being mentioned by 1.3% of respondents (1.6% of women and 0.7% of men). Car accidents were the least reported issue, experienced by 2% overall (2.8% of women and 0.07% of men). Lastly, 25% of participants (24.2% of women and 26.4% of men) reported no negative experiences.
Table 5 presents the participants’ views on improving Skopeftirio Park. A total of 28.5% of respondents, including 27.7% of women and 29.9% of men, expressed a desire for better accessibility. In terms of safety, 75.4% of respondents overall wanted the Skopeftirio to provide a greater sense of safety, with 76.7% of women and 72.9% of men highlighting this need. Improved lighting was considered important by 72.9% of women and 68.1% of men, resulting in an overall preference of 71.5%. Additionally, the majority of participants supported the upgrading and care of the existing greenery, with 71.3% of women and 73.6% of men in favor (72.1% in total).
The addition of water features was requested by 46.5% of women and 54.2% of men, with a total preference of 49.1%. For noise reduction, 16.5% of women and 14.6% of men suggested a quieter Skopeftirio, with a combined total of 15.8%. Regarding weather protection, 45.8% of women and 52.1% of men asked for this improvement, bringing the overall percentage to 48%. In terms of seating and resting areas, 56.5% of women and 56.9% of men expressed the need for more benches (56.8% in total). Waste bins were also a priority, with 53.5% of women and 51.4% of men requesting more, for a total of 52.9%. Furthermore, 56.1% of women and 56.3% of men supported enhancing the cultural and artistic elements of the Skopeftirio (56.4% overall). Access to free Wi-Fi was highlighted by 33.2% of women and 37.5% of men, resulting in a combined preference of 34.9%. The addition of exercise equipment was desired by 27.7% of women and 32.6% of men (29.4% overall). Public toilets were requested by 39.4% of women and 53.5% of men, bringing the overall preference to 43.9%. Finally, 45.5% of women and 50.7% of men expressed the desire for designated children’s areas (46.9% overall), while 10.6% of women and 10.3% of men suggested other potential improvements (10.7% in total).
Fear due to inadequate lighting was the most significant concern, affecting 57.2% of respondents (61.3% of women and 47.9% of men). This was followed by perceptions of neglect or poor cleanliness, reported by 43.9% overall (45.8% of women and 38.9% of men). Theft was another prevalent issue, with 25.9% of participants affected (27.1% of women and 22.9% of men). Harassment was experienced by 16% overall (16.5% of women and 15.3% of men), while discomfort from extreme temperatures or loud noise was noted by 13.4% of respondents (13.2% of women and 13.9% of men). Difficulties crossing the area were reported by 13.6% of respondents (13.9% of women and 13.2% of men), while fall-related accidents affected 6.8% (7.1% of women and 6.3% of men). Racist attacks were less frequent, reported by 4.4% overall (3.9% of women and 4.9% of men). Traffic accidents were the least reported, with only 1.3% of participants affected (1.3% of women and 1.4% of men). Additionally, 18.5% of respondents (16.2% of women and 23.6% of men) reported having no negative experiences in the Skopeftirio area, and 3.7% (3.9% of women and 3.4% of men) mentioned other negative experiences (Table 6).
There seems to be a statistically significant difference in gender regarding their opinion about the subway, but by doing a Post hoc analysis, no statistically significant difference was found between the groups (Table 7). The reliability of the questionnaire is high, with an overall Cronbach’s alpha of 0.791, demonstrating very good internal consistency. Each dimension contributes meaningfully to this reliability, as the removal of any individual question results in only a slight decrease in Cronbach’s alpha, ranging between 0.745 and 0.780. This suggests that all questions are useful and contribute to the overall cohesion of the questionnaire, making the instrument a reliable tool for assessing the quality and accessibility of public spaces (Table 8).
The selection of results presented was made following careful consultation to determine which findings best align with the research objectives. The questionnaire used in the study generates an extensive range of data, offering the potential for more comprehensive and complex analyses beyond what is included in this report. This research forms part of a larger, more comprehensive study of the public spaces of the region, which incorporates more detailed social and spatial correlations.
4. Discussion
In this discussion, we interpret the key findings of the study in relation to existing literature and urban planning practices. The results provide valuable insights into how different demographic factors, such as age, business ownership, having children, and education level, influence perceptions of public space quality in the urban areas of Kaisariani. By examining these correlations, we aim to better understand the diverse needs and expectations of different user groups. Furthermore, the study highlights critical aspects of urban space design, such as safety, lighting, and greenery, which have emerged as central concerns for respondents. These findings not only align with broader urban planning trends but also offer practical guidance for enhancing public spaces through informed interventions.
The findings of this research align closely with existing literature on public space perceptions and usage in Greece. Frequent use of public spaces, with many residents visiting daily or many times per week [12,63,64]. The perception of a moderate, but not abundant, number of public spaces corresponds with studies noting better spatial distribution in suburban areas compared to central locations like Athens [63,65]. Kaisariani, despite its proximity to the city center, benefits from ample public green spaces like Mount Hymettus, Panepistimioupoli, and Skopeftirio Park.
Literature also highlights issues of cleanliness, accessibility, and safety—key concerns reflected in this study, particularly regarding nighttime security [52,66]. The findings from this case study highlight the urgent need for improvements in urban spaces like Kaisariani Square, where most participants prioritized enhancements in greenery, lighting, and cleanness. This reflects broader research emphasizing the vital role of green spaces in promoting health and well-being, as well as their aesthetic and restorative contributions to urban environments [67,68,69,70]. Issues of neglect and cleanliness, identified by almost the half of participants, further underscore the importance of maintenance in shaping user satisfaction and space quality [71,72]. Addressing these concerns through thoughtful urban planning can create environments that are safe, welcoming, and conducive to community well-being [63]. Additionally, more than half of respondents expressed a need for more seating and rest areas, reinforcing existing literature that emphasizes the importance of comfort amenities in making urban spaces more usable and enjoyable [69,73,74]. Safety also emerged as a key issue, with many participants advocating for improved safety measures in Skopeftirio Park. This aligns with studies indicating that perceptions of safety are critical for encouraging the use of public spaces [52,75]. Lighting improvements were identified as essential for addressing safety concerns, echoing studies that link poor lighting with heightened perceptions of safety and reduced nighttime use of public spaces [69].
Older individuals often perceive public spaces differently due to shifts in mobility, social inclusion, and safety expectations. Research indicates that older adults prioritize accessibility, safety, and comfort more than younger generations, driven by physical limitations and a need for restful environments. Studies in urban design and gerontology emphasize the importance of features like smooth pavements, adequate seating, and clear signage for older adults, which may not be as crucial for younger populations, who tend to value recreational and social opportunities [76]. This aligns with our findings, where older respondents expressed lower satisfaction with public space quality, emphasizing safety and ease of movement. In terms of urban design expectations, older adults often seek spaces that foster ease of movement and social interaction in secure environments. They also tend to have higher expectations for well-maintained, accessible facilities [77,78]. Urban planning literature highlights the importance of age-friendly spaces that address these concerns, suggesting that public spaces should be designed to support the well-being and quality of life of aging populations. Our study reinforces this, revealing that older individuals rate urban equipment and space quality lower, but place greater value on their identity and role within the community [77,78].
Business owners tend to rate public space quality higher due to their economic interests. Vibrant, well-maintained public spaces can attract more foot traffic, directly benefiting their businesses. Research shows that well-designed urban areas foster increased visitor engagement, encouraging longer stays, which in turn leads to more purchases and interaction with local businesses [79]. This economic incentive likely explains the more favorable assessments from business owners. Numerous studies underscore the strong connection between public spaces and local economic growth. Squares and parks that are well-maintained often serve as focal points for community events, drawing visitors to nearby shops and restaurants, thereby supporting local economies. Literature on place-making highlights how successful public spaces contribute to urban regeneration, spurring economic vitality and increasing business owners’ positive perceptions of these areas [80].
Also, parents with children under 18 often express greater concerns about the safety and quality of public spaces. They tend to be more critical of areas lacking child-friendly features, such as secure fencing, adequate lighting, or engaging play equipment. Such concerns over safety risks can result in lower overall perceptions of public space quality, as parents prioritize environments that ensure the well-being and enjoyment of their children [81,82,83]. Urban planning research highlights the importance of family-oriented amenities like playgrounds, restroom facilities, and shaded areas, which are essential for making public spaces accessible and enjoyable for families. Cities that prioritize these features tend to receive more favorable evaluations from parents. Studies show that incorporating child-friendly designs not only enhances safety but also increases the overall satisfaction of families, contributing to more positive perceptions of urban spaces [77,79,84].
Individuals with higher education levels often hold more critical and informed perspectives on urban regeneration and greenery, a trend observed across studies in urban planning and environmental psychology. Educated individuals are typically more exposed to urban design concepts and sustainability principles, enabling them to assess whether development projects meet global best practices in sustainable urban planning. This demographic tends to demand higher standards for urban aesthetics and ecological integration, reflecting a deeper appreciation of green spaces and a commitment to long-term sustainability [79]. Educated individuals are generally more likely to understand the diverse benefits of green spaces, such as ecological sustainability, social cohesion, and improvements in physical and mental well-being. Their exposure to environmental sustainability and urban resilience frameworks, often through academic channels, shapes their more nuanced perspectives on how public spaces can foster both environmental and social benefits. This critical awareness tends to create higher expectations for urban spaces that balance functionality with ecological integrity [85,86,87]. However, it’s important to recognize that these perspectives are not universal; cultural and social characteristics unique to each region can significantly influence how these factors are perceived and prioritized.
The results reveal mixed opinions regarding the redevelopment of Kaisariani Square and the construction of the new metro station. While many respondents were aware of these projects, their views varied, with a significant portion expressing skepticism or uncertainty. For instance, 28.8% of respondents felt skeptical about the square’s redevelopment, while 28.6% viewed it positively. Similarly, opinions about the metro station were largely positive, with 36.6% supporting the project but noting some concerns, and another 33.6% seeing it as particularly beneficial for the area despite a balanced mix of positive and negative aspects.
Regardless of whether deficiencies were identified in these projects, it is clear that more information and active involvement of the community would be beneficial. Engaging the public early on and providing clear, transparent communication about the details and potential impacts of these developments could help mitigate skepticism and foster stronger community support. Enhanced communication through presentations, local newsletters, and other means would ensure that residents feel informed and included, particularly given that only 12.3% of respondents felt well informed about the square’s redevelopment. Extensive literature highlights that enhanced and effective information exchange with local communities significantly improves the acceptance of public space regeneration projects. This engagement not only fosters greater community support but also provides valuable data that can be leveraged for more effective management and resolution of related issues [88,89,90,91]. By prioritizing community involvement, future urban projects could better address local concerns and improve public perception from the outset.
While this case study offers valuable insights into community preferences for urban regeneration and safety in Kaisariani’s main squarea nd Skopeftirio Park, it has several limitations. The case study design restricts generalizability, as findings may be specific to the socio-cultural context of the area. Additionally, the study focuses on specific elements of urban space quality but does not fully explore broader factors like socio-economic status or systemic urban planning issues. Future research should adopt a more comprehensive approach, including these variables, to provide deeper insights. Lastly, seasonal factors may have influenced responses, suggesting that future studies consider timing to capture a fuller picture of urban space perceptions.
5. Conclusions
This study presents a significant advancement in evaluating the quality of urban public spaces by developing a concise and effective questionnaire. The findings underscore the multifaceted nature of public space quality, emphasizing the need for a comprehensive approach that incorporates both subjective user experiences and objective assessments. By utilizing a structured yet adaptable framework, the questionnaire effectively captures key dimensions such as availability, accessibility, safety, comfort, identity, inclusion, and the presence of urban equipment, providing a holistic view of public space quality.
The majority of respondents felt that there were a moderate number of free public spaces in Kaisariani, though opinions on their quality were largely mediocre. Daily use of these spaces was common, with most residents passing through frequently. However, perceptions of the redevelopment of Kaisariani’s main square were mixed, with many aware of the project but expressing skepticism, while others viewed it positively.
In the case study, the majority of participants preferred improvements in greenery and lighting for Kaisariani’s main square. Additionally, more than half of respondents supported the addition of more seating and rest areas and their desire for more culture and art in the urban space. Better accessibility and walkability were desired by a significant portion of participants. The most frequently reported negative experience in Kaisariani’s main square was a feeling of neglect or lack of cleanliness. Participants prioritized safety enhancements for the Skopeftirio Park with the vast majority emphasizing the need for a stronger sense of safety. This concern is closely related to the call for improved lighting and upgraded greenery. Additionally, more than a half of participants requested more seating and rest areas, more trash bins, and more culture and/or art. As far as Skopeftirio Park, fear was the most significant concern due to inadequate lighting, affecting the majority of participants, followed by perceptions of neglect or poor cleanliness. Additionally, 1 in 5 of the respondents experienced theft, while more than 1 in 10 reported incidents of harassment in the Skopeftirio Park. The results showed a weak but statistically significant negative correlation between age and perceptions of public spaces, with older respondents rating both the availability and quality of urban spaces lower than younger participants. Business owners tended to rate the square’s quality higher and visit it more frequently compared to non-business owners. Additionally, respondents with children under 18 reported lower perceptions of public space quality and safety, while higher education levels were associated with less favorable views on urban regeneration efforts and greenery quality.
In conclusion, this research not only addresses existing gaps in the literature on public space evaluation but also sets a foundation for future studies to explore additional dimensions of urban quality. As urbanization continues to present new challenges, adopting such innovative tools will be crucial in fostering sustainable and livable cities that prioritize the well-being of their residents. While the development of the questionnaire allows for adaptation and application across a wide range of environments and contexts, the limitations identified are specific to the case study, including its restricted geographical focus and the seasonal nature of data collection. Future research should explore broader socio-economic contexts to further validate and enhance its applicability.
6. Patents
The questionnaire and its methodology are not patented but are protected under copyright laws.
Author Contributions
Conceptualization, M.A.; data collection, M.A.; data analysis M.A. and T.E.; writing—original draft preparation, M.A.; writing—review and editing, M.A., T.E. and V.G. All authors have read and agreed to the published version of the manuscript.
Funding
This research received no external funding.
Institutional Review Board Statement
Not applicable
Informed Consent Statement
Informed consent was obtained from all subjects involved in the study.
Data Availability Statement
Data are contained within the article.
Acknowledgments
The publication of this article was financially supported by the Special Accounts for Research Grants, University of West Attica.
Conflicts of Interest
The authors declare no conflicts of interest.
References
- Cabe Space. The Value of Public Space. Exch. Organ. Behav. Teach. J. 2013, 19.
- Aram, F.; Solgi, E.; García, E. H.; Mosavi, A.; Várkonyi-Kóczy, A. R. The Cooling Effect of Large-Scale Urban Parks on Surrounding Area Thermal Comfort. Energies 2019, 12 (20), 1–21. [CrossRef]
- Burnett, H.; Olsen, J. R.; Nicholls, N.; Mitchell, R. Change in Time Spent Visiting and Experiences of Green Space Following Restrictions on Movement during the COVID-19 Pandemic: A Nationally Representative Cross-Sectional Study of UK Adults. BMJ Open 2021, 11 (3). [CrossRef]
- Giannico, V.; Spano, G.; Elia, M.; D’Este, M.; Sanesi, G.; Lafortezza, R. Green Spaces, Quality of Life, and Citizen Perception in European Cities. Environ. Res. 2021, 196 (December 2020), 110922. [CrossRef]
- Maruani, T.; Amit-Cohen, I. Open Space Planning Models: A Review of Approaches and Methods. Landsc. Urban Plan. 2007, 81 (1–2), 1–13. [CrossRef]
- Dalman, M.; Salleh, E.; Sapian, A. R.; Saadatian, O. Thermal Comfort Investigation in Traditional and Modern Urban Canyons in Bandar Abbas, Iran. Pertanika J. Soc. Sci. Humanit. 2013, 21 (4), 1491–1515.
- Rossini, F.; Nervino, E. City Branding and Public Space. An Empirical Analysis of Dolce & Gabbana’s Alta Moda Event in Naples. J. Public Sp. 2019, 4 (4), 61–82. [CrossRef]
- Walla A. Yakoub; Mahmoud Fouad Mahmoud; Osama M. Abou Elenien; Ghada Mohammad Elrayies. Ambassadors of Sustainability: An Analytical Study of Global Eco-Friendly Cities. Second Int. Conf. (Tenth Conf. Sustain. Environ. Dev. 16-20 March 2019At Sharm El Sheikh, Egypt 2019, No. March, 16–20.
- Chitrakar, R. M.; Baker, D. C.; Guaralda, M. Emerging Challenges in the Management of Contemporary Public Spaces in Urban Neighbourhoods. Archnet-IJAR 2017, 11 (1), 29–43. [CrossRef]
- Mela, A.; Vryzidis, I.; Varelidis, G.; Tsotsolas, N. Urban Space Quality Evaluation Using Multi-Criteria Decision Analysis-Based Framework. Mult. Criteria Decis. Mak. 2023, Part F1272, 59–84. [CrossRef]
- Ghel, J.; Jvare, B. How To Study Public Life; 2013.
- Mela, A.; Varelidis, G. Effects of the COVID-19 Pandemic on the Use and Attitudes Towards Urban Public Spaces. J. Sustain. Archit. Civ. Eng. 2022, 31 (2), 85–95. [CrossRef]
- Ho, R.; Au, W. T. Scale Development for Environmental Perception of Public Space. Front. Psychol. 2020, 11 (November). [CrossRef]
- Gonsalves, K.; Caldwell, G. A.; Foth, M. The Praxis of Radical Placemaking. Front. Comput. Sci. 2023, 5. [CrossRef]
- Ataman, C.; Tuncer, B. Urban Interventions and Participation Tools in Urban Design Processes: A Systematic Review and Thematic Analysis (1995–2021). Sustain. Cities Soc. 2022, 76 (October). [CrossRef]
- Jacobs, J. The Death and Life of Great American Cities; Vintage, 1961.
- Lynch, K. The Image of The City; 1960.
- İnceoğlu, M.; Aytuğ, A. The Concept of Urban Space Quality. MEGARON 2009, 4 ((3) January), 131–146.
- UN-Habitat. The New Urban Agenda; 2020.
- Ghel, J. Cities for People; ISLANDPRESS: Washington l Covelo l London, 2010; Vol. 21.
- Whyte, W. The Social Life of Small Urban Spaces City : Rediscovering the Center. Washingt. Conserv. Found. D.C. 1980, VIII (1).
- Carr, S.; Francis, M.; Rivlin, L. G.; Stone, A. M. Needs in Public Space. In M. Carmona, & S. Tiesdell (Eds.). Urban Des. Reader, Oxford, UK Archit. Press 1992, 230–240.
- Carmona, M.; Tiesdell, S.; Heath, T.; Oc, T. Public Places Urban Spaces. The Dimensions of Urban Design, New York Londra. Archit. Press 2003, 2.
- Herthogs, P.; Tunçer, B.; Schläpfer, M.; He, P. A Weighted Graph Model to Estimate People’s Presence in Public Space The Visit Potential Model. Proc. Int. Conf. Educ. Res. Comput. Aided Archit. Des. Eur. 2018, 2, 611–620. [CrossRef]
- Hespanhol, L. Making Meaningful Spaces : Strategies for Designing Enduring Digital. Int. Conf. Des. Innov. Creat. 2018, No. July, 108–117.
- Montgomery, J. Making a City: Urbanity, Vitality and Urban Design. J. Urban Des. 1998. [CrossRef]
- Gehl Institute. Twelve Quality Criteria; 2018.
- He, P.; Herthogs, P.; Cinelli, M.; Tomarchio, L.; Tunçer, B. A Multi-Criteria Decision Analysis Based Framework to Evaluate Public Space Quality. Smart Sustain. Cities Build. 2020, No. December, 271–283. [CrossRef]
- Mohajerani, A.; Bakaric, J.; Jeffrey-Bailey, T. The Urban Heat Island Effect, Its Causes, and Mitigation, with Reference to the Thermal Properties of Asphalt Concrete. J. Environ. Manage. 2017, 197, 522–538. [CrossRef]
- Adams, M. D. Wellbeing and the Environment: Wellbeing: A Complete Reference Guide, Volume II. Edited by Rachel Cooper, Elizabeth Burton, and Cary L. Cooper. Wellbeing 2014, II, 1–21. [CrossRef]
- Venot, F.; Sémidor, C. The “Soundwalk” as an Operational Component for Urban Design. PLEA 2006—23rd Int. Conf. Passiv. Low Energy Archit. Conf. Proc. 2006, No. September, 6–8.
- Syarlianti, D. Identifying Great Street in Bandung as Part of Bandung Technopolis Concept: A Perception-Based Approach. IPTEK J. Proc. Ser. 2017, 0 (3). [CrossRef]
- Coleman, A. F.; Ryan, R. L.; Eisenman, T. S.; Locke, D. H.; Harper, R. W. The Influence of Street Trees on Pedestrian Perceptions of Safety: Results from Environmental Justice Areas of Massachusetts, U.S. Urban For. Urban Green. 2021, 64 (July), 127258. [CrossRef]
- Davies, W. J.; Adams, M. D.; Bruce, N. S.; Cain, R.; Carlyle, A.; Cusack, P.; Hall, D. A.; Hume, K. I.; Irwin, A.; Jennings, P.; Marselle, M.; Plack, C. J.; Poxon, J. Perception of Soundscapes: An Interdisciplinary Approach. Appl. Acoust. 2013, 74 (2), 224–231. [CrossRef]
- Evans, J.; Evans, S. Z.; Morgan, J. D.; Snyder, J. A.; Abderhalden, F. P. Evaluating the Quality of Mid-Sized City Parks: A Replication and Extension of the Public Space Index. J. Urban Des. 2019, 24 (1), 119–136. [CrossRef]
- Mehta, V. Evaluating Public Space. J. Urban Des. 2014, 19 (1), 53–88. [CrossRef]
- Evans, J.; Evans, S. Z.; Morgan, J. D.; Snyder, J. A. Evaluating the Quality of Mid-Sized City Parks : A Replication and Extension of the Public Space Index. J. Urban Des. 2018, 1–19. [CrossRef]
- Allahbakhshi, H. Towards an Inclusive Urban Environment: A Participatory Approach for Collecting Spatial Accessibility Data in Zurich. Leibniz International Proceedings in Informatics, LIPIcs. Schloss Dagstuhl—Leibniz-Zentrum für Informatik, Dagstuhl Publishing, Germany 2023, pp 13:1-13:0. [CrossRef]
- Lopes, M.; Alves, F. Digital Tools to Foster Inclusiveness: Porto’s System of Accessible Itineraries. Sustain. 2021, 13 (11). [CrossRef]
- Dhasmana, P.; Bansal, K.; Kaur, M. Assessing Gender Inclusive User Preferences: A Case of Urban Public Spaces in Chandigarh. 2022 Int. Conf. Innov. Intell. Informatics, Comput. Technol. 3ICT 2022 2022, No. November 2022, 221–226. [CrossRef]
- Selanon, P.; Puggioni, F.; Dejnirattisai, S. An Inclusive Park Design Based on a Research Process: A Case Study of Thammasat Water Sport Center, Pathum Thani, Thailand. Buildings 2024, 14 (6). [CrossRef]
- Ikudayisi, A. E.; Taiwo, A. A. Accessibility and Inclusive Use of Public Spaces within the City-Centre of Ibadan, Nigeria. J. Place Manag. Dev. 2022, 15 (3), 316–335. [CrossRef]
- Mrak, I.; Campisi, T.; Tesoriere, G.; Canale, A.; Cindrić, M. The Role of Urban and Social Factors in the Accessibility of Urban Areas for People with Motor and Visual Disabilities. AIP Conf. Proc. 2019, 2186 (December). [CrossRef]
- Ahmad, A. M.; Abdelkarim, S.; Al-Nuaimi, M.; Makhoul, N.; Mathew, L.; Garba, S. Inclusiveness Assessment Tool for Disabled Persons in Higher Education Facilities. J. Facil. Manag. 2024, 22 (2), 210–233. [CrossRef]
- Belaroussi, R.; Sitohang, I.; Diaz Gonzalez, E. M.; Martin-Gutierrez, J. Cross-Cultural Aspects of Streetscape Perception. Vitruvio 2024, 9 (1), 114–129. [CrossRef]
- Rebecchi, A. Cities, Walkability and Health. A Multi-Disciplinary Walking Experience at EPH22 in Berlin Andrea. Andrea 2023, 33.
- Carmona, M. Contemporary Public Space: Critique and Classification, Part One: Critique. J. Urban Des. 2010, 15 (1), 123–148. [CrossRef]
- Kaghouche, M.; Benkechkache, I. Assessment of the Quality of Public Spaces in the New City of Ali Mendjeli in Constantine (Algeria). Bull. Serbian Geogr. Soc. 2023, 103 (2), 161–176. [CrossRef]
- Praliya, S.; Garg, P. Public Space Quality Evaluation : Prerequisite for Public Space Management. 2019, 4, 93–126. [CrossRef]
- Sayad, B.; Alkama, D. Assessment of the Environmental Quality through Users’ Perception in Guelma City, Algeria. 2021, No. May, 182–187. [CrossRef]
- Rad, V. B.; Ngah, I. Bin. Assessment of Quality of Public Urban Spaces. Sci.Int(Lahore) 2014, 26 (1), 335–338.
- Mela, A.; Tousi, E. Safe and Inclusive Urban Public Spaces: A Gendered Perspective. The Case of Attica ’s Public Spaces During the COVID-19 Pandemic in Greece. J. Sustain. Archit. Civ. Eng. 2023, 2 (33), 5–14. [CrossRef]
- Namar, J. M.; Salheen, M. A.; Ismail, A. Investigating Users Changing Needs in Relation to Non-Designed or Unplanned Public Spaces in Cairo. J. Public Sp. 2021, 6 (Vol. 6 n. 1), 47–66. [CrossRef]
- Chęć-Małyszek, A. Criteria of Livable Public Spaces Quality . Case Study Analysis on the Example of Selected Public Spaces Lublin, Poland. Geography 2022.
- Chen, Y.; Ge, Y.; Yang, G.; Wu, Z.; Du, Y.; Mao, F.; Liu, S.; Xu, R.; Qu, Z.; Xu, B.; Chang, J. Inequalities of Urban Green Space Area and Ecosystem Services along Urban Center-Edge Gradients. Landsc. Urban Plan. 2022, 217 (October 2021), 104266. [CrossRef]
- Dillman, D. A.; Smyth, J. D.; Christian, L. M. Internet, Phone, Mail, and Mixed Mode Surveys: The Tailored Design Method (4th Ed.), 4th ed.; John Wiley & Sons Inc, Ed.; 2014.
- Floyd J. Fowler. Survey Research Methods.; Sage publications, 2013.
- Gallagher, P. M.; Fowler, F. J.; Stringfellow, V. L. Notes from the Field: Experiments in Influencing Response Rates from Medicaid Enrollees. Center for Survey Research. 2002, pp 971–976.
- Larsen, M. D.; Rasinski, K. The Psychology of Survey Response. J. Am. Stat. Assoc. 2002. [CrossRef]
- Sen, A. Long survey lengths lead to bad data—Here are 11 ways to keep your survey short. milieu. https://www.mili.eu/learn/survey-length-11-best-practice-tips-to-keep-surveys-short.
- Municipality of Kaisariani. Municipality of Kaisariani. wikipedia. https://el.wikipedia.org/wiki/Καισαριανή.
- Tousi, E. Urban Socio-Spatial Transformations in Light of the Asia Minor Refugee Issue. The Case of the Urban Agglomeration of Athens –Piraeus, NTUA, 2014. https://www.didaktorika.gr/eadd/handle/10442/42796.
- Mela, A.; Tousi, E.; Melas, E.; Varelidis, G. Spatial Distribution and Quality of Urban Public Spaces in the Attica Region (Greece) during the COVID-19 Pandemic: A Survey-Based Analysis. Urban Sci. 2023, 8 (1), 2. [CrossRef]
- Kyriakidis, C.; Bakogiannis, E. An Evaluation of Urban Open Spaces in Larisa, Greece. Eur. J. Form. Sci. Eng. 2018, 1 (1), 17. [CrossRef]
- Karanikola, P.; Panagopoulos, T.; Tampakis, S.; Karipidou-Kanari, A. A Perceptual Study of Users’ Expectations of Urban Green Infrastructure in Kalamaria, Municipality of Greece. Manag. Environ. Qual. An Int. J. 2016, 27 (5), 568–584. [CrossRef]
- Tousi, E.; Mela, A. Supralocal Role of Medium to Large Scale Urban Parks, in Attica Greece. Issues of Meso Car Dependence during the Covid-19 Pandemic. (Pending Publication 2023-2024). J. Sustain. Archit. Civ. Eng. 2024, 2 (35), 201–215. [CrossRef]
- Sturiale, L.; Scuderi, A.; Timpanaro, G. A Multicriteria Decision-Making Approach of “Tree” Meaning in the New Urban Context. Sustain. 2022, 14 (5). [CrossRef]
- Sturiale, L. The Role of Green Infrastructures in Urban Planning for Climate Change Adaptation. 2019.
- Lee, Y.; Gu, N.; An, S. Residents’ Perception and Use of Green Space: Results from a Mixed Method Study in a Deprived Neighbourhood in Korea. Indoor Built Environ. 2017, 26 (6), 855–871. [CrossRef]
- Arvanitidis, P. A.; Papagiannitsis, G. Urban Open Spaces as a Commons: The Credibility Thesis and Common Property in a Self-Governed Park of Athens, Greece. Cities 2020, 97 (July 2019), 102480. [CrossRef]
- Kothencz, G.; Blaschke, T. Urban Parks: Visitors’ Perceptions versus Spatial Indicators. Land use policy 2017, 64, 233–244. [CrossRef]
- Kothencz, G.; Kolcsár, R.; Cabrera-Barona, P.; Szilassi, P. Urban Green Space Perception and Its Contribution to Well-Being. Int. J. Environ. Res. Public Health 2017, 14 (7). [CrossRef]
- Silva, J. P.; Toland, J.; Jones, W.; Eldridge, J.; Hudson, T.; O’Hara, E.; Thévignot, C.; Salsi, A.; Jussiant, E. Nature LIFE Building up Europe’s Green Infrastructure; 2010. [CrossRef]
- Vukmirovic, M.; Gavrilovic, S.; Stojanovic, D. The Improvement of the Comfort of Public Spaces as a Local Initiative in Coping with Climate Change. Sustain. 2019, 11 (23), 1–20. [CrossRef]
- Bao, Y.; Gao, M.; Luo, D.; Zhou, X. Urban Parks—A Catalyst for Activities! The Effect of the Perceived Characteristics of the Urban Park Environment on Children’s Physical Activity Levels. Forests 2023, 14 (2), 1–14. [CrossRef]
- Lak, A.; Aghamolaei, R.; Baradaran, H. R.; Myint, P. K. Development and Validation of Elder- Friendly Urban Spaces Questionnaire ( EFUSQ ). 2019, 1–14.
- Szczepańska, A.; Pietrzyk, K. Seasons of the Year and Perceptions of Public Spaces. Landsc. J. 2021, 40 (2), 19–35. [CrossRef]
- Czepkiewicz, M.; Jankowski, P.; Młodkowski, M. Geo-Questionnaires in Urban Planning: Recruitment Methods, Participant Engagement, and Data Quality. Cartogr. Geogr. Inf. Sci. 2017, 44 (6), 551–567. [CrossRef]
- Abbasi, A.; Alalouch, C.; Bramley, G. Open Space Quality in Deprived Urban Areas: User Perspective and Use Pattern. Procedia—Soc. Behav. Sci. 2016, 216, 194–205. [CrossRef]
- Quercia, D.; Aiello, L. M.; Schifanella, R.; Davies, A. The Digital Life of Walkable Streets. WWW 2015—Proc. 24th Int. Conf. World Wide Web 2015, No. March, 875–884. [CrossRef]
- Perini, K.; Chokhachian, A.; Dong, S.; Auer, T. Modeling and Simulating Urban Outdoor Comfort: Coupling ENVI-Met and TRNSYS by Grasshopper. Energy Build. 2017, 152, 373–384. [CrossRef]
- Zhang, Y.; Feng, L. Evaluation and Optimization of Children’s Recreational Center in Urban Green Public Space Based on AHP-TOPSIS. Journal of Applied Sciences. 2013, pp 895–900. [CrossRef]
- Aliyas, Z.; Gharaei, M. Utilization and Physical Features of Public Open Spaces in Bandar Abbas, Iran. IIOAB J. · 2016, 7 (October 2016), 178–183.
- ordin, N. N.; Abd Malek, M. I. Quality and Potential for Public Open Space Typology Underneath the Flyover in the Context of Old Town Kuala Lumpur Case Study: Pasar Seni LRT Area. J. Kejuruter. 2022, 34 (2), 277–298. [CrossRef]
- Rossignolo, C.; Saccomani, S. Evidence and Methods from an Educational Experience about Area- Based Urban Regeneration. In “From control to co-evolution”, AESOP Annual Congress tenutosi a Utrecht nel 9-12 July 2014); 2014.
- Oh, J.; Seo, M. Evaluation of Citizen–Student Cooperative Urban Planning and Design Experience in Higher Education. Sustain. 2022, 14 (4), 1–18. [CrossRef]
- Kim, J. Y.; Kim, J. H.; Seo, K. W. The Perception of Urban Regeneration by Stakeholders: A Case Study of the Student Village Design Project in Korea. Buildings 2023, 13 (2). [CrossRef]
- Mullenbach, L. E.; Baker, B. L.; Benfield, J.; Hickerson, B.; Mowen, A. J. Assessing the Relationship between Community Engagement and Perceived Ownership of an Urban Park in Philadelphia. J. Leis. Res. 2019, 50 (3), 201–219. [CrossRef]
- Kaplan, R. Citizen Participation in Design and Evaluation of a Park. Environ. Behav. 1980.
- Soares, I.; Weitkamp, G.; Yamu, C. Public Spaces as Knowledgescapes: Understanding the Relationship between the Built Environment and Creative Encounters at Dutch University Campuses and Science Parks. Int. J. Environ. Res. Public Health 2020, 17 (20), 1–30. [CrossRef]
- Sanches, D.; Lessa Ortiz, S. R. The Design of Co-Participation Processes in Public Spaces in São Paulo as University Extension Project: The Revitalization Process of Dom Orione and Major Freire Squares. 2020, 4, 125–136. [CrossRef]
Figure 1.
Map depicting the boundaries of the municipality of Kaisariani, highlighting the key public areas under study, including the Central Square of Kaisariani and the Skopeftirio Park, outlined in black. The central avenue is marked in red.
Figure 1.
Map depicting the boundaries of the municipality of Kaisariani, highlighting the key public areas under study, including the Central Square of Kaisariani and the Skopeftirio Park, outlined in black. The central avenue is marked in red.
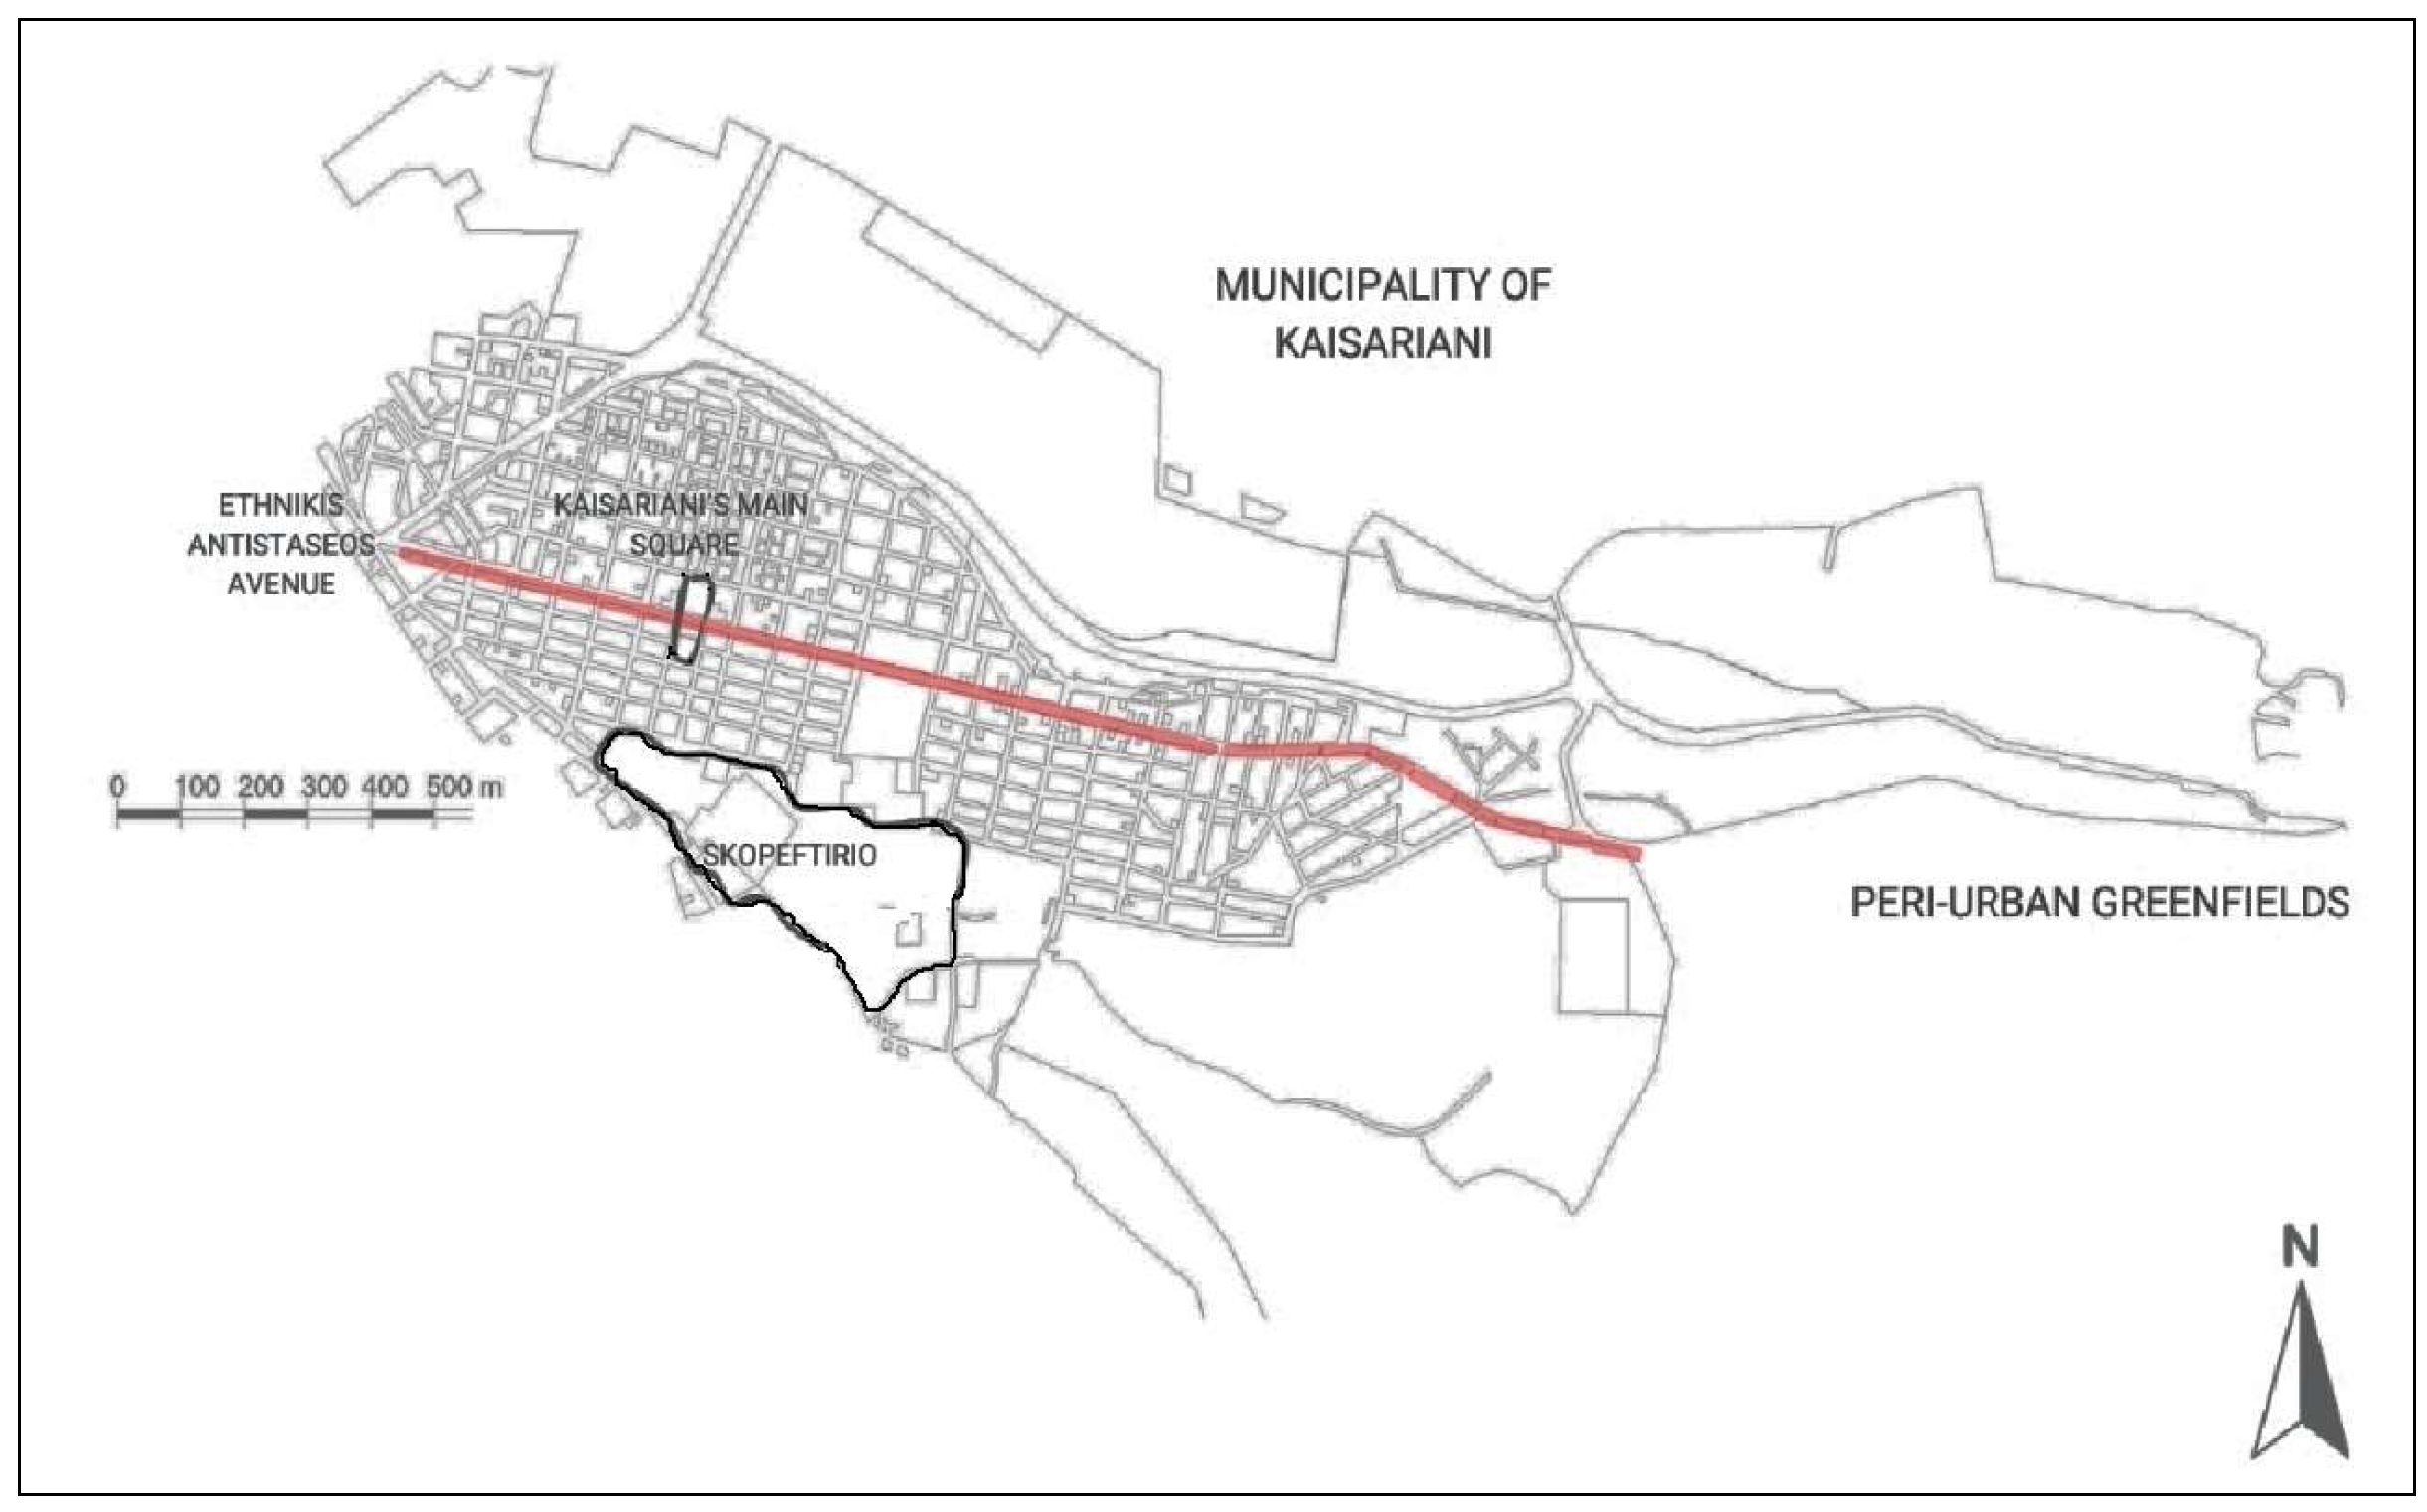
Figure 2.
Opinions about the amount of free public spaces (squares, parks, playgrounds, etc.) in Kaisariani.
Figure 2.
Opinions about the amount of free public spaces (squares, parks, playgrounds, etc.) in Kaisariani.
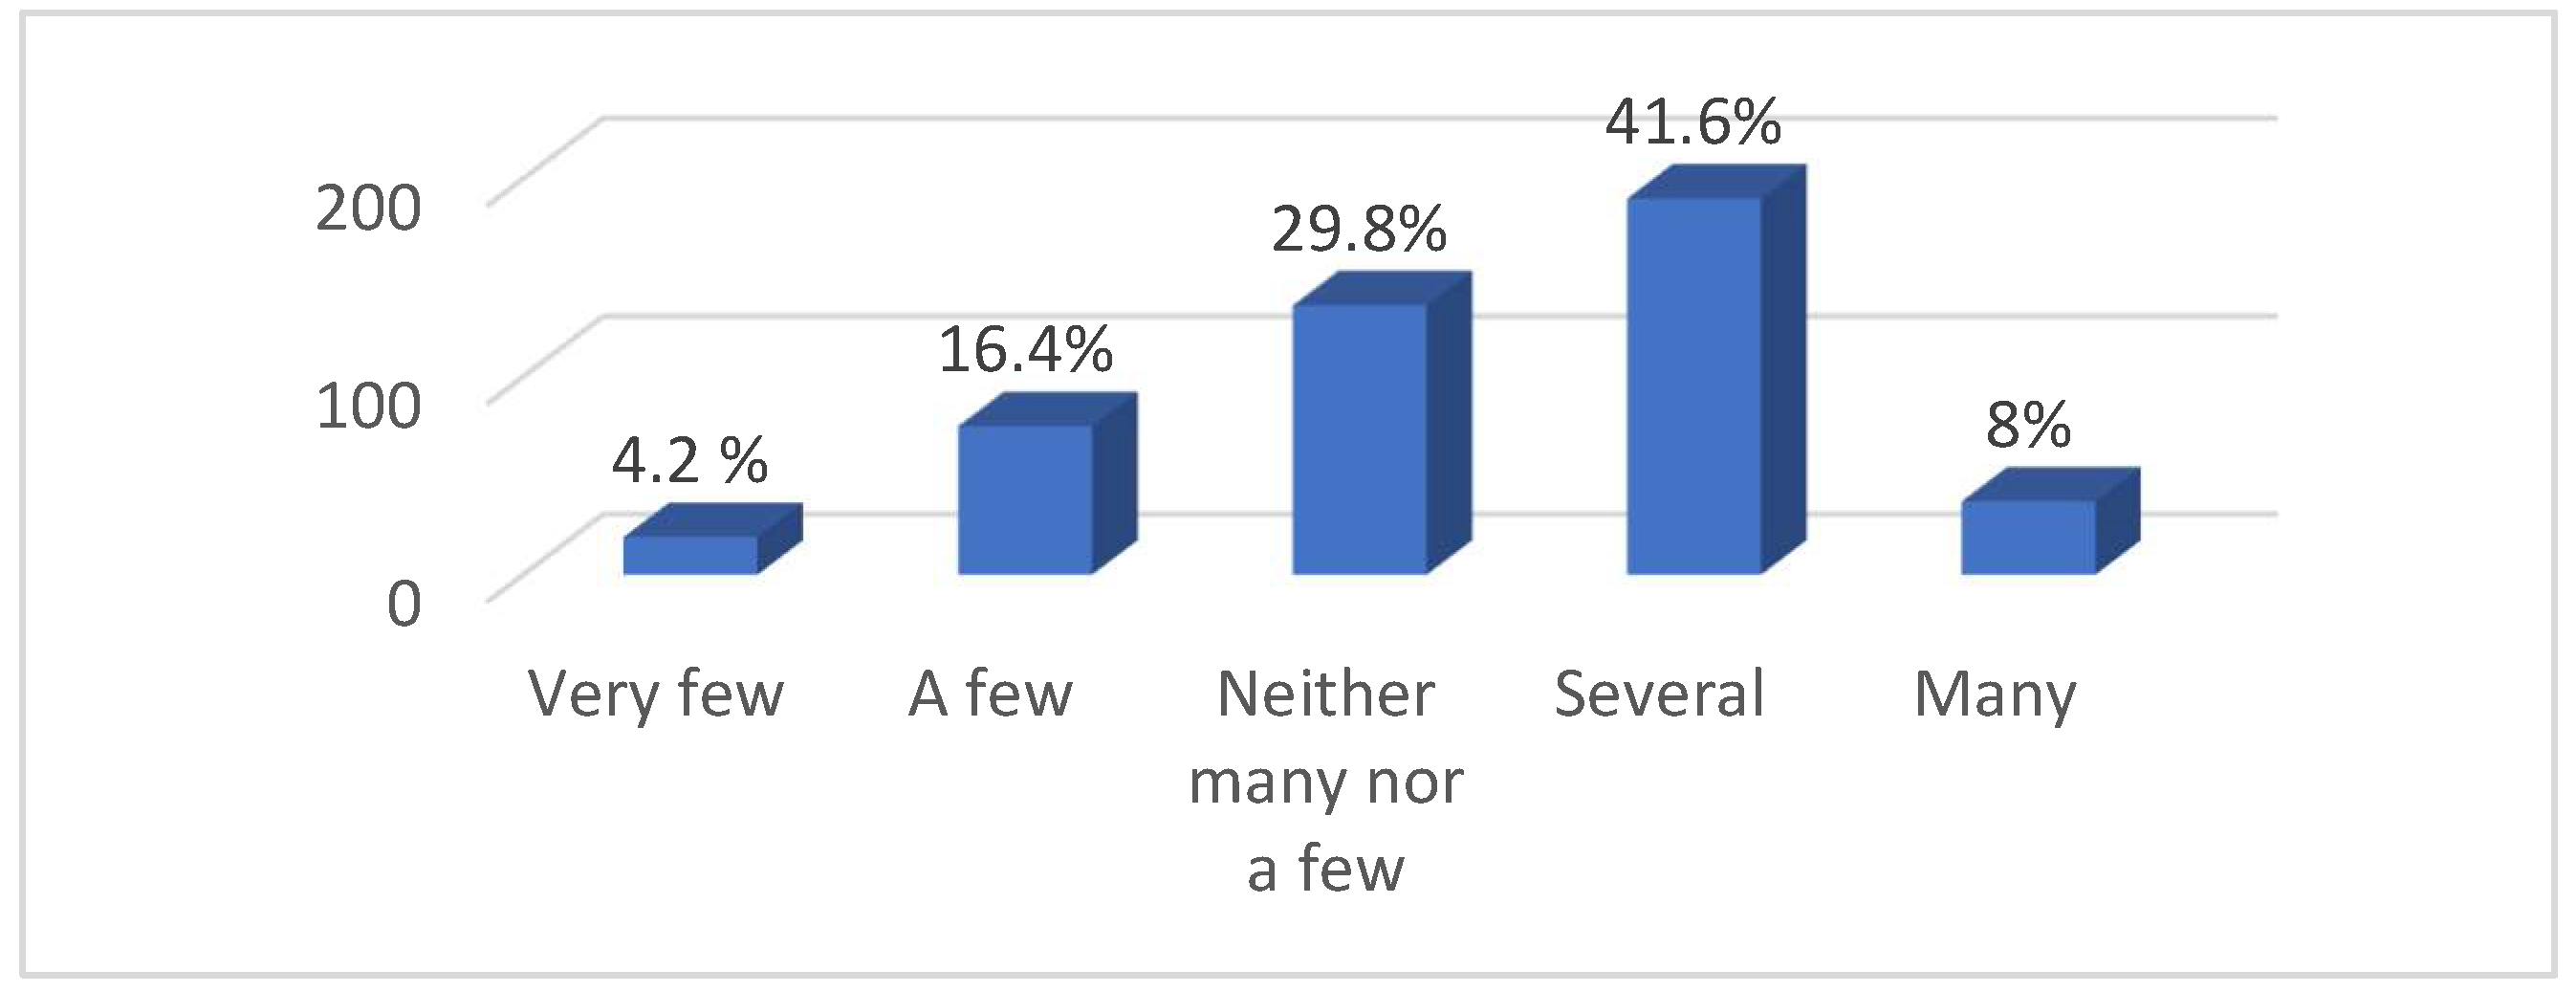
Figure 3.
The frequency of respondents’ visits per week to a public space in Kaisariani.
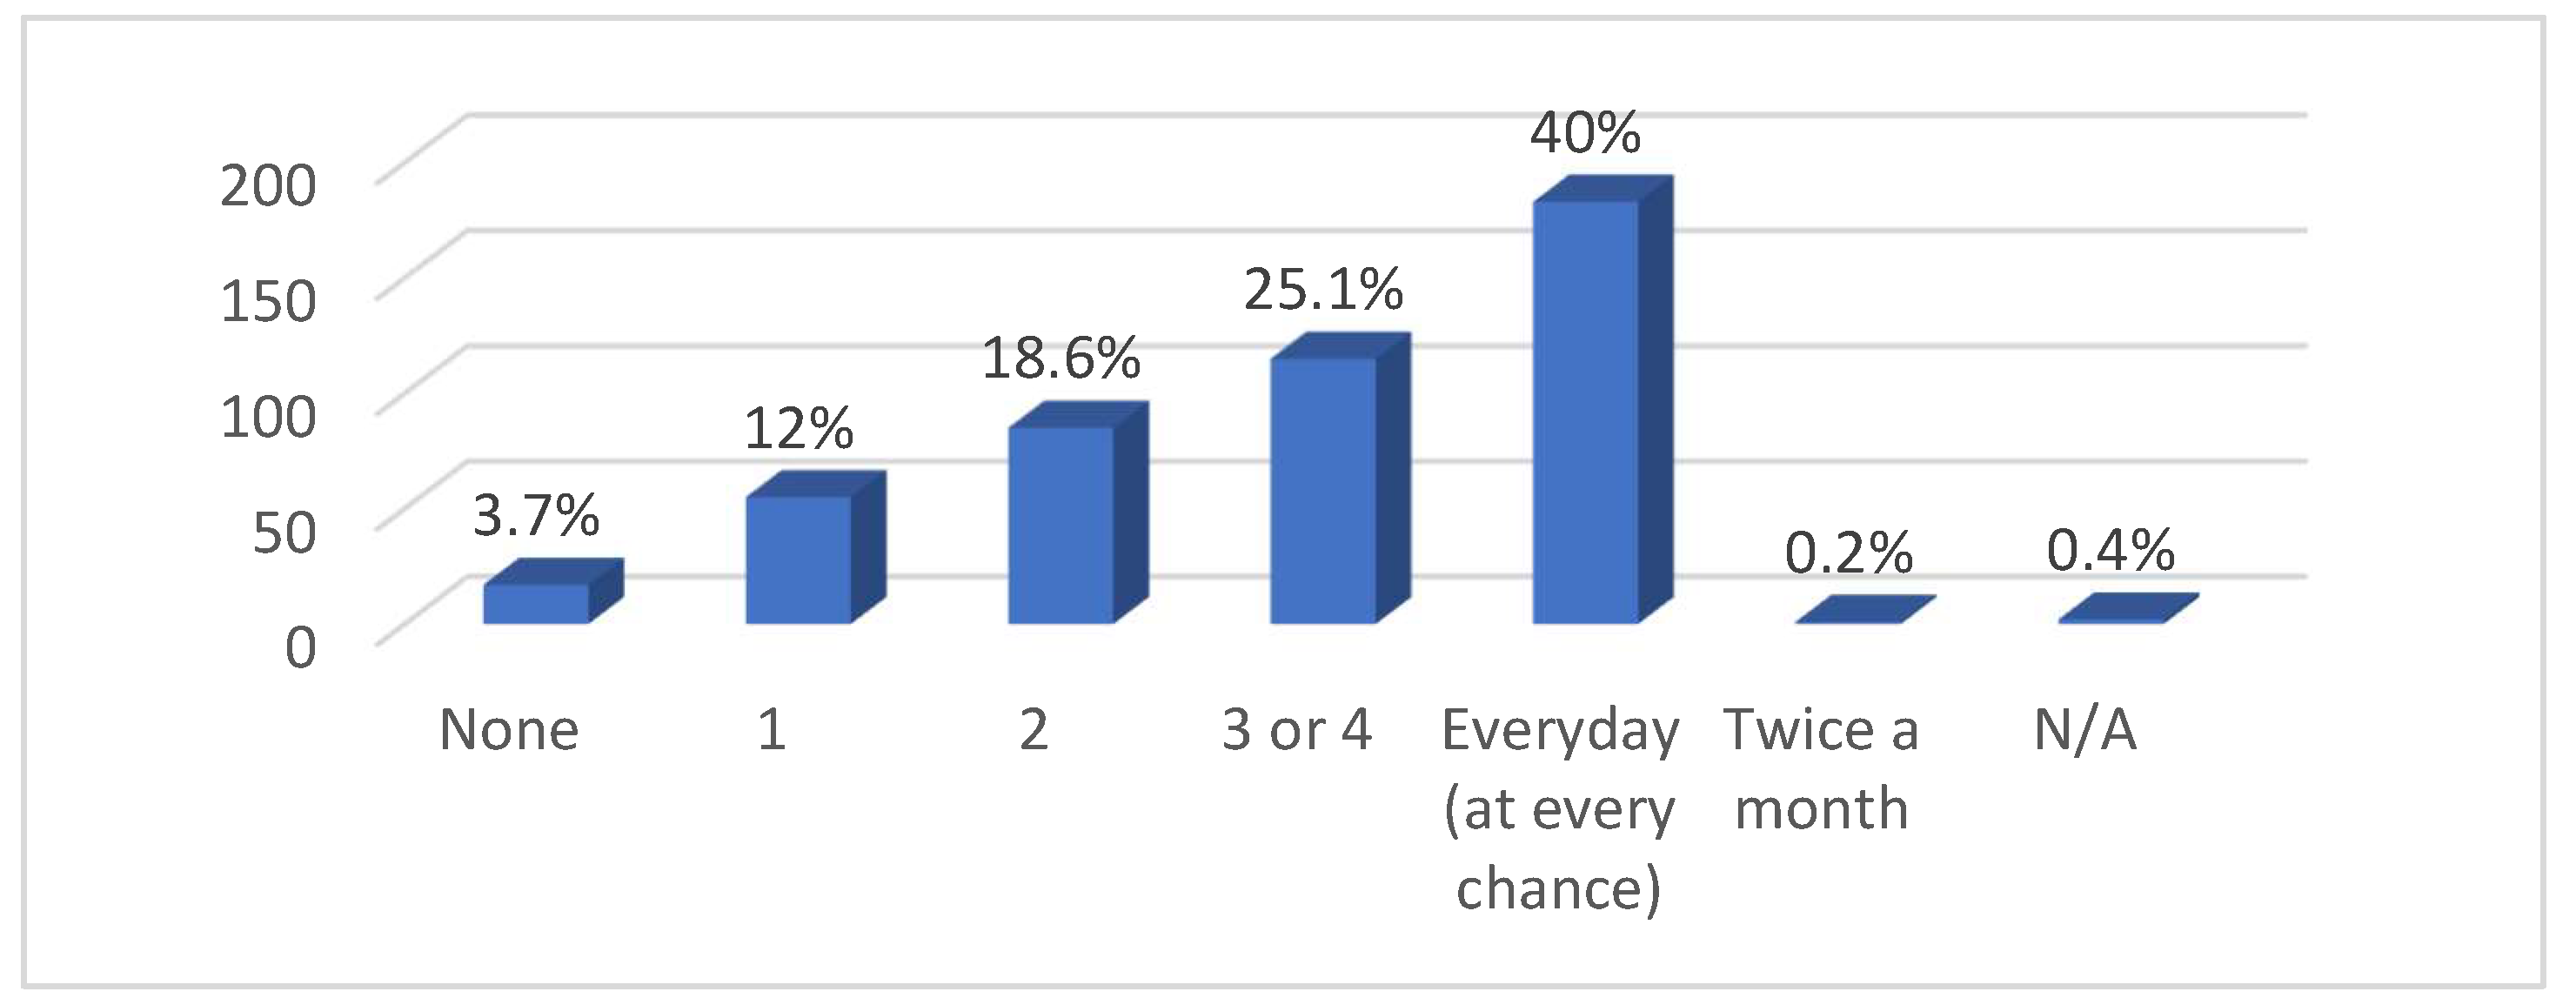
Figure 4.
Opinions regarding the overall quality of urban public spaces in Kaisariani.
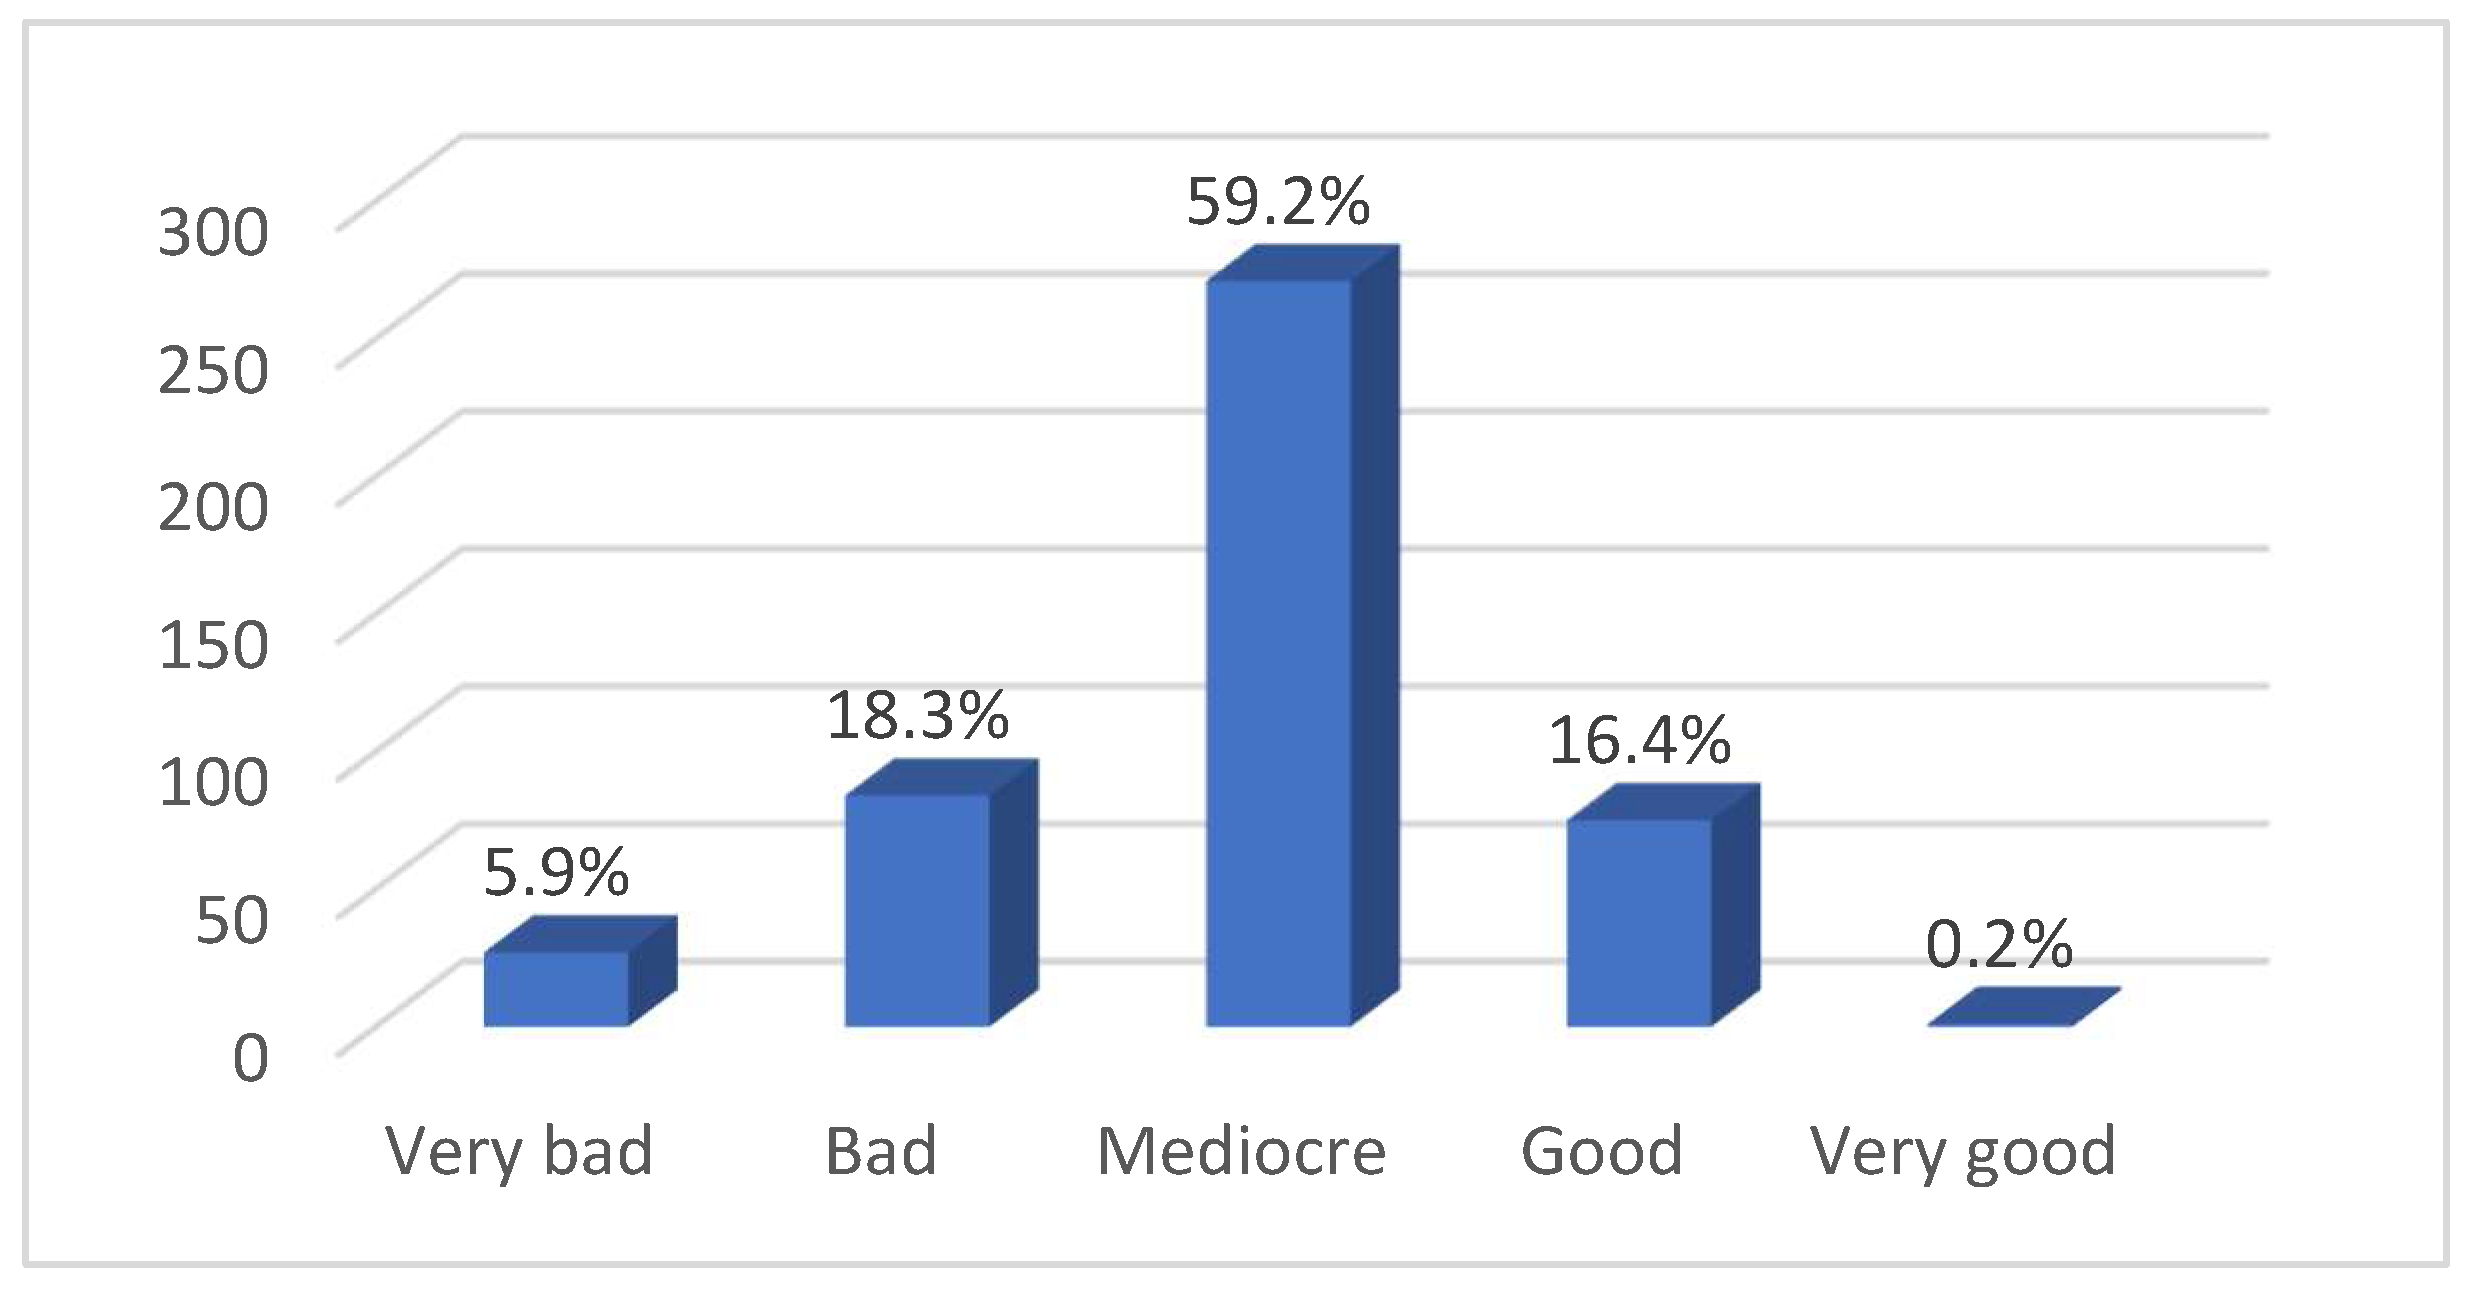

Table 1.
Socio-demographic characteristics of survey responders (N=458).
| Socio-demographic characteristics | N (%) | |
|---|---|---|
| Gender identity | ||
| Women | 310 (67.7) | |
| Men | 146 (31.9) | |
| Non-binary/Other | 2 (0.4) | |
| Age (years) | ||
| 18-30 | 49 (10.7) | |
| 31-40 | 75 (16.4) | |
| 41-50 | 118 (25.8) | |
| 51-60 | 106 (23.1) | |
| >60 | 108 (23.6) | |
| Having underaged children | ||
| None | 278 (60.7) | |
| 1 child | 79 (17.2) | |
| 2 children | 78 (17.0) | |
| >3 children | 15 (3.3) | |
| N/A | 1 (0.2) | |
| Educational level | ||
| Primary school | 21 (4.6) | |
| Secondary school | 26 (5.7) | |
| High school | 102 (22.3) | |
| Institute of Vocational Training | 49 (10.7) | |
| University/ Technical University | 168 (36.7) | |
| Master’s degree | 75 (16.4) | |
| PhD | 5 (1.1) | |
| N/A | 1 (0.2) | |
| Contact with Kaisariani | ||
| Living but not working in Kaisariani | 202 (44.1) | |
| Living and working in Kaisariani | 137 (29.9) | |
| Working but not living in Kaisariani | 78 (17.0) | |
| Visiting often Kaisariani for family or business reasons | 39 (8.5) | |
| Business owner in Kaisariani | ||
| Yes | 67 (14.6) | |
| No | 385 (84.1) | |
| No, but I intend to own a business | 2 (0.4) | |
| Difficulty in mobility (in terms of disability) | ||
| Yes | 39 (8.5) | |
| Sometimes | 74 (16.2) | |
| No | 337 (73.6) | |
Table 2.
Spearman correlation coefficients of scales about free public spaces, the main square of Kaisariani and Skopeftirio concerning age, business ownership, having children under 18, and education level.
Table 2.
Spearman correlation coefficients of scales about free public spaces, the main square of Kaisariani and Skopeftirio concerning age, business ownership, having children under 18, and education level.
| Age | Business owner | Having children under 18 | Education level | |
| Amount of free public spaces | -0.105* | 0.003 | 0.071 | 0.091 |
| Quality of free public spaces | -0.022 | 0.045 | -0.116* | 0.021 |
| Times passing per week | -0.018 | 0.156*** | 0.099* | 0.058 |
| Regeneration of Kaisariani | 0.072 | -0.031 | -0.001 | -0.161*** |
| The overall quality of the square | -0.127** | 0.159*** | -0.036 | 0.016 |
| Accessibility in the square | 0.017 | 0.023 | -0.023 | -0.063 |
| Square’s safety by day | 0.027 | 0.021 | -0.105* | 0.060 |
| Square’s safety by night | -0.057 | 0.016 | -0.078 | 0.101* |
| Quality of urban equipment | -0.103* | 0.086 | -0.040 | 0.081 |
| Greennery in the square | -0.030 | 0.042 | -0.099* | -0.128** |
| Square as an “identity element” of Kaisariani | 0.192*** | 0.029 | 0.027 | -0.081 |
| Skopeftirio an “identity element” of Kaisariani | 0.049 | 0.050 | -0.006 | 0.071 |
| Opinion about the metro station in Kaisariani | 0.207*** | 0.071 | 0.000 | -0.007 |
Table 3.
Responses to the Multiple-Choice Question “If I Could Improve Something in Kaisariani Square, It Would Be...” regarding gender identity (N=458).
Table 3.
Responses to the Multiple-Choice Question “If I Could Improve Something in Kaisariani Square, It Would Be...” regarding gender identity (N=458).
| Women | Men | Non-binary/Other | Total | |
| Ν (%) | Ν (%) | Ν (%) | Ν (%) | |
| Better accessibility/walkability | 118 (38.2) | 62 (42.8) | 1 (50.0) | 181 (39.7) |
| Inspire a greater sense of safety | 115 (37.2) | 49 (33.8) | 0 (0.0) | 164 (36.0) |
| Has better lighting | 170 (55.0) | 77 (53.1) | 1 (50.0) | 248 (54.4) |
| Upgrading and care of the existing greennery | 244 (79.0) | 113 (77.9) | 2 (100) | 359 (78.7) |
| Water element | 118 (38.2) | 51 (35.2) | 1 (50.0) | 170 (37.3) |
| Less noise | 115 (37.2) | 57 (39.3) | 1 (50.0) | 173 (37.9) |
| Greater protection from the weather (e.g., canopy/shade, etc.) | 134 (43.4) | 54 (37.2) | 1 (50.0) | 189 (41.4) |
| More benches and rest areas | 187 (60.5) | 82 (56.6) | 2 (100) | 271 (59.4) |
| More trash cans | 153 (49.5) | 50 (34.5) | 1 (50.0) | 204 (44.7) |
| More pronounced culture and/or art | 184 (59.5) | 72 (49.7) | 2 (100) | 258 (56.6) |
| Access to free wifi | 116 (37.5) | 61 (42.1) | 1 (50.0) | 178 (39.0) |
| Exercise equipment | 43 (13.9) | 13 (9.0) | 1 (50.0) | 57 (12.5) |
| Public WC | 75 (24.3) | 47 (32.4) | 1 (50.0) | 123 (27.0) |
| Special areas for children | 145 (46.9) | 52 (35.9) | 1 (50.0) | 198 (43.4) |
| Other | 18 (5.8) | 7 (4.8) | 1 (50.0) | 26 (5.7) |
Table 4.
Negative experiences in Kaisariani’s main Square regarding gender identity (N=458).
| Women | Men | Non-binary/Other | Total | |
| Ν (%) | Ν (%) | Ν (%) | Ν (%) | |
| Difficulty in crossing | 49 (15.8) | 34 (23.6) | 0 (0.0) | 83 (18.1) |
| Car Accident | 8 (2.8) | 1 (0.07) | 0 (0.0) | 9 (2.0) |
| Fall accident | 37 (11.9) | 10 (6.9) | 0 (0.0) | 47 (10.3) |
| Harassment | 11 (3.5) | 2 (1.4) | 0 (0.0) | 13 (2.9) |
| Racist attack | 5 (1.6) | 1 (0.7) | 0 (0.0) | 6 (1.3) |
| Theft | 18 (5.8) | 11 (7.6) | 0 (0.0) | 29 (6.4) |
| Memory of discomfort (e.g., due to heat, cold, loud noise, etc.) | 59 (19.0) | 23 (16.0) | 1 (50.0) | 83 (18.2) |
| Fear due to lack of lighting | 46 (14.8) | 14 (9.7) | 0 (0.0) | 60 (13.2) |
| Lack of care/cleanliness | 149 (48.1) | 62 (43.1) | 1 (50.0) | 212 (46.5) |
| Other | 7 (2.3) | 3 (2.1) | 0 (0.0) | 10 (2.2) |
| No negative experience | 75 (24.2) | 38 (26.4) | 1 (50.0) | 114 (25.0) |
Table 5.
Responses to the Multiple-Choice Question “If I Could Improve Something in Skopeftirio Park, It Would Be...” regarding gender identity (N=458).
Table 5.
Responses to the Multiple-Choice Question “If I Could Improve Something in Skopeftirio Park, It Would Be...” regarding gender identity (N=458).
| Women | Men | Non-binary/Other | Total | |
| N (%) | N (%) | N (%) | N (%) | |
| Better accessibility/walkability | 86 (27.7) | 43 (29.9) | 1 (50.0) | 130 (28.5) |
| Inspire a greater sense of safety | 237 (76.7) | 105 (72.9) | 1 (50.0) | 343 (75.4) |
| Has better lighting | 226 (72.9) | 98 (68.1) | 2 (100) | 326 (71.5) |
| Upgrading and care of the existing greenery |
221 (71.3) | 106 (73.6) | 2 (100) | 329 (72.1) |
| Water element | 144 (46.5) | 78 (54.2) | 2 (100) | 224 (49.1) |
| Less noise | 51 (16.5) | 21 (14.6) | 0 (0.0) | 72 (15.8) |
| Greater protection from the weather (e.g., canopy/shade, etc.) |
142 (45.8) | 75 (52.1) | 2 (100) | 219 (48.0) |
| More benches and rest areas | 175 (56.5) | 82 (56.9) | 2 (100) | 259 (56.8) |
| More trash cans | 166 (53.5) | 74 (51.4) | 1 (50.0) | 241 (52.9) |
| More culture and/or art | 174 (56.1) | 81 (56.3) | 2 (100) | 257 (56.4) |
| Access to free wifi | 103 (33.2) | 54 (37.5) | 2 (100) | 159 (34.9) |
| Exercise equipment | 86 (27.7) | 47 (32.6) | 1 (50.0) | 134 (29.4) |
| Public WC | 122 (39.4) | 77 (53.5) | 1 (50.0) | 200 (43.9) |
| Special areas for children | 141 (45.5) | 73 (50.7) | 0 (0.0) | 214 (46.9) |
| Other | 33 (10.6) | 15 (10.3) | 1 (50.0) | 49 (10.7) |
Table 6.
Negative experiences in Skopeftirio Park regarding gender identity (N=458).
| Women | Men | Non-binary/Other | Total | |
| N (%) | N (%) | N (%) | N (%) | |
| Difficulty in crossing | 43 (13.9) | 19 (13.2) | 0 (0.0) | 62 (13.6) |
| Car Accident | 4 (1.3) | 2 (1.4) | 0 (0.0) | 6 (1.3) |
| Fall accident | 22 (7.1) | 9 (6.3) | 0 (0.0) | 31 (6.8) |
| Harassment | 51 (16.5) | 22 (15.3) | 0 (0.0) | 73 (16.0) |
| Racist attack | 12 (3.9) | 7 (4.9) | 1 (50.0) | 20 (4.4) |
| Theft | 84 (27.1) | 33 (22.9) | 1 (50.0) | 118 (25.9) |
| Memory of discomfort (e.g., due to heat, cold, loud noise, etc.) | 41 (13.2) | 20 (13.9) | 0 (0.0) | 61 (13.4) |
| Fear due to lack of lighting | 190 (61.3) | 69 (47.9) | 2 (100) | 261 (57.2) |
| Lack of care/cleanliness | 142 (45.8) | 56 (38.9) | 2 (100) | 200 (43.9) |
| Other | 12 (3.9) | 5 (3.4) | 0 (0.0) | 17 (3.7) |
| No negative experience | 50 (16.2) | 34 (23.6) | 0 (0.0) | 84 (18.5) |
Table 7.
Kruskal-Wallis correlation coefficients of scales about free public spaces in Kaisariani with respect to gender identity.
Table 7.
Kruskal-Wallis correlation coefficients of scales about free public spaces in Kaisariani with respect to gender identity.
| Gender | P-value Kruskal-Wallis test | ||||||
| Female | Male | Non-binary/Other | |||||
| Mean (SD) | Median | Mean (SD) | Median | Mean (SD) | Median | ||
| Existence of free public spaces | 3.34 (0.97) | 3 | 3.34 (0.99) | 4 | 3.5 (0.71) | 3.5 | 0.974 |
| Quality of free public spaces | 2.89 (0.75) | 3 | 2.84 (0.74) | 3 | 3.5 (0.71) | 3.5 | 0.273 |
| Times passing per week | 3.95 (1.18) | 4 | 3.78 (1.19) | 4 | 4 (0.00) | 4 | 0.241 |
| Regeneration of Kaisariani | 2.95 (1.25) | 3 | 3.02 (1.34) | 3 | 3 (1.41) | 3 | 0.889 |
| Quality of the square | 2.65 (0.83) | 3 | 2.57 (0.73) | 3 | 4 (0.00) | 4 | 0.025 |
| Accessibility in the square | 3 (0.89) | 3 | 3.04 (0.84) | 3 | 3 (1.41) | 3 | 0.998 |
| Square safety by day | 3.7 (0.77) | 4 | 3.74 (0.77) | 4 | 4.5 (0.71) | 4.5 | 0.253 |
| Square safety by night | 3 (0.9) | 3 | 3.1 (0.9) | 3 | 4.5 (0.71) | 4.5 | 0.063 |
| Quality of urban equipment | 2.52 (0.82) | 3 | 2.57 (0.83) | 3 | 3.5 (0.71) | 3.5 | 0.236 |
| Green in the square | 2.45 (0.9) | 2 | 2.4 (0.84) | 2 | 3 (0.00) | 3 | 0.371 |
| Square as an identity of Kaisariani | 3.83 (1.21) | 4 | 3.89 (1.21) | 4 | 4.5 (0.71) | 4.5 | 0.664 |
| Skopeftirio as an identity of Kaisariani | 4.63 (0.78) | 5 | 4.71 (0.68) | 5 | 5 (0.00) | 5 | 0.369 |
| Opinion about the metro station in Kaisariani | 4.7 (1.31) | 5 | 4.99 (1.14) | 5 | 4 (0.00) | 4 | 0.029 |
Table 8.
Cronbach’s alpha reliability results and the impact of a missing question regarding Kaisariani Square’s quality.
Table 8.
Cronbach’s alpha reliability results and the impact of a missing question regarding Kaisariani Square’s quality.
| Minimum | Maximum | Mean (SD) | Median | Cronbach’s if item deleted | Cronbach’s a | |
| Quality of free public spaces | 1 | 5 | 2.87 (0.76) | 3 | 0.776 | |
| Quality | 1 | 5 | 2.62 (0.81) | 3 | 0.745 | |
| Accessibility | 1 | 5 | 3.00 (0.88) | 3 | 0.756 | |
| Safety by day | 1 | 5 | 3.71 (0.77) | 4 | 0.766 | |
| Safety by night | 1 | 5 | 3.04 (0.91) | 3 | 0.769 | |
| Quality of urban equipment | 1 | 5 | 2.54 (0.83) | 3 | 0.755 | |
| Greennery | 1 | 5 | 2.44 (0.88) | 2 | 0.780 | |
| 0.791 | ||||||
Disclaimer/Publisher’s Note: The statements, opinions and data contained in all publications are solely those of the individual author(s) and contributor(s) and not of MDPI and/or the editor(s). MDPI and/or the editor(s) disclaim responsibility for any injury to people or property resulting from any ideas, methods, instructions or products referred to in the content. |
© 2025 by the authors. Licensee MDPI, Basel, Switzerland. This article is an open access article distributed under the terms and conditions of the Creative Commons Attribution (CC BY) license (https://creativecommons.org/licenses/by/4.0/).
Copyright: This open access article is published under a Creative Commons CC BY 4.0 license, which permit the free download, distribution, and reuse, provided that the author and preprint are cited in any reuse.


