
Submitted:
30 November 2025
Posted:
01 December 2025
You are already at the latest version
Abstract
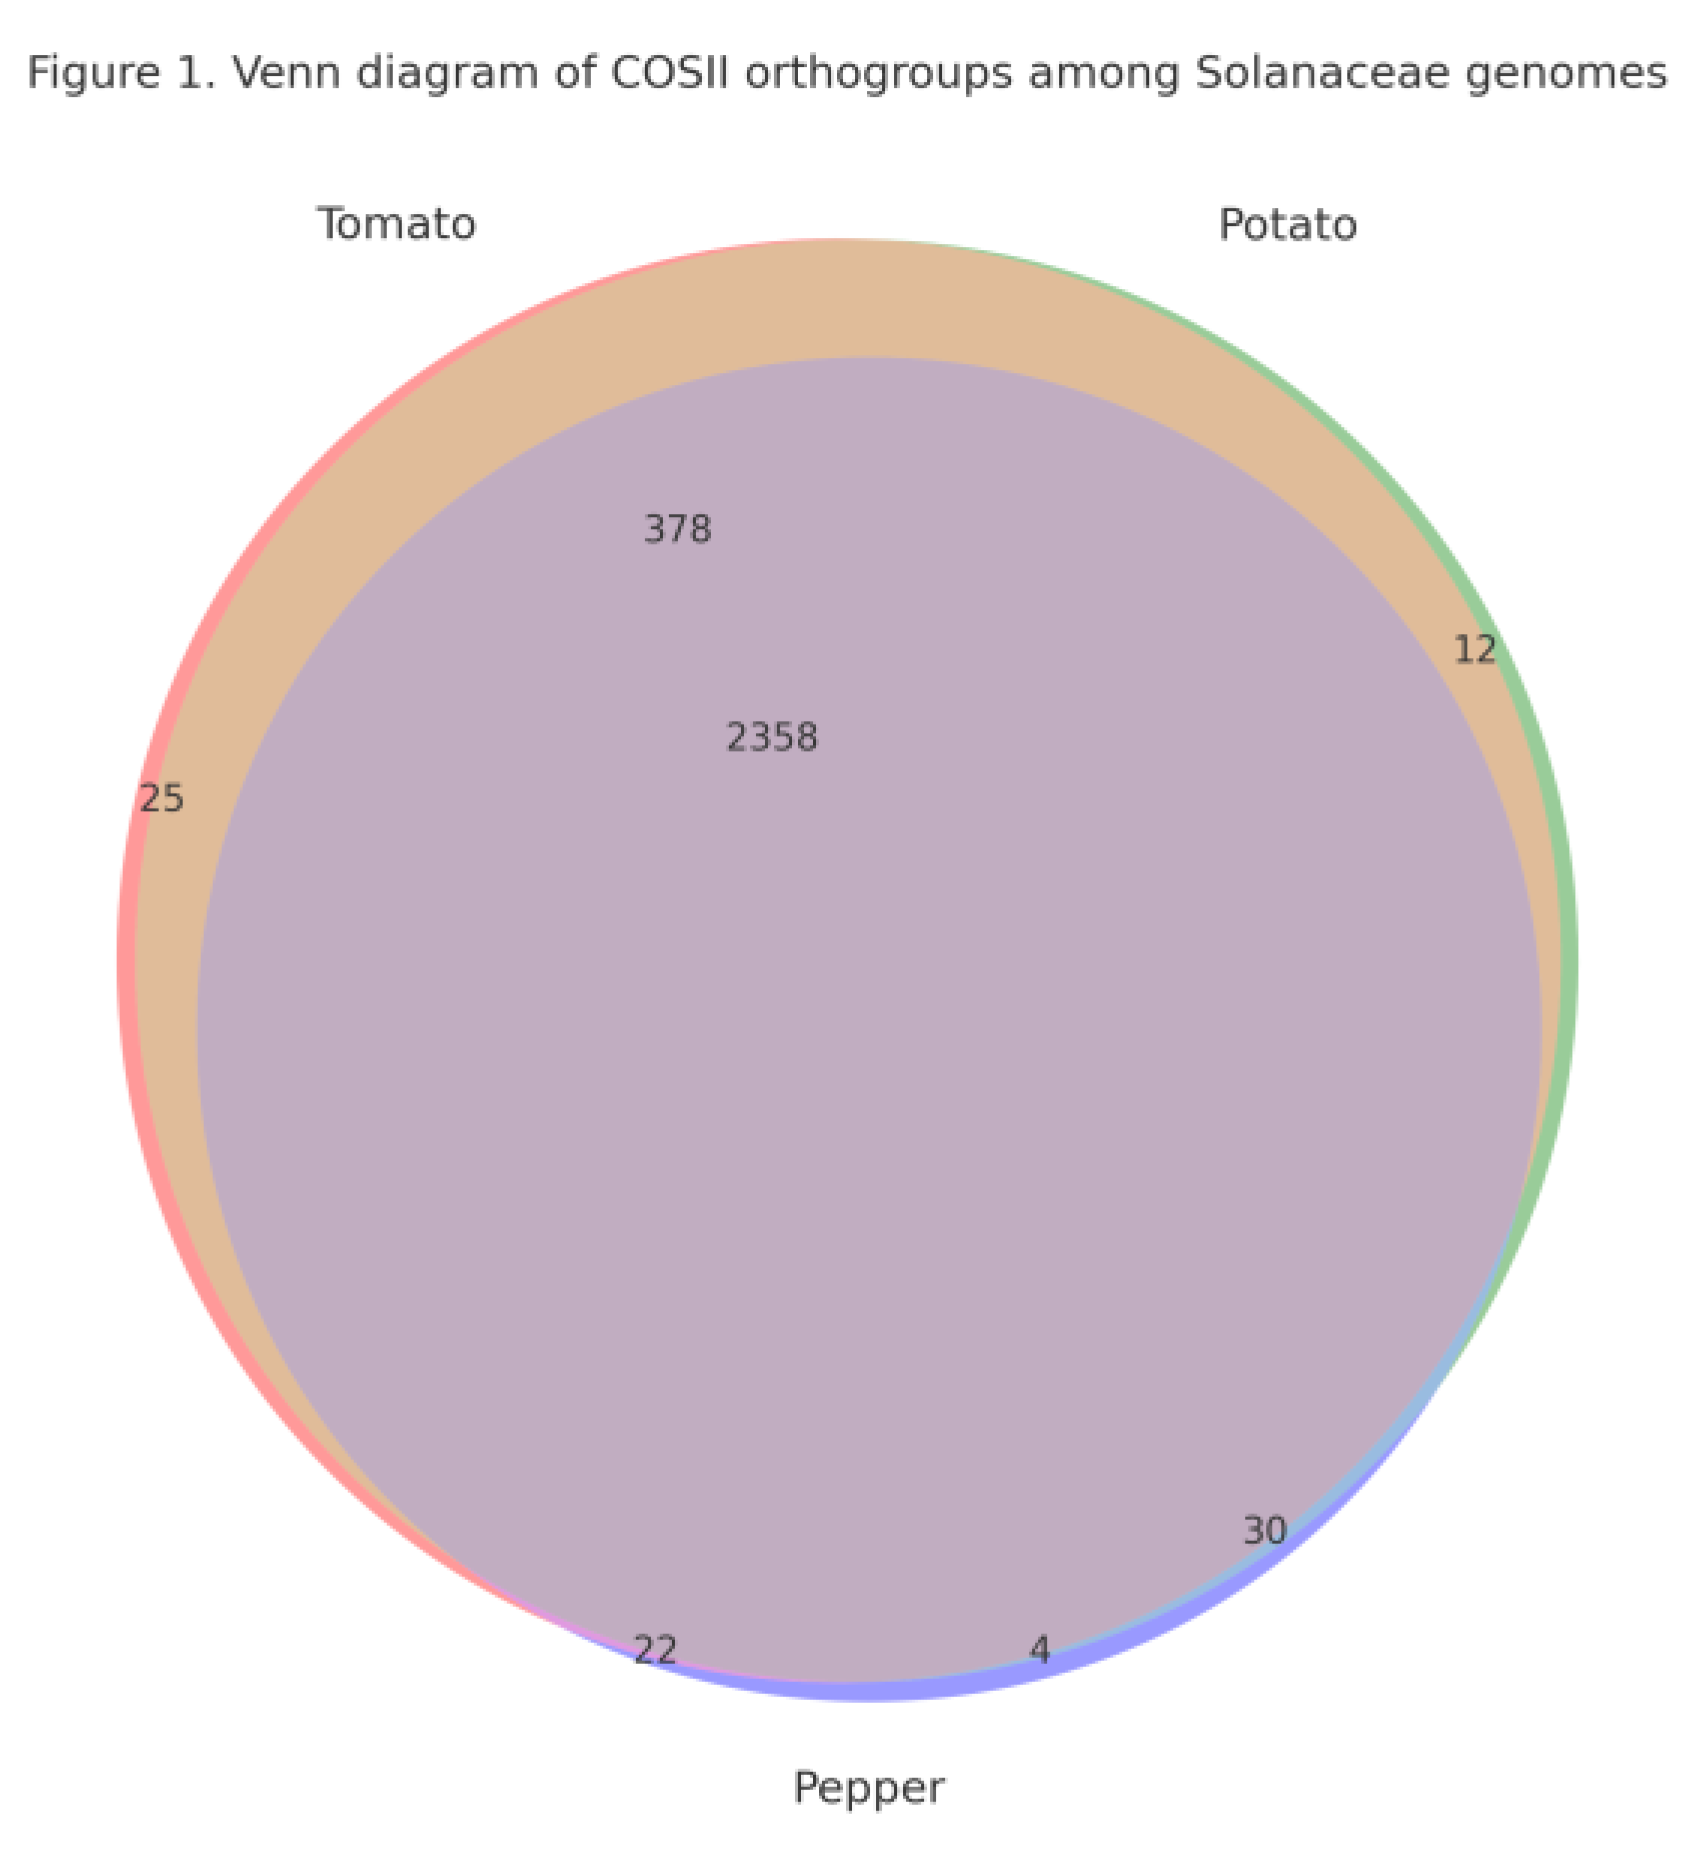
Conserved Ortholog Set II (COSII) markers represent a well-established resource for comparative genomics and phylogenetic analyses in the Solanaceae family. In this study, we conducted a comprehensive in silico assessment of COSII orthologs in Solanum lycopersicum L., Solanum tuberosum L., and Capsicum annuum L. using an integrated workflow that combined OrthoFinder-based orthogroup inference, hierarchical orthogroup (HOG) reconstruction, synteny mapping, and evaluation of copy number. We identified 2,853 COSII-associated orthogroups, of which 2,359 (82.7%) were shared among all the three species, forming a deeply conserved solanaceous core. Among the three species, 1,839 orthogroups represented strict single-copy loci, reflecting their high evolutionary stability. Across these loci tomato and potato retained nearly complete single-copy status, whereas C. annuum L. displayed moderate copy-number variation (mean 1.35 genes per orthogroup; 22% multicopy), with duplicated clusters enriched on chromosomes 1-3, as well as on unplaced scaffolds (CA00). Hierarchical orthogroup analysis revealed substantial gene family expansion at the ancestral Solanaceae node, followed by lineage-specific diversification within Solanum and Capsicum. Synteny mapping showed extensive collinearity among genomes, combined with localized breaks and rearrangements in pepper. Together, these findings highlight a dual evolutionary pattern in Solanaceae: a highly conserved COSII genomic backbone, alongside lineage-specific structural innovations in C. annuum. COSII remains a reliable marker system for phylogenetics, comparative genomics, and marker-assisted breeding. The observed Capsicum-specific multicopy expansions overlap genomic regions enriched for stress-response gene families, suggesting links between structural variation and abiotic stress adaptation.
Keywords:
1. Introduction
2. Materials and Methods
Genome Resources
Dataset Preparation and Gene Model Extraction
COSII Marker Dataset Construction
Orthology Inference Using OrthoFinder
Phylogenetic Reconstruction of Single-Copy COSII Orthologs
Copy Number Variation (CNV) Analysis
Chromosomal Mapping and Synteny Analyses
Hierarchical Orthogroup (HOG) Analysis
Multiple alignment and tree inference
Synteny assessment and annotation
3. Results
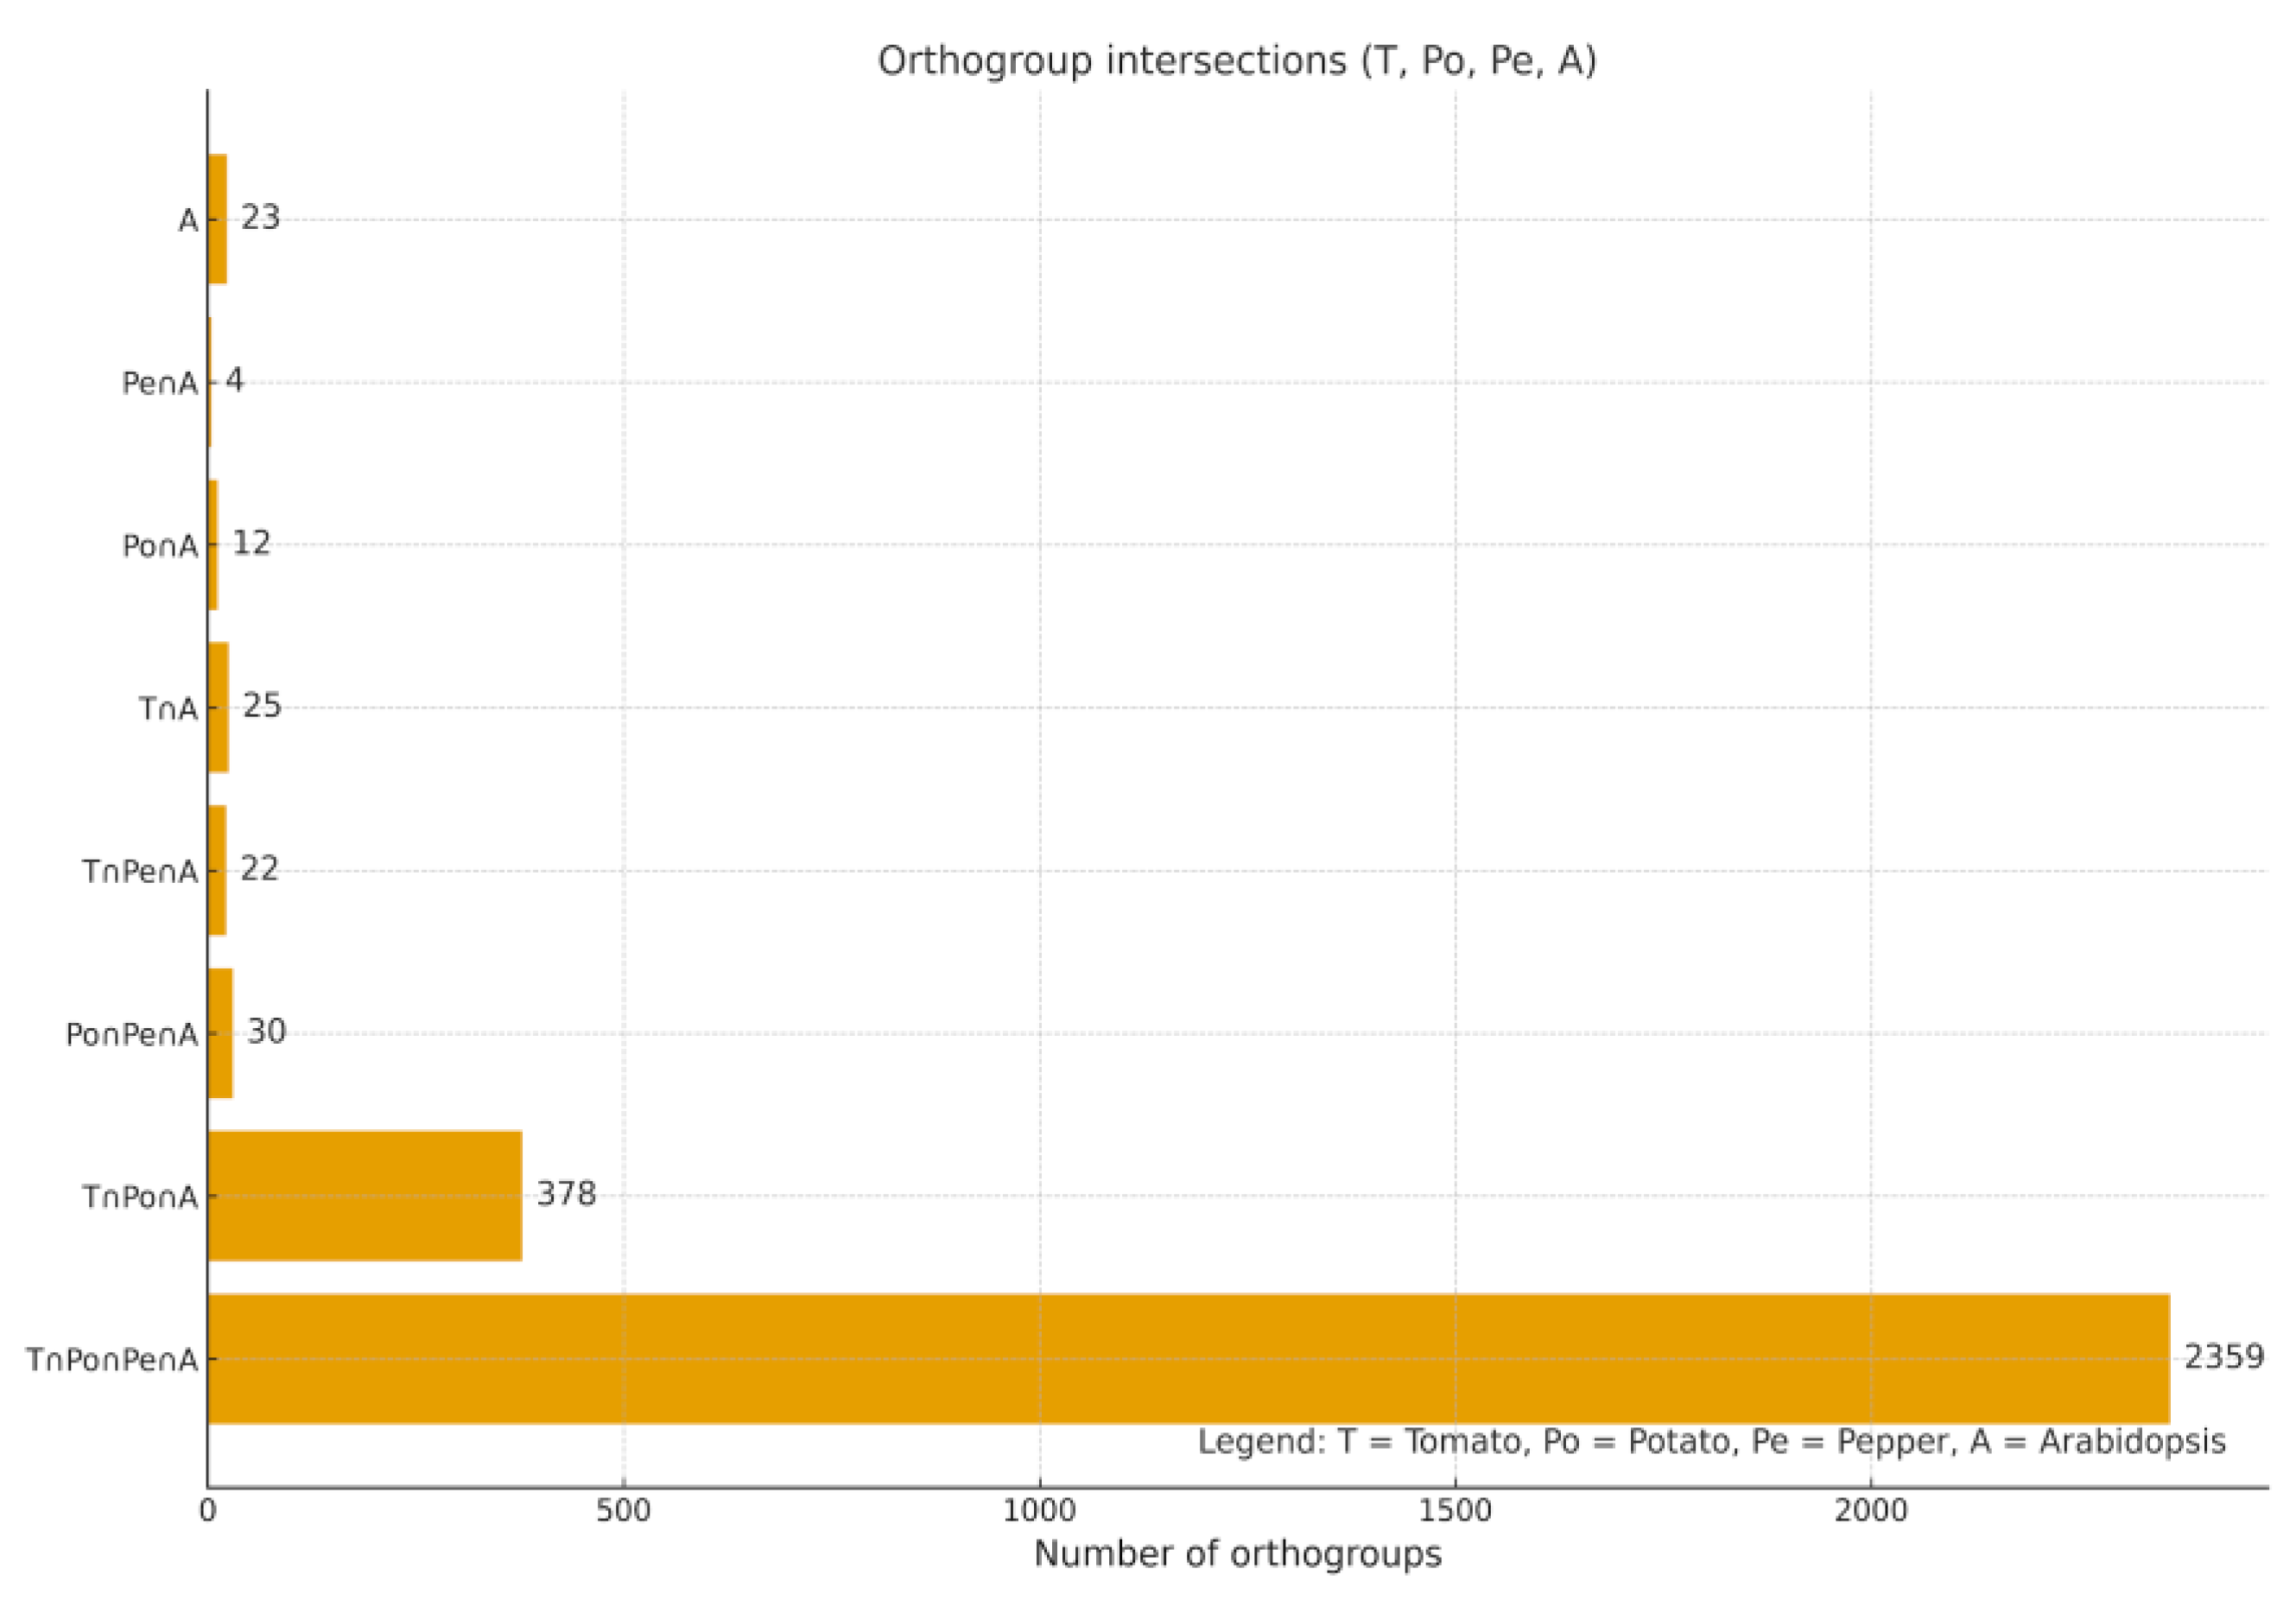
Identification of COSII Orthogroups Across Tomato, Potato and Pepper
Single-Copy and Multicopy COSII Orthologs
Phylogenetic Tree Reconstruction
Evolutionary Dynamics of Hierarchical Orthogroups (HOGs)
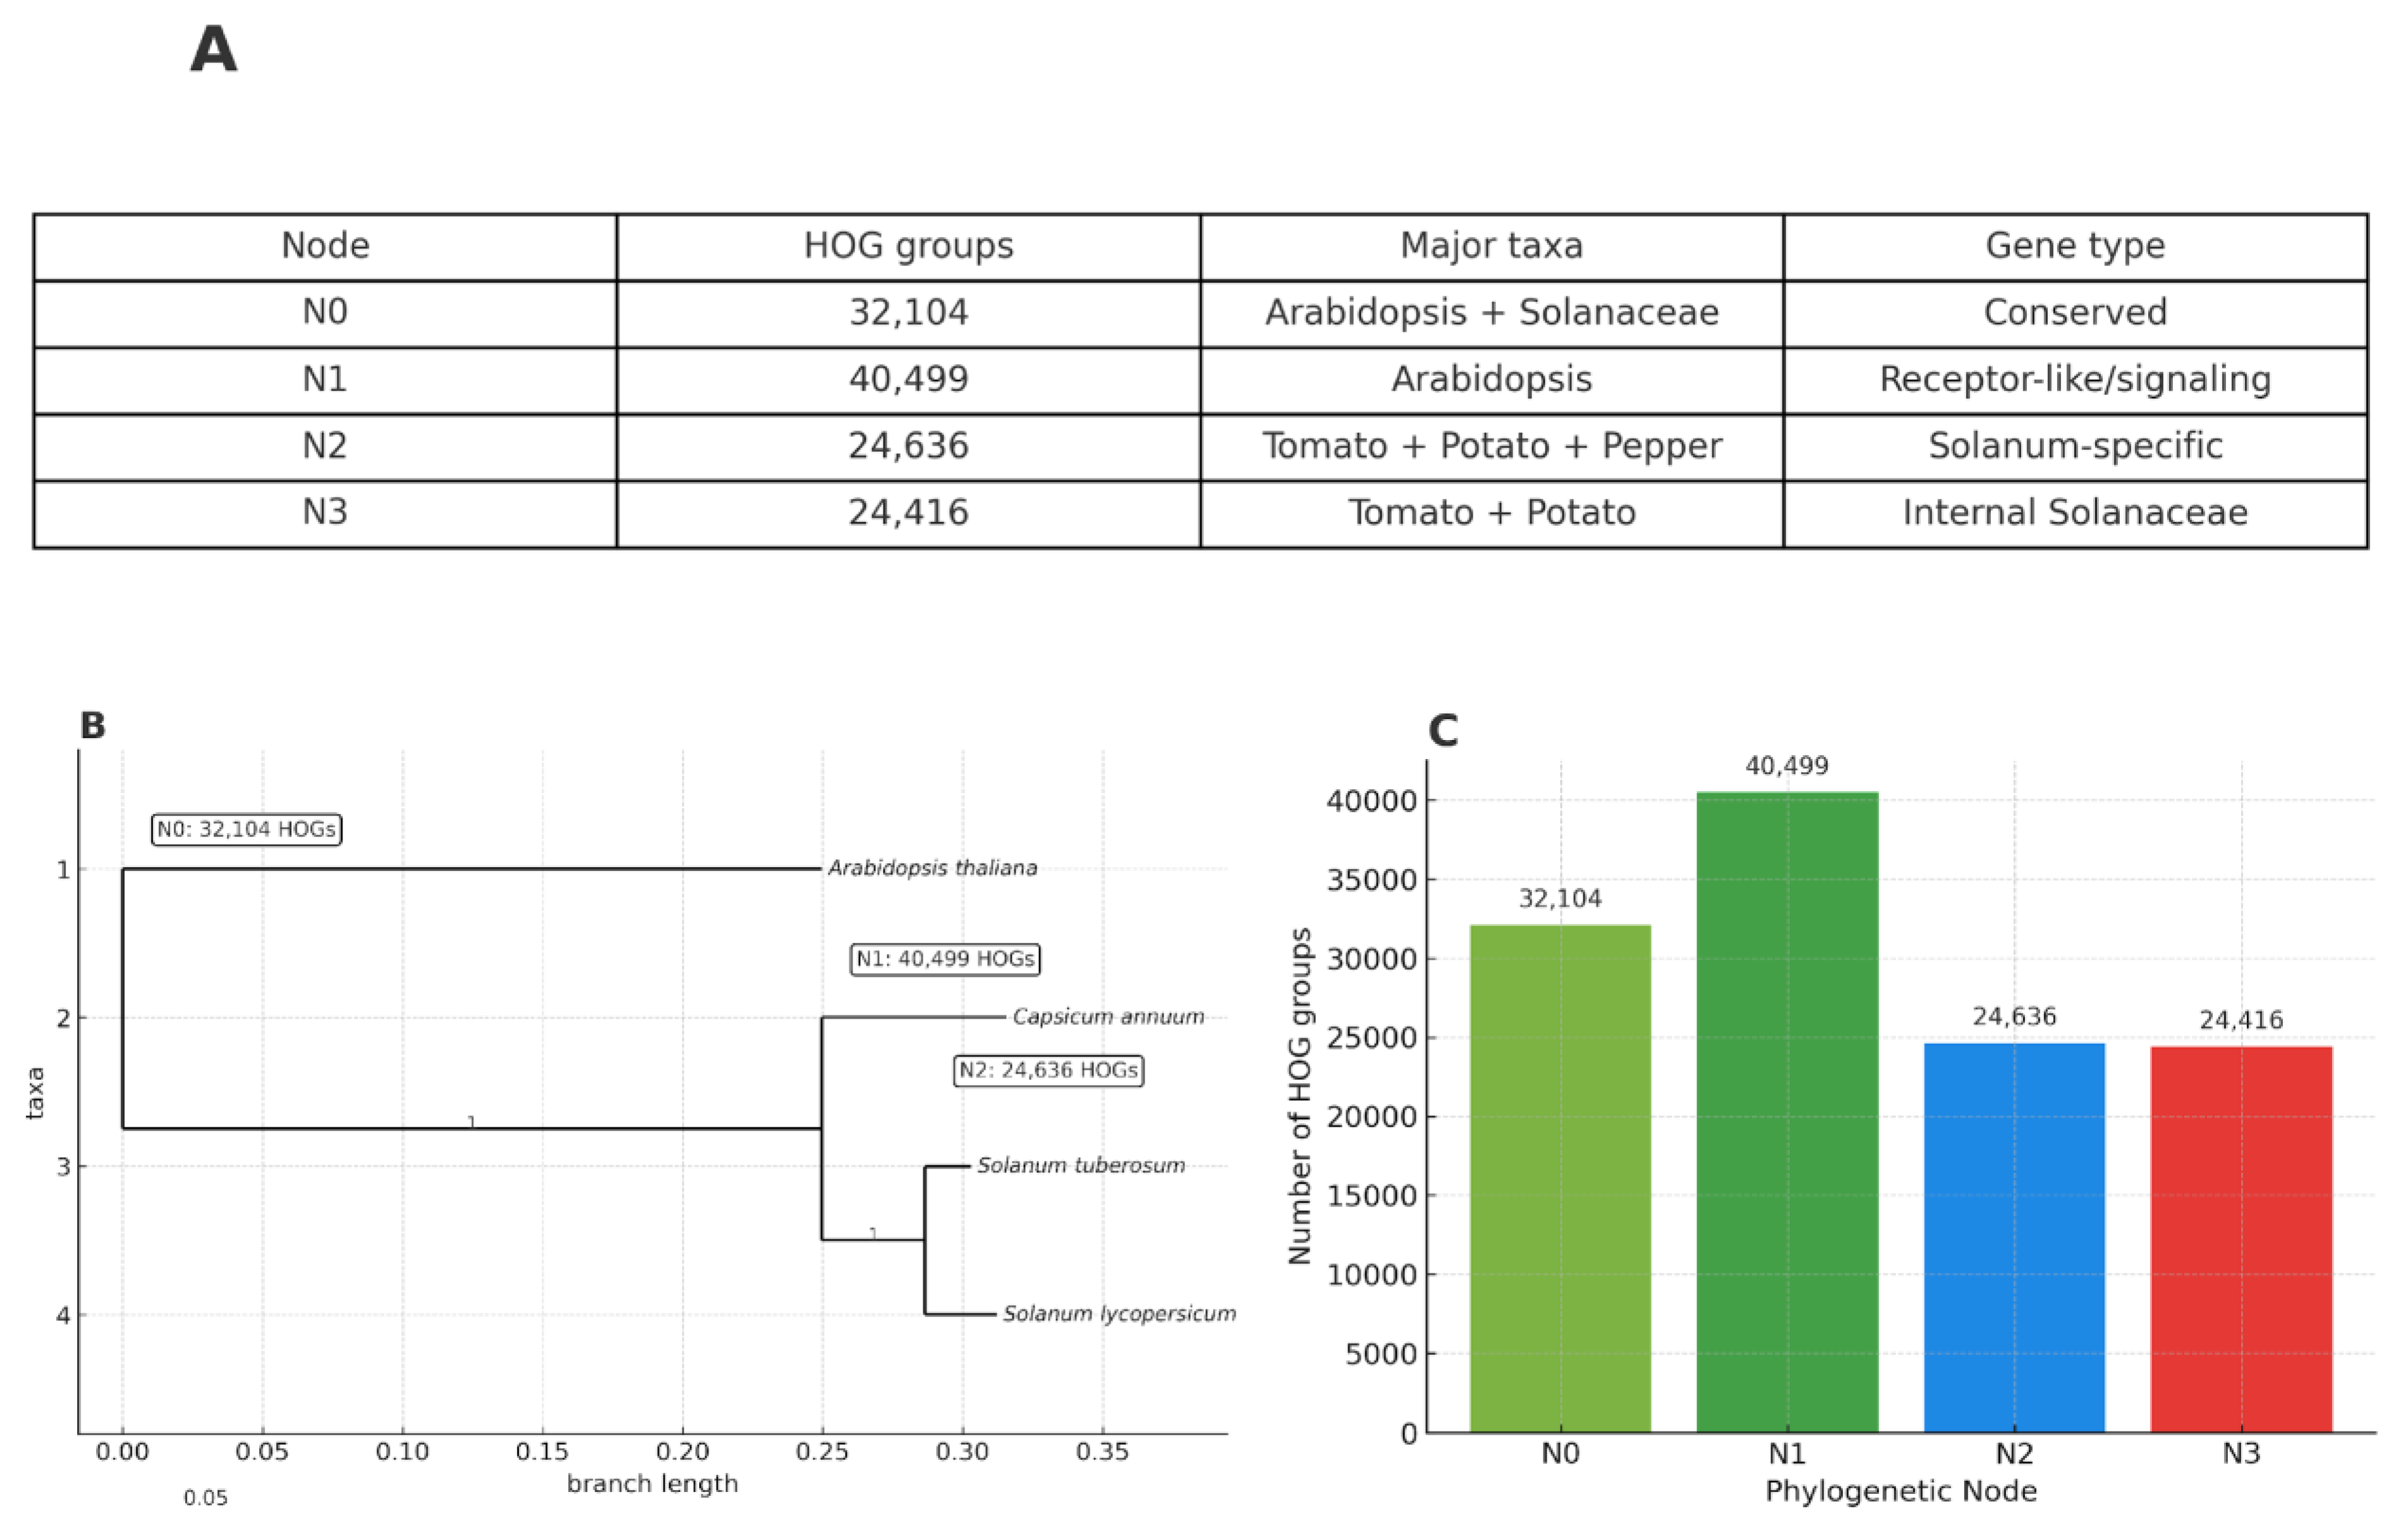
Overall Distribution of HOGs Across Phylogenetic Nodes
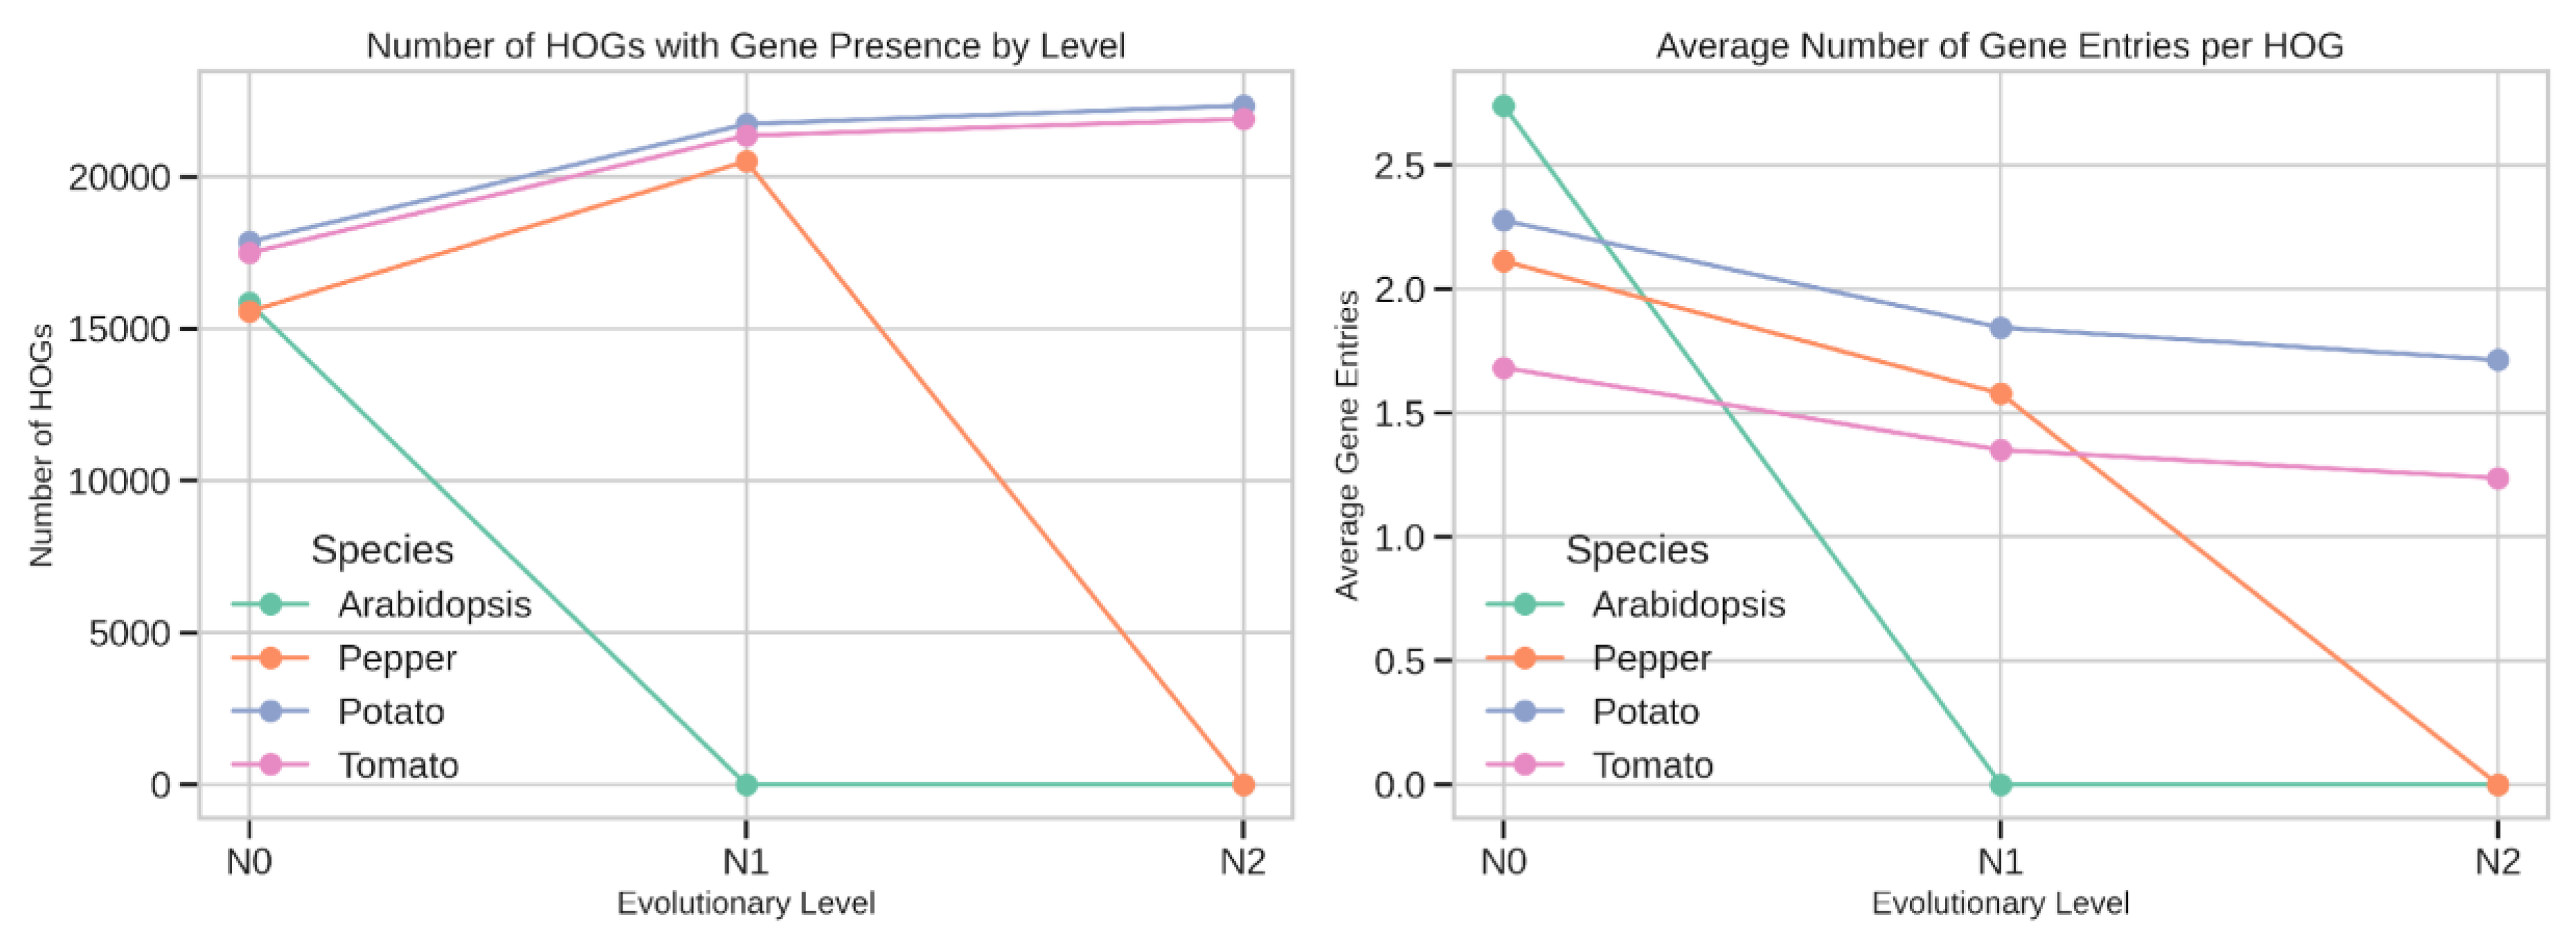
Species-Specific Patterns of HOG Representation
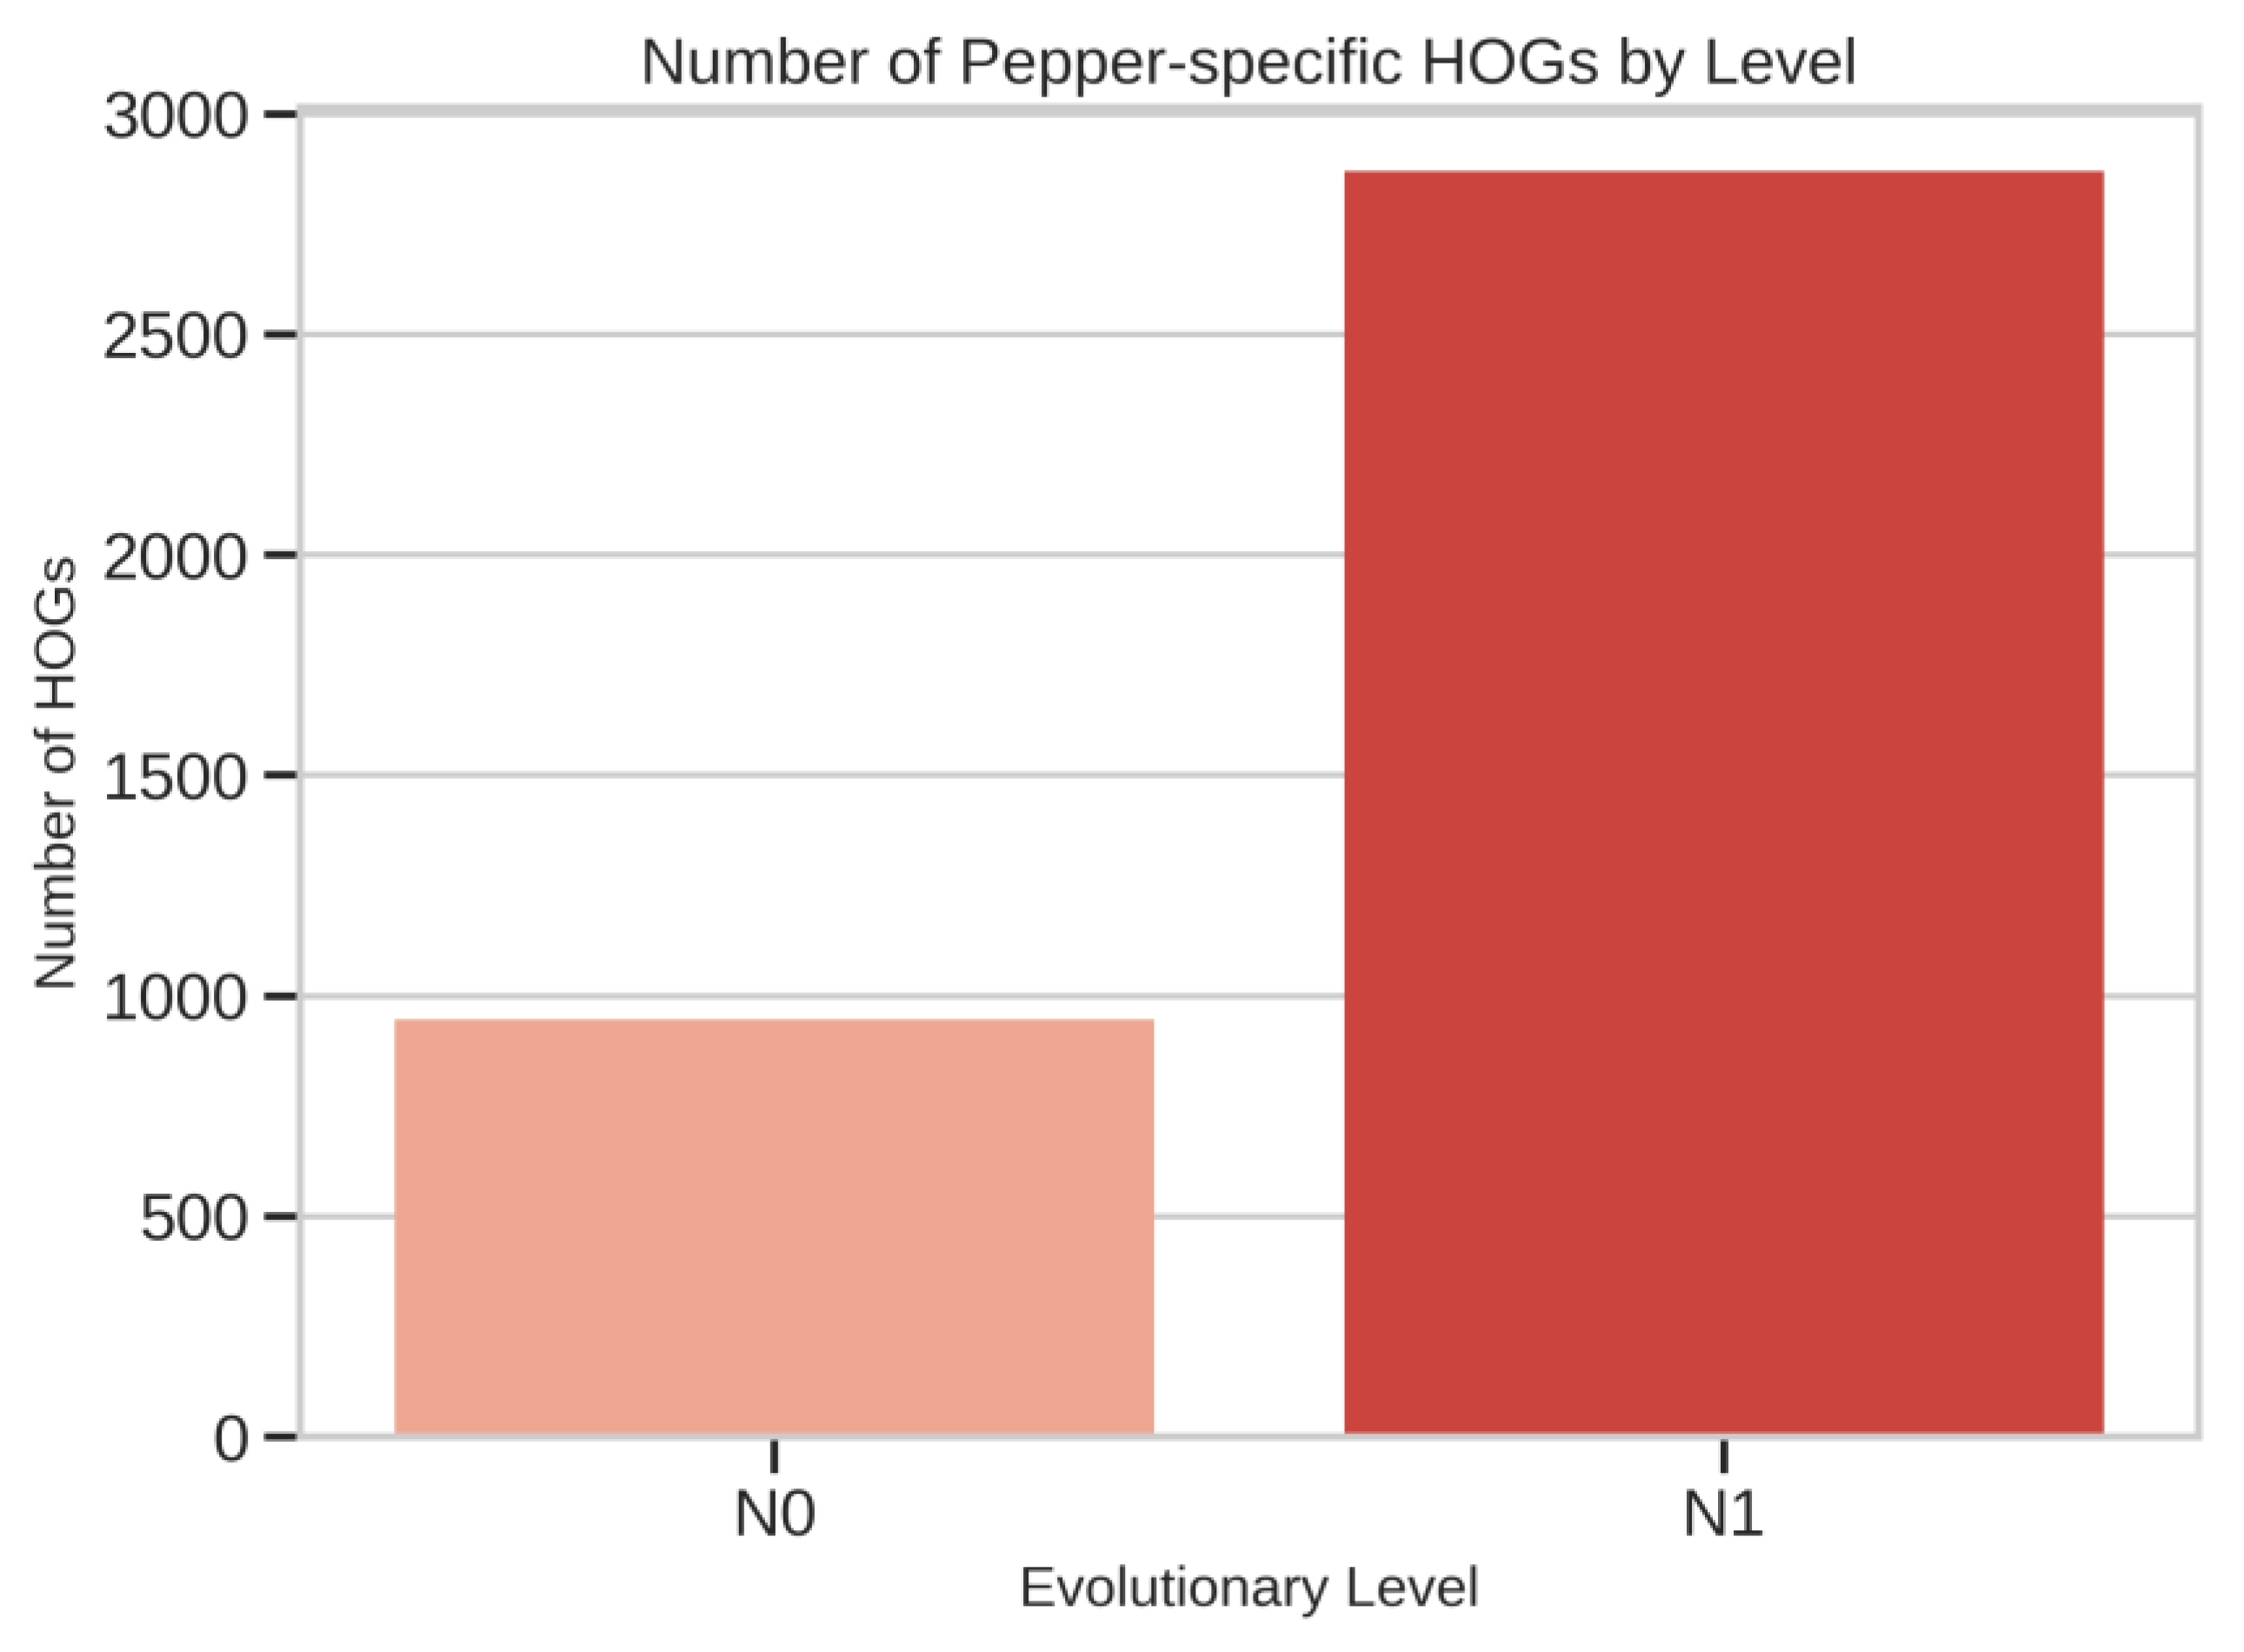
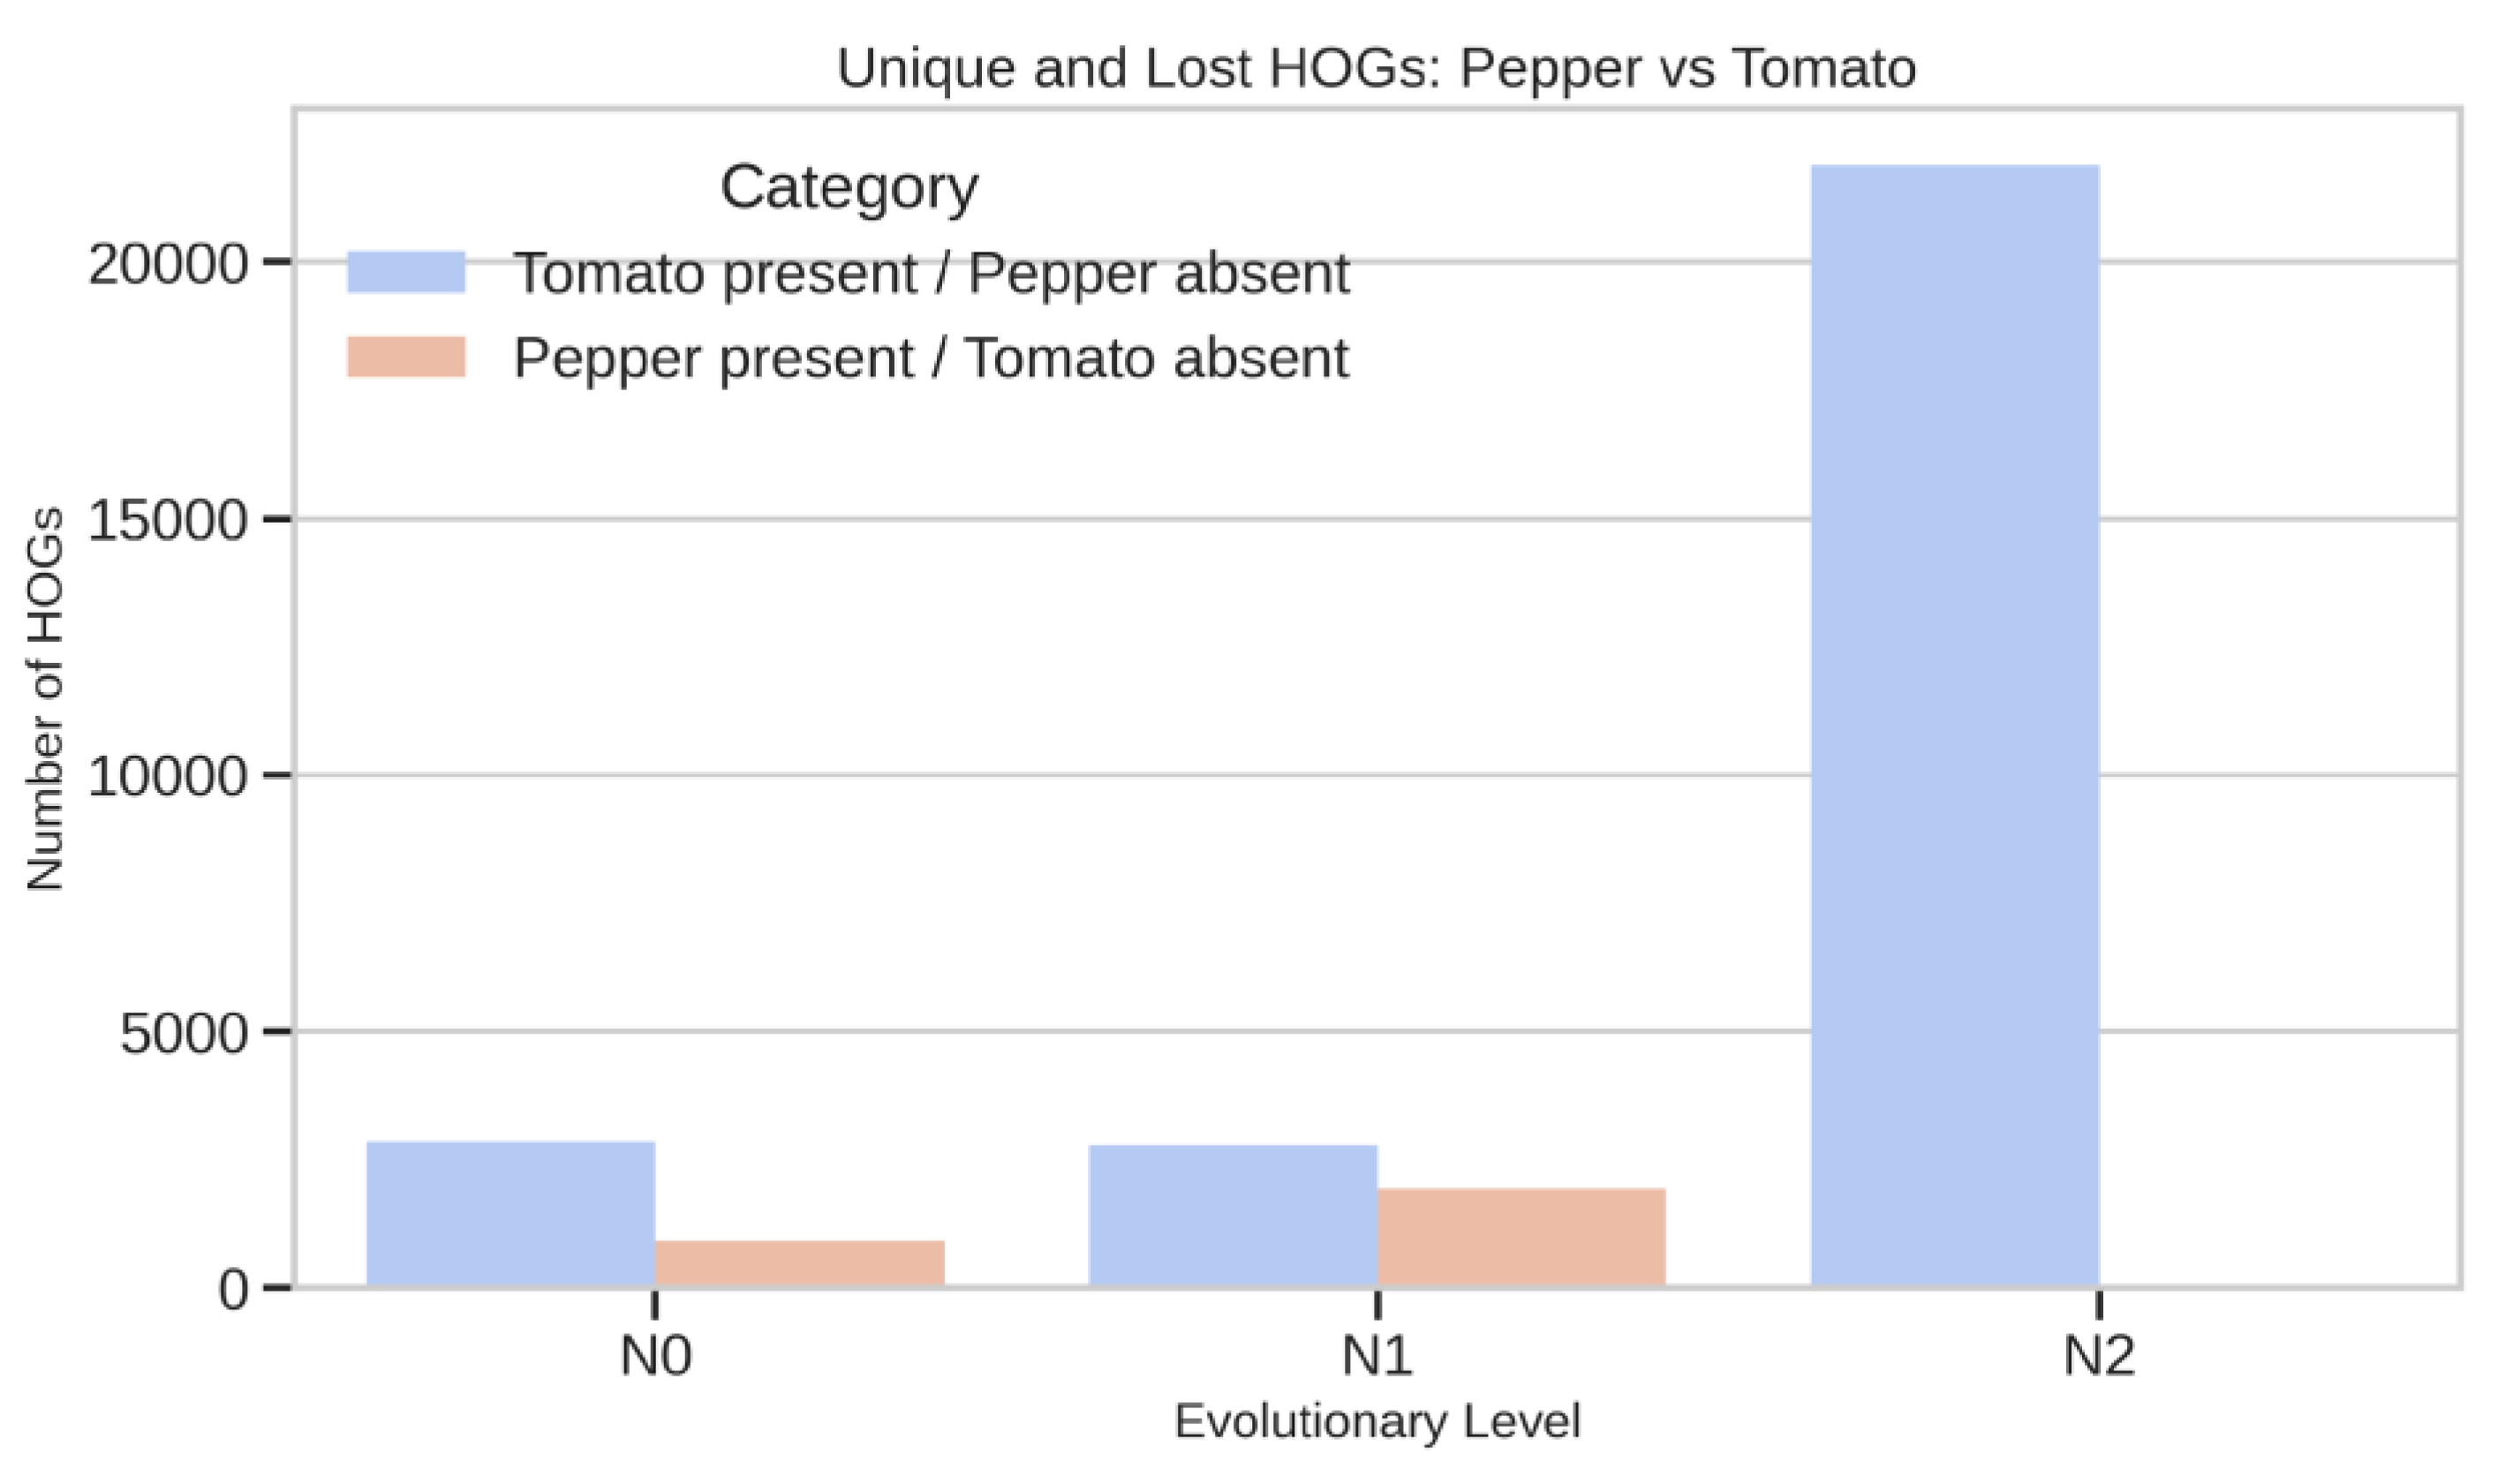
Pepper-Specific HOG Expansions
Tomato–Pepper Lineage-Specific Differences
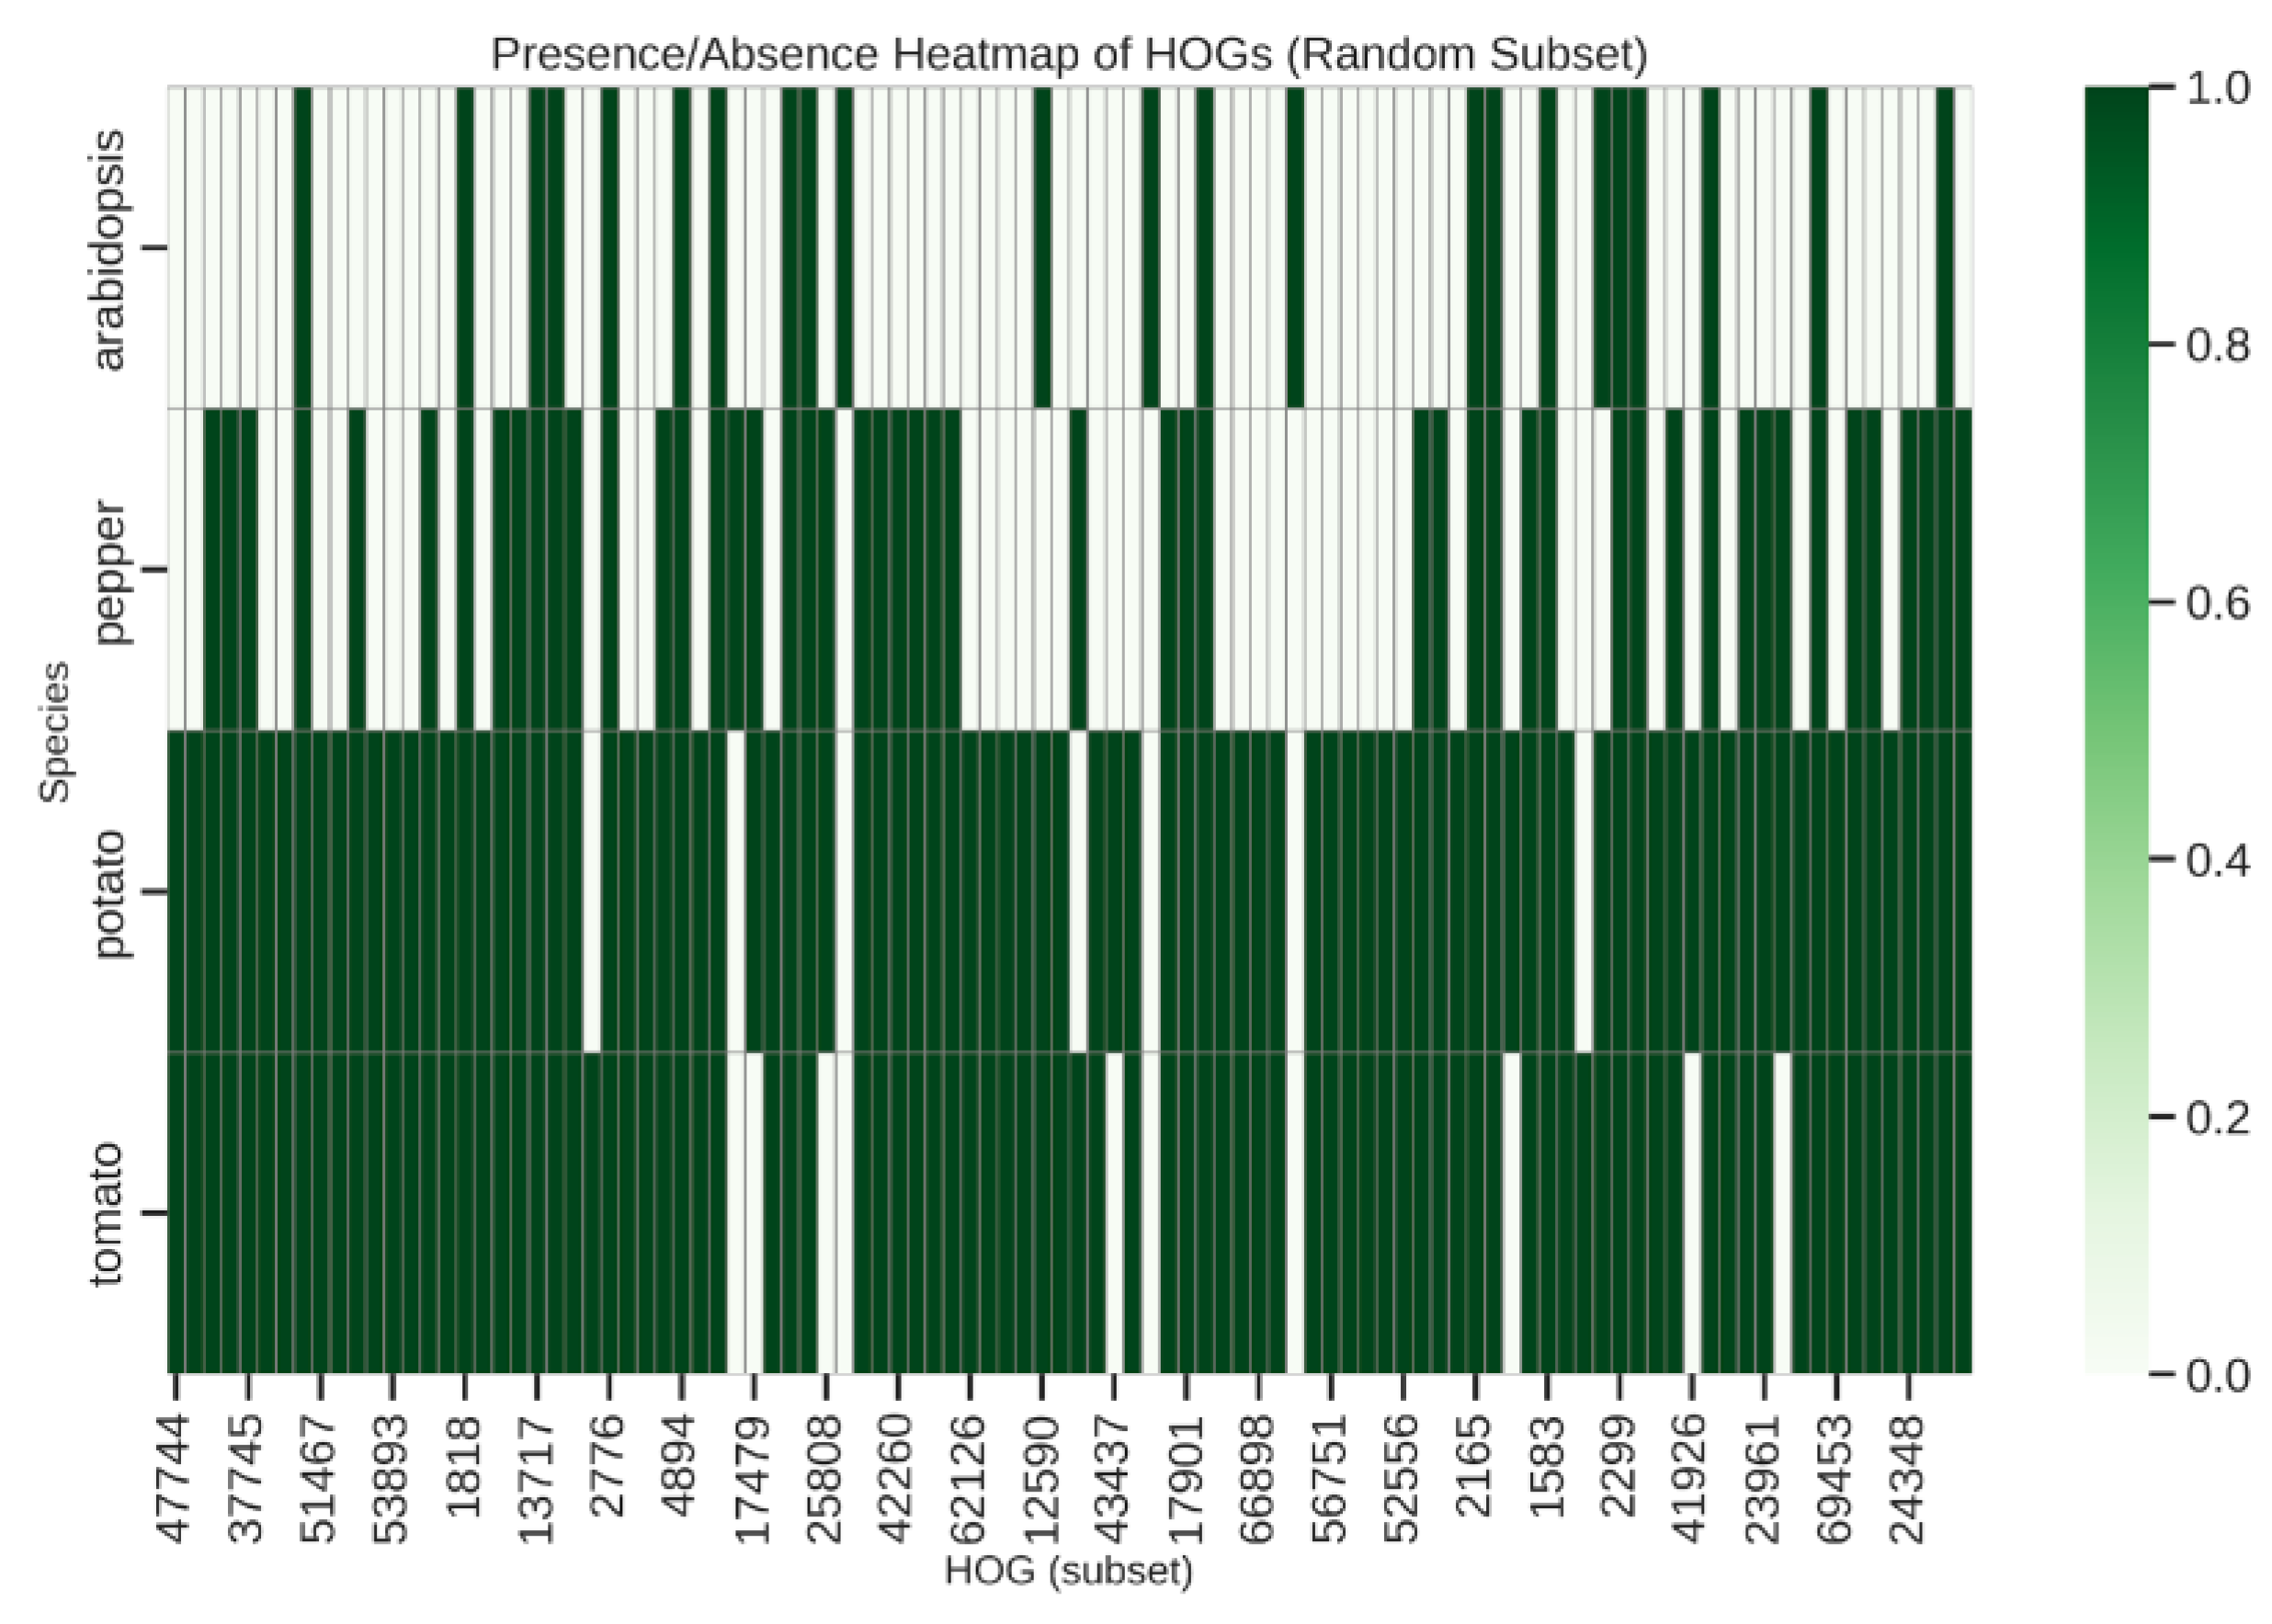
Presence/Absence Variation and Heatmap Visualization
COSII Orthogroup Distribution and Synteny
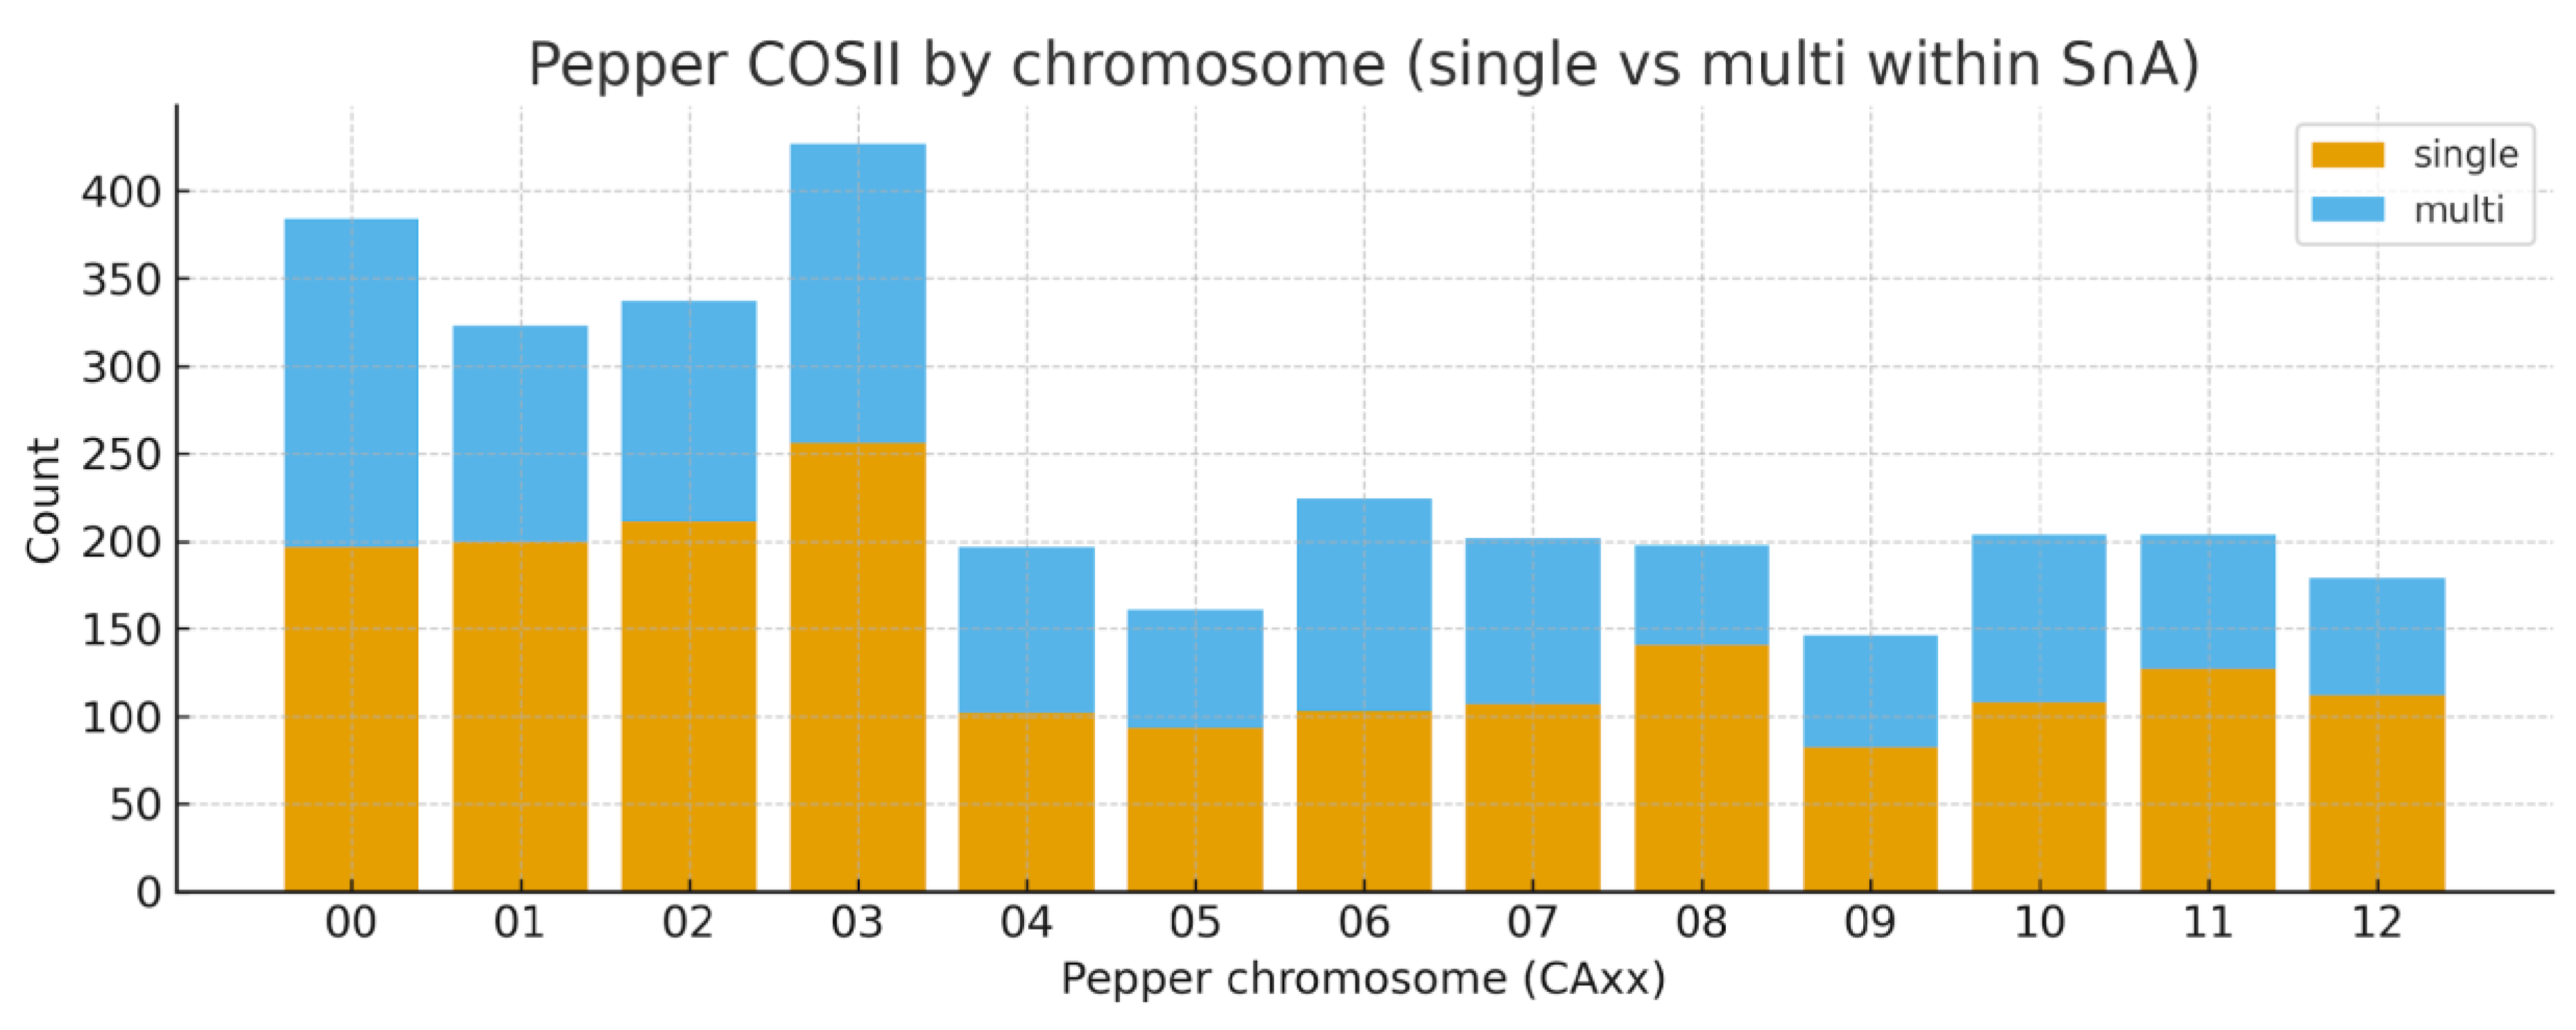
Chromosomal Distribution and Synteny of COSII Loci
Conservation of the COSII Core
Copy-Number Variation and Lineage-Specific COSII Dynamics
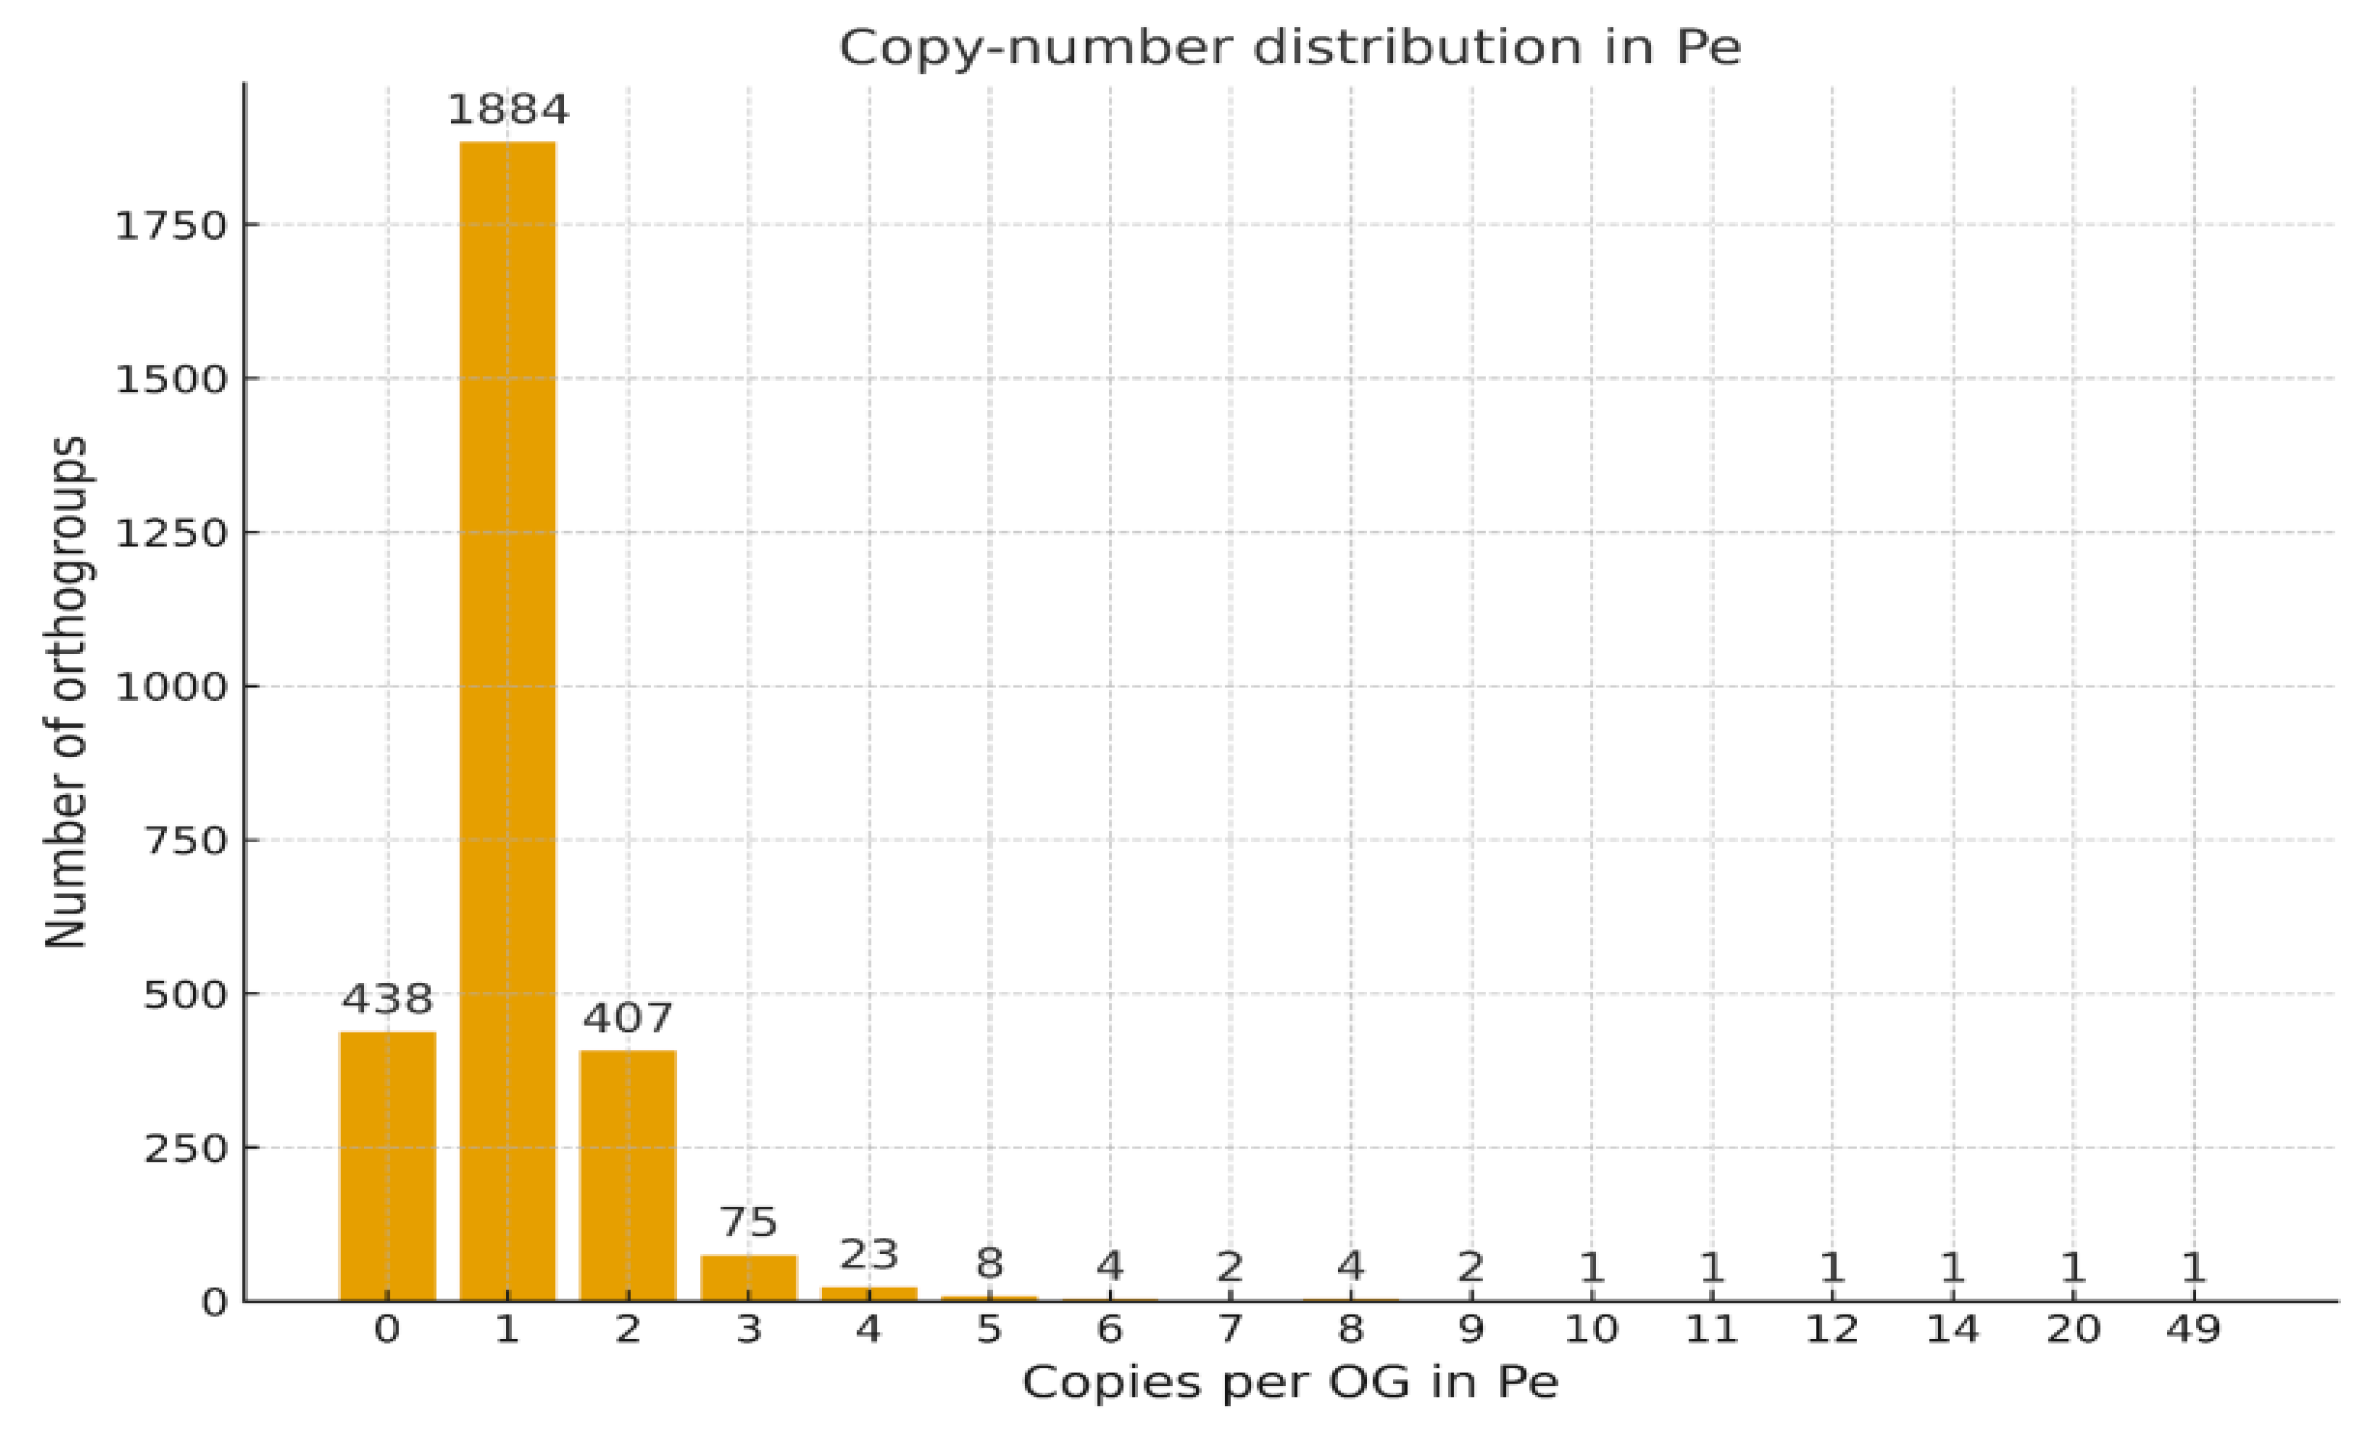
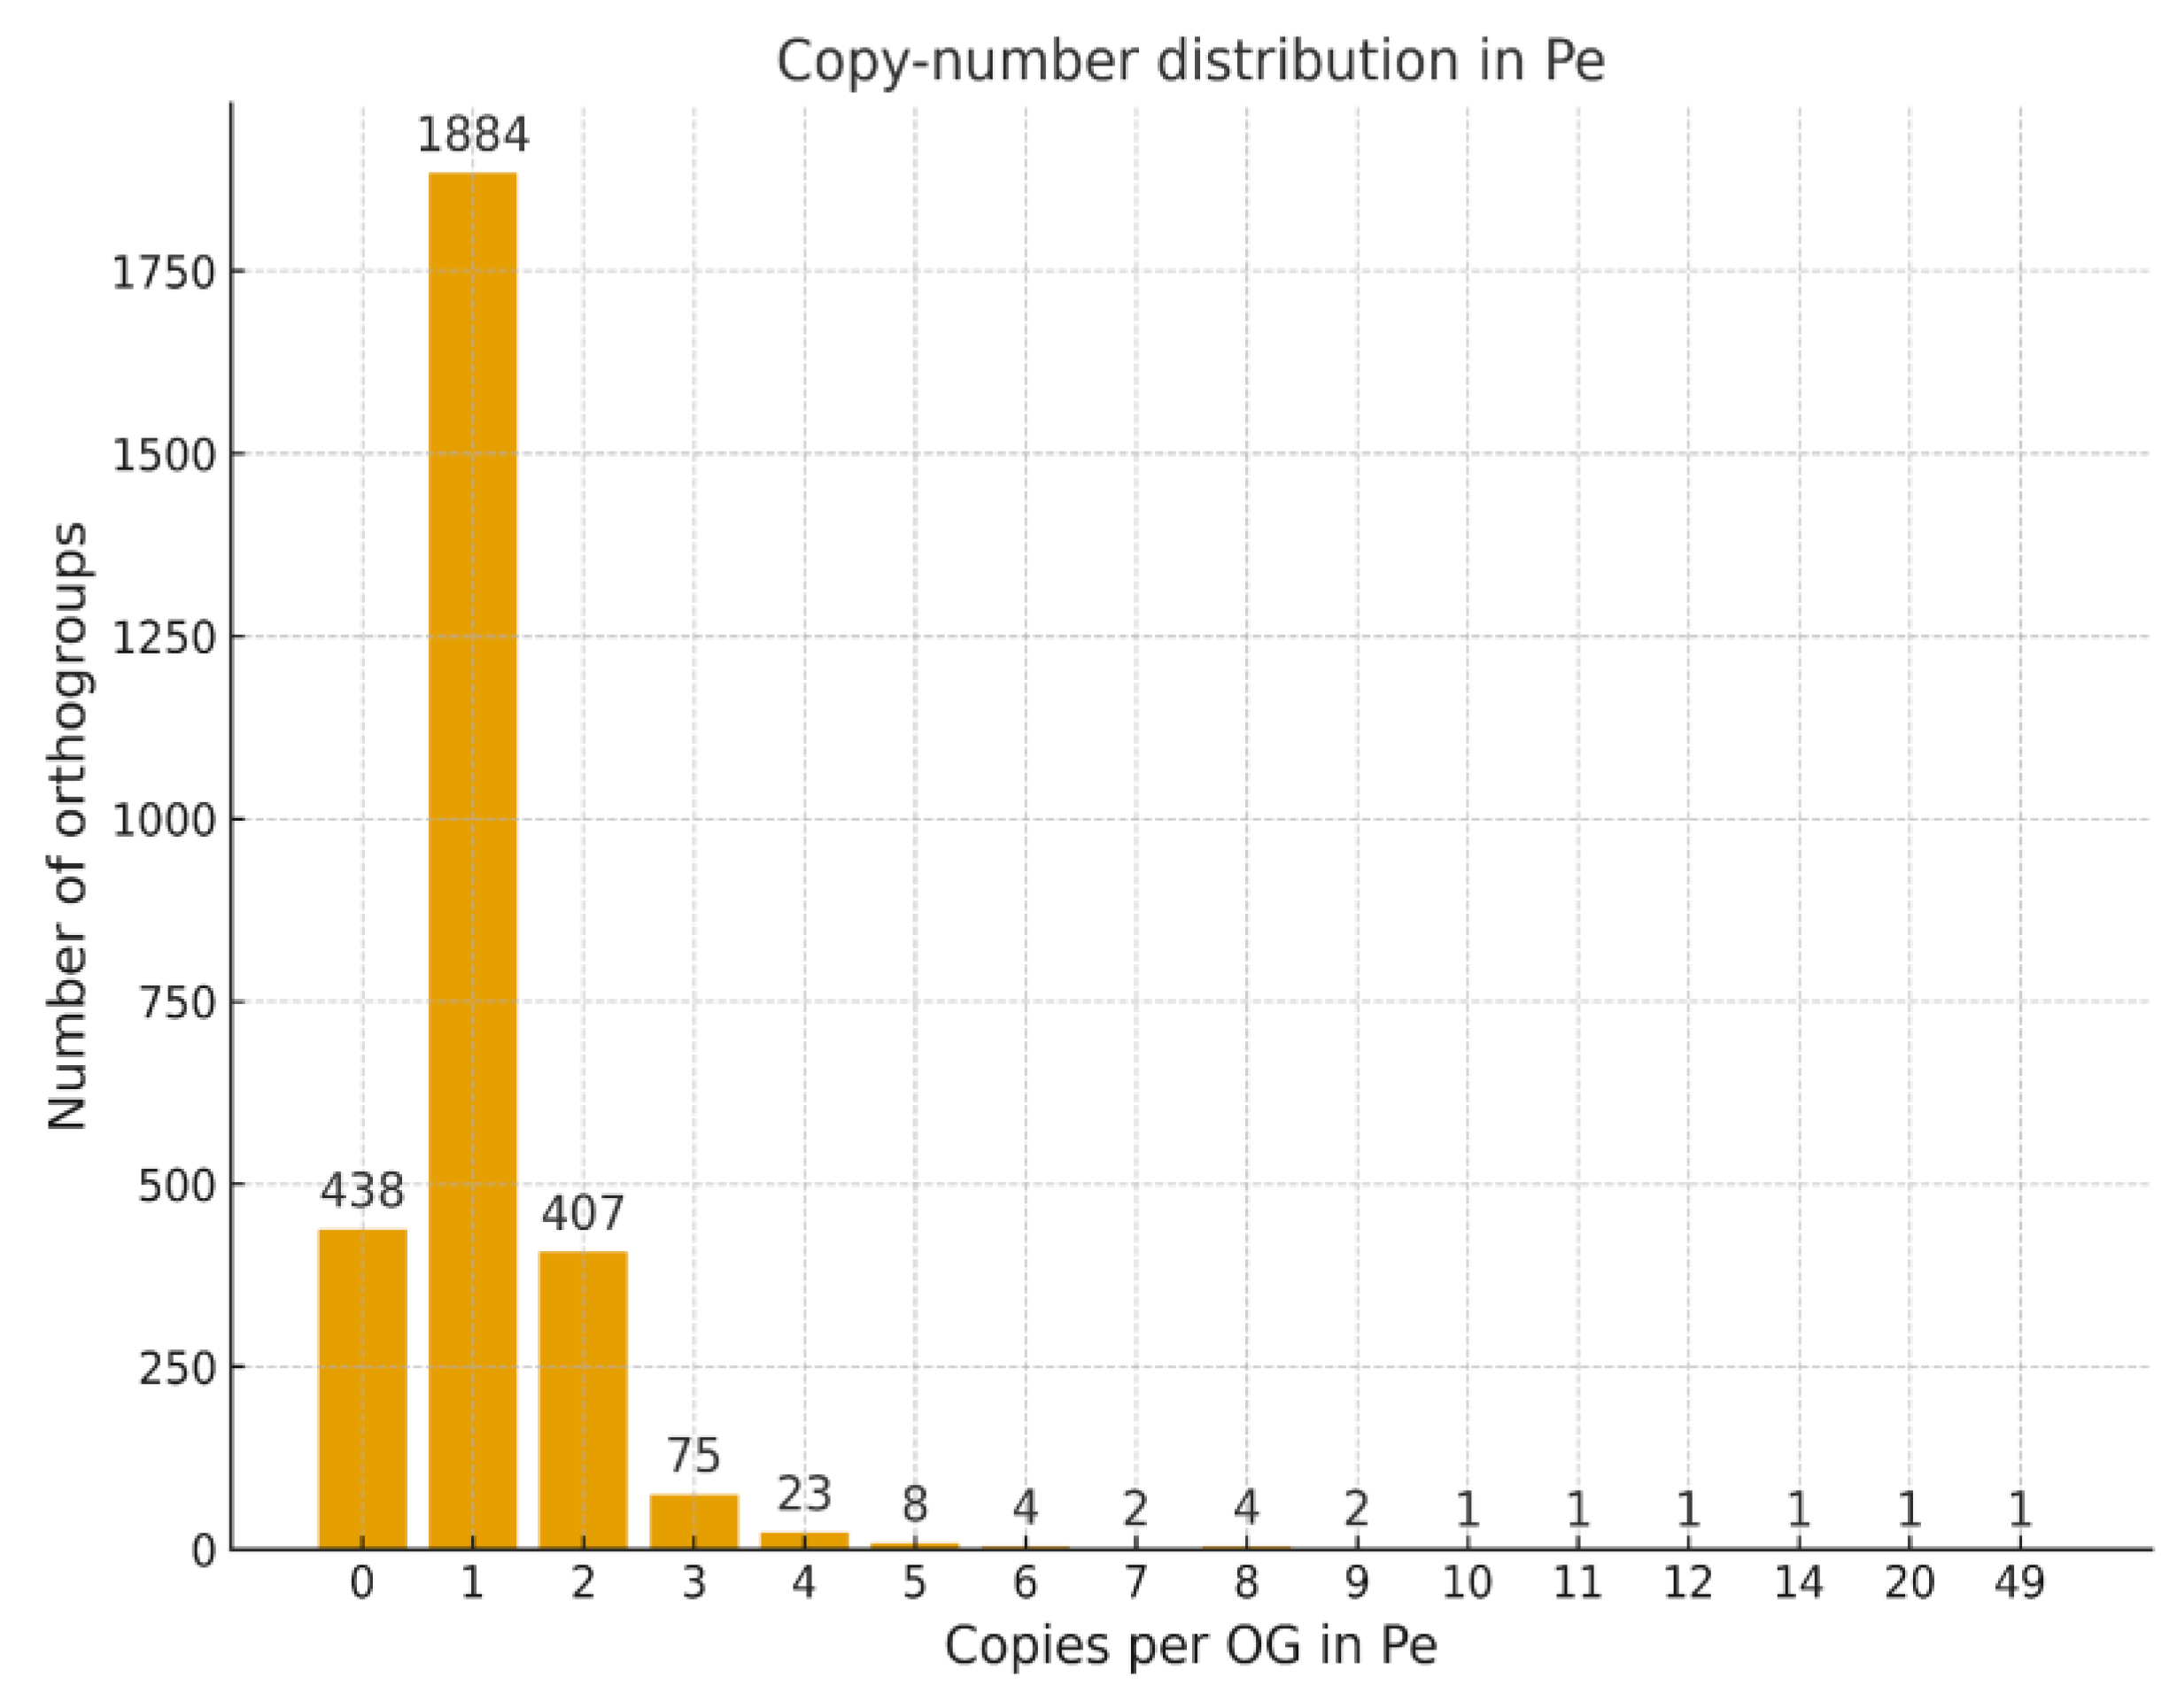
Histogram of Gene Copy Number per Orthogroup
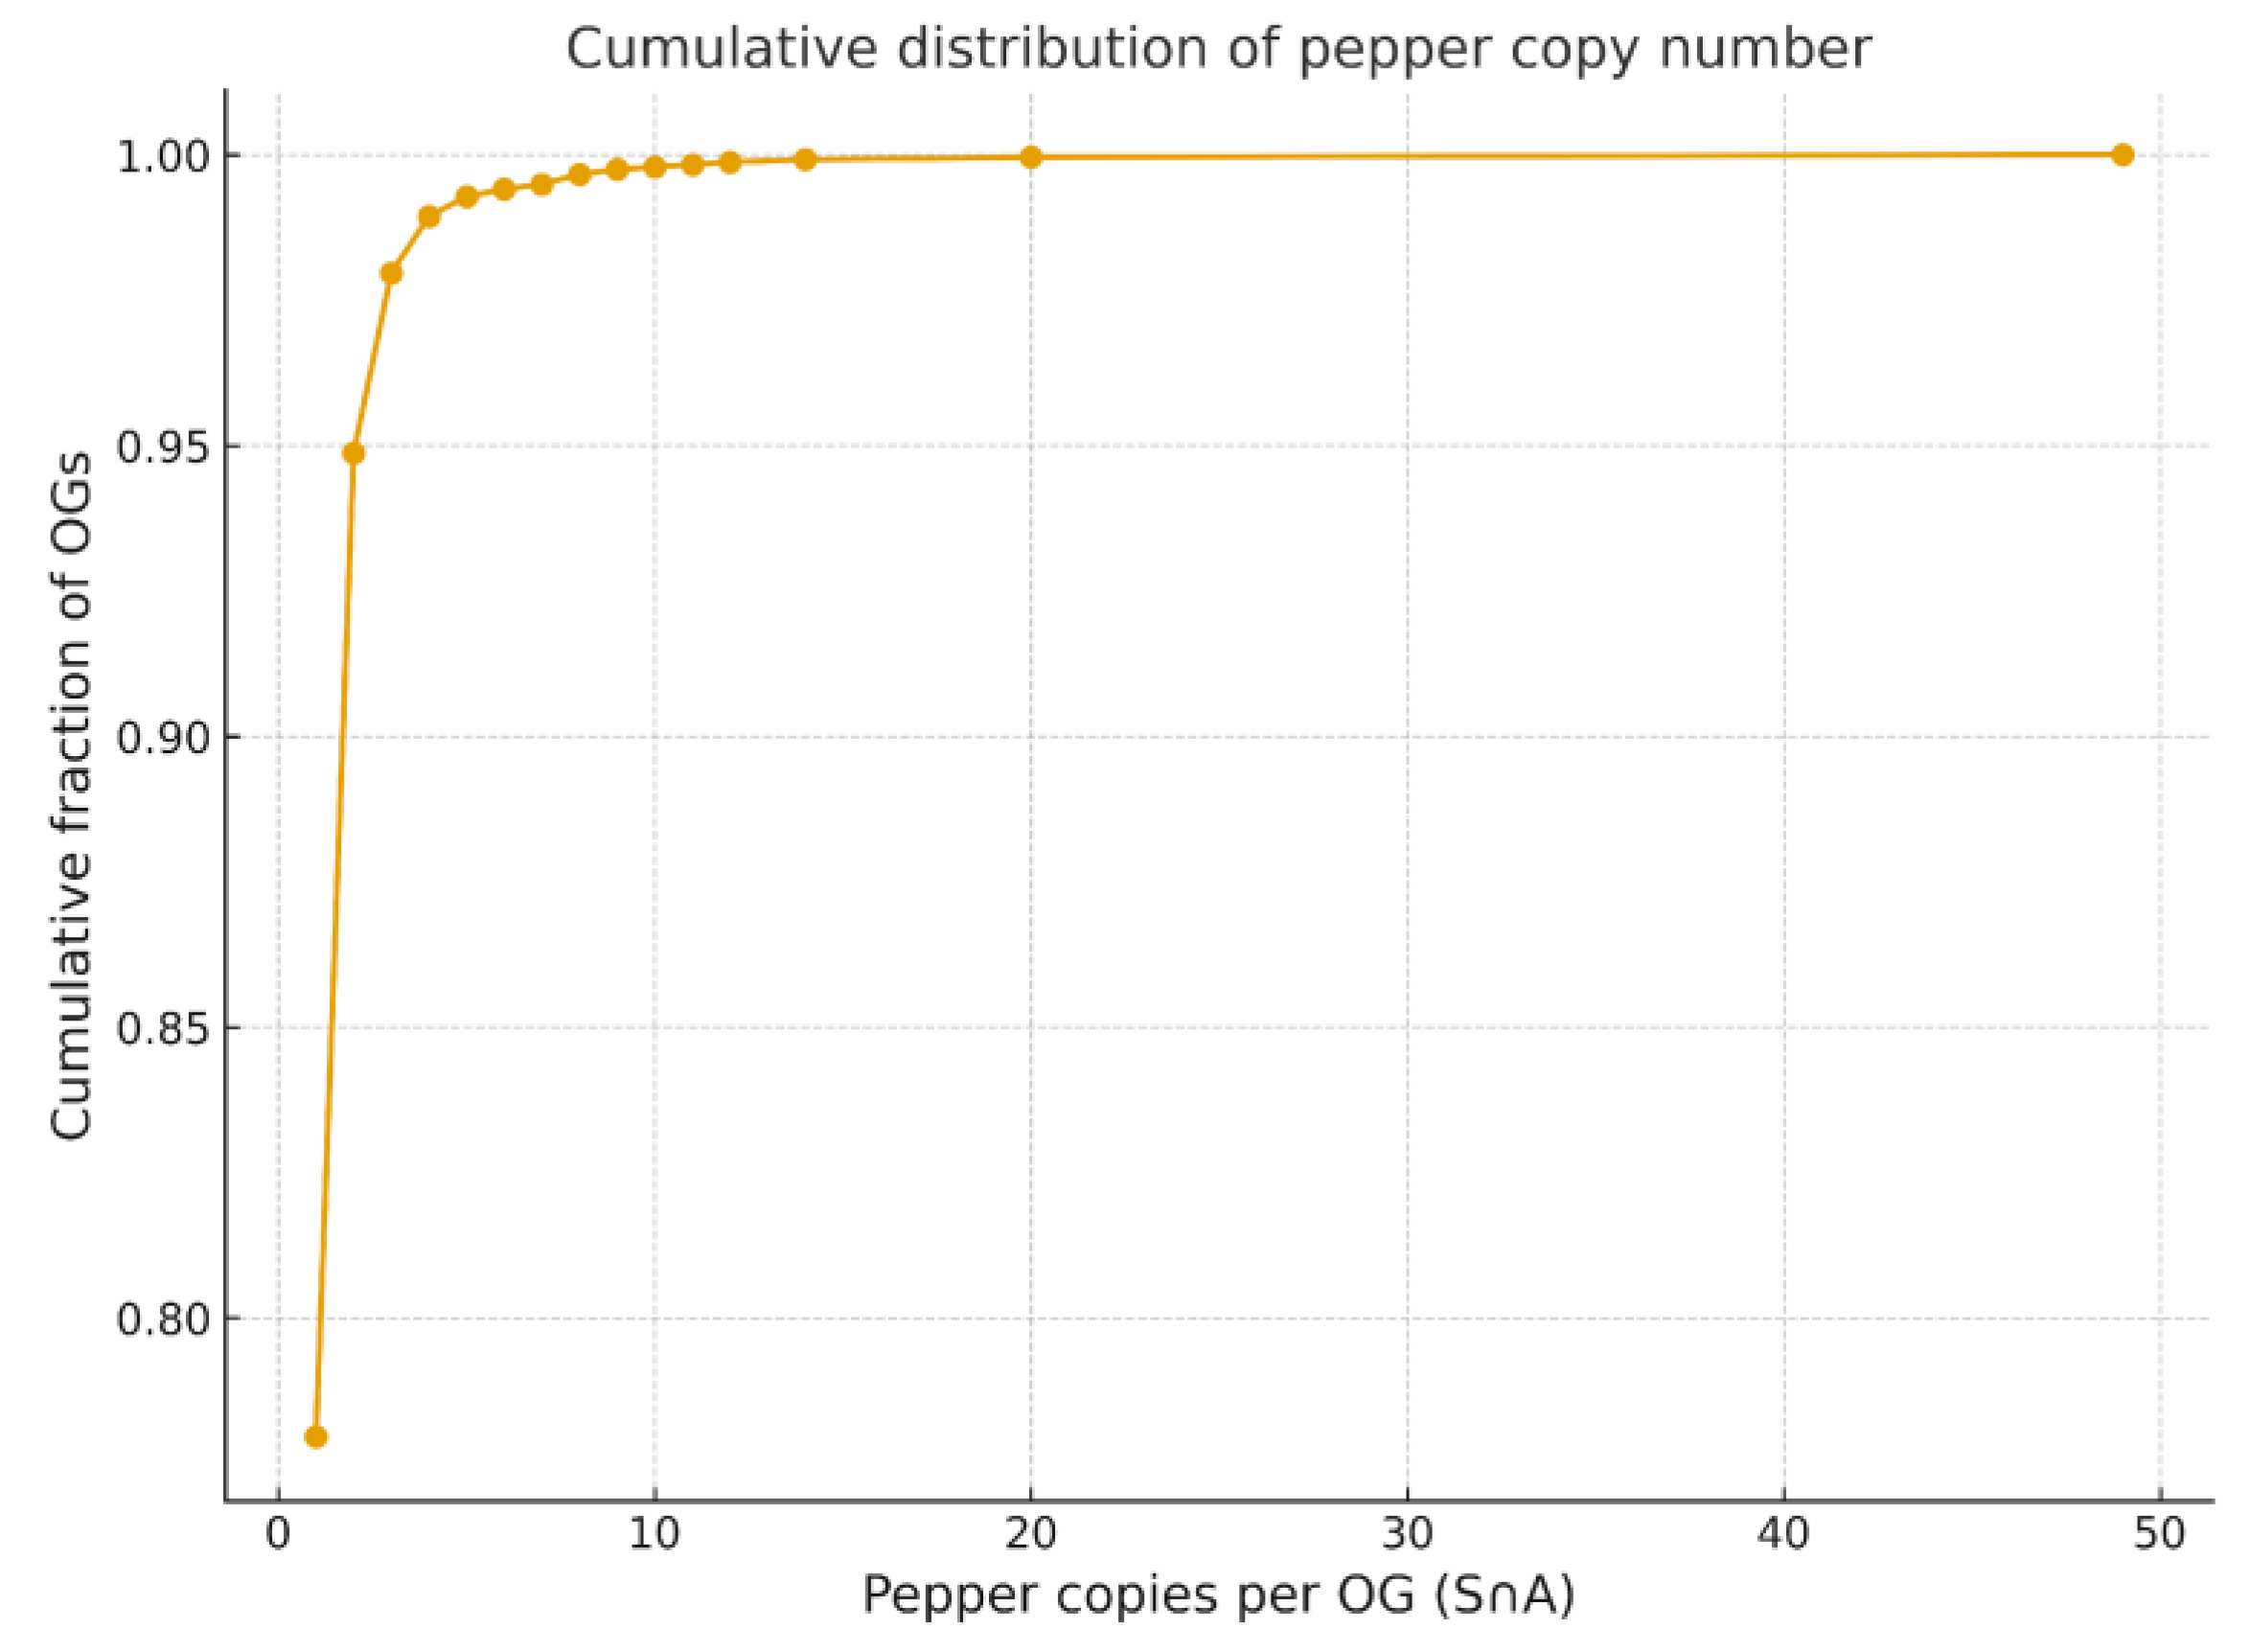
Cumulative Distribution of Gene Copy Numbers
Comparative Coverage and Conservation
Summary and Evolutionary Implications
4. Discussion
Conservation and Divergence of COSII Orthologs
Chromosomal Organization and Synteny
Evolutionary Dynamics of Gene Families
Copy Number Variation and Structural Patterns
Limitations and Future Perspectives
Evolutionary Implications and Marker Utility
Gene Family Evolution in Solanaceae
COSII orthologues as a stable genomic framework for investigating abiotic stress responses
5. Conclusions
Supplementary Materials
Author Contributions
Funding
Acknowledgments
Conflicts of Interest
Abbreviations
| HOG | Hierarchical orthogroup |
| CNV | Copy Number Variation |
References
- Knapp, S. Tobacco to tomatoes: a phylogenetic perspective on fruit diversity in the Solanaceae. Taxon 2002, 51, 45–61. https://pubmed.ncbi.nlm.nih.gov/12324525/. [CrossRef]
- Tomato Genome Consortium. The tomato genome sequence provides insights into fleshy fruit evolution. Nature 2012, 485, 635–641. https://pubmed.ncbi.nlm.nih.gov/22660326/. [CrossRef]
- Zhou, L.; Feng, T.; Xu, S.; Gao, F.; Lam, T.T.; Wang, Q.; Wu, T.; Huang, H.; Zhan, L.; Li, L. ggmsa: A visual exploration tool for multiple sequence alignment and associated data. Briefings in Bioinformatics 2022, 23, bbac222. [Google Scholar] [CrossRef]
- Rivera-Silva, R.; Chávez Montes, R.A.; Jaimes-Miranda, F. Gene ontology functional annotation datasets for the ITAG3.2 and ITAG4.0 tomato (Solanum lycopersicum) genome annotations. Data Brief. 2024, 54, 110401. [Google Scholar] [CrossRef] [PubMed] [PubMed Central]
- Hardigan, M.A.; Laimbeer, F.P.E.; Newton, L.; Crisovan, E.; Hamilton, J.P.; Vaillancourt, B.; Wiegert-Rininger, K.; Wood, J.C.; Douches, D.S.; Farré, E.M.; Veilleux, R.E.; Buell, C.R. Genome diversity of tuber-bearing Solanum uncovers complex evolutionary history and targets of domestication. Proc. Natl. Acad. Sci. USA, 2017, 114, E9999–E10008. https://pubmed.ncbi.nlm.nih.gov/29087343/. [CrossRef] [PubMed]
- Pham, G.M.; Hamilton, J.P.; Wood, J.C.; Burke, J.T.; Zhao, H.; Vaillancourt, B.; Ou, S.; Jiang, J.; Buell, C.R. Construction of a chromosome-scale long-read reference genome assembly for potato. GigaScience 2020, 9, giaa100. https://pubmed.ncbi.nlm.nih.gov/32964225/. [CrossRef] [PubMed]
- Kim, S.; Park, M.; Yeom, S.I.; Kim, Y.M.; Lee, J.M.; Lee, H.A.; Seo, E.; Choi, J.; Cheong, K.; Kim, K.T.; Jung, K.; Lee, G.W.; Oh, S.K.; Bae, C.; Kim, S.B.; Lee, H.Y.; Kim, S.Y.; Kim, M.S.; Kang, BC, Jo, Y.D.; Yang, H.B.; Jeong, H.J.; Kang, W.H.; Kwon, J.K.; Shin, C.; Lim, J.Y.; Park, J.H.; Huh, J.H.; Kim, J.S.; Kim, B.D.; Cohen, O.; Paran, I.; Suh, M.C.; Lee, S.B.; Kim, Y.K.; Shin, Y.; Noh, S.J.; Park, J.; Seo, Y.S.; Kwon, S.Y.; Kim, H.A.; Park, J.M.; Kim, H.J.; Choi, S.B.; Bosland, P.W.; Reeves, G.; Jo, S.H.; Lee, B.W.; Cho, H.T.; Choi, H.S.; Lee, M.S.; Yu, Y.; Do Choi, Y.; Park, B.S.; van Deynze, A.; Ashrafi, H.; Hill, T.; Kim, W.T.; Pai, H.S.; Ahn, H.K.; Yeam, I.; Giovannoni, J.J.; Rose, J.K.; Sørensen, I.; Lee, S.J.; Kim, R.W.; Choi, I.Y.; Choi, B.S.; Lim, J.S.; Lee, Y.H.; Choi, D. Genome sequence of Capsicum annuum reveals the dynamic genome evolution of pepper. Nat. Genet. 2014, 46, 270–278. https://pubmed.ncbi.nlm.nih.gov/24441736/.
- Hulse-Kemp, A.M.; Maheshwari, S.; Stoffel, K.; Hill, T.A.; Jaffe, D.; Williams, S.R.; Weisenfeld, N.; Ramakrishnan, S.; Kumar, V.; Shah, P. ; Schatz, MC, Church DM, Van Deynze, A. Reference-quality assemblies of pepper genomes reveal structural variation and diversification of disease-resistance genes. Genome Biol 2018, 19, 224. https://pubmed.ncbi.nlm.nih.gov/29423234/. [CrossRef]
- Ou, L.; Li, D.; Lv, J.; Chen, W.; Zhang, Z.; Li, X.; Yang, B.; Zhou, S.; Yang, S.; Li, W.; Gao, H.; Zeng, Q.; Yu, H.; Ouyang, B.; Li, F.; Liu, F.; Zheng, J.; Liu, Y.; Wang, J.; Wang, B.; Dai, X.; Ma, Y.; Zou, X. Pan-genome of cultivated pepper (Capsicum) and its use in gene presence-absence variation analyses. New Phytology 2018, 220, 360–363. [Google Scholar] [CrossRef] [PubMed]
- Peters, S.A.; Bargsten, J.W.; Szinay, D.; van de Belt, J.; Visser, R.G.; Bai, Y.; de Jong, H. Structural homology in the Solanaceae: analysis of genomic regions in support of synteny studies in tomato, potato and pepper. Plant Journal 2012, 71, 602–14. [Google Scholar] [CrossRef] [PubMed]
- Choe, J.; Kim, J.E.; Lee, B.W.; Lee, J.H.; Nam, M.; Park, Y.I.; Jo, S.H. A comparative synteny analysis tool for target-gene SNP marker discovery: connecting genomics data to breeding in Solanaceae. Database (Oxford). 2018, bay047. [Google Scholar] [CrossRef] [PubMed] [PubMed Central]
- Wei, K.; Stam, R.; Tellier, A.; Silva-Arias, G.A. Copy number variations shape genomic structural diversity underpinning ecological adaptation in the wild tomato Solanum chilense. bioRxiv 2023. [Google Scholar] [CrossRef]
- Wu, F.; Mueller, L.A.; Crouzillat, D.; Pétiard, V.; Tanksley, S.D. Combining bioinformatics and phylogenetics to identify large sets of single-copy orthologous genes (COSII) for comparative, evolutionary and systematic studies: a test case in the euasterid plant clade. Plant Physiology 2006, 141, 1186–1200. https://pmc.ncbi.nlm.nih.gov/articles/PMC1667096/. [CrossRef] [PubMed]
- Rodríguez, G.R.; Moyseenko, J.B.; Robbins, M.D.; Morejón, N.H.; Francis, D.M.; Oost, K.; van der Knaap, E. Tomato Analyzer 3.0: New tools for digital phenotyping. Plant Physiology 2009, 150, 842–853. https://pubmed.ncbi.nlm.nih.gov/20234339/. [CrossRef]
- Wu, F.; Tanksley, S.D. Chromosomal evolution in the plant family Solanaceae. BMC Genomics 2010, 11, 182. https://bmcgenomics.biomedcentral.com/articles/10.1186/1471-2164-11-182 https://pubmed.ncbi.nlm.nih.gov/20236516/. [CrossRef]
- Wu, F.; Eannetta, N.T.; Xu, Y.; Durrett, R.; Mazourek, M.; Jahn, M.M.; Tanksley, S.D. A COSII genetic map of the pepper genome provides a detailed picture of synteny with tomato and new insights into recent chromosome evolution in the genus Capsicum. Theoretical and Applied Genetics 2009, 118, 1279–1293. https://pubmed.ncbi.nlm.nih.gov/19229514/. [CrossRef]
- Lindqvist-Kreuze, H.; Gastelo, M.; Perez, W.; Forbes, G.A.; de Koeyer, D.; Bonierbale, M. Phenotypic stability and genome-wide association study of late blight resistance in potato genotypes adapted to the tropical highlands. Phytopathology 2014, 104, 624–33. [Google Scholar] [CrossRef] [PubMed]
- Lefebvre-Pautigny, F.; Wu, F.; Philippot, M.; Rigoreau, M.; Priyono, Zouine M, et al. High resolution synteny maps allowing direct comparisons between the coffee and tomato genomes. Tree Genetics & Genomes, 2010, 6, 565–577. https://link.springer.com/article/10.1007/s11295-010-0272-3. [CrossRef]
- Emms, D.M.; Kelly, S. OrthoFinder: Phylogenetic orthology inference for comparative genomics. Genome Biol, 2019, 20, 238. [Google Scholar] [CrossRef] [PubMed]
- Hosmani, P.S.; Gonzalez, M.F.; van de Geest, H.; Maumus, F.; Bakker, L.V.; Schijlen, E.; Haarst, J.; Cordewener, J.; Sanchez-Perez, G.; Peters, S.; FeI, Zh., Giovannoni, J.J.; Mueller, L.A.; Saha, S. An improved de novo assembly and annotation of the tomato reference genome using single-molecule sequencing, Hi-C proximity ligation and optical maps. bioRxiv 2019. https://www.biorxiv.org/content/10.1101/767764v1. [CrossRef]
- Mi, H.; Poudel, S.; Muruganujan, A.; Casagrande, J.T.; Thomas, P.D. PANTHER version 17: Expanded protein families and improved gene-tree inference. Nucleic Acids Res. 2016, 51, D468–D476. https://pubmed.ncbi.nlm.nih.gov/26578592/. [CrossRef]
- Camacho, C.; Coulouris, G.; Avagyan, V.; Ma, N.; Papadopoulos, J.; Bealer, K.; Madden, T.L. BLAST+: architecture and applications. BMC Bioinformatics 2009, 10, 421. https://pubmed.ncbi.nlm.nih.gov/20003500/. [CrossRef] [PubMed]
- Katoh, K.; Standley, D.M. MAFFT multiple sequence alignment software version 7: improvements in performance and usability. Molecular Biology and Evolution 2013, 30, 772–780. https://pubmed.ncbi.nlm.nih.gov/23329690/. [CrossRef] [PubMed]
- Capella-Gutiérrez, S.; Silla-Martínez, J.M.; Gabaldón, T. trimAl: a tool for automated alignment trimming in large-scale phylogenetic analyses. Bioinformatics 2009, 25, 1972–1973. https://pubmed.ncbi.nlm.nih.gov/19505945/. [CrossRef]
- Minh, B.Q.; Schmidt, H.A.; Chernomor, O.; Schrempf, D.; Woodhams, M.D.; von Haeseler, A.; Lanfear, R. IQ-TREE 2: New models and efficient methods for phylogenetic inference in the genomic era. Molecular Biology and Evolution 2020, 37, 1530–1534. https://pubmed.ncbi.nlm.nih.gov/32011700/. [CrossRef] [PubMed]
- Kalyaanamoorthy, S.; Minh, B.Q.; Wong, T.K.F.; von Haeseler, A.; Jermiin, L.S. ModelFinder: fast model selection for accurate phylogenetic estimates. Nature Methods 2017, 14, 587–589. https://pubmed.ncbi.nlm.nih.gov/28481363/. [CrossRef]
- Hoang, D.T.; Chernomor, O.; von Haeseler, A.; Minh, B.Q.; Vinh, L.S. UFBoot2: Improving the ultrafast bootstrap approximation. Molecular Biology and Evolution 2018, 35, 518–522. https://pubmed.ncbi.nlm.nih.gov/29077904/. [CrossRef]
- Sato, S.; Tabata, S.; Hirakawa, H.; Asamizu, E.; Shirasawa, K.; Isobe, S.; et al. The tomato genome sequence provides insights into fleshy fruit evolution. Nature 2012, 485, 635–641. https://pmc.ncbi.nlm.nih.gov/articles/PMC3378239/. [CrossRef]
- Krzywinski, M.; Schein, J.; Birol, I.; Connors, J.; Gascoyne, R.; Horsman, D.; Jones, S.J.; Marra, M.A. Circos: an information aesthetic for comparative genomics. Genome Research 2009, 19, 1639–1645. https://pubmed.ncbi.nlm.nih.gov/19541911/. [CrossRef]
- Letunic, I.; Bork, P. Interactive Tree Of Life (iTOL) v6: recent updates. Nucleic Acids Research 2024, 52, 78–82. https://pubmed.ncbi.nlm.nih.gov/38613393/. [CrossRef]
- Shiu, S.H.; Karlowski, W.M.; Pan, R.; Tzeng, Y.H.; Mayer, K.F.; Li, W.H. Comparative analysis of the receptor-like kinase family in Arabidopsis and rice. Plant Cell 2004, 16, 1220–1234. https://pubmed.ncbi.nlm.nih.gov/15105442/. [CrossRef] [PubMed]
- Andolfo, G.; Sanseverino, W.; Rombauts, S.; Van de Peer, Y.; Bradeen, J.M.; Carputo, D.; Frusciante, L.; Ercolano, M.R. Overview of tomato (Solanum lycopersicum) candidate pathogen recognition genes reveals important Solanum R locus dynamics. New Phytol. 2013, 197, 223–237. https://pubmed.ncbi.nlm.nih.gov/23163550/. [CrossRef]
- Andolfo, G.; Ferriello, F.; Tardella, L.; Ferrarini, A.; Sigillo, L.; Frusciante, L.; Ercolano, M.R. Evolutionary dynamics and functional specialization of plant NLR gene families. Plant Biotechnology Journal 2014, 12, 1–12. https://pubmed.ncbi.nlm.nih.gov/23163550/. [CrossRef]
- Kang, W.H.; Yeom, S.I. Genome-wide analysis of disease resistance genes in pepper (Capsicum annuum). Frontiers in Plant Science 2018, 9, 1012. [Google Scholar] [CrossRef]
- Bombarely, A.; Rosli, H.G.; Vrebalov, J.; Moffett, P.; Mueller, L.A.; Martin, G.B. A draft genome sequence of Nicotiana benthamiana to enhance molecular plant-microbe biology research. Mol Plant Microbe Interact. 2012, 25, 1523–30. [Google Scholar] [CrossRef] [PubMed]
- Fernandez-Pozo, N.; Menda, N.; Edwards, J.D.; Saha, S.; Tecle, I.Y.; Strickler, S.R.; Bombarely, A.; Fisher-York, T.; Pujar, A.; Foerster, H.; Yan, A.; Mueller, L.A. The Sol Genomics Network (SGN)—from genotype to phenotype to breeding. Nucleic Acids Research 2012, 40, D1036–D1044. https://pubmed.ncbi.nlm.nih.gov/25428362/. [CrossRef]
- Potato Genome Sequencing Consortium.; Xu, X., Pan, S., Cheng, S., Zhang, B., Mu, D., Ni, P., Zhang, G., Yang, S., Li, R., Wang, J., Orjeda, G., Guzman, F., Torres, M., Lozano, R., Ponce, O., Martinez, D., De la Cruz, G., Chakrabarti, S.K., Patil, V.U., Skryabin, K.G., Kuznetsov, B.B., Ravin, N.V., Kolganova, T.V., Beletsky, A.V., Mardanov, A.V., Di Genova, A., Bolser, D.M., Martin, D.M., Li, G., Yang, Y., Kuang, H., Hu, Q., Xiong, X., Bishop, G.J., Sagredo, B., Mejía, N., Zagorski, W., Gromadka, R., Gawor, J., Szczesny, P., Huang, S., Zhang, Z., Liang, C., He, J., Li, Y., He, Y., Xu, J., Zhang, Y., Xie, B., Du, Y., Qu, D., Bonierbale, M., Ghislain, M., Herrera Mdel, R., Giuliano, G., Pietrella, M., Perrotta, G., Facella, P., O’Brien, K., Feingold, S.E., Barreiro, L.E., Massa, G.A., Diambra, L., Whitty, B.R., Vaillancourt, B., Lin, H., Massa, A.N., Geoffroy,M., Lundback, S., DellaPenna, D., Buell, C.R., Sharma, S.K., Marshall, D.F.; Waugh, R., Bryan, G.J., Destefanis, M., Nagy, I., Milbourne, D., Thomson, S.J., Fiers, M., Jacobs, J.M., Nielsen, K.L., Sønderkær, M., Iovene, M., Torres, G.A., Jiang, J., Veilleux, R.E., Bachem, C.W., de Boer, J., Borm, T., Kloosterman, B., van Eck, H., Datema, E., Hekkert, Bt., Goverse, A., van Ham, R.C., Visser, R.G. enome sequence and analysis of the tuber crop potato. Nature 2011, 475, 189–195. https://pubmed.ncbi.nlm.nih.gov/21743474/. [CrossRef]
- Särkinen, T.; Bohs, L.; Olmstead, R.G.; Knapp, S. A phylogenetic framework for evolutionary study of the nightshades (Solanaceae): a dated 1000-tip tree. BMC Evolutionary Biology, 2013, 13, 214. https://pubmed.ncbi.nlm.nih.gov/24283922/. [CrossRef] [PubMed]
- Aflitos, S.; Schijlen, E.; de Jong, H.; de Ridder, D.; Smit, S.; Finkers, R.; Wang, J.; Zhang, G.; Li, N.; Mao, L.; Bakker, F.; Dirks, R.; Breit, T.; Gravendeel, B.; Huits, H.; Struss, D.; Swanson-Wagner, R.; van Leeuwen, H.; van Ham, R.C.; Fito, L.; Guignier, L.; Sevilla, M.; Ellul, P.; Ganko, E.; Kapur, A.; Reclus, E.; de Geus, B.; van de Geest, H.; Lintel, T.; Hekkert, B.; van Haarst, J.; Smits, L.; Koops, A.; Sanchez-Perez, G.; van Heusden, A.W.; Visser, R.; Quan, Z.; Min, J.; Liao, L.; Wang, X.; Wang, G.; Yue, Z.; Yang, X.; Xu, N.; Schranz, E.; Smets, E.; Vos, R.; Rauwerda, J.; Ursem, R.; Schuit, C.; Kerns, M.; van den Berg, J.; Vriezen, W.; Janssen, A.; Datema, E.; Jahrman, T.; Moquet, F.; Bonnet, J.; Peters, S. Exploring genetic variation in the tomato (Solanum section, Lycopersicon) clade by whole-genome sequencing. Plant Journal, 2014, 80, 136–148. https://pubmed.ncbi.nlm.nih.gov/25039268/. [CrossRef]
- Arabidopsis Genome Initiative. Analysis of the genome sequence of the flowering plant Arabidopsis thaliana. Nature 2000, 408, 796–815. https://pubmed.ncbi.nlm.nih.gov/11130711/. [CrossRef]
- Soltis, D.E.; Albert, V.A.; Leebens-Mack, J.; Bell, C.D.; Paterson, A.H.; Zheng, C.; Sankoff, D.; Depamphilis, C.W.; Wall, P.K.; Soltis, P.S. Polyploidy and angiosperm diversification. American Journal of Botany 2009, 96, 336–348. https://pubmed.ncbi.nlm.nih.gov/21628192/. [CrossRef]
- Qin, C.; Yu, C.; Shen, Y.; Fang, X.; Chen, L.; Min, J.; Cheng, J.; Zhao, S.; Xu, M.; Luo, Y.; Yang, Y.; Wu, Z.; Mao, L.; Wu, H.; Ling-Hu, C.; Zhou, H.; Lin, H.; González-Morales, S.; Trejo-Saavedra, D.L.; Tian, H.; Tang, X.; Zhao, M.; Huang, Z.; Zhou, A.; Yao, X.; Cui, J.; Li, W.; Chen, Z.; Feng, Y.; Niu, Y.; Bi, S.; Yang, X.; Li, W.; Cai, H.; Luo, X.; Montes-Hernández, S.; Leyva-González, M.A.; Xiong, Z.; He, X.; Bai, L.; Tan, S.; Tang, X.; Liu, D.; Liu, J.; Zhang, S.; Chen, M.; Zhang, L.; Zhang, L.; Zhang, Y.; Liao, W.; Zhang, Y.; Wang, M.; Lv, X.; Wen, B.; Liu, H.; Luan, H.; Zhang, Y.; Yang, S.; Wang, X.; Xu, J.; Li, X.; Li, S.; Wang, J.; Palloix, A.; Bosland, P.W.; Li, Y.; Krogh, A.; Rivera-Bustamante, R.F.; Herrera-Estrella, L.; Yin, Y.; Yu, J.; Hu, K.; Zhang, Z. Whole-genome sequencing of cultivated and wild peppers provides insights into Capsicum domestication and specialization. Proceedings of the National Academy of Sciences USA 2014, 111, 5135–5140. https://pubmed.ncbi.nlm.nih.gov/24591624/. [CrossRef]
- Fischer, I.; Diévart, A.; Droc, G.; Dufayard, J.F.; Chantret, N. Evolutionary dynamics of RLK/Pelle gene family in land plants. Genome Biology and Evolution 2016, 13, evab058. https://agritrop.cirad.fr/579776/1/579776.pdf. [CrossRef]
- Livingstone, K.D.; Lackney, V.K.; Blauth, J.R.; van Wijk, R.; Jahn, M.K. Genome mapping in Capsicum and the evolution of genome structure in the Solanaceae. Genetics 1999, 152, 1183–1202. https://pmc.ncbi.nlm.nih.gov/articles/PMC1460652/. [CrossRef]
- He, S.; Weng, D.; Zhang, Y.; Kong, Q.; Wang, K.; Jing, N.; Li, F.; Ge, Y.; Xiong, H.; Wu, L.; Xie, D.Y.; Feng, S.; Yu, X.; Wang, X.; Shu, S.; Mei, Z. A telomere-to-telomere reference genome for pepper provides insight into genome expansion and evolution. Nat. Plants, 2023, 9, 1152–1165. [Google Scholar]
- Gebhardt, C. ; The historical role of species from the Solanaceae plant family in genetic research. Theor Appl Genet. 2016, 129, 2281–2294. [Google Scholar] [CrossRef] [PubMed] [PubMed Central]
- Simko, I.; Jia, M.; Venkatesh, J.; Kang, B.C.; Weng,Y. ; Barcaccia, G.; Lanteri, S.; Bhattara, G.; Foolad, M.R. Genomics and marker-assisted improvement of vegetable crops. Critical Reviews in Plant Sciences 2021, 40, 303–365. [Google Scholar] [CrossRef]
- Wenke, T.; Seibt, K.M.; Döbel, T.; Muders, K.; Schmidt, T. Inter-SINE Amplified Polymorphism (ISAP) for rapid and robust plant genotyping. Methods Mol Biol. 2015, 1245, 183–92. [Google Scholar] [CrossRef] [PubMed]
- Seibt, K.M.; Wenke, T.; Wollrab, C.; Junghans, H.; Muders, K.; Dehmer, K.J.; Diekmann, K.; Schmidt, T. Development and application of SINE-based markers for genotyping of potato varieties. Theor Appl Genet. 2012, 125, 185–96. [Google Scholar] [CrossRef] [PubMed]
- Seibt, K.M.; Wenke, T.; Muders, K.; Truberg, B.; Schmidt, T. Short interspersed nuclear elements (SINEs) are abundant in Solanaceae and have a family-specific impact on gene structure and genome organization. Plant J. 2016, 86, 268–85. [Google Scholar] [CrossRef] [PubMed]
- Denna, R.; Barboza, G.E.; Bohs, L.; Dodsworth, S.; Gagnon, E.; Giacomin, L.L.; Knapp, S.; Orejuela, A.; Poczai, P.; Smith, S.D.; Olmstead, R.G. A new phylogeny and phylogenetic classification for Solanaceae. bioRxiv preprint 2025. https://www.biorxiv.org/content/10.1101/2025.07.10.663745v1. [CrossRef]
Disclaimer/Publisher’s Note: The statements, opinions and data contained in all publications are solely those of the individual author(s) and contributor(s) and not of MDPI and/or the editor(s). MDPI and/or the editor(s) disclaim responsibility for any injury to people or property resulting from any ideas, methods, instructions or products referred to in the content. |
© 2025 by the authors. Licensee MDPI, Basel, Switzerland. This article is an open access article distributed under the terms and conditions of the Creative Commons Attribution (CC BY) license (http://creativecommons.org/licenses/by/4.0/).


