Preprint
Article

This version is not peer-reviewed.

Analysis of Photosynthetic Parameters, Yield, and Quality Correlations in Herbicide-Tolerant Transgenic Hybrid Cotton

  † These authors contributed equally to this work.

Submitted:

28 November 2025

Posted:

28 November 2025

You are already at the latest version

Abstract

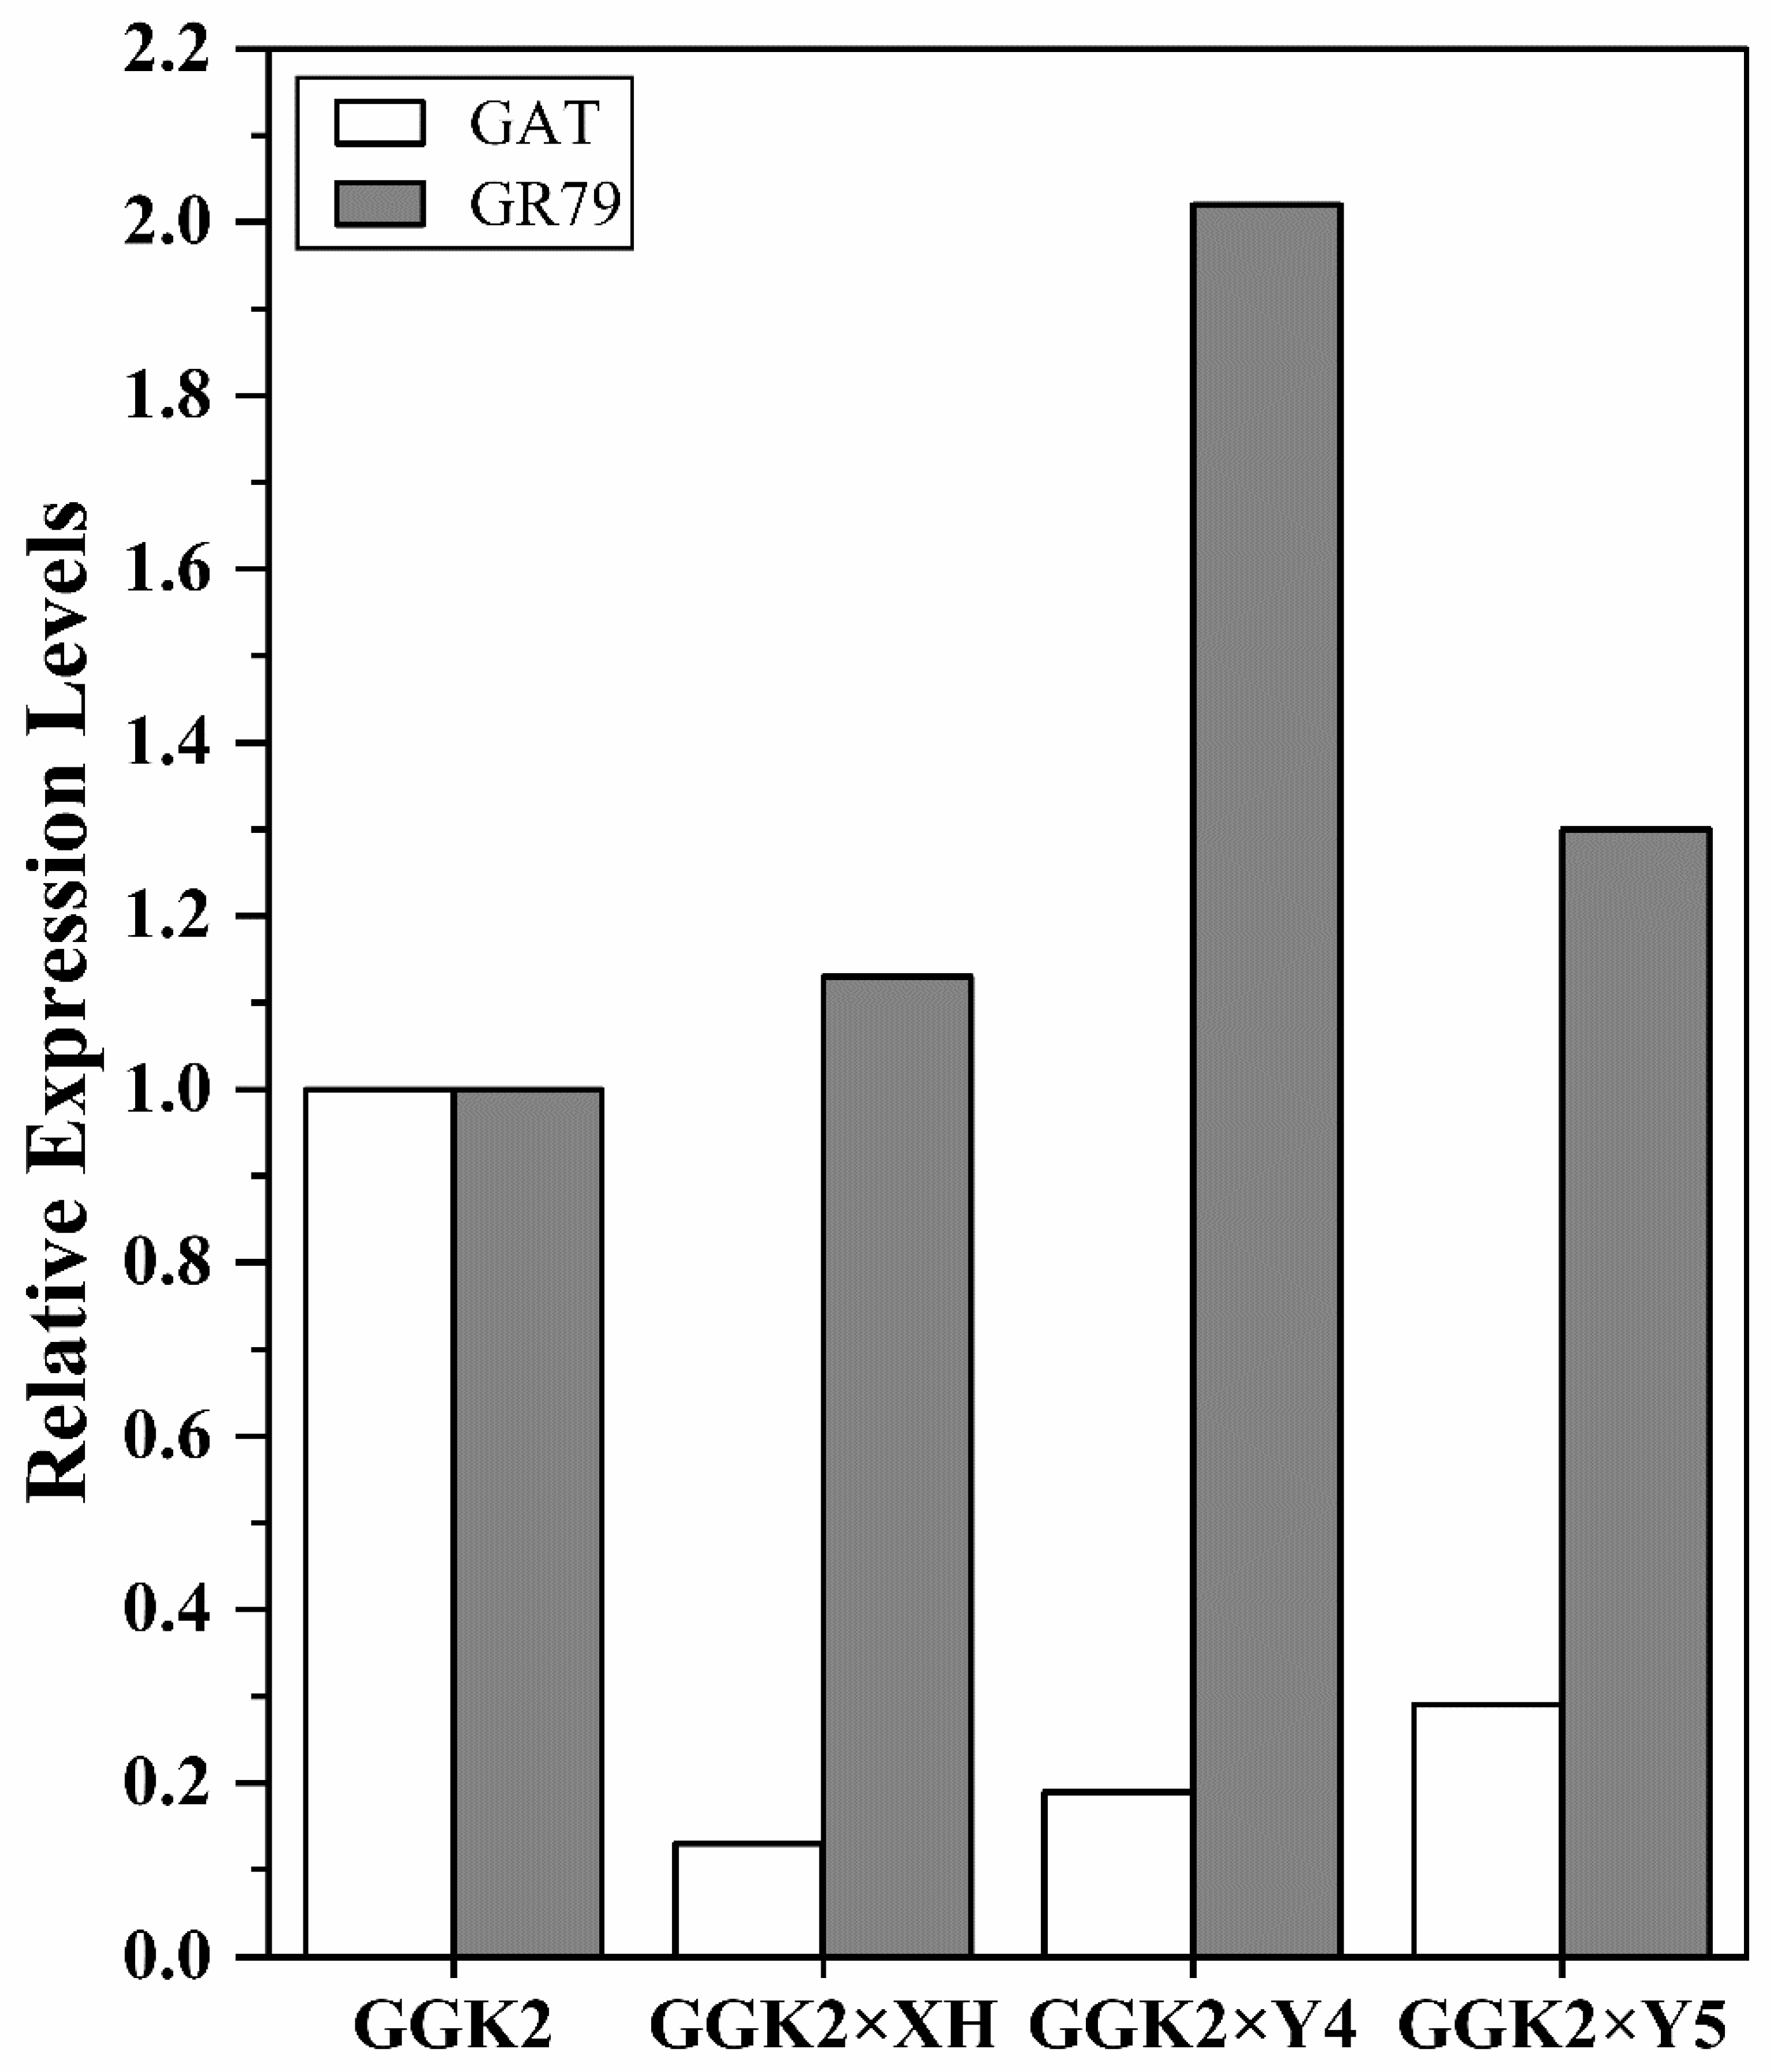
Weed stress remains a major limiting factor in cotton production, and glyphosate-tolerant varieties provide an effective solution for chemical weed control. However, achieving a balance between herbicide tolerance and agronomic physiological traits remains challenging. In this study, three hybrid combinations were generated by crossing a glyphosate-tolerant cotton line (GGK2) with conventional elite lines and were comprehensively evaluated. Gene expression analysis revealed that the classical detoxification gene GAT was significantly downregulated in all hybrid combinations, whereas the expression of GR-79, a gene associated with glutathione metabolism and oxidative stress response, was markedly elevated, particularly in the GGK2 × Y4 combination. This differential expression pattern suggests that GR-79 may compensate for the reduced function of GAT by conferring oxidative protection under herbicide stress. Physiological determination indicated that hybrid combinations with enhanced GR-79 expression, especially GGK2 × Y5, exhibited superior photosynthetic pigment composition and photosystem II (PSII) efficiency, validating the role of GR-79 in maintaining photosynthetic stability. Agronomic trait assessment demonstrated that GGK2 × Y4 achieved significant biomass accumulation and yield improvement through heterosis, although fiber quality improvement was limited. This study effectively enhanced the herbicide resistance of conventional cotton through crossbreeding and revealed that the interaction between GR-79 and GAT can improve cotton tolerance to herbicides, thereby providing a breeding strategy for developing cotton varieties with both herbicide tolerance and superior agronomic traits.

Keywords: 
;  ;  ;  ;  ;  ;  ;  

1. Introduction

Weed infestation in agricultural fields represents one of the primary factors contributing to crop yield reduction. Traditional manual weeding methods are not only labor-intensive and inefficient but also increasingly incompatible with the large-scale, mechanized operations characteristic of modern agriculture [1,2,3]. The extensive application of herbicides has significantly suppressed weed growth and improved crop management efficiency; however, it has also exerted certain adverse effects on crop growth and development [4]. Since 1996, genetically modified (GM) crops with glyphosate resistance have been successively developed, including glyphosate-resistant soybean and rapeseed (1996), cotton (1997), maize (1998), and sugar beet (1999) [5,6]. Herbicide-tolerant crops account for more than 94% of the 180 million hectares of GM crops cultivated globally each year, with glyphosate-resistant soybean, maize, cotton, rapeseed, and sugar beet collectively occupying approximately 80% of the total planted area [7]. The widespread adoption of herbicide-resistant GM crops has substantially reduced the frequency and overall volume of herbicide applications worldwide, while simultaneously lowering labor costs associated with manual weeding in agricultural production [3]. Nevertheless, this has also led to a significant decline in weed species diversity within agroecosystems, intensified reliance on single herbicides such as glyphosate, and increased the potential risk of herbicide-resistant weed evolution [8].
Upland cotton (Gossypium hirsutum L.) is one of the most economically important crops globally, valued for its fiber and oil. In recent years, however, global cotton cultivation area has exhibited a declining trend due to multiple factors, including rising production costs, natural resource constraints, and threats from pests and diseases [9,10,11,12] According to FAO statistics, the cultivation areas in China, India, the United States, and Brazil—the four leading cotton-producing countries—were 3,250.00, 1,347.70, 3,348.61, and 1,633.42 thousand hectares in 2020, with corresponding yields of 5,511.10, 1,315.70, 2,748.80, and 4,329.30 thousand metric tons, respectively. By 2022, the cultivation areas in China, India, and the United States had decreased by 7.69%, 8.20%, and 10.08% year-on-year, respectively. Although slight yield increases were observed in some countries (e.g., China: +9.61%; United States: +2.31%), an overall fluctuating downward trend has been evident. In the context of the increasingly prominent global imbalance between cotton supply and demand, reliance solely on conventional breeding methods is insufficient to meet the demand for high-quality, high-yield raw materials required by the modern textile industry. Therefore, accelerating the development of new cotton varieties with high yield, superior quality, and stress resistance has become particularly urgent.
Among various breeding strategies, heterosis represents one of the effective approaches for enhancing crop yield and stress tolerance. Studies have shown that F₁ hybrid varieties of crops generally achieve approximately a 20% increase in yield, while the F₂ generation can still maintain an advantage exceeding 10% [13]. Furthermore, hybrid lines across multiple generations exhibit favorable genetic stability in terms of adaptability, biomass accumulation, and yield performance. However, the utilization of heterosis remains significantly constrained due to the strong randomness in cross-combination screening, prolonged breeding cycles, and high costs associated with hybrid breeding. The rapid advancement of molecular breeding technologies, particularly transgenic technology and gene editing, has opened new avenues for improving stress tolerance and enabling precision breeding in cotton [14,15,16,17]. Previous studies have confirmed that transgenic cotton varieties carrying insect-resistant, drought-tolerant, or herbicide-tolerant genes demonstrate satisfactory performance in expression efficiency, environmental adaptability, and yield stability [18,19,20,21] Nevertheless, limitations such as current transformation efficiency, stability of target site expression, and screening of functional genotypes continue to pose substantial obstacles to cotton breeding progress in China [22,23,24].
In summary, by utilizing glyphosate-tolerant transgenic cotton as the male parent and crossing it with conventional female parents possessing favorable yield and quality traits, it is possible to fully exploit heterosis for the development of high-yielding, high-quality, and glyphosate-resistant cotton varieties. A systematic comparison of these hybrid combinations in terms of herbicide resistance, field performance, photosynthetic capacity, yield components, and quality traits will provide a theoretical foundation and material resources for future commercial breeding of stress-tolerant transgenic cotton.

2. Results

2.1. Differential Expression of GAT and GR-79 in Cotton Male Parents and Hybrids

Table 1. Primer involved in the experiment for RT-PCR.
Primer name Primer 5’→3’
RT GAT-F AAGCAAGGAGGAGTGGTTGC
RT GAT-R TCTTGCCTCCGATGAACTTG
RT GR-79-F TGATGGAGACCATGAGAGTG
RT GR-79-R CTCCAGGAAGTTGTCTGGTG
UBQ-F AGAGGTCGAGTCTTCGGACACC
UBQ-R TGCTTGATCTTCTTGGGCTTGG
Figure 1. Elative expression levels of the GAT and GR-79 genes in the paternal and hybrid lines.
Preprints 187249 g001
To investigate the factors underlying the differences in herbicide tolerance among the hybrid lines, the relative expression levels of herbicide-related genes in the hybrids were analyzed. The data revealed that, compared to GGK2, the expression of the GAT gene was downregulated in the hybrids, with reductions of 87%, 81%, and 71% in GGK2×XH, GGK2×Y4, and GGK2×Y5, respectively. In contrast, the expression of GR-79 was upregulated relative to GGK2, with increases of 13%, 102%, and 30%, respectively.

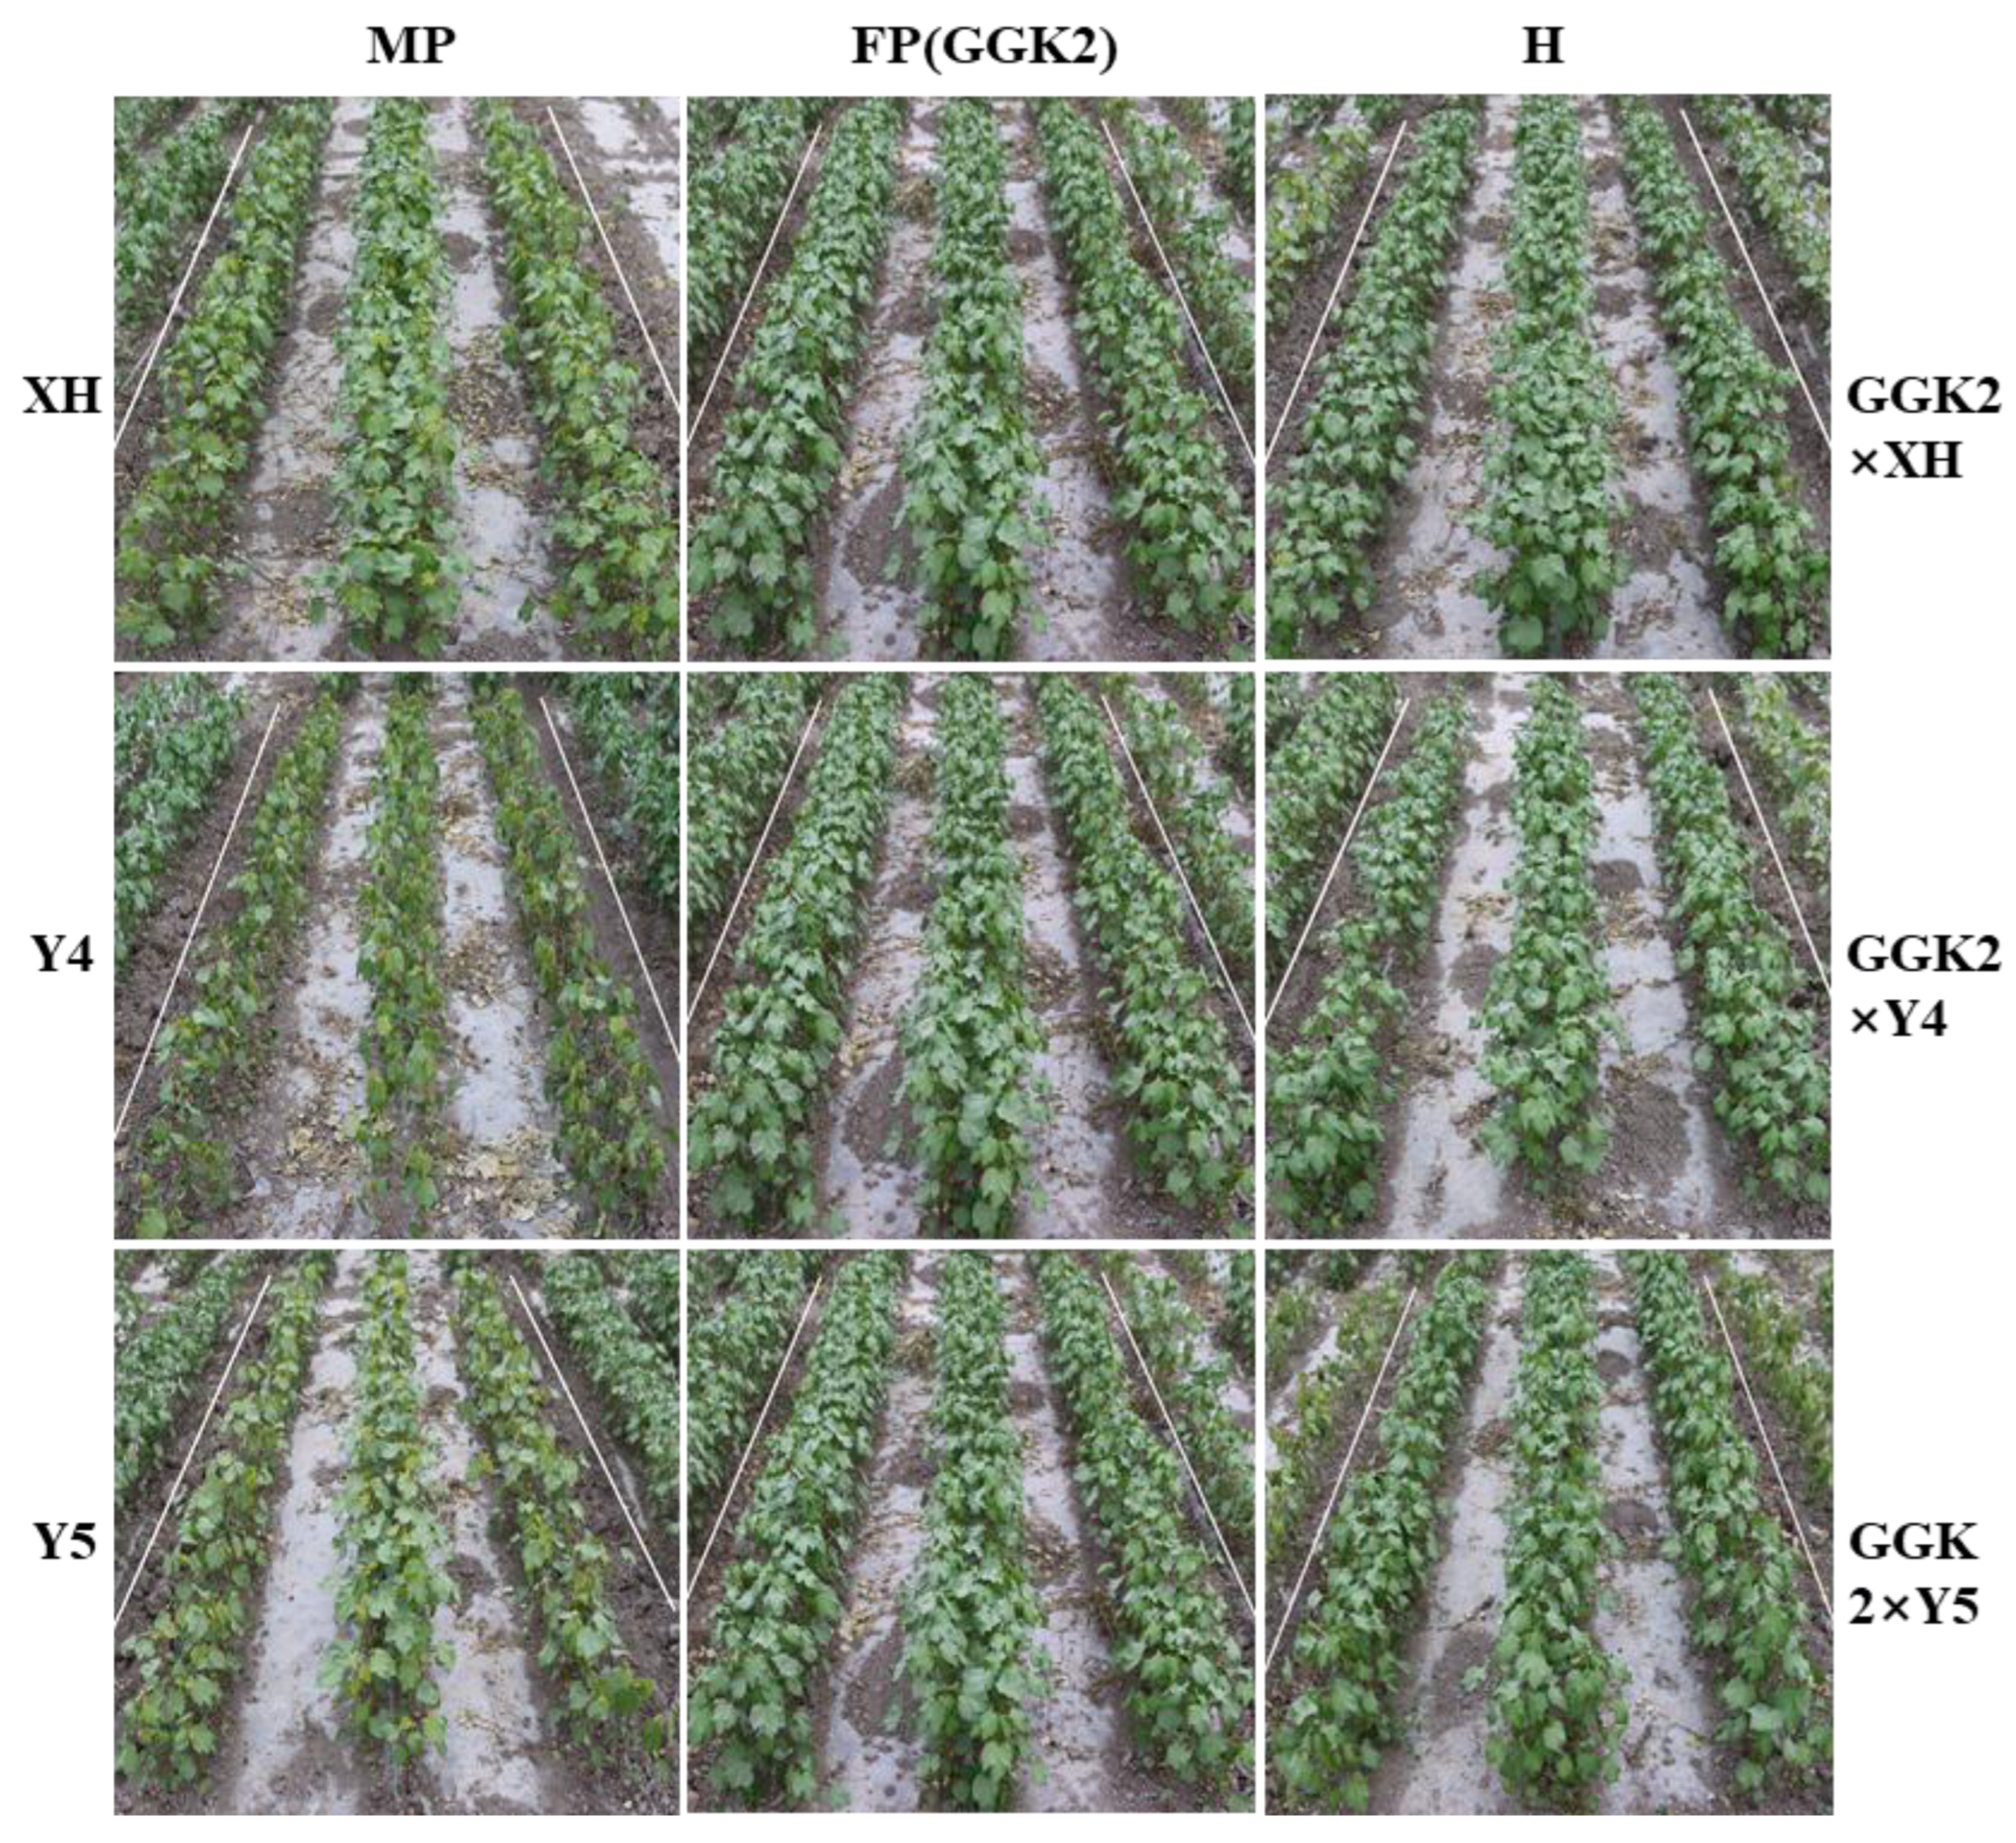
2.2. Phenotypic Responses of Parental and Hybrid Cotton Lines Under Herbicide Stress

Figure 2. Cotton seedling performance under 0.5% herbicide treatment. MP, FP (GGK2), and H denote the maternal parents (XH, Y4, and Y5), paternal parent (GGK2), and hybrid lines (GGK2×XH, GGK2×Y4, and GGK2×Y5), respectively.
Preprints 187249 g002

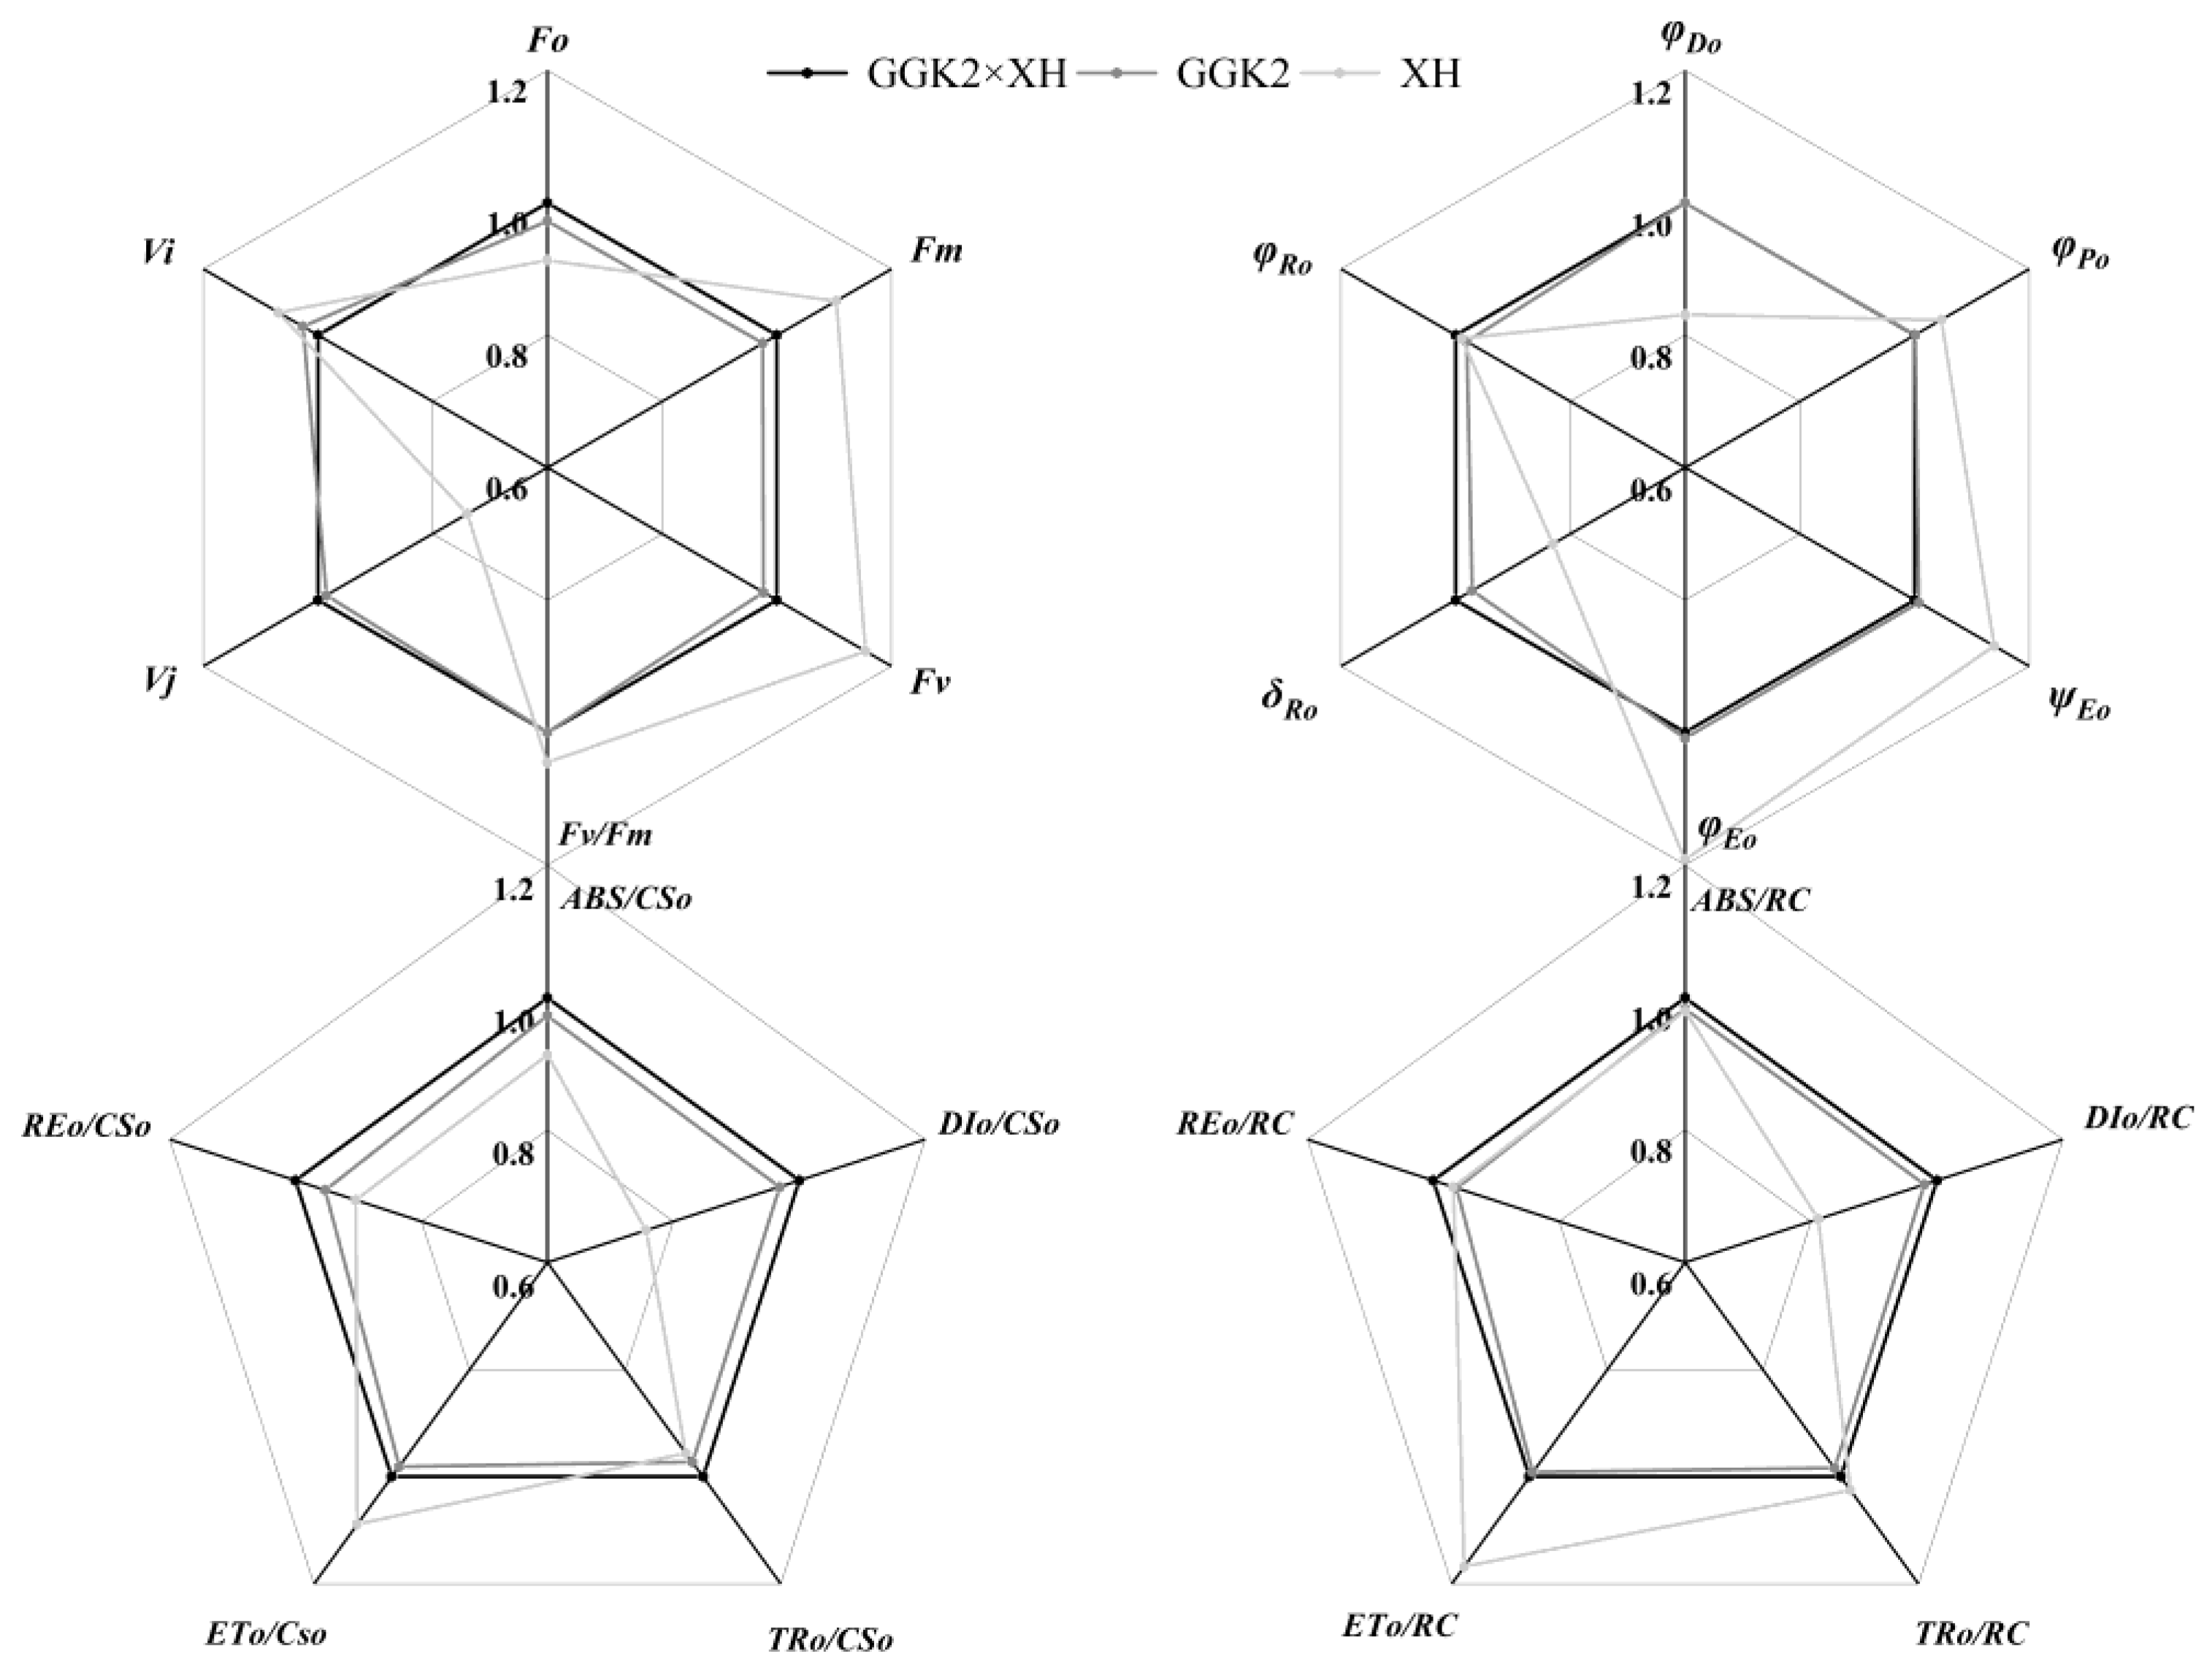
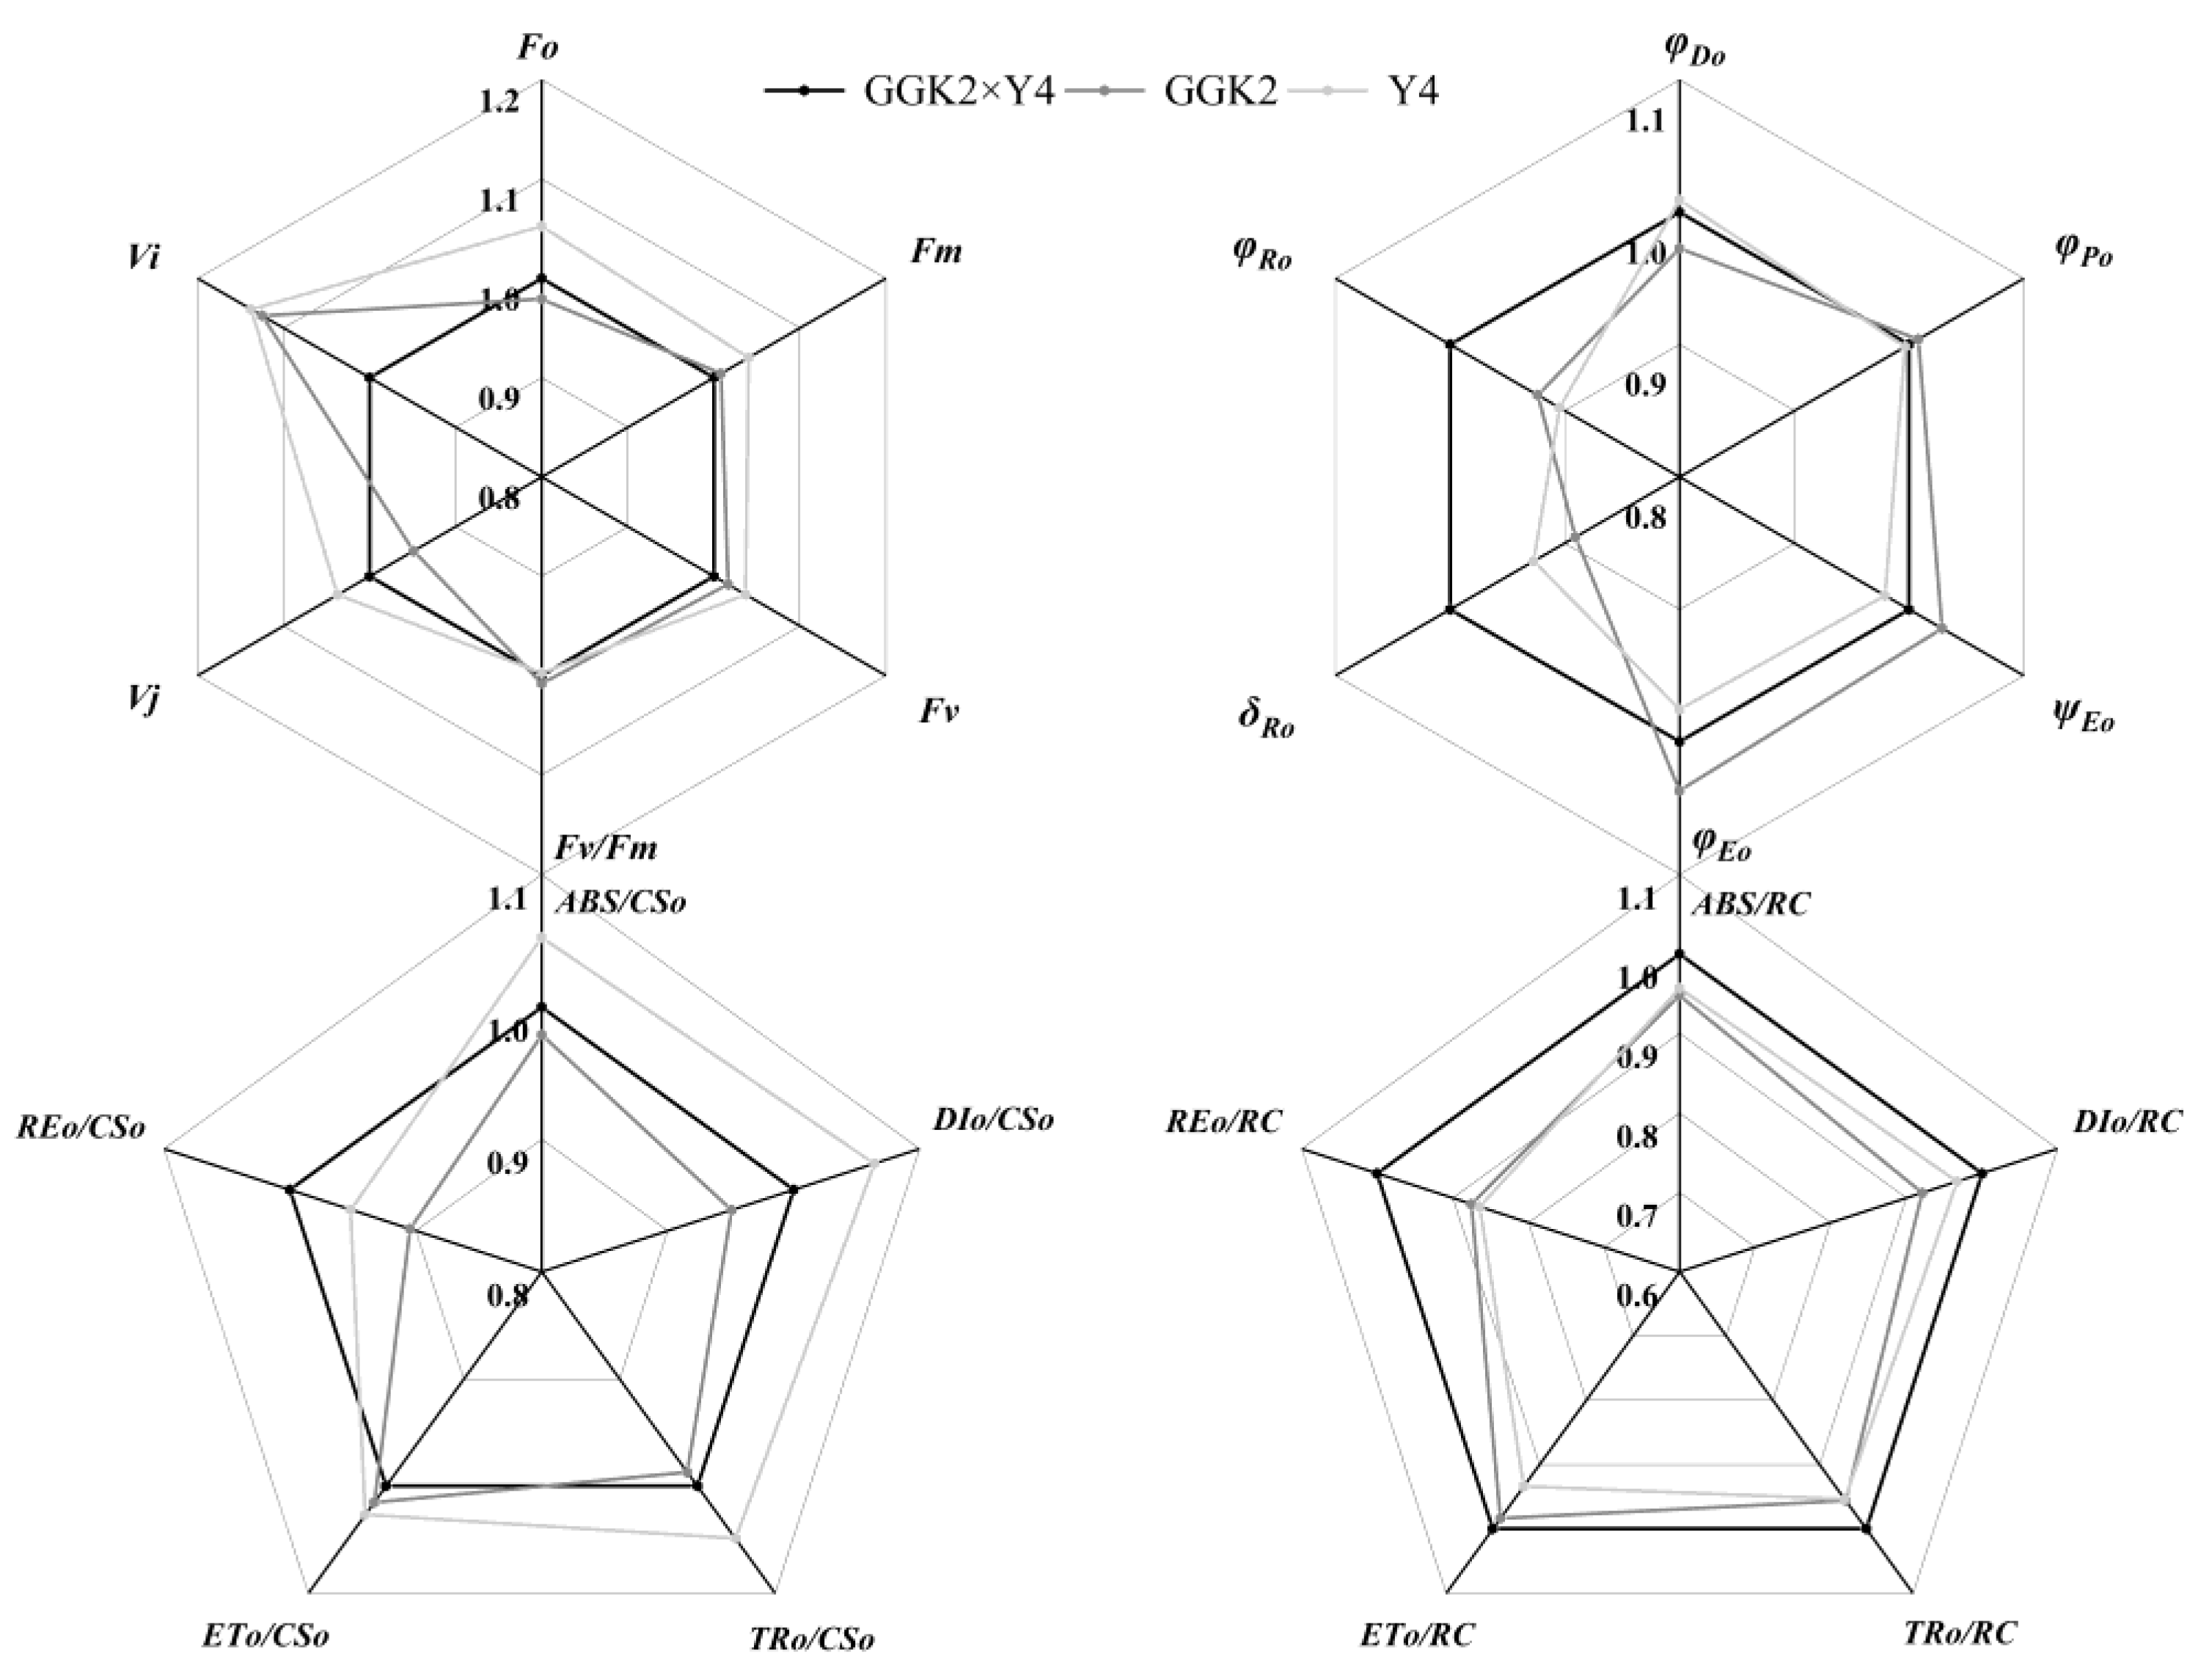
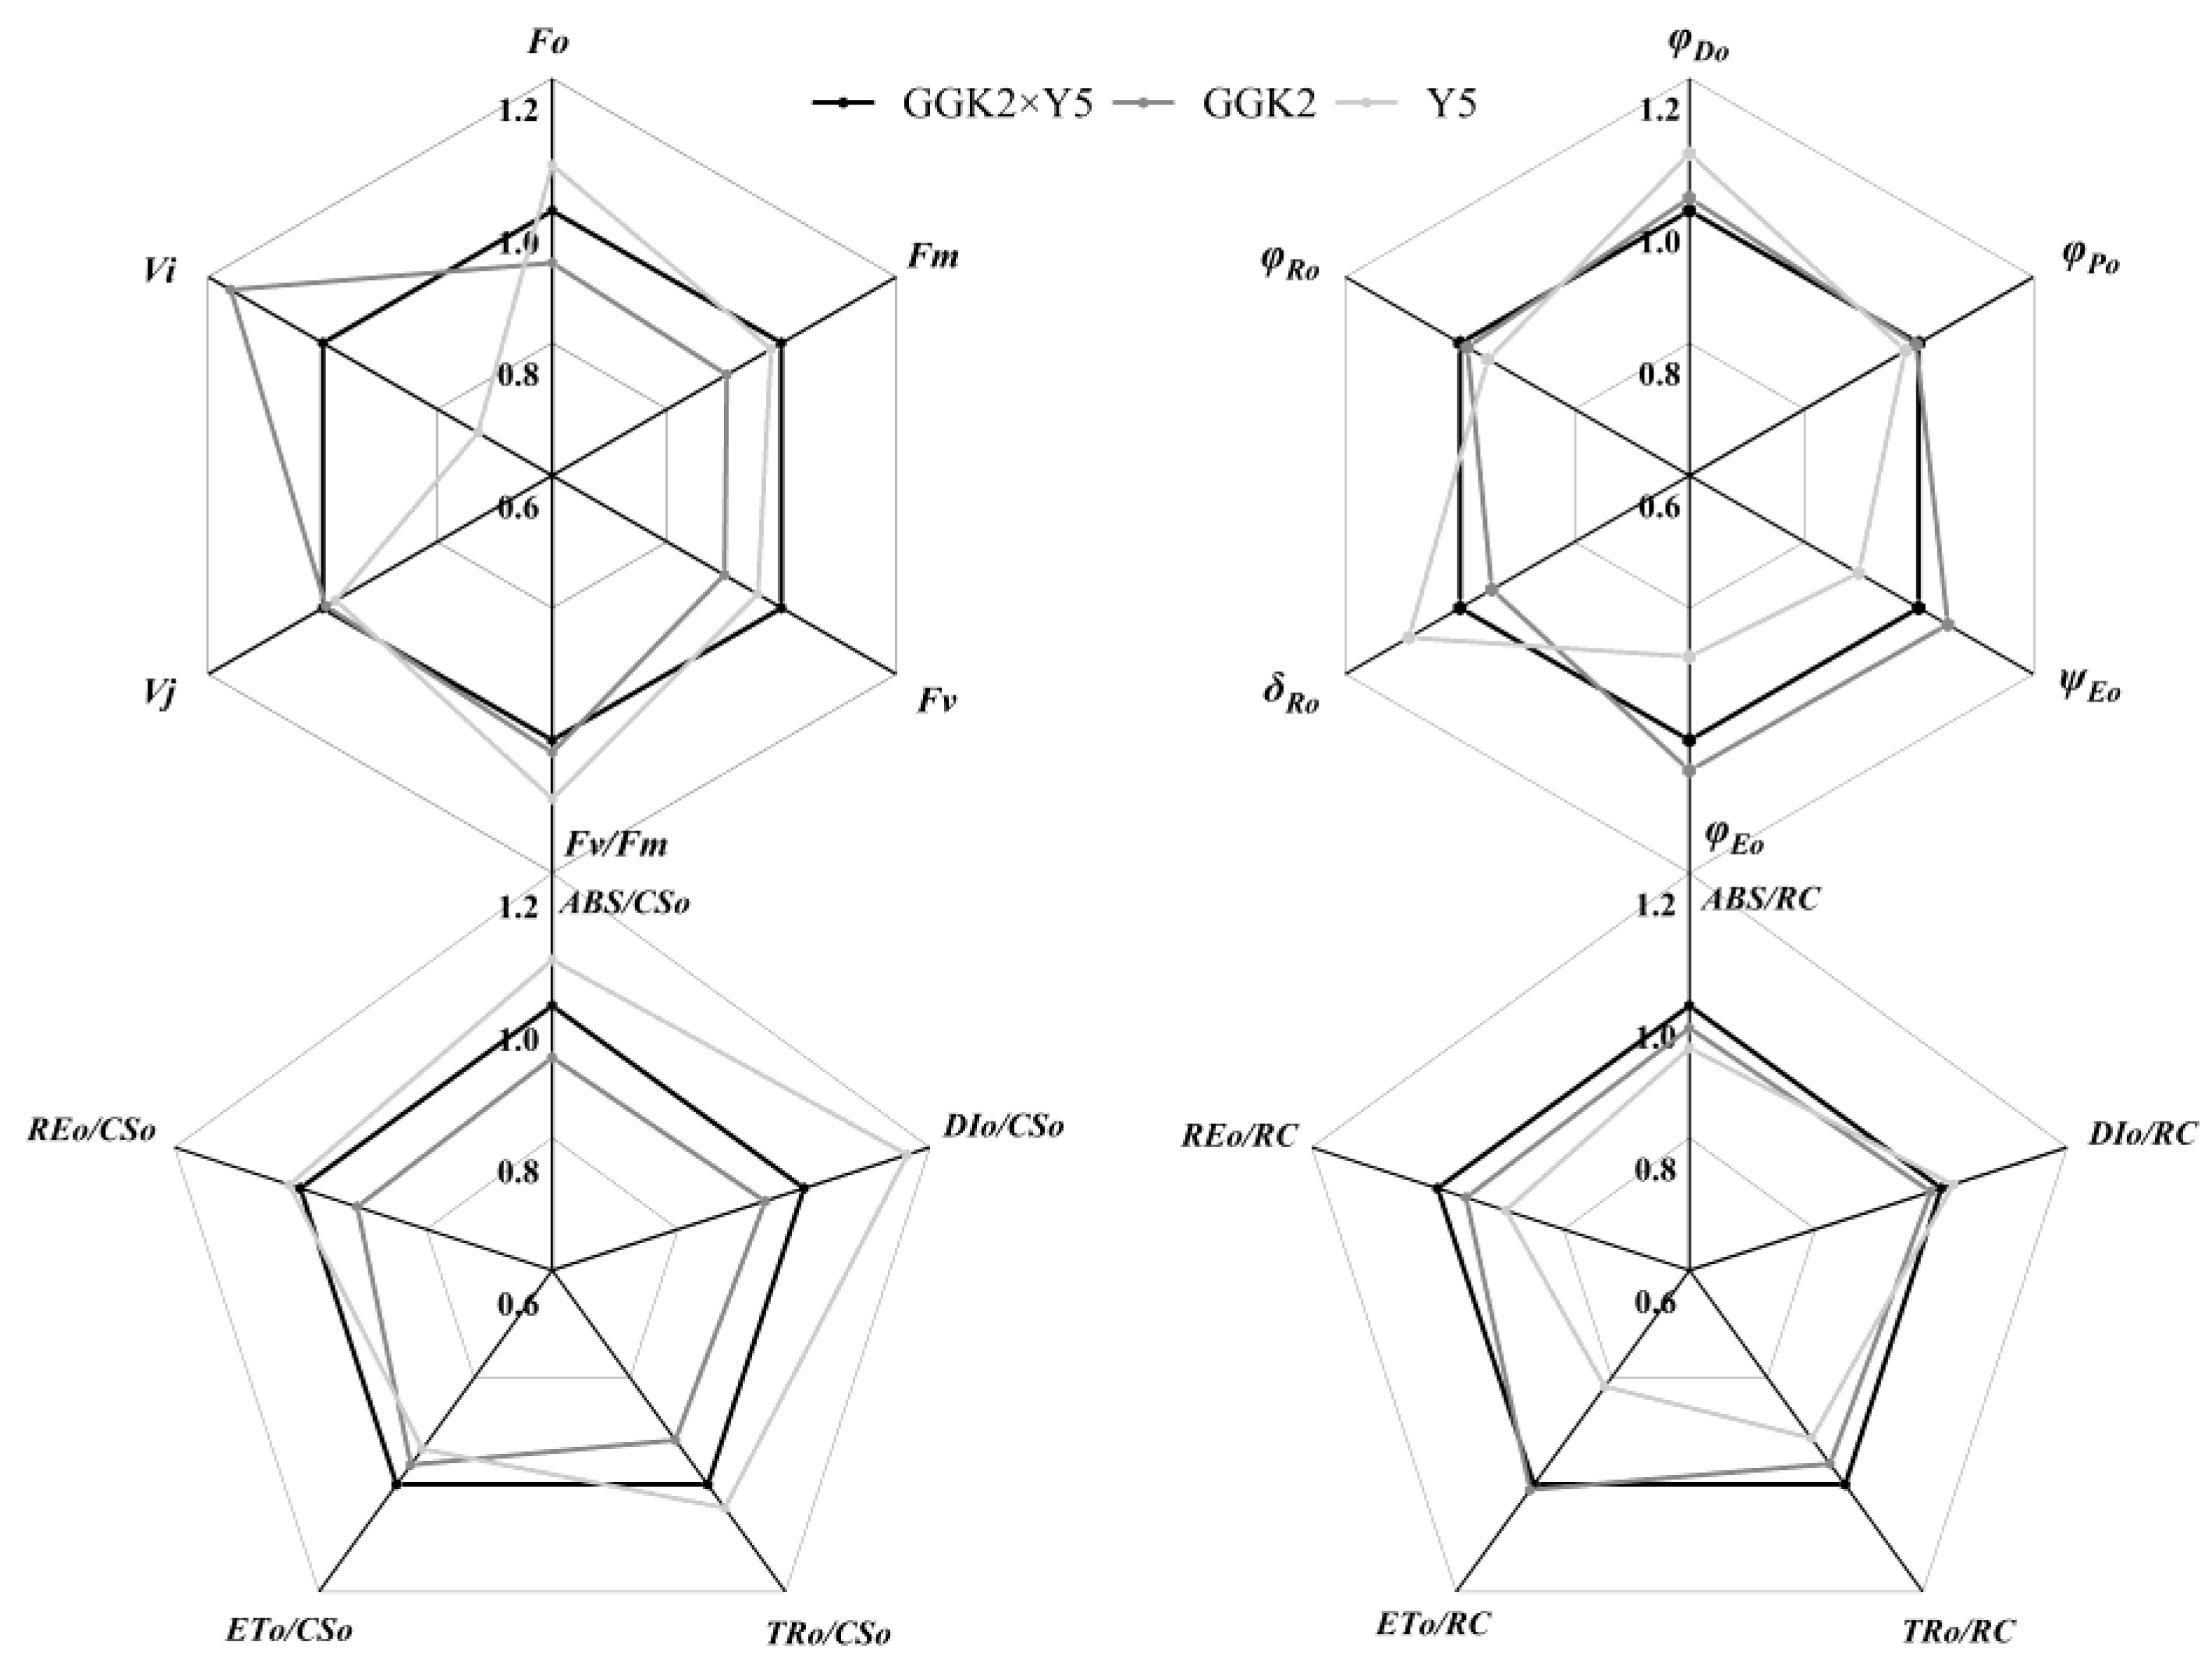
2.2. Study on Photosynthetic Pigment Accumulation and PSII Performance in Herbicide-Resistant Cotton Hybrids

To determine whether herbicide tolerance genes introduced through hybridization affect pigment accumulation in cotton varieties, the contents of chlorophyll and carotenoids were measured in various germplasms during the boll-forming stage. As shown in Table 2, a significant difference in chlorophyll a content was observed only in the germplasm GGK2×Y5, while pigment contents in other germplasms were largely unaffected by the GAT and GR-79 genes. However, in terms of heterosis, the hybrid germplasm GGK2×Y5 exhibited relatively high MPH and SPH values for pigment traits. Specifically, MPH values of 28.08%, 14.09%, 24.84%, 12.51%, and 22.39% were observed for Chla, Chlb, ChlT, Chl a/b, and Car, respectively, while the corresponding SPH values were 17.34%, 2.49%, 13.86%, 9.86%, and 15.18%. Similarly, for the Chl a/b ratio, GGK2×XH, GGK2×Y4, and GGK2×Y5 showed MPH and SPH values of 11.32% and 9.36%, 0.15% and –0.61%, and 12.51% and 9.86%, respectively.
Table 2. The Chlorophyll content of each strain at boll stage.
Plant lines Chl a Chl b Car Chl T Chl a/b
GGK2 1.05±0.11a 0.32±0.04a 0.05±0.01a 1.36±0.15a 3.26±0.05b
XH 1.04±0.10a 0.32±0.04a 0.05±0.01a 1.35±0.14a 3.14±0.12b
GGK2×XH 0.99±0.07a 0.30±0.03a 0.05±0.01a 1.30±0.10a 3.56±0.15a
MPH -4.76% -4.62% -5.21% -4.72% 11.32%
SPH -5.07% -5.30% -7.84% -5.12% 9.36%
GGK2 1.05±0.11a 0.32±0.04a 0.05±0.01a 1.36±0.15a 3.26±0.05a
Y4 1.09±0.12a 0.35±0.06a 0.04±0.01a 1.44±0.18a 3.31±0.11a
GGK2×Y4 0.99±0.01a 0.28±0.01a 0.05±0.01a 1.26±0.013a 3.29±0.12a
MPH -7.82% -17.74% 8.32% -10.19% 0.15%
SPH -9.80% -21.35% 3.04% -12.61% -0.61%
GGK2 1.05±0.11ab 0.32±0.05a 0.049±0.01a 1.36±0.15a 3.26±0.05b
Y5 0.87±0.05b 0.26±0.020a 0.06±0.01a 1.13±0.07a 3.41±0.10ab
GGK2×Y5 1.23±0.09a 0.33±0.03a 0.06±0.01a 1.56±0.12a 3.75±0.12a
MPH 28.08% 14.09% 22.39% 24.84% 12.51%
SPH 17.34% 2.49% 15.18% 13.86% 9.86%
Note: The abbreviations Chla, Chlb, ChlT, Chl a/b, and Car represent chlorophyll a content, chlorophyll b content, total chlorophyll content, chlorophyll a/b ratio, and carotenoid content, respectively. The letters a, b, and c indicate significance at the 5% probability level. MPH denotes mid-parent heterosis, calculated as MPH = (trait value of hybrid - mean trait value of parents) / mean trait value of parents × 100%; SPH denotes super-parent heterosis, calculated as SPH = (trait value of hybrid - trait value of better parent) / trait value of better parent × 100%. A value greater than 0 indicates positive heterosis, while a value less than 0 indicates negative heterosis.
Figure 3 presents the relative values of chlorophyll fluorescence kinetic parameters for GGK2×XH and its parents. It was observed that the chlorophyll fluorescence kinetic parameters of GGK2×XH were relatively similar to those of the paternal parent GGK2, with nearly all parameter values being higher in GGK2×XH than in GGK2. However, significant differences were noted compared to the maternal parent XH. For instance, in terms of quantum efficiencies or flux ratios, φPo, ψEo, and φEo were significantly higher in XH than in GGK2×XH. Additionally, the initial light absorption per cross-section (ETo/CSo) and per reaction center (ETo/RC) were markedly higher in XH compared to GGK2×XH. Conversely, other parameters of GGK2×XH—namely φDo, δRo, ABS/CSo, DIo/CSo, TRo/CSo, REo/CSo, ABS/RC, TRo/RC, REo/RC, and DIo/RC—were all higher than those of the maternal parent XH.
Figure 3. Relative differences in chlorophyll fluorescence kinetic parameters between GGK2×XH and its parents.
Preprints 187249 g003
As illustrated in Figure 4, the differences between GGK2×Y4 and its parents are primarily manifested in the quantum efficiencies or flux ratios and the initial apparent quantum flux per unit light-exposed cross-sectional area. Specifically, φRo, δRo, and REo/CSo of GGK2×Y4 were significantly higher than those of its parents. In contrast, the maternal parent Y4 exhibited higher values for ABS/CSo, DIo/CSo, and TRo/CSo compared to GGK2×Y4. Notably, all Structural Indicators & Fluxes parameters—namely ABS/RC, TRo/RC, ETo/RC, REo/RC, and DIo/RC—were higher in GGK2×Y4 than in its parents. Additionally, the paternal parent GGK2 demonstrated higher ψEo and φEo values than the hybrid line.
Figure 4. Elative Differences in Chlorophyll Fluorescence Kinetic Parameters between GGK2×Y4 and Its Parents.
Preprints 187249 g004
As shown in Figure 5, differences in chlorophyll fluorescence kinetics were primarily observed between the maternal parent and GGK2×Y5. The values of φDo, δRo, ABS/CSo, DIo/CSo, and TRo/CSo in the maternal parent were significantly higher than those in GGK2×Y5, whereas ψEo, φEo, ABS/RC, TRo/RC, ETo/RC, and REo/RC were lower than those in GGK2×Y5. The chlorophyll fluorescence kinetic parameters of the paternal parent GGK2 were nearly identical to those of GGK2×Y5.
Figure 5. Relative differences in chlorophyll fluorescence kinetic parameters between GGK2×Y5 and its parents.
Preprints 187249 g005

2.3. Analysis of Biomass Distribution, Yield Performance, and Fiber Quality in Three Cotton Hybrid Combinations

To further understand the heterosis of the hybrid germplasms, the fresh weight and dry weight of each germplasm were measured. As shown in Table 2, among the three hybrid germplasms, only GGK2 × Y4 exhibited high heterosis for fresh weight across various tissues. It demonstrated MPH values of 51.07%, 41.07%, 43.18%, 125.16%, and 32.05%, and SPH values of 35.22%, 33.33%, 31.26%, 91.96%, and 18.36% for the whole plant, root, stem, leaf, and boll, respectively. GGK2 × Y5 exhibited MPH for fresh weight in all tissues (14.97%, 31.85%, 15.11%, 14.15%, and 15.42%, respectively), while SPH was observed only in the root and leaf (30.32% and 30.63%, respectively). In addition, GGK2 × XH also exhibited certain MPH (22.53% and 18.50%) and SPH (21.09% and 1.52%) in the root and leaf, respectively.
Table 2. Fresh weight of various tissues at the boll stage.
Plant lines Fresh weight(g)
Plant Roots Stems Leaves Bolls
GGK2 449.73±41.25a 14.07±1.66a 72.50±8.85a 83.30±10.05a 265.87±34.55a
XH 330.00±34.48b 13.74±2.46a 65.03±6.11a 59.43±6.99a 182.80±19.70ab
GGK2×XH 350.80±14.10ab 17.03±1.53a 65.47±4.84a 84.57±7.81a 173.73±2.32b
MPH -10.02% 22.53% -4.80% 18.50% -22.56%
SPH -22.00% 21.09% -9.70% 1.52% -34.65%
GGK2 449.73±41.25ab 14.07±1.66a 72.50±8.85a 83.30±10.05b 265.87±34.550a
Y4 355.37±33.93b 15.80±2.35a 60.43±7.80a 58.73±11.18b 210.73±16.71a
GGK2×Y4 608.13±84.09a 21.07±3.61a 95.17±14.40a 159.90±22.26a 314.67±44.72a
MPH 51.07% 41.07% 43.18% 125.16% 32.05%
SPH 35.22% 33.33% 31.26% 91.96% 18.36%
GGK2 449.73±41.25a 14.07±1.66a 72.50±8.85a 83.30±10.05a 265.87±34.55a
Y5 322.97±17.590b 14.40±0.92a 49.70±2.86a 64.63±3.98a 185.23±9.48a
GGK2×Y5 444.20±5.65a 18.77±1.23a 70.33±5.64a 84.43±5.66a 260.33±15.00a
MPH 14.97% 31.85% 15.11% 14.15% 15.42%
SPH -1.23% 30.32% -2.99% 30.63% -2.08%
Note: “Plant”, “Root”, “Stem”, “Leaf”, and “Boll” represent the fresh weight of the whole plant and each tissue, respectively. Values followed by different lowercase letters (a, b, c) indicate significant differences at the 5% probability level. MPH, mid-parent heterosis rate, MPH = (Hybrid trait value - Mean of parental trait values) / Mean of parental trait values × 100%; SPH, super-parent heterosis rate, SPH = (Hybrid trait value - Higher parent trait value) / Higher parent trait value × 100%. A value greater than 0 indicates positive heterosis, while a value less than 0 indicates negative heterosis.
As shown in Table 3, significant differences were observed between the hybrid GGK2×XH and its parents for root and leaf dry weights. This hybrid also exhibited relatively high MPH (42.87%, 35.83%) and SPH (36.42%, 21.09%) values for these traits. Significant differences were detected between the hybrid GGK2×Y4 and its parents for plant, stem, and leaf dry weights. The MPH for GGK2×Y4 ranged from 49.12% to 94.51%, while its SPH ranged from 31.17% to 84.04%. Similarly, the hybrid GGK2×Y5 also demonstrated heterosis, with MPH ranging from 15.76% to 31.72% and SPH ranging from 9.33% to 31.22%.
Table 3. Dry weight of various tissues at the boll stage.
Plant lines Dry weight(g)
Plants Roots Stems Leaves Bolls
GGK2 100.83±8.22a 4.39±0.59ab 20.64±1.88a 14.15±0.87ab 61.65±6.54a
XH 90.32±6.88a 4.00±0.45b 19.31±1.92a 11.08±1.42b 55.93±3.58a
GGK2×XH 95.53±5.54a 5.99±0.39a 19.96±1.07a 17.13±1.23a 52.44±3.57a
MPH -0.05% 42.87% -0.07% 35.83% -10.80%
SPH -5.25% 36.42% -3.28% 21.09% -14.93%
GGK2 100.83±8.22b 4.39±0.59a 20.64±1.88ab 14.15±0.87b 61.65±6.54a
Y4 93.30±7.15b 4.62±0.72a 15.67±1.10b 15.85±0.71b 57.15±7.22a
GGK2×Y4 149.51±19.65a 7.14±1.33a 27.07±4.81a 29.18±4.74a 86.12±10.01a
MPH 54.03% 58.45% 49.12% 94.51% 44.98%
SPH 48.28% 54.51% 31.17% 84.04% 39.69%
GGK2 100.83±8.22a 4.39±0.59a 20.64±1.88a 14.15±0.87b 61.65±6.54a
Y5 92.58±4.27a 4.82±0.25a 17.28±1.03a 14.04±1.27b 56.45±2.64a
GGK2×Y5 115.40±8.19a 5.92±0.75a 22.57±2.02a 18.56±0.87a 68.36±5.72a
MPH 19.34% 31.72% 15.76% 28.48% 19.03%
SPH 14.46% 22.84% 9.33% 31.22% 10.88%
Note: “Plant”, “Root”, “Stem”, “Leaf”, and “Boll” represent the dry weight of the whole plant and each tissue, respectively. Values followed by different lowercase letters (a, b, c) indicate significant differences at the 5% probability level. MPH, mid-parent heterosis rate, MPH = (Hybrid trait value - Mean of parental trait values) / Mean of parental trait values × 100%; SPH, super-parent heterosis rate, SPH = (Hybrid trait value - Higher parent trait value) / Higher parent trait value × 100%. A value greater than 0 indicates positive heterosis, while a value less than 0 indicates negative heterosis.
As shown in Table 4, significant differences in agronomic traits at the boll stage were observed between the hybrid germplasms and their parents. In the cross GGK2 × XH, plant height and height to the first fruiting branch exhibited low MPH (2.46% and 6.06%, respectively), and their SPH values (-2.54% and -5.66%, respectively) indicated no heterosis. The number of bolls and number of fruiting branches both demonstrated certain levels of MPH (14.18% and 14.02%, respectively) and SPH (12.88% and 9.58%, respectively). No heterosis was observed for stem diameter. In contrast, the cross GGK2 × Y5 exhibited heterosis across all measured agronomic traits. Notably, high heterosis was observed for the number of bolls, number of fruiting branches, and stem diameter, with MPH values of 13.64%, 11.32%, and 9.43%, and SPH values of 13.64%, 5.99%, and 6.81%, respectively.
Table 4. Agronomic traits of different cotton lines at the boll stage.
Plant lines Plant height
(cm)
Height of the first fruiting branch(cm) Number of fruiting branches(a) Number of cotton bolls(a) Stem diameter
(mm)
GGK2 91.57±0.57b 34.15±0.35c 8.80±0.18b 11.13±0.27ab 10.02±0.15b
XH 101.46±0.65a 43.83±0.28a 8.60±0.32b 10.27±0.61b 10.63±0.19a
GGK2×XH 98.89±1.22a 41.35±0.43b 9.93±0.28a 12.20±0.4a 9.66±0.13b
MPH 2.46% 6.06% 14.18% 14.02% -6.39%
SPH -2.54% -5.66% 12.88% 9.58% -9.09%
GGK2 91.57±0.59a 34.15±0.35a 8.80±0.18b 11.13±0.27a 10.02±0.15b
Y4 91.23±0.93a 32.85±0.51a 9.60±0.19a 11.47±0.44a 10.69±0.18a
GGK2×Y4 82.62±0.96b 28.69±0.51b 8.27±0.21b 10.40±0.34a 10.12±0.23ab
MPH -9.61% -14.37% -10.14% -7.96% -2.21%
SPH -9.77% -15.99% -13.89% -9.30% -5.27%
GGK2 91.57±0.59a 34.15±0.35a 8.80±0.18b 11.13±0.27ab 10.02±0.15b
Y5 84.17±0.56b 30.50±0.43b 8.80±0.20b 10.07±0.49b 10.52±0.16b
GGK2×Y5 93.13±0.96a 33.99±0.29a 10.00±0.28a 11.80±0.42a 11.24±0.27a
MPH 5.99% 5.17% 13.64% 11.32% 9.43%
SPH 1.71% -0.45% 13.64% 5.99% 6.81%
Note: This table presents the agronomic traits of various cotton lines at the boll stage, including plant height, height to the first fruiting branch, number of fruiting branches, number of bolls, and stem diameter. The letters a, b, and c indicate significant differences at the 5% probability level. MPH, mid-parent heterosis rate, MPH = (hybrid trait value - average parental trait value) / average parental trait value × 100%; SPH, super-parent heterosis rate, SPH = (hybrid trait value - high-parent trait value) / high-parent trait value × 100%. Values greater than 0 indicate positive heterosis, while values less than 0 indicate negative heterosis.
Yield traits are important indicators for crop evaluation. Table 5 displays the agronomic traits of the hybrid germplasms and their parents, as well as the heterosis rates of the hybrid germplasms. The cross GGK2 × XH exhibited heterosis in boll number per plant, yield per plant, and lint yield, particularly in boll number per plant, where its MPH and SPH were 2.98% and 21.47%, respectively. The heterosis observed in GGK2 × Y4 was similar to that of GGK2 × XH, with MPH values of 15.94%, 6.98%, and 6.98% for boll number per plant, yield per plant, and lint yield, respectively, and corresponding SPH values of 9.89%, 3.62%, and 10.56%. In contrast, GGK2 × Y5 demonstrated almost no heterosis.
Table 5. Yield traits of various cotton lines at maturity stage.
Plant lines No. bolls(plant-1) Weight(plant-1) Weight(boll-1) Yeild (kg·ha-1) Lint score (%) Seed index(g)
GGK2 8.15±0.24b 43.89±1.87a 5.36±0.11a 52.27±2.23a 0.39±0.01a 10.25±0.07b
XH 7.95±0.30b 42.32±1.66a 5.35±0.14a 50.40±1.97a 0.39±0.01a 11.15±0.08a
GGK2×XH 9.9±0.60a 45.59±2.81a 4.62±0.11b 54.30±3.35a 0.37±0.01b 10.88±0.15a
MPH 22.98% 5.77% -13.67% 5.77% -4.94% 1.65%
SPH 21.47% 3.87% -13.74% 3.87% -4.85% -2.42%
GGK2 8.15±0.24b 43.89±1.87a 5.36±0.11a 52.27±2.23a 0.39±0.01a 10.25±0.07c
Y4 9.10±0.50ab 46.83±2.07a 5.21±0.10ab 55.77±2.46a 0.34±0.01b 13.59±0.07a
GGK2×Y4 10.00±0.60a 48.52±3.24a 4.85±0.15b 57.79±3.86a 0.38±0.01a 11.22±0.08c
MPH 15.94% 6.98% -8.28% 6.98% 4.29% -5.92%
SPH 9.89% 3.62% -9.60% 10.56% -3.17% -17.44%
GGK2 8.15±0.24a 43.89±1.87a 5.36±0.11a 52.27±2.23a 0.39±0.01a 10.25±0.07c
Y5 8.55±0.37a 44.75±1.64a 5.29±0.12a 53.30±1.96a 0.34±0.01c 12.76±0.11b
GGK2×Y5 8.45±0.34a 43.41±1.55a 5.16±0.08a 51.71±1.85a 0.36±0.01b 11.09±0.05a
MPH 1.20% -2.04% -3.03% -2.05% -2.83% -3.61%
SPH -1.17% -2.99% -3.73% -1.08% -9.64% -13.09%
Note: This table presents the yield traits at maturity for each cotton line, including boll number per plant, yield per plant, boll weight per plant, yield per unit area, lint score, and seed index. Letters a, b, and c indicate significant differences at the 5% probability level. MPH, mid-parent heterosis rate, MPH = (mean trait value of the hybrid - mean trait value of the parents) / mean trait value of the parents × 100%; SPH, super-parent heterosis rate, SPH = (trait value of the hybrid - trait value of the better parent) / trait value of the better parent × 100%. Values greater than 0 indicate positive heterosis, while values less than 0 indicate negative heterosis.
The quality of cotton fiber determines the efficiency of textile processing. As shown in Table 6, significant differences in fiber quality were observed between the hybrid germplasms and their parents. The cross GGK2 × XH exhibited a certain level of heterosis for fiber elongation, specifically with MPH and SPH values of 18.51% and 15.37%, respectively. However, no heterosis was observed for the other quality parameters. Similarly, in GGK2 × Y4, only fiber elongation and micronaire value demonstrated low heterosis, with MPH values of 4.42% and 8.33%, and SPH values of 4.02% and 7.39%, respectively; no heterosis was detected for the remaining parameters. Furthermore, GGK2 × Y5 exhibited even lower heterosis, showing MPH values of 3.69%, 0.37%, 1.39%, and 7.35% for fiber length, uniformity, elongation, and micronaire value, respectively, but demonstrating SPH only for fiber length and micronaire value, at 1.60% and 6.64%, respectively.
Table 6. Fiber Quality of Various Cotton Germplasms.
Plant lines Length
(mm)
Uniformity (%) Strength
(cN/tex)
Elongation (%) Micronaire
GGK2 30.02±0.22b 87.74±0.23a 27.94±0.14b 10.36±0.22b 4.52±0.14ab
XH 33.52±0.27a 88.32±0.23a 30.00±0.21a 8.98±0.13a 4.74±0.15a
GGK2×XH 29.96±0.16b 86.76±0.35b 30.00±0.40a 11.46±0.31c 4.26±0.07b
MPH -5.70% -1.44% 3.56% 18.51% -8.00%
SPH -10.44% -1.77% 0.00% 15.37% -4.64%
GGK2 30.02±0.22b 87.74±0.23a 27.94±0.14a 10.36±0.22a 4.52±0.14a
Y4 32.44±0.36a 87.96±0.44a 27.98±0.34a 10.44±0.30a 4.60±0.20a
GGK2×Y4 30.36±0.32b 86.76±0.48a 26.68±0.42b 10.86±0.21a 4.94±0.12a
MPH -2.78% -1.24% -4.58% 4.42% 8.33%
SPH -6.41% -1.36% -4.65% 4.02% 7.39%
GGK2 30.02±0.22b 87.74±0.23b 27.94±0.14b 10.36±0.22b 4.52±0.14a
Y5 31.28±0.23a 89.48±0.37a 29.48±0.31a 11.18±0.20a 4.46±0.12a
GGK2×Y5 31.78±0.21a 88.28±0.37b 28.00±0.21b 10.92±0.18ab 4.82±0.14a
MPH 3.69% 0.37% -2.47% 1.39% 7.35%
SPH 1.60% -1.34% -5.02% -2.33% 6.64%
Note: This table presents the fiber quality of each cotton variety, including fiber length, uniformity, breaking tenacity, elongation at break, and micronaire value. The letters a, b, and c indicate significant differences at the 5% probability level. MPH, mid-parent heterosis rate, MPH = (F₁ trait value - mean of parental traits) / mean of parental traits × 100%; SPH, super-parent heterosis rate, SPH = (F₁ trait value - higher parent trait value) / higher parent trait value × 100%. Values greater than 0 indicate positive heterosis, while values less than 0 indicate negative heterosis.

3. Discussion

Glyphosate is a broad-spectrum herbicide widely used in agricultural production; however, its potential phytotoxicity limits the widespread adoption of elite crop varieties. The GAT gene, which can reduce glyphosate toxicity by catalyzing its N-acetylation, is one of the most commonly utilized herbicide-tolerant genes. In contrast, GR-79 is a relatively less-studied novel gene associated with herbicide tolerance, and its underlying mechanism is closely related to glutathione metabolism and oxidative stress response. To investigate the effects of these two types of genes on herbicide tolerance in different hybrid combinations, this study examined the expression levels of GAT and GR-79 in various crosses and compared their herbicide-resistant phenotypes under glyphosate stress.
The results showed that, compared to the paternal parent GGK2, the expression levels of GAT were significantly downregulated in three hybrid combinations (GGK2×XH, GGK2×Y4, and GGK2×Y5), decreasing by 87%, 81%, and 71%, respectively. This may impair the GAT-mediated herbicide detoxification capacity. Notably, however, GR-79 was generally upregulated in the hybrid combinations, with increases of 13%, 102%, and 30%, respectively. In particular, its expression in GGK2×Y4 was approximately twice that of the paternal parent. Based on previous studies indicating the critical role of GR-type genes in glutathione metabolism, ROS scavenging, and cellular protection [25,26,27], it is hypothesized that GR-79 plays an important function in alleviating glyphosate-induced oxidative damage. This regulatory role may be particularly prominent when GAT expression is suppressed. Furthermore, studies have suggested that co-expression of GAT and GR-type genes can enhance herbicide tolerance and reduce glyphosate residues [28], which is highly consistent with the findings of this study.
Analysis of herbicide-resistant phenotypes further supports the aforementioned molecular mechanisms. Under treatment with 0.5% glyphosate, all hybrid combinations exhibited a certain degree of resistance, indicating that the herbicide tolerance trait carried by the paternal parent GGK2 was successfully inherited in the hybrid germplasm and displayed a strong dominant or partially dominant inheritance trend [29,30,31,32,33]. The downregulation of GAT expression may be associated with the reorganization of cis- or trans-regulatory factors resulting from hybridization, whereas the high expression of GR-79 is likely driven by dominant alleles or enhanced effects of gene interactions, reflecting the integration of complex regulatory networks on target traits during hybridization [34]. Therefore, this study untangles, at the transcriptional level, that herbicide tolerance in hybrid varieties does not rely solely on the GAT gene, and suggests that novel resistance genes such as GR-79 may play a more critical role in conferring resistance, thereby providing new targets and a theoretical basis for subsequent molecular breeding of herbicide-tolerant crops.
Abiotic stress conditions (e.g., salinity, drought, and heavy metals) generally exert significant impacts on the synthesis and distribution of photosynthetic pigments in plants [18,19,20]. In this study, based on the introduction of herbicide resistance-related genes GAT and GR-79, we systematically analyzed changes in leaf pigment content and photosystem function across three hybrid combinations (GGK2×XH, GGK2×Y4, GGK2×Y5) to explore the relationship between molecular regulation of herbicide tolerance and photosynthetic physiological performance. Regarding chlorophyll content, except for the significantly higher chlorophyll a (Chla) content in GGK2×Y5 compared to its parents, no significant differences were observed between the other hybrid germplasms and their parents, indicating that altered expression of GAT and GR-79 did not inhibit pigment biosynthesis. However, further heterosis analysis revealed that GGK2×Y5 exhibited significant mid-parent heterosis (MPH) and super-parent heterosis (SPH) in pigment accumulation, with MPH values for Chla, Chlb, and carotenoids (Car) reaching 28.08%, 14.09%, and 22.39%, respectively. Moreover, the Chla/b ratio in this combination was also significantly increased, suggesting a potential optimization of light capture and distribution efficiency through an elevated coordination ratio between chlorophyll a and b [35,36,37,38]. GGK2×XH and GGK2×Y4 also displayed a certain degree of heterosis in the Chla/b ratio. Such differences may be related to the maternal genetic background and its interactions with photosynthetic regulatory pathways, thereby influencing pigment synthesis efficiency and photosynthetic capacity.
To further validate the functional changes in photosynthesis regulation of the hybrid combinations, this study analyzed chlorophyll fluorescence kinetic characteristics, clearly untangling the response differences in the energy conversion pathway of photosystem II (PSII) among different genotypes. The fluorescence parameters of GGK2×XH were overall similar to those of the paternal parent GGK2, and were higher than those of the maternal parent XH in most structural indicators (e.g., ABS/RC, TRo/RC, REo/RC), reflecting its strong foundation for light energy capture and electron transport. However, its photochemical efficiency indicators (e.g., φPo, ψEo, φEo) were lower than those of the maternal parent, indicating that despite superior structural performance, losses still occur in the light energy conversion process, potentially limited by gene interaction regulation [39,40,41]. GGK2×Y4 exhibited outstanding performance in electron transport efficiency, particularly in indicators reflecting the depth of electron transport and the overall output efficiency of reaction centers, such as φRo, δRo, and REo/CSo, where it was significantly superior to both parents. This suggests that this combination can effectively deliver electrons to the terminal end of the electron donor chain, enhancing the energy output efficiency of the PSII system per unit area [40,42,43], further demonstrating its clear heterosis performance. Concurrently, its advantages in structural parameters of the reaction centers (e.g., ABS/RC, ETo/RC, REo/RC) indicate good potential for the structural integrity of the photosystem and the stability of electron output. In GGK2×Y5, the fluorescence parameters were similar to those of the paternal parent GGK2, with some indicators such as ψEo and φEo being significantly higher than those of the maternal parent Y5, highlighting the genetic contribution of the paternal parent to its photosynthetic performance. Particularly noteworthy are the lower φDo and δRo values related to light energy dissipation in this combination, implying that higher electron transport efficiency is achieved based on lower energy loss, demonstrating a more economical and efficient light energy utilization characteristic, further supporting the overall advantages of this combination in pigment accumulation and photosynthetic efficiency [44,45,46]. Integrating the above results, it is evident that although the expression level of the herbicide-tolerance-related gene GAT was downregulated in some combinations, it did not cause significant inhibition of PSII system function. Conversely, in combinations with high GR-79 expression (e.g., GGK2×Y5), the optimization of fluorescence parameters and the enhancement of photosynthetic structural stability were more pronounced, potentially related to the stress resistance-associated regulation involving GR-79 (e.g., ROS scavenging, cellular homeostasis maintenance). This physiologically reveals that GR-79 may play an auxiliary protective role in regulating the photosynthetic system, helping to maintain the photosynthetic activity of herbicide-tolerant hybrid combinations under adverse environmental conditions. These differences in photosynthetic function and pigment accumulation not only indicate varying response states of different hybrid combinations to herbicide-tolerance gene expression but also suggest a potential synergistic maintenance mechanism between herbicide-tolerance genes and photosynthesis regulation. This enhances the photosynthetic homeostasis capacity of hybrid combinations under abiotic stress conditions and also reflects the multi-level expression mechanism of heterosis in hybrid breeding. The potential synergistic maintenance mechanism between herbicide-tolerance genes and photosynthesis regulation further emphasizes the critical role of parental genetic background and its interaction with photosynthesis regulation in shaping the stress resistance and photosynthetic efficiency of hybrid cultivars.
Biomass accumulation and yield of hybrid germplasms are of widespread interest to researchers. In this experiment, significant combinatory differences were observed in the biomass accumulation of the hybrid germplasms, demonstrating strong dependence on genetic background. GGK2×Y4 exhibited significant MPH and SPH in fresh weight indicators for the whole plant and various organs (root, stem, leaf, boll). The MPH and SPH for leaf fresh weight reached as high as 125.16% and 91.96%, respectively, indicating superior performance in photosynthetic product accumulation and organ-specific growth in this combination, potentially originating from higher leaf area index, photosynthetic efficiency, and dry matter conversion capacity. Although GGK2×Y5 showed a certain degree of biomass advantage in roots and leaves, its overall advantage did not lead to systematic accumulation at the whole-plant level. In contrast, the biomass heterosis of GGK2×XH was the most limited, being only slightly higher than the parents in some parameters of roots and leaves, suggesting relatively weaker capacity for carbon assimilate transport and inter-organ allocation [47]. Notably, regarding yield traits, GGK2×XH exhibited low MPH or even negative SPH in individual structural traits such as plant height and height to the first fruiting branch, indicating no significant advantage in plant architecture construction. However, this combination still displayed moderate levels of heterosis in the number of fruiting branches and bolls, indicating enhanced lateral branch growth and reproductive establishment capacity [48,49]. The hybrid GGK2×Y5 exhibited extensive heterosis in agronomic traits, particularly showing significant positive mid-parent heterosis (MPH) and specific combining ability (SCA) in multiple indicators such as the number of fruit branches, number of bolls, and stem diameter, indicating favorable field growth capacity. However, its heterosis for yield per plant was relatively low, which may be associated with reduced boll-setting rate or individual boll weight. These results suggest a certain degree of phenotypic dissociation between agronomic traits (e.g., plant height, stem diameter) and final yield-related traits, indicating that their correlation requires further optimization [50]. In terms of yield improvement, GGK2×Y4 demonstrated the most prominent advantages, with MPH values reaching 15.94% for boll number per plant and 9.89% for yield per plant, making it the combination with the highest yield potential in this study. It is hypothesized that this hybrid has established a coordinated optimization pathway involving photosynthetic efficiency, biomass accumulation, and reproductive development rhythm, thereby providing a foundation for achieving high-yield objectives.
Although the aforementioned hybrid combinations exhibited varying degrees of superiority in biomass, agronomic traits, and yield, there remains considerable room for improvement in fiber quality. Overall, heterosis had limited effects on enhancing various fiber quality parameters (e.g., fiber length, strength, uniformity) [1,50,51]. Only GGK2×XH showed a notable advantage in fiber elongation (MPH of 18.51%, SCA of 15.37%), while GGK2×Y4 and GGK2×Y5 exhibited minor improvements in parameters such as micronaire value. This indicates that, under the current parental combinations, hybridization breeding has not yet sufficiently improved the commercial properties of cotton. These findings suggest that fiber quality traits are governed by polygenic coordination, exhibit strong genetic stability, and low environmental sensitivity, making it difficult to achieve significant improvement through a single round of hybridization. The results imply that if fiber quality is the primary breeding objective, subsequent efforts should introduce high-quality fiber-type parents and incorporate marker-assisted selection to accelerate the pyramiding and optimized expression of superior fiber genes.

4. Materials and Methods

4.1. Plant Materials and Experimental Design

The plant materials used in this study included herbicide-tolerant transgenic cotton (GGK2), three conventional cultivars (XH, Y4, and Y5), and their hybrid F4 progenies (GGK2 × XH, GGK2 × Y4, and GGK2 × Y5). The GGK2 cotton was provided by Academician Guo Sandui, while the other cultivars were obtained through selective breeding in our laboratory. The field experiment was conducted in 2023 at the experimental station of Shihezi University in Shihezi City, Xinjiang (45°19’N, 86°03’E). A plot planting design was adopted, with each plot measuring 5 m in length and 2.10 m in width. The row spacing was 80 cm, and the plant spacing was 10 cm. The experiment was arranged in a randomized block design with five replicates. Sowing was performed by dibbling on May 15, 2023. Field management involved drip irrigation for water and fertilizer application. Mepiquat chloride was applied as a plant growth regulator via spraying every 7–8 days. The supply of water, fertilizer, and the growth regulator was terminated in September.

4.2. Methods

4.2.1. Quantitative Real-Time PCR

At the boll stage, the fourth leaf from the top of the main stem (the third leaf from the top after topping) of cotton plants was collected, rapidly frozen in liquid nitrogen, and stored at -80 °C in a laboratory freezer. Total RNA was extracted from the leaf tissues according to the manufacturer’s instructions. Subsequently, cDNA was synthesized using a reverse transcription kit. The concentration of the synthesized cDNA was determined using a micro-volume nucleic acid analyzer, and all samples were diluted to the same concentration prior to quantitative real-time PCR (qRT-PCR).
Specific primers for key herbicide resistance-related regulatory genes in upland cotton, such as GAT and GR-79, as well as for the internal reference gene GhUBQ7, were designed based on their sequences retrieved from GenBank using the Primer-BLAST tool in the NCBI database. Gene expression analysis was performed using a Bio-Rad real-time PCR system and the Bio Glod SYBR qPCR Master Mix kit (BIOGENE). The PCR amplification protocol consisted of an initial denaturation at 95 °C for 30 s, followed by 40 cycles of 95 °C for 5 s and 59 °C for 30 s. A melting curve was generated at the end of each run to confirm amplification specificity. The relative expression levels of the target genes were calculated using the 2–ΔΔCt method [52].

4.2.2. Seedling Herbicide Tolerance Assay

Based on the predetermined herbicide tolerance concentration for seedlings [53], cotton plants at the seedling stage were treated with herbicide at concentrations of 0% and 0.5%. The number of plants exhibiting a response to each herbicide concentration was recorded. The growth phenotypes of cotton plants in response to herbicide treatment were photographed for documentation.

4.2.3. Chlorophyll Pigment Content and OJIP Fluorescence

At the boll stage, the pigment content of the plants was determined. From each planting plot, healthy plants showing no signs of pest or disease damage were selected. Twenty leaf discs were collected from the fourth leaf from the top of the main stem (the third leaf from the top after topping) using a 1-cm diameter punch. These discs were immersed in sealed test tubes containing 10 mL of 95% ethanol for extraction. After the leaf discs turned white, the absorbance of the extracts was measured at 470 nm, 645 nm, and 663 nm using a spectrophotometer. The contents of chlorophyll a (Chl a), chlorophyll b (Chl b), total chlorophyll (Chl T), and carotenoids (Car) were calculated using the following formulae:
Chl a (mg/g) = 12.71 × OD663 – 2.59 × OD645
Chl b (mg/g) = 22.88 × OD645 – 4.67 × OD663
Chl T (mg/g) = Chl a + Chl b
Car (mg/g) = 4.7 × OD470 – 0.27 × Chl T
Also at the boll stage, OJIP fluorescence parameters were measured for plants in each plot. Five consecutive plants were selected per plot. The fourth leaf from the top of the main stem (the third leaf from the top after topping) was dark-adapted for 20 minutes between 10:00 AM and 12:00 PM. The fast chlorophyll a fluorescence induction kinetics curve (OJIP curve) was then recorded using a Handy PEA fluorometer. The measurements were conducted under an LED light source intensity of 3000 μmol·m⁻²·s⁻¹, with a detection duration of 1 second for rapid fluorescence signal acquisition. To minimize the effects of leaf heterogeneity, three different points were measured on each leaf, and the average value was taken as the final rapid fluorescence data.

4.2.4. Agronomic Traits, Yield Components, and Fiber Quality

At the boll stage, ten consecutive plants with uniform growth were selected for the analysis of agronomic traits. Plant height, height to the first fruiting node, number of fruiting branches, number of bolls, leaf area, internode length, and fruiting branch length were measured. Whole plants were carefully uprooted, and their fresh weights were immediately recorded. All plant tissues were then deactivated at 105 °C and dried at 80 °C until a constant dry weight was achieved.
Yield and yield components were assessed at maturity (October 15). From each plot, ten consecutive plants with fully open bolls were harvested. The seed cotton weight per plant was measured, and ginning was conducted under laboratory conditions to determine the lint percentage. Lint index was calculated based on lint percentage and seed index. Additionally, 50 fully open bolls from the middle portion of the plants were collected and weighed to determine boll weight. The total seed cotton weight from all fully open bolls in the plot was recorded as the final yield.
After ginning, a 30 g fiber sample from each plant was analyzed for fiber quality parameters, including fiber length, uniformity index, breaking tenacity, elongation at break, and micronaire value. These analyses were performed at the Institute of Agricultural Quality Standards and Testing Technology, Xinjiang Academy of Agricultural Sciences. Five replicates were assessed for each cultivar.

4.2.5. Statistical Analysis

Data were tested for normality and homogeneity of variance using SPSS 26.0. A one-way analysis of variance (ANOVA) was conducted, and means were separated using the T-test at a significance level of 0.05. Figures were generated using Origin 2021 Pro. All data are presented as the mean ± standard error (SE) from at least three replicates.

5. Conclusions

Through integrated analysis of gene expression regulation, physiological parameters, and multi-level phenotypic data, this study untangled the differential responses of hybrid combinations across multiple dimensions—including pigment accumulation, biomass formation, agronomic traits, yield performance, and fiber quality—under the context of herbicide-tolerant gene introduction. Particularly in combinations with enhanced GR-79 expression, not only was a strong physiological adaptability observed in pigment accumulation and photosystem stability, but promising growth and yield potential was also demonstrated. The spatial and organ-specific distribution of heterosis across these traits, along with its combination-dependent nature, provides theoretical support for further exploitation of elite hybrid germplasm. Moreover, it highlights potential trade-offs among different traits, underscoring the need for balanced and precise selection in subsequent breeding efforts to achieve coordinated optimization of yield, quality, and resistance.

Supplementary Materials

The following supporting information can be downloaded at the website of this paper posted on Preprints.org, Figure S1: title; Table S1: title; Video S1: title.

Author Contributions

For research articles with several authors, the following statements should be used “Conceptualization, X.X. and Y.Y.; methodology, X.X.; software, X.X.; validation, X.X., Y.Y. and Z.Z.; formal analysis, X.X.; investigation, X.X.; resources, X.X.; data curation, X.X.; writing—original draft preparation, X.X.; writing—review and editing, X.X.; visualization, X.X.; supervision, X.X.; project administration, X.X.; funding acquisition, Y.Y. All authors have read and agreed to the published version of the manuscript.”

Funding

This work was supported by the environmental release of drought-resistant transgenic cotton 31-20 expressing the Saussurea involucrata SikPIP2;7 gene (Project No.: YZZX202404), the study on the mechanism by which the Saussurea involucrata SikFBA gene enhances photosynthetic physiology under low temperature in cotton (Project No.: 2023CB008-27), and the investigation of disease resistance signaling pathway transduction and interaction patterns in transgenic cotton RPPL1 expressing the ApHRD gene (Project No.: RCZK202366).

Institutional Review Board Statement

Not applicable.

Informed Consent Statement

Not applicable.

Data Availability Statement

The original contributions presented in this study are included in the article/Supplementary Material. Further inquiries can be directed to the corresponding authors.

Conflicts of Interest

The authors declare no conflicts of interest.

References

  1. Abdel-Aty, M. S.; Sorour, F. A.; Yehia, W. M. B.; Kotb, H. M. K.; Abdelghany, A. M.; Lamlom, S. F.; Shah, A. N.; Abdelsalam, N. R. Estimating the combining ability and genetic parameters for growth habit, yield, and fiber quality traits in some Egyptian cotton crosses. BMC Plant Biol. 2023, 23, 21. [Google Scholar] [CrossRef] [PubMed]
  2. Jiang, B.; Zhang, H. Y.; Su, W. H. Automatic Localization of Soybean Seedlings Based on Crop Signaling and Multi-View Imaging. Sensors 2024, 24, 20. [Google Scholar] [CrossRef]
  3. Xiang, M. Q.; Qu, M. H.; Wang, G.; Ma, Z. Y.; Chen, X. G.; Zhou, Z. H.; Qi, J. T.; Gao, X. M.; Li, H. L.; Jia, H. L. Crop detection technologies, mechanical weeding executive parts and working performance of intelligent mechanical weeding: a review. Front. Plant Sci. 2024, 15, 16, Review. [Google Scholar] [CrossRef]
  4. Divya, K.; Thangaraj, M.; Krishna Radhika, N. CRISPR/Cas9: an advanced platform for root and tuber crops improvement. Frontiers in genome editing 2023, 5, 1242510, Review. [Google Scholar] [CrossRef]
  5. Saunders, L. E.; Pezeshki, R. Glyphosate in Runoff Waters and in the Root-Zone: A Review. Toxics 2015, 3, 462–480. [Google Scholar] [CrossRef]
  6. Martins-Gomes, C.; Silva, T. L.; Andreani, T.; Silva, A. M. Glyphosate vs. Glyphosate-Based Herbicides Exposure: A Review on Their Toxicity. J Xenobiot 2022, 12, 21–40. [Google Scholar] [CrossRef]
  7. Achary, V. M. M.; Sheri, V.; Manna, M.; Panditi, V.; Borphukan, B.; Ram, B.; Agarwal, A.; Fartyal, D.; Teotia, D.; Masakapalli, S. K.; et al. Overexpression of improved EPSPS gene results in field level glyphosate tolerance and higher grain yield in rice. Plant Biotechnol J 2020, 18, 2504–2519. [Google Scholar] [CrossRef]
  8. Duke, S. O.; Carvalho, L. B. Unintended Effects of the Intended Herbicides on Transgenic Herbicide-Resistant Crops. Agronomy 2025, 15. [Google Scholar] [CrossRef]
  9. Cohen, Z. P.; Perkin, L. C.; Wagner, T. A.; Liu, J. G.; Bell, A. A.; Arick, M. A., II; Grover, C. E.; Yu, J. Z.; Udall, J. A.; Suh, C. P. C. Nematode-resistance loci in upland cotton genomes are associated with structural differences. G3-Genes Genomes Genet. 2024, 14, 10. [CrossRef] [PubMed]
  10. Li, L. B.; Zhao, S. Q.; Su, J. J.; Fan, S. L.; Pang, C. Y.; Wei, H. L.; Wang, H. T.; Gu, L. J.; Zhang, C.; Liu, G. Y.; et al. High-density genetic linkage map construction by F2 populations and QTL analysis of early-maturity traits in upland cotton (Gossypium hirsutum L.). Plos One 2017, 12, 17. [Google Scholar] [CrossRef] [PubMed]
  11. Su, J. J.; Fan, S. L.; Li, L. B.; Wei, H. L.; Wang, C. X.; Wang, H. T.; Song, M. Z.; Zhang, C.; Gu, L. J.; Zhao, S. Q.; et al. Detection of Favorable QTL Alleles and Candidate Genes for Lint Percentage by GWAS in Chinese Upland Cotton. Front. Plant Sci. 2016, 7, 11. [Google Scholar] [CrossRef]
  12. Ijaz, A.; Khan, M. K. R.; Haidar, S. Early-stage identification of heat-tolerant cotton genotypes under simulated episodic heat stress in controlled conditions. BMC Plant Biol. 2025, 25, 15. [Google Scholar] [CrossRef]
  13. Zou, J.; Zhu, J.; Huang, S.; Tian, E.; Xiao, Y.; Fu, D.; Tu, J.; Fu, T.; Meng, J. Broadening the avenue of intersubgenomic heterosis in oilseed Brassica. Theoretical and Applied Genetics 2009, 120, 283–290. [Google Scholar] [CrossRef]
  14. Yaqoob, A.; Bashir, S.; Rao, A. Q.; Shahid, A. A. Transformation of α-EXPA1 gene leads to an improved fibre quality in Gossypium hirsutum. Plant Breed. 2020, 139, 1213–1220. [Google Scholar] [CrossRef]
  15. Karthik, K.; Nandiganti, M.; Thangaraj, A.; Singh, S.; Mishra, P.; Rathinam, M.; Sharma, M.; Singh, N. K.; Dash, P. K.; Sreevathsa, R. Transgenic Cotton (Gossypium hirsutum L.) to Combat Weed Vagaries: Utility of an Apical Meristem-Targeted in plantaTransformation Strategy to Introgress a Modified CP4-EPSPS Gene for Glyphosate Tolerance. Front. Plant Sci. 2020, 11, 11. [Google Scholar] [CrossRef] [PubMed]
  16. Gul, A.; Rao, A. Q.; Ahmed, M.; Latif, A.; Bakhsh, A.; Iftikhar, S. The Increased aspartate levels in transgenic cotton (Gossypium hirsutum L.) lead to improved tolerance against whitefly (Bemisia tabaci, Gennadius). Physiol. Plant. 2024, 176, 10. [Google Scholar] [CrossRef] [PubMed]
  17. Tong, X. H.; Daud, M. K.; Sun, Y. Q.; Zhu, S. J. Physiological and molecular mechanisms of glyphosate tolerance in an in vitro selected cotton mutant. Pest. Biochem. Physiol. 2009, 94, 100-106. [Google Scholar] [CrossRef]
  18. Gujjar, R. S.; Sherin, S.; Batra, S.; Mahto, A.; Goswami, S. K.; Kumar, R.; Tiwari, R. K.; Singh, A.; Kumari, M. Emerging trends in the development of efficient CAS nucleases for meticulous gene editing in plants. Plant Sci 2026, 362, 112820. [Google Scholar] [CrossRef]
  19. Zhao, J.; Yu, A.; Du, Y.; Wang, G.; Li, Y.; Zhao, G.; Wang, X.; Zhang, W.; Cheng, K.; Liu, X.; et al. Foxtail millet (Setaria italica (L.) P. Beauv) CIPKs are responsive to ABA and abiotic stresses. PLoS One 2019, 14, e0225091. [Google Scholar] [CrossRef]
  20. Zhang, B. Transgenic cotton: from biotransformation methods to agricultural application. Methods in molecular biology (Clifton, N.J.) 2013, 958, 3–15, Review. [Google Scholar] [CrossRef]
  21. Fang, J. G.; Zhu, X. D.; Wang, C.; Shangguan, L. F. Applications of DNA Technologies in Agriculture. Curr. Genomics 2016, 17, 379–386. [Google Scholar] [CrossRef]
  22. Lowder, L.; Malzahn, A.; Qi, Y. P. Rapid Evolution of Manifold CRISPR Systems for Plant Genome Editing. Front. Plant Sci. 2016, 7, 12, Review. [Google Scholar] [CrossRef]
  23. Feke, A.; Liu, W.; Hong, J.; Li, M. W.; Lee, C. M.; Zhou, E. K.; Gendron, J. M. Decoys provide a scalable platform for the identification of plant E3 ubiquitin ligases that regulate circadian function. eLife 2019, 8, 35. [Google Scholar] [CrossRef]
  24. Delporte, F.; Jacquemin, J.-M.; Masson, P.; Watillon, B. Insights into the regenerative property of plant cells and their receptivity to transgenesis: wheat as a research case study. Plant signaling & behavior 2012, 7, 1608–1620, Review. [Google Scholar] [CrossRef]
  25. Nawaz, F.; Naeem, M.; Ashraf, M. Y.; Tahir, M. N.; Zulficiar, B.; Salahuddin, M.; Shabbir, R. N.; Aslam, M. Selenium Supplementation Affects Physiological and Biochemical Processes to Improve Fodder Yield and Quality of Maize (Zea mays L.) under Water Deficit Conditions. Front. Plant Sci. 2016, 7, 13. [Google Scholar] [CrossRef] [PubMed]
  26. Gao, M. Z.; Ling, N.; Tian, H. Y.; Guo, C. Q.; Wang, Q. Y. Toxicity, physiological response, and biosorption mechanism of Dunaliella salina to copper, lead, and cadmium. Front. Microbiol. 2024, 15, 19. [Google Scholar] [CrossRef] [PubMed]
  27. El-Hendawy, S.; Elsayed, S.; Al-Suhaibani, N.; Alotaibi, M.; Tahir, M. U.; Mubushar, M.; Attia, A.; Hassan, W. M. Use of Hyperspectral Reflectance Sensing for Assessing Growth and Chlorophyll Content of Spring Wheat Grown under Simulated Saline Field Conditions. Plants-Basel 2021, 10, 26. [Google Scholar] [CrossRef]
  28. Meng, Y.; Zhang, W.; Wang, Z.; Yuan, F.; Guo, S.; Lin, H.; Niu, L. Correction: Co-expression of GR79 EPSPSand GATgenerates high glyphosate-resistant alfalfa with low glyphosate residues. aBIOTECH 2024, 5 (1), 116, Published Erratum. [CrossRef]
  29. Tang, S. Y.; Shi, J. Y.; Li, X. F.; Yang, M. L.; Li, C.; Zhang, D.; Yang, S.; Mei, C.; Luo, Z. Y.; Zhang, L.; et al. Development and Breeding of Herbicide-Resistant Sorghum for Effective Cereal-Legume Intercropping. Adv. Sci. 2025, 12, 11. [Google Scholar] [CrossRef]
  30. Sharkhuu, A.; Narasimhan, M. L.; Merzaban, J. S.; Bressan, R. A.; Weller, S.; Gehring, C. A red and far-red light receptor mutation confers resistance to the herbicide glyphosate. Plant J. 2014, 78, 916–926. [Google Scholar] [CrossRef] [PubMed]
  31. Nakazato, I.; Yamori, W.; Matsumura, H.; Qu, Y. C.; Okuno, M.; Tsutsumi, N.; Arimura, S. I. Resistance to the herbicide metribuzin conferred to Arabidopsis thaliana by targeted base editing of the chloroplast genome. Plant Biotechnol. J. 2025, 23, 204–215. [Google Scholar] [CrossRef]
  32. Park, J. C.; Hur, O. S.; Yoon, Y. M.; Lee, C. H.; Kim, S. M. Development of cleaved amplified polymorphic sequence marker for powdery mildew resistance in Korean malting barley using QTL-seq. Front. Plant Sci. 2025, 16, 17. [Google Scholar] [CrossRef]
  33. Ferdous, M. J.; Hossain, M. R.; Park, J. I.; Robin, A. H. K.; Jesse, D. M. I.; Jung, H. J.; Kim, H. T.; Nou, I. S. Inheritance Pattern and Molecular Markers for Resistance to Blackleg Disease in Cabbage. Plants-Basel 2019, 8, 17. [Google Scholar] [CrossRef] [PubMed]
  34. Guo, M.; Liu, J. H.; Ma, X.; Luo, D. X.; Gong, Z. H.; Lu, M. H. The Plant Heat Stress Transcription Factors (HSFs): Structure, Regulation, and Function in Response to Abiotic Stresses. Front. Plant Sci. 2016, 7, 13, Review. [Google Scholar] [CrossRef] [PubMed]
  35. Ma, X. H.; Song, L. L.; Yu, W. W.; Hu, Y. Y.; Liu, Y.; Wu, J. S.; Ying, Y. Q. Growth, physiological, and biochemical responses of Camptotheca acuminata seedlings to different light environments. Front. Plant Sci. 2015, 6, 12. [Google Scholar] [CrossRef] [PubMed]
  36. Lu, J. T.; Dong, Q. Q.; Lan, G. H.; He, Z. C.; Zhou, D. Y.; Zhang, H.; Wang, X. G.; Liu, X. B.; Jiang, C. J.; Zhang, Z.; et al. Row ratio increasing improved light distribution, photosynthetic characteristics, and yield of peanut in the maize and peanut strip intercropping system. Front. Plant Sci. 2023, 14, 16. [Google Scholar] [CrossRef]
  37. Zhang, H. H.; Zhong, H. X.; Wang, J. F.; Sui, X.; Xu, N. Adaptive changes in chlorophyll content and photosynthetic features to low light in Physocarpus amurensis Maxim and Physocarpus opulifolius “Diabolo”. PeerJ 2016, 4, 23. [Google Scholar] [CrossRef]
  38. Ma, X. H.; Qian, R. J.; Zhang, X. L.; Hu, Q. D.; Liu, H. J.; Zheng, J. Contrasting growth, physiological and gene expression responses of Clematis crassifolia and Clematis cadmia to different irradiance conditions. Sci Rep 2019, 9, 12. [Google Scholar] [CrossRef]
  39. Czyczylo-Mysza, I.; Tyrka, M.; Marcinska, I.; Skrzypek, E.; Karbarz, M.; Dziurka, M.; Hura, T.; Dziurka, K.; Quarrie, S. A. Quantitative trait loci for leaf chlorophyll fluorescence parameters, chlorophyll and carotenoid contents in relation to biomass and yield in bread wheat and their chromosome deletion bin assignments. Mol. Breed. 2013, 32, 189–210. [Google Scholar] [CrossRef]
  40. Fan, J. B.; Xu, J. L.; Zhang, W. H.; Amee, M.; Liu, D. L.; Chen, L. Salt-Induced Damage is Alleviated by Short-Term Pre-Cold Treatment in Bermudagrass (Cynodon dactylon). Plants-Basel 2019, 8, 15. [Google Scholar] [CrossRef]
  41. Lu, T.; Yu, H. J.; Li, Q.; Chai, L.; Jiang, W. J. Improving Plant Growth and Alleviating Photosynthetic Inhibition and Oxidative Stress From Low-Light Stress With Exogenous GR24 in Tomato (Solanum lycopersicum L.) Seedlings. Front. Plant Sci. 2019, 10, 13. [Google Scholar] [CrossRef]
  42. Stefanov, M. A.; Rashkov, G. D.; Yotsova, E. K.; Borisova, P. B.; Dobrikova, A. G.; Apostolova, E. L. Different Sensitivity Levels of the Photosynthetic Apparatus in Zea mays L. and Sorghum bicolor L. under Salt Stress. Plants-Basel 2021, 10, 17. [Google Scholar] [CrossRef]
  43. Meng, X.; Chen, W. W.; Wang, Y. Y.; Huang, Z. R.; Ye, X.; Chen, L. S.; Yang, L. T. Effects of phosphorus deficiency on the absorption of mineral nutrients, photosynthetic system performance and antioxidant metabolism in Citrus grandis. Plos One 2021, 16, 20. [Google Scholar] [CrossRef]
  44. Sobczak, A.; Sujkowska-Rybkowska, M.; Gajc-Wolska, J.; Kowalczyk, W.; Borucki, W.; Kalaji, H. M.; Kowalczyk, K. Photosynthetic Efficiency and Anatomical Structure of Pepper Leaf (Capsicum annuum L.) Transplants Grown under High-Pressure Sodium (HPS) and Light-Emitting Diode (LED) Supplementary Lighting Systems. Plants-Basel 2021, 10, 14. [Google Scholar] [CrossRef]
  45. Wang, C.; Gu, Q. L.; Zhao, L. J.; Li, C. Y.; Ren, J. T.; Zhang, J. X. Photochemical Efficiency of Photosystem II in Inverted Leaves of Soybean Glycine max (L.) Merr. Affected by Elevated Temperature and High Light. Front. Plant Sci. 2022, 12, 15. [Google Scholar] [CrossRef]
  46. Lv, Y. Y.; Wang, X.; Ding, B.; Xiao, M.; Qin, C. Effects of nitrogen addition on the growth and photosynthetic physiology of Gleditsia sinensis Lam. seedlings under shading conditions. Sci Rep 2025, 15, 20. [Google Scholar] [CrossRef] [PubMed]
  47. Baptist, F.; Tcherkez, G.; Aubert, S.; Pontailler, J. Y.; Choler, P.; Nogués, S. 13C and 15N allocations of two alpine species from early and late snowmelt locations reflect their different growth strategies. J. Exp. Bot. 2009, 60, 2725–2735. [Google Scholar] [CrossRef] [PubMed]
  48. Shi, J. Q.; Li, R. Y.; Zou, J.; Long, Y.; Meng, J. L. A Dynamic and Complex Network Regulates the Heterosis of Yield-Correlated Traits in Rapeseed (Brassica napus L.). Plos One 2011, 6, 16. [Google Scholar] [CrossRef]
  49. Tripathy, B.; Tripathy, P.; Jyothsna, J.; Sahu, G. S.; Dash, S. K.; Badu, M.; Mahapatra, S. K.; Rout, G. R. Exploring heterosis, dominance effect, and genetic control in Brinjal (Solanum melongena L.) landraces. Sci Rep 2025, 15, 33. [Google Scholar] [CrossRef]
  50. Geng, X. L.; Qu, Y. J.; Jia, Y. H.; He, S. P.; Pan, Z. E.; Wang, L. R.; Du, X. M. Assessment of heterosis based on parental genetic distance estimated with SSR and SNP markers in upland cotton (Gossypium hirsutum L.). BMC Genomics 2021, 22, 11. [Google Scholar] [CrossRef] [PubMed]
  51. Ayele, A. G.; Dever, J. K.; Kelly, C. M.; Sheehan, M.; Morgan, V.; Payton, P. Responses of Upland Cotton (Gossypium hirsutum L.) Lines to Irrigated and Rainfed Conditions of Texas High Plains. Plants-Basel 2020, 9, 13. [Google Scholar] [CrossRef] [PubMed]
  52. Livak, K. J.; Schmittgen, T. D. Analysis of relative gene expression data using real-time quantitative PCR and the 2-ΔΔCT method. Methods 2001, 25, 402–408. [Google Scholar] [CrossRef] [PubMed]
  53. Guo, J. L.; Gao, S. W.; Lin, Q. L.; Wang, H. B.; Que, Y. X.; Xu, L. P. Transgenic Sugarcane Resistant to Sorghum mosaic virus Based on Coat Protein Gene Silencing by RNA Interference. Biomed Res. Int. 2015, 2015, 9. [Google Scholar] [CrossRef] [PubMed]
Disclaimer/Publisher’s Note: The statements, opinions and data contained in all publications are solely those of the individual author(s) and contributor(s) and not of MDPI and/or the editor(s). MDPI and/or the editor(s) disclaim responsibility for any injury to people or property resulting from any ideas, methods, instructions or products referred to in the content.
Copyright: This open access article is published under a Creative Commons CC BY 4.0 license, which permit the free download, distribution, and reuse, provided that the author and preprint are cited in any reuse.
Prerpints.org logo

Preprints.org is a free preprint server supported by MDPI in Basel, Switzerland.

Subscribe

Disclaimer

Terms of Use

Privacy Policy

Privacy Settings

© 2025 MDPI (Basel, Switzerland) unless otherwise stated