
Submitted:
14 July 2025
Posted:
17 July 2025
You are already at the latest version
Abstract
Brassica napus L. (B. napus) is well known edible oil crop globally threatened by heavy metal pollution, particularly vanadium (V), which severely damaged plant growth, biomass accumulation, photosynthetic efficiency, and antioxidant defense by inducing oxidative stress. Melatonin (MT), a multifunctional phytohormone, has emerged as a potent regulator of plant responses to abiotic stress; however, its role in mitigating V-induced phytotoxicity remains largely unexplored in B. napus. In this study, we evaluated the physio-biochemical and transcriptomic responses of B. napus seedlings under V stress (100 mg L⁻¹) with or without MT supplementation (100 µM). MT treatment significantly reduced V uptake (~66.79%) and alleviated V-induced phenotypic and physiological damages, restoring biomass, water content, and photosynthetic pigment accumulation. Notably, MT enhanced chlorophyll fluorescence, gas exchange parameters, and ROS-scavenging by up-regulating antioxidant enzymes (SOD, POD, CAT, APX) and their corresponding genes. Transcriptomic analysis identified 1767 deferentially expressed genes (DEGs), with MT reversing V-down-regulated gene expression and promoting stress-responsive pathways. Weighted Gene Co-expression Network Analysis (WGCNA) revealed four key modules (turquoise, blue, brown, yellow), where gene expression was predominantly up-regulated in MT+V treatments. GO and KEGG enrichment highlighted MT-induced activation of pathways related to abiotic stress responses, including phenylpropanoid biosynthesis, flavonoid metabolism, and ROS detoxification. Notably, genes involved in flavonoid (PAL, FLS, CYP73A), lignin (PODs, CAD, COMT), and sinapine biosynthesis were significantly up-regulated by MT, correlating with reduced H₂O₂ accumulation and enhanced stress resilience. This study provides novel insights into the molecular and physiological mechanisms by which MT mitigates V toxicity in B. napus, underscoring its potential application in enhancing heavy metal stress tolerance in crops through sustainable bio-stimulant strategies.
Keywords:
abiotic stresses
; vanadium
; melatonin
; Brassica napus L.
; transcriptome
1. Introduction
The Brassica napus L., (B. napus) also known as rapeseed is an important crop belonging to the Brassicaceae family. B. napus is the major oil produce seed crop in China. China contributes for 20% of global B. napus production, with 7.5 million hectares of planting area, but the edible oil self-sufficiency rate is still < 40% [1,2]. Recently, different abiotic stresses such as heat, cold, drought, and heavy metals adversely affected B. napus production [3,4]. Heavy metal pollution continues to be the most transcendent agricultural and environmental issue of the 21st century [5,6]. Among them, Vanadium (V) remains the effective poisonous heavy metal that poses ascetic intimidation on both plants and humans [7]. The V is the fifth most plentiful trace element in the earth’s crust amid all the transitional elements mainly in the USA, South Africa, and China [8]. Worldwide, the V production is 57%, China is the largest producer and user of V which comprises around 26.5% of V-polluted soil in Southwest China [9,10]. It is reported that about 10 to 220 mg kg−1 amount of V is present in the earth’s crust, however higher in human-used soils that need reduction or elimination to not transfer further to plants and food chains used by humans and animals [11,12]. The V accumulation in plant various parts induces permanent alterations such as diminished photosynthetic activity, stomatal closer, suppressed enzymatic activities, leaf necrosis, and cellular structural damage, which ultimately reduces crop yield [13,14]. At 35 mg L−1 level of V in rice and 40 mg L−1 in tomato, the malondialdehyde (MDA) and hydrogen peroxide (H2O2) accumulation was uplifted noticeably, which in turn reduced the rice growth [8,13]. The enhanced V accumulation than the threshold level (40-55.8 mg L-1 causes a reduction in plant essential nutrient production thus damaging crop yield [4,15]. The V high-concentration hinders the physiological, phenotypic, and biochemical activities of plants hence reducing the plant growth and development, mostly due to reactive oxygen species (ROS) production, alteration in enzymatic activities, and gene expression [16]. The exogenous V application (40 and 80 mg L-1) significantly altered the root architecture and reduced the root and stem fresh weight and fruit production [6,15,17]. Similar results were obtained by [8] in chickpea (Cicer arietinum L.) at V 25 mg L-1 application. Plants have an essential nutrient known as phosphorus (P), and its lack can cause serious damage to metabolic, biochemical, and physiological processes. Nevertheless, both V and P are chemical analogs, and it is reported that V can significantly suppress the plants’ ability to absorb P [18] Furthermore, V causes weakness, diarrhea, nose bleeding, weight reduction, and vomiting in Humans [19]. Therefore, in plants, the controlling of V toxicity and accumulation needs much attention for healthier plant growth and human security.
Melatonin (MT, C13H16N2O2), also known as N-acetyl-5-methoxy-tryptamine, is an organic compound having low molecular weight and is commonly present in almost all living organisms from animals, bacteria, and plants [20,21,22]. MT was first identified in 1958 in cow’s pineal glands [23], however in plants, it was first discovered in 1995, later, different researchers reported its presence in different crops such as tomatoes, rice, and pepper also observed its presence in plant different parts such leaves, roots, flowers, stems, fruits and seeds, for instance, contain about 5 to 14500o pg g-1 based on fresh weight [24,25,26,27]. The physiological and biochemical properties of plants are significantly influenced by MT, such as gene and enzyme regulation related to growth initiation, germination, sucrose biosynthesis, germination, and uplifting crop production [24,28]. MT is involved in the regulation of many important processes i.e., plant growth, flowering, circadian rhythm, fruit ripening, mitotic spindle formation, lateral root formation, and regeneration of root [14,24,28]. Moreover, MT supports the plant’s total chlorophyll and carotenoids contents and revokes the chlorophyll deposition hence increasing the photosynthesis process, and regulating the sugar and nitrogen metabolism [24,29]. The MT also enhanced the photosynthetic capability by regulating the expression of PsaK, PsaG, PsaO, PsaH, PsaA, and PsaF genes in photo-system I, and PsbZ, PsbP, Psb28, PsbQ, PsbY, PsbE, and PsbO genes in photo-system II [30]. Moreover, MT is a significant anti-stress regulator and plant growth bio-stimulator, specifically under harsh eco-friendly situations, such as ultraviolet radiation, and different stresses like heavy metals, salt, water, cold, acid rain, drought, and heat stress [31,32,33,34].
This is the first-ever study about the ME defensive mechanism against V toxicity in B. napus in terms of plant growth and development, plant biomass, root architecture, minerals uptake, and chlorophyll contents. Besides physiological aspects, the current research is focused on the ME up regulated genes in response to V (100 mg L-1) toxicity through a comparative transcriptomic study. The study specifically aimed to investigate the mechanism of action of ME against V and represents valuable insights into maintaining B. napus growth and development by preparing stress-resilient B. napus genotypes through modern biotechnological techniques.
2. Results
2.1. B. napus Phenotype Attributes Under V Stress and MT Supplementation
The B. napus seedlings were subjected individuality to MT (100 µM), and V (100 mg L− 1). We observe that MT improved the phenotypic growth of the seedlings, inversely, V dramatically decreased the growth of the seedlings including root and shoot growth and leaf number as shown in Figure 1B. Further, when MT was applied simultaneously with V dose, then we observe that MT amendment quenched the V induced phytotoxic alteration and improved the phenotypic growth and seedlings biomass (whole plant weight) compared to uniform V stress (Figure 1B,C). Furthermore, the V deposition was reduced by MT (~66.79%) in the combined MTV treated seedlings as compared to V uniformly treated seedlings (Figure 1D). It means that MT can revoke the V uptake by roots and further to leaves, hence support plant growth and development.
2.2. Analyses of B. napus Seedlings Phenotypic Attributes
The V dose application made drastic changes in B. napus seedlings vegetative growth and developments. We observe that V application noticeably reduced the seedlings shoot length (SL) (70.29), shoot fresh weight (SFW) (50.34), shoot dry weight (SDW) (27.64), Root length (RL) (73.19), root fresh weight (RFW) (61.29), root dry weight (RDW) (51.37), root relative moisture water content (RRMC) (37.56), shoot relative moisture water content (SRMC) (66.17), and leaf relative moisture water content (LRMC) (47.90), as compare to CK (Figure 2A–I), while the MT amendment improved the seedlings SL (152.90), SFW (185.25), SDW (255.88), RL (156.26), RFW (175.98), RDW (219.33), RRMC (309.68), SRMC (198.54), and LRMC (197.87), as compared to uniformly V treated seedlings (Figure 2A–I). Some other important phenotypic parameters such like root, shoot, and leaf width, and leaf length analyses under V stress and MT supplementation were given in (Figure S4). The MT application markedly mitigates the V toxic effects and hence support the Brassica seedlings growth-related attributes (Figure 2A–I).
2.3. SPAD Index, Photosynthesis, and Leaf Gas Exchange Parameters
The chlorophyll pigments i.e., chlorophyll a (Chl a), chlorophyll b (Chl b), and carotenoids accumulation was uplifted by MT supplementation by 159.67%, 140.67%, and 150.81%, respectively, (Figure 3A–C), in the V induced seedlings, while Unsurprisingly, these pigment contents get reduced by V up to 59.23%, 61.00%, and 62.22%, respectively, as compared to CK (Figure 3A–C). In contrast, The MT mitigate the V induced toxic effects on plants chlorophyll pigments and improved chlorophyll contents. Besides this, the MT amendment improved the SPAD index by (220.33%), that was reduced by V exposure by 52.57% (Figure 3D). Furthermore, the V stress also reduced the leaf gas exchange parameters Pn, Ci, Gs, and Tr by 51.89%, 55.08%, 42.86%, and 59.74%, as compared to those brassica seedlings which have no stress (CK) , but the MT supplementation support these parameters by 45.47%, 41.97%, 47.88%, and 63.46%, respectively, as compared to V induce stress seedlings (Figure 3E–G). The chlorophyll fluorescence parameters i.e., Fo, Fv, Fm, Fv/Fm, and Fv/Fo were quantified in the MT, V, MTV, treated seedlings and CK as well (Figure S5). The results showed that the florescence parameters i.e., maximum quantum of PSII, Fv/Fm; was up-lifted by MT supplementation up to (145.81%), as compared to V stress seedlings, while on other hand these are reduced by V exposure by (61.20%), as compared to CK (Figure 3I).
2.4. Vanadium (V) Induced Oxidative Stress and Proline Accumulation
After seven days of V stress treatments the oxidative stress markers H2O2, and MDA were quantified in the fresh leaves of B. napus seedlings. For instance, in the V stressed seedlings, the H2O2, and MDA accumulations were increased significantly by 9.2 and 6.51-folds, respectively, compared with CK. Importantly, ME amendment decreased these levels by 5.3-, and 5.2-folds, respectively, as compared to MT and V combined applied seedlings (Figure 4A,B). Proline accumulation takes part in the scavenging of free radicals or reactive oxygen species (ROS) negative effects, as a result the proline accumulation is significantly increased in the presence of V stress by 15.11 folds, compared with CK, while MT amendment reduced the proline content by 5.2-folds, as compared to MT and V combined applied seedlings (Figure 4C), its mean that MT play a pivotal role in preventing oxidative stress and scavenge the free radicals.
2.5. Analyses of Antioxidant Enzymes and Genes Activities
The antioxidant enzymes accumulation in the leaves of B. napus seedlings were investigated spectro-photometrically to evaluate the possible role of MT on the antioxidant machinery against V. The antioxidant enzymes (SOD, POD, CAT, and APX)
accumulation was dramatically decreased by V up to (49.65%), (59.07%), (63.86%), and (55.34%), respectively, as compared to non treated plants (CK), while the MT amendment significantly uplift these accumulation by (329.16%), (266.69%), (247.21%), and (217.69%), respectively, as compared to only V stressed seedlings (Figure 5A–C).
In the said treatments, the RT-qPCR relative expression analyses of the linked genes of B. napus seedlings with the aforesaid antioxidant enzymes were investigated (Figure 5D–F). A significant decline was noticed in the expression of SOD, POD, CAT, and APX encoding genes BnSOD, BnPOD, BnCAT, and BnAPX, under V toxicity, as compared to the CK, while the MT supplementation enhanced the transcript level of these genes by 5.217, 7.979, 7.986, and 4.799- folds, respectively, as compare to uniform V stressed seedlings.
The concentration of MT and V were 100 µM Na2SiO3.9H2O and 100 mg L− 1, NH4VO3, respectively. Data represent as mean, n = 3, ± SD. The statistical significance of the data among different treatments is represented by different lower-case letters (a-c) at p ≤ 0.05, according to LSD test.
2.6. Transcriptome Assembly and Data Analyses Under V Stress and MT Supplementation
To reveal the mechanism of action and underlying transcriptional dynamics of MT amendment against V stress, gene expression analyses in CK, MT, V, and MTV treatments were analyzed via; transcriptome sequencing with three independent biological replicated. Overall, 12 cDNA libraries were constructed and were pooled to sequencing via; Illumina NovaSeq platform, yielding approximately ~649.353 raw reads, (Supplementary File S1). The RAW data uploading to NCBI database is in progress. After removing sequencing errors, ambiguous nucleotide, false sequences, and assessing the GC content distribution total of ~639.217994 clean reads were retained. On average, the clean reads had 97.65% (Q20), and 93.72% (Q30) scores, while a GC content of 40% recorded, which demonstrated the high quality of the sequencing data (Supplementary File S1). The filtered clean reads (~639 million) were mapped to the B. napus reference genome and after alignment the gene expression was measured to obtain raw counts for all genes across different samples.
2.7. Analyses of Deferentially Expressed Genes (DEGs) Under V Stress and MT Supplementation
To investigate the mechanism of action of MT mediated defence against V-induced stress in B. napus, the deferentially expressed genes (DEGs) were analyzed among MT, V, and MT + V (MTV) treatments as compared to healthy seedlings (CK), as shown in (Figure 6A). After alignment with the Brassica napus we get approximately 1767 DEGS. Further, we identified 741 (494 down-regulated, and 247 up-regulated), 789 (428 down-regulated, and 361 up-regulated), and 237 (80 down-regulated, and 157 up-regulated) genes in CK vs MT, CK vs V, and CK vs MTV, respectively. The prominent number of DEGs were expressed V stressed plants compared to CK, followed by MT, and MTV have least number of DEGs, means that Brassica activate many genes to cop the V stress. On the other hand, the decreasing levels of gene expression in MT uniform and in combination with V (MTV) demonstrates that MT plays prominent role in uplifting the immunity of seedlings against V stress, and mitigate V toxic effects by maintaining the gene level nearly resemble to CK gene expression levels. The total number of down-regulated DEGs (1002 DEGs) in all combinations was higher then the up-regulated genes (765 DEGs) (Figure 6A). The aforesaid mentioned DEGs expression among MT, V, and MTV compared to CK, respectively, were also represents in the form of expression heatmap (Figure 6B), and Volcanic representation (Figure 6C). Afterward, to explore specifically the number of DEGs in each treatment, and MT based DEGs against V stress we performed Venn diagram analyses of the DEGs, and here we found 12, 16, and 4 DEGs [(CK vs MT) vs (CK vs V)], [(CK vs V) vs (CK vs MTV)], and (CK vs MTV) vs (CK vs MT)], respectively, in up-regulated DEGs, while no commonly expressed gene was found (Figure 6D; up-regulated), and 43, 11, and 3 in down-regulated DEGs were found under the above mentioned treatments comparisons, respectively, while 5 common genes were expressed in these combinations (Figure 6D; down-regulated), and finally 57, 31 and 7 in up/down regulated DEGs were found under the above mentioned treatments comparisons, respectively, while 5 common genes were expressed in these combinations (Figure 6D; up/down regulated). In all comparisons the DEGs (up-down) number between MT and V was more (112 DEGs) as compared to V and MTV (58 DEGs), and MTV vs MT (14 DEGs) (Figure 6D). The expression of 5 commonly expressed genes in up and up/down regulated genes were same and their expression among all treatments was shown in (Figure 6E). The identified DEGs were subjected to further analysis.
2.8. Construction of Weighted Genes Correlation Network Analysis (WGCNA) and Identification of Key Modules
We performed WGCNA analyses to explore the key regulatory modules and gene clusters which are significantly associated with V stress mitigating role. The genes clustering dendo gram was constructed to find-out the key signature genes (Figure 7B). The customized threshold power and the scale-free topology index was set at 15 and 0.8, respectively for the analyses (Figure 7A). The hierarchical clustering with prominent topological overlapping genes were followed for identification of the top four expression network modules (turquoise, blue, brown, and yellow), beside this, twelve modules were created from the transcripts, and significant connected modules were found (Figure 7b). The overall expression of the total genes in all module were shown in (Figure 7C). As a result, 335 out of the 632 genes were linked with four modules (turquoise, blue, brown, and yellow) (Figure 7). The turquoise, blue, brown, and yellow modules contain 162, 59, 58, and 56 genes, respectively. Interestingly, the genes in all four modules i.e., turquoise, blue, brown, and yellow, were highly expressed in MT + V treatment, followed by MT, and V, respectively. The order of gene expression in all four modules was MTV>MT>V (Figure 7D–G). It means that MT significantly uplift the expression of key genes against heavy metal (V) toxicity.
2.9. GO and KEGG Enrichment Analyses of DEGs
The gene ontology (GO) enrichment analyses of the DEGs among MT, V, and MTV were proceeds and overall 44 significantly enriched GO terms (p < 0.05) were obtained, and were divided in to 3 functional categorizes: BP (Biological processes; 19), CC (Cellular components; 18), and MF (Molecular function; 7) (Supplementary File S2) (Figure 8A–C). The prominent GO terms in each category are shown in Figure 8. The highest number of GO terms “18” in all classes (BP, CC, MF) were obtained in the seedlings having both MT and V combined applications, whereas, “17” were obtained in the uniformly V stressed seedlings, and the least number of GO terms “9” were identified in MT supplemented seedlings (Figure 8). Notably, the BP category shows a prominent number of genes enriched in photosynthesis pathway, in response to stresses (biotic, abiotic, chemical, light, external and endogenous stimuli), carbohydrate metabolism (phenylpropanoid pathway, lipid metabolic process, flavonoid metabolic process, and so on) (Figure 8A–C). The number of genes involved in each pathway in all classes (BP, CC, and MF) were mentioned in (Figure 8D–F) under MT, V, and MTV treatment applications, respectively, where the highest am significantly expressed number of genes were obtained in MTV (Figure 8F) in response to chemical, biotic and abiotic stresses (Supplementary Files S2 and S3).
Majority of the genes in biological process were mostly categorized into response to stress (GO:0006950), response to stress abiotic stimulus (GO:0009605, GO:0009628), response to chemical (GO:0042221). In the cellular components category genes were grouped in membrane (GO:0016020), plasma membrane (GO:0005886), chloroplast (GO:0009507), and cell wall (GO:0005618), while in MF category gene were classified in catalytic activity (GO:0003824), transferase activity (GO:0016740), and transporter activity (GO:0005215) (Supplementary Files S2 and S3). From the entire analyses of GO and KEGG, interestingly, it is noticed that MT supports the heavy metal related pathway genes expression and hence supports the plant growth and development (Figure 8).
2.10. Genes Involved in Phenylpropanoid Pathway
In plants phenylpropanoid pathway is the key metabolic route for conversion of phenylalanine amino acid in to different significant secondary metabolites such as, flavonoids, lignins, and sinapines etc. These secondary metabolites play crucial role in different mechanism of plants against various stresses; biotic and abiotic, and hence play a pivotal role in plant growth and development [35,36]. All the 24 DEGs in the phenylpropanoid pathway are mainly involved in the said three metabolic pathways (flavonoids, lignins, and sinapines) and are significantly up-regulated by MT, V, or MTV, as shown in Figure 9 (Supplementary File S4).
2.10.1. Flavonoids Biosynthesis
Out of the 24 DEGs, 4 DEGs were involved in flavanol (quercitin, kaempherol, and myricetin) biosynthesis. In these 4 DEGs one was PAL, one was PTAL, 1 CYP73A, and 1 was FLS, all these genes were expressed highly significantly in M supplementation combined with V stress seedlings, means that MT significant up-regulate the expression of these genes to cop ROS production induced by V (Figure 9).
2.10.2. Liginin Biosynthesis
Beside the 3 commonly expressed DEGs with flavonoids biosynthesis (1-PAL, 1-PTAL, 1-CYP73A) 19 DEGs out total 24 DEGs were expressed in lignin (Hydrophenyllegnin, guaiacyl, and syringyl) biosynthesis under M, V, and MTV treatments, among these Six-CAD, eight-PODs, and one-COMT, were the genes involved in lignin biosynthesis. Majority CAD, POD, and one-COMT gene was significantly expressed by MT against V in the MTV treatment, while 2 POD (BnC01g0438850.1, BnC08g0875420.1), one CAD (BnC01g0437400.1), were significantly up-regulated in V stress seedlings (Figure 9).
2.10.3. Sinapine Biosynthesis
Seven DEGs were involved in sinapine biosynthesis pathway. Beside the 5 common DEGS (1-PAL, 1-PTAL, 2-CYP73A, and 1-COMT) with flavonoid and lignin biosynthesis pathways 2 DEGs; one-SCPL19, and one-BRT1 are separately expressed in this pathway, and one in these two (BnC04g0663490.1) expressed significantly under V stressed seedlings, and the other one (BnC01g0450190.1) were significantly up-regulated under MT applied treatments (Figure 9), (Supplementary File S4).
The expression of all DEGs involved in phenylpropanoid pathway was given in Figure S6.
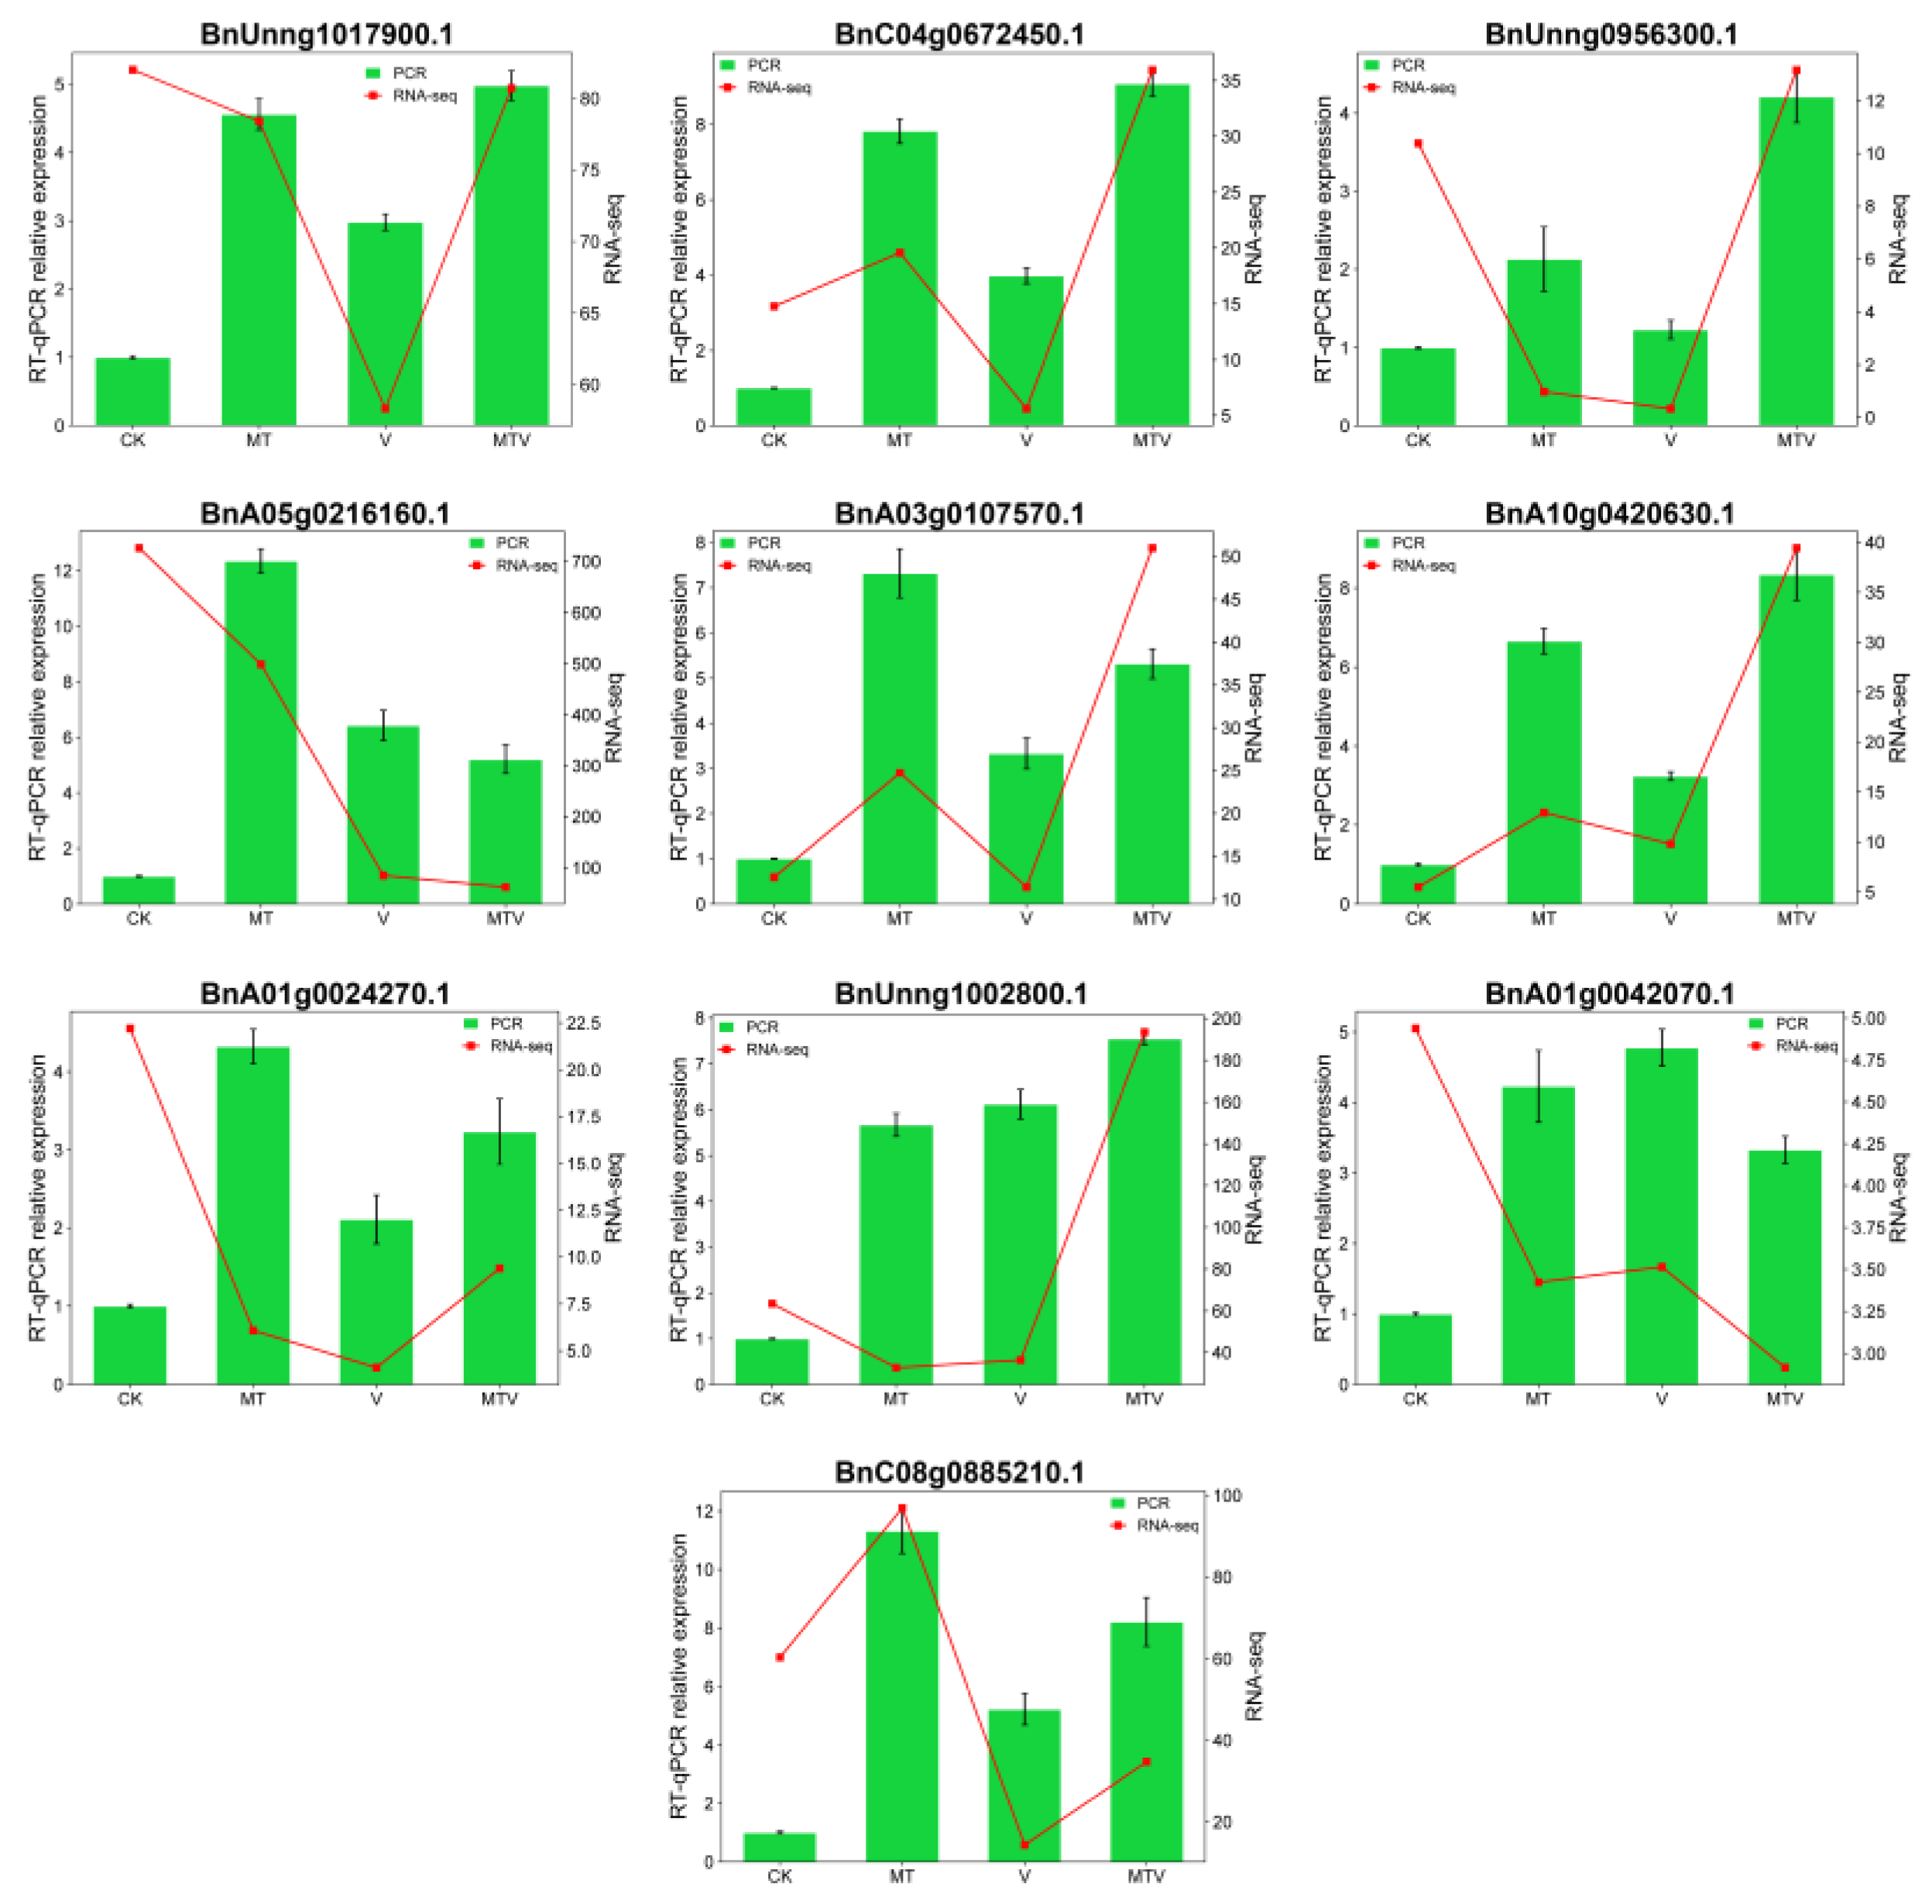
2.11. RT-qPCR Validation of RNA-Seq Data
To verify the reliability and authenticity of the RNA-seq data under the CK, MT, V, and MTV treatments, we randomly select 10 genes [BnUnng1017900.1 (WRKY), BnC04g0672450.1 (SOD), BnUnng0956300.1 (ChlBP), BnA05g0216160.1 (HSP), BnA03g0107570.1 (FB), BnA10g0420630.1 (FB), BnA01g0024270.1 (ChlBP), BnUnng1002800.1 (CAT), BnA01g0042070.1 (AMPK, CAT), and BnC08g0885210.1 (APX) from the DEGs for RT-qPCR analyses. A highly significant correlation was obtained between RNA-seq and RT-qPCR data, that shows revealing the significant positive correlation between RT-qPCR and RNA-seq data (Figure 10).
3. Discussion
The current research investigation aimed to explore the melatonin (MT) mediated defence mechanism in B. napus against vanadium (V) toxicity. Plants have the ability to naturally scavenge ROS damages induced by heavy metal stresses by improving their antioxidant machinery, but in case, if this system becomes weak, then supplementation of some exogenous compounds with signification antioxidant abilities can improve the defence system of the plants against different stress conditions [37]. MT is one of such exogenous compounds having significant antioxidant properties, and supports the plant immunity, uplift the stress resistance, act as a signaling molecule, and up-regulate the stress resistant genes and level of endogenous ME under stress environment Arnao and Hernández-Ruiz [25]. Moreover, different latest research publication suggest that MT play a prominent protective role against abiotic stresses in different plants such as kiwifruit [38], rubber tree [39], and tomato [40].
Prevention of V uptake by roots and from roots to upper parts is very important to keep crops safe from V induced toxicity. Our results showed that V accumulation severely damaged the brassica growth in term of plant biomass reduction (root, shoot and leaves), inversely MT supplementation can markedly improved the brassica growth and development (Figure 1B and Figure 3A–F). Majority of the published research reports suggest that heavy metals i.e., Ni, Cd, V stress in tomato and rice seedlings can inhibit the growth and biomass (root, shoot) production prominently, while MT supplementation can reinforced these growth traits [26,41].
Heavy metal toxicity exhibit diminution in photosynthetic activity, and directly damaged the photosynthetic system [42], lowered the CO2 exchange, [43,44], and can cause stomatal closure [45,46]. The plant growth have positive correlation with photosynthetic activity, if the photosynthesis rate of is high the plant growth will be better, vise-versa, and on the other hand the photosynthesis directly correlated with chlorophyll’s and carotenoids accumulation [47]. The high accumulation of V in B. napus can prominently decreased the Chlorophyll a, b, carotenoids, SPAD index, Pn, inter cellular CO2 concentration, Gs, Tr, and maximum quantum of PSII, Fv/Fm levels in the present investigation, Interestingly, ME supplementation can robustly improved the content of these photosynthetic pigments and parameters in B. napus seedlings (Figure 3A–I). Our results are aligned with the results outcome in various crops, including rice, mustard, and chickpea [7,8,48,49], where V accumulation decreased and MT can increased the photosynthetic pigments and parameters level significantly. The results revealed that MT successfully mitigate the V toxicity by supporting the photosynthetic machinery, and hence improve the B. napus seedlings growth (Figure 1B).
Plants when subjected to heavy metal stresses can experience different metabolic disorders, and can cause ROS overproduction and oxidative stress, which inversely can damage the membrane, cellular components (DNA, proteins, lipids etc), and finally cause cell death [13,50,51]. In the present study the V dose dramatically enhanced the oxidative stress markers; H2O2, MDA, and Proline (Figure 4A–C). Enhanced accumulation of these chemicals induced oxidative damage in B. napus seedlings, which is resembled with mustard and rice results [7,48]. On the other hand MT significantly can reduced these stress marker accumulation (Figure 4A–C). Our study results are affirmed with the previous results of MT mediated reduction in ROS, MDA and proline accumulation in C. cathayensis [52], Moringa oleifera [53], Peach fruit [54], Citrullus lanatus [55], Cucumis sativus [56], and Stevia rebaudiana [57] under variuos environmental stimuli. Thus, our results showed that MT reduce the oxidative damage, and balanced the membrane damage, and ROS production caused by V toxicity.
After overproduction of ROS induce by heavy abiotic stresses, the plant release the antioxidant enzyme to scavenge these free radicals [58]. MT is recognized as well known universal antioxidant [59], because it can support the plants antioxidant defence machinery and detoxify the ROS accumulation [60]. In the present work MT noticeably enhanced the accumulation of antioxidant enzymes (SOD, POD, CAT, and APX) and their relative genes expression (Figure 5A–H). Our results are aligned with outcomes of the previous researcher in different plants, where MT can successfully up-regulate the antioxidant enzymes activities under abiotic stresses [52,61,62].
To explore the possible mechanism of action of MT against V toxicity in B. napus, we performed the RNA-seq analyses among all CK, MT, V, and MTV treated seedlings. Our results showed that MT significantly mitigate the V toxicity by regulating different genes. The analyses of up/down DEGs through Venn diagram (Figure 6D) represents 5 common genes under CK, MT, V , and MTV treatments, among these five DEGs 2 genes were significantly up-regulated by MT (Figure 6E). During the WGCNA analyses the DEGs represented by signification four modules i.e., turquoise, blue, brown, and yellow. Interestingly majority of these DEGs in the four modules were up-regulated by MT uniformly and in combination with V stress, while down-regulated by V toxicity (Figure 7D–G). The results revealed that MT on molecular level mitigate the V toxicity. The GO analyses explore that the stress responsive genes were mainly up-regulated by MT (Figure 8) (Supplementary Files S2 and S3).
Interestingly, in KEGG analyses, the DEGs in phenylpropanoid pathways were significantly up-regulated by MT (Figure 9). Flovonoids are involved in diverse processes with significant roles, such like plant flavonoids have been involved in diverse processes, such as plant-microbe interactions, pigmentation, development, redox and UV protection, and regulation of auxin transport, etc. [63,64,65,66]. Most importantly, flavonoids, as vital antioxidants, can scavenge the ROS generation induced by stresses in plants [67,68]. In consistent with, higher H2O2 accumulation in V-treatment and reduced H2O2 accumulation in M treatment, the expressions of four genes in flavonoids synthesis i.e., 2PAL, CYP73A, and FLS etc., were significantly uplifted by MT and down-regulated by V which is significantly enriched in KEGG pathway (Figure 9). Our research outcomes indicate that MT possibly mitigate V toxicity B. napus seedlings i.e., reducing H2O2 concentration, and ROS production by regulating the genes involved in flavonoids biosynthesis. Many DEGs involved in lignin and sinapine biosynthesis were significantly up-regulated by MT supplementation, while down regulated by V toxicity (Figure 9). In summary, the V stress can cause oxidative stress and increase the ROS production, also reduced the photosynthesis pigments accumulation, while on the other hand the MT supports the plant growth and mitigate the toxic effect of V toxicity.
should discuss the results and how they can be interpreted from the perspective of previous studies and of the working hypotheses. The findings and their implications should be discussed in the broadest context possible. Future research directions may also be highlighted.
4. Materials and Methods
4.1. Experimental Setup and Growing Conditions
In the present research work the B. napus genotype XiZiYuan (XZY) were used. The seeds were provided by Pr. Liu Pingwu of Sanya Nanfan Research Institute of Hainan University, Haikou, China. Initially before sowing the seeds were sterilized by soaking 15 mints in NaClO [(Sodium hypochlorite, 0.5% (v/v)], followed by thorough rinsing five times with deionized water. About 30 seeds for each treatment were placed in petri plates having wet filter paper with deionised water to maintain the moisture level for seeds germination. The plates were then shifted to a growth chamber having controlled growth environment with darkness, having relative humidity (RH) 75%, at 20 oC. After 5 days of germination the uniform seedlings were shifted to the black hydroponic plastic pots (with 8.5 cm height, and 10 and 7 cm top and bottom diameter, respectively) enriched with Hoagland Solution (HS) [69], (pH 5.6 ± 0.1)]. The HS was replenished every 5 days until 4 leaf stage i.e., 20 days after shifting to black pot during which the plants were allowed to get adapted with the enriched HS hydroponic system. The growth conditions inside the growth chamber was maintained as, day/night (16L/8D hrs), RH 75% ± 1%, temperature (23-28 ± 1 oC), and for light period the photon flux density were maintained at 820 µmol m-2s-1.
the MT treatment concentration was selected from the previously conducted study [70], while for V dose we applied 4 different V concentration i.e., 25, 50, 75, 100 mg L-1, at 4 leaf stage for 7 days to assess that at which level V maximum reduce the growth and development of the seedlings. After 7 days of the treatment we observe maximum decline in growth of the seedlings with V (100 mg L-1) application as compared to others (Figures 1 and S1), thus we finalized of V (100 mg L-1) for the current investigation. The selection was made based on declination of plant biomass (Figure S1).
The current experiment comprised of 4 treatments, (i) Control (CK) with only water application; (ii) Melatonin (MT, C13H16N2O2) with an amendment of MT (100 µM); (iii) Vanadium (VNH4VO3) with an amendment of V (100 mg L-1); and (iv) MT + V (MTV) with combined MT and V dose applications. The above treatments were supplied for 7 days at 4 leaf stage i.e., 20 days after shifting to black pots as shown in Figure 1 A. After 7 days of doses applications the phenotype of agronomic traits along with chlorophyll pigments were recorded, and for further analyses of transcriptomic, molecular, and biochemical activities the roots and shoots were separately stored at -80℃.
4.2. Measurement of V Accumulation
4.3. Plant Biomass and Relative Water Contents (RWCs) Parameters
The plant biomass i.e whole plant (Fresh weight), while root and shoot fresh and dry weight were measured by using 3, 3 uniformly growing seedlings for each treatment. After fresh weight determination the roots and shoots immediately placed inside the oven for 20 minutes at 105 oC. The root and shoot length was measured by using Vernier Caliper.
Here is the formula used for measuring leaf, root, and shoot RWCs:
where, fw = fresh weight, tw = turgid weight (re-hydrated weight of samples for 24 hrs) or SW = saturated weight in water, and dw = dry weight. [72].
RWC % = [(fw – dw) / (tw - dw)] x 100,
4.4. Leaf Pigments, Chlorophyll Florescence, and Gassious Exchange Parameters
The methodology of [73] was followed for chlorophyll pigments a, b, and total carotenoids quantification’s. Briefly, the leaves of B. napus were ground 95% ethanol (v/v) along with calcium carbonate and quartz salt, followed by dark period for 5 minutes, dilute the solution up to 25 ml using 95% ethanol (v/v). and the OD reading was taken at 663, 645, and 470 nm for Chl a, Chl b, and carotenoids (Caro), respectively, by using a Spectrophotometer (Lambda 25 UV/VIS), and the activity was calculated using the [74] formula.
Chla = 12.72 A663 - 2.5A 645,
Chlb = 22.88 A 645 - 4.67 A663
Caroc = (1000 A470 - 3.27 Ca - 104 Cb) / 229
Where, Chla; is chlorophyll a, Chlb; is chlorophyll b, and Caroc; is carotenoids.
The B. napus upper fully expanded leaves were used for chlorophyll florescence measurement i.e., Fo, Fv, Fm, and Fv / Fm (Maximum quantum of PSII) using a mini-PAM (miniaturized pulse amplitude–modulated photosynthesis yield analyzer; Walz, GmbH, Effeltrich, Germany). The formulas of [75] were used for florescence calculation. The leaves were kept in dark overnight to maintain dark adaptation.
The portable photosynthesis apparatus (LiCor-6400 LICOR Inc., Lincoln, NE, USA) was used to record various photosynthetic parameters including, net photosynthetic rate (Pn), transpiration rate (Tr), stomatal conductance (Gs), and inter-cellular CO2 concentration (Ci). These investigations were performed in the morning from 9 to 11 am, with control measuring chamber conditions to maintain 800 µM m-2 s-1 photosynthetic photon-flux density, 360 µM mol-1 CO2 concentration, and 22 ± 1 oC leaf temperature.
4.5. Quantification of Oxidative Stress Markers; MDA, H2O2, and Proline
The fresh leaf of B. napus seedlings about 0.1 g from each treatment and CK was used for estimation of oxidative stress marker i.e., MDA, H2O2, and proline. The leaves were grounded to fine powder with the help of mortar and pestle using liquid nitrogen. The stress markers were quantified from the supernatant having total soluble proteins and was extracted using 100 mM PBS buffer (900 µL, pH 7.4), followed by the guidelines given in the kits provided by Jiancheng Bioengineering Institute, Nanjing, Jiangsu, China, for MDA (A003-3-1), H2O2 (A064-5-1), and proline (A107-1-1). The OD absorption values were taken at wavelength of 405nm, 560nm, and 520nm, respectively, by using Lambda 25 UV/VIS Spectro-photometer, PerkinElmer, USA and was calculated recording to the formula given in the kits.
4.6. Determination of Antioxidant Enzyme Accumulation
The 1 g liquid nitrogen based crushed leaves of treatments as well as CK (three biological repeats) were separately homogenized in PBS buffer (1 mL, pH 7.4), and centrifuged for 15 minutes at 10,000 rpm and 4 oC temperature [160]. After centrifugation the supernatant was used for further analyses. Furthermore, the accumulation of SOD, POD, CAT, and APX, in the B. napus leaves were assessed by following the methodology given in A001-4-1, A084-3-1, A007-1-1, and A123-1-1, at wavelength of 550, 420, 405, and 290 nm, respectively, by using Lambda 25 UV/VIS Spectro-photometer, PerkinElmer, USA and was calculated recording to the formula given in the kits.
4.7. RNA Extraction, Library Construction and RNA-Seq
The total RNA extraction was performed using “RNAprep Pure Plant Kit (TIANGEN) kit” methodology. The extracted RNA purity and quality was checked by 1 % agarose gel electrophoresis, and a Nanodrop®spectrophotomete (Implen, CA, USA). The enzyme DNase-1 was used to remove the genomic DNA contamination, and to get the perspective amount of cDNA following protocols of kit (QuantiTect Reverse Transcription Kit). The RNA sequencing libraries were generated using NEBNext Ultra RNA Library Prep Kit for Illumina (NEB, USA, Catalog #: E7530L) following manufacturer’s recommendations, and the Novogene personalized library construction methodology (Figure S2). The qualified libraries were pooled for RNA-Seq using the Illumina NovaSeq 6000 S4 kit components in Beijing Novogene Bio-informatics Technology Co., Ltd. China.
4.8. RNA-Seq Data Processing, De Novo Transcriptome Assembly, and Functional Annotation
The reliability and quality of the sequenced data was determined by using fastp (version .23.1) [76], following the recommended methodology of Novogene transcriptome assembly (Figure S3). Further the obtained clean reads were compared with the reference genome [77] by using HISAT2 (2.0.5) software (Kim et al. 2019) to get the reads alignment detail on the reference genome, that will further used to count the gene reads in the B. napus genome database [77], (BnIR, Brassica napus multi-omics database (information resource). The DESeq2 (v1.20.0) software was used for DEGs analyses and for normalization of the raw read counts. The genes expression quantification’s were performed based on FPKM (fragments per kilobase of transcript per million mapped reads) values [78]. The transcript assembly was obtained by using StringTie software [79].
The GO (Gene ontology), and KEGG (Kyoto Encyclopedia of Genes and Genomes) pathway analyses were performed based on deferentially expressed gene sets via; online platform; SRPLOT (SRplot - Science and Research online plot). Gene enrichment analysis (GSEA) was conducted on the GO, KEGG, and additional datasets based on the significantly up-regulated and down-regulated genes of B. napus species. The significantly enriched GO terms were determine at p-value cutoff of at <0.05.
4.9. Genes Co-Expression Network Analysis
The weighted gene co-expression network analysis (WGCNA) co-expression network analysis was carried out using online platform iDEP 1.1 (iDEP.96),[80].
4.10. Quantitative Real-Time PCR Analysis
The cDNA synthesis were obtained by following Vazyme HiScript II Q RT SuperMix Kit (Vazyme, China) methodology. The RT-qPCR was performed on 96-well plates following methodology of [81], and the kit protocol “ChamQTM SYBR RT-qPCR Master Mix (Vazyme Biotech Co, Ltd., China)”, and the readings were taken at Lightcycler 96/Lightcycler480Real-timeSystem (Rochediagnostic,UK). The primers used in the present research investigation are given in Supplementary File S1. The formula 2−ΔΔCT, developed by [82], were used for relative expression.
4.11. Statistical Analysis
The statistical analysis was performed using SPSS version 22.0 (IBM Corporation, Armonk, NY, USA). One-way analysis of variance (ANOVA) was completed, and the treatment means were compared using the LSD (least significant difference) test (at p ≤ 0.05). The graphs were made with GraphPad prism 8, and SRplot (SRplot - Science and Research online plot).
5. Conclusions
Melatonin (MT) a well known antioxidant agent, has several prominent roles in different plants, however this is the first ever study to explore the possible functions of MT against Vanadium (V) toxicity in B. napus L. by modifying many molecular and physio-biochemical processes. MT can inhibit the uptake of V to control the V accumulation to not exceed to a toxic level. Our results demonstrate that MT significantly mitigate the ROS production induced by V toxicity, and interestingly uplift plant biomass, photosynthesis system, antioxidant enzymes and genes expression and combat against V-phytotoxic effects. The transcriptomic analyses shown that the antioxidant system protection was carried out by exogenous melatonin supplementation through regulating the genes engaged in ROS metabolism, photosynthesis, phenylalanin, flavonoids, lignin, and sinapine biosynthesis. The WGCNA analyses showed the key DEGs in various modules (turquoise, blue, brown, and yellow) and their expression which was significantly up-regulated by MT against V toxicity. These findings concludes that MT can enhance V stress tolerance directly or indirectly by scavenging the H2O2 accumulation in B. napus plant. Our findings are useful not only for understanding MT role in V stress toxicity, but also for gaining new insights into the possible use of MT against abiotic stresses in the B. napus crop.
Author Contributions
L.P. and L.U.K. conceived and designed this project. L.U.K. performed the analyses. L.U.K. carried out the experiments and wrote the original draft manuscript. L.U.K., O.U.S. and E.M handling the seedlings and stresses management. L.U.K and M.W. analyses and validation. L.P. and L.U.K. checked and revised the manuscript. L.P and M.W. supervision. L.P. funding acquisition. All authors have read and agreed to the published version of the manuscript.
Funding
This work was supported by grants from the Special Project for the Academician Team Innovation Center of Hainan Province (grant number: YSPTZX202206), the Key Research Program of Hainan Province (grant number: ZDYF2022XDNY185), and grants from The National Natural Science Foundation of China (NSFC) Research Fund for International Young Scientists (grant number: 32250410291).
Data Availability Statement
The original contributions presented in the study are included in the article/Supplementary Materials, further inquiries can be directed to the corresponding author.
Acknowledgments
The authors would like to express their gratitude to all the participants who took part in this study.
Conflicts of Interest
The authors declare no conflict of interest.
References
- Wang, D., Chen, Q., Chen, W., Guo, Q., Xia, Y., Wang, S., ... & Liang, G. (2021). Physiological and transcription analyses reveal the regulatory mechanism of melatonin in inducing drought resistance in loquat (Eriobotrya japonica Lindl.) seedlings. Environmental and Experimental Botany, 181, 104291. [CrossRef]
- Hussain, M. A., Huang, Y., Luo, D., Mehmood, S. S., Raza, A., Duan, L., ... & Lv, Y. (2025). Integrative analyses reveal Bna-miR397a–BnaLAC2 as a potential modulator of low-temperature adaptability in Brassica napus L. Plant Biotechnology Journal, 23(6), 1968-1987. [CrossRef]
- Ahmed, W.; Xia, Y.; Li, R.; Bai, G.; Siddique, K.H.M.; Guo, P. Non-Coding RNAs: Functional Roles in the Regulation of Stress Response in Brassica Crops. Genomics 2020, 112, 1419–1424. [CrossRef]
- Chinnusamy, V. Molecular Genetic Perspectives on Cross-Talk and Specificity in Abiotic Stress Signalling in Plants. Journal of Experimental Botany 2003, 55, 225–236. [CrossRef]
- Zaman, Q. U., Garg, V., Raza, A., Nazir, M. F., Hui, L., Khan, D., ... & Varshney, R. K. (2024). Unique regulatory network of dragon fruit simultaneously mitigates the effect of vanadium pollutant and environmental factors. Physiologia plantarum, 176(4), e14416. [CrossRef]
- Altaf, M. A., Shahid, R., Ren, M. X., Altaf, M. M., Jahan, M. S., & Khan, L. U. (2021). Melatonin mitigates nickel toxicity by improving nutrient uptake fluxes, root architecture system, photosynthesis, and antioxidant potential in tomato seedling. Journal of Soil Science and Plant Nutrition, 21(3), 1842-1855. [CrossRef]
- Imtiaz, M., Mushtaq, M. A., Nawaz, M. A., Ashraf, M., Rizwan, M. S., Mehmood, S., ... & Coleman, M. D. (2018). Physiological and anthocyanin biosynthesis genes response induced by vanadium stress in mustard genotypes with distinct photosynthetic activity. Environmental Toxicology and Pharmacology, 62, 20-29. [CrossRef]
- Imtiaz, M., Mushtaq, M. A., Rizwan, M. S., Arif, M. S., Yousaf, B., Ashraf, M., ... & Tu, S. (2016). Comparison of antioxidant enzyme activities and DNA damage in chickpea (Cicer arietinum L.) genotypes exposed to vanadium. Environmental Science and Pollution Research, 23(19), 19787-19796. [CrossRef]
- Wang, H. Z. (2018). New-demand oriented oilseed rape industry developing strategy. Chinese Journal of Oil Crop Sciences, 40(5), 613-617.
- Chen, L., Zhu, Y. Y., Luo, H. Q., & Yang, J. Y. (2020). Characteristic of adsorption, desorption, and co-transport of vanadium on humic acid colloid. Ecotoxicology and Environmental Safety, 190, 110087. [CrossRef]
- Wu, Z. Z., Zhang, Y. X., Yang, J. Y., Zhou, Y., & Wang, C. Q. (2021). Effect of vanadium on testa, seed germination, and subsequent seedling growth of alfalfa (Medicago sativa L.). Journal of Plant Growth Regulation, 40(4), 1566-1578. [CrossRef]
- Imtiaz, M., Rizwan, M. S., Xiong, S., Li, H., Ashraf, M., Shahzad, S. M., ... & Tu, S. (2015). Vanadium, recent advancements and research prospects: A review. Environment international, 80, 79-88. [CrossRef]
- Altaf, M. M., Diao, X. P., Altaf, M. A., ur Rehman, A., Shakoor, A., Khan, L. U., ... & Ahmad, P. (2022). Silicon-mediated metabolic upregulation of ascorbate glutathione (AsA-GSH) and glyoxalase reduces the toxic effects of vanadium in rice. Journal of Hazardous Materials, 436, 129145. [CrossRef]
- Altaf, M. A., Shahid, R., Ren, M. X., Khan, L. U., Altaf, M. M., Jahan, M. S., ... & Shahid, M. A. (2022). Protective mechanisms of melatonin against vanadium phytotoxicity in tomato seedlings: insights into nutritional status, photosynthesis, root architecture system, and antioxidant machinery. Journal of Plant Growth Regulation, 41(8), 3300-3316. [CrossRef]
- Aihemaiti, A., Jiang, J., Gao, Y., Meng, Y., Zou, Q., Yang, M., ... & Tuerhong, T. (2019). The effect of vanadium on essential element uptake of Setaria viridis’ seedlings. Journal of Environmental Management, 237, 399-407. [CrossRef]
- Wu, Z. Z., Yang, J. Y., Zhang, Y. X., Wang, C. Q., Guo, S. S., & Yu, Y. Q. (2021). Growth responses, accumulation, translocation and distribution of vanadium in tobacco and its potential in phytoremediation. Ecotoxicology and Environmental Safety, 207, 111297. [CrossRef]
- Vachirapatama, N., Jirakiattikul, Y., Dicinoski, G., Townsend, A. T., & Haddad, P. R. (2011). Effect of vanadium on plant growth and its accumulation in plant tissues. Sonklanakarin Journal of Science and Technology, 33(3), 255.
- Imtiaz, M., Rizwan, M. S., Mushtaq, M. A., Yousaf, B., Ashraf, M., Ali, M., ... & Tu, S. (2017). Interactive effects of vanadium and phosphorus on their uptake, growth and heat shock proteins in chickpea genotypes under hydroponic conditions. Environmental and Experimental Botany, 134, 72-81. [CrossRef]
- Ghosh, S. K., Saha, R., & Saha, B. (2015). Toxicity of inorganic vanadium compounds. Research on Chemical Intermediates, 41(7), 4873-4897. [CrossRef]
- Khan, D., Yang, X., He, G., Khan, R. A. A., Usman, B., Hui, L., ... & Wang, H. F. (2024). Comparative physiological and transcriptomics profiling provides integrated insight into melatonin mediated salt and copper stress tolerance in Selenicereus undatus L. Plants, 13(24), 3602. [CrossRef]
- Bose, S. K., & Howlader, P. (2020). Melatonin plays multifunctional role in horticultural crops against environmental stresses: A review. Environmental and experimental botany, 176, 104063. [CrossRef]
- Pan, Y., Xu, X., Li, L., Sun, Q., Wang, Q., Huang, H., ... & Zhang, J. (2023). Melatonin-mediated development and abiotic stress tolerance in plants. Frontiers in Plant Science, 14, 1100827. [CrossRef]
- Lerner, A. B., Case, J. D., Takahashi, Y., Lee, T. H., & Mori, W. (1958). Isolation of melatonin, the pineal gland factor that lightens melanocyteS1. Journal of the american chemical society, 80(10), 2587-2587.
- Niazi Khogeh, M., Rezaei, M., & Ghasimi Hagh, Z. (2022). Effect of salicylic acid and melatonin on chlorophyll fluorescence and initial growth of greenhouse tomatoes in salinity stress. Journal of Plant Production Research, 29(2), 265-282.
- Arnao, M. B., & Hernández-Ruiz, J. (2019). Melatonin: a new plant hormone and/or a plant master regulator?. Trends in Plant Science, 24(1), 38-48. [CrossRef]
- Altaf, M. A., Shahid, R., Ren, M. X., Altaf, M. M., Khan, L. U., Shahid, S., & Jahan, M. S. (2021). Melatonin alleviates salt damage in tomato seedling: A root architecture system, photosynthetic capacity, ion homeostasis, and antioxidant enzymes analysis. Scientia Horticulturae, 285, 110145. [CrossRef]
- Yan, F., Wei, H., Ding, Y., Li, W., Liu, Z., Chen, L., ... & Li, G. (2021). Melatonin regulates antioxidant strategy in response to continuous salt stress in rice seedlings. Plant Physiology and Biochemistry, 165, 239-250. [CrossRef]
- Zhao, G., Zhao, Y., Yu, X., Kiprotich, F., Han, H., Guan, R., ... & Shen, W. (2018). Nitric oxide is required for melatonin-enhanced tolerance against salinity stress in rapeseed (Brassica napus L.) seedlings. International Journal of Molecular Sciences, 19(7), 1912. [CrossRef]
- Siddiqui, M. H., Alamri, S., Al-Khaishany, M. Y., Khan, M. N., Al-Amri, A., Ali, H. M., ... & Alsahli, A. A. (2019). Exogenous melatonin counteracts NaCl-induced damage by regulating the antioxidant system, proline and carbohydrates metabolism in tomato seedlings. International Journal of Molecular Sciences, 20(2), 353. [CrossRef]
- Wei, W., Li, Q. T., Chu, Y. N., Reiter, R. J., Yu, X. M., Zhu, D. H., ... & Chen, S. Y. (2015). Melatonin enhances plant growth and abiotic stress tolerance in soybean plants. Journal of experimental botany, 66(3), 695-707. [CrossRef]
- Jia, C., Yu, X., Zhang, M., Liu, Z., Zou, P., Ma, J., & Xu, Y. (2020). Application of melatonin-enhanced tolerance to high-temperature stress in cherry radish (Raphanus sativus L. var. radculus pers). Journal of Plant Growth Regulation, 39(2), 631-640. [CrossRef]
- Tiwari, R. K., Lal, M. K., Kumar, R., Chourasia, K. N., Naga, K. C., Kumar, D., ... & Zinta, G. (2021). Mechanistic insights on melatonin-mediated drought stress mitigation in plants. Physiologia Plantarum, 172(2), 1212-1226. [CrossRef]
- Kaya, C., Okant, M., Ugurlar, F., Alyemeni, M. N., Ashraf, M., & Ahmad, P. (2019). Melatonin-mediated nitric oxide improves tolerance to cadmium toxicity by reducing oxidative stress in wheat plants. Chemosphere, 225, 627-638. [CrossRef]
- Debnath, B., Sikdar, A., Islam, S., Hasan, K., Li, M., & Qiu, D. (2021). Physiological and molecular responses to acid rain stress in plants and the impact of melatonin, glutathione and silicon in the amendment of plant acid rain stress. Molecules, 26(4), 862. [CrossRef]
- Hahlbrock, K., & Scheel, D. (1989). Physiology and molecular biology of phenylpropanoid metabolism. Annual review of plant physiology and plant molecular biology, 40(1), 347-369. [CrossRef]
- Fraser, C. M., & Chapple, C. (2011). The phenylpropanoid pathway in Arabidopsis. The Arabidopsis Book/American Society of Plant Biologists, 9, e0152.
- Nawaz, M. A., Huang, Y., Bie, Z., Ahmed, W., Reiter, R. J., Niu, M., & Hameed, S. (2016). Melatonin: current status and future perspectives in plant science. Frontiers in plant science, 6, 1230. [CrossRef]
- Xia, H., Ni, Z., Hu, R., Lin, L., Deng, H., Wang, J., ... & Liang, D. (2020). Melatonin alleviates drought stress by a non-enzymatic and enzymatic antioxidative system in kiwifruit seedlings. International journal of molecular sciences, 21(3), 852. [CrossRef]
- Yang, H., Dai, L., Wei, Y., Deng, Z., & Li, D. (2020). Melatonin enhances salt stress tolerance in rubber tree (Hevea brasiliensis) seedlings. Industrial crops and products, 145, 111990. [CrossRef]
- Altaf, M. A., Shahid, R., Ren, M. X., Naz, S., Altaf, M. M., Khan, L. U., ... & Ahmad, P. (2022). Melatonin improves drought stress tolerance of tomato by modulating plant growth, root architecture, photosynthesis, and antioxidant defense system. Antioxidants, 11(2), 309. [CrossRef]
- Jahan, M. S., Guo, S., Sun, J., Shu, S., Wang, Y., Abou El-Yazied, A., ... & Hasan, M. M. (2021). Melatonin-mediated photosynthetic performance of tomato seedlings under high-temperature stress. Plant Physiology and Biochemistry, 167, 309-320. [CrossRef]
- Zaid, A., Mohammad, F., Wani, S. H., & Siddique, K. M. (2019). Salicylic acid enhances nickel stress tolerance by up-regulating antioxidant defense and glyoxalase systems in mustard plants. Ecotoxicology and environmental safety, 180, 575-587. [CrossRef]
- Rahman, S. U., Li, Y., Hussain, S., Hussain, B., Khan, W. U. D., Riaz, L., ... & Cheng, H. (2023). Role of phytohormones in heavy metal tolerance in plants: A review. Ecological Indicators, 146, 109844. [CrossRef]
- Rezayian, M.; Niknam, V.; Ebrahimzadeh, H. Effects of Drought Stress on the Seedling Growth, Development, and Metabolic Activity in Different Cultivars of Canola. Soil Science and Plant Nutrition 2018, 64, 360–369. [CrossRef]
- He, W. Y., Liao, W., Yang, J. Y., Jeyakumar, P., & Anderson, C. (2020). Removal of vanadium from aquatic environment using phosphoric acid modified rice straw. Bioremediation Journal, 24(1), 80-89. [CrossRef]
- Mir, A. R., Pichtel, J., & Hayat, S. (2021). Copper: uptake, toxicity and tolerance in plants and management of Cu-contaminated soil. Biometals, 34(4), 737-759. [CrossRef]
- Jahan, M. S., Wang, Y., Shu, S., Zhong, M., Chen, Z., Wu, J., ... & Guo, S. (2019). Exogenous salicylic acid increases the heat tolerance in Tomato (Solanum lycopersicum L) by enhancing photosynthesis efficiency and improving antioxidant defense system through scavenging of reactive oxygen species. Scientia Horticulturae, 247, 421-429. [CrossRef]
- Altaf, M. M., Diao, X. P., Wang, H., Khan, L. U., Rehman, A. U., Shakoor, A., ... & Farooq, T. H. (2022). Salicylic acid induces vanadium stress tolerance in rice by regulating the AsA-GSH cycle and glyoxalase system. Journal of Soil Science and Plant Nutrition, 22(2), 1983-1999. [CrossRef]
- Cheng, W., Luo, A., Li, H., Chen, Z., Guan, Z., Escalona, V. H., ... & Yu, X. (2025). Variation in nutritional qualities and antioxidant capacity of different leaf mustard cultivars. Horticulturae, 11(1), 59. [CrossRef]
- Hodzic, E., Galijasevic, S., Balaban, M., Rekanovic, S., Makic, H., Kukavica, B., & Mihajlovic, D. (2021). The protective role of melatonin under heavy metal-induced stress in Melissa Officinalis L. Turkish journal of chemistry, 45(3), 737-748. [CrossRef]
- Zhang, T., Wang, Y., Ma, X., Ouyang, Z., Deng, L., Shen, S., ... & Sun, K. (2022). Melatonin alleviates copper toxicity via improving ROS metabolism and antioxidant defense response in tomato seedlings. Antioxidants, 11(4), 758. [CrossRef]
- Sharma, A., Wang, J., Xu, D., Tao, S., Chong, S., Yan, D., ... & Zheng, B. (2020). Melatonin regulates the functional components of photosynthesis, antioxidant system, gene expression, and metabolic pathways to induce drought resistance in grafted Carya cathayensis plants. Science of the Total Environment, 713, 136675. [CrossRef]
- Sadak, M. S., Abdalla, A. M., Abd Elhamid, E. M., & Ezzo, M. I. (2020). Role of melatonin in improving growth, yield quantity and quality of Moringa oleifera L. plant under drought stress. Bulletin of the National Research Centre, 44(1), 18. [CrossRef]
- Gao, H., Zhang, Z. K., Chai, H. K., Cheng, N., Yang, Y., Wang, D. N., ... & Cao, W. (2016). Melatonin treatment delays postharvest senescence and regulates reactive oxygen species metabolism in peach fruit. Postharvest Biology and Technology, 118, 103-110. [CrossRef]
- Nawaz, M. A., Jiao, Y., Chen, C., Shireen, F., Zheng, Z., Imtiaz, M., ... & Huang, Y. (2018). Melatonin pretreatment improves vanadium stress tolerance of watermelon seedlings by reducing vanadium concentration in the leaves and regulating melatonin biosynthesis and antioxidant-related gene expression. Journal of Plant Physiology, 220, 115-127. [CrossRef]
- Zhang, T., Shi, Z., Zhang, X., Zheng, S., Wang, J., & Mo, J. (2020). Alleviating effects of exogenous melatonin on salt stress in cucumber. Scientia Horticulturae, 262, 109070. [CrossRef]
- Simlat, M., Ptak, A., Skrzypek, E., Warchoł, M., Morańska, E., & Piórkowska, E. (2018). Melatonin significantly influences seed germination and seedling growth of Stevia rebaudiana Bertoni. PeerJ, 6, e5009. [CrossRef]
- Mittler, R. (2017). ROS are good. Trends in plant science, 22(1), 11-19.
- Ahammed, G. J., Xu, W., Liu, A., & Chen, S. (2019). Endogenous melatonin deficiency aggravates high temperature-induced oxidative stress in Solanum lycopersicum L. Environmental and Experimental Botany, 161, 303-311. [CrossRef]
- Arnao, M. B., & Hernández-Ruiz, J. (2015). Functions of melatonin in plants: a review. Journal of pineal research, 59(2), 133-150. [CrossRef]
- Takahashi, S., & Murata, N. (2008). How do environmental stresses accelerate photoinhibition?. Trends in plant science, 13(4), 178-182. [CrossRef]
- Zahedi, S. M., Hosseini, M. S., Abadía, J., & Marjani, M. (2020). Melatonin foliar sprays elicit salinity stress tolerance and enhance fruit yield and quality in strawberry (Fragaria× ananassa Duch.). Plant Physiology and Biochemistry, 149, 313-323. [CrossRef]
- Kuhn, B. M., Geisler, M., Bigler, L., & Ringli, C. (2011). Flavonols accumulate asymmetrically and affect auxin transport in Arabidopsis. Plant Physiology, 156(2), 585-595. [CrossRef]
- Peer, W. A., Blakeslee, J. J., Yang, H., & Murphy, A. S. (2011). Seven things we think we know about auxin transport. Molecular plant, 4(3), 487-504. [CrossRef]
- Buer, C. S., Kordbacheh, F., Truong, T. T., Hocart, C. H., & Djordjevic, M. A. (2013). Alteration of flavonoid accumulation patterns in transparent testa mutants disturbs auxin transport, gravity responses, and imparts long-term effects on root and shoot architecture. Planta, 238(1), 171-189. [CrossRef]
- Ishihara, H., Tohge, T., Viehöver, P., Fernie, A. R., Weisshaar, B., & Stracke, R. (2016). Natural variation in flavonol accumulation in Arabidopsis is determined by the flavonol glucosyltransferase BGLU6. Journal of experimental botany, 67(5), 1505-1517. [CrossRef]
- Mouradov, A., & Spangenberg, G. (2014). Flavonoids: a metabolic network mediating plants adaptation to their real estate. Frontiers in plant science, 5, 620. [CrossRef]
- Yang, H., Dai, L., Wei, Y., Deng, Z., & Li, D. (2020). Melatonin enhances salt stress tolerance in rubber tree (Hevea brasiliensis) seedlings. Industrial crops and products, 145, 111990. [CrossRef]
- Arnon, D. I., & Hoagland, D. R. (1944). The investigation of plant nutrition by artificial culture methods. Biological Reviews, 19(2), 55-67. [CrossRef]
- Sami, A., Shah, F. A., Abdullah, M., Zhou, X., Yan, Y., Zhu, Z., & Zhou, K. (2020). Melatonin mitigates cadmium and aluminium toxicity through modulation of antioxidant potential in Brassica napus L. Plant Biology, 22(4), 679-690. [CrossRef]
- Hou, M., Hu, C., Xiong, L., Lu, C., 2013. Tissue accumulation and subcellular distribution of vanadium in Brassica juncea and Brassica chinensis. Microchemical Journal. 110, 575–578. [CrossRef]
- Sengupta, M., Chakraborty, A., & Raychaudhuri, S. S. (2013). Ionizing radiation induced changes in phenotype, photosynthetic pigments and free polyamine levels in Vigna radiata (L.) Wilczek. Applied Radiation and Isotopes, 75, 44-49. [CrossRef]
- Lichtenthaler, H. K. (1987). [34] Chlorophylls and carotenoids: pigments of photosynthetic biomembranes. In Methods in enzymology (Vol. 148, pp. 350-382). Academic Press. [CrossRef]
- Wellburn, A. R. (1994). The spectral determination of chlorophylls a and b, as well as total carotenoids, using various solvents with spectrophotometers of different resolution. Journal of plant physiology, 144(3), 307-313. [CrossRef]
- Schreiber, U. S. C. H. L. I. W. A., Schliwa, U., & Bilger, W. (1986). Continuous recording of photochemical and non-photochemical chlorophyll fluorescence quenching with a new type of modulation fluorometer. Photosynthesis research, 10(1), 51-62. [CrossRef]
- Chen, Y., Chen, Y., Shi, C., Huang, Z., Zhang, Y., Li, S., ... & Chen, Q. (2018). SOAPnuke: a MapReduce acceleration-supported software for integrated quality control and preprocessing of high-throughput sequencing data. Gigascience, 7(1), gix120. [CrossRef]
- Yang, Z., Wang, S., Wei, L., Huang, Y., Liu, D., Jia, Y., ... & Yang, Q. Y. (2023). BnIR: A multi-omics database with various tools for Brassica napus research and breeding. Molecular Plant, 16(4), 775-789. [CrossRef]
- Zhao, Y., Li, M. C., Konaté, M. M., Chen, L., Das, B., Karlovich, C., ... & McShane, L. M. (2021). TPM, FPKM, or normalized counts? A comparative study of quantification measures for the analysis of RNA-seq data from the NCI patient-derived models repository. Journal of translational medicine, 19(1), 269. [CrossRef]
- Pertea, M., Pertea, G. M., Antonescu, C. M., Chang, T. C., Mendell, J. T., & Salzberg, S. L. (2015). StringTie enables improved reconstruction of a transcriptome from RNA-seq reads. Nature biotechnology, 33(3), 290-295. [CrossRef]
- Ge, S. X., Son, E. W., & Yao, R. (2018). iDEP: an integrated web application for differential expression and pathway analysis of RNA-Seq data. BMC bioinformatics, 19(1), 534. [CrossRef]
- Khan, L. U., Cao, X., Zhao, R., Tan, H., Xing, Z., & Huang, X. (2022). Effect of temperature on yellow leaf disease symptoms and its associated areca palm velarivirus 1 titer in areca palm (Areca catechu L.). Frontiers in Plant Science, 13, 1023386. [CrossRef]
- Livak, K. J., & Schmittgen, T. D. (2001). Analysis of relative gene expression data using real-time quantitative PCR and the 2− ΔΔCT method. methods, 25(4), 402-408.
Figure 1.
Influence of MT, V, and combined MTV on B. napus seedlings (A). Diagrammatical representation of the treatments combination and methodology followed for the current investigation (B). Phenotypes of the B. napus shoots and roots at the 7th day of doses application (CK, MT, V, MTV) (C). Plant biomass, and (D). V quantification under V and MTV applications. The concentration of MT and V were 100 µM Na2SiO3.9H2O and 100 mg L− 1, NH4VO3, respectively. Data represent as mean, n = 3, ± SD. The statistical significance of the data among different treatments is represented by different lower-case letters, at p ≤ 0.05, according to LSD test.
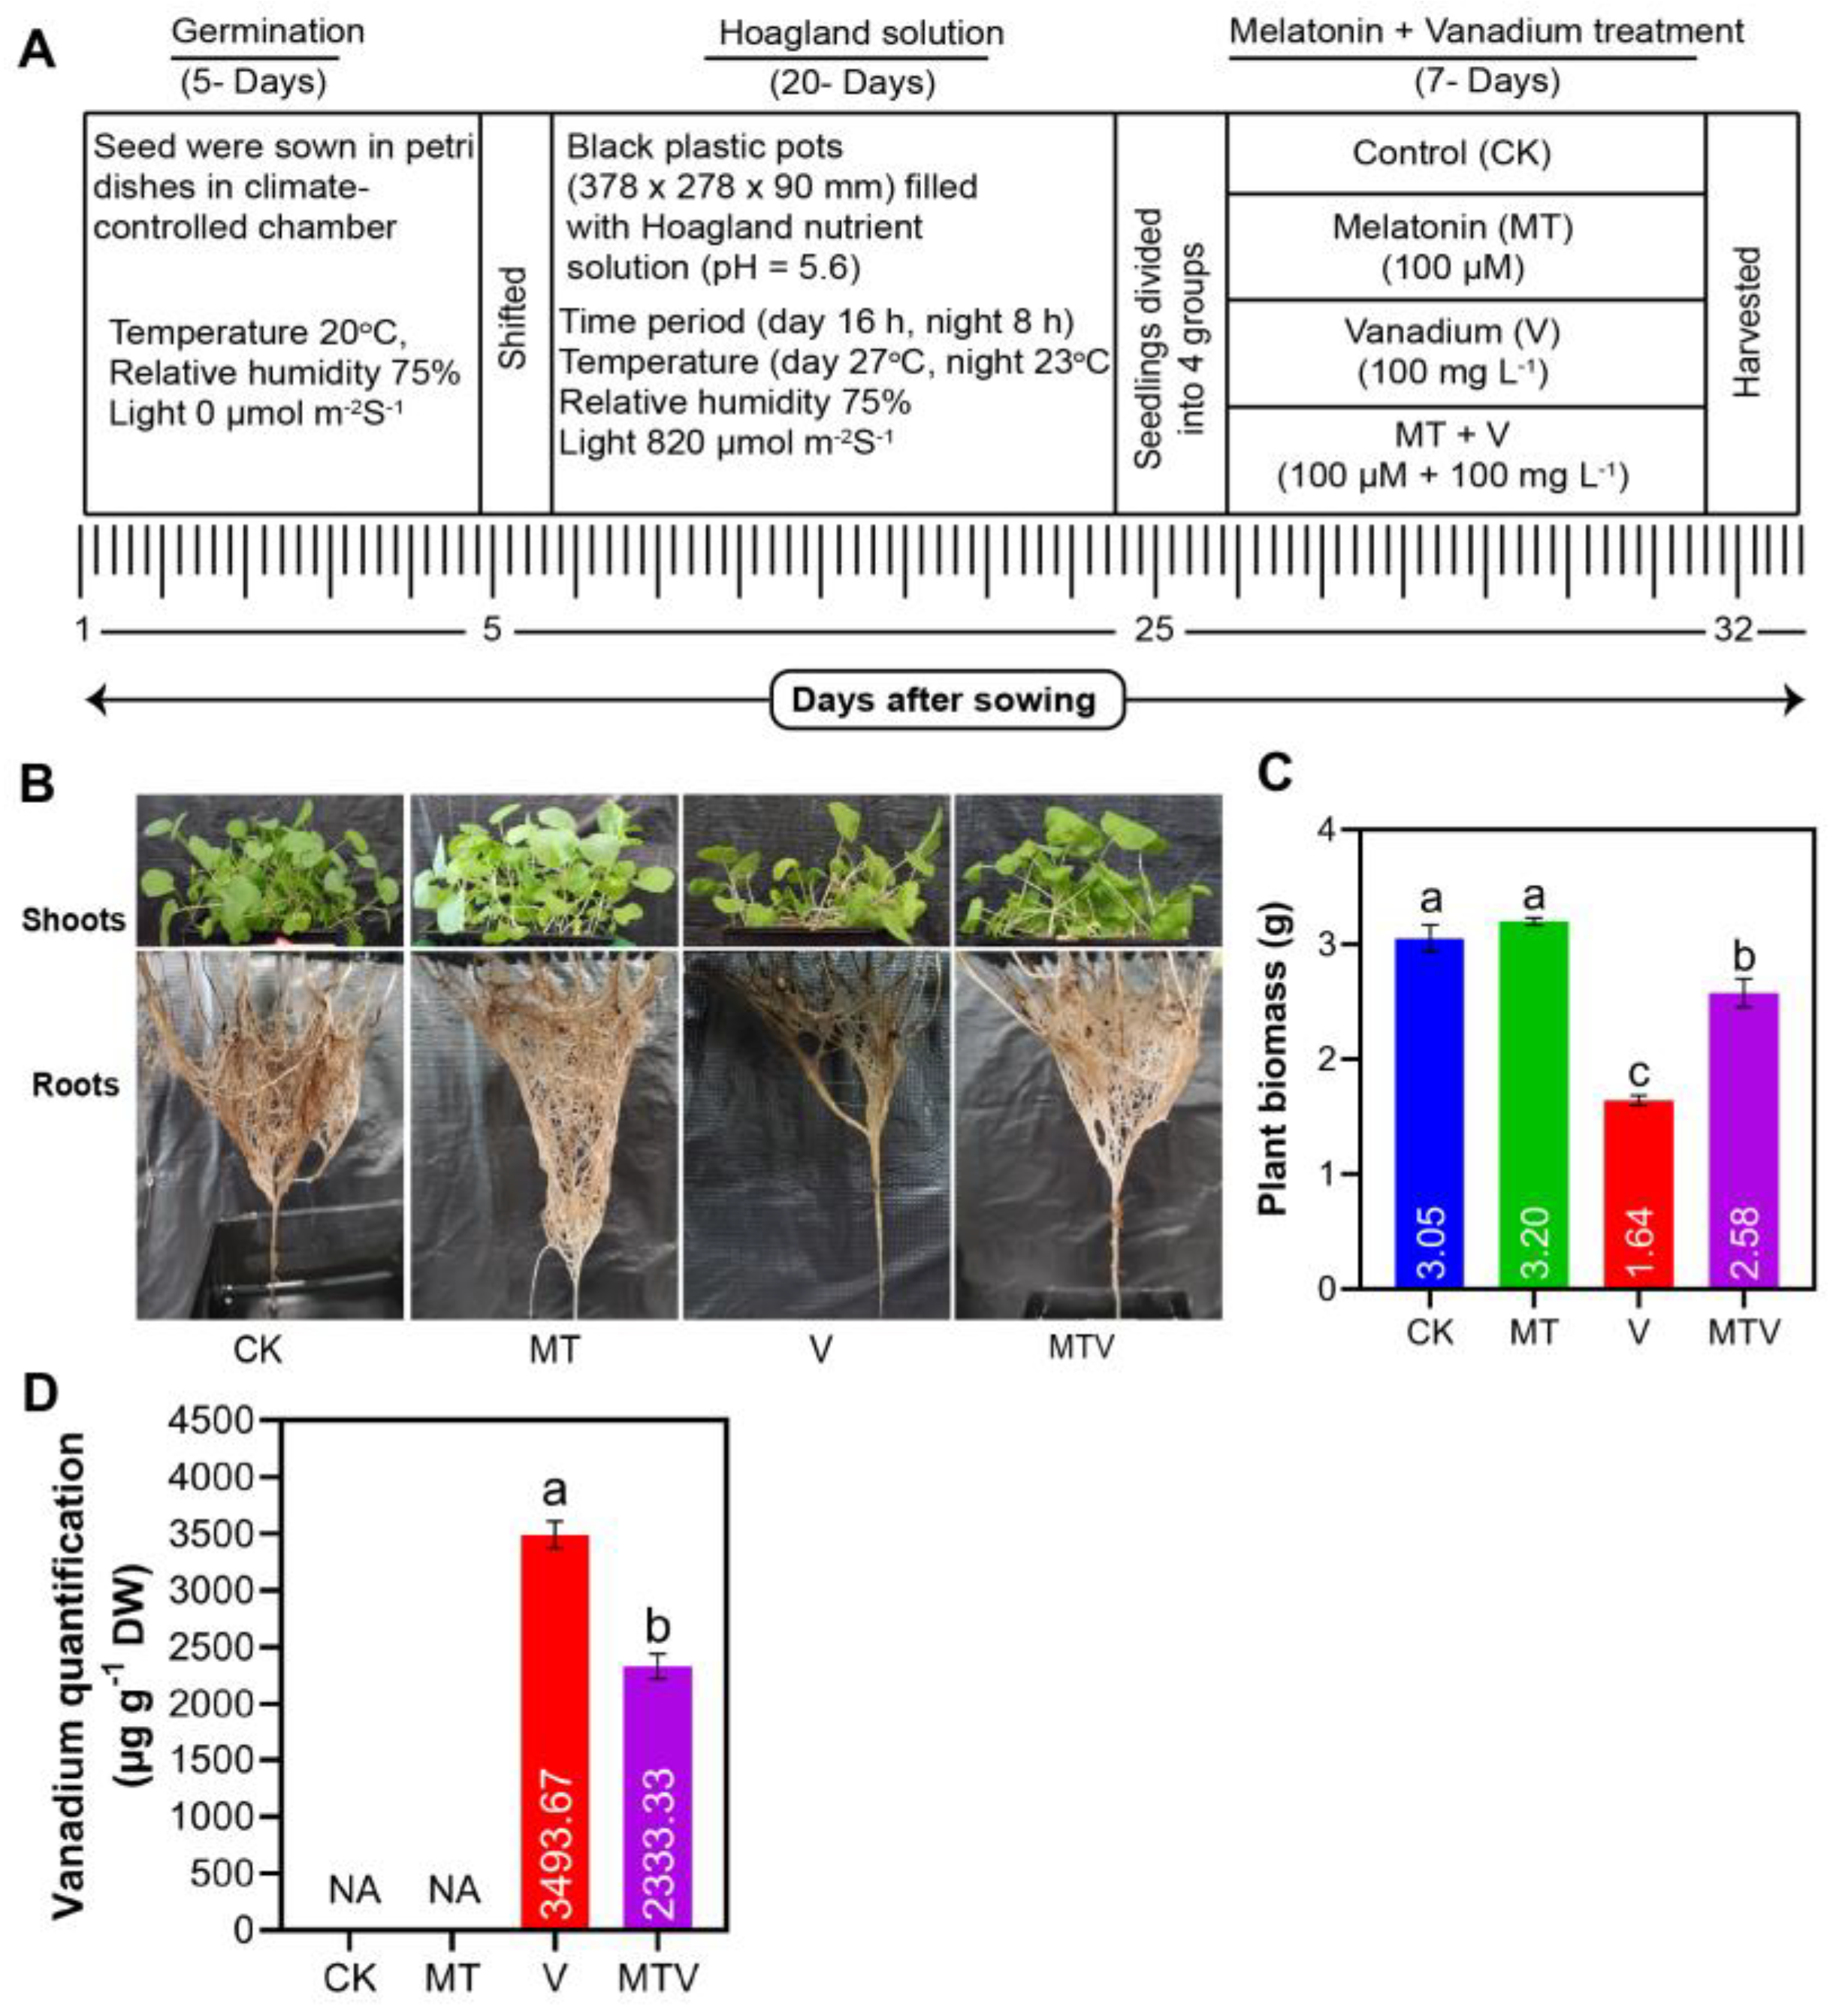
Figure 2.
Effect of Melatonin (MT) application on shoot length (A). shoot fresh weight (B). shoot dry weight (C). Root length (D). root fresh weight (E). root dry weight (F). root relative moisture water content (G), shoot relative moisture water content (H), and leaf relative moisture water content (I). The concentration of MT and V were 100 µM Na2SiO3.9H2O and 100 mg L− 1, NH4VO3, respectively. Data represent as mean, n = 3, ± SD. The statistical significance of the data among different treatments is represented by different lower-case letters, at p ≤ 0.05, according to LSD test.
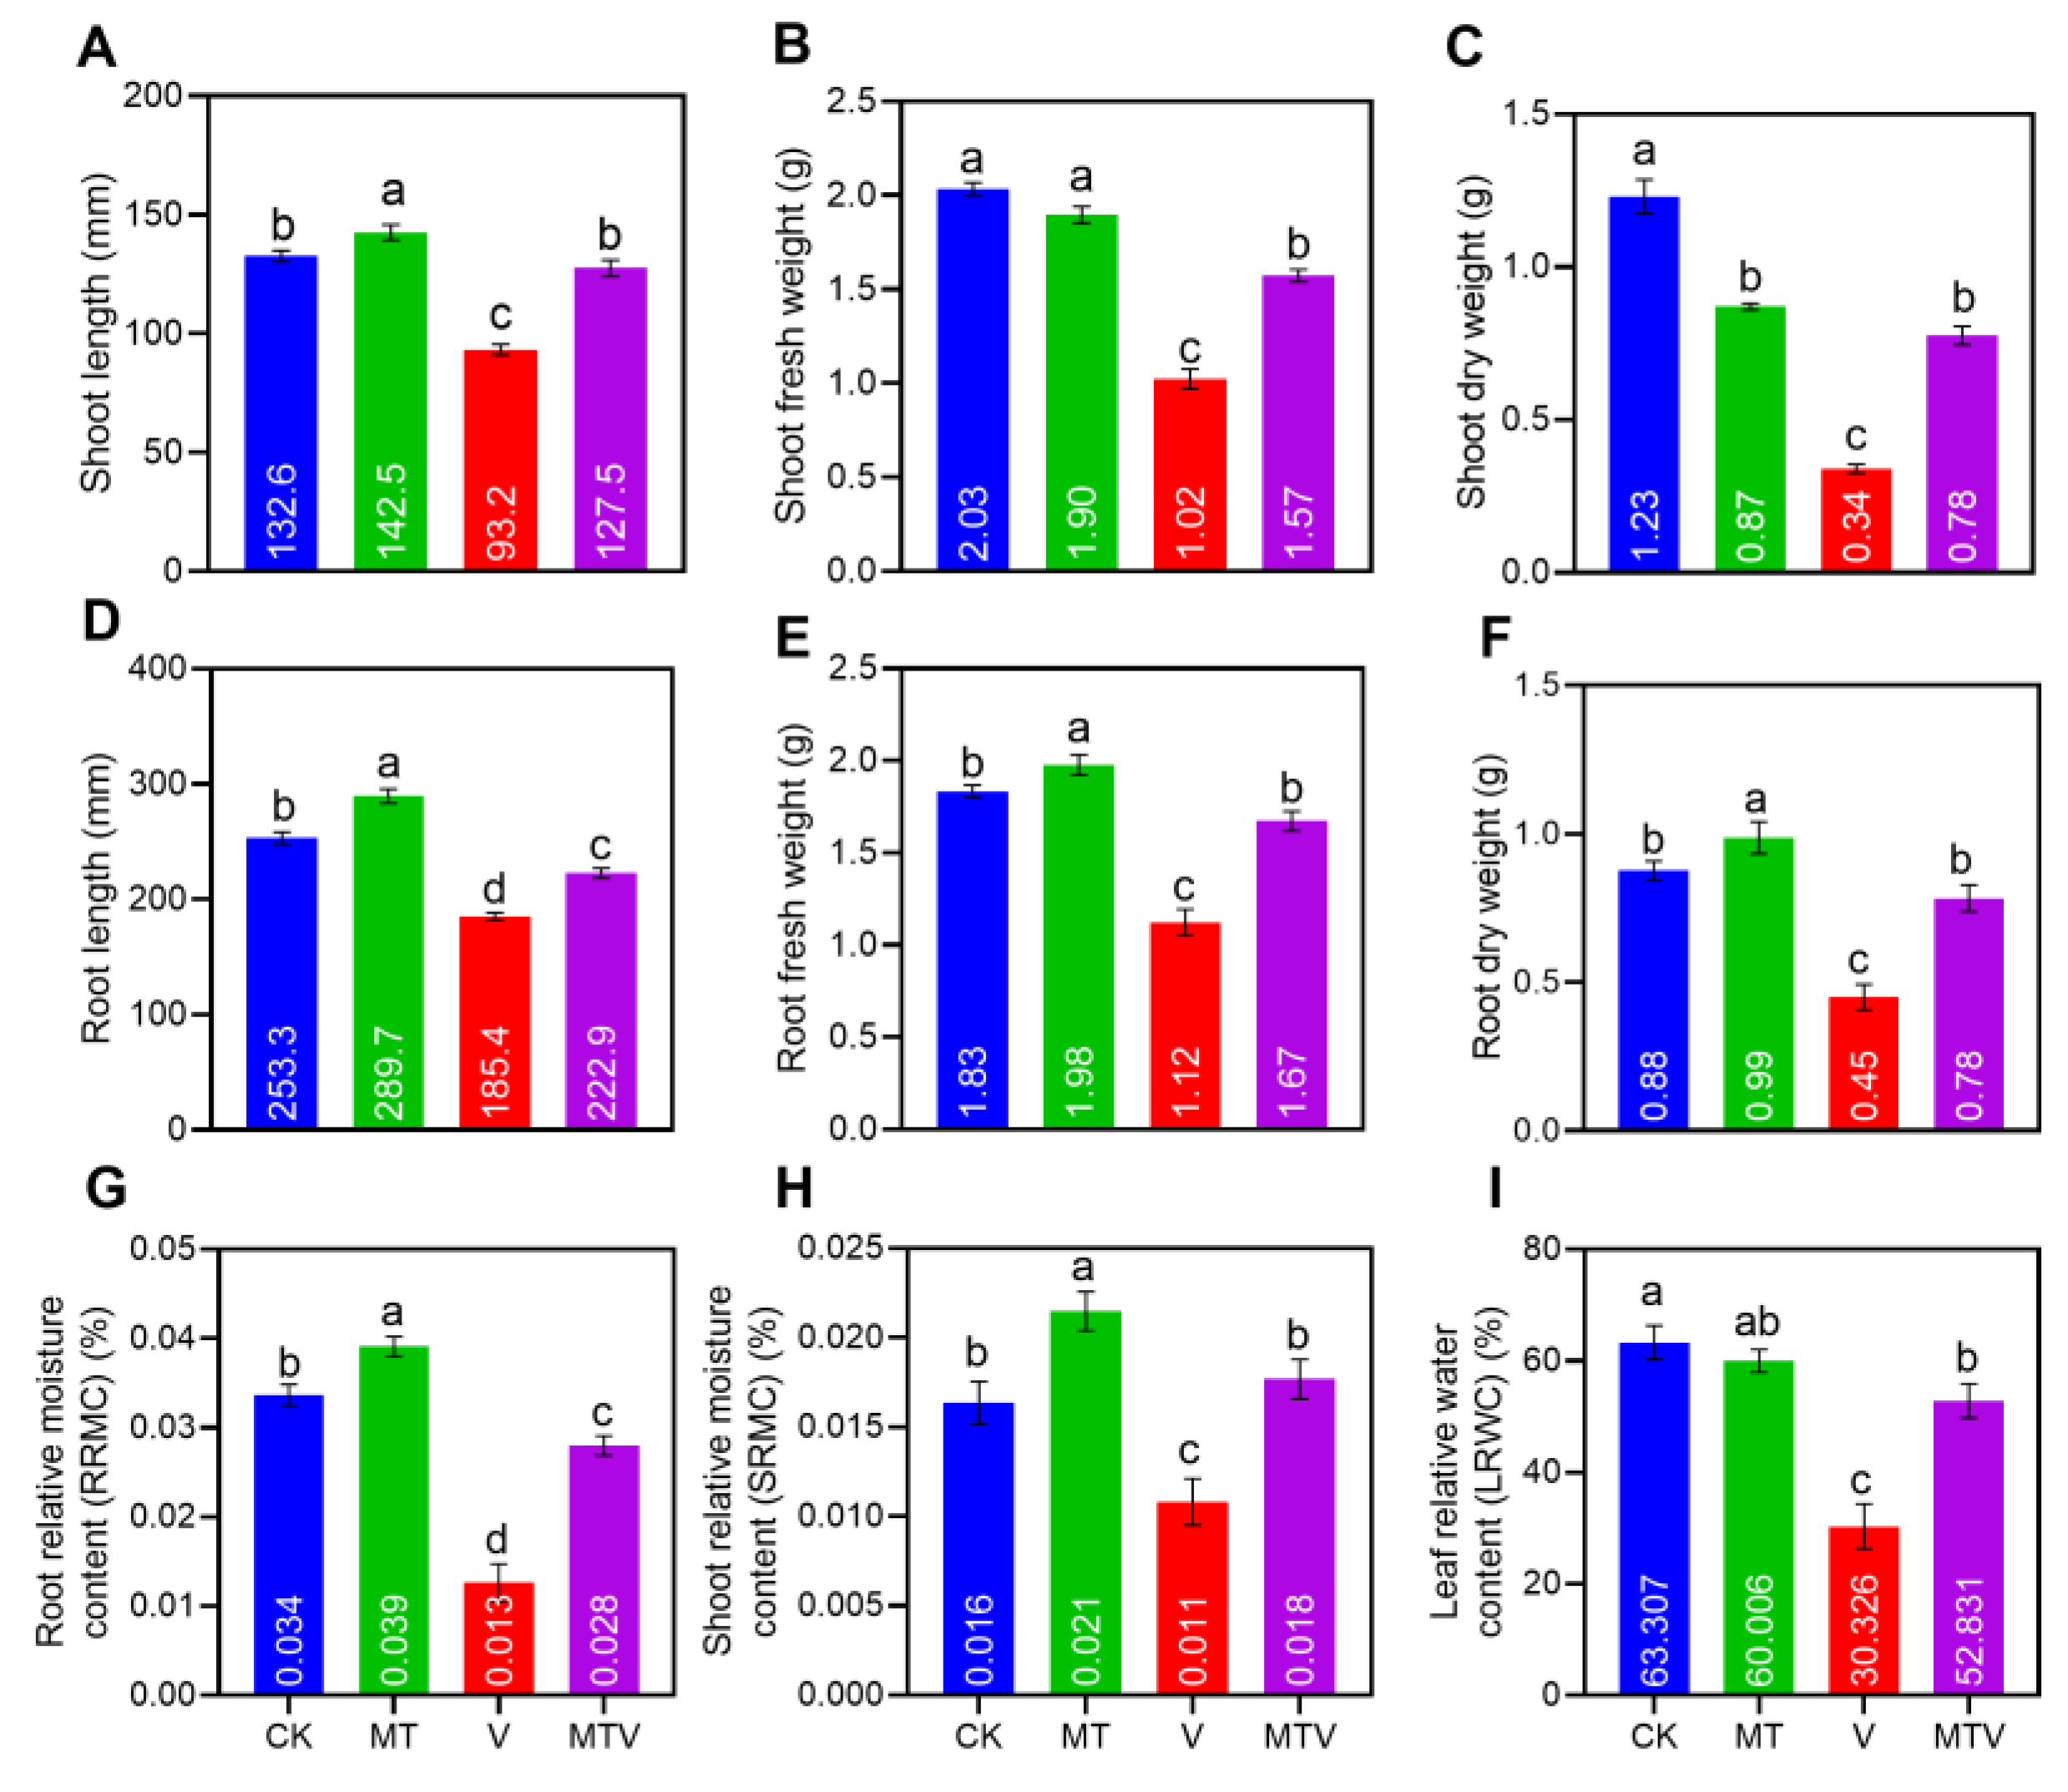
Figure 3.
Melatonin (MT) supplementation uplift chlorophyll pigments; chlorophyll a (A). chlorophyll b (B). carotenoids (C). SPAD index (D). and promote leaf gas exchange parameters; Pn (E). Ci (F). Gs (G). and Tr (H). also promote the maximum quantum of PSII, Fv/Fm (I), of B. napus seedlings under V stress. The concentration of MT and V were 100 µM Na2SiO3.9H2O and 100 mg L− 1, NH4VO3, respectively. Data represent as mean, n = 3, ± SD. The statistical significance of the data among different treatments is represented by different lower-case letters, at p ≤ 0.05, according to LSD test.
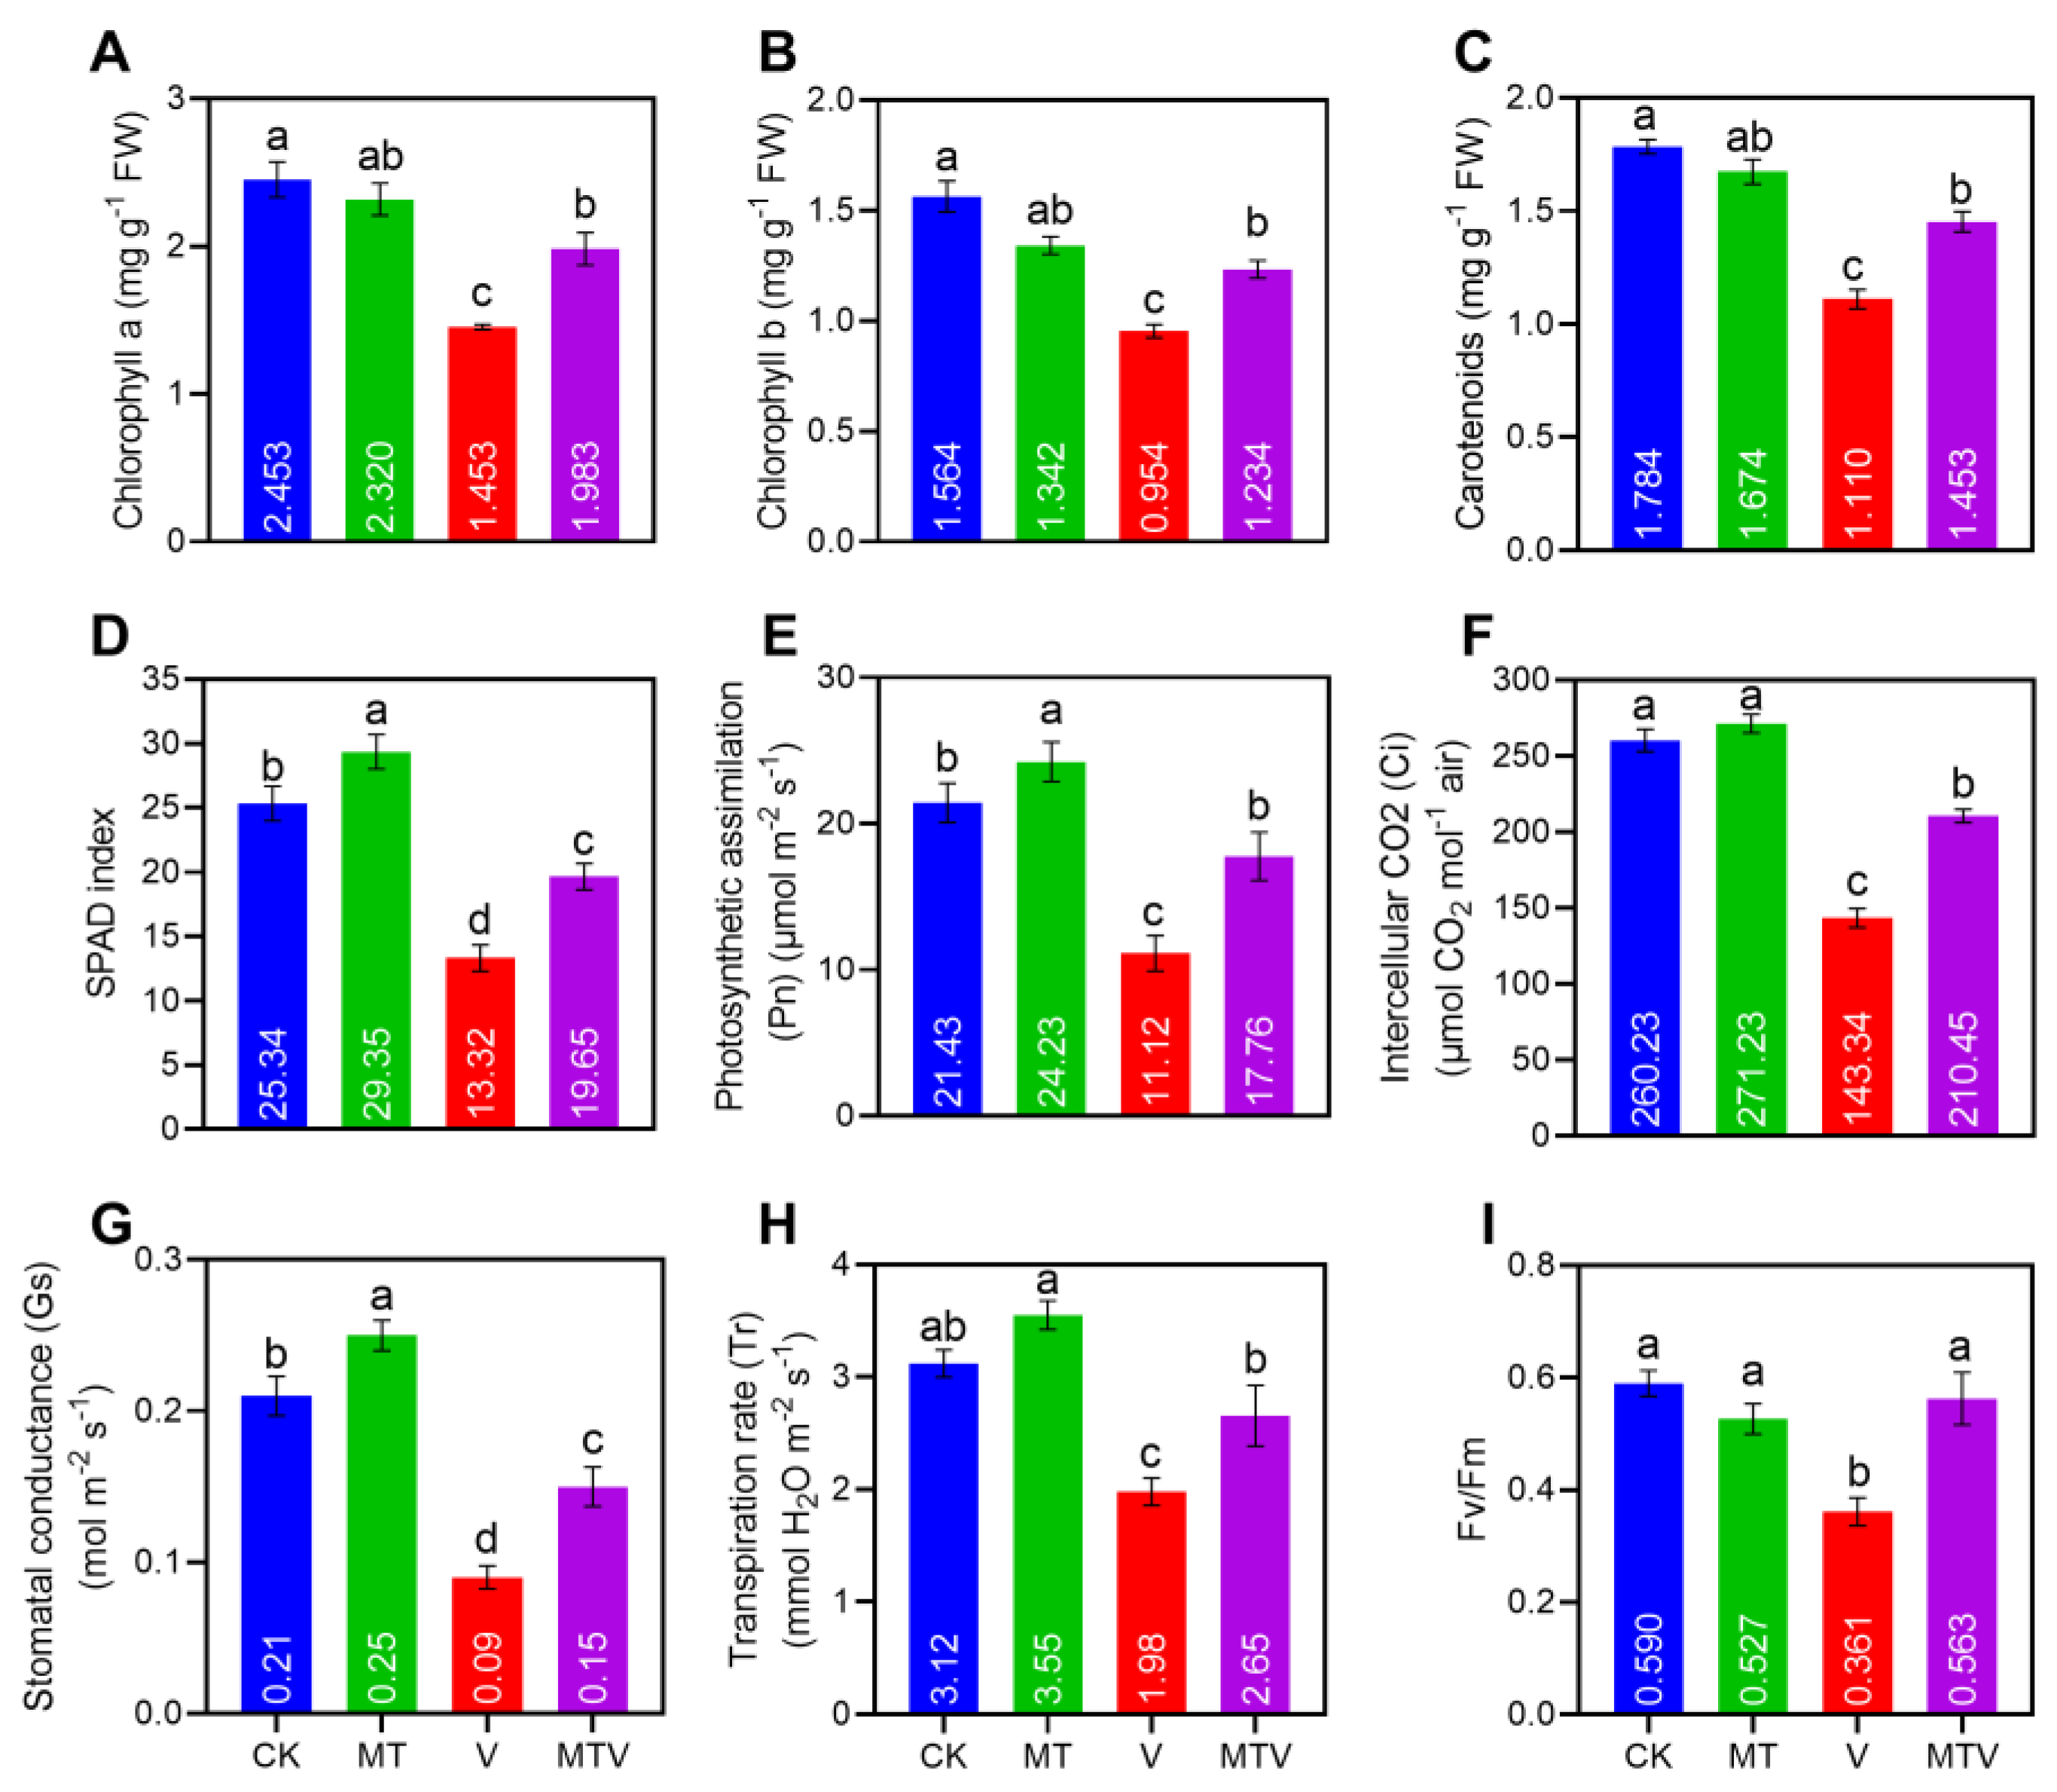
Figure 4.
Melatonin (MT) supplementation successfully reduced the oxidative stress markers; [H2O2 (A). MDA (B). and proline (C). levels in B. napus seddlings under V stress. The concentration of MT and V were 100 µM Na2SiO3.9H2O and 100 mg L− 1, NH4VO3, respectively. Data represent as mean, n = 3, ± SD. The statistical significance of the data among different treatments is represented by different lower-case letters, at p ≤ 0.05, according to LSD test.
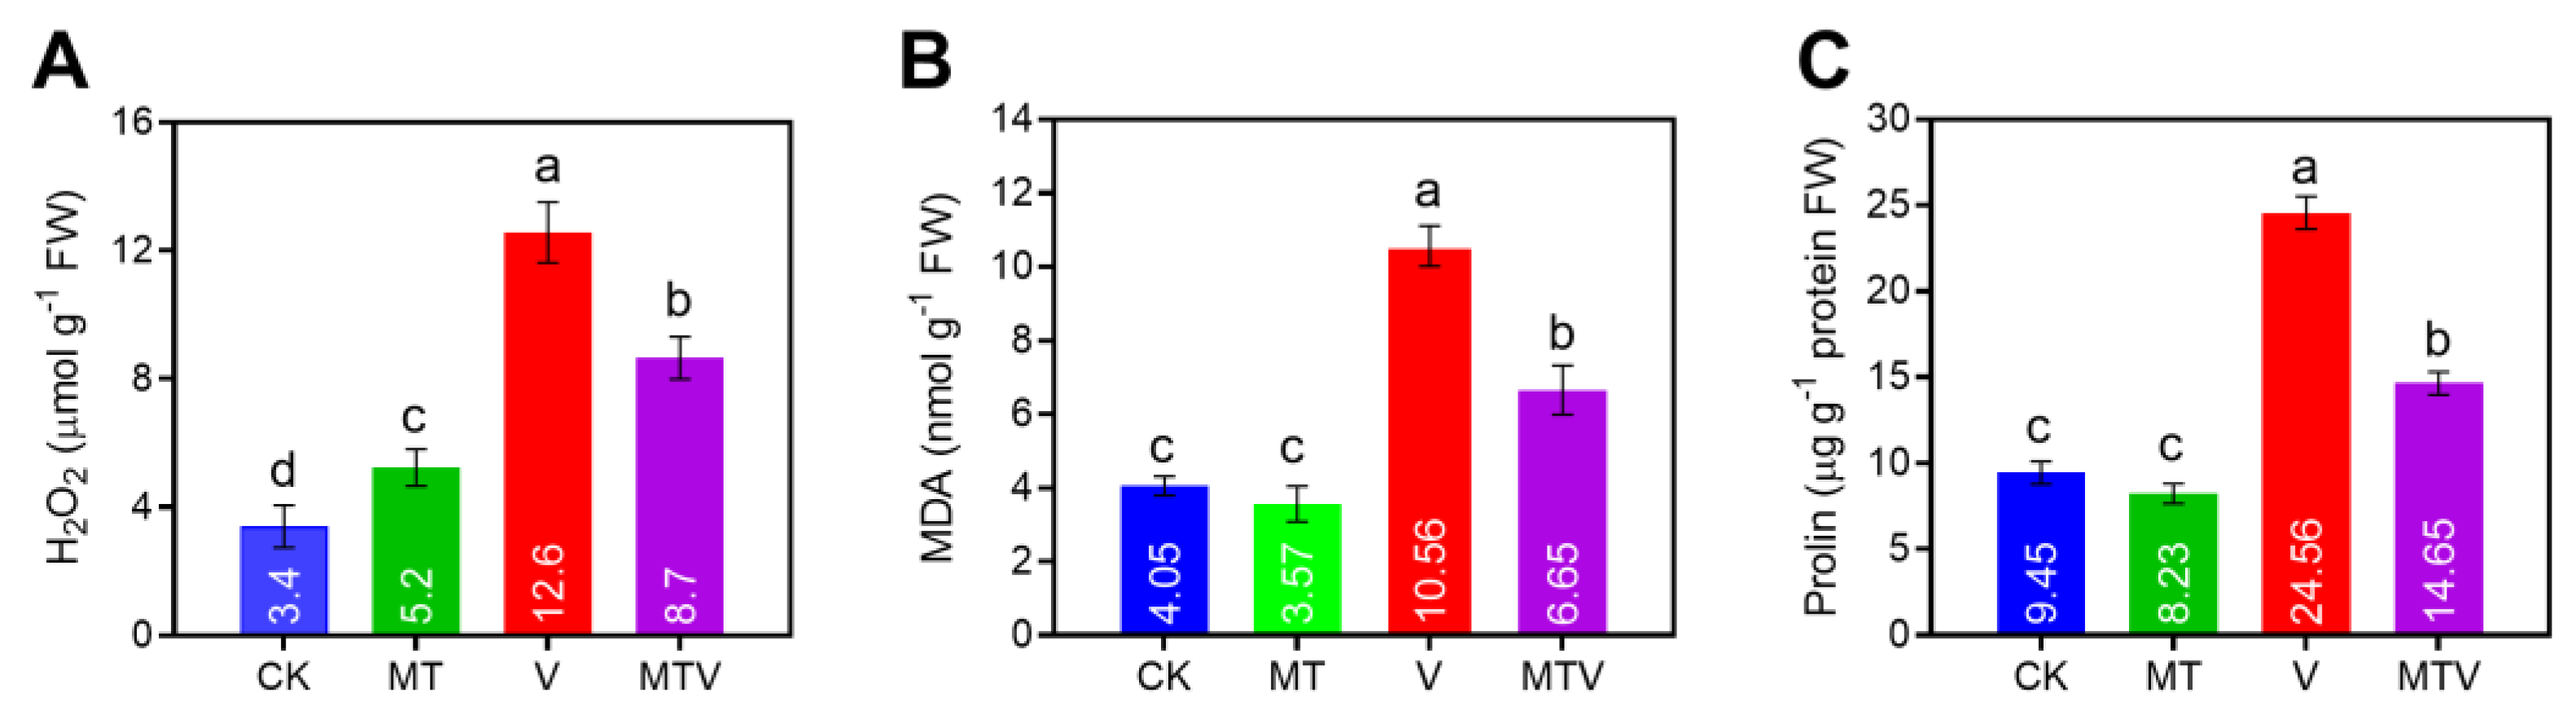
Figure 5.
Effect of Melatonin (MT) on antioxidant enzymes and linked gene genes; SOD (A&E). POD (B&F). CAT (C&G). and APX (D&H), in B. napus seedlings under V stress.
Figure 5.
Effect of Melatonin (MT) on antioxidant enzymes and linked gene genes; SOD (A&E). POD (B&F). CAT (C&G). and APX (D&H), in B. napus seedlings under V stress.
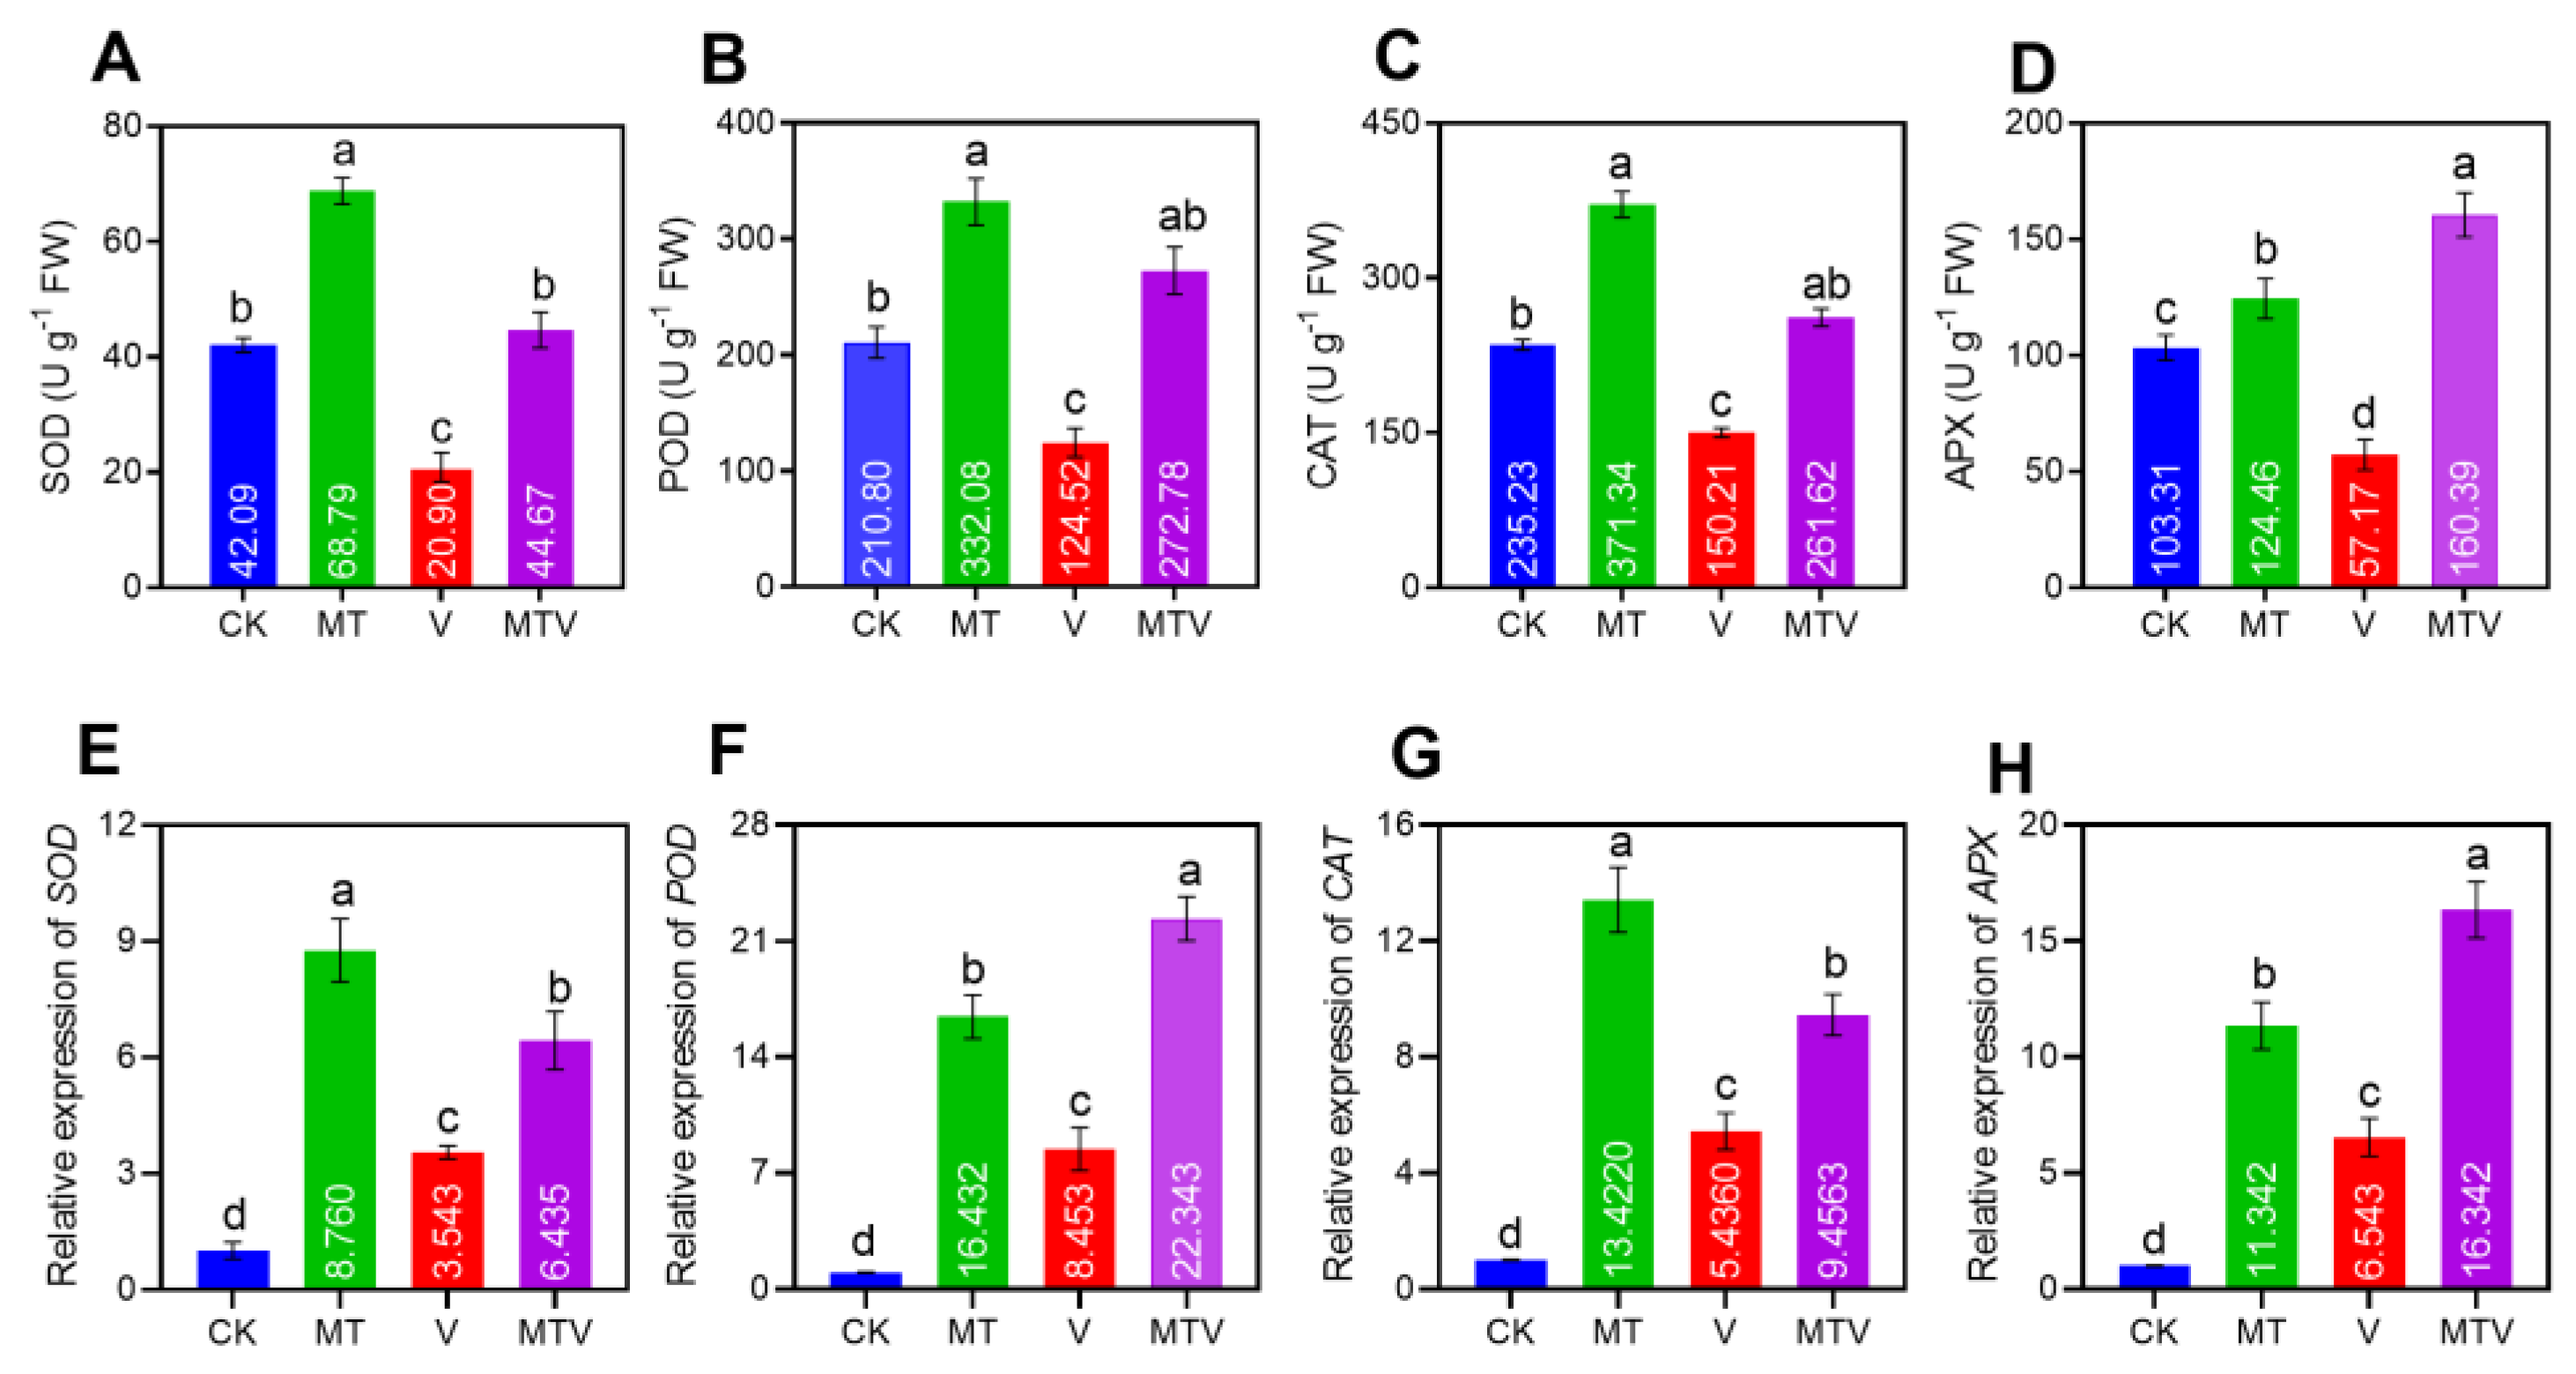
Figure 6.
Comparative analyses of deferentially expressed genes (DEGs) in B. napus seedlings under different treatments (A). Total number of up-down DEGs in all treatments (B). Clustering heat-map of DEGs; CK vs MT, CK vs V, and CK vs MTV, respectively, (C). Volcano representation of DEGs in CK vs MT, CK vs V, and CK vs MTV, respectively, (D). Venn diagram of up, down, and combined up-down regulated genes, respectively, (E). Expression heatmap of commonly regulated genes in the up and up/down regulated comparison in Venn diagram analyses.
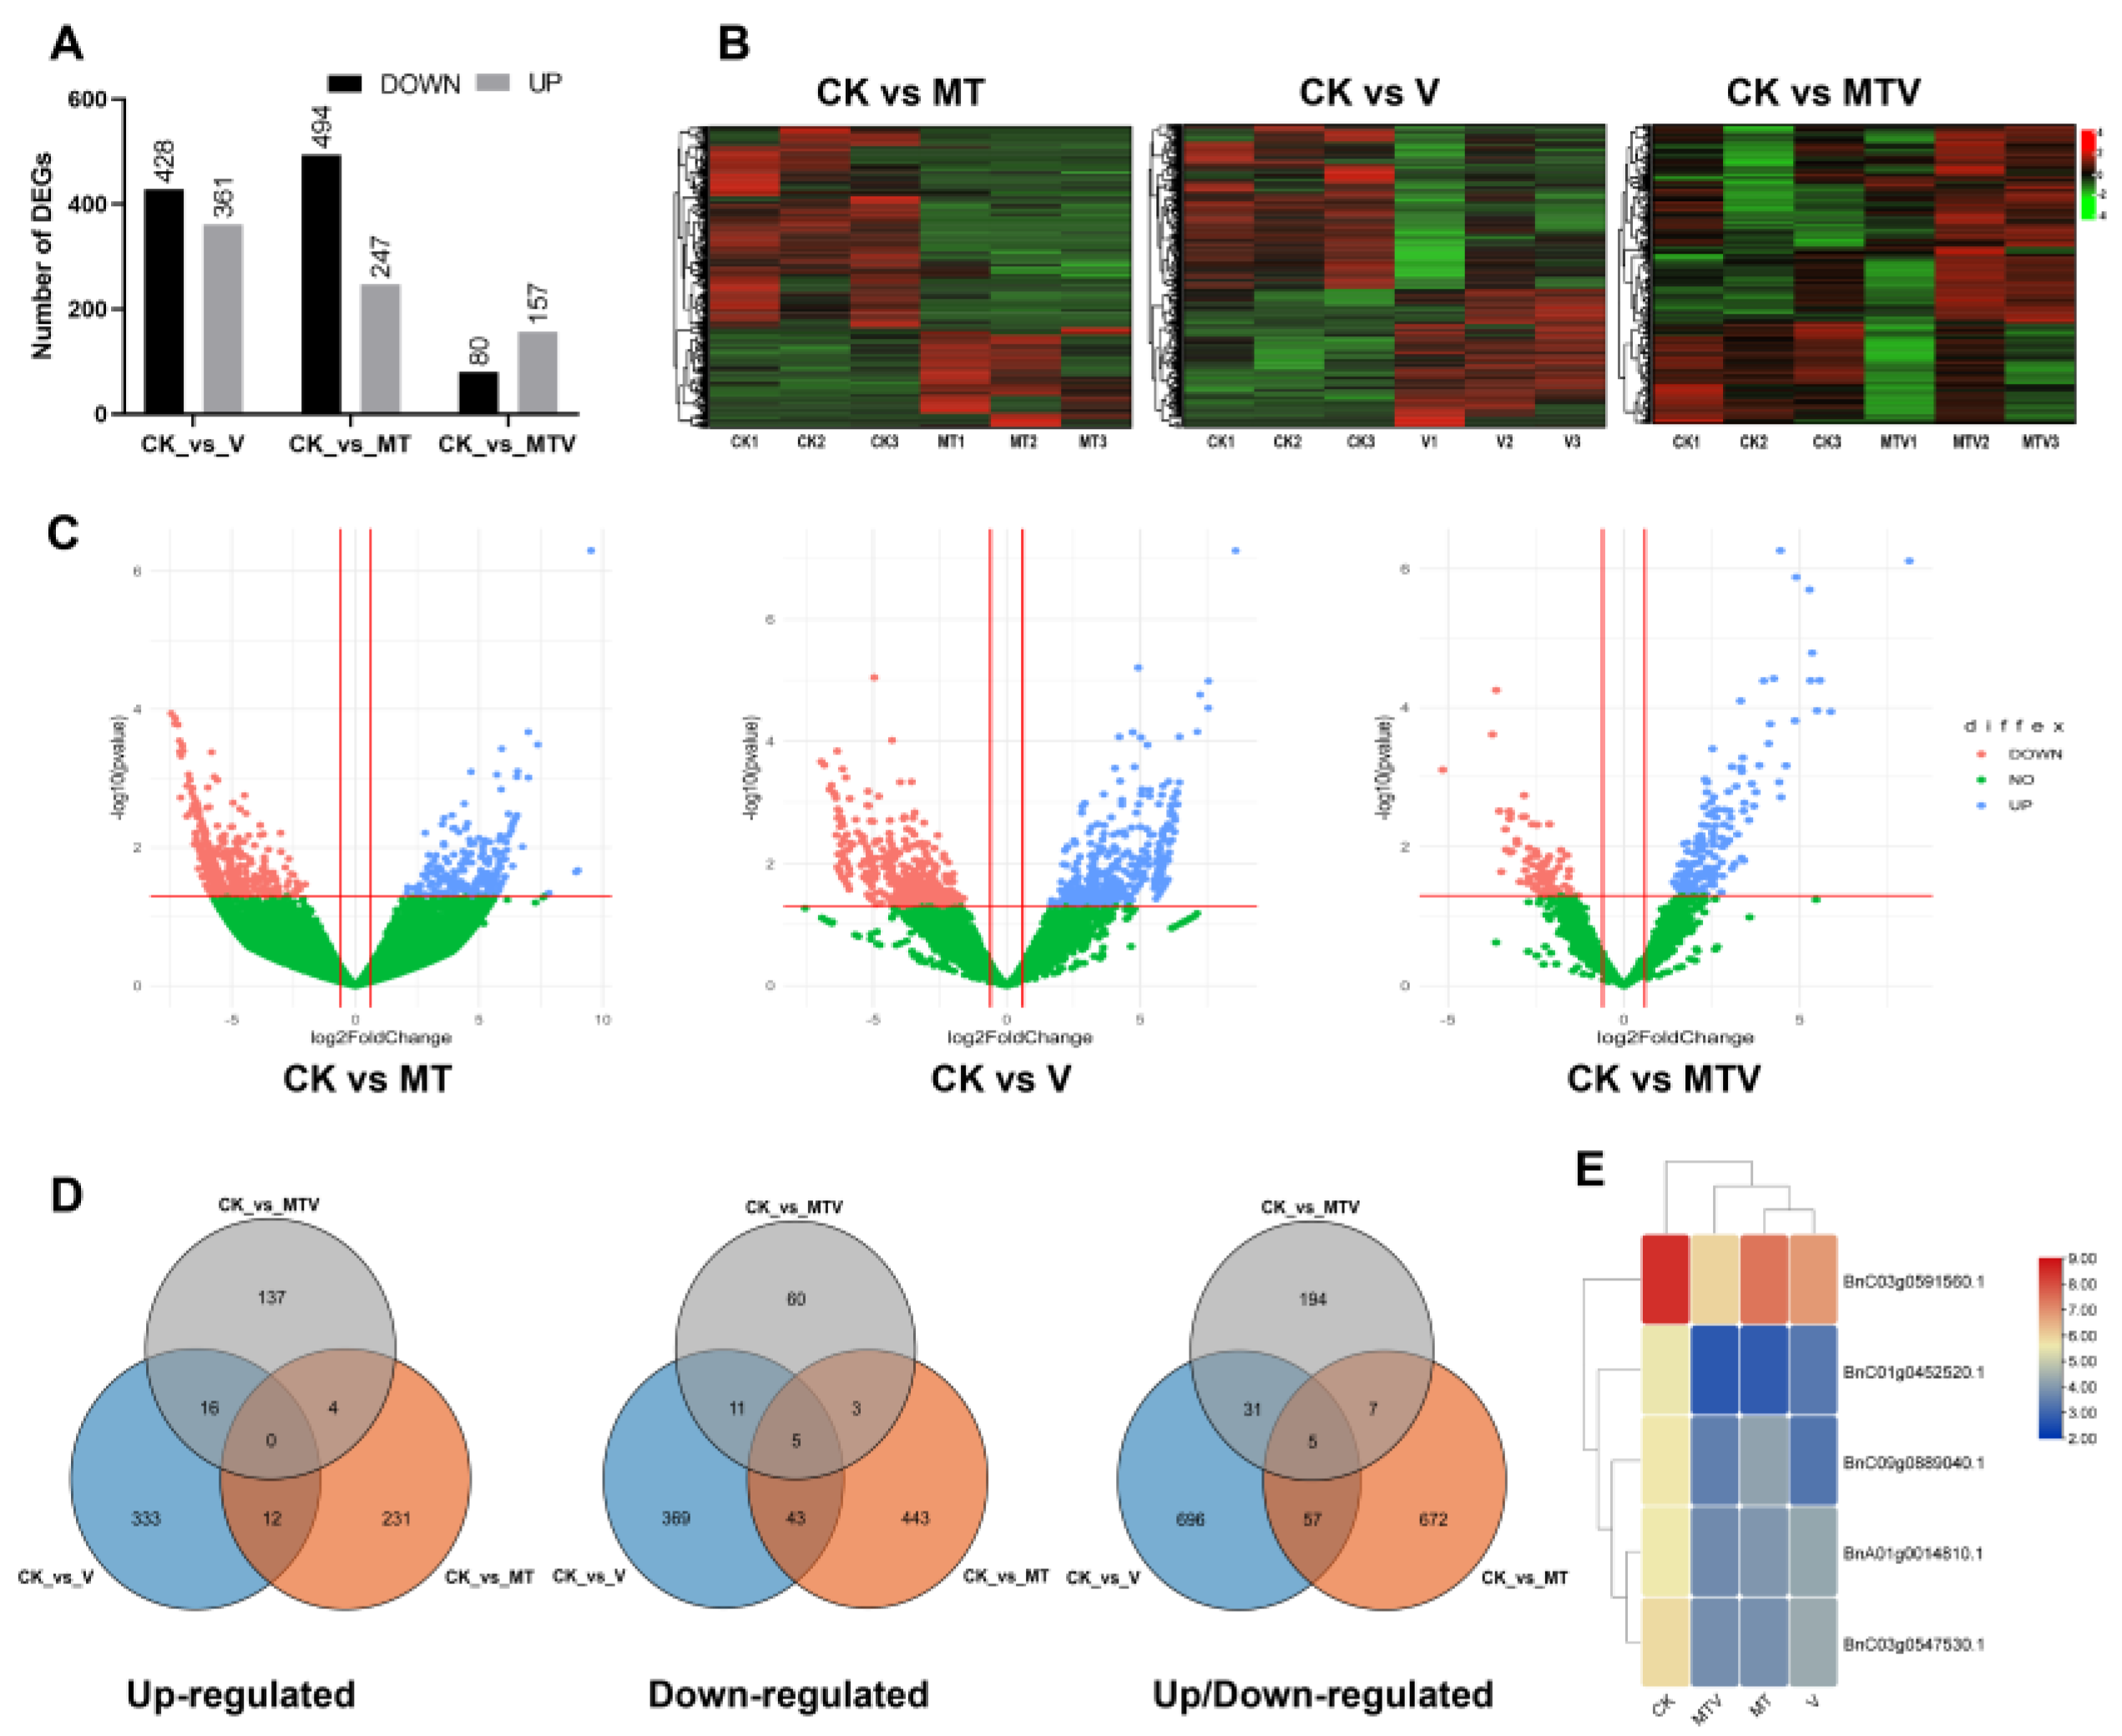
Figure 7.
Weighted Genes Correlation Network Analysis (WGCNA) analysis of network topology; (A). Both panels show the impact of soft threshold power on scalefree and the impact of it on mean connectivity (B). The gene cluster dendo gram and module identification (C). The expression heatmap of total genes grouped into 12 gene clusters through WGCNA (D). Turquoise (E). Blue (F). Brown, and (G). Yellow expression network modules module of genes. The color scale “from dark blue and green to dark red” in the heatmaps showed the intensity of expression values (-1 to +1).
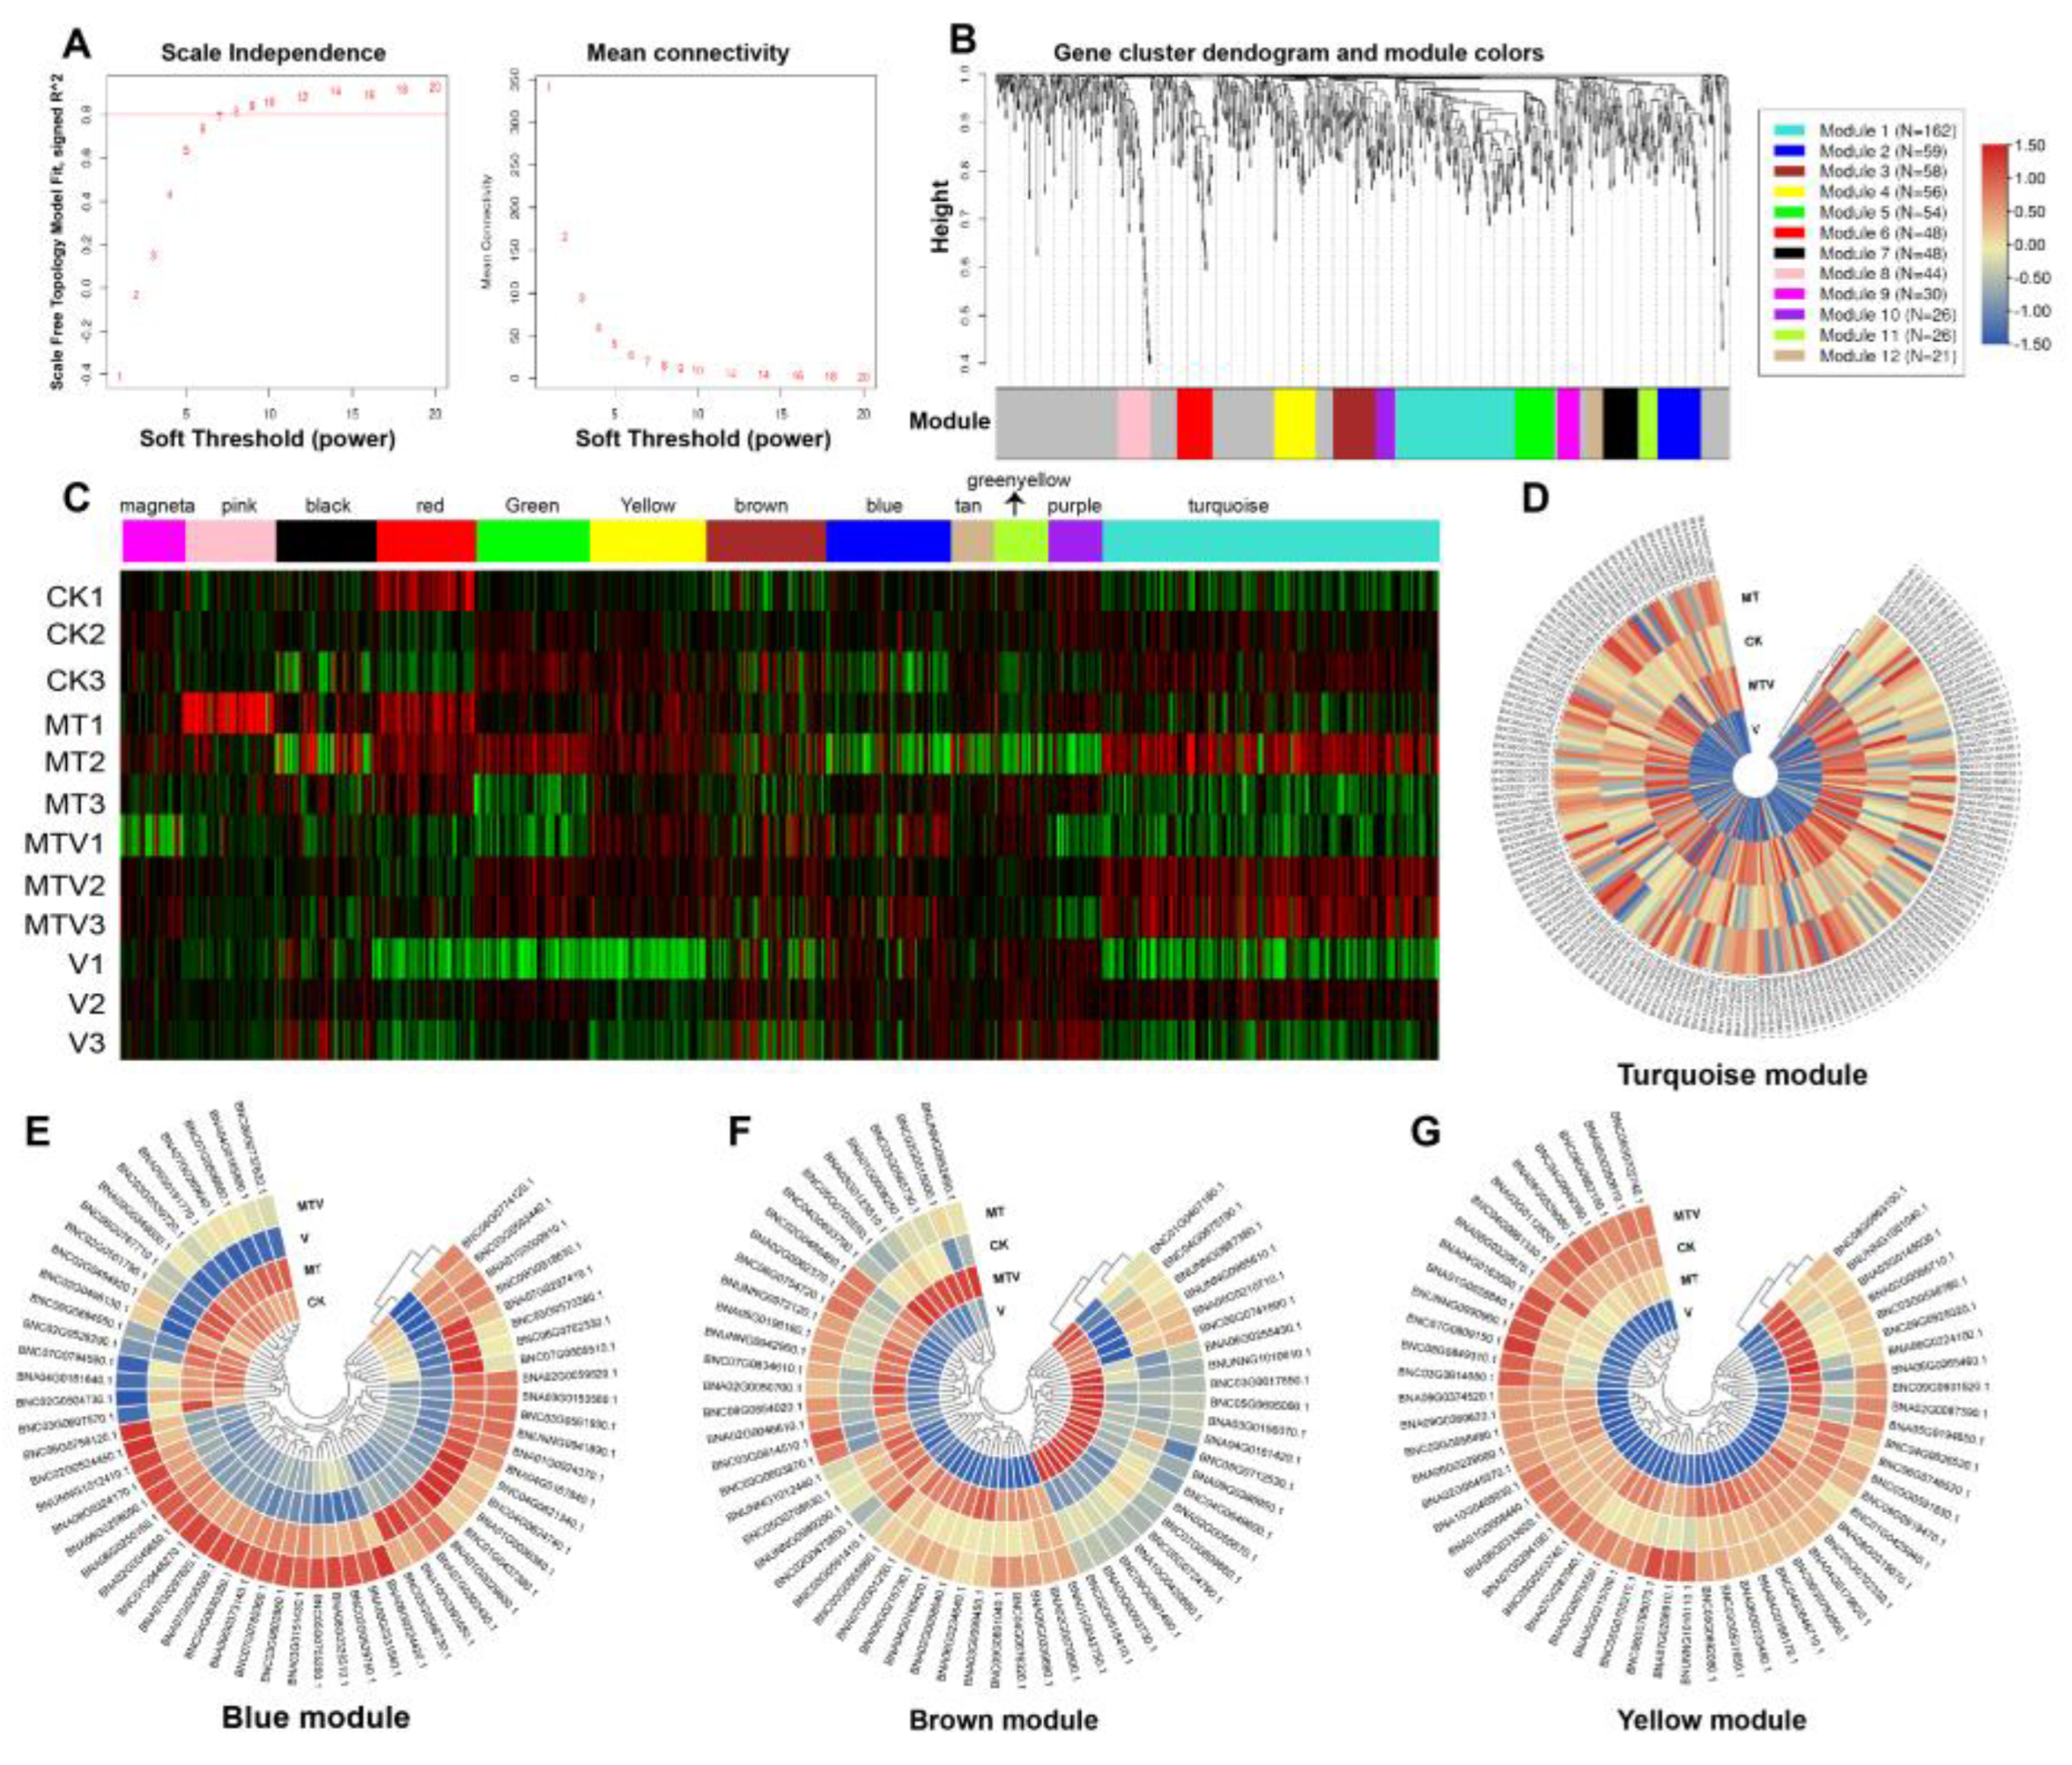
Figure 8.
The GO and KEGG enrichment analysis of deferentially expressed genes in MT, V, and MTV treatments. GO enrichment of DEGs under (A). MT, (B). V, and (C). MTV treatments. KEGG enrichment of DEGs under (A). MT, (B). V, and (C). MTV treatments.
Figure 8.
The GO and KEGG enrichment analysis of deferentially expressed genes in MT, V, and MTV treatments. GO enrichment of DEGs under (A). MT, (B). V, and (C). MTV treatments. KEGG enrichment of DEGs under (A). MT, (B). V, and (C). MTV treatments.
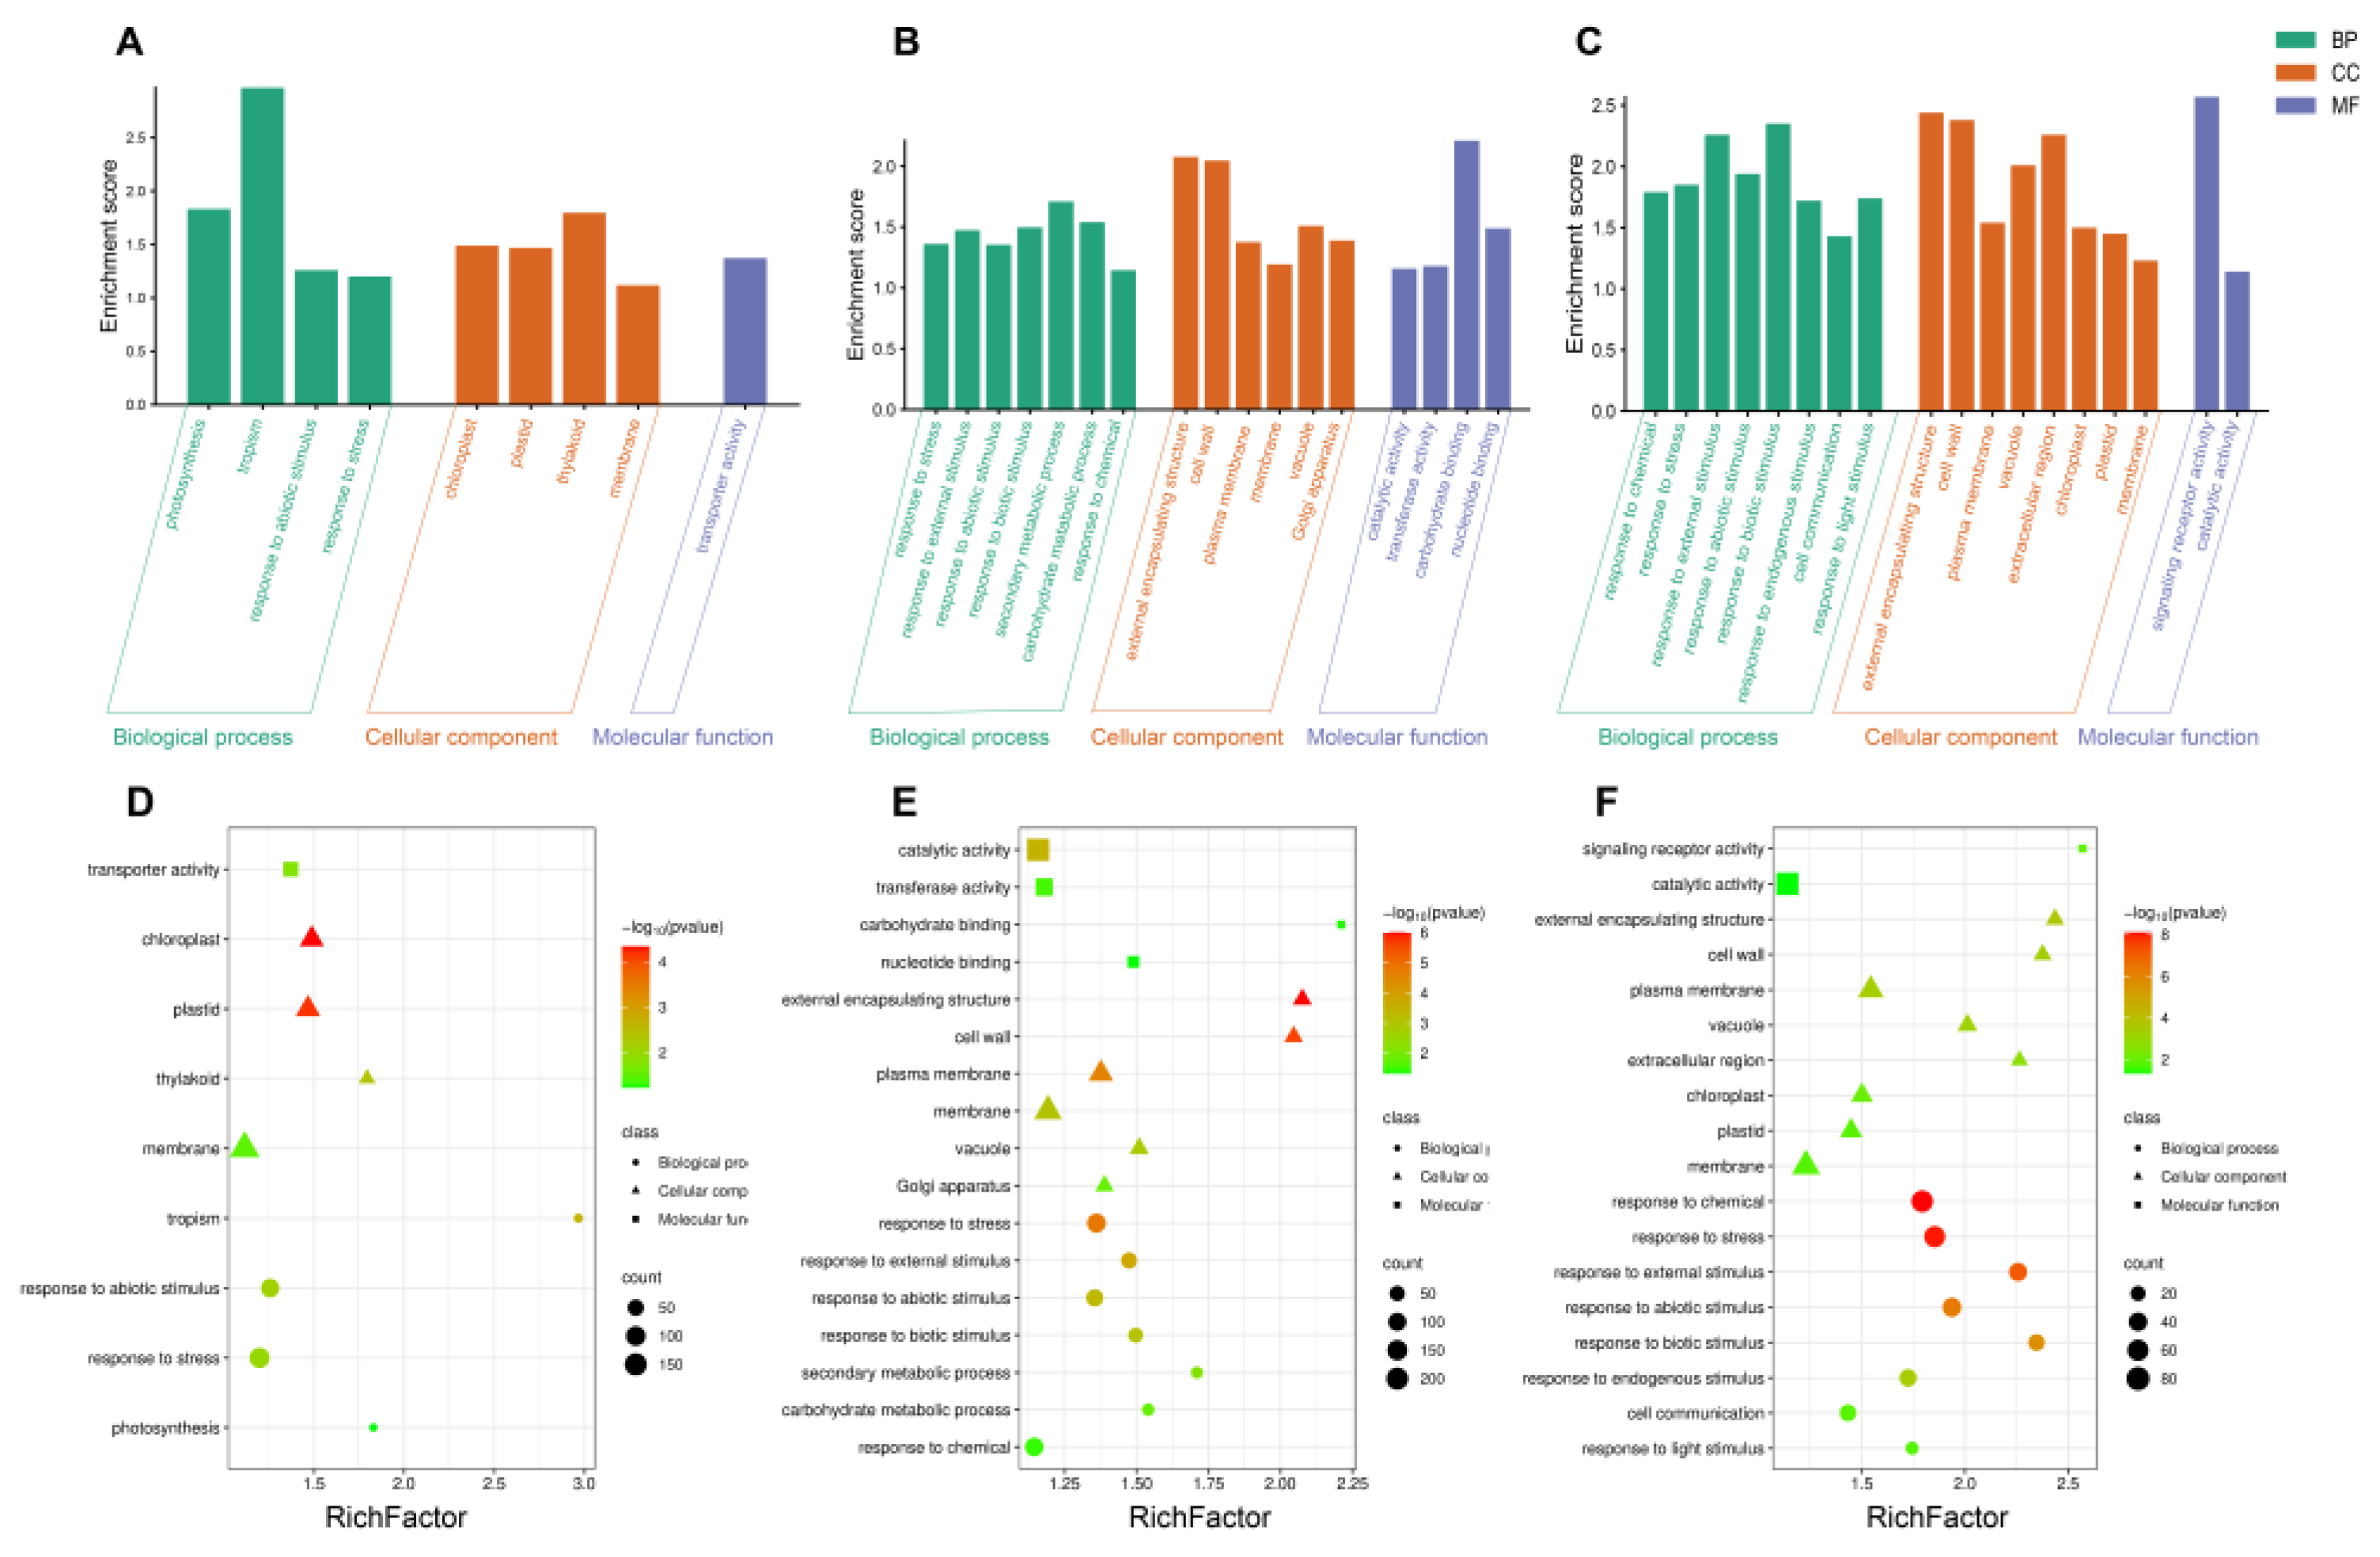
Figure 9.
Genes invloved in phenylpropanoid pathway. The pathways with yellow color in the end represents sinapine biosynthesis pathway, the light-blue color showed the lignin biosynthesis pathway, and the golden color represents the flavonoids biosynthesis pathway. The expression heatmap represents the expression intensity of the DEGs at each stage in the respective pathways. The color bar from blue (min.) to red (max.) represents the FPKM expression values of the DEGs.
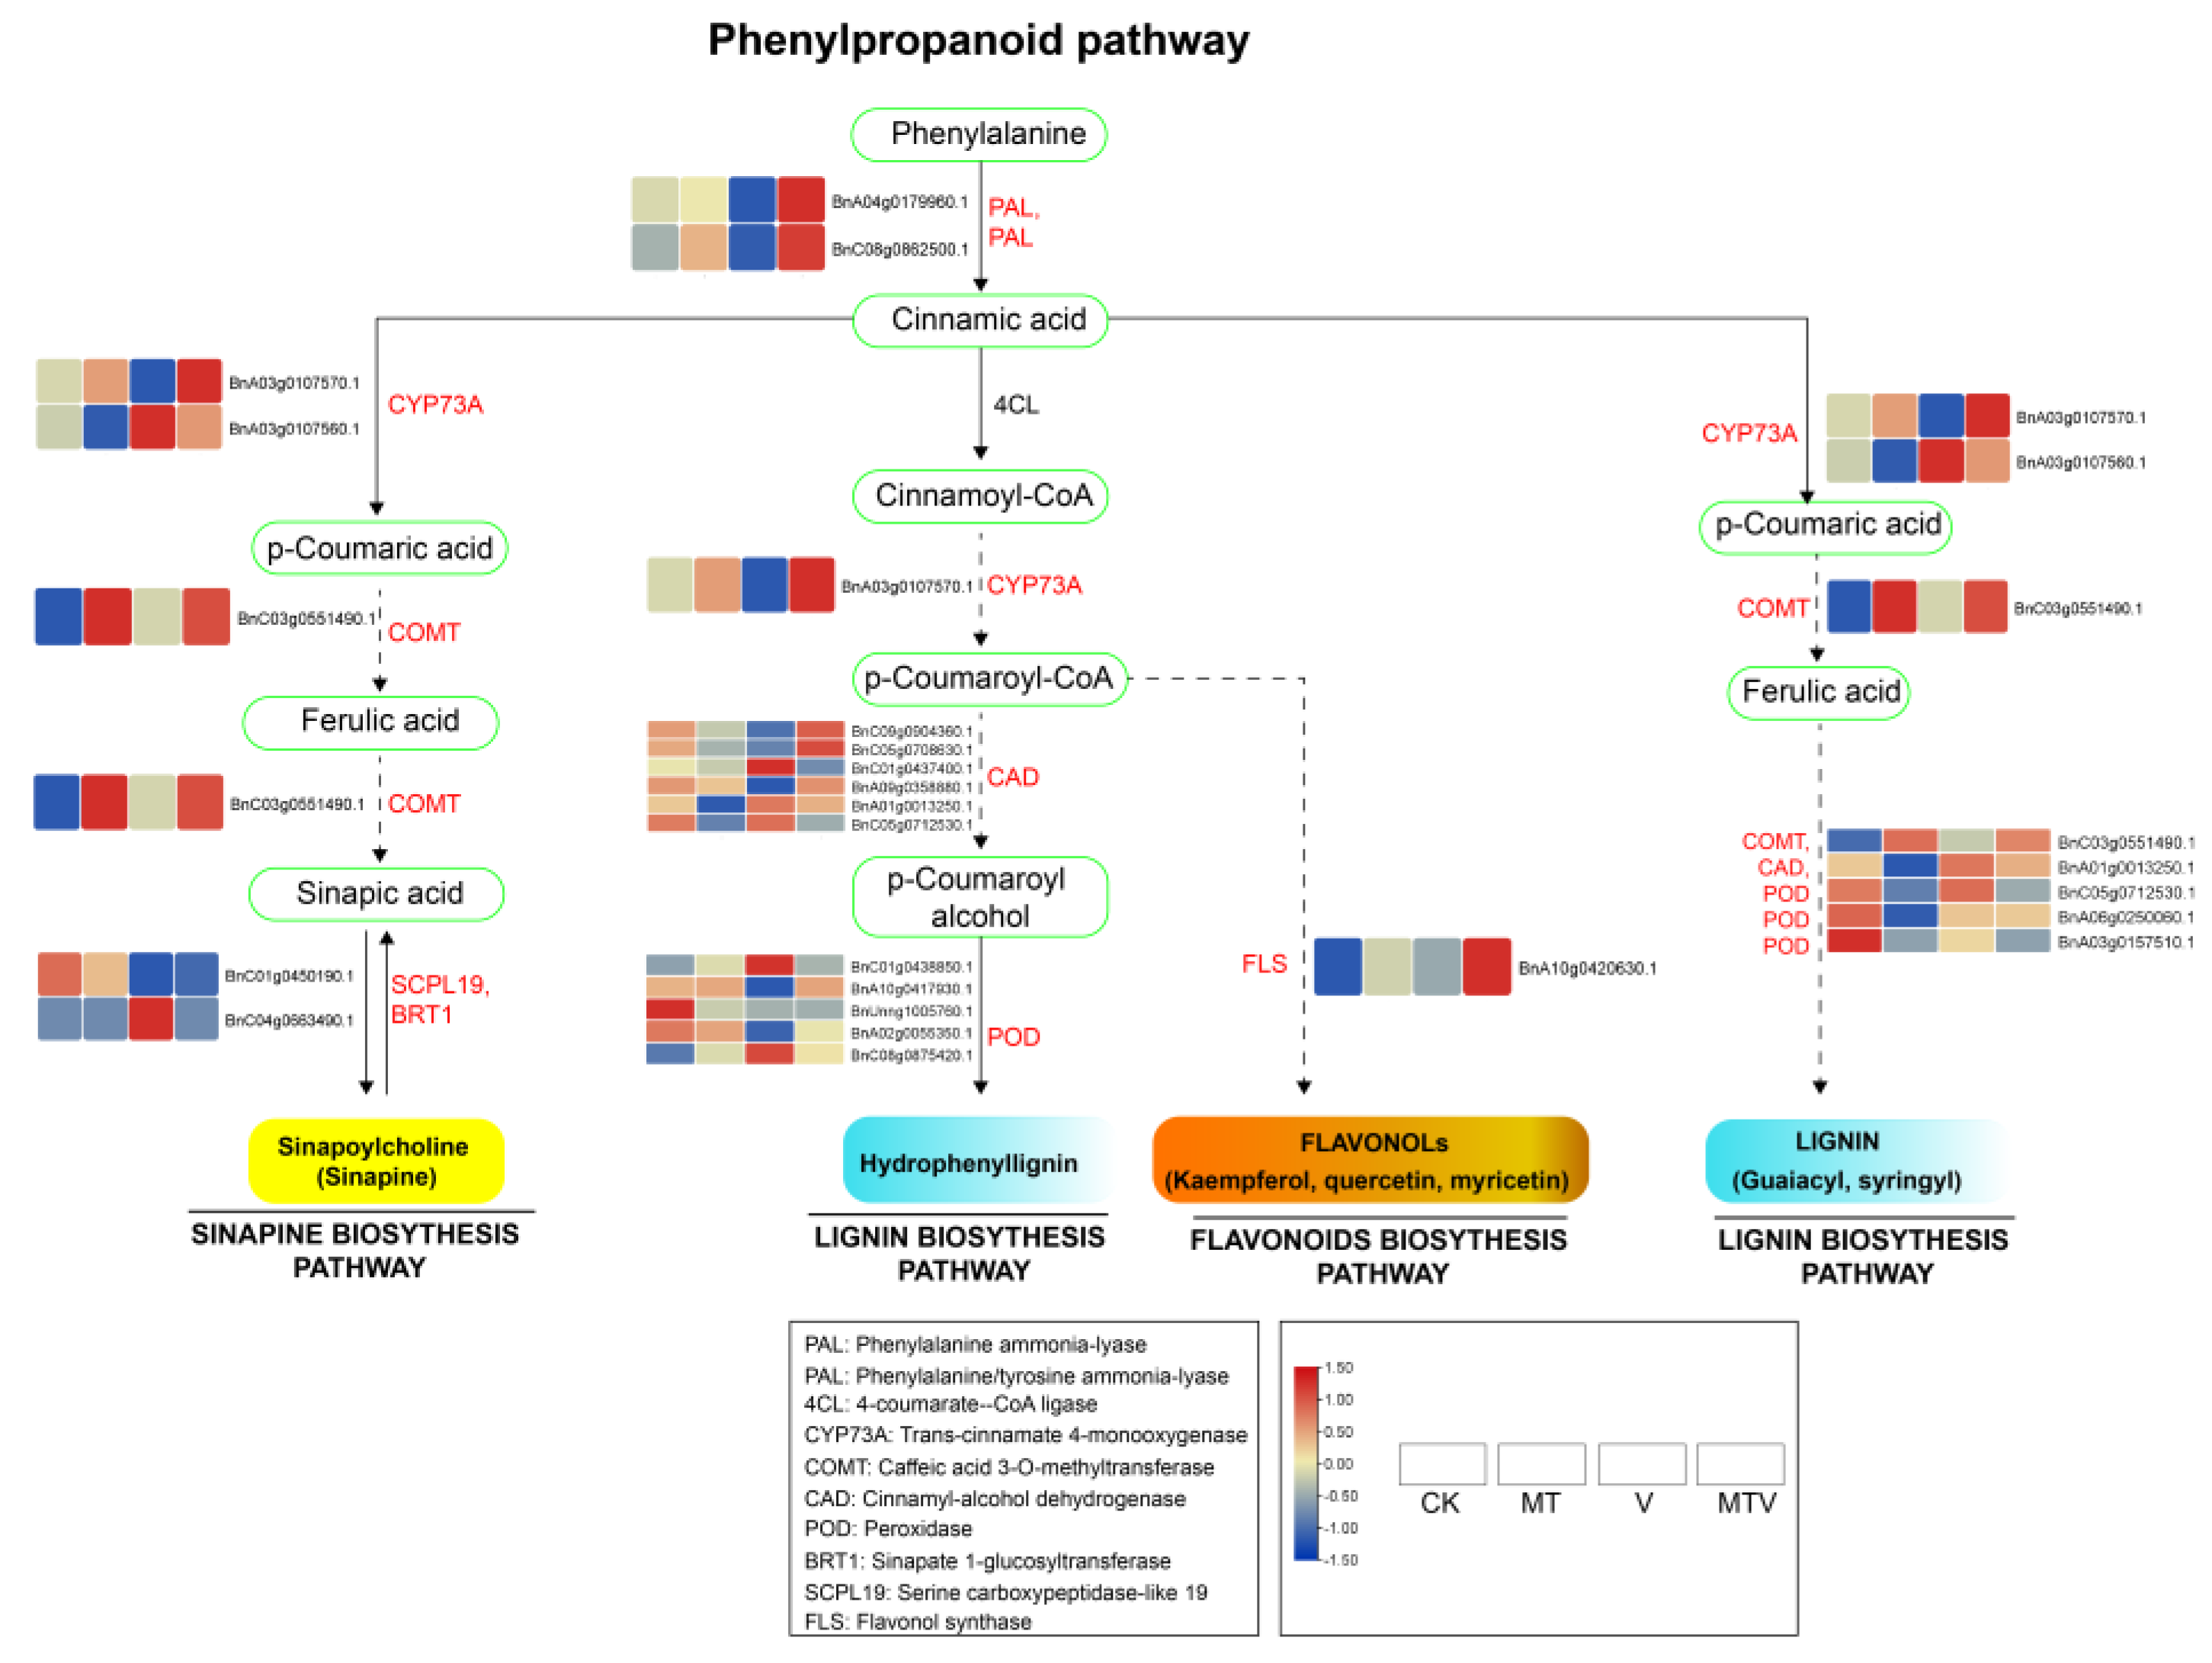
Figure 10.
Validation of RNA-seq data via RT−qPCR analysis of randomly selected genes. At left side and green bars showed the RT-qPCR relative gene expressions, and variables at right side and red line indicates the RNA-seq expression.
Figure 10.
Validation of RNA-seq data via RT−qPCR analysis of randomly selected genes. At left side and green bars showed the RT-qPCR relative gene expressions, and variables at right side and red line indicates the RNA-seq expression.
Disclaimer/Publisher’s Note: The statements, opinions and data contained in all publications are solely those of the individual author(s) and contributor(s) and not of MDPI and/or the editor(s). MDPI and/or the editor(s) disclaim responsibility for any injury to people or property resulting from any ideas, methods, instructions or products referred to in the content. |
© 2025 by the authors. Licensee MDPI, Basel, Switzerland. This article is an open access article distributed under the terms and conditions of the Creative Commons Attribution (CC BY) license (https://creativecommons.org/licenses/by/4.0/).
Copyright: This open access article is published under a Creative Commons CC BY 4.0 license, which permit the free download, distribution, and reuse, provided that the author and preprint are cited in any reuse.


