
Submitted:
26 November 2025
Posted:
27 November 2025
You are already at the latest version
Abstract
This study presents a techno-economic assessment of a modular solar-assisted me-thane pyrolysis pilot plant designed for sustainable hydrogen production in Nigeria using Concentrated Solar Power (CSP). Driven by the need to convert flare gas into value and reduce emissions, the work evaluates a hypothetical 100 kg/day hydrogen system by integrating a methane pyrolysis reactor with a solar heliostat–receiver field. Process modelling was carried out in DWSIM, while solar concentration behavior was represented using Tonatiuh. Mass and energy balance results show a hydrogen output of 3.95 kg/h accompanied by 12.30 kg/h of carbon black, with the reactor demanding roughly 44 kW of high-temperature heat at 900 °C. The total capital cost of the ≈50 kW pilot plant is approximately $1.5 million, with heliostat and receiver technologies forming the bulk of the investment. Annual operating costs are estimated at $69,580, along-side feedstock expenses of $43,566. Using annualized cost and discounted cash flow approaches, the resulting levelized cost of hydrogen (LCOH) is $5.87/kg, competitive with off-grid electrolysis in the region, though still above blue and gray hydrogen benchmarks. Financial indicators reveal a positive NPV, a 13% IRR, and a 13-year dis-counted payback period, highlighting the promise of solar-assisted methane pyrolysis as a transitional hydrogen pathway for Nigeria.
Keywords:
hydrogen production
; carbon black co-production
; solar-assisted methane pyrolysis
; flare-gas valorization
; techno-economic analysis
1. Introduction
Hydrogen has emerged as a cornerstone in global decarbonization strategies, owing to its versatility as an energy carrier and feedstock across multiple sectors. Unlike fossil fuels, hydrogen combustion produces only water vapor at the point of use, making it an attractive option for deep decarbonization of energy systems where direct electrification remains technically or economically challenging. These include energy-intensive industries such as steel, cement, and chemicals, as well as long-haul transport and seasonal energy storage [1]. Global momentum toward a hydrogen economy has been accelerated by international policy frameworks and net-zero pledges. More than 40 countries have now released national hydrogen strategies, and they project hydrogen demand to grow from the current 95 Mt/yr, which is primarily grey hydrogen derived from natural gas reforming, to over 500–600 Mt/yr by 2050 [2]. These scenarios are aligned with the Paris Agreement. The International Energy Agency (IEA) also projects that achieving global net-zero targets by 2050 would require hydrogen to supply approximately 10% of total final energy consumption, displacing conventional fossil energy in both power and industrial applications [3]. As a result of this projected scale-up, there is increasing industrial interest and investment in hydrogen production pathways. Global installed electrolyzer capacity, for example, expanded by more than five times between 2019 and 2023, and more exponential growth is anticipated as renewable power costs continue to fall [4]. Simultaneously, multinational corporations are progressing with large-scale demonstration projects for blue hydrogen, green hydrogen, and alternative low-carbon routes, which is a response to not just climate policy pressure but emerging hydrogen markets. It then becomes apparent that hydrogen is not only a tool for decarbonization, but also as a strategic commodity capable of reshaping global energy trade.
1.1. Challenges of Current Hydrogen Pathways
Despite the increasing policy momentum, hydrogen supply today is overwhelmingly fossil-based, and the three major production pathways, grey, blue, and green, all face distinct technical, environmental, and economic hurdles. Unabated steam-methane reforming (SMR), or grey hydrogen, dominates current output and typically exhibits greenhouse-gas (GHG) intensities of between 10–12 kg CO₂-eq/kg H₂ for natural-gas routes (and even higher, 22–26 kg CO₂-eq/kg H₂ for coal gasification) [5], making it definitely incompatible with net-zero trajectories. Its principal advantage remains cost, as multiple assessments still place SMR production at roughly $1–$3.8/kg depending on gas price and region. Blue hydrogen is SMR or auto-thermal reforming (ATR) with carbon capture and storage (CCS). Blue hydrogen lowers process-site CO₂ but it also introduces risks in capture-rate, upstream methane-leakage, transport and storage, and cost-reliability. IEA estimates state abatement costs for SMR of $60–85/t CO₂ at 55–70% capture and $85–110/t CO₂ at >90% capture [6]. Total lifecycle emissions are highly sensitive to methane leakage assumptions from gas-supply. Optimistic industry scenarios envisage a possible parity with grey hydrogen, mostly in specific U.S. geographies by 2030, but independent reviews warn that blue hydrogen performance is uneven and financing relies strongly on long-lasting infrastructure and policy support [7]. Although green hydrogen (water electrolysis using low-carbon electricity) offers the clearest route to an operational CO₂ of near-zero, it remains vulnerable to financial risk from electricity price and utilization. EU datasets indicate around $6–$8/kg for grid-connected or renewable electrolysis, and electricity, along with grid costs often constituting 60% of LCOH. DOE modeling for current-generation PEM systems produces comparable values, while it also lays out innovation pathways toward lower costs [8].
Figure 1.
LCOH of Grey, Blue and Green Hydrogen [9].
Figure 1.
LCOH of Grey, Blue and Green Hydrogen [9].
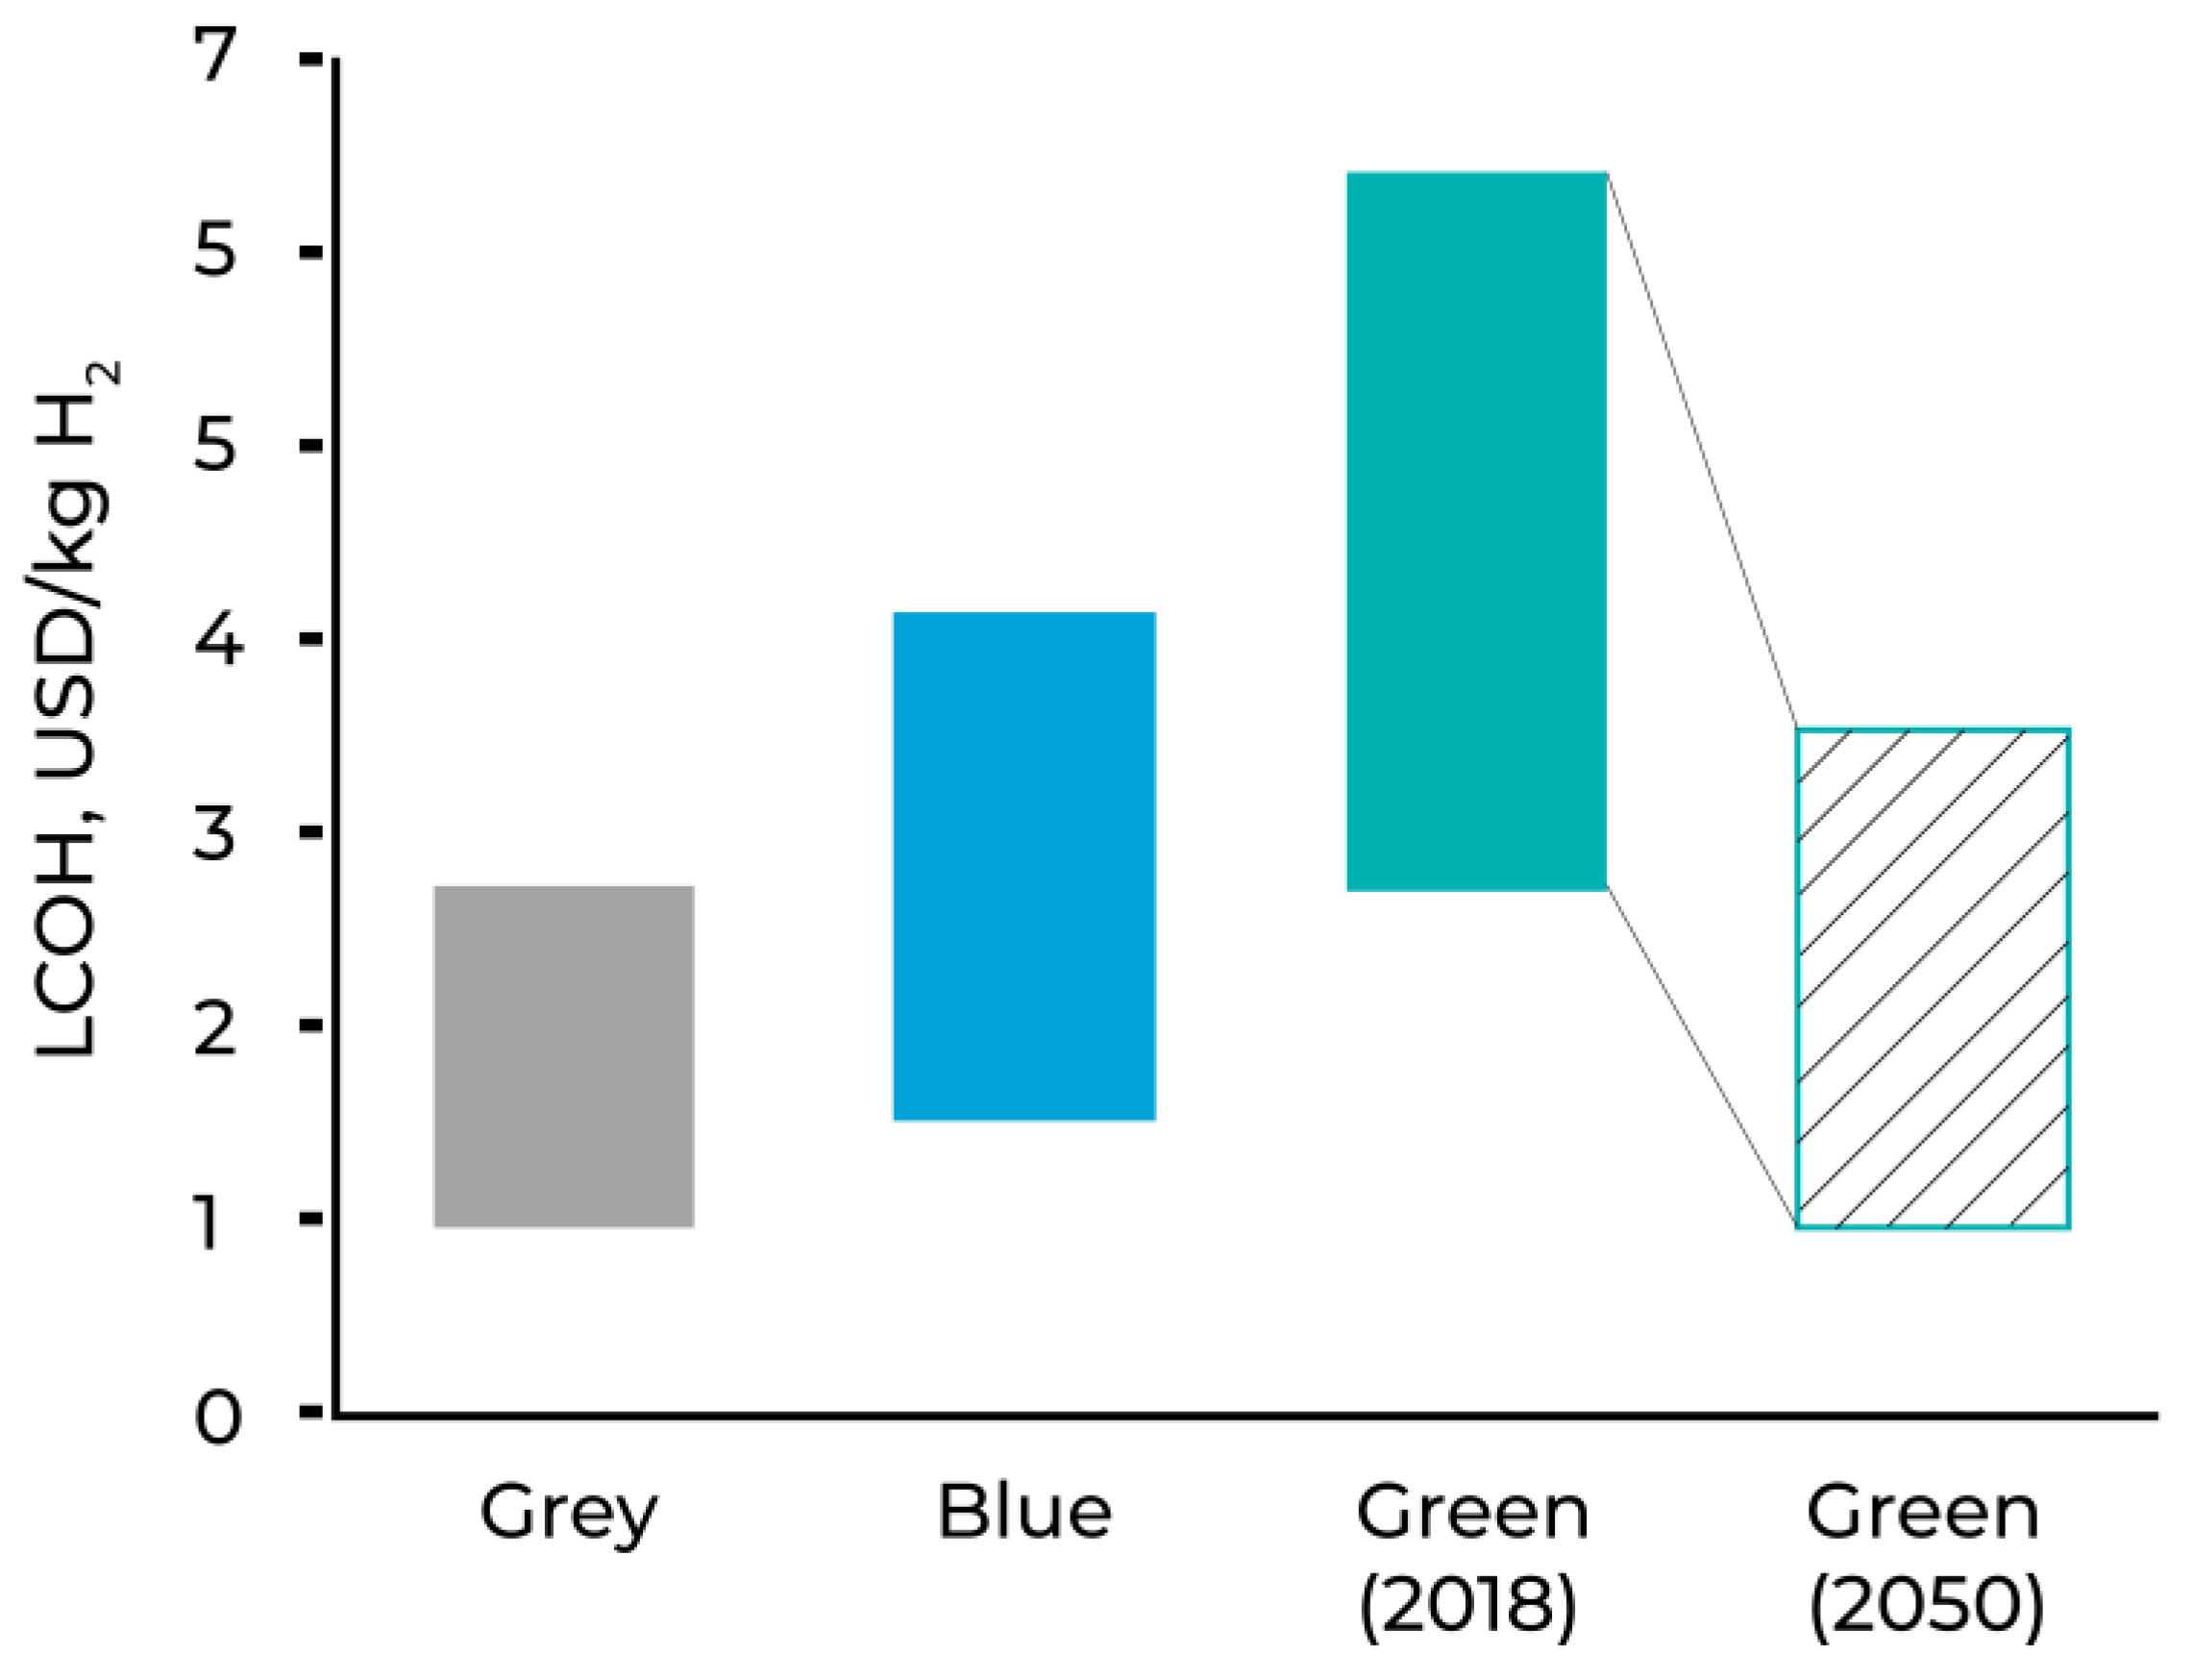
The IEA reports that around the globe, producing renewable hydrogen is 1.5–6 times more expensive than grey hydrogen at present [10], and this highlights the persistent cost gap that policy and technology progress must bridge. Conclusively, grey hydrogen is inexpensive but emissions-intensive; blue hydrogen can reduce site emissions but is reliant on high capture rates, low upstream leakage, and dependable CO₂ storage, and green hydrogen is environmentally convincing but its implementation currently faces strong barriers in energy-intensity and competitiveness of cost at typical electricity prices. The outlined constraints thereby motivate a thorough examination of alternative low-carbon pathways which can disentangle hydrogen production from process-CO₂ formation while still managing energy input costs at high temperature.
1.2. Methane Pyrolysis as a Low-Carbon Alternative
Methane pyrolysis (MP) splits CH₄ into H₂ and solid carbon at high temperatures, and thus it avoids CO₂ formation at the reactor. Potentially when the heat input is low-carbon and the carbon product is stably stored or utilized, it can achieve near-zero direct process emissions. The major impacts to this lifecycle are then limited to upstream methane leakage, heat/electricity sources, and the quality and use of the solid carbon. One of the distinct economic features of MP is the process co-product carbon, which could be either carbon black or graphitic carbon [11]. If sold into established markets, this co-product carbon can provide a material revenue stream that lowers the effective LCOH. Recent experimental work has demonstrated solar-thermal and electrically heated reactors that achieve high CH₄ conversions and produce graphitic/structured carbons, which have market value, supporting this premise [12].
The technology used to implement MP includes (i) plasma and resistive or electrical pyrolysis (Monolith’s plasma process coupling hydrogen with premium carbon black production), (ii) catalytic or molten-metal or salt reactors (BASF’s liquid-metal MP test plant), and (iii) solar-thermal concepts that use concentrated solar flux to supply endothermic heat directly or through high-temperature heat-transfer media [13]. Most system-level techno-economics of MP remain dependent on the sites and configuration of the process, but assessments indicate that MP can be cost-competitive with blue hydrogen and, in favourable cases, even undercut renewable electrolysis, especially when carbon black brings in a robust revenue and the high-temperature heat is inexpensive. For this study, both assumptions are incorporated. Pilot and early-commercial demonstrations have shifted MP discussions beyond purely theoretical analyses. BASF has operated a methane-pyrolysis test facility at Ludwigshafen and plans large-scale implementation before 2030 [15]. Their focus is on catalytic molten-metal reactors in order to minimize coking and improve heat transfer. Monolith has reported multi-thousand-hour plasma-pyrolysis operation and commercial-scale carbon black production alongside their hydrogen output, which shows the role of carbon product quality and markets in enhancing commercial viability.
And so, these developments place methane pyrolysis as a promising low-carbon alternative to established pathways. Pyrolysis avoids process-CO₂, utilizes solid-carbon valorization to offset costs, and can be integrated with renewable high-temperature heat, in this case, solar towers. The remaining challenges; reactor kinetics and fouling, continuous solids handling, scalable receiver/reactor integration, and lifecycle performance under realistic upstream methane leakage are miniscule in comparison to the significant advantages offered by this study’s CSP-coupled MP assessment and benchmarking.
1.3. Role of Solar Thermal Integration
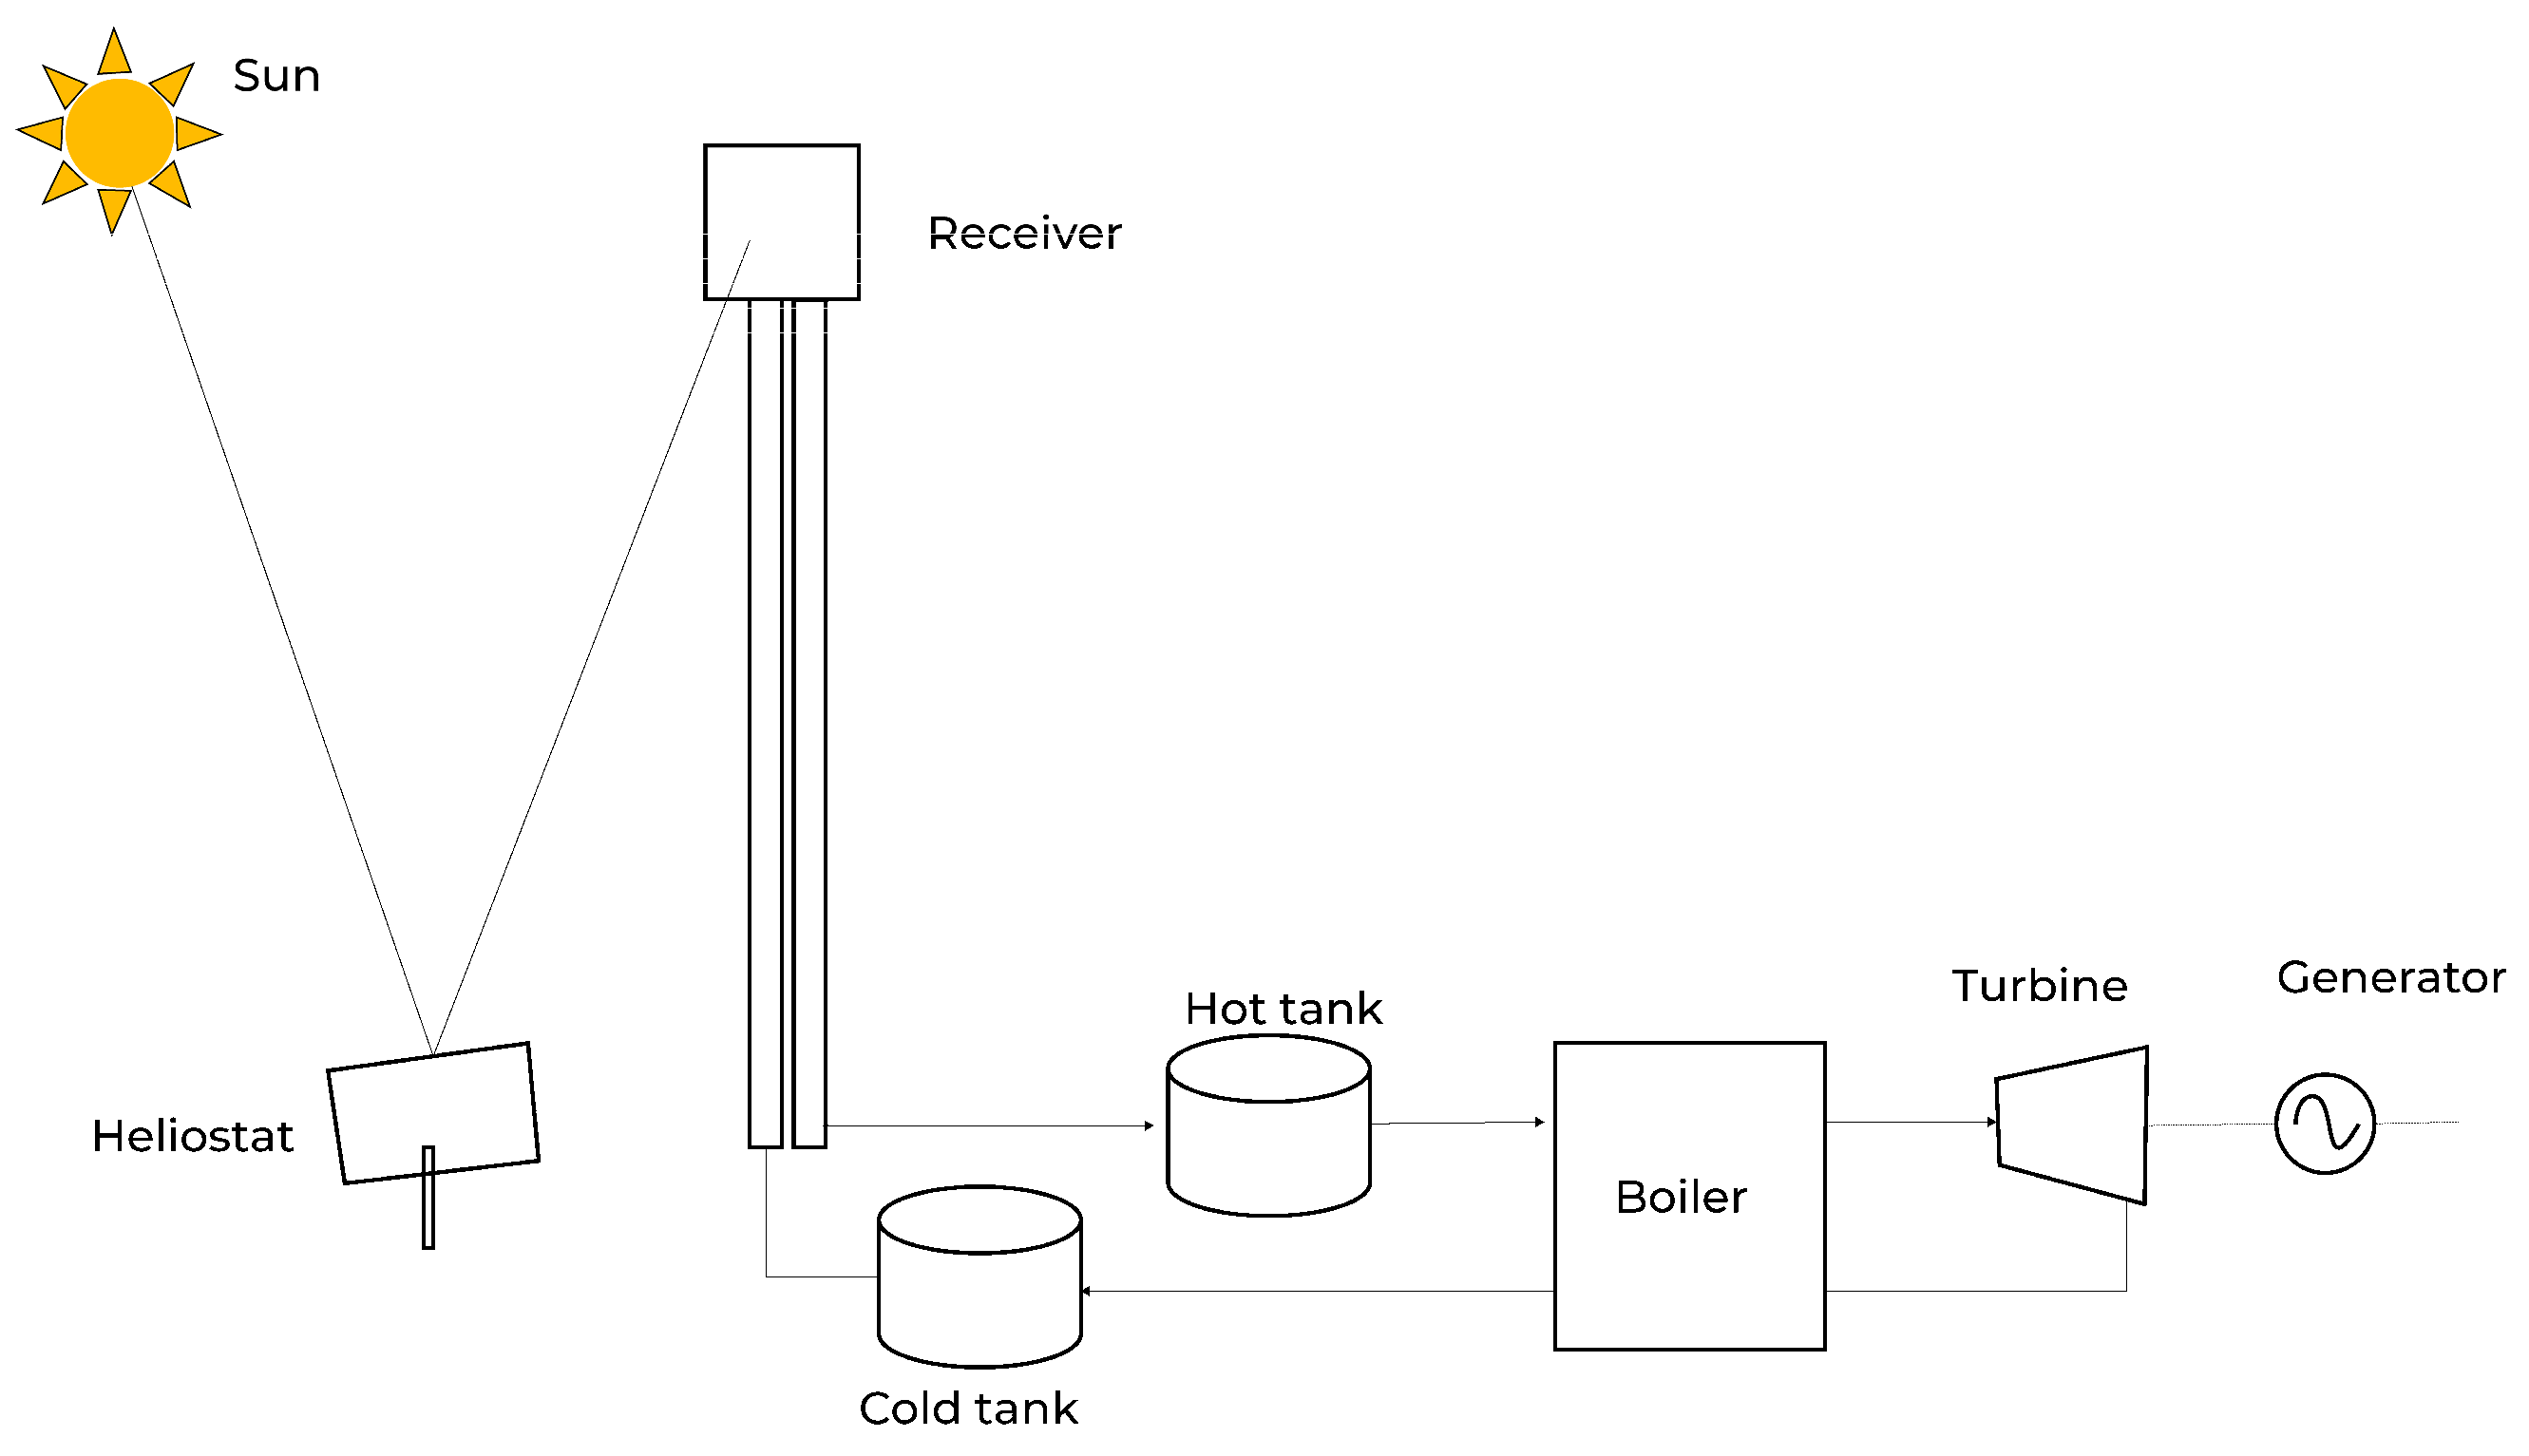
Concentrated solar power (CSP), using the central-receiver or solar-tower configuration, is particularly good for providing the high-temperature thermal energy required by methane pyrolysis because it directly supplies process heat at temperatures that are difficult and expensive to reach with electrical heating alone. Solar towers concentrate sunlight many hundreds of times to generate heat in a receiver and modern receiver concepts [16] (including particle and ceramic receivers) are capable of operating at temperatures commonly targeted for thermochemical processes (600–1000 °C and above), with demonstrated laboratory and pilot component operation at or beyond 1000 °C. Direct delivery of heat avoids the round-trip losses associated with converting solar energy to electricity (PV) and then back to heat (resistive or electrolytic heating), and it enables use of cost-effective sensible thermal energy storage (TES) to decouple production from instantaneous insolation. Several recent reviews and technology roadmaps emphasize that thermal storage for CSP is substantially more economical per unit of stored energy and more durable for long-duration dispatch than battery systems targeted at electrical storage [17], making CSP+TES attractive for industrial process heat applications where continuous or dispatchable high-temperature heat is required.
When sizing the solar provision for an endothermic industrial reaction such as methane pyrolysis, two features of CSP are particularly relevant. First, the achievable receiver temperatures and the resulting high exergetic quality of delivered heat reduce the ancillary energy required for reaching reaction setpoints (reducing overall primary-energy demand), and second, CSP’s thermal storage gives a cost-effective path to smooth hourly and diurnal variability in solar input so that the chemical plant can operate nearer to steady state. This is an important operational and economic advantage for unit operations that favor continuous operation. For these reasons, coupling a solar tower to a methane-pyrolysis reactor is a compelling configuration in high-DNI regions: it supplies the requisite high-grade heat directly and, when combined with TES, provides dispatchable thermal energy at a lower marginal cost for long-duration storage than equivalent electrical storage approaches.
Figure 2.
Working Principle of a Central Receiver System [18].
Figure 2.
Working Principle of a Central Receiver System [18].
1.4. Nigeria’s Energy and Gas Utilization Context
Nigeria is a high-potential setting for CSP-assisted methane pyrolysis because it combines substantial natural-gas resources and significant solar resource quality with concentrated industrial gas activity in the Niger Delta. At the national scale Nigeria is one of Africa’s largest holders of proven natural-gas reserves (on the order of 200–210 trillion cubic feet of proven gas [19]), and the country has major liquefaction and refining projects under development that indicate continuing strategic focus on monetizing gas resources. At the same time, gas flaring in the Niger Delta remains a major environmental and economic problem: recent World Bank tracking shows that while flaring volumes have fallen from historical highs, several hundred flare sites and multi-billion-cubic-metre residual flaring remain, indicating a persistent local source of wasted gas that could be repurposed for value-added uses such as onsite hydrogen production rather than atmospheric combustion.
Delta State is an especially appropriate pilot location for a CSP-pyrolysis plant for several reasons. Delta State sits in the Niger Delta hydrocarbon province, hosts large refining and petrochemical assets (for example the Warri refinery and associated petrochemical complexes) and has existing downstream logistics (ports, roads and local chemical industry clusters) that facilitate product off-take. Practically speaking, locating a pilot plant in Delta State minimizes methane feedline length and transport logistics when tapping associated gas or low-value flare gas and places the plant close to potential industrial consumers of both hydrogen and carbon black (or to export infrastructure). It also places the demonstration within the region most affected by flaring, thereby delivering co-benefits in emissions abatement, local employment, and socio-economic development if local value chains for the carbon co-product can be developed.
Moreover, Nigeria’s solar resource is generally excellent: gridded solar atlases and mesoscale studies show mean annual direct normal irradiation (DNI) values that range roughly from ~3.5 kWh/m²/day along the coastal belt to ≈7.0 kWh/m²/day in the far north, with large contiguous areas exhibiting DNI well above the thresholds commonly used for CSP deployment. For a pilot sited in Delta State the DNI is lower than in the far north but remains sufficient for modular CSP applications, and the combination of proximate gas feedstock, industrial demand, and port access outweighs the DNI differential for an early demonstration focused on process integration and market development. Finally, Nigeria’s recent policy moves to valorize and commercialize gas [20] (including floating LNG and gas-to-value projects) strengthen the case for near-term demonstrations that convert stranded/associated gas to marketable hydrogen and carbon products, using CSP to supply the high-temperature heat and TES to improve dispatchability and capacity factor.
1.5. Research Gap and Objectives of This Study
Despite the growing body of research on hydrogen production pathways, there still remains a significant lack of literature addressing the integration of solar thermal energy with methane pyrolysis, particularly in African contexts characterized by high direct normal irradiance (DNI). Most techno-economic assessments of hydrogen production have focused on steam methane reforming (SMR), autothermal reforming (ATR), and electrolysis, either powered by fossil fuels or increasingly by renewable electricity. However, studies combining concentrated solar power (CSP) with methane pyrolysis are limited to a small number of pilot projects and conceptual analyses, primarily located in Europe, North America, and the Middle East. Very few have examined the techno-economic feasibility of such systems in sub-Saharan Africa, despite the region’s dual advantages of abundant solar resources and large reserves of natural gas that are often flared or underutilized.

Table 1.
Key Literature Review, Showing Gaps and Limitations.
| Author/Year | Focus of Study | Key Findings | Main Limitations |
| Rodat, Abánades & Flamant (2010) [21] | Experimental evaluation of indirect-heating tubular reactors for solar methane pyrolysis | Demonstrated a 10 kW multi-tubular solar reactor (SR10) for methane pyrolysis with high CH₄ conversions and co-production of H₂ and carbon (lab-scale). | Lab-scale experimental work only; no techno-economic assessment. |
| Abbas & Daud (2010) [22] | Review: hydrogen production by methane decomposition | Comprehensive review of catalytic and non-catalytic methane decomposition routes, catalysts, reactor concepts and research gaps (i.e., catalyst deactivation, carbon handling). | Review paper, no original process-level techno-economic modelling. |
| Parkinson et al. (2019) [23] | Levelized cost / life-cycle framing of CO₂ mitigation for H₂ routes | Developed LCOC/LCCM framework across many H₂ routes; notes methane pyrolysis can be a cost-effective abatement option subject to solid-carbon value and supply-chain emissions. | Global/regional LCOH ranges, limited site-specific CSP or Africa-focused integration analysis. |
| Chaubey et al. (2013) [24] | Review of industrial & emerging H₂ production techniques | Surveyed industrial routes (SMR, ATR) and emerging techniques (plasma, thermochemical, pyrolysis), noting carbon co-product as an economic lever. | Broad review; lacks process-level cost models or CSP-integration scenarios. |
| BASF (2021) [18] | BASF methane-pyrolysis pilot | Confirms operation of a methane-pyrolysis test plant | Industry report / corporate release. |
Furthermore, while methane pyrolysis is increasingly recognized as a promising “turquoise hydrogen” pathway, offering low or near-zero direct CO₂ emissions and valuable co-production of carbon black, there is insufficient analysis of the economic advantages provided by monetizing solid carbon in developing economies. Most existing models either assume carbon black has little or no market value, or apply global market averages that may not reflect regional opportunities in petrochemicals, construction, and advanced materials sectors. Similarly, the majority of CSP integration studies have emphasized electricity generation rather than direct process heat provision for industrial applications, leaving a knowledge gap in high-temperature chemical process integration.
This study addresses these gaps by presenting a novel techno-economic analysis of solar-assisted methane pyrolysis for hydrogen production in Delta State, Nigeria. Specifically, the research pursues four interconnected objectives:
1. Develop and validate a process simulation of methane pyrolysis, including mass and energy balances, reactor performance, and hydrogen and carbon yields.
2. Model a solar tower and receiver system capable of delivering the required thermal energy input under Delta State DNI conditions.
3. Assemble a capital expenditure (CAPEX) and operational expenditure (OPEX) framework for the integrated system, explicitly incorporating the potential revenue stream from carbon black as a by-product.
4. Compute the levelized cost of hydrogen (LCOH) and determine project profitability by the following metrics: Net Present Value (NPV), Internal Rate of Return (IRR) and undiscounted and discounted payback period (PB).
By filling these gaps, the study aims to establish a regionally relevant reference case for CSP–methane pyrolysis integration in Nigeria, while also providing insights into the role of solid carbon valorization in closing the cost gap between turquoise and alternative hydrogen pathways.
2. Materials and Methods
2.1. Simulation Environment: DWSIM and Thermodynamic Framework
DWSIM is an open-source, CAPE-OPEN compliant chemical process simulator, nd it is employed as the foundational modeling environment for this study. It supports both steady-state and dynamic simulations across multiple platforms (Windows, Linux, macOS), features an intuitive graphical user interface, and includes a broad selection of thermodynamic packages and unit operations typical of advanced commercial tools. The Peng-Robinson 1978 (Advanced) equation of state (PR 78) was chosen as the primary thermodynamic model due to its proven robustness in describing phase behavior and properties of hydrocarbons and hydrogen-rich mixtures, while maintaining reasonable computational demand. Furthermore, multiple peer investigations have used DWSIM effectively for gas-phase reaction and purification systems. For instance, Adha et al. [25]. conducted dry reforming simulations in DWSIM to examine CH₄/CO₂ feed ratios, pressures, and temperatures on syngas yield and composition. In another study, Aziaba et al. [26]. used DWSIM (v6.6) in conjunction with Aspen Plus to simulate hydrogen production from ammonia feedstocks, providing a clear precedent for hybrid toolchains and modular process modeling.
Figure 3.
DWSIM Process Simulation.
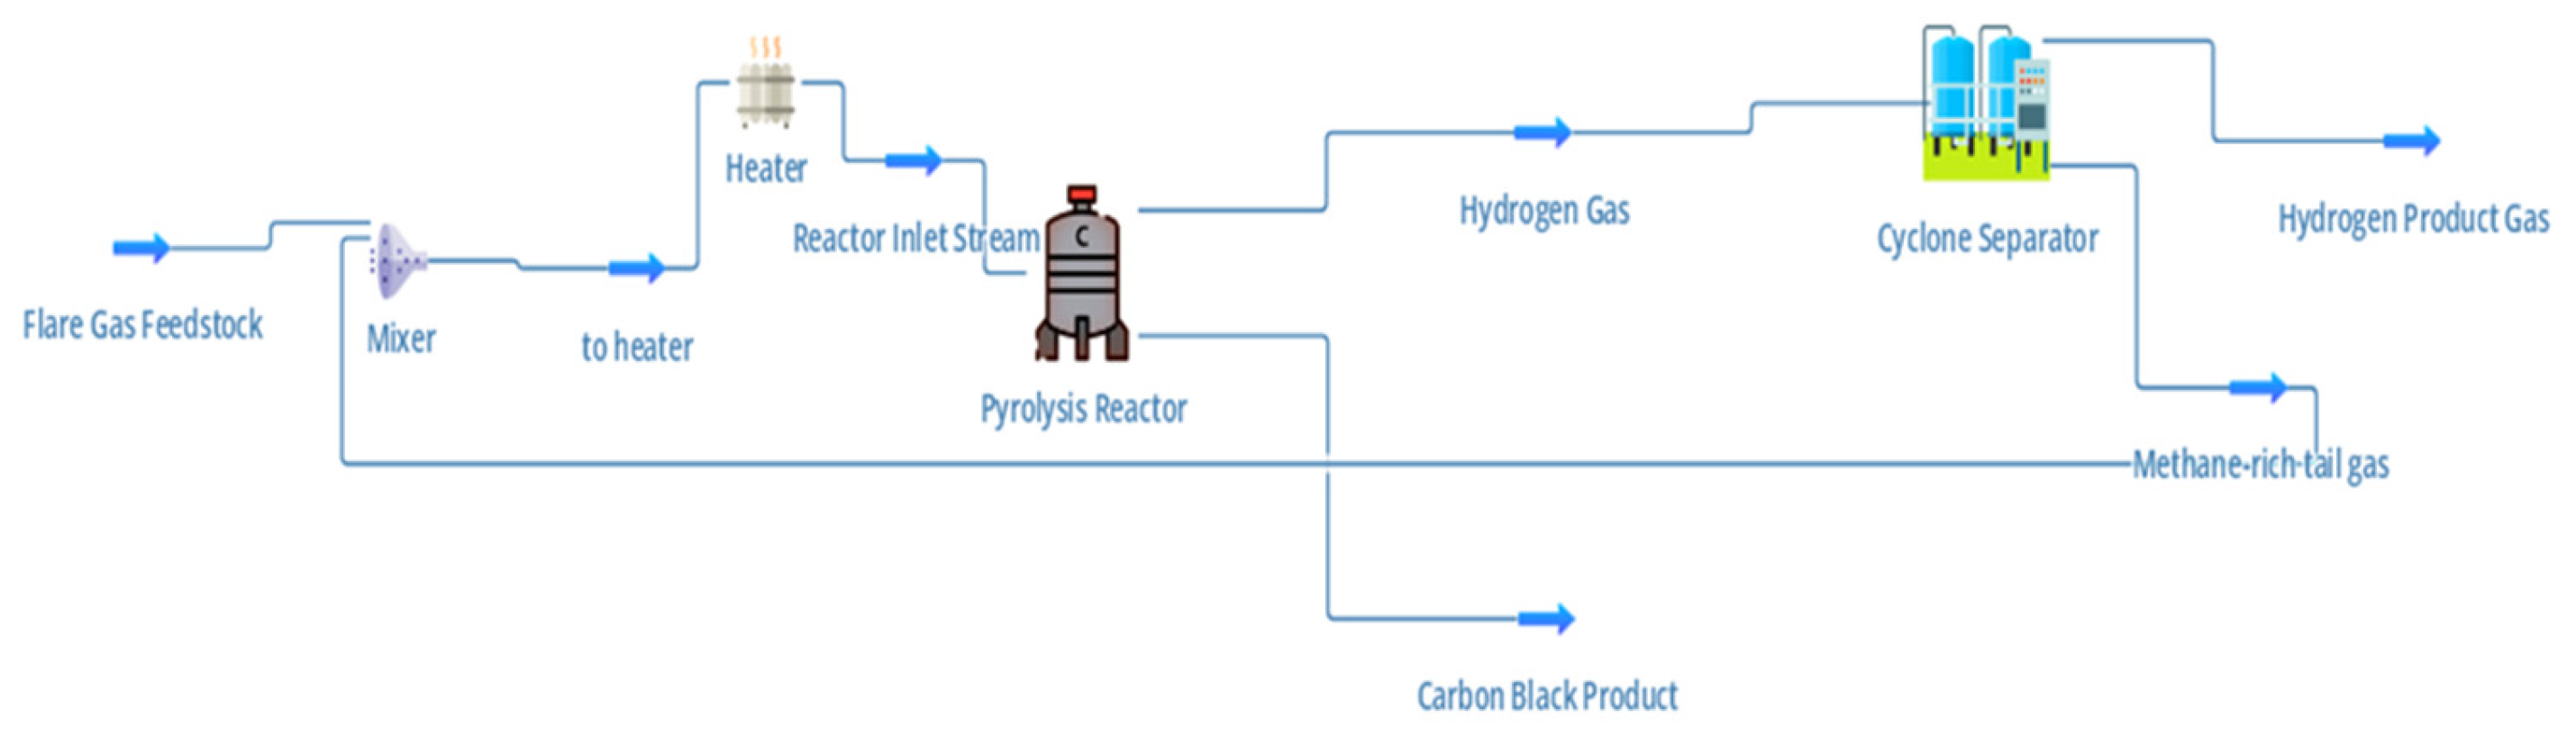
The process begins with the stranded gas (or flare gas) feedstock, representing a mixture dominated by methane, which is typically wasted through routine flaring in Nigeria’s oil-producing regions. This gas is first directed into a mixer, where it may be combined with inert carrier gases or preheated recycle streams to moderate reactor inlet conditions. Following mixing, the stream is sent to a heater, which elevates the gas temperature to the level required for pyrolysis initiation (typically 800–1000 °C, here 850 °C). In the proposed system, this thermal energy is supplied via concentrated solar tower technology, enabling direct use of renewable heat and eliminating the combustion-derived CO₂ emissions associated with conventional furnace heating.
The preheated stream enters the pyrolysis reactor, where the key endothermic reaction occurs:
The process operates without oxygen or steam, distinguishing it from steam methane reforming (SMR) by avoiding in-situ CO₂ generation. Reactor heat demandis continuously supplied by solar-derived energy, ensuring steady-state operation aligned with the diurnal variability of solar input. The carbon is collected as a solid product with potential commercial value (e.g., pigment, tire reinforcement, or battery anodes). The cleaned gas phase is further divided into a hydrogen-rich product stream and a methane-rich tail gas stream. The hydrogen-rich stream represents the target energy carrier, while the methane-rich fraction may be partially recycled to the reactor or utilized as a secondary fuel source, improving the overall process efficiency.
The integrated process thus delivers two valuable products: hydrogen as a clean energy vector, and carbon black as an industrial raw material. By using flare gas as the primary feedstock, the system simultaneously addresses environmental concerns of gas flaring and energy poverty in Nigeria. Integration with solar tower technology allows the process to exploit Nigeria’s exceptional solar resources. With Direct Normal Irradiance (DNI) levels of 2000–2200 kWh/m²/year in the southern and central regions, including Delta State, solar towers can deliver high-temperature heat reliably. Delta State is strategically chosen due to its proximity to major flare sites, existing gas infrastructure, and potential hydrogen demand from refining, petrochemicals, and fertilizer industries. Locating the facility near flare points minimizes feedstock transportation costs while simultaneously addressing environmental and social concerns associated with gas flaring.
2.1. Thermodynamic Basis for Reactor Heat Duty Calculation
The thermal energy requirement of the methane pyrolysis reactor can be expressed by combining the enthalpy of reaction with the sensible enthalpy changes of reactants and products. For the primary decomposition reaction, the general energy balance at constant pressure yields the heat duty as:
here ṅCH4 is the methane molar feed rate, ΔHrxn is the standard enthalpy of reaction, νi are stoichiometric coefficients of the products, and cp,i are their heat capacities.
Assuming constant heat capacities over the temperature range of interest, the above expression becomes:
where ΔT=Tout−Tin. This simplified expression is widely adopted for engineering design calculations, with literature values for ΔHrxn typically ranging between +75 and +90 kJ/mol of CH₄, depending on reference state and temperature. The treatment of methane pyrolysis as an endothermic process requiring both intrinsic reaction energy and sensible heat supply is consistent with detailed thermodynamic assessments.
To account for the gap between theoretical reactor heat duty and practical operation, a correction factor was applied to the calculated enthalpy demand of methane pyrolysis [27]. This approach aligns with recent pilot-scale assessments of pyrolysis systems, which consistently report conversion efficiencies below the ideal thermodynamic benchmark [28]. Correspondingly, the specific energy consumption was found to be in the range of 13–15 kWh per kg of H₂ produced, confirming the existence of substantial thermal and optical penalties at scale. In this study, a multiplicative correction factor of 1.5 was imposed on the theoretical reactor duty derived from enthalpy balance calculations, thereby ensuring consistency with experimentally validated energy intensities. This adjustment allows the simulation to reflect realistic solar-to-hydrogen conversion behavior while maintaining thermodynamic accuracy in the baseline model.
2.1. Heliostat–Tower Configuration Methodology
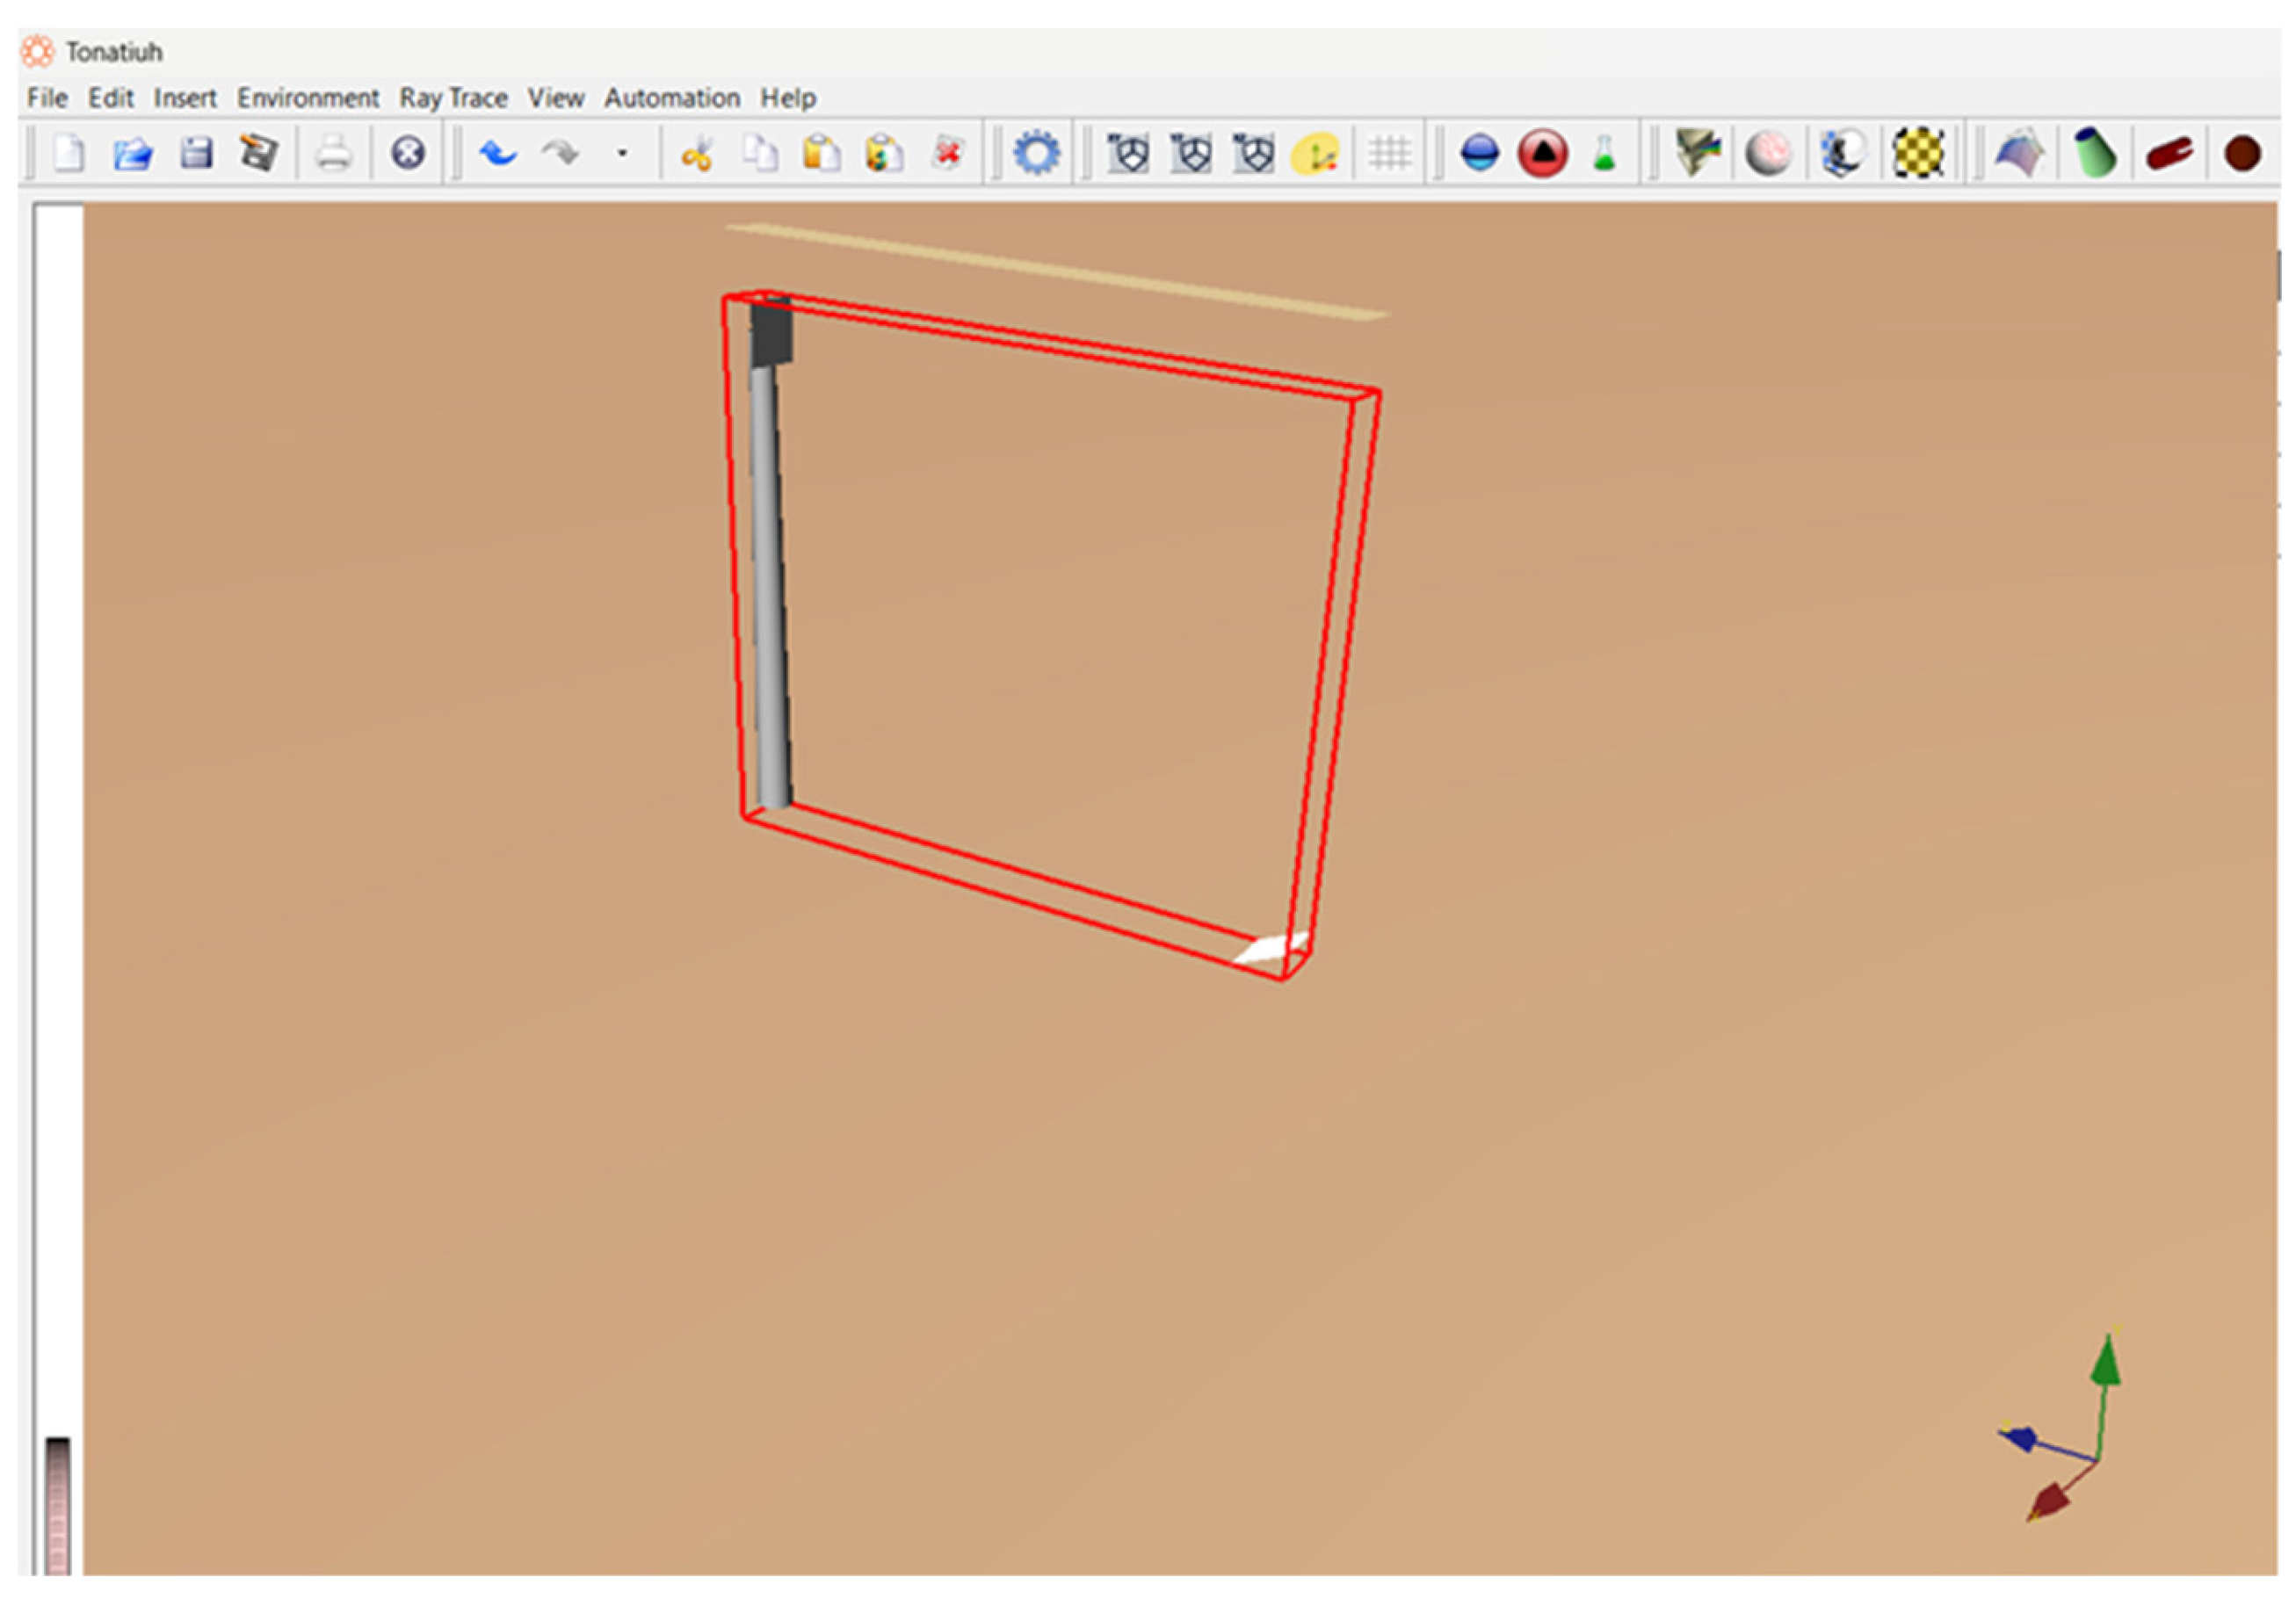
The heliostat field and tower geometry were designed and evaluated using the open-source ray-tracing software Tonatiuh. A single square heliostat of 10 m × 10 m (100 m² reflective area) was modeled and positioned at a radial distance of 30 m from the tower base. The central tower height was set at 80 m, with the receiver aperture mounted at the tower top. High-fidelity simulations in Tonatiuh were performed to generate flux maps, quantify the distribution of incident power on the receiver surface, and compute the net absorbed thermal power.
The useful thermal power delivered by heliostats to the heat-transfer fluid (HTF) is approximated by the optical chain:
where DNI = direct normal irradiance (W•m⁻²),
Ahelio = heliostat reflective area (m²),
ρ = mirror reflectivity (decimal),
ηoptical = field/optical chain efficiency (cosine, tracking, spillage, intercept),
ηrec = receiver thermal absorption efficiency.
Figure 4.
Tower, Receiver and Heliostat Architecture in Tonatiuh.
2.1. Capital Cost and Operating Expenditure Estimation
To ensure consistency and comparability in the capital cost evaluation of the CSP–methane pyrolysis system, all equipment costs were normalized using the Chemical Engineering Plant Cost Index (CEPCI) [29]. The CEPCI, published monthly by Chemical Engineering Magazine, is a composite cost indicator that reflects trends in process plant construction, including equipment, labor, and materials. Costs reported in different reference years were escalated using the standard correction relation:
where C1 is the reference cost reported in the base year with index CEPCI1, and C2 is the escalated cost in the study year with index CEPCI2. This correction ensures that all capital cost estimates are expressed in consistent economic terms for comparability with other hydrogen production pathways. The total CAPEX was obtained by summing the escalated equipment costs with installation, engineering, and contingency factors.
The operating expenditure (OPEX) of the CSP–methane pyrolysis system was evaluated by accounting for fixed and variable cost components. Fixed costs include labor, maintenance, insurance, and administrative overhead, typically estimated as a percentage of the installed capital cost. Following standard process economics practice, annual maintenance and repairs were taken as 2–5% of the total CAPEX, while operator labor requirements were benchmarked against similar pilot-scale solar-thermal facilities and adjusted for local wage structures. Variable costs, by contrast, scale with system throughput and include electricity for auxiliary equipment (e.g., compressors, pumps, tracking motors), water for cooling, and consumables. Feedstock costs were calculated from the stoichiometric methane requirement for hydrogen production, multiplied by prevailing natural gas prices. In addition, carbon handling was considered negligible at this scale due to direct solid carbon withdrawal without further processing. The total OPEX was determined by summing fixed and variable contributions on an annualized basis. This structured methodology ensures that recurring costs are consistently captured.
Table 2.
Overview of assumptions in estimating operating costs.
| Operating Cost | Detailed Estimates | Factored Estimates |
| Maintenance & Repairs | ___ | Approximated as 2–5% of installed CAPEX annually, following chemical plant heuristics. |
| Labor Costs | ___ | Scaled to plant size using typical labor-to-capacity ratios from published techno-economic studies. |
| Utilities (Water, N₂, etc.) | ___ | Estimated as a fraction (5–10%) of direct variable costs, depending on technology complexity. |
| Catalyst/Consumables | Based on methane pyrolysis catalyst replacement frequency and market cost of materials. | ___ |
| Insurance & Overheads | ___ | Calculated as percentage of fixed assets, using standard industry practice (0.5–1% of CAPEX). |
| CSP Operation | Based on mirror washing frequency, tracking system lubrication, and solar field upkeep costs observed in pilot CSP plants. | ___ |
2.1. Methodology for Economic Assessment
The economic performance of the proposed solar-assisted methane pyrolysis system was evaluated using both unit production cost and profitability metrics. The principal indicator for production cost is the Levelized Cost of Hydrogen (LCOH), defined as the ratio of total discounted costs over the project lifetime to the total hydrogen mass produced. The LCOH was expressed as:
where CAPEX represents the total installed capital investment, annualized using the capital recovery factor (CRF) and the project discount rate; OPEX covers recurring operational expenses including maintenance, utilities, and labor; Feed cost corresponds to the natural gas consumed; and Carbon net revenue accounts for potential income from the sale or credit of recovered solid carbon.
In addition to LCOH, profitability metrics were applied to assess project feasibility. The Net Present Value (NPV) was calculated by discounting annual after-tax cash flows over the plant’s lifetime to the present. The Internal Rate of Return (IRR) was determined as the discount rate at which NPV equals zero, reflecting the project’s implicit return. The Payback Period (PB) was computed both in nominal terms (undiscounted) and in discounted terms, defined respectively as the time required for cumulative cash inflows to equal the initial capital outlay, with and without discounting.
Together, these metrics provide a balanced framework: LCOH establishes competitiveness against hydrogen market benchmarks, while NPV, IRR, and PB provide investor-oriented decision criteria for profitability, risk, and capital recovery dynamics.
3. Results
Mass balance check:
ṁin =16.6667 kg•h−1
ṁout = ṁH2 + ṁC=3.95098+12.2966=16.24758 kg•h−1
Mass yields (by mass, relative to feed):
These empirical yields are consistent with the stoichiometry of the ideal reaction (theoretical mass yields: H₂ = 25%, C = 75% by mass if full conversion and no losses), and the deviations likely reflect realistic process inefficiencies.
Table 3.
Stream conditions (process streams after simulation).
| Object | Temperature (°C) | Pressure (bar) | Mass flow (kg·h⁻¹) | cp |
| Flare gas feedstock (CH₄) | 900 | 1.0125 | 16.6667 | 35.69 |
| Hydrogen product gas (H₂) | 847 | 1.0125 | 3.95098 | 28.84 |
| Carbon black product (C, s) | 853 | 1.0125 | 12.2966 | 8.53 |
3.1. Reactor Heat Duty: Derivation and Numeric Calculation
For methane pyrolysis the required thermal duty (per unit time) combines the reaction enthalpy and sensible heating of reactants and products. Assuming approximately constant molar heat capacities over the temperature range of interest, the reactor heat duty per time is:
where:
ṅCH4 is the methane molar feed rate, (kmol•h⁻¹)
ΔHrxn is the standard enthalpy of reaction, (kJ•kmol•h⁻¹)
cp,i are constant-pressure heat capacities, (kJ•kmol•h⁻¹•K⁻¹)
ΔT=Tout−Tin (K)
Molar mass CH₄: MCH4=16.04 kg•kmol− 1
Methane mass feed: ṁCH4=16.6667 kJ•kmol•h⁻¹
Molar feed rate:
Standard reaction enthalpy, ΔHrxn=74.8×10³ kJ•kmol− 1
Molar heat capacities (kJ•kmol⁻¹•K⁻¹): cp,H2 ≈28.84, cp,CH4 ≈35.69, cp,C ≈8.53
Temperature bounds for sensible heating: for the overall design duty ambient-to-reaction span was used (to capture pre-heating needs);
Tin=25 °C (298 K), Tout=900 °C (1173 K), hence ΔT=875 K.
Sensible-term coefficient:
Sensible energy per kmol over ΔT:
Total enthalpy per kmol (reaction + sensible):
Multiply by molar feed to get Q (kJ•h⁻¹):
Convert to kW (1 kW = 3,600 kJ•h⁻¹):
This value is the theoretical heat duty required to effect the stoichiometric conversion and raise streams to reaction temperature, under the stated Cp and temperature assumptions. Pilot-scale experience and experimental studies demonstrate non-negligible additional heat demand due to radiative losses, imperfect coupling between receiver and reactor, thermal gradients, parasitic loads, and transient/start-stop inefficiencies. To capture these effects, a multiplicative correction factor, fcorr, is applied to the theoretical duty. Consistent with solar-pyrolysis pilot literature, a conservative factor fcorr =1.5 was adopted
The design heat duty is therefore:
This corrected duty (44 kW) is the thermal target adopted for the CSP receiver and forms the basis for the Tonatiuh receiver sizing and the downstream matching to the DWSIM process model.
3.2. Receiver-Heliostat Matching
From (4), the useful thermal power delivered by a single heliostat to the heat-transfer fluid (HTF) can be approximated by;
Using the study baseline and a design reactor heat duty Qdesign=44.0 kW:
Baseline parameters:
DNI=950 W•m⁻².
Ahelio =100 m2 (10×10 heliostat).
ρ=0.93.
ηoptical=0.80.
ηrec=0.80
Compute intermediate and useful powers:
Mirror incident power:
Power at aperture (after reflectivity & optical losses):
Net power to HTF (after receiver losses):
Number of heliostats required:
Thus, under baseline optical/receiver assumptions a single 100 m² heliostat is sufficient to meet the 44 kW design duty.
For the Tonatiuh simulation, the geographical coordinates of Delta State, Nigeria, was used to determine sun position, global horizontal irradiance and direct normal irradiance;
The final simulation was then run, using 100 solar rays for clarity and accuracy;
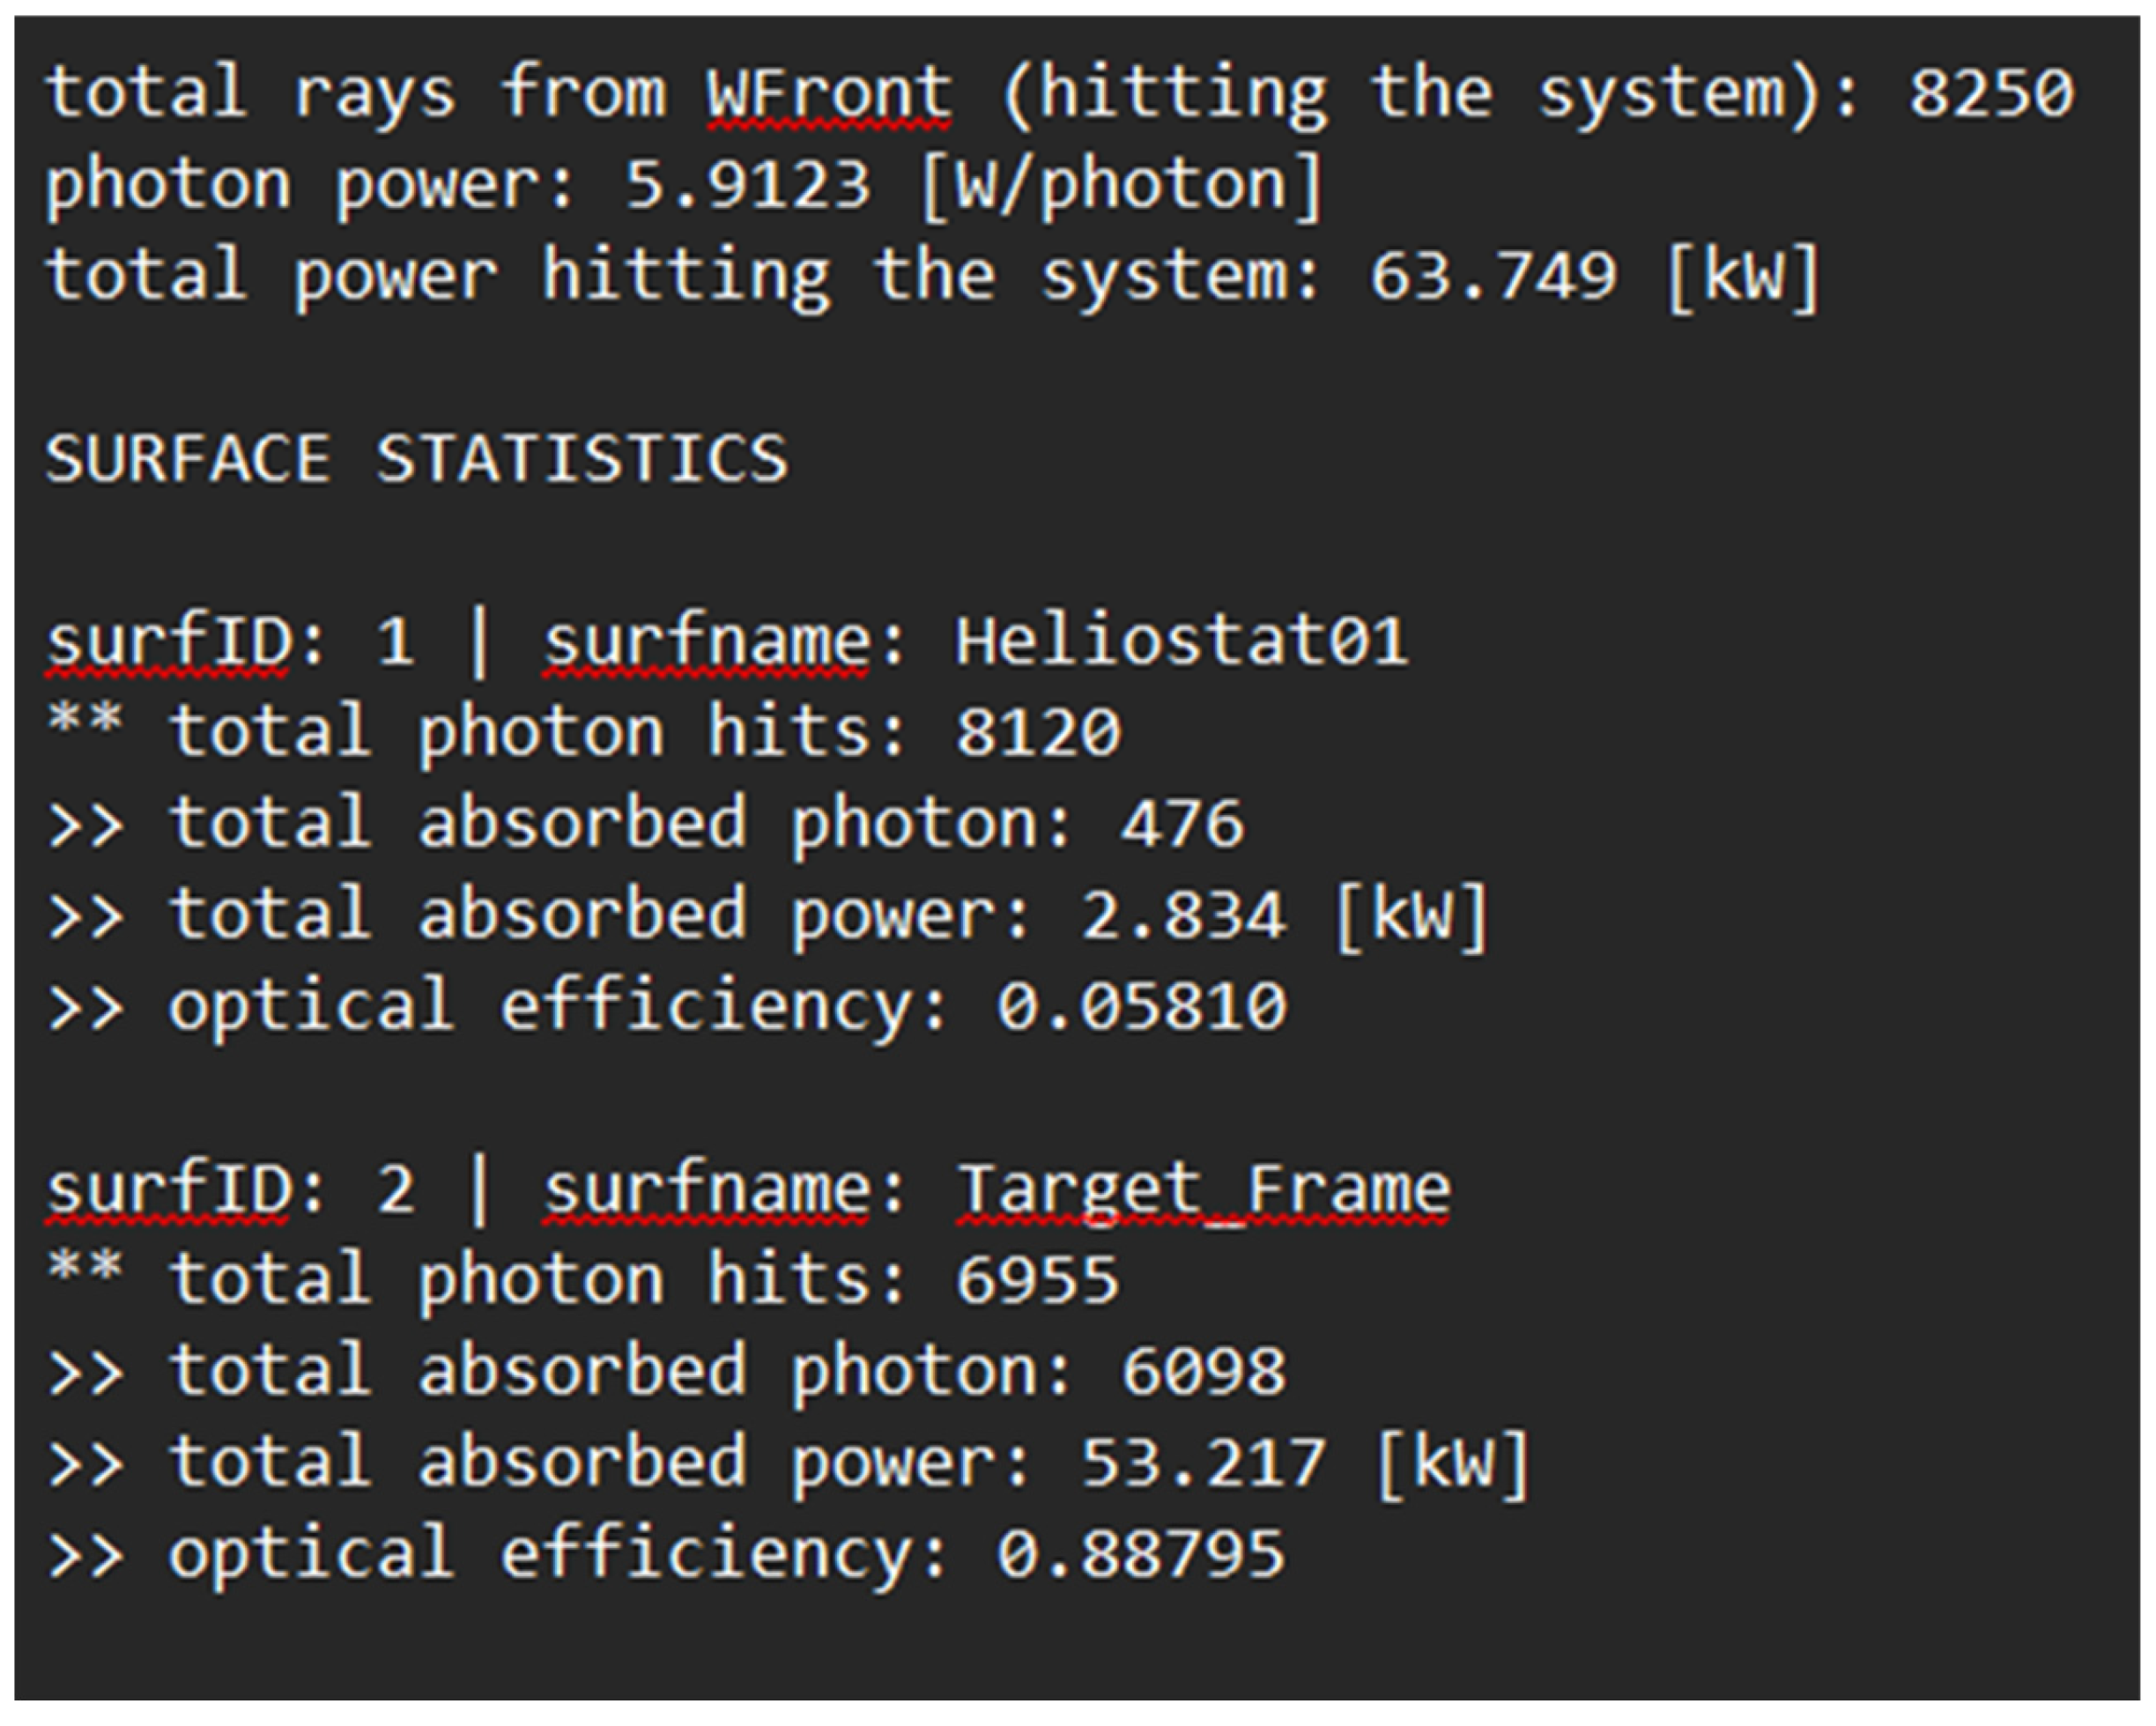
The simulation data was exported, and surface statistics were determined to sufficiently match theoretical expectations, proving the efficacy of the heliostat and receiver.
Figure 5.
Sun Position Calculator in Tonatiuh.
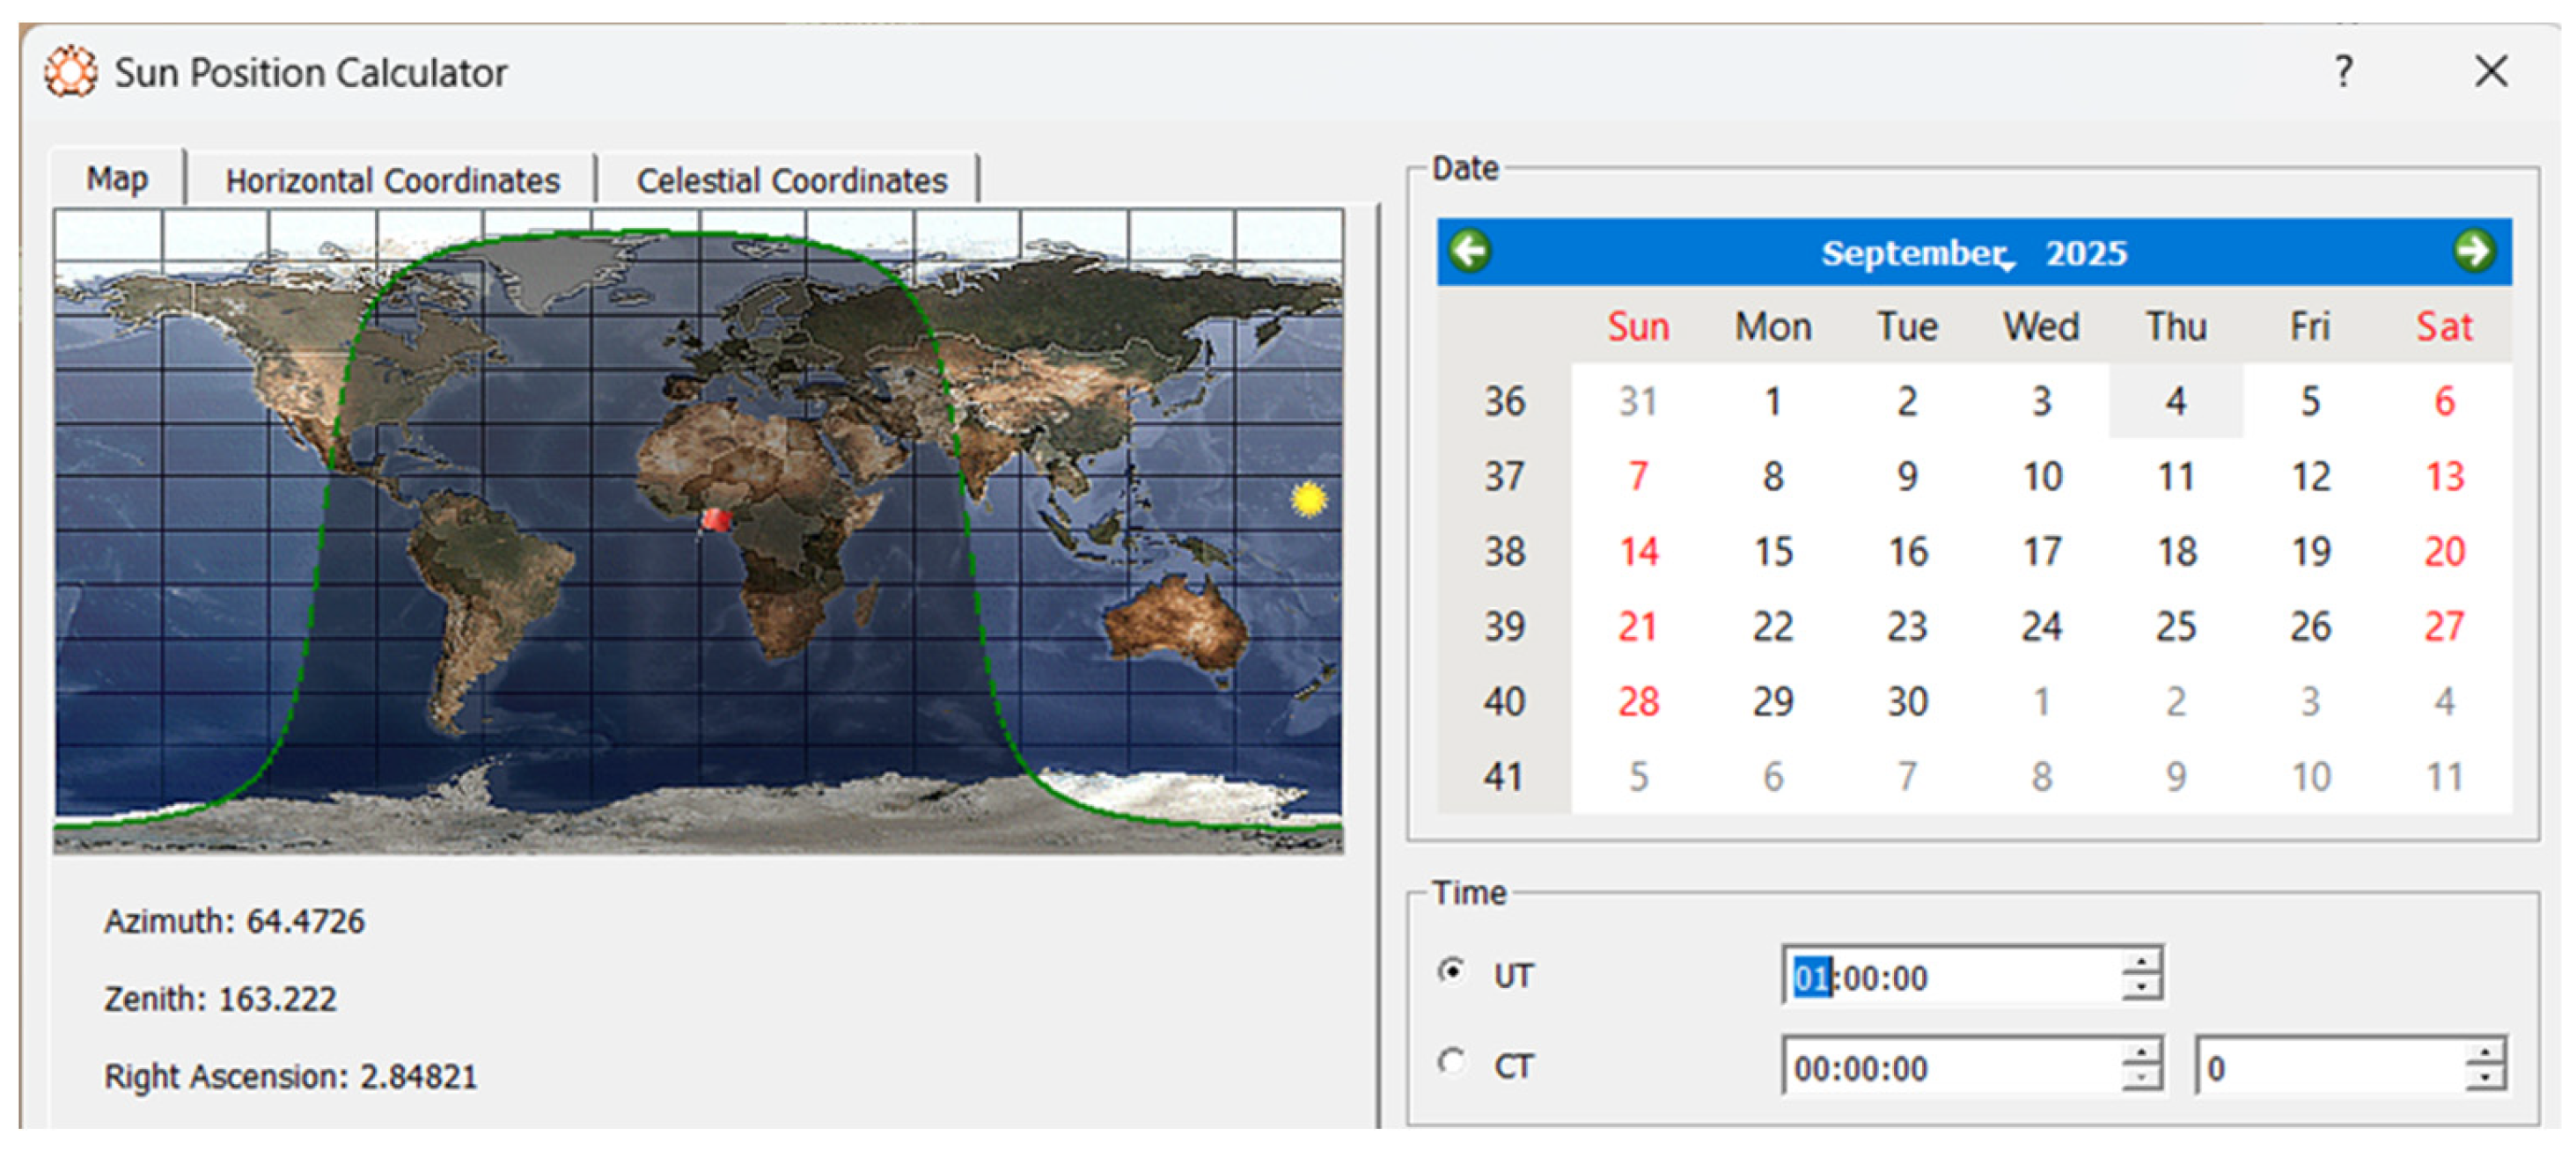
Figure 6.
Final Tonatiuh Architecture Simulation.
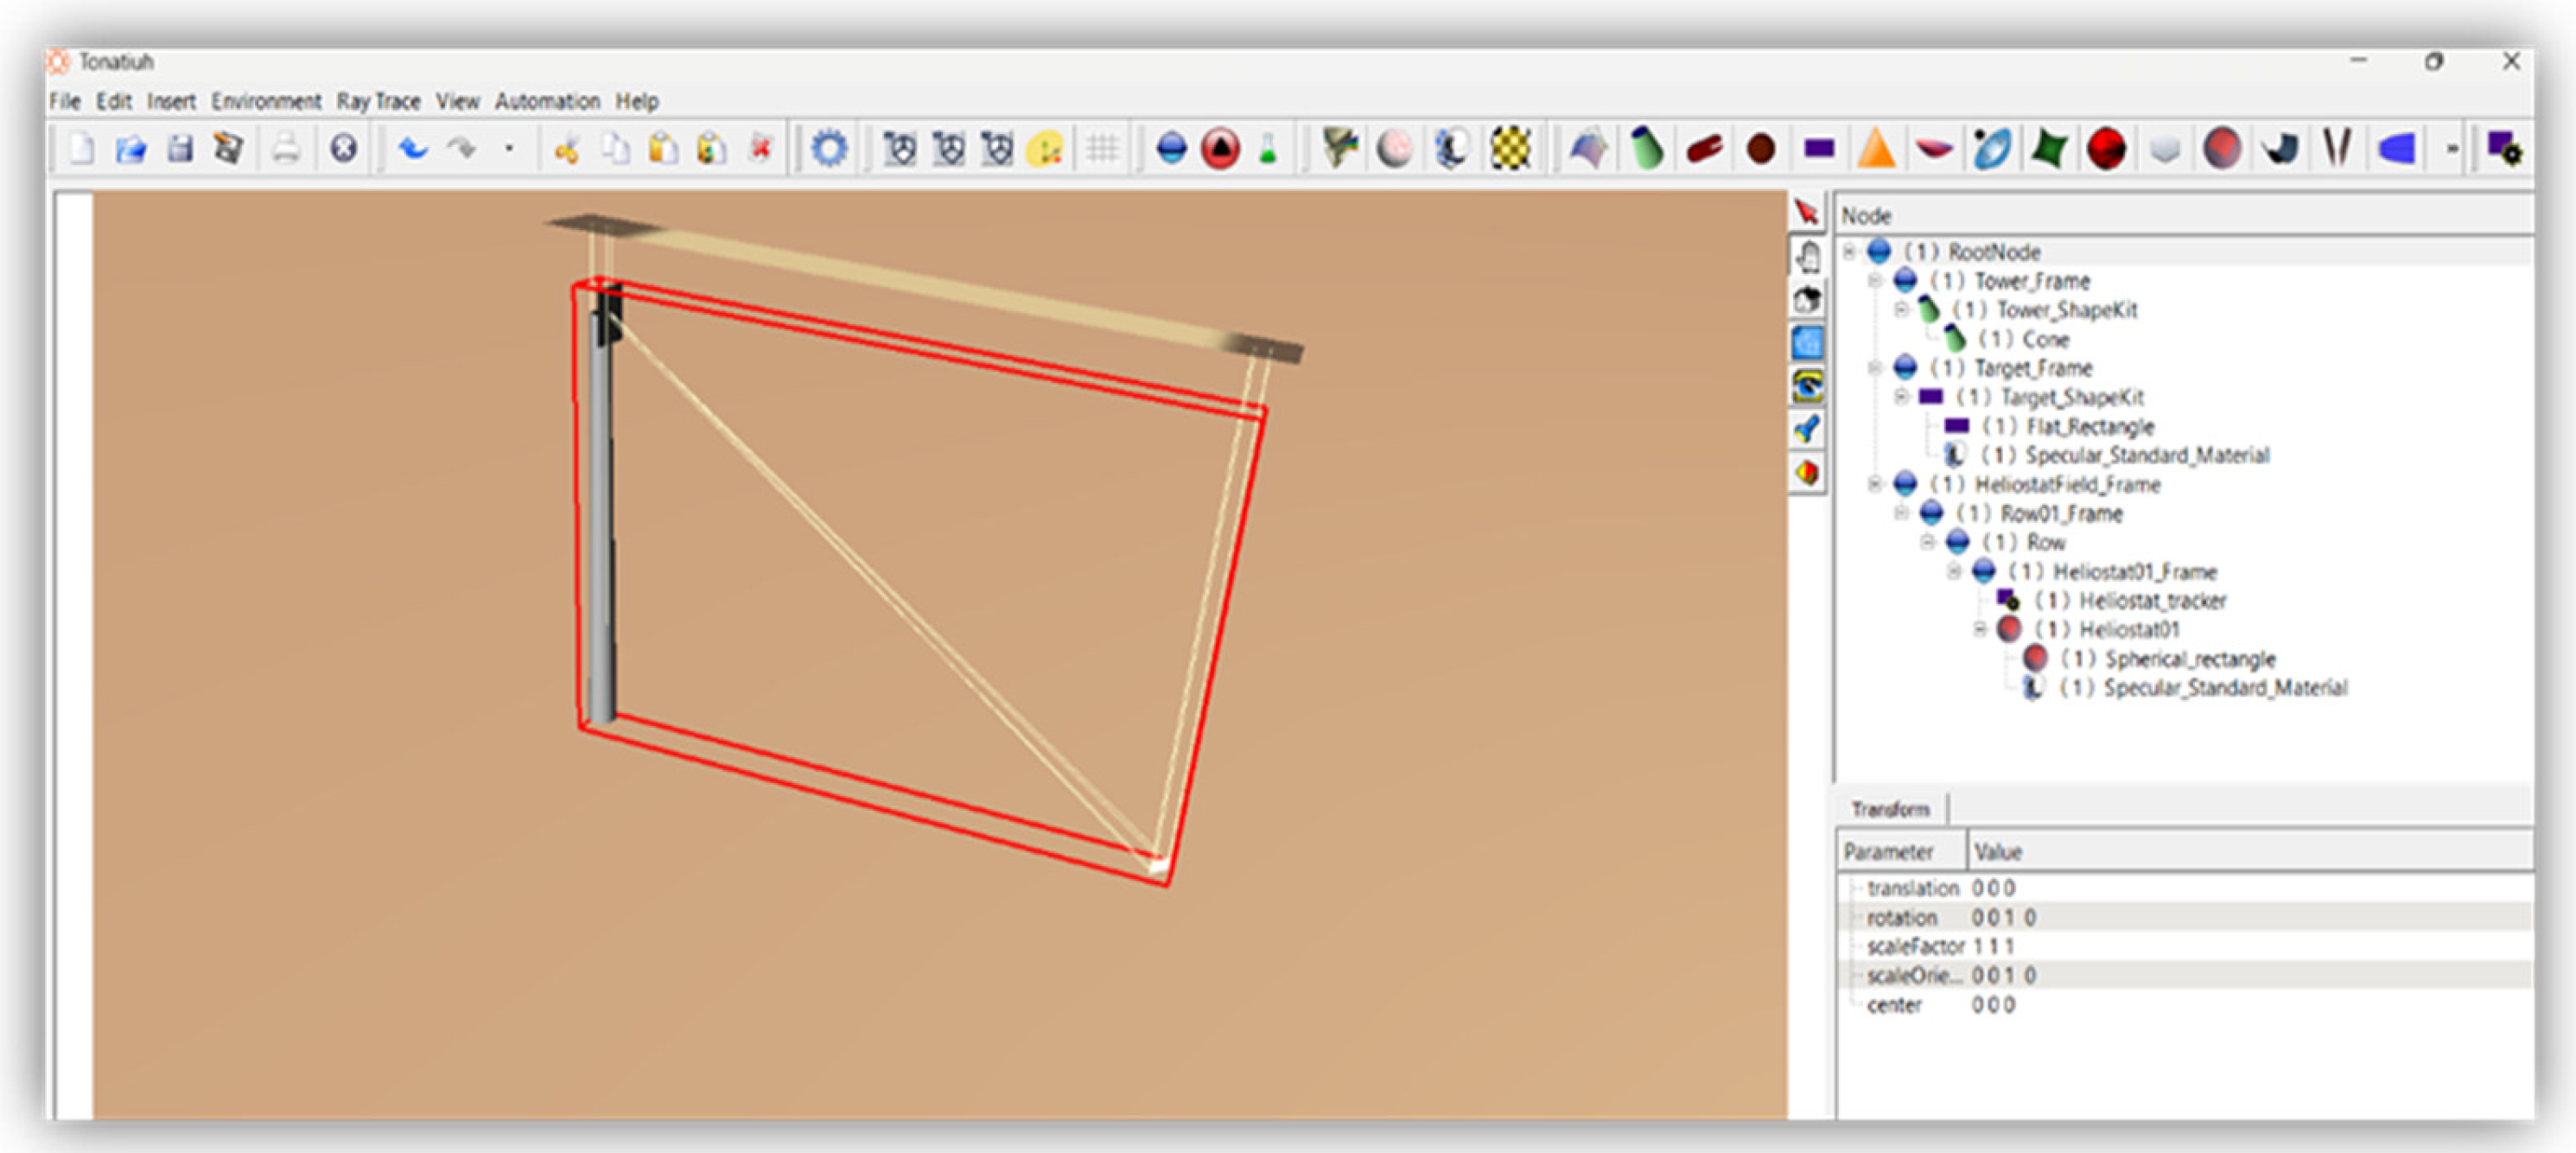
Figure 7.
Exported Tonatiuh Surface Statistics.
3.3. Capital and Operating Expenditures
The economic assessment of the proposed solar-assisted methane pyrolysis plant was undertaken by disaggregating both capital expenditure (CAPEX) and operating expenditure (OPEX) into their constituent categories. To incorporate the time value of money, this investment was annualized using a capital recovery factor based on a 20-year plant life, n, and a 10% discount rate, i;
Therefore;
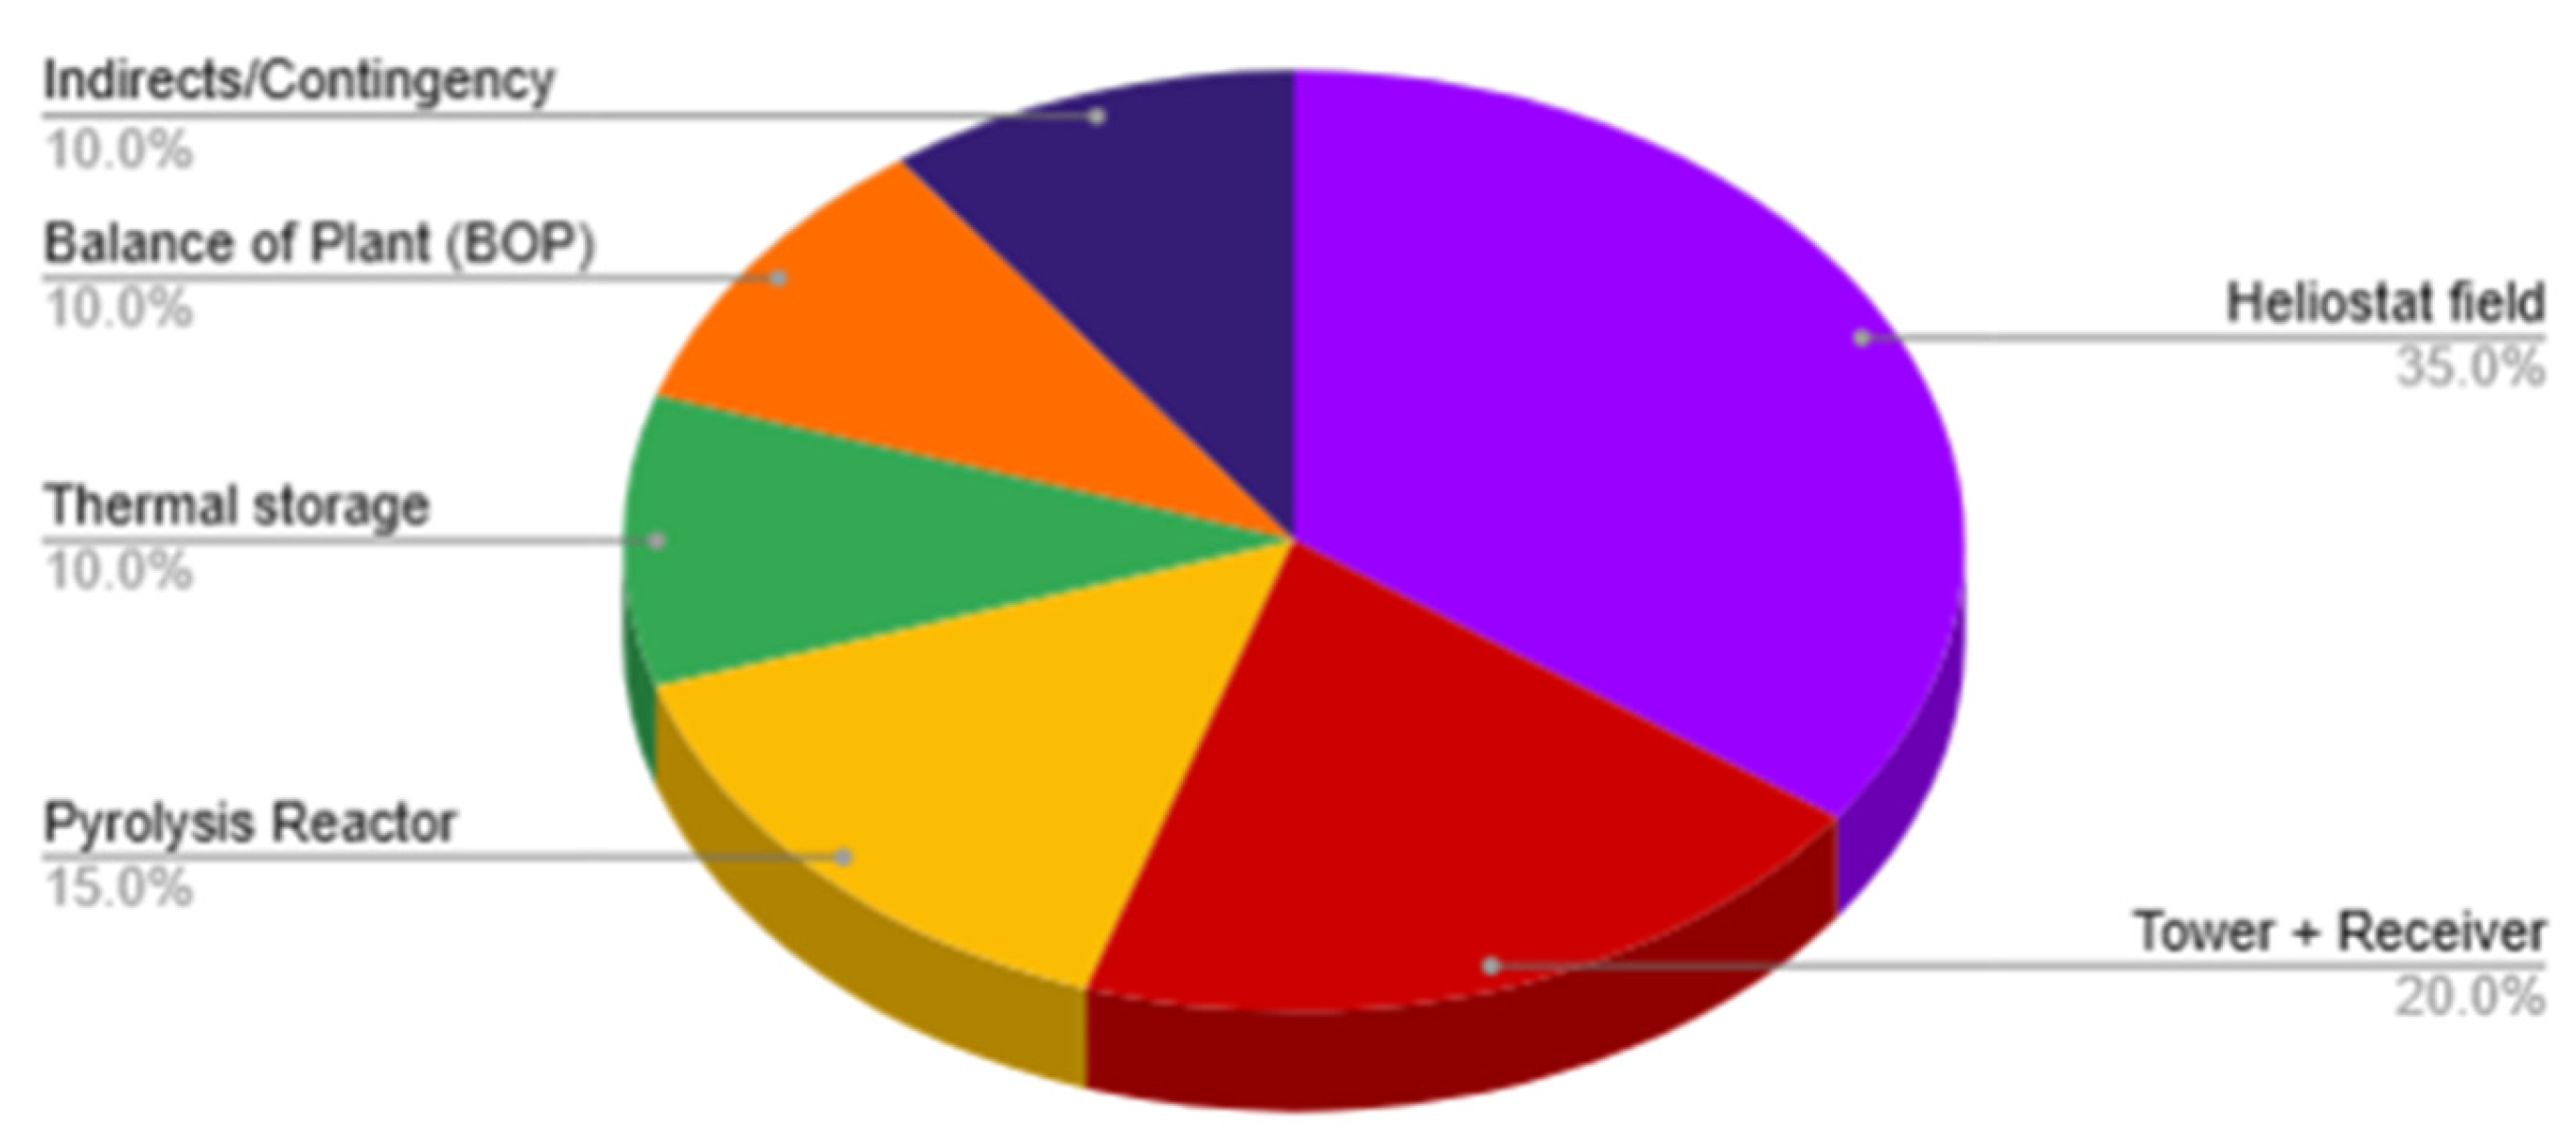
This treatment ensures comparability between capital costs and annual operating flows in the levelized cost of hydrogen (LCOH) framework. Table 1 summarizes the breakdown of CAPEX across key subsystems. The heliostat field remains the single largest component, representing 35% of total investment (~$0.53 million), followed by the tower and receiver assembly (20%, ~$0.30 million) and the methane pyrolysis reactor (15%, ~$0.23 million). Other elements such as thermal storage (10%, ~$0.15 million) and balance-of-plant (10%, ~$0.15 million) contribute modestly, while contingencies, engineering, and indirect services account for the remaining 10% (~$0.15 million). This baseline CAPEX, totaling $1,500,000, was then annualized.
This profile reflects published benchmarks where the solar field and receiver dominate the cost structure of tower-based pilot facilities. A 10% discount rate was selected for this techno-economic analysis as it reflects a balance between the required return for pilot-scale energy investments and the financial risk inherent in emerging technologies. Several hydrogen-related economic studies employ similar rates; for example, Devkota et al. uses a 25-year lifetime with a 10% discount rate and demonstrate strong investment viability [30]. Also, Musa et al. outlines a typical discount rate range of 4–12% for hydrogen production systems [31], marking 10% as a conservative yet credible assumption in contexts of elevated market and deployment risks.
Figure 8.
Project Capital Expenditure (CAPEX) Distribution.
Operating expenditures (OPEX), excluding feedstock costs, were resolved into principal categories totaling $69,580 per annum. This allocation reflects cost structures typical of solar-thermochemical pilot plants normalized to the 50 kW scale. The largest contributions arise from labor and supervision (30%, $20,874/year), covering operators, technicians, and administrative overhead, followed by maintenance and repairs (25%, $17,395/year), which include servicing of the reactor system and routine CSP mirror upkeep. Utilities (15%, $10,437/year), such as cooling water, nitrogen purge gas, and auxiliary electricity for nighttime or transient operations, represent the next largest fraction. CSP operation and cleaning (10%, $6,958/year) cover solar field upkeep, mirror washing, and tracking system lubrication. Catalyst and consumables (8%, $5,566/year) reflect periodic catalyst replacement, regeneration, and process chemicals. The residual expenditures are split between insurance and regulatory compliance (7%, $4,871/year) and miscellaneous indirect costs (5%, $3,479/year), including training, IT, and software support.
Figure 9.
Project Operating Expenditure (OPEX) Distribution.
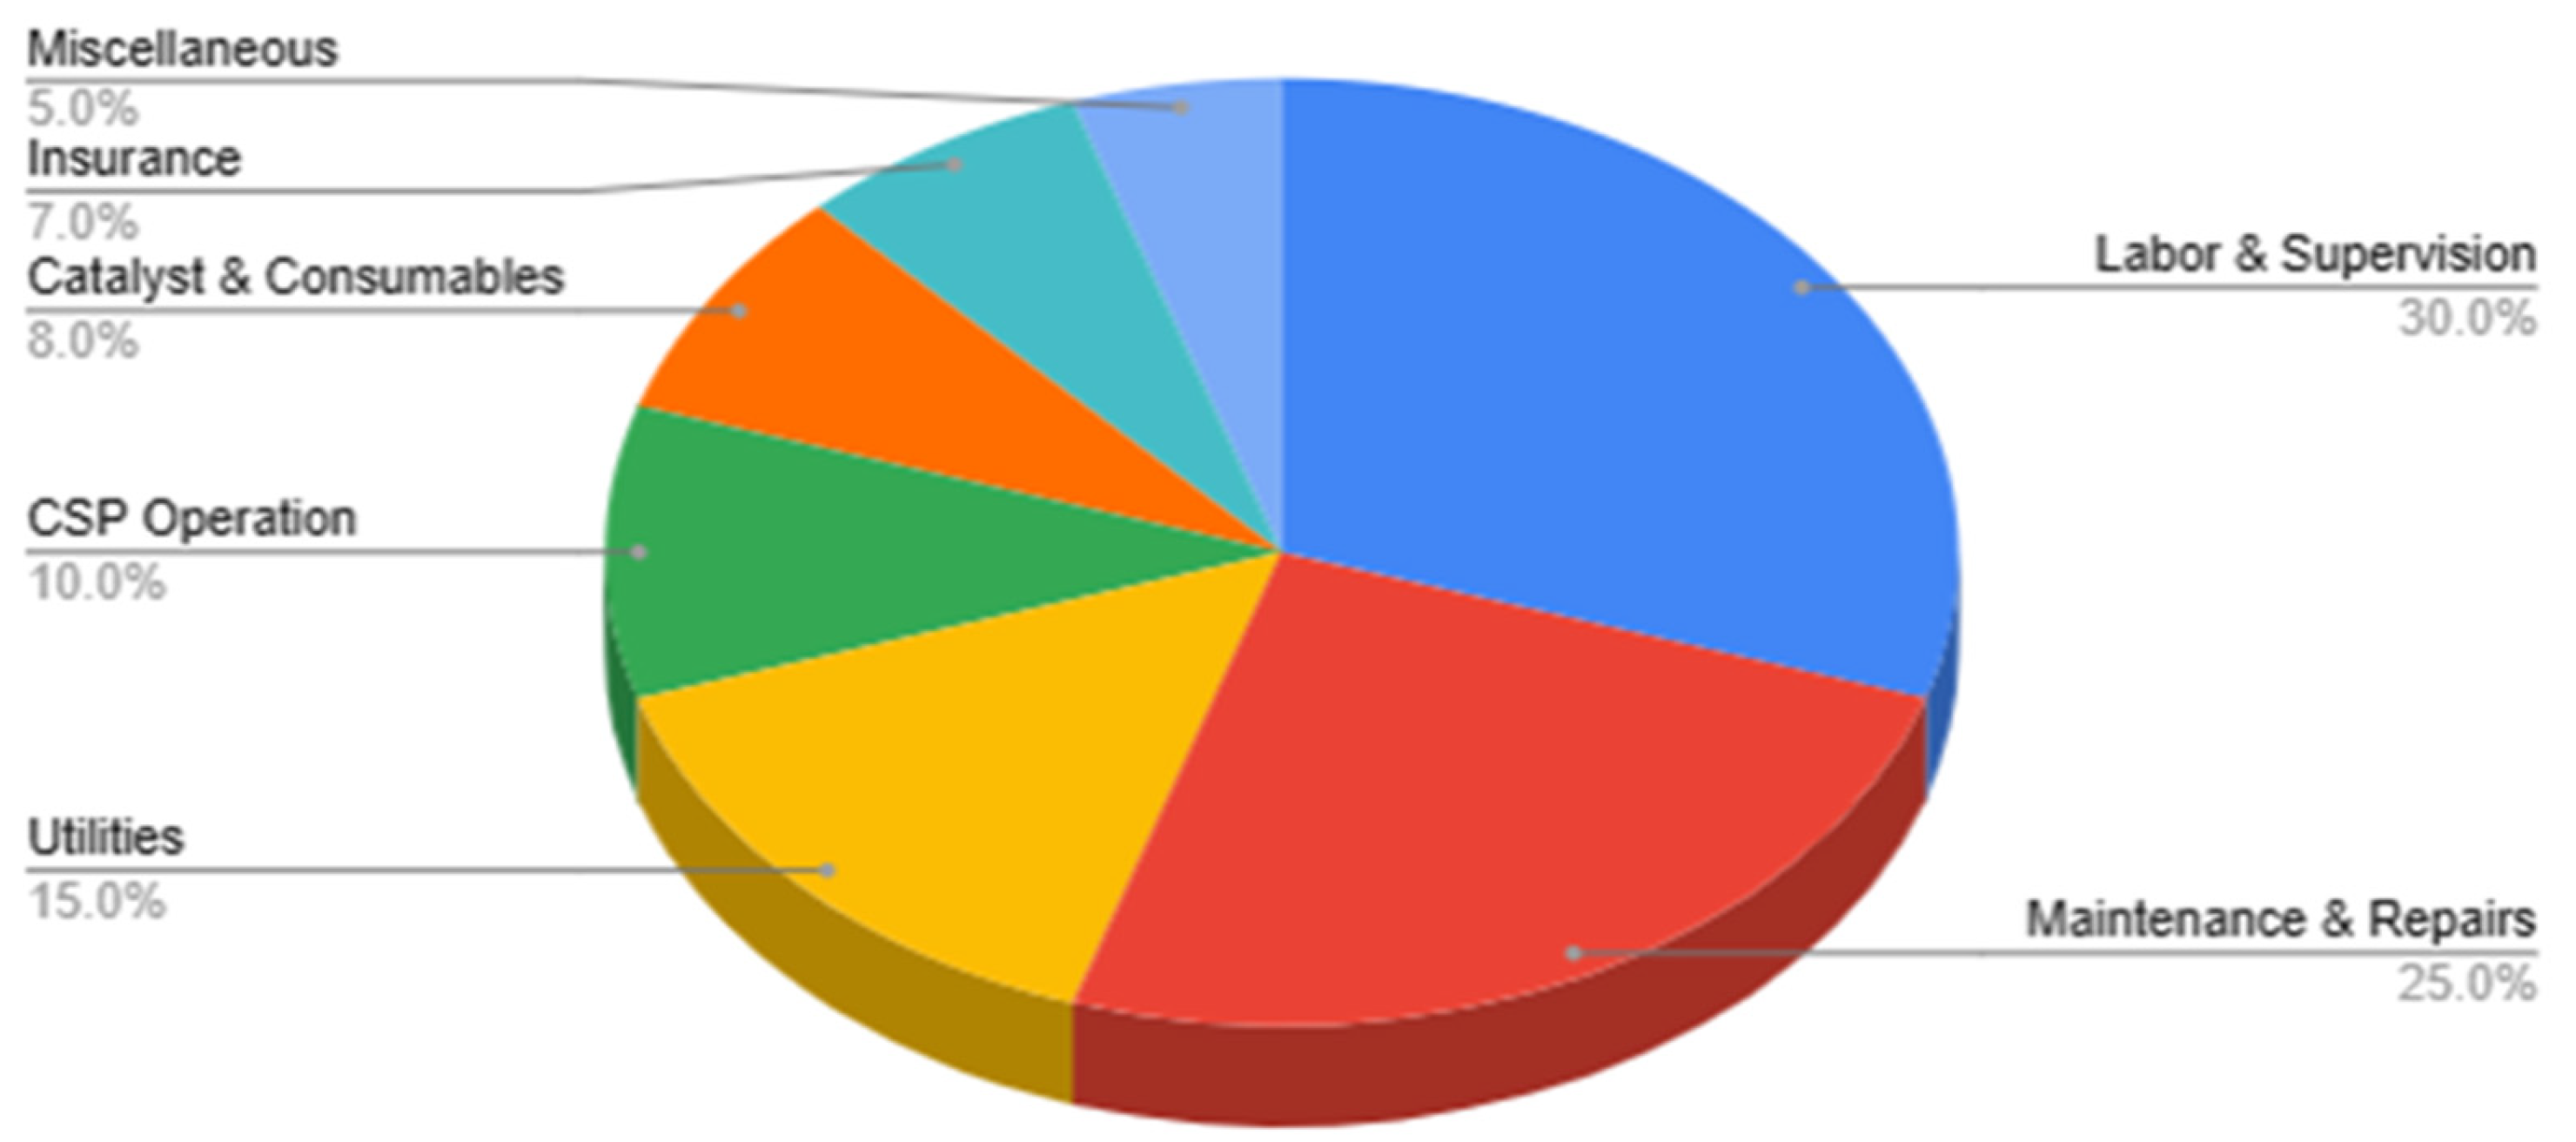
The CAPEX and OPEX profiles reveal that the heliostat field and labor/maintenance dominate capital and operating costs, respectively. The annualized CAPEX ($176,190) and OPEX ($69,580) values provide the economic basis for the subsequent calculation of levelized cost of hydrogen (LCOH), net present value (NPV), internal rate of return (IRR), and payback period (PB).
Methane feedstock cost is estimated at $43,566/year, based on 400 kg/day consumption, which corresponds to an effective rate of approximately $0.30/kg. According to a cost–benefit model in Nigeria, the capture cost is estimated at $1.86–$3.34 per Mscf (onshore) [32]. 1 Mscf of methane equals approximately 20 kg, bringing this range to $0.09–$0.17/kg. The assumed rate for this study seeks to include additional expenses such as conditioning, compression, infrastructure amortization, and regulatory compliance. Even at this rate, the cost is still very modest when it is compared to the substantial economic losses associated with flaring in Nigeria (estimated at US$761.6 million to $2.5 billion annually).
3.4. Levelized Cost of Hydrogen (LCOH) and Profitability Metrics
The levelized cost of hydrogen (LCOH) was determined according to the standard discounted cash flow formulation stated in 6:
For this pilot configuration, the annualized CAPEX was calculated as $176,190, with OPEX of $69,580 per annum. Methane feedstock costs contribute $43,566, while the sale of co-product carbon black provides a net revenue of $76,139. Substituting these values yields:
Annual Cash Flow=176,190+69,580+43,566-76,139=$213,197/yr
The annual hydrogen output is 36,336 kg H₂/year, leading to:
This baseline value is comparable to reported pilot-scale solar hydrogen pathways, though still above parity with conventional grey hydrogen.
The profitability metrics were evaluated by projecting annual net cash inflows from hydrogen and carbon sales against total investment. The Net Present Value (NPV) was calculated as:
where CFt is the annual cash flow, r is the discount rate (10%), n is the project lifetime (20 years), and I0 is the initial CAPEX. The NPV was calculated to be $0.47 million, a positive value which indicates economic viability under these baseline assumptions.
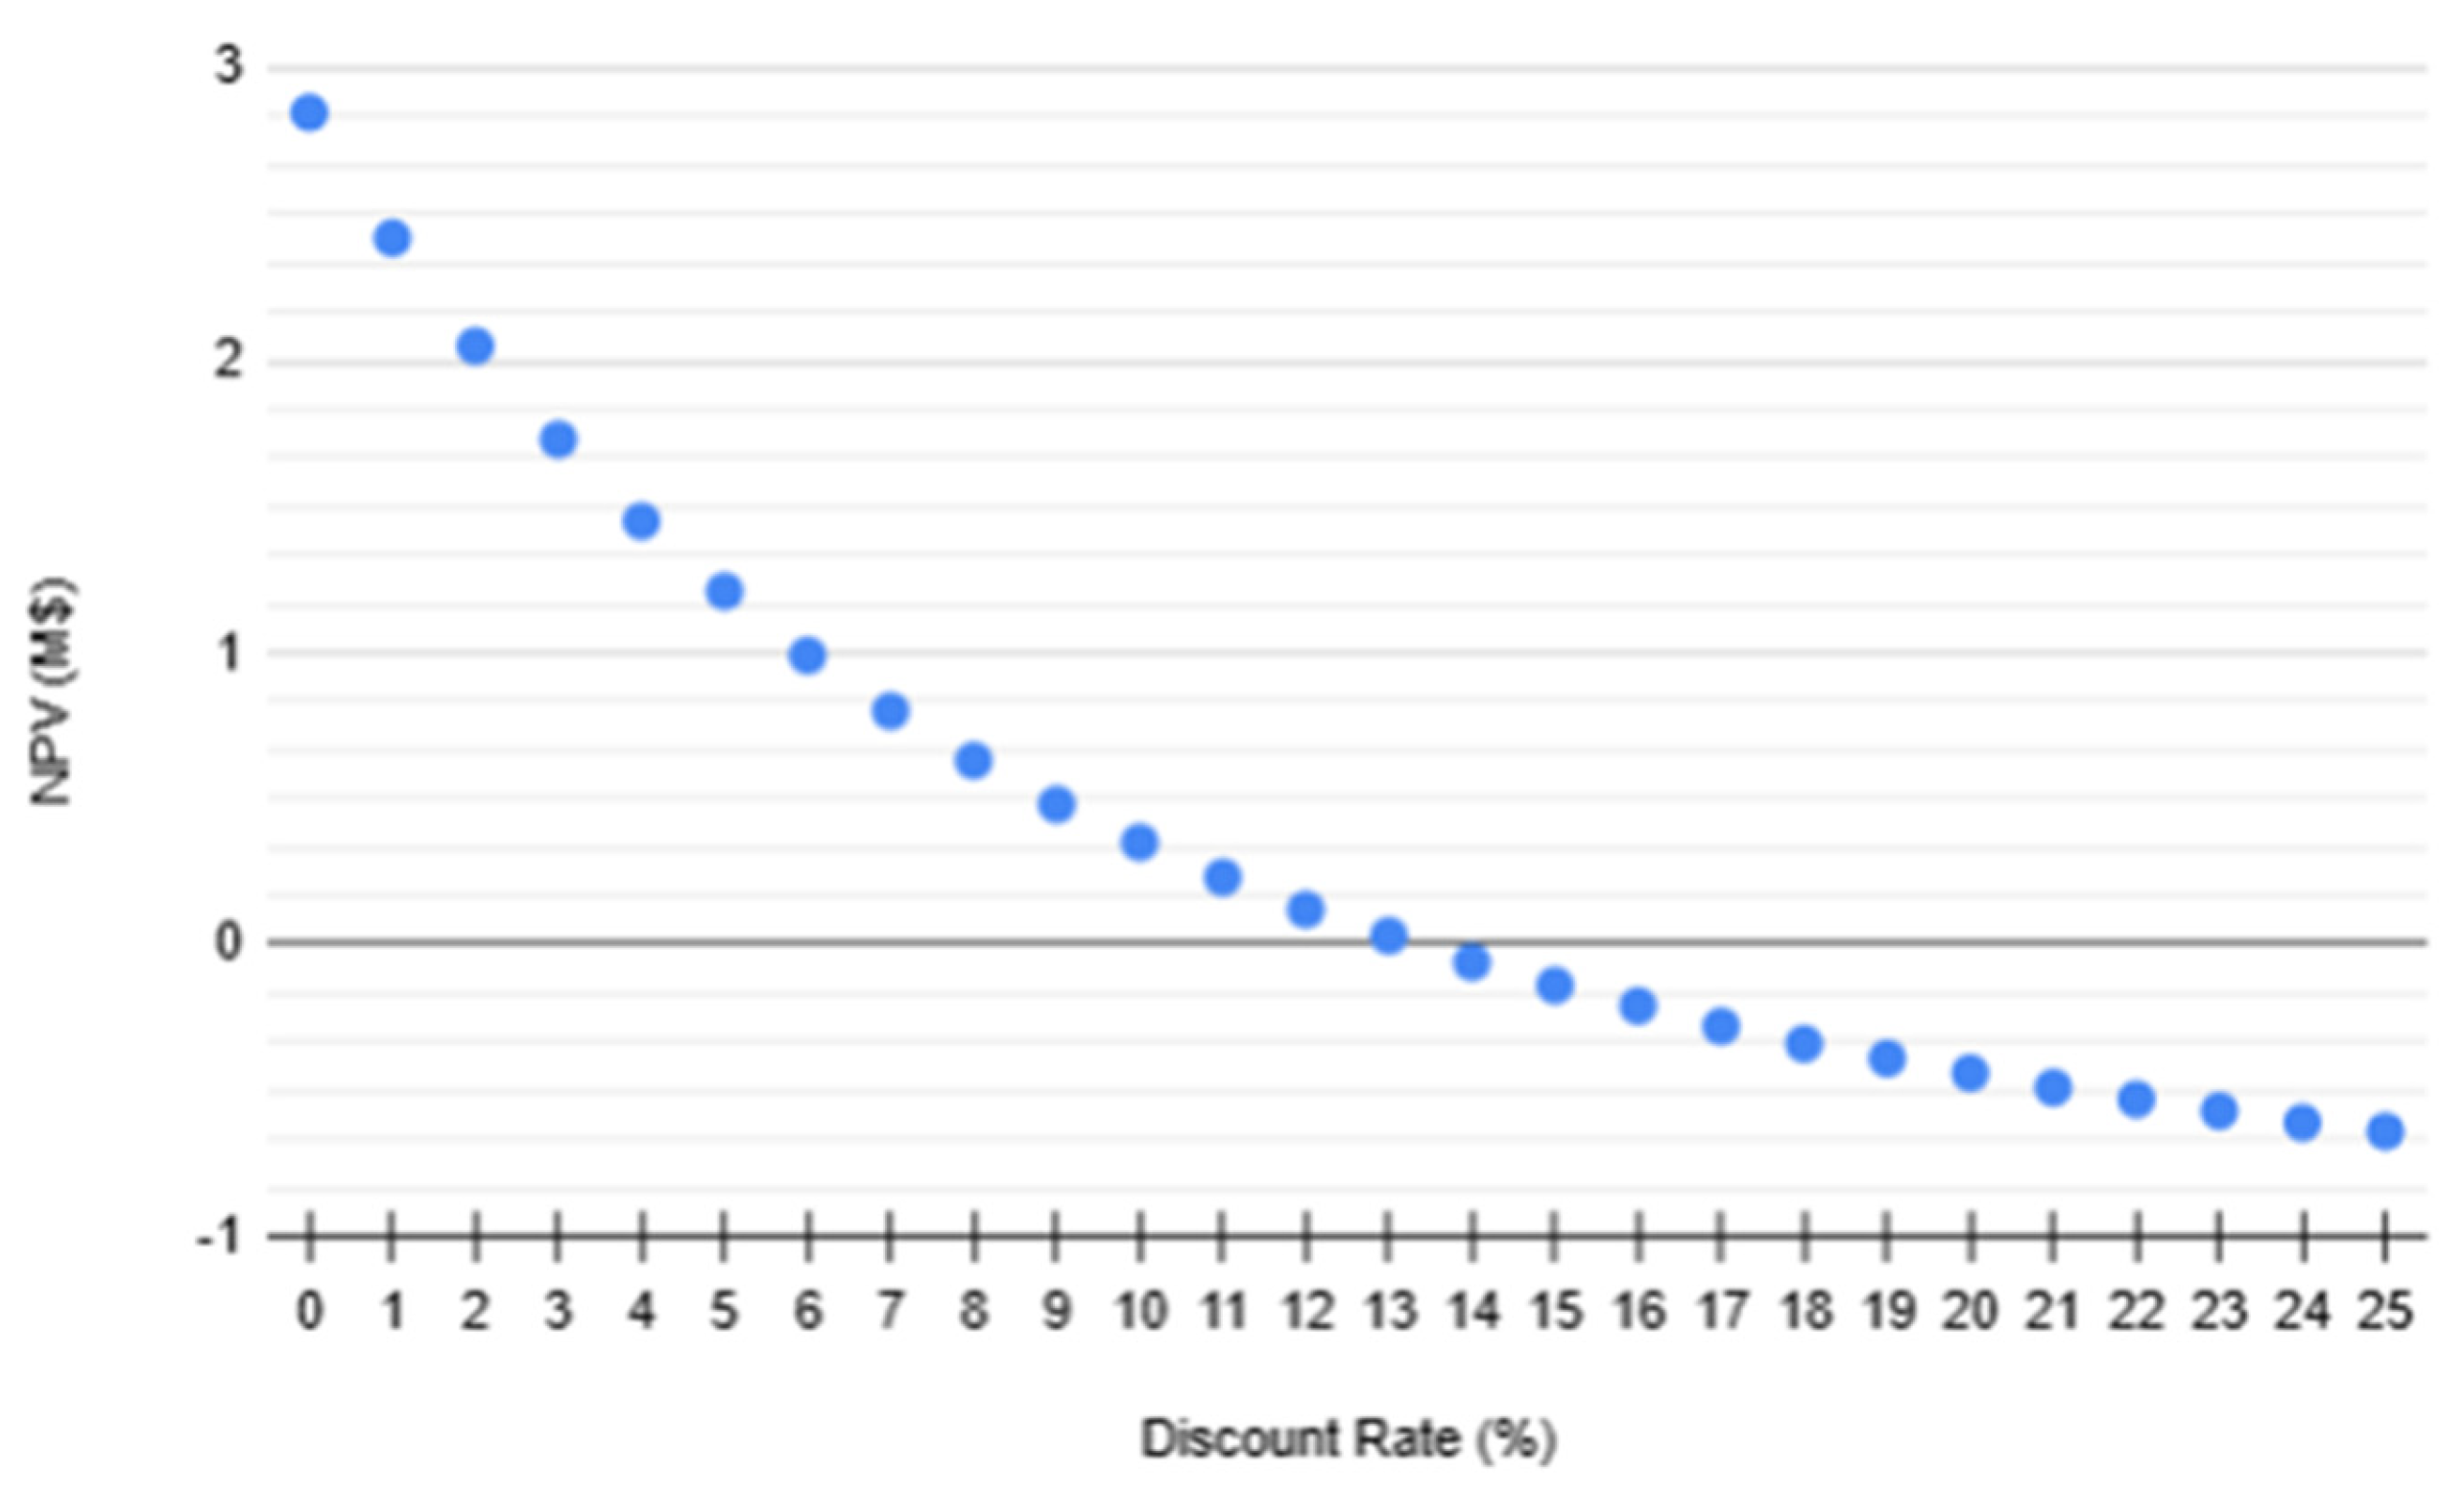
The Internal Rate of Return (IRR) is determined as the discount rate where the NPV crossed zero. From the graph, an IRR of 13% is obtained.
Figure 10.
NPV (M$) vs Discount Rate (%).
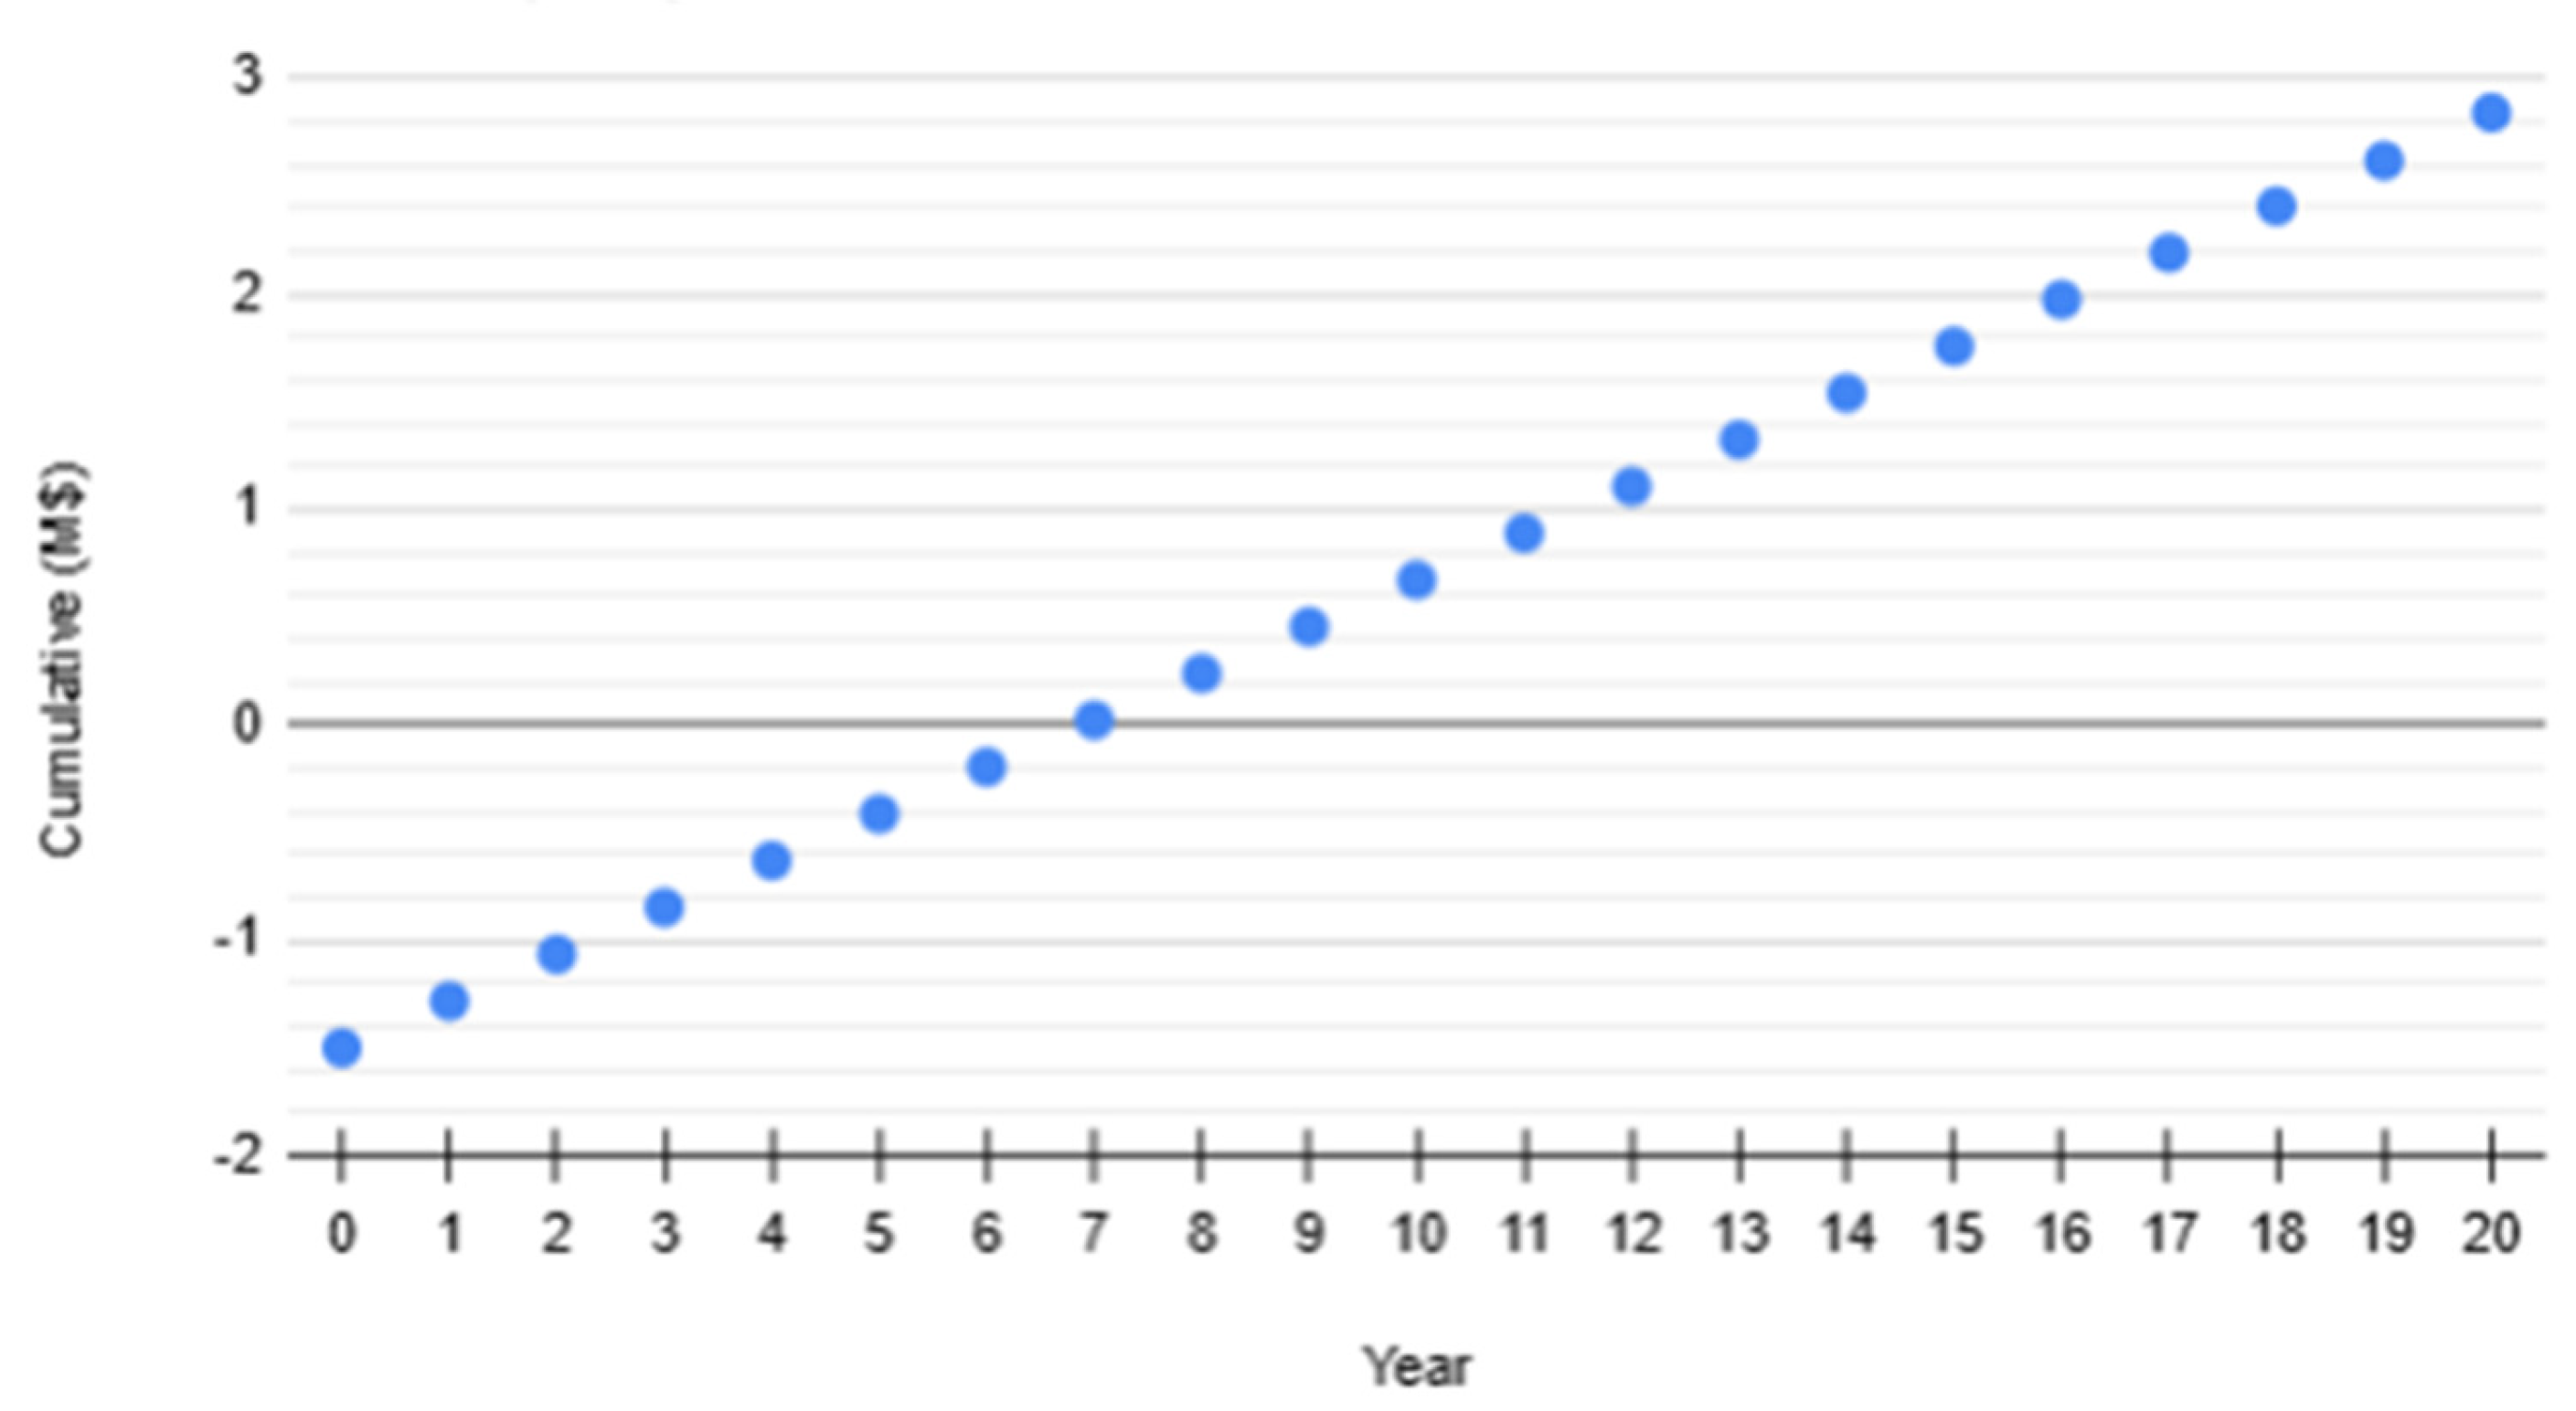
The undiscounted payback period (PB) is at 7 years, defined as the time required for cumulative undiscounted cash flows to equal initial investment.
Figure 11.
Simple Payback Period Projection.
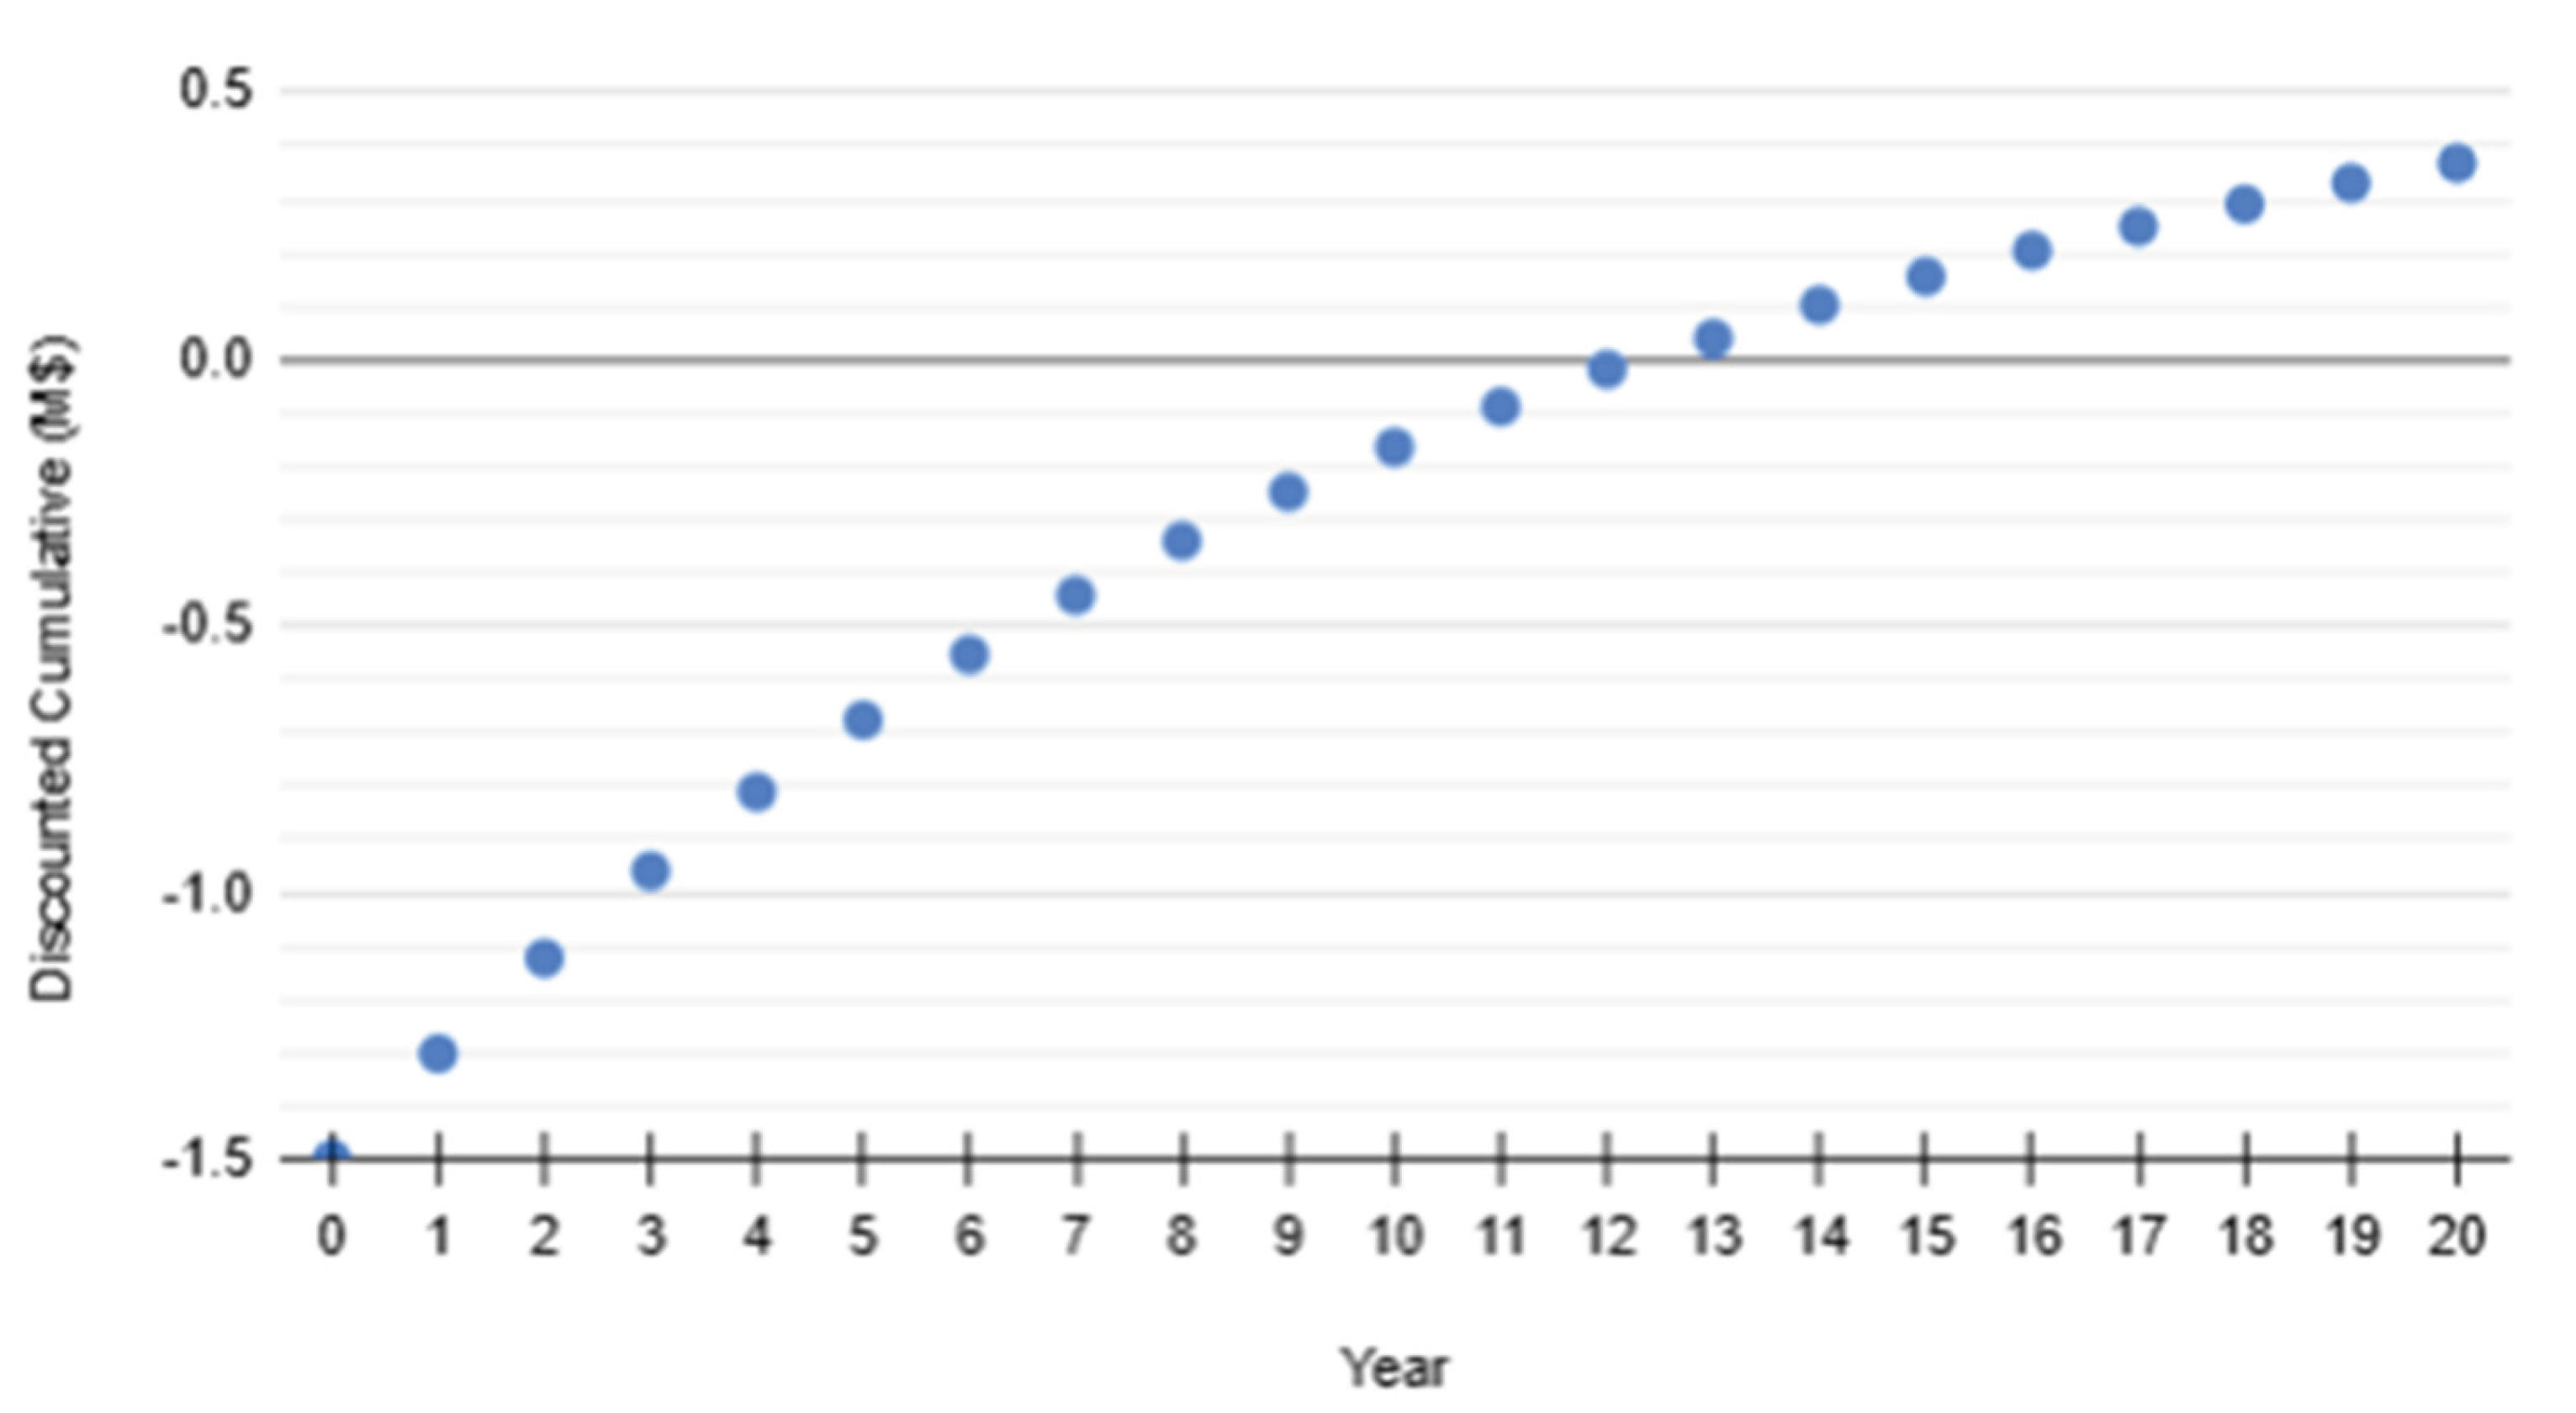
Discounted payback (10%) is determined by the time when the cumulative becomes positive, in this case between Year 12 and Year 13. The first positive is at Year 13, therefore the discounted payback is approximately 13 years.
Figure 12.
Discounted Payback Period Projection.
4. Discussion
This study has demonstrated the technical and economic feasibility of a solar-assisted methane pyrolysis pilot plant for hydrogen production in Nigeria. By coupling concentrated solar thermal input with catalytic pyrolysis of flare-derived methane, the system achieves co-production of 3.95 kg/h hydrogen and 12.3 kg/h carbon black, with a reactor duty of approximately 44 kW at 900 °C. The analysis shows that capital investment is dominated by heliostat and receiver costs, while OPEX contributions are primarily driven by labor, maintenance, and utilities. Economic assessment yielded a baseline LCOH of $5.87/kg, positioning the technology as competitive with off-grid electrolysis ($6–8/kg) but less favorable compared with blue ($2.1/kg) and gray hydrogen ($1-3.8/kg) pathways. Importantly, the system achieved a positive NPV, IRR of 13%, and discounted payback of 13 years, demonstrating that profitability is attainable under Nigerian flare-gas conditions.
Beyond cost competitiveness, the approach delivers strategic environmental benefits by valorizing associated gas that would otherwise be flared, thereby mitigating both methane and CO₂ emissions while producing low-carbon hydrogen and marketable carbon black. These results show the potential of solar-assisted pyrolysis as a transitional pathway for Nigeria’s hydrogen economy, bridging fossil resources and renewable integration. Future work should focus on scaling effects, catalyst longevity, and carbon black market integration, as well as policy frameworks that incentivize flare-gas utilization and early hydrogen adoption.
Author Contributions
Conceptualization, C.O.O. and C.N.E.; methodology, C.O.O.; software, C.O.O; validation, C.N.E; formal analysis, C.O.O AND C.N.E; investigation, C.O.O; resources,C.N.E; data curation, C.O.O; writing—original draft preparation, C.O.O; writing—review and editing, C.N.E; visualization, C.O.O; supervision, C.N.E; project administration, C.N.E; funding acquisition, C.N.E. All authors have read and agreed to the published version of the manuscript.
Funding
This research received no external funding.
Data Availability Statement
The original contributions presented in this study are included in the article. Further inquiries can be directed to the corresponding author.
Conflicts of Interest
The authors declare no conflicts of interest.
References
- Hydrogen Council & McKinsey, Global Hydrogen Flows: Hydrogen trade as a key enabler for efficient decarbonization. 2022. Available online: https://hydrogencouncil.com/wp-content/uploads/2022/10/Global-Hydrogen-Flows.pdf.
- IEA, Hydrogen, International Energy Agency. 2024. Available online: https://www.iea.org/energy-system/low-emission-fuels/hydrogen.
- McKinsey & Company, Global Energy Perspective 2023 – Hydrogen Outlook. 2023. Available online: https://www.mckinsey.com/industries/oil-and-gas/our-insights/global-energy-perspective-2023-hydrogen-outlook.
- IEA, Electrolysers, International Energy Agency. 2024. Available online: https://www.iea.org/energy-system/low-emission-fuels/electrolysers.
- IEA, GHG Emissions of Hydrogen and its Derivatives. 2023. Available online: https://www.iea.org/reports/global-hydrogen-review-2024/ghg-emissions-of-hydrogen-and-its-derivatives.
- IEA, Global Hydrogen Review 2021, International Energy Agency. 2021. Available online: https://www.iea.org/reports/global-hydrogen-review-2021.
- Ueckerdt, F.; et al. On the cost competitiveness of blue and green hydrogen. Joule 2024, 8, 300–320. Available online: https://www.sciencedirect.com/science/article/pii/S2542435123004968. [CrossRef]
- U.S. Department of Energy, Clean Hydrogen Production Cost – PEM Electrolyzer. 2024. Available online: https://www.hydrogen.energy.gov/docs/hydrogenprogramlibraries/pdfs/24005-clean-hydrogen-production-cost-pem-electrolyzer.pdf.
- Webb, J.; et al. The application of green finance to the production of blue and green hydrogen. Renew. Energy 2023, 219, 119236. [Google Scholar] [CrossRef]
- IEA, Global Hydrogen Review 2024, International Energy Agency. 2024. Available online: https://www.iea.org/reports/global-hydrogen-review-2024.
- Schmigalla, M.; et al. Methane pyrolysis: An emerging low-CO₂ hydrogen production process. Ind. Eng. Chem. Res. 2021, 60, 8737–8752. [Google Scholar]
- Timmerberg, S.; Kaltschmitt, M.; Finkbeiner, M. Techno-economic and environmental assessment of methane pyrolysis for low-emission hydrogen. Energy Environ. Sci. 2024, 17, 1482–1500. [Google Scholar]
- Monolith, The Monolith Process. 2023. Available online: https://carbonblack.monolith-corp.com/pyrolysis.
- BASF, Methane pyrolysis – A possible game changer for hydrogen. 2021. Available online: https://report.basf.com/2021/en/shareholders/basf-on-the-capital-market/methane-pyrolysis.html.
- Monolith Inc., Monolith Carbon Black: Cleanly made, sustainable carbon blacks. 2021. Available online: https://monolith-corp.com/storage/documents/media-kit/21-mono-0069-carbon-black-brochure-fin.pdf.
- Penn State EME 812, Concentrating Solar Power: Utility Solar Power and Concentration, n.d. Available online: https://www.e-education.psu.edu/eme812/node/646.
- The economics of concentrating solar power (CSP): Assessing cost competitiveness and deployment potential. Renew. Sustain. Energy Rev. 2024, 200, 114551. [CrossRef]
- D. Faille and P. Haessig, “Heliostat aiming points optimization for Concentrated Solar Power plant,” POWID 2017, Cleveland, OH. 2017. Available online: https://hal.science/hal-01912767v1/document.
- Reuters, “Nigeria’s TotalEnergies deal marks shift to gas development,” 2025. Available online: https://www.reuters.com/business/energy/nigerias-totalenergies-deal-marks-shift-gas-development-2025-09-03/.
- SolarPACES Guardian, “Gas-centric transition strategy to curb flaring by 2030 – NUPRC,” 2025. Available online: https://guardian.ng/energy/gas-centric-transition-strategy-to-curb-flaring-by-2030-nuprc/.
- Rodat, S.; Abánades, S.; Flamant, G. Experimental evaluation of indirect heating tubular reactors for solar methane pyrolysis. Int. J. Chem. Reactor Eng. 2010, 8, 1. [Google Scholar] [CrossRef]
- Abbas, H.F.; Daud, W.M.A.W. Hydrogen production by methane decomposition: A review. Int. J. Hydrogen Energy 2010, 35, 1160–1190. [Google Scholar] [CrossRef]
- Parkinson, B.; et al. Levelized cost of CO₂ mitigation from hydrogen production routes. Energy Environ. Sci. 2019, 12, 19–40. [Google Scholar] [CrossRef]
- Chaubey, R.; et al. A review on development of industrial processes and emerging techniques for hydrogen production from renewable sources. Renew. Sustain. Energy Rev. 2013, 23, 443–462. [Google Scholar] [CrossRef]
- Adha, A.; Rahmadi, R. Comparative performance analysis of catalysts for syngas production from biogas: A simulation study using DWSIM. Period. Polytech. Chem. Eng. 2024, 68, 665–679. [Google Scholar] [CrossRef]
- Aziaba, K.; et al. High purity hydrogen from liquid NH₃ – Proposal and evaluation of a process chain. Chem. Eng. Trans. 2022, 96, 169–174. [Google Scholar]
- Kolenchukov, O.A.; et al. Numerical and experimental study of heat transfer in a high-temperature solar reactor. Energies 2023, 16, 6086. [Google Scholar] [CrossRef]
- Daugaard, D.E.; Brown, R.C. Enthalpy for pyrolysis for several types of biomass. Iowa State Univ., 2003. Available online: https://dr.lib.iastate.edu/server/api/core/bitstreams/2e5490ab-a079-4d56-aeb3-cb628a1b88f0/content.
- Chemical Engineering, “Chemical Engineering Plant Cost Index (CEPCI) 2023,” 2023. Available online: https://www.chemengonline.com/news/chemical-engineering-plant-cost-index-cepci/.
- Devkota, S. Techno-economic and environmental assessment of hydrogen production through ammonia decomposition. Appl. Energy 2024, 358, 226050. [Google Scholar] [CrossRef]
- Musa, M. Techno-economic assessment of natural hydrogen from geologic accumulations. Int. J. Hydrogen Energy 2024, 93, 1283–1294. [Google Scholar] [CrossRef]
- Chukuwendu, U.M.; et al. Economic viability of gas-flaring reduction in Nigeria. Int. Res. J. Modernization Eng. Tech. Sci. 2025, 7, 1032–1045. [Google Scholar]
Disclaimer/Publisher’s Note: The statements, opinions and data contained in all publications are solely those of the individual author(s) and contributor(s) and not of MDPI and/or the editor(s). MDPI and/or the editor(s) disclaim responsibility for any injury to people or property resulting from any ideas, methods, instructions or products referred to in the content. |
© 2025 by the authors. Licensee MDPI, Basel, Switzerland. This article is an open access article distributed under the terms and conditions of the Creative Commons Attribution (CC BY) license (http://creativecommons.org/licenses/by/4.0/).
Copyright: This open access article is published under a Creative Commons CC BY 4.0 license, which permit the free download, distribution, and reuse, provided that the author and preprint are cited in any reuse.


