
Submitted:
26 November 2025
Posted:
27 November 2025
You are already at the latest version
Abstract
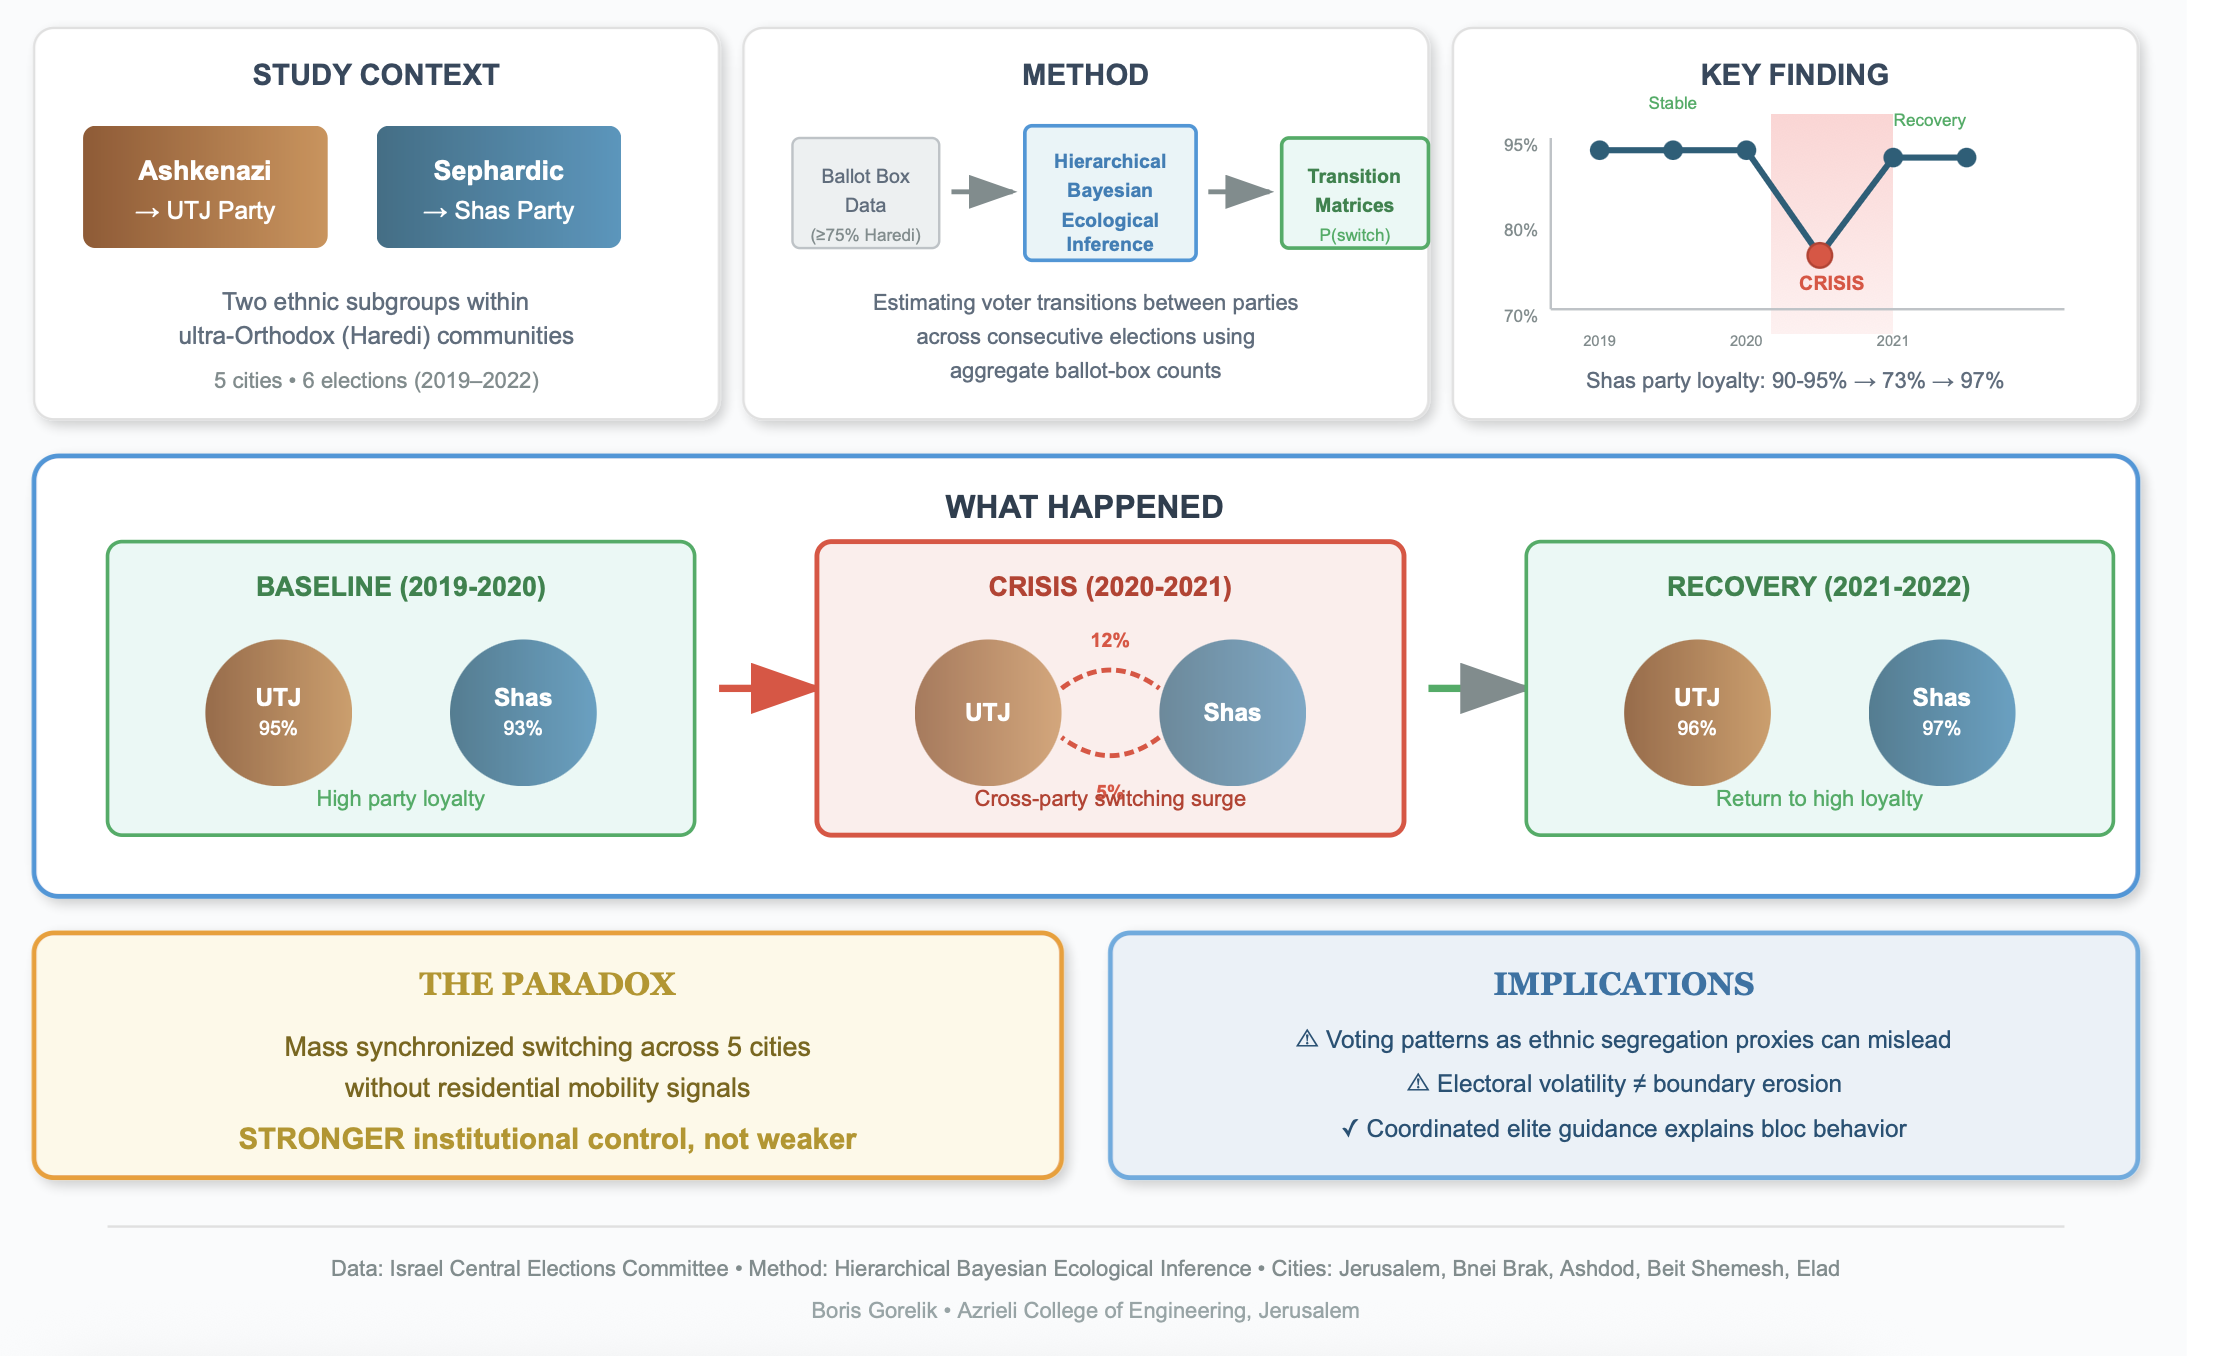
When tightly-knit communities suddenly show electoral volatility, does it signal weakening group identity, or something else entirely? This question matters wherever cohesive groups vote as blocs: evangelical churches, immigrant enclaves, ethnic minorities, religious denominations. Conventional wisdom interprets such shifts as boundary erosion. This paper demonstrates the opposite.I exploit a natural experiment, Israel’s 2020 - 21 electoral crisis, to track voter transitions within ultra-Orthodox communities, where ethnically distinct subgroups (Ashkenazi and Sephardic) maintain near-total political separation despite shared religious practice. Using ecological inference on ballot-box data from five population centers across six elections (2019 - 2022), I document exceptionally high baseline party loyalty (90 - 95%), a dramatic disruption during the March 2020 – March 2021 transition when switching surged to 12 - 19%, and a return to high loyalty to the “new” party. a pattern that remained invisible in country-level aggregates and became detectable only through the ecological-inference framework applied here, and a return to high loyalty to the post-switch party..The synchronized switch of voting loyalty across geographically dispersed cities, occurring without residential mobility, suggests coordinated elite guidance rather than emerging voter independence. Paradoxically, mass switching demonstrates stronger, not weaker, institutional control.This finding exposes a methodological trap. Researchers sometimes use voting patterns as proxies for residential segregation, including in my own earlier work. When voters switched parties without moving, standard indices falsely registered political shifts as spatial integration, a confound that threatens any study that conflates demographic and political boundaries.The broader implication challenges how we interpret electoral behavior in cohesive communities worldwide: apparent volatility may signal disciplined coordination, and what looks like boundary erosion may actually reveal institutional strength operating through collective action.
Keywords:
electoral volatility
; ethnic voting
; coordinated behavior
; ecological inference
; bloc voting
; segregation indices
; ultra-Orthodox communities
Introduction
Across many democracies, communities exhibit cohesive voting patterns that form durable voting blocs anchored in strong group identities. Classic cleavage theories and the literature on ethnoreligious mobilization argue that such identities can cement stable partisan alignments over long periods (Lipset & Rokkan, 1967; Curiel & Zeedan, 2024). From U.S. evangelicals to European regional party loyalists to African ethnic voting coalitions, these blocs appear remarkably stable. Yet a central question remains: are these voting blocs truly immobile, or can their rigid boundaries yield under stress? Israel’s 2020–21 electoral upheaval, which produced four general elections within two years, offers a rare natural experiment to observe how deeply internalized political loyalties respond to sudden systemic shocks.
Israel’s ultra-Orthodox (Haredi, plural Haredim) Jews provide an extreme-case test of this question. The Haredi sector is widely portrayed as one of the most disciplined electoral blocs in Israel, with high turnout rates and reliably pro-clerical voting reinforced by dense institutional networks (Freedman 2020; Leon 2014; Malach 2025). Haredi political culture traditionally frames voting not as an individual right but as a collective religious duty dictated by spiritual authorities. Yet recent research challenges this monolithic portrayal. Zalcberg (2023) notes that the community is factionalized and not all members obey rabbinic voting directives; roughly, an estimated 11% of self-identified Haredi Jews voted for non-Haredi lists in the 2021 election despite communal pressures. Similar patterns of partial defection within cohesive electorates have been documented elsewhere: Simas and Lothamer (2025) find that even strong party identifiers may temporarily defect following intraparty conflict, revealing that perceived unity can mask underlying volatility. This pattern is particularly striking given Israel’s electoral history: Andersen and Yaish (2003) found that the 1993–1999 electoral reform failed to shift social cleavage voting patterns, suggesting that institutional change alone rarely disrupts voting blocs. Yet the 2020–21 shock disrupted even the most disciplined Haredi communities, making this episode distinctive. This raises a theoretical puzzle applicable beyond Israel: can highly disciplined voting blocs harbor latent realignment pressures that surface under specific temporal and local conditions?
The Haredi sector is internally divided along ethnic lines between Ashkenazi and Sephardi/Mizrahi streams, each aligned with a separate political party: United Torah Judaism (UTJ) and Shas. UTJ’s electorate is almost entirely Ashkenazi and ultra-Orthodox, while Shas draws most of its support from Sephardi/Mizrahi voters and has a broader base that extends beyond the strictly Haredi population. Cincotta (2013) notes that much of Shas’s support comes from non-Haredi Sephardim and Mizrahim, reflecting its wider appeal. Leon (2014) describes Sephardi ultra-Orthodoxy as “strict ideology, liquid identity,” suggesting more permeable boundaries than in Ashkenazi contexts. Malach (2025) similarly characterizes UTJ as a sectarian party with “dynamic fringes,” capturing almost all of its core electorate with limited leakage. This ethnic cleavage within a religiously unified population provides a strong test case for examining how internal boundaries respond to electoral shocks and whether they can temporarily weaken without permanent realignment.
This current study was sparked by an anomaly discovered in my previous research on Haredi residential segregation (Gorelik 2025). That study documented persistent spatial separation between Ashkenazi and Sephardi Haredim across Israel’s cities. However, Ashdod, a southern coastal city, exhibited a sudden, unexplained drop in residential segregation between the March 2020 and March 2021 elections (Figure 1). With no major demographic relocation or institutional change occurring during this brief period, the anomaly was puzzling. If people did not physically move, what changed? One plausible answer: politics. Residential segregation changes slowly but voting behavior can shift rapidly. If Sephardi voters temporarily switched from Shas to UTJ (or vice versa), this would create apparent “integration” in segregation indices, which rely on party votes as proxies for ethnicity, without any residential movement. This possibility motivated the present study: Was Ashdod’s anomaly evidence of a broader, under-the-radar pattern of voter transitions within this ostensibly rigid bloc? The period’s exceptional political volatility, with four national elections between April 2019 and March 2021, provides a natural experiment for testing how electoral shocks affect even highly disciplined voting communities.
I address this puzzle by analyzing voter transition matrices across successive elections from January 2013 through November 2022 (Knessets 19–25), using hierarchical Bayesian ecological inference applied to polling station results (detailed in the Methods section; King 1997; Greiner & Quinn 2010). The analysis estimates transition probabilities among four categories: Shas, UTJ, other parties, and abstention. To focus specifically on Haredi behavior, I restrict the sample to polling stations at least 75% Haredi in composition, a procedure used in Gorelik (2025) and described there in greater detail, ensuring that the transitions reflect dynamics within the ultra-Orthodox sector rather than broader trends. The framework provides both national-level estimates and city-specific patterns for major Haredi population centers.
This paper examines an unusual episode of electoral volatility within one of the most disciplined voting blocs in contemporary democracies. During Israel’s 2020–21 electoral crisis, which produced four national elections in a very short period, Haredi voters displayed a brief but system-wide deviation from their normally rigid partisan loyalty. This rare moment provides a direct test of how strongly bounded identity groups respond to sudden political shocks. By combining ecological inference with spatial segregation metrics, the study uncovers temporary permeability in ethnic and political boundaries that remains invisible in national aggregates. The analysis shows that what appears externally as bloc stability can, under exceptional pressure, mask short-lived internal shifts that quickly reconstitute. The findings also highlight a methodological vulnerability in using electoral data as proxies for ethnic residential patterns and offer a broader insight: even cohesive communities can display coordinated volatility without undergoing long-term realignment.
Specifically, this study makes two central contributions. First, it identifies a methodological shortcoming in using electoral data as a proxy for ethnic residential patterns. Temporary fluctuations in partisan loyalty can create the appearance of spatial integration even when no demographic change has occurred, a vulnerability relevant to any research that links political behavior to ethnic or spatial boundaries. Second, the study shows that even highly disciplined voting blocs can exhibit internal permeability that remain hidden in national aggregates yet reconstitute rapidly once the triggering conditions subside. Understanding when such temporary shifts arise, and how quickly boundaries recover, is essential for anticipating coalition dynamics and democratic responsiveness in polities structured by strong identity-based voting. The following section details the data sources, model specification, and analytical approach.
Methods
Data Sources and Scope
This study uses official election results from the Central Elections Committee of Israel for Knesset elections 19 through 25, spanning from the January 2013 election (Knesset 19) through the November 2022 election (Knesset 25). These datasets provide polling-station-level counts of registered voters, valid votes, and votes for each political party. The analysis focuses on cities and towns with a significant ultra-Orthodox (Haredi) presence, following the same selection framework as in my previous study on intra-Haredi ethnic segregation (Gorelik, 2025). Throughout this paper, “country-level” refers to aggregated estimates across all qualifying ballot boxes nationwide, while “city-level” refers to qualifying boxes within each city.
Voters are assigned to polling stations by residential address. Most ballot boxes contain 536–650 registered voters (interquartile range from recent elections). I identify Haredi ballot boxes using a 75% threshold: boxes where combined votes for Shas and UTJ exceed three-quarters of all votes cast, maintaining consistency with Gorelik (2025). To ensure reliable statistical estimation, I include only cities with at least five qualifying boxes.
Data were obtained directly from the Central Elections Committee’s official online repository, supplemented by previously digitized archives for earlier elections (via Dr. Keren-Kratz, 2024). The resulting dataset includes polling-station level results for all eligible cities, with a focus on those exhibiting consistent Haredi voting patterns.
Ballot-Box Alignment and Preprocessing
Ballot boxes were matched between consecutive elections by city and ballot-box ID. Where multiple boxes shared the same city-box pair across elections, their results were aggregated. Mismatched boxes that could not be aligned between consecutive elections were excluded from that specific transition analysis but remained available for analysis in subsequent election pairs where they could be matched. This ensured that all included boxes represented consistent geographical and demographic units across each election pair while maximizing data retention.
Abstention was defined as the difference between the number of registered voters in a ballot box and the number of valid votes cast. This captures both non-voters and those who submitted invalid or blank ballots. This standard approach treats non-participation and invalid ballots as a single “abstention” category.
Analytical Focus and Categories
Four electoral categories were modeled: (1) Shas (Sephardic ultra-Orthodox party), (2) UTJ (United Torah Judaism, the Ashkenazi ultra-Orthodox party alliance), (3) Other parties (all non-Haredi political lists), and (4) Abstention (registered but did not cast a valid vote). All non-Haredi parties are combined into a single “Other” category because the focus is intra-Haredi dynamics; distinguishing additional parties would add dimensionality without illuminating Haredi behavior. The restriction to homogeneous Haredi ballot boxes (≥75% Shas+UTJ votes) ensures that nearly all Shas and UTJ votes in this sample originate from Haredi populations, isolating within-sector dynamics from broader societal trends.
Model Overview
The estimation framework follows a hierarchical Bayesian ecological inference model, designed to infer unobserved voter transition matrices between consecutive elections from aggregate data. This problem is inherently challenging because individual ballots are secret and only aggregate counts are available. Thus, I adopt a classic ecological inference scenario (Robinson 1950; King 1997). The hierarchical structure pools information across localities, improving precision in small samples while maintaining flexibility across elections. Full model specifications and diagnostics are provided in Appendix A.
For each election pair , the model infers the probability that a voter from category i at election t votes for category j at election t+1. Individual transitions are unobserved, but aggregate vote counts provide marginal constraints. Building on Goodman’s (1953) ecological regression framework and subsequent Bayesian extensions (King 1997; Rosen et al. 2001), I model voter transitions probabilistically using a hierarchical Bayesian approach that generalizes the linear model to address several key challenges: unobserved individual transitions, spatial heterogeneity in voting patterns, high dimensionality of transition matrices, and overdispersion in vote counts (Wakefield 2004; Forcina and Pellegrino 2019).
Important conceptual distinction: The transition probabilities represent the probability of voting behavior at each election, not the movement of individual voters between parties. When a party’s retention rate increases, this indicates that leakage to other parties stopped, a return to a new steady state, not the literal return of voters who previously defected.
Each election pair is modeled using three levels of hierarchy: (1) National transition matrix () that represents the baseline transition probabilities for the entire electorate, (2) Shared deviation pattern (), a low-rank structure capturing how cities collectively deviate from national trends, and (3) City-specific scalar (), a single latent variable scaling the deviation pattern for each city.
This hierarchical structure avoids the “uniform swing” assumption of traditional ecological inference while managing dimensionality. I impose a rank-1 structure on city-level deviations: each city’s deviation is captured by a single scalar that scales a shared deviation pattern , reflecting that electoral shifts are often driven by one dominant cleavage rather than completely unique city-by-city patterns (Brown and Payne 1986; Puig and Ginebra 2015).
City-level transition matrices are constructed as:
Priors and Likelihood
Transition logits are modeled using logistic-normal priors, avoiding the independence assumptions of Dirichlet distributions (Wakefield 2004; Glynn and Wakefield 2010). I add a diagonal bias term to same-party transitions to reflect voter inertia, the well-documented tendency to stick with previous choices (Campbell, Green, and Layman 2011; Clarke et al. 2004). The unusually short intervals between Israeli elections during this period (5.5 to 19 months) further strengthen this inertia prior. Observed vote counts were modeled with a Dirichlet-multinomial likelihood with overdispersion parameter , accounting for correlated behavior due to social networks and demographic clustering. Full prior specifications are detailed in Appendix A.
Temporal Extension
The model is applied sequentially across subsequent election pairs from the January 2013 election (Knesset 19) through the November 2022 election (Knesset 25). Posterior means of , , and from one transition are used as prior means for the next, allowing gradual temporal evolution while maintaining continuity across election cycles.
Model Validation and Implementation
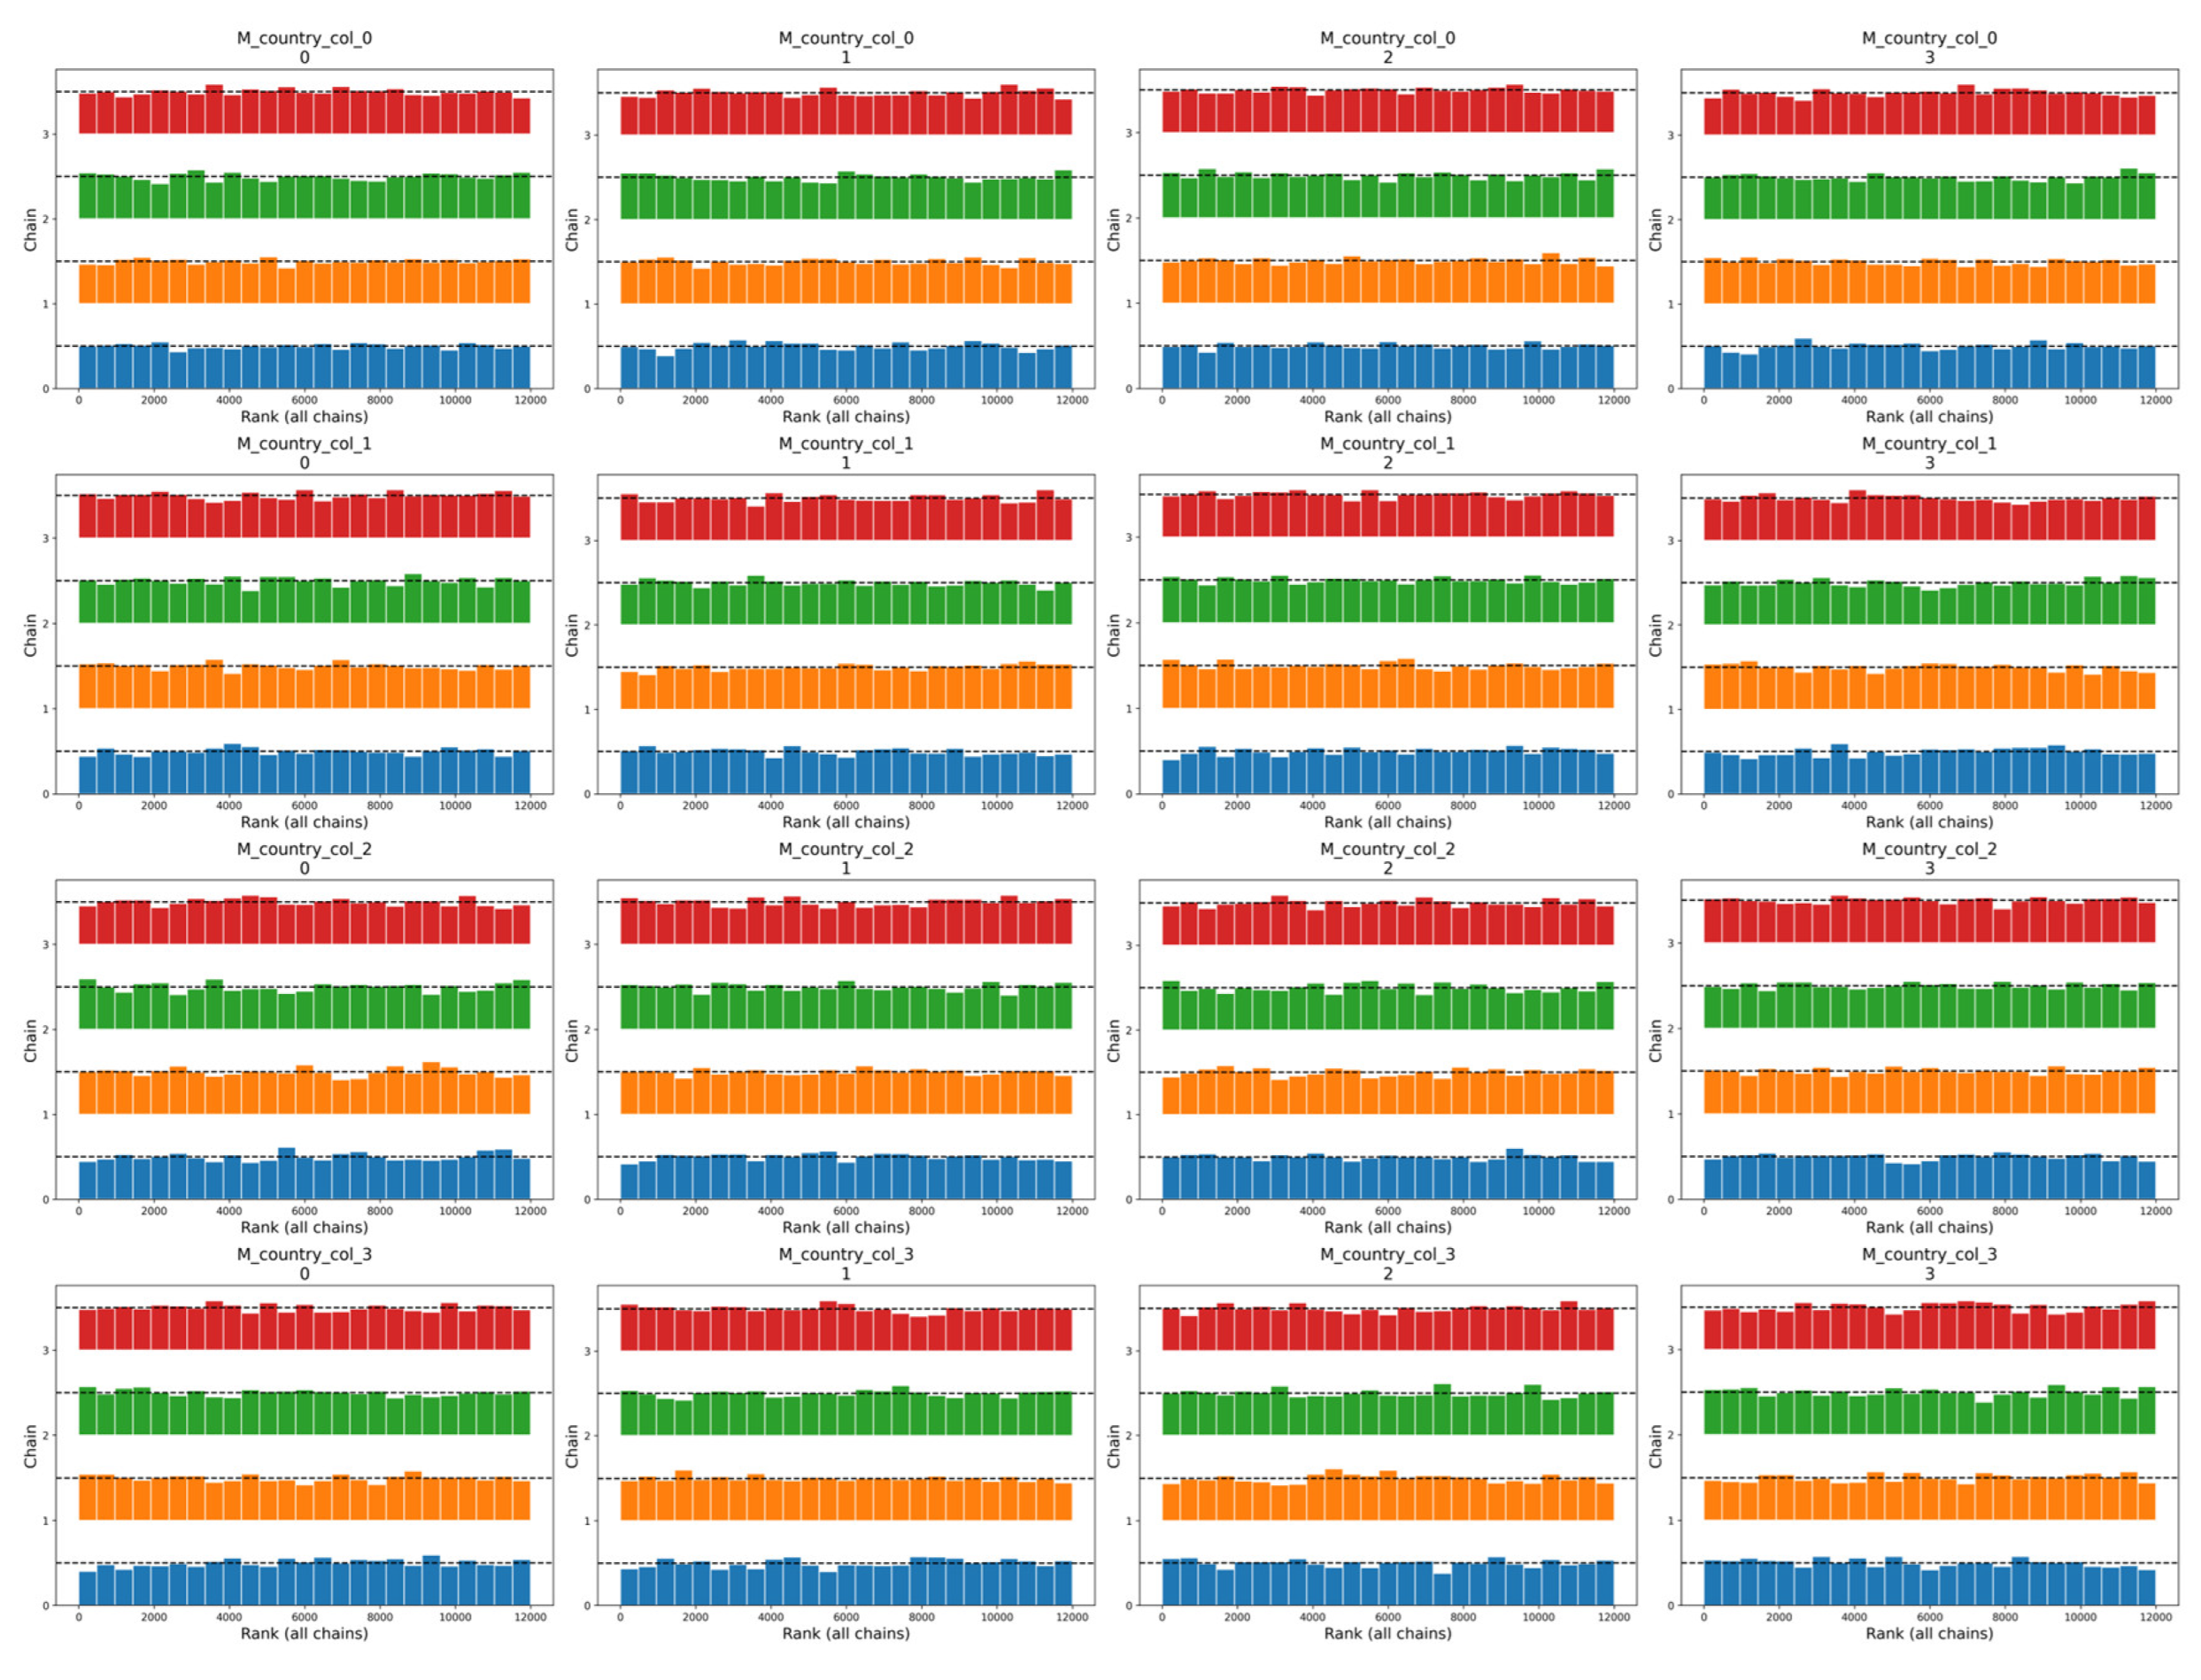
All chains converged successfully (Gelman-Rubin , effective sample sizes exceeding 400 for key parameters, no divergent transitions). Posterior predictive checks confirmed good fit. Models were implemented in PyMC (Salvatier et al., 2016) ver 5.25.1 using four chains (seed 42). Full diagnostics and code are available at https://github.com/bgbg/segregation_paper.
Note on notation: Throughout this paper, election transitions are denoted using the arrow notation (→) to indicate the direction from one election to the next. For example, “23→24” refers to the transition from the March 2020 election (Knesset 23) to the March 2021 election (Knesset 24). This notation emphasizes that I am examining voter flows between consecutive elections rather than the elections themselves in isolation.
The following section presents the estimated transition patterns at national and city levels, revealing both the dominant pattern of high stability and a dramatic temporary disruption in the March 2020–March 2021 transition.
Results
The results reveal a consistent pattern of high baseline loyalty within both Shas and UTJ, alongside marked temporal and geographic variation in voter transitions. Most election pairs show strong stability, yet one transition stands out: the March 2020 to March 2021 election produced a sharp, system-wide disruption in loyalty across all major Haredi residential hubs. This disruption was temporary, and the subsequent election saw a full return to near-baseline levels. The sections below present these patterns in detail, beginning with national estimates and then examining city-level variation.
Model diagnostics confirming adequate fit are provided in Appendix B.
Country-Level Transitions
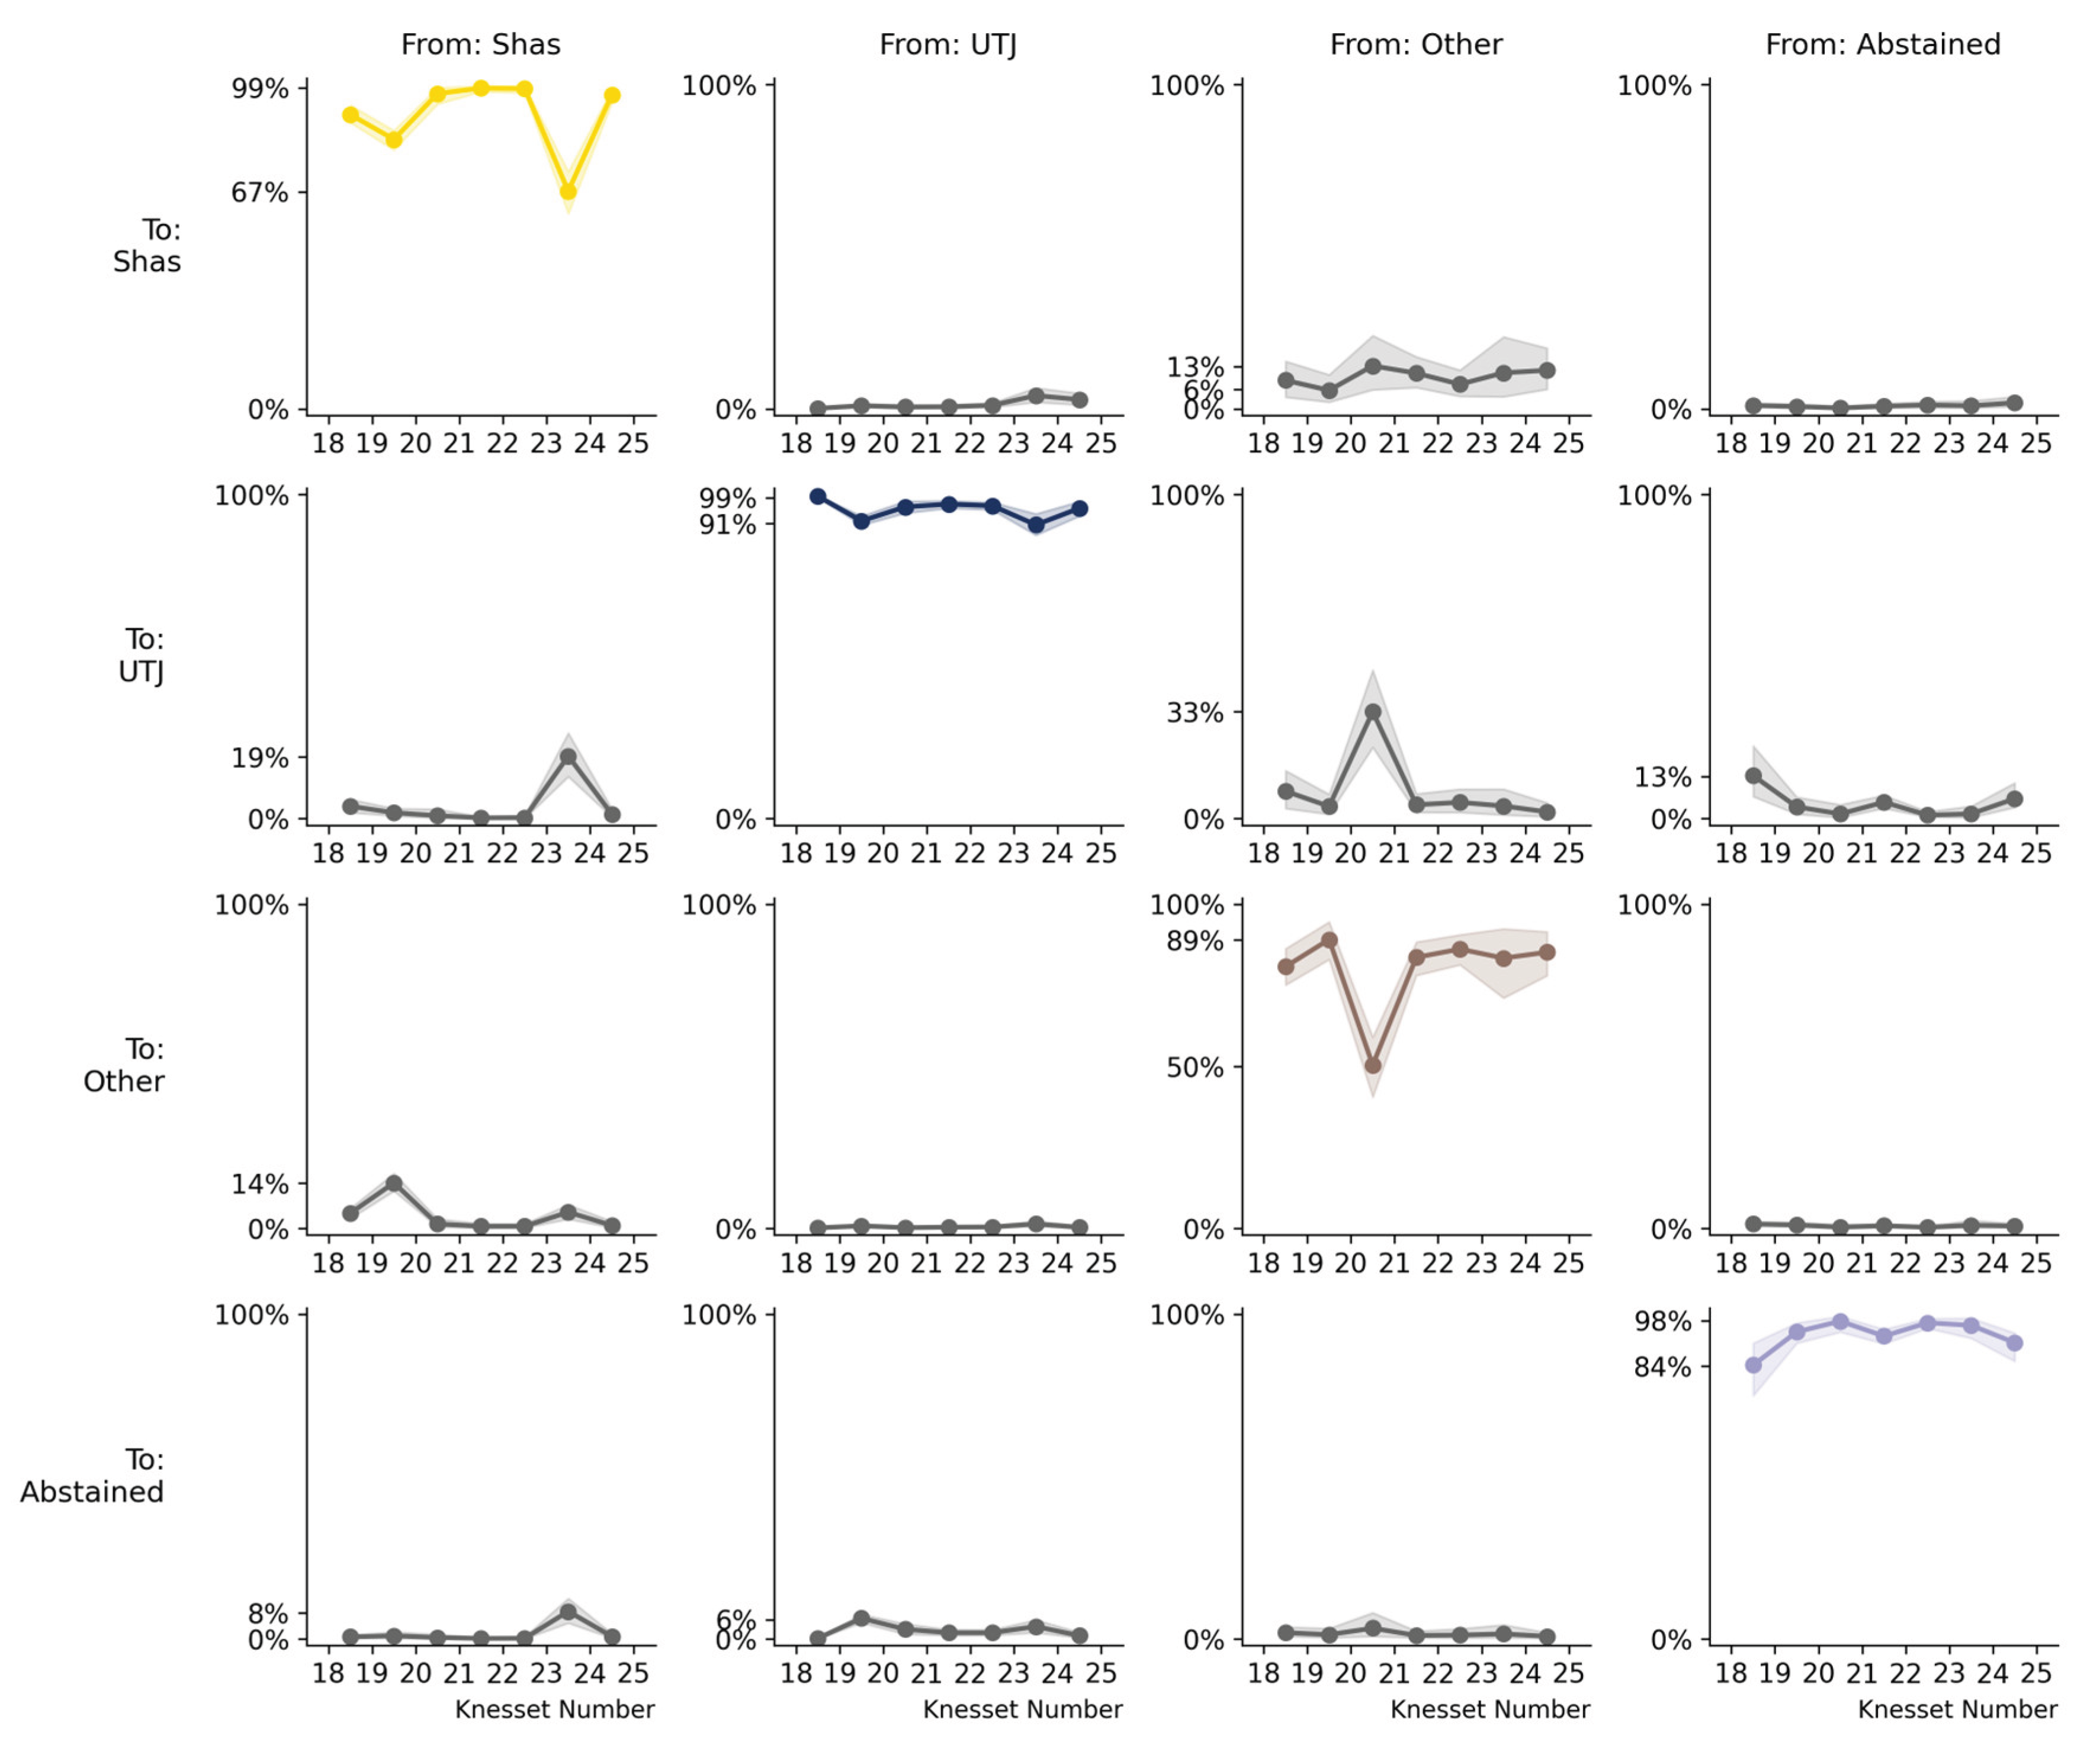
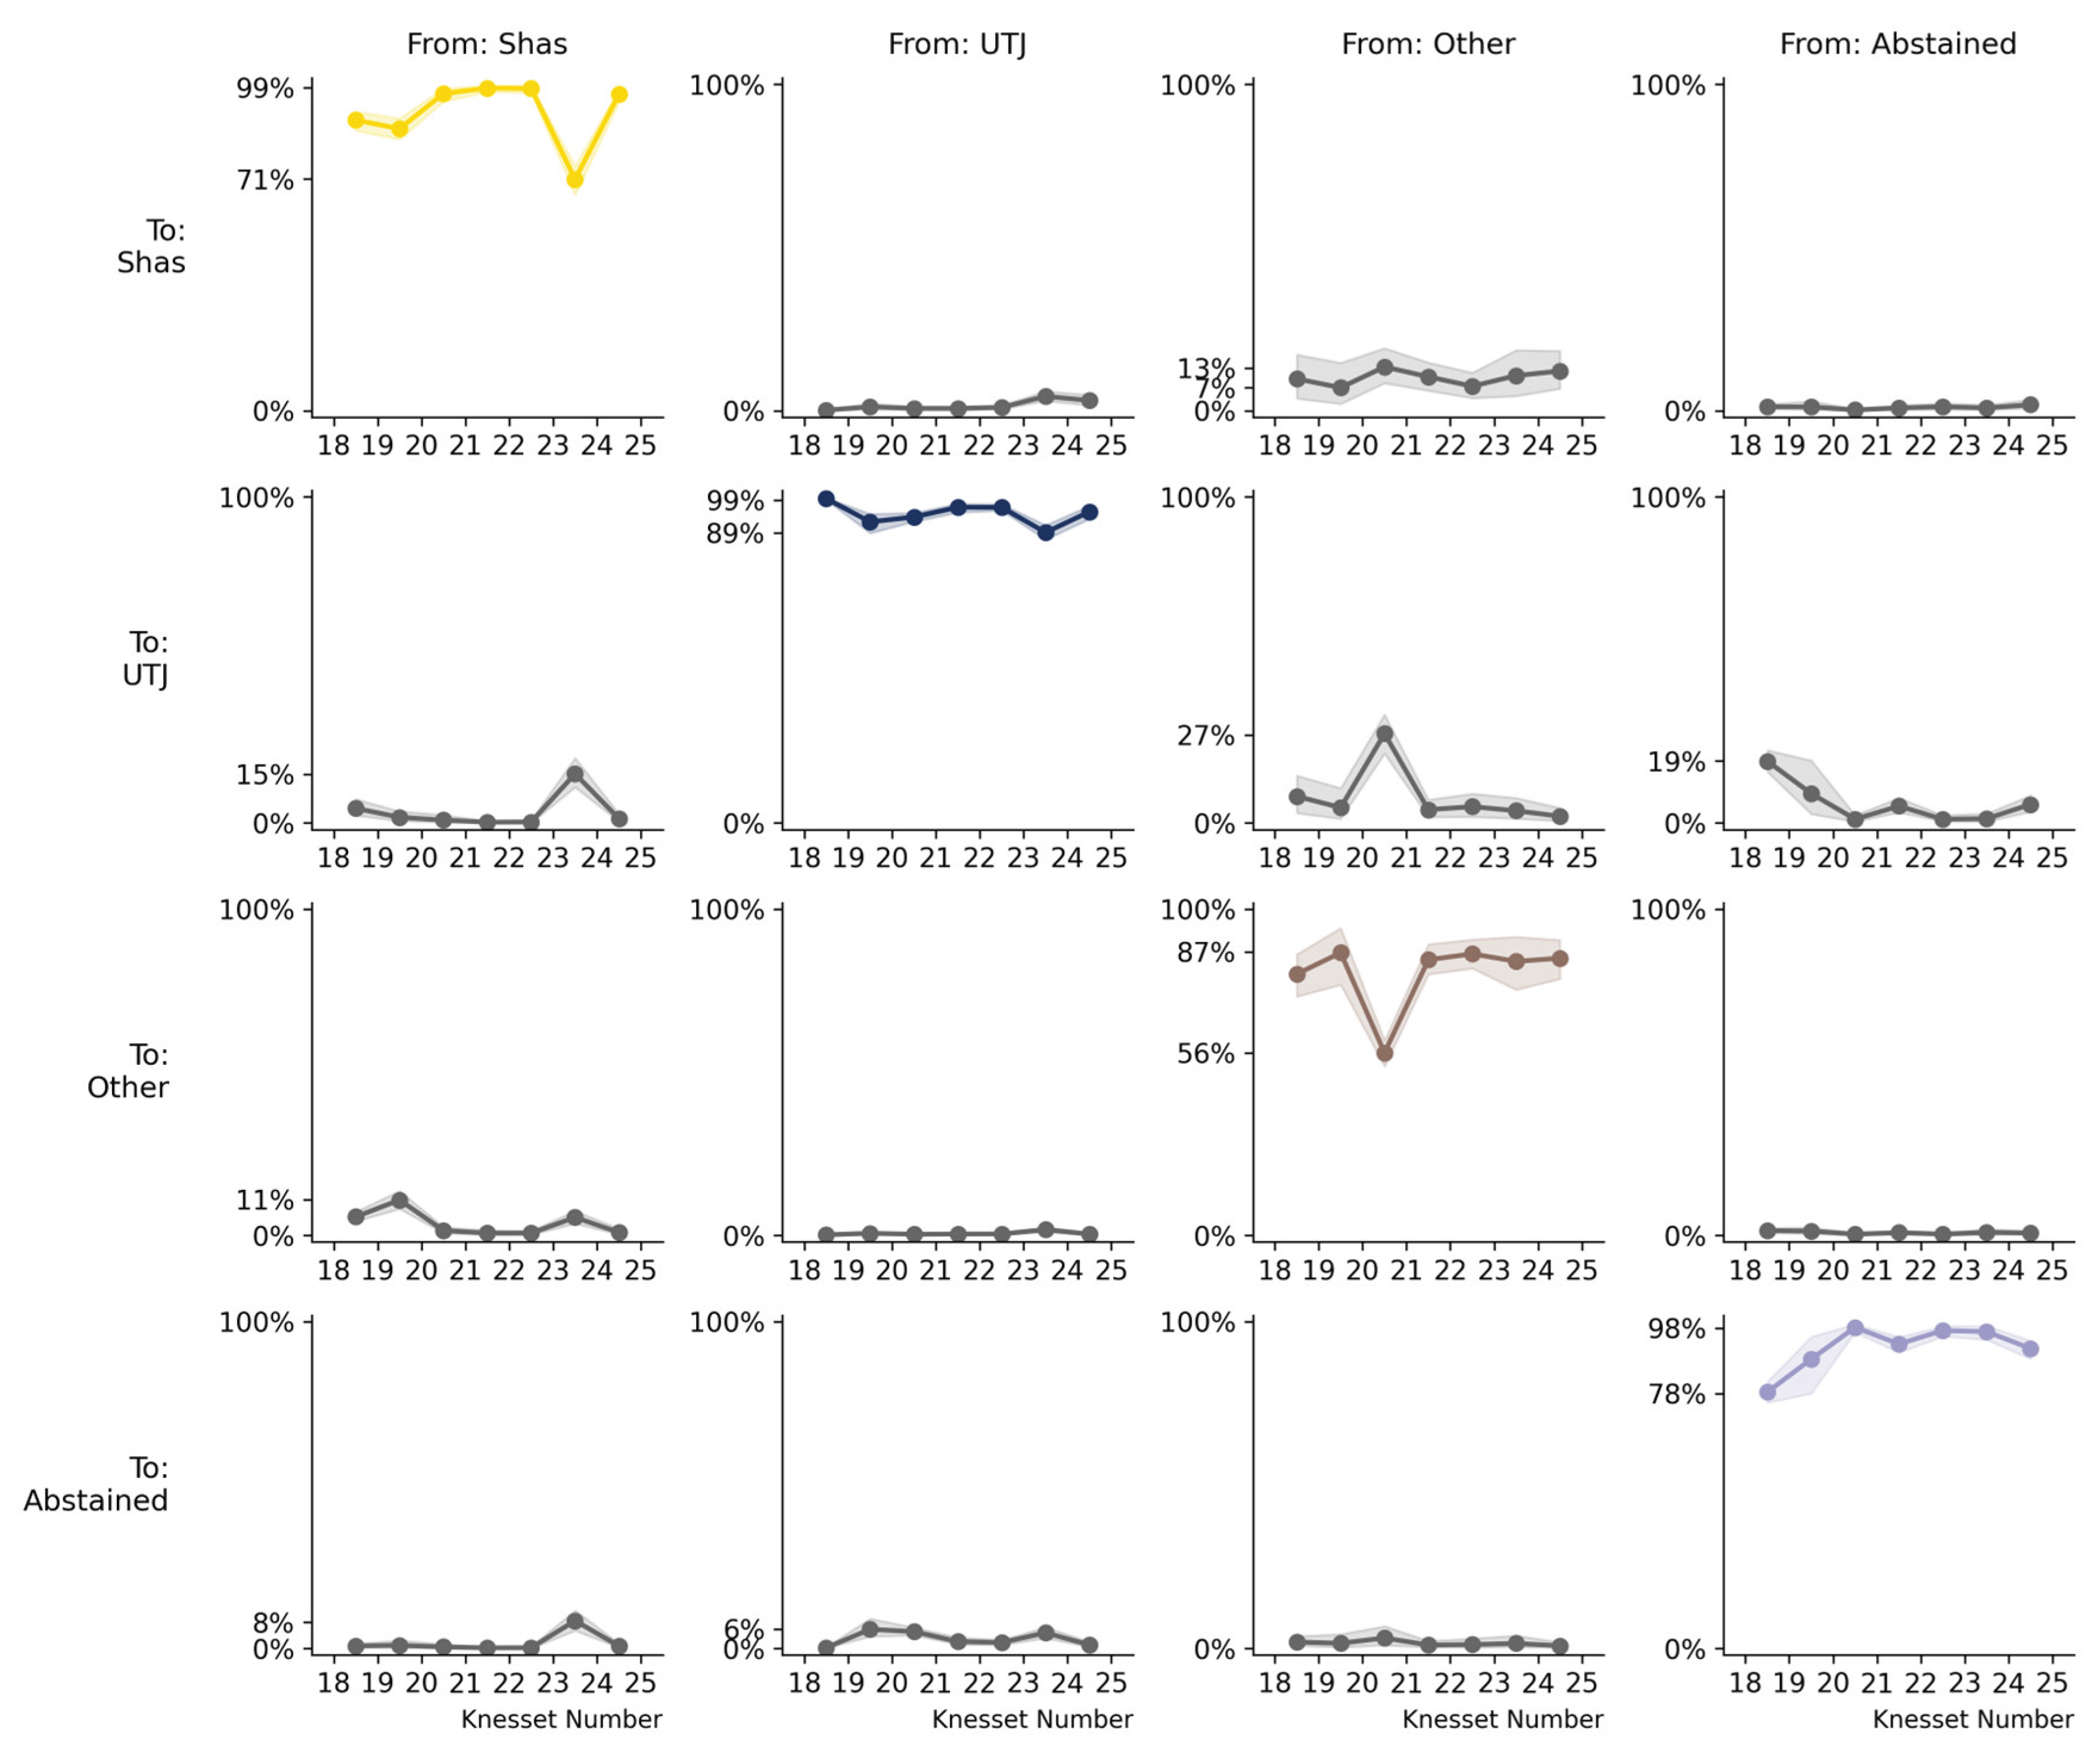
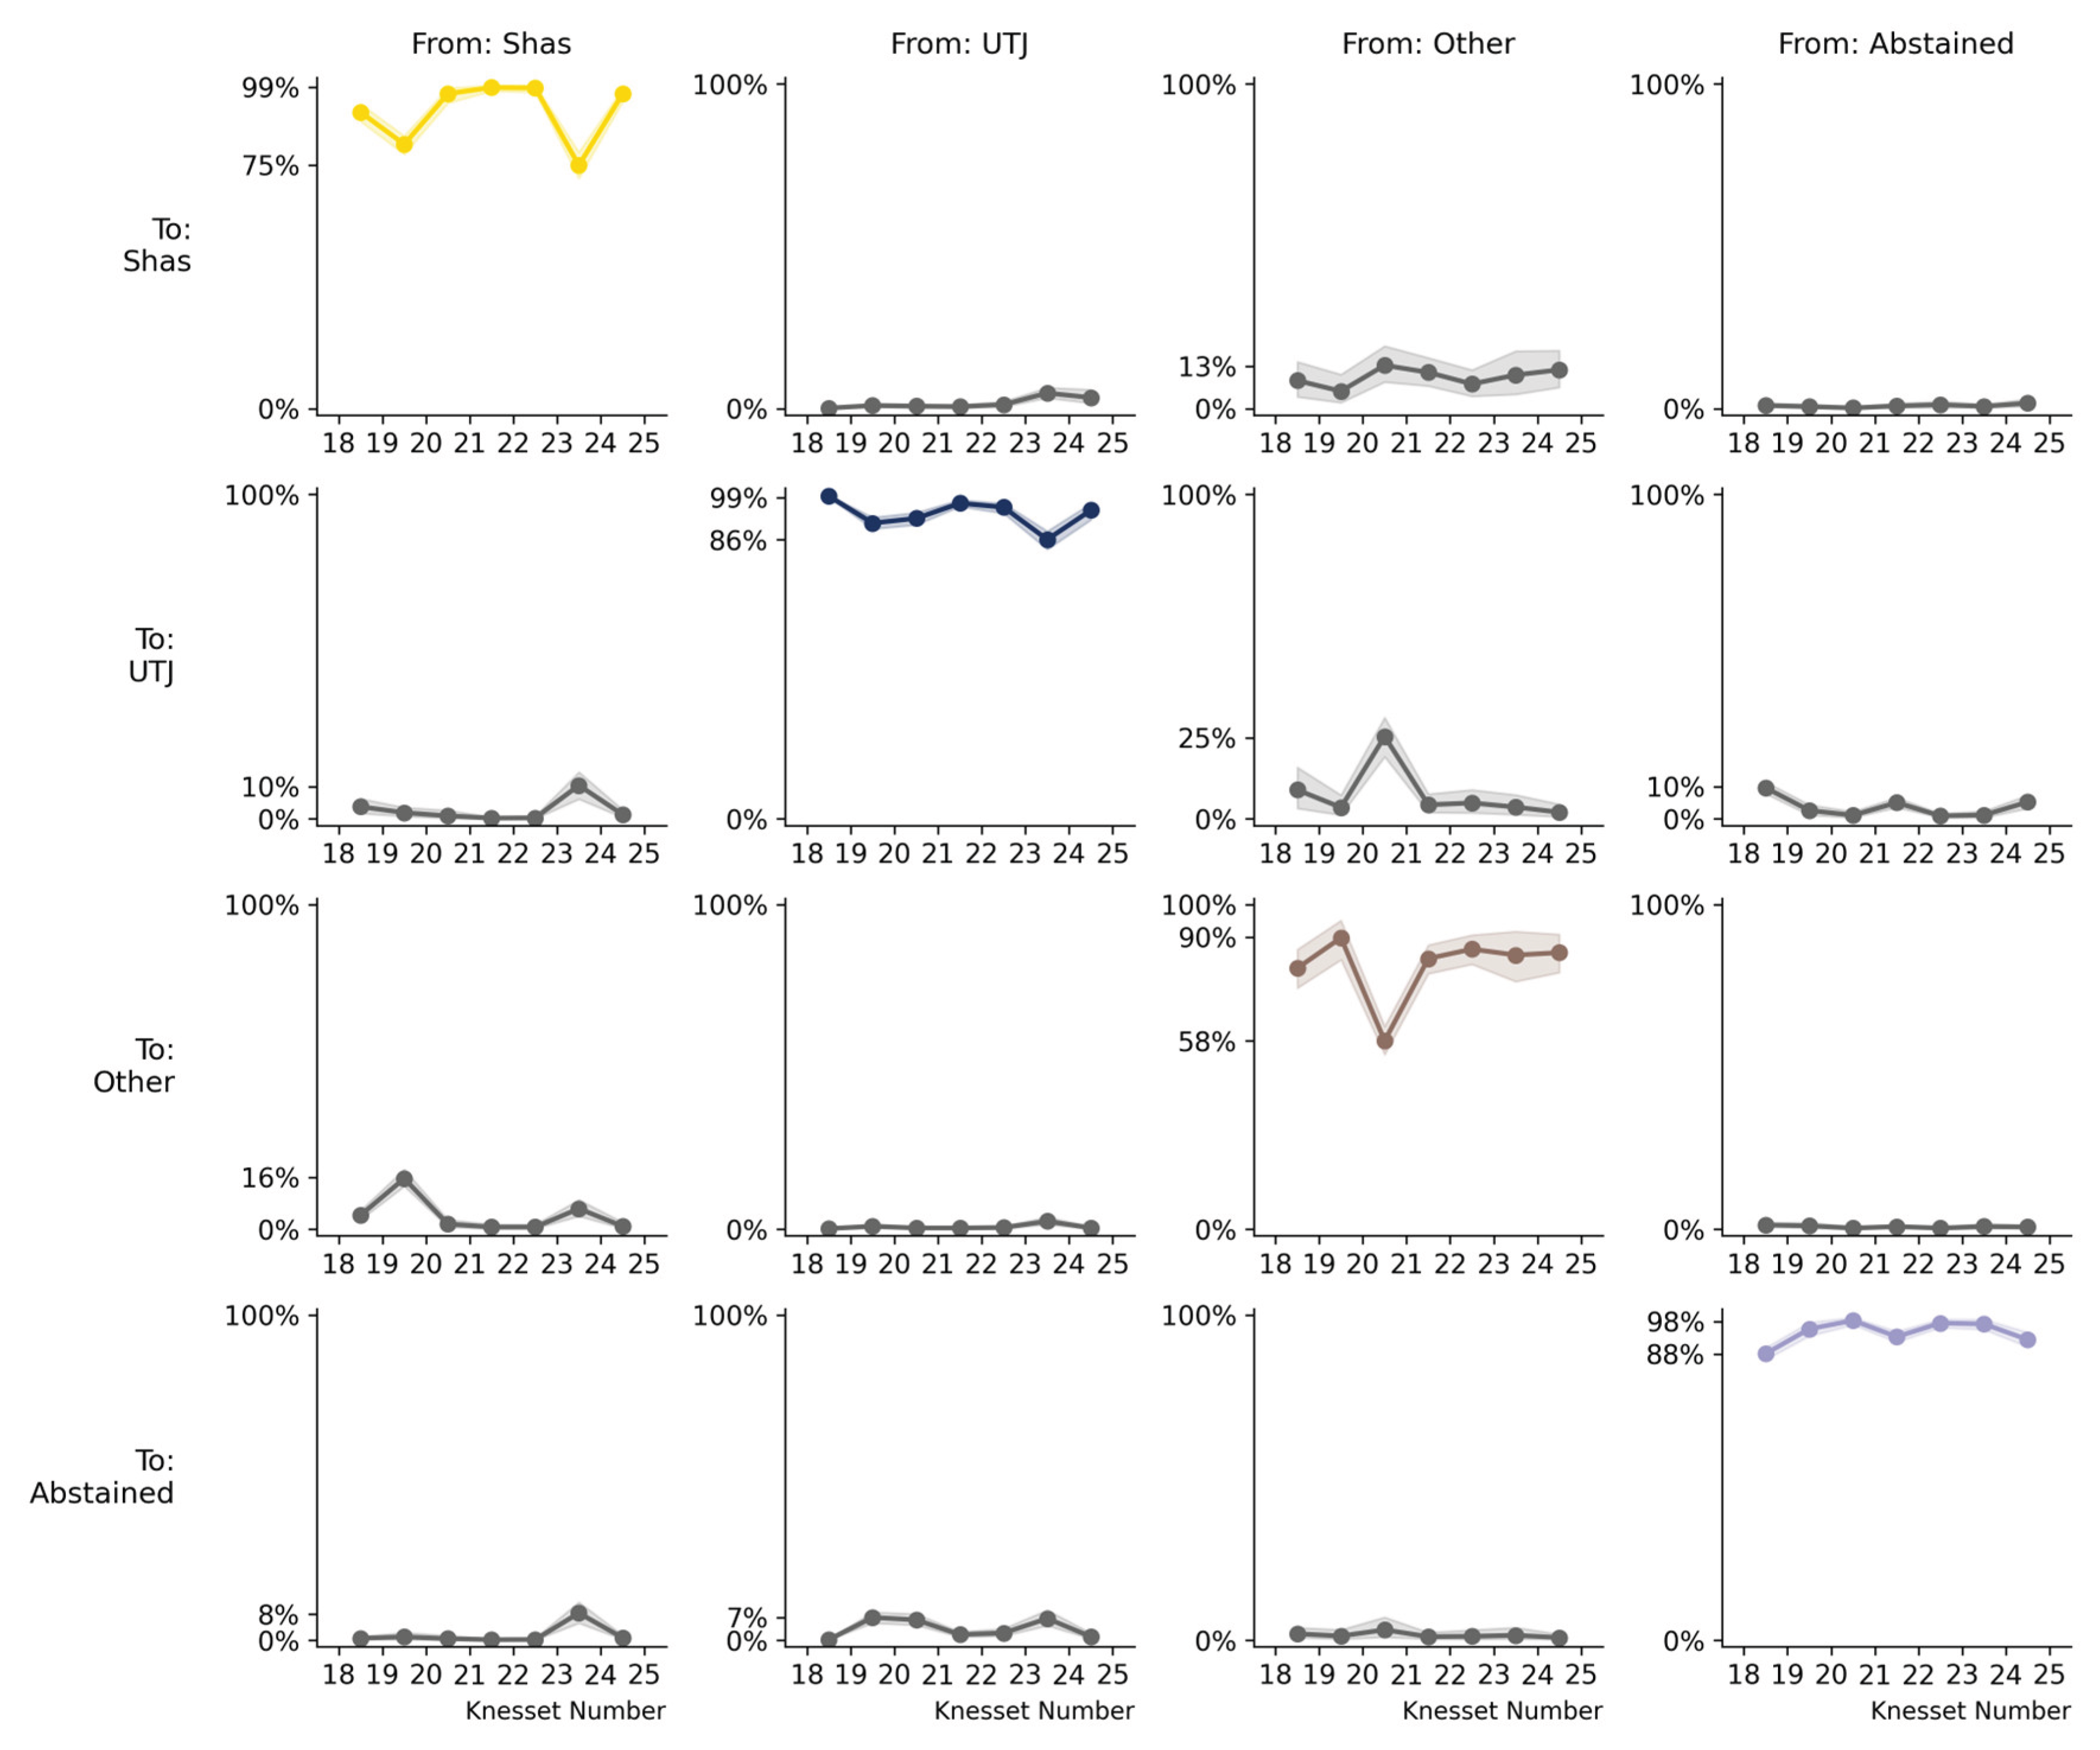
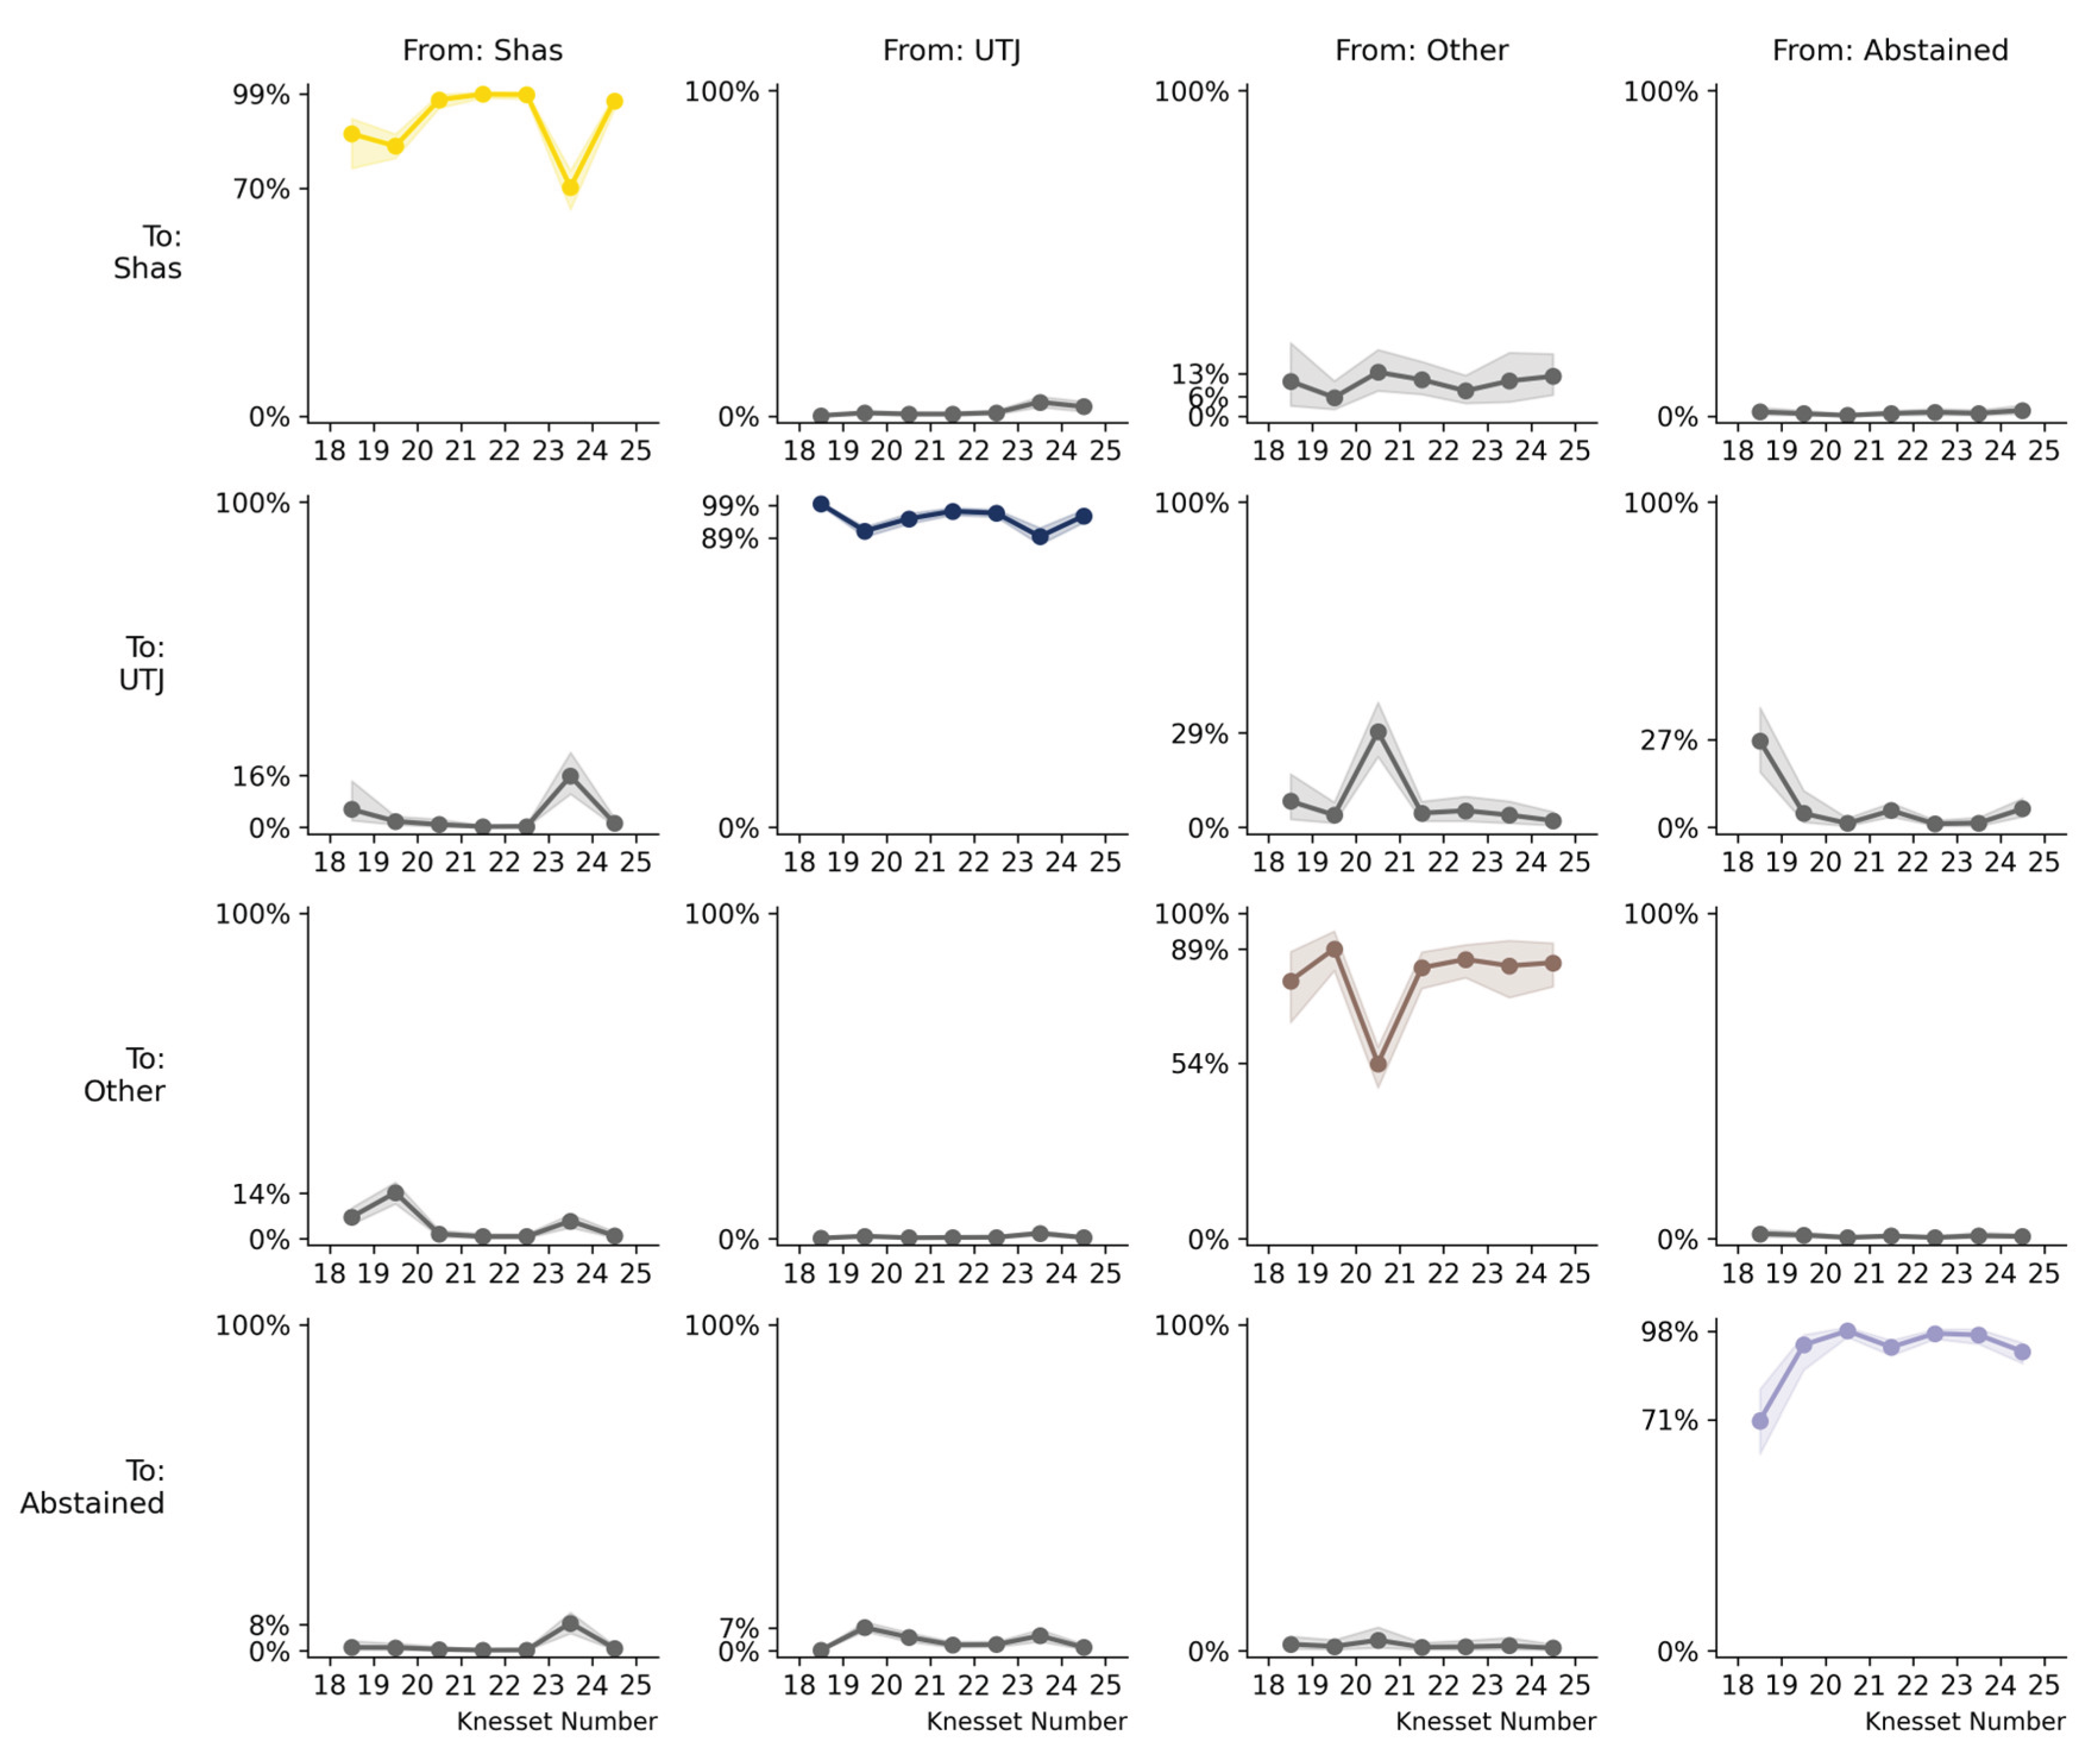
At the national level, the transition matrices reveal strong voter loyalty within both Haredi parties (Figure 2). Shas retained on average more than 90% of its voters across elections, while UTJ consistently preserved above 95%. However, the magnitude of “within-bloc permeability” voters shifting between Shas and UTJ varied notably over time.
The March 2020–March 2021 transition (Knesset 23→24) showed an unusual and dramatic decline in intra-Haredi loyalty, particularly among Shas voters. At the country level, Shas-to-Shas loyalty plummeted from 98.9% (in the September 2019–March 2020 transition, Knesset 22→23) to just 73.5% in the 23→24 transition. Simultaneously, the probability of Shas voters switching to UTJ jumped from near zero to 12.3%. UTJ voters also experienced reduced loyalty, dropping from 96.6% to 87.9%, with 4.6% of UTJ voters defecting to Shas. The estimated decline in party retention corresponds to roughly one parliamentary seat (out of 120) per party, illustrating the political significance of even modest swings in Haredi voting patterns. The temporary drop thus had a tangible potential to alter coalition outcomes.
This crossflow pattern represents an unprecedented disruption in the typically stable Haredi voting bloc. Critically, the disruption in Shas-Shas loyalgy was observed across multiple geographic scales: both at the national level (Figure 2) and across individual cities (Figure 3), indicating a system-wide rather than localized phenomenon. Notably, this disruption was temporary: in the subsequent March 2021–November 2022 transition (Knesset 24→25), loyalty rates recovered substantially (Shas: 96.9%, UTJ: 95.5%).
It is important to emphasize that the recovery in retention probabilities does not indicate that individual voters who had “strayed” from Shas returned to the party. Rather, it reflects that the “leak” of voters from Shas to other parties stopped (see Methods section on the distinction between voting behavior probabilities and individual voter movements). The actual voter movements are captured by the off-diagonal elements of the transition matrix, the flows between parties, not by the diagonal retention rates themselves. Critically, none of the off-diagonal transitions into Shas (UTJ→Shas, Other→Shas, Abstain→Shas) showed unusual spikes in the March 2021–November 2022 transition (Knesset 24→25), confirming that voters who left Shas in the 23→24 disruption did not return.
Paradoxically, despite losing core Haredi voters in 23→24 without recovering them in 24→25, Shas’s national vote share increased from 7.17% to 8.25% (9 to 11 seats). Since Haredi population hubs show no corresponding Shas influx, this growth originated from voters outside major Haredi centers. This demonstrates how aggregate vote-share growth can mask internal dynamics: Shas simultaneously lost its core ultra-Orthodox base (to UTJ in 23→24) while gaining peripheral traditional Sephardic supporters.
The timing of these elections is crucial for interpretation. As shown in Table 1, this period was marked by political instability with elections occurring in rapid succession: only 5.5 months separated the September 2019 (Knesset 22) and March 2020 (Knesset 23) elections, followed by a 13-month interval to the March 2021 election (Knesset 24), and a longer 19-month gap to the November 2022 election (Knesset 25). These short intervals, particularly the 5.5 and 13-month gaps, strongly suggest that the observed transitions reflect genuine voter switching rather than demographic change through migration or generational replacement. The close temporal proximity makes it unlikely that residential mobility or population turnover could account for the dramatic shifts in voting patterns.
Figure 2 shows that Haredi abstention rates remained stable, and cross-over transition between Haredi and non-Haredi parties remained marginal, indicating persistent political segmentation despite broader electoral turbulence.
City-Level Variation
While the national patterns indicate high stability, city-level analysis reveals substantial variation in the magnitude of the March 2020–March 2021 (23→24) loyalty disruption across Haredi strongholds. Figure 3 demonstrates that the disruption was universal, every city experienced reduced Shas loyalty in the 23→24 transition, but the magnitude varied substantially. Ashdod (blue line) shows the steepest drop to approximately 65%, while other cities cluster between 70–78%. The recovery in the March 2021–November 2022 transition (24→25) was equally universal and nearly complete, with all cities returning to loyalty rates above 95%.
Ashdod exhibited the most dramatic deviation from national patterns. As shown in Figure 4, Shas-to-Shas loyalty dropped to just 67.1% (compared to 73.5% nationally), while the Shas-to-UTJ switching rate surged to 19.3%, more than 50% higher than the national rate of 12.3%. This aligns with findings from Gorelik (2025), where Ashdod was the only major Haredi city to show a sudden reduction in the separation coefficient (Figure 1), a pattern now explained by temporary cross-party voting rather than residential change. Anecdotal accounts of community leadership disputes during this period further suggest that local religious authority fragmentation may have amplified the disruption. The exceptionally high cross-party flow indicates particularly fluid political boundaries between Sephardic and Ashkenazi Haredi communities in this mixed city. In the subsequent 24→25 transition, Ashdod’s Shas loyalty recovered to 96.9%, closely tracking the national pattern.
Other major Haredi cities showed similar but more moderate disruptions. Beit Shemesh experienced a Shas loyalty drop to 75.2% (with 9.5% switching to UTJ), while Bnei Brak, despite being a predominantly Ashkenazi stronghold, saw Shas loyalty fall to 70.9% (with 15.8% switching to UTJ). Loyalty values fully recovered by the 24→25 transition. Detailed transition matrices for these cities are provided in Appendix A.
The consistency of this temporal pattern across cities, sharp disruption followed by full recovery, strongly suggests a coordinated or system-wide shock rather than city-specific factors. Importantly, while the voter transition disruption was universal across all major Haredi cities, only Ashdod exhibited a dramatic drop in residential segregation indices in my previous study (Gorelik, 2025). This city-specific segregation response, despite the system-wide voting disruption, proved methodologically revealing. Ashdod’s exceptionally high switching rate (19.3% compared to 12.3% nationally) and other factors, probably crossed a threshold that made the confounding between voting patterns and residential segregation visible in the dissimilarity index. This fortunate coincidence, that the city with the most extreme switching happened to be the same city where segregation indices were carefully tracked, allowed identification of a fundamental measurement issue: using party votes as proxies for ethnic residential patterns can be compromised when voter loyalty fluctuates. Had the switching been more uniform across cities or had Ashdod’s rate been closer to the national average, this methodological confound might have remained undetected.
Connection to Residential Segregation Patterns
The 19.3% Shas-to-UTJ switching in Ashdod created apparent “integration” in segregation indices without actual residential movement. Ballot boxes previously dominated by Shas (Sephardic) suddenly showed substantial UTJ (Ashkenazi) support, reducing the spatial correlation between ethnicity and party vote, precisely what the dissimilarity index measures. The synchronized recovery of both voter loyalty (to 96.9% in 24→25) and segregation levels confirms this electoral mechanism.
This reveals a critical methodological limitation: using party votes as proxies for ethnic residential patterns assumes stable political loyalty. The proxy works well when ethnic-political boundaries are rigid but fails during loyalty disruptions. This temporally contingent validity has implications for any study conflating political and demographic boundaries, a pattern potentially observable in other contexts where voting behavior proxies for group membership (religious denominations, immigrant origin groups, linguistic communities).
Other Notable Disruptions Beyond The March 2020–March 2021 Transition
While the March 2020–March 2021 transition (23→24) represents the most dramatic disruption, the data reveal episodic deviations from typical loyalty patterns. At the national level, the January 2013–March 2015 transition (19→20) showed Shas-to-Shas loyalty dropping to 85.0%, with 13.8% defecting to the “Other” category (comprising numerous non-Haredi parties), an early instance of Shas voters exploring options outside the Haredi sectoral bloc, possibly reflecting dissatisfaction with party leadership during that period.
More significantly, Ashdod exhibited early signs of instability in the transitions immediately preceding the 23→24 collapse. Shas loyalty in Ashdod declined from 91.8% in the April 2019–September 2019 transition (21→22) to 83.6% in the September 2019–March 2020 transition (22→23), well before the system-wide shock. This suggests that Ashdod’s Sephardic Haredi population was already experiencing political flux, making the city particularly vulnerable to the subsequent disruption.
These patterns indicate that voter transitions in the Haredi sector are not confined to singular crisis moments but occur episodically, with certain cities, particularly Ashdod, serving as bellwethers of broader instability.
Summary of Findings
The analysis yields six key findings about Haredi voter transition patterns:
- Dominant pattern of high stability: Across most election pairs, Shas and UTJ maintained loyalty rates above 95%, confirming the general portrait of Haredi voting as highly disciplined and predictable.
- Sharp temporary disruption in the March 2020–March 2021 transition (23→24): Shas loyalty dropped to 73.5% nationally (67.1% in Ashdod), with 12.3% switching to UTJ (19.3% in Ashdod). UTJ loyalty also fell to 87.9%, with 4.6% of UTJ voters switching to Shas.
- Full recovery in the March 2021–November 2022 transition (24→25): Loyalty patterns returned to pre-crisis levels, indicating the disruption was temporary rather than a permanent realignment.
- Geographic variation in disruption magnitude: The 23→24 shock affected all cities but varied in intensity. Ashdod showed the largest deviations, followed by Bnei Brak and Beit Shemesh, suggesting that local demographic integration modulates electoral volatility.
- Temporal proximity rules out demographic explanations: The short intervals between elections (5.5–19 months) indicate genuine voter switching rather than migration or generational turnover.
- Stable abstention rates: Haredi participation remained resilient throughout, even during the 23→24 disruption, with minimal abstention flows contrasting with significant inter-party switching.
These findings reveal that even highly cohesive voting blocs can experience rapid, system-wide disruptions in loyalty patterns that fully reverse when triggering conditions resolve, a pattern of rigidity with stress fractures potentially observable across identity-based electorates from U.S. evangelicals to European regional parties. The consistency across cities points to centralized political dynamics, while the variation in magnitude highlights how local social integration modulates the boundaries of permissible switching within otherwise rigid structures. The Conclusions section explores the theoretical and methodological implications of these patterns, situating them within broader comparative frameworks and discussing their significance for understanding ethnic boundary maintenance in cohesive communities.
Conclusions
This study traced voter transitions within Israel’s ultra-Orthodox electorate across six national elections, uncovering a pattern of long-term stability interrupted by a single, sharp disruption during the March 2020–March 2021 (23→24) transition. Under normal conditions, Shas and UTJ voters display exceptionally high loyalty, typically above 90–95%, and very limited cross-party switching. The 23→24 transition broke this pattern: Shas-to-Shas loyalty dropped to 73.5% nationally and to 67.1% in Ashdod, while Shas-to-UTJ switching surged. Yet by the 24→25 transition, loyalty levels returned almost fully to their pre-crisis baseline. This “collapse and recovery” illustrates that ethnic–political boundaries in the Haredi sector are highly resilient, even when temporarily stressed.
Synchronized Disruption: Discipline, Not Fluidity
The most striking finding is the highly synchronized nature of the disruption. The loyalty collapse in 23→24 occurred almost simultaneously across all major Haredi cities: Jerusalem, Bnei Brak, Ashdod, Beit Shemesh, and Modi’in Illit, despite substantial differences in their demographic composition and ethnic mix. The subsequent recovery in 24→25 was equally synchronized.
This pattern is difficult to reconcile with interpretations based on individual voter independence or gradual ideological drift. If voters were acting autonomously in response to local conditions, we would expect asynchronous, city-specific shifts: staggered declines, partial recoveries, or persistent divergence. Instead, the data show sharp, collective movement followed by an equally collective re-stabilization.
Such coordination is far more consistent with institutional discipline and centralized signaling than with independent voter recalculation. In tightly knit religious communities with strong rabbinic authority structures, large-scale behavioral pivots can occur quickly when communal elites adjust guidance or messaging. The 23→24 disruption, therefore, is evidence not of weakening boundaries, but of the system’s capacity to mobilize rapid, reversible action when confronted with acute political shocks.
This interpretation is reinforced by the recovery pattern. The return to high loyalty in 24→25 was achieved without large numbers of voters switching back to Shas or UTJ; instead, the leakage simply stopped. Once external pressures eased, the ethnic-political boundaries reasserted themselves, and electoral behavior again aligned with long-standing communal norms.
Robustness to Model Specification
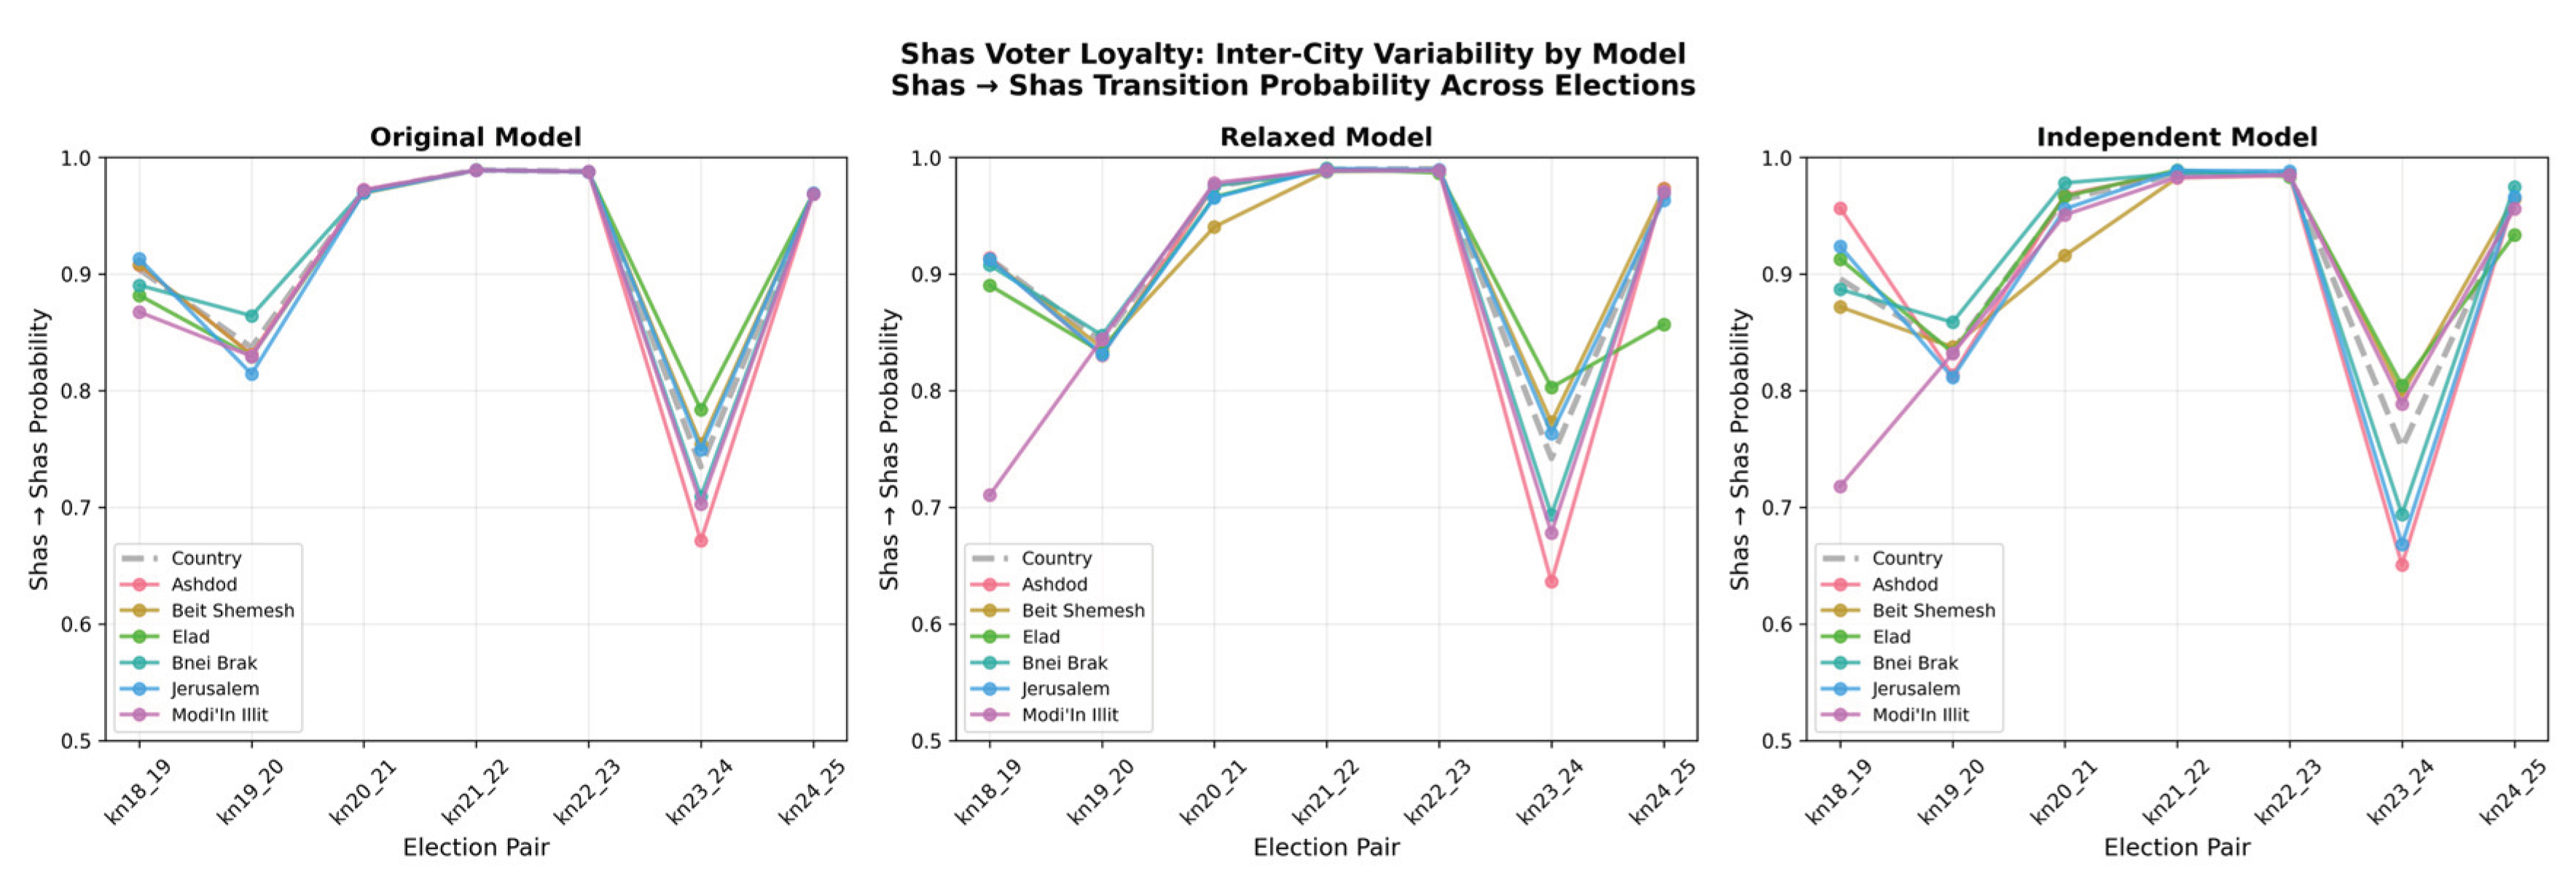
Because synchronized movement can theoretically reflect model structure rather than real behavior, I tested alternative ecological-inference specifications: a relaxed hierarchical model with greatly increased variance and a fully independent (no-pooling) model fitted separately for each city. Both alternatives allowed cities to diverge substantially from national patterns. Yet across all specifications, the same temporal shape remained: a steep, synchronized loyalty drop in 23→24 and a synchronized recovery in 24→25. The persistence of this structure even under highly flexible modeling conditions confirms that the observed coordination reflects genuine empirical patterns rather than a statistical artifact.
A Methodological Warning: Voting as a Proxy for Ethnicity
The extreme temporary switching in Ashdod also explains the anomalous segregation decrease documented in my earlier spatial analysis. Because that study used party votes as proxies for ethnicity in calculating dissimilarity indices, sudden cross-party voting appeared as residential integration—despite no demographic movement. This episode highlights a broader methodological vulnerability: electoral proxies for ethnicity are valid only under stable loyalty conditions. When loyalty shifts, even briefly, segregation indices can misinterpret political behavior as demographic change.
Final Reflection
Taken together, the findings portray a community defined by rigid boundaries capable of tightly coordinate permeability. The 23→24 episode did not signal a long-term weakening of ethnic or political segmentation. Rather, it revealed how cohesive identity blocs respond to stress: with rapid, collective motion that dissipates once the triggering conditions subside. Understanding such dynamics requires treating voting not as a fixed reflection of group identity but as a responsive system shaped by institutional authority, communal cohesion, and the ability to rapidly reassert boundaries after moments of disruption.
Declaration of generative AI and AI-assisted technologies in the manuscript preparation process
During the preparation of this work the author used:
- ChatGPT in order to assist in literature search, and to edit, spellcheck, and proofread the manuscript.
- NotebookLM in order to assist in researching the current state of the art.
- Claude Code and Cursor in order to assist in writing and debugging the code.
After using this tools and services, the author reviewed and edited the content as needed and takes full responsibility for the content of the published article.
Appendix A. City-Level Transition Matrices
The following figures provide detailed transition matrices for all analyzed cities across consecutive elections. These supplement the summary analysis presented in the main text, particularly the condensed discussion in the City-Level Variation section.
Ashdod
Figure A1.
Ashdod exhibited the most extreme disruption during the March 2020–March 2021 transition (2324), with Shas loyalty dropping to 67.1% and 19.3% switching to UTJ.
Figure A1.
Ashdod exhibited the most extreme disruption during the March 2020–March 2021 transition (2324), with Shas loyalty dropping to 67.1% and 19.3% switching to UTJ.
Beit Shemesh
Figure A2.
Beit Shemesh showed moderate disruption with Shas loyalty falling to 75.4% during the 2324 transition.
Figure A2.
Beit Shemesh showed moderate disruption with Shas loyalty falling to 75.4% during the 2324 transition.
Elad
Figure A3.
Elad transition patterns across all election pairs.
Bnei Brak
Figure A4.
Bnei Brak, despite being predominantly Ashkenazi, experienced a sharp Shas loyalty drop to 70.9% during the 2324 transition.
Figure A4.
Bnei Brak, despite being predominantly Ashkenazi, experienced a sharp Shas loyalty drop to 70.9% during the 2324 transition.
Jerusalem
Figure A5.
Jerusalem transition patterns across all election pairs.
Modi’in Illit
Figure A6.
Modi’in Illit transition patterns across all election pairs.
Appendix B. Model Validation and Diagnostics
This section documents model validation through posterior predictive checks and convergence diagnostics for transparency and reproducibility.
Model Validation
Posterior predictive checks confirm that the model adequately reproduces empirical vote counts across all elections. Most chains converged successfully, with effective sample sizes (ESS) exceeding 400 for key parameters and R-hat values approaching 1.01 in later runs. Minor convergence issues in earlier election pairs (January 2013March 2015 transition, Knesset 1920) were resolved by increasing the number of draws and adopting non-centered parameterization.
| Transition | R-hat max | ESS min |
| Kn 19–20 (Jan 2013 to Mar 2015) | 1.530 | 7 |
| Kn 20–21 (Mar 2015 to Apr 2019) | 1.529 | 7 |
| Kn 21–22 (Apr 2019 to Sep 2019) | 1.465 | 7 |
| Kn 22–23 (Sep 2019 to Mar 2020) | 1.134 | 19 |
| Kn 23–24 (Mar 2020 to Mar 2021) | 1.477 | 7 |
| Kn 24–25 (Mar 2021 to Nov 2022) | 1.737 | 6 |
While some early models show high R-hat and low ESS, these issues were largely addressed through increased sampling and refined priors. The final models show stable posteriors without divergences.
Representative diagnostics are shown below.
Figure A7.
Rank plots for the Kn 2122 (April 2019–September 2019) transition showing uniform distributions across chains, indicating good mixing.
Figure A7.
Rank plots for the Kn 2122 (April 2019–September 2019) transition showing uniform distributions across chains, indicating good mixing.
Appendix C. Model Robustness Testing
To verify that the observed synchronization of voter transitions across cities represents genuine coordinated behavior rather than an artifact of the hierarchical Bayesian model structure, I tested three alternative model specifications with varying levels of flexibility for city-specific patterns.
Model Specifications
Original Hierarchical Model (baseline): The model described in the Methods section uses hierarchical pooling with moderately tight priors to stabilize estimates while allowing cities to deviate from national patterns. Key parameters: sigma_D = 0.3, delta_scale = 0.5, D_sigma = 0.3.
Relaxed Hierarchical Model: Same hierarchical structure but with substantially increased variability parameters to allow greater city-specific deviations: sigma_D = 0.8 (+167%), delta_scale = 1.5 (+200%), D_sigma = 0.8 (+167%). This specification tests whether tighter priors artificially constrain city-level patterns.
Independent Model: Each city is fitted separately without hierarchical pooling. The country-level transition matrix is estimated first, then used as a prior mean for independent city-level fits with sigma_city = 0.8. This specification completely removes structural constraints toward similarity between cities.
Results
Despite the increased flexibility allowing cities to diverge substantially from national patterns (248% increase in inter-city variability for the independent model), the synchronized drops and recoveries in Shas loyalty remained evident across all model specifications. Figure A8 shows Shas→Shas retention rates across all three models, revealing that the temporal patterns and cross-city synchronization persist regardless of model structure.
Figure A8.
Shas→Shas retention rates across models. Each panel shows one location (country or city) with three lines representing the original hierarchical (blue), relaxed hierarchical (orange), and independent (green) models. The synchronized drop during the 23→24 transition appears in all models across all cities.

Figure A9 presents an alternative view with one panel per model, showing all cities together within each specification. The inter-city standard deviation (shown in gray shading) increases substantially in the relaxed and independent models, confirming that these specifications successfully allow greater divergence. Yet the temporal correlation across cities remains evident in all three panels.
Ecological Bayesian Modeling for Electoral Transitions
This natural experiment, the 2020 - 21 electoral crisis, provided a rare opportunity to observe voter transitions over a short period and demonstrates the utility of hierarchical Bayesian ecological inference for analyzing such transitions in contexts where individual-level data are unavailable due to ballot secrecy. The framework successfully captures both national baseline patterns and city-specific deviations while accounting for the inherent uncertainty in ecological inference. The temporal extensionusing posterior distributions from one election pair to inform priors for the nextallows the model to trace gradual evolution while remaining flexible enough to detect sharp disruptions.
The approach is replicable across other contexts where: - Aggregate data (ballot-box or precinct-level) are available - Individual voting patterns are unobserved - Both national trends and local variation are of interest - Multiple time periods permit temporal modeling
Extending Static Segregation Measures to Dynamic Frameworks
By connecting static dissimilarity indices (measuring separation at a point in time) with transition matrices (measuring movement over time), this research offers a richer portrait of intra-group segmentation. The combination reveals not only that ethnic subgroups maintain distinct residential and political spaces, but also how permeable the boundaries between those spaces areand under what conditions permeability increases.
This methodological pairing could be applied to other segmented populations: immigrant communities divided by origin region, religious denominations within a shared faith tradition, or linguistic minorities maintaining distinct political allegiances. The framework provides a way to quantify both the degree of separation and the rate of exchange between subgroups.
This study focuses on short-term electoral effects and does not address possible social or attitudinal consequences. Future research should examine whether temporary electoral volatility affects long-term communal trust or leadership legitimacy. Comparative studies could test whether similar patterns of ‘hidden volatility’ appear in other religious or identity-based voting blocs.
Figure A9.
Shas→Shas retention rates by model specification. Each panel shows all cities within one model. Country estimates shown as thick gray dashed line; individual cities as colored solid lines. Gray shading indicates inter-city standard deviation. Despite increased flexibility in relaxed and independent models, synchronized patterns persist.
Quantitative Comparison
Mean Absolute Deviation (MAD) from country estimates across all transition pairs and electoral categories:
- Original hierarchical: MAD = 0.0044
- Relaxed hierarchical: MAD = 0.0116 (+166%)
- Independent: MAD = 0.0152 (+248%)
The substantial increases in inter-city variability confirm that the alternative specifications successfully relax constraints. The persistence of synchronized transitions across all specifications demonstrates that the observed coordination reflects genuine features of the electoral data rather than modeling artifacts.
Full implementation details, including model code and configuration files, are available in the GitHub repository.
References
- Aha, Katharine, Catherine Hiebel, and Linsey Jensen. 2024. “Turning to the Radical Right: Examining Subnational Variation in Radical Right Support after Ethnic Minority Success in East Central Europe.” Electoral Studies 83: 102828. [CrossRef]
- Andersen, Jørgen Goul, and Meir Yaish. 2003. “Social Cleavages, Electoral Reform and Party Choice: Israel’s ‘Natural’ Experiment.” Electoral Studies 22 (3): 399–423. [CrossRef]
- Ben Porat, Guy, and Dani Filc. 2022. “Religious Populism in Israel: The Case of Shas.” Politics and Religion 15 (2): 289313. [CrossRef]
- Brown, Philip J., and C. Desmond Payne. 1986. “Aggregate Data, Ecological Regression and Voting Transitions.” Journal of the American Statistical Association 81 (394): 453–460. [CrossRef]
- Bullock, Charles S., et al. 2019. “The Rise of the Christian Right in the South and Its Impact on National Politics.” In The South and the Transformation of U.S. Politics. New York: Oxford University Press. [CrossRef]
- Campbell, David E., John C. Green, and Geoffrey C. Layman. 2011. “The Party Faithful: Partisan Images, Candidate Religion, and the Electoral Impact of Party Identification.” American Journal of Political Science 55 (1): 42–58. [CrossRef]
- Cincotta, Richard. 2013. “Government Without the Ultra-Orthodox?” Demography and the Future of Israeli Politics. FPRI eNotes, December. Philadelphia: Foreign Policy Research Institute.
- Clarke, Harold D., David Sanders, Marianne C. Stewart, and Paul Whiteley. 2004. Political Choice in Britain. Oxford: Oxford University Press.
- Curiel, Concha Pérez, and Rami Zeedan. 2024. “Social Identity and Voting Behavior in a Deeply Divided Society: The Case of Israel.” Societies 14 (9): 177. [CrossRef]
- Forcina, Antonio, and Domenico Pellegrino. 2019. “Estimation of Voter Transitions and the Ecological Fallacy.” Quality & Quantity 53: 1859–1874. [CrossRef]
- Freedman, Michael. 2020. “Vote with Your Rabbi: The Electoral Effects of Religious Institutions in Israel.” Electoral Studies 67: 102241. [CrossRef]
- Gelman, Andrew, and Jennifer Hill. 2007. Data Analysis Using Regression and Multilevel/Hierarchical Models. Cambridge: Cambridge University Press.
- Gidron, Noam, Lior Sheffer, and Guy Mor. 2022. “Validating the Feeling Thermometer as a Measure of Partisan Affect in Multi-Party Systems.” Electoral Studies 80: 102542. [CrossRef]
- Glynn, Adam N., and Jon Wakefield. 2010. “Ecological Inference in the Social Sciences.” Statistical Methodology 7 (3): 307–322. [CrossRef]
- Goodman, Leo A. 1953. “Ecological Regressions and the Behavior of Individuals.” American Sociological Review 18, no. 6 (December): 663–664. [CrossRef]
- Goodwin, Matthew J., Eric Kaufmann, and Erik G. Larsen. 2022. “Asymmetric Realignment: Immigration and Right Party Voting.” Electoral Studies 80: 102551. [CrossRef]
- Gorelik, Boris. 2025. “Ethnic Divisions Within Unity: Insights into Intra-Group Segregation from Israel’s Ultra-Orthodox Society.” Social Sciences 14 (3): 169. [CrossRef]
- Greiner, James, and Kevin Quinn. 2010. “RC Ecological Inference: Bounds, Correlations, Flexibility and Transparency of Assumptions.” Journal of the Royal Statistical Society: Series A (Statistics in Society) 173 (1): 5581. [CrossRef]
- Keren-Kratz, Menachem. 2025. “The Turnaround in Israel’s Haredi Society in the Late 20th Century: A DataBased Analysis.” Religions 16 (2): 145. [CrossRef]
- King, Gary. 1997. A Solution to the Ecological Inference Problem: Reconstructing Individual Behavior from Aggregate Data. Princeton, NJ: Princeton University Press.
- Leon, Nissim. 2014. “Ethno-Religious Fundamentalism and Theo-Ethnocratic politics in Israel.” Studies in Ethnicity and Nationalism 14 (1): 20–35. [CrossRef]
- Lipset, Seymour Martin, and Stein Rokkan. 1967. Party Systems and Voter Alignments: Cross-National Perspectives. New York: Free Press.
- Malach, Gilad, and Lee Cahaner. 2025. Statistical Report on Ultra-Orthodox Society in Israel 2024. Jerusalem: Israel Democracy Institute.
- McCauley, John F. 2014. “The Political Mobilization of Ethnic and Religious Identities in Africa.” American Political Science Review 108 (4): 801–16. [CrossRef]
- Puig, Xavier, and Josep Ginebra. 2015. “Ecological Inference and Spatial Variation of Individual Behavior: National Divide and Elections in Catalonia.” Geographical Analysis 47 (3): 262–283. [CrossRef]
- Robinson, William S. 1950. “Ecological Correlations and the Behavior of Individuals.” American Sociological Review 15 (3): 351–357. [CrossRef]
- Rosen, Ori, Wenxin Jiang, Gary King, and Martin A. Tanner. 2001. “Bayesian and Frequentist Inference for Ecological Inference: The R×C Case.” Statistica Neerlandica 55 (2): 134–156. [CrossRef]
- Salvatier, John, Thomas V. Wiecki, and Christopher Fonnesbeck. 2016. “Probabilistic Programming in Python Using PyMC3.” PeerJ Computer Science 2: e55. [CrossRef]
- Simas, Elizabeth N., and Lucas Lothamer. 2025. “Not Just Who, but How: Further Probing the Connection between Primary Election Dissatisfaction and General Election Voting Behavior.” Electoral Studies 88: 102969. [CrossRef]
- Smith, Amy Erica. 2019. “Church Influence on Voting Behavior.” In Religion and Brazilian Democracy: Mobilizing the People of God, 113–129. Cambridge Studies in Social Theory, Religion, and Politics. Cambridge: Cambridge University Press. [CrossRef]
- Wakefield, Jon. 2004. “Ecological Inference for 2×2 Tables (with Discussion).” Journal of the Royal Statistical Society: Series A 167(3): 385–445. [CrossRef]
- Zalcberg, Sara. 2023. “The Ultra-Orthodox in Israel: Who they are, where they are headed.” Center of Jadaic and Inter-religious Studies of Shandong University 21.
Figure 1.
Ashdod exhibits a distinctive sharp drop in dissimilarity index between Knesset 23 and 24 (March 2020–March 2021), while other major Haredi cities show stable segregation patterns. The index measures spatial segregation between Ashkenazi and Sephardi Haredi populations within the Haredi residential hubs of each city, with higher values indicating greater ethnic separation. Reconstructed from data in Gorelik (2025).
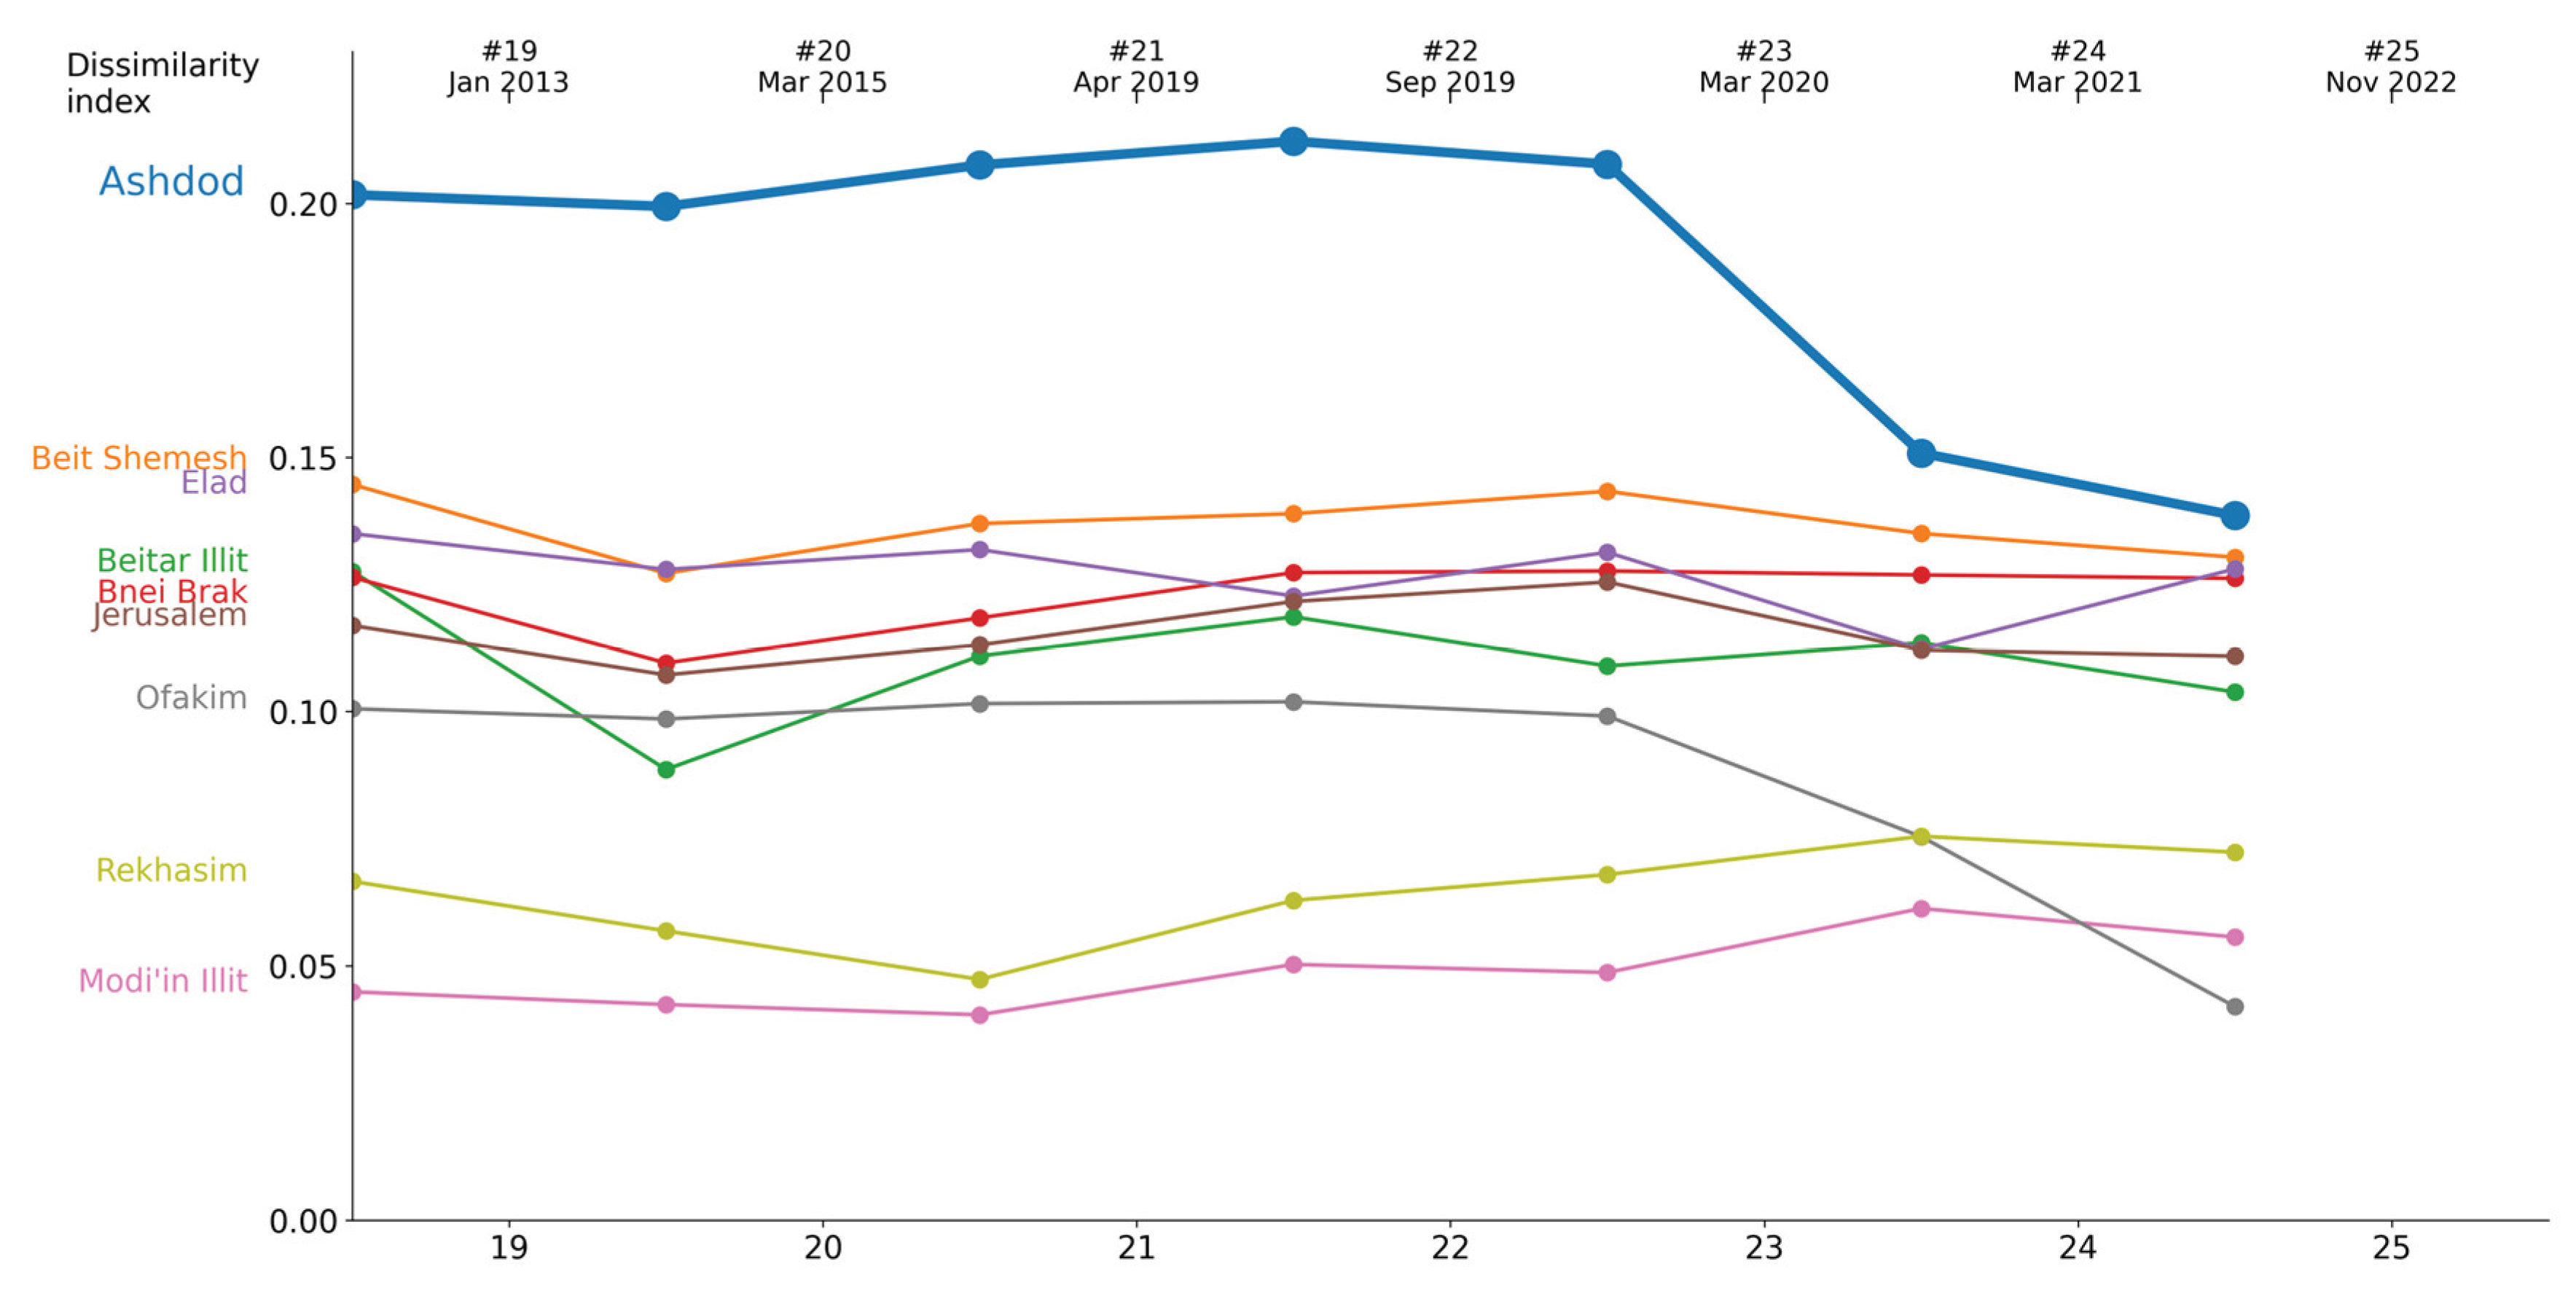
Figure 2.
A single sharp disruption emerges within an otherwise highly stable pattern of national Haredi voting. Each panel presents estimated transition probabilities between electoral categories across Knesset elections 18–25, showing strong Shas and UTJ retention, low cross-party flows in most periods, and a pronounced but temporary spike in switching during the Knesset 23→24 transition.
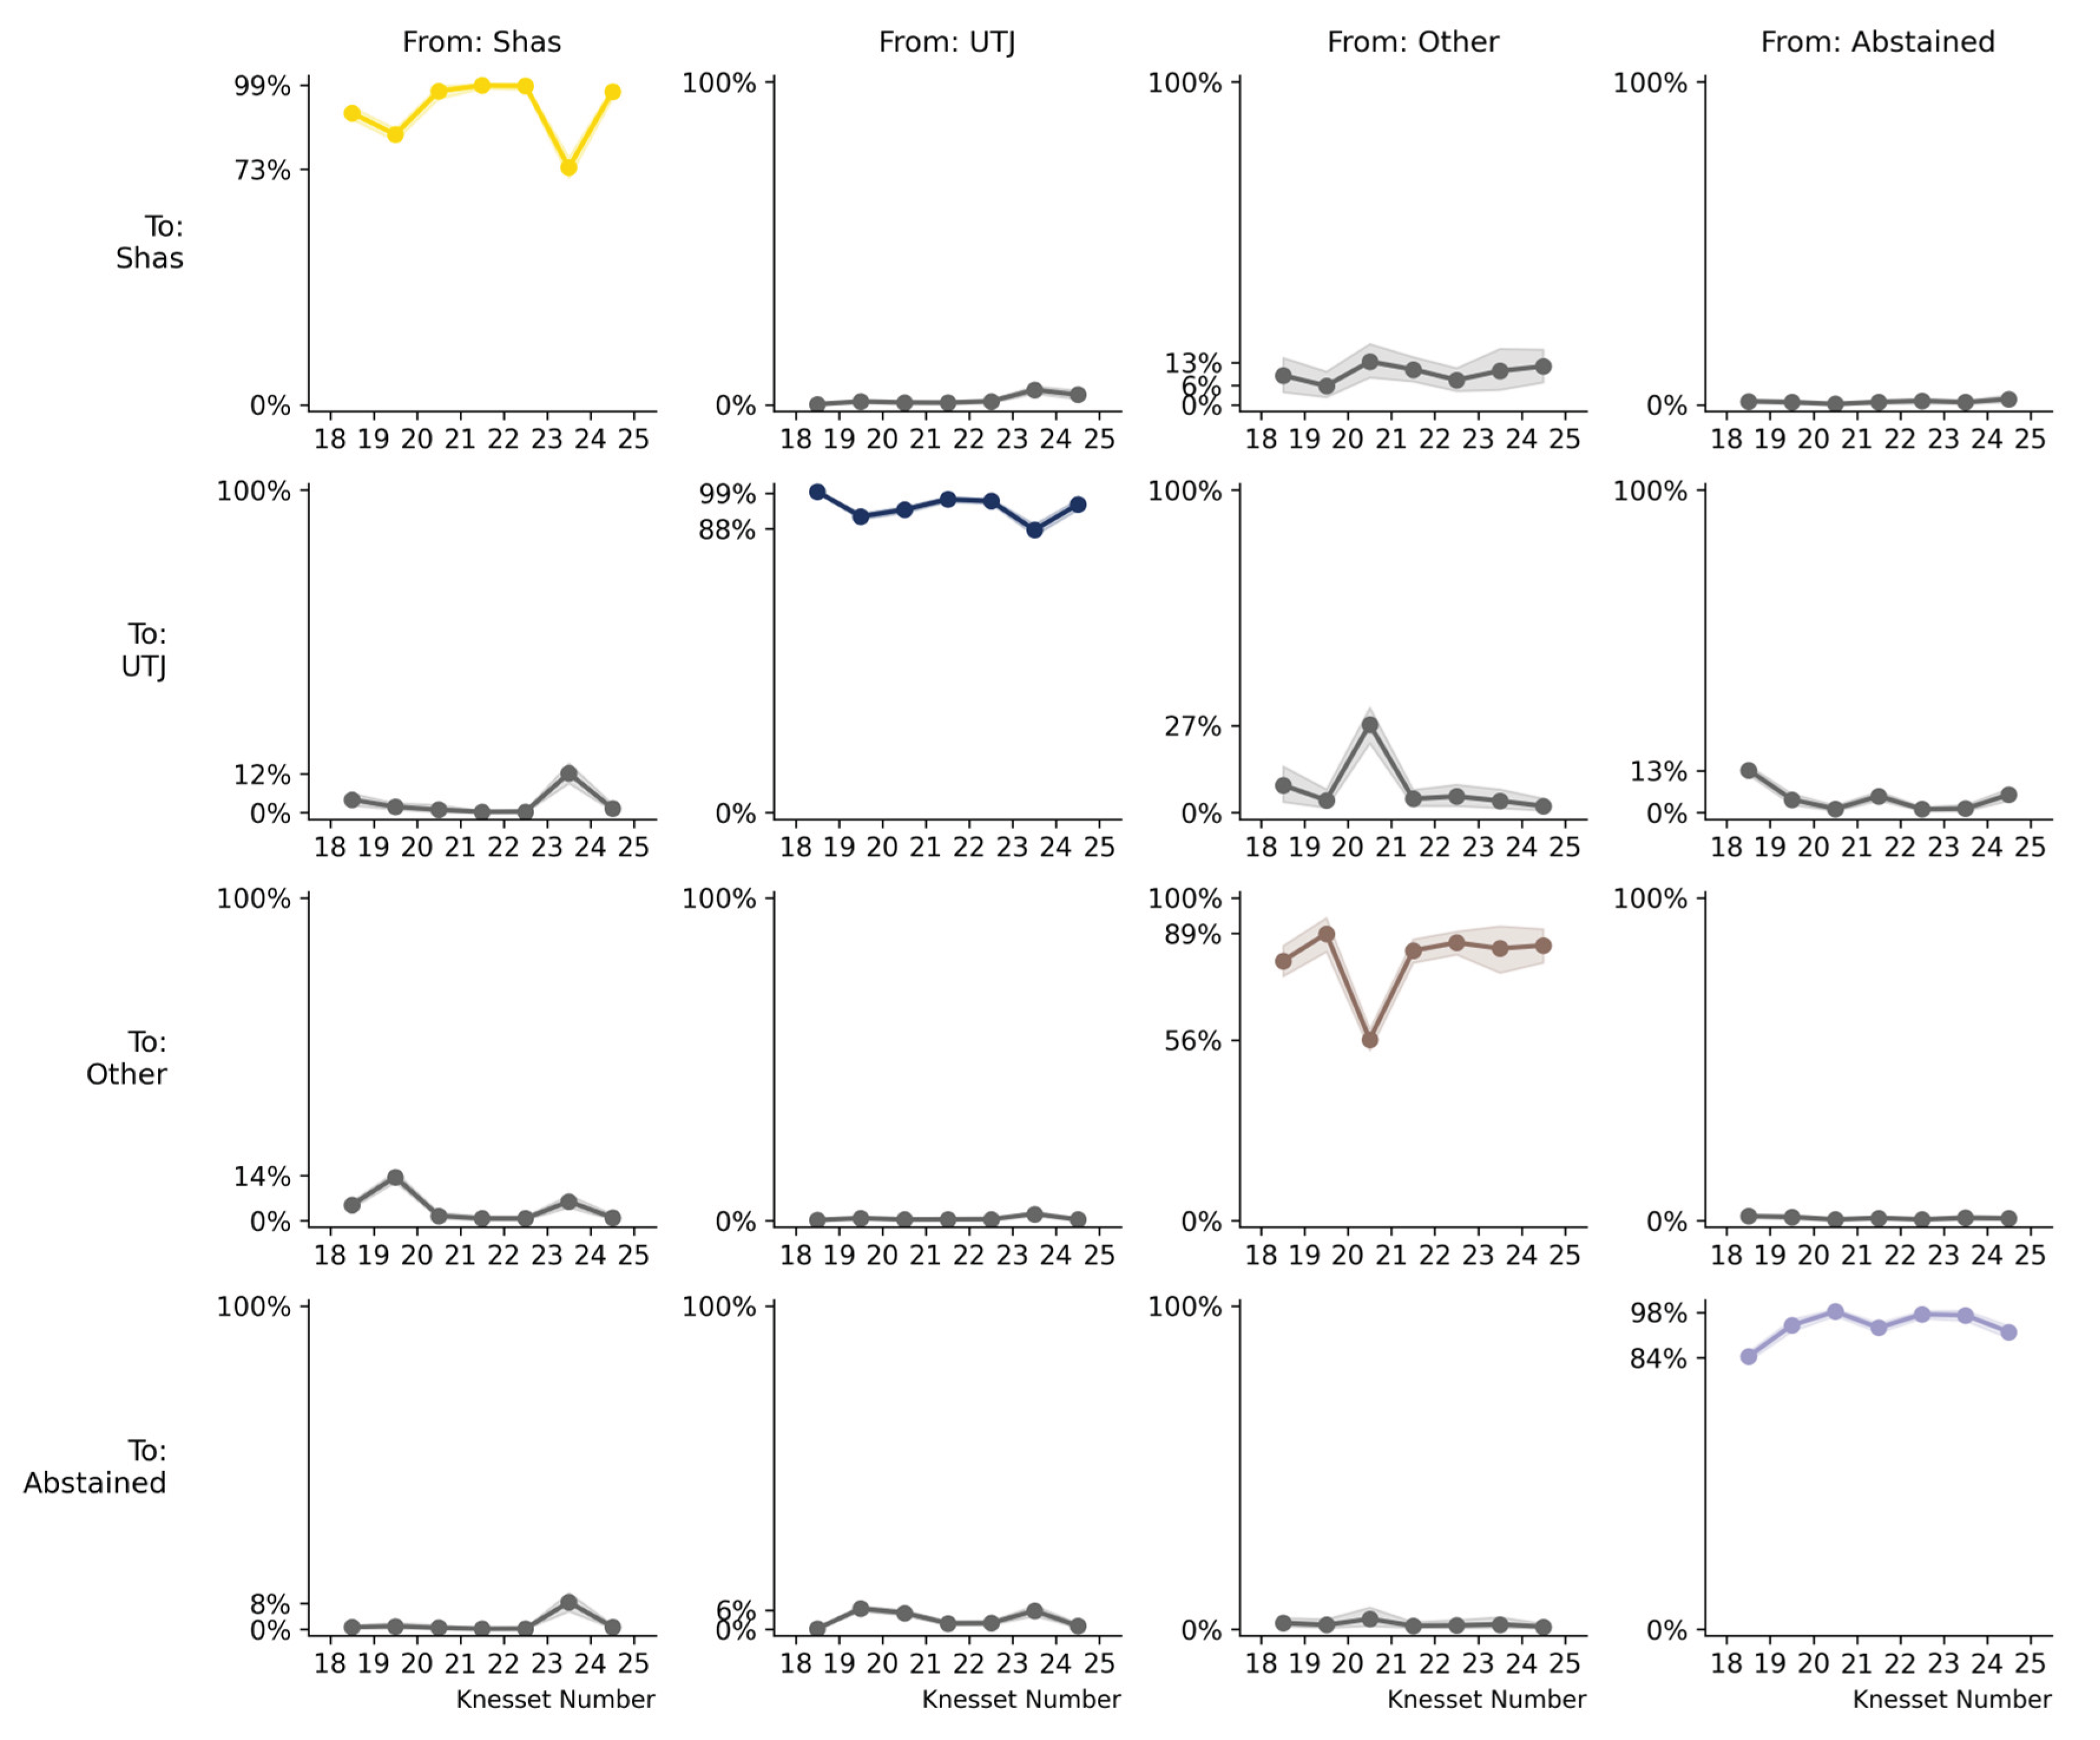
Figure 3.
Synchronized loyalty drops across all major Haredi population centers. City-level Shas-to-Shas transition probabilities reveal a consistent 23→24 decline and a subsequent 24→25 rebound, with Ashdod (blue) showing the most substantial disruption.
Figure 3.
Synchronized loyalty drops across all major Haredi population centers. City-level Shas-to-Shas transition probabilities reveal a consistent 23→24 decline and a subsequent 24→25 rebound, with Ashdod (blue) showing the most substantial disruption.
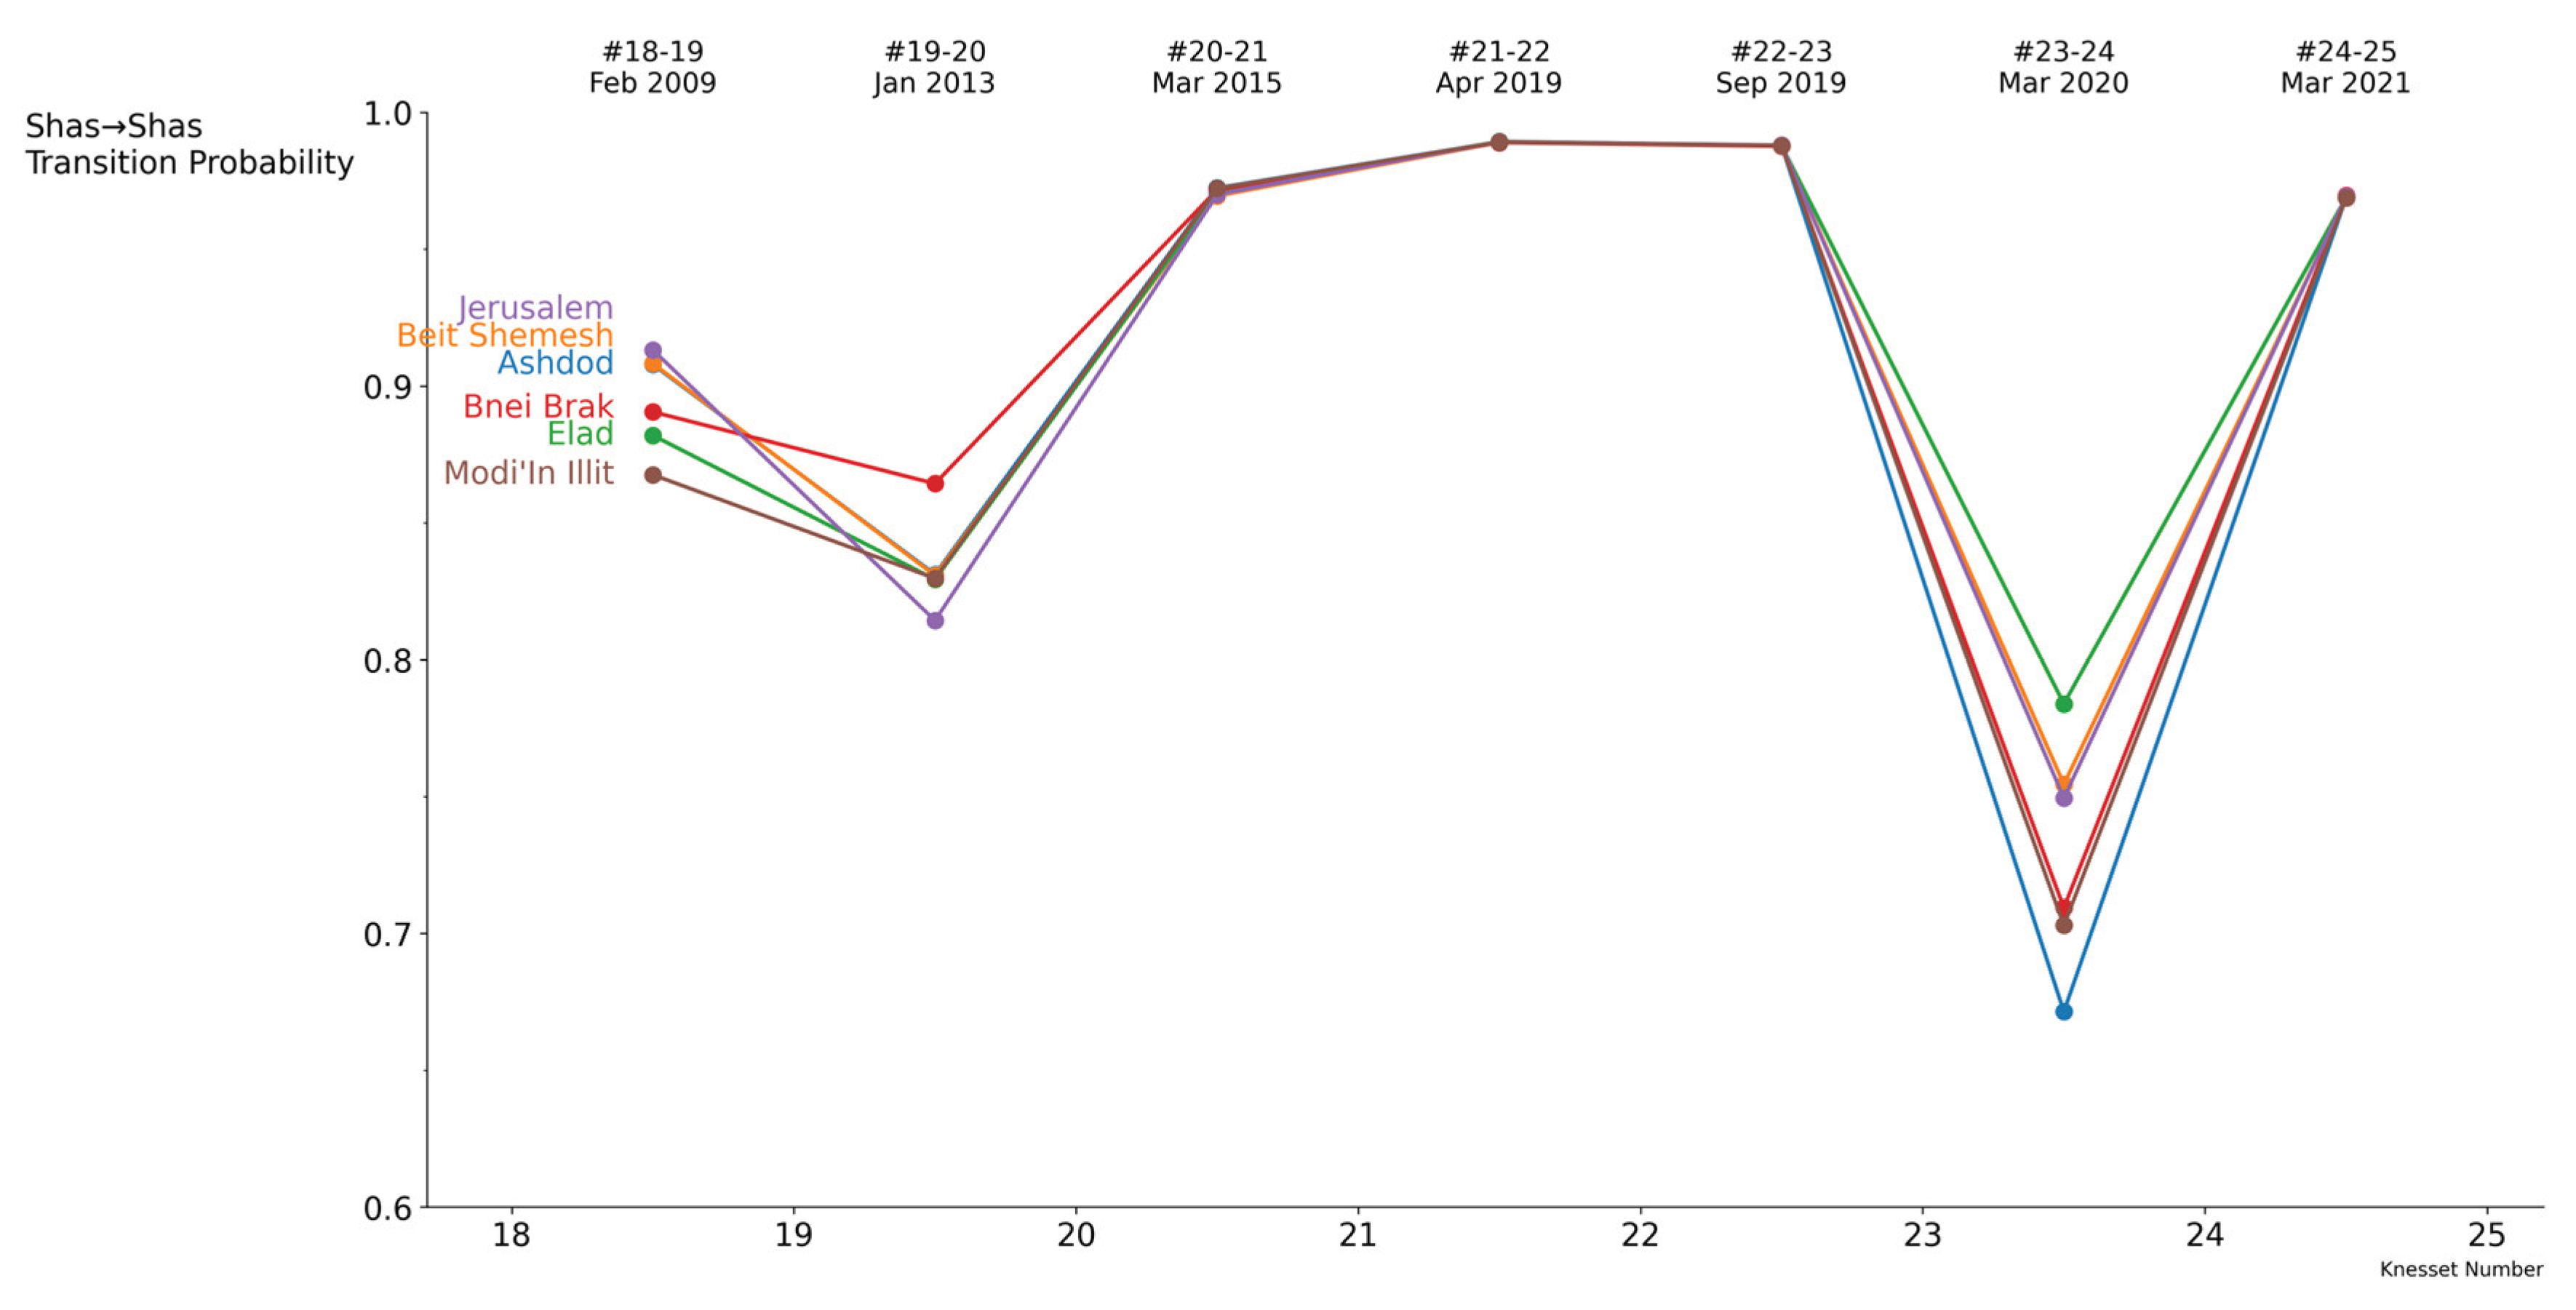
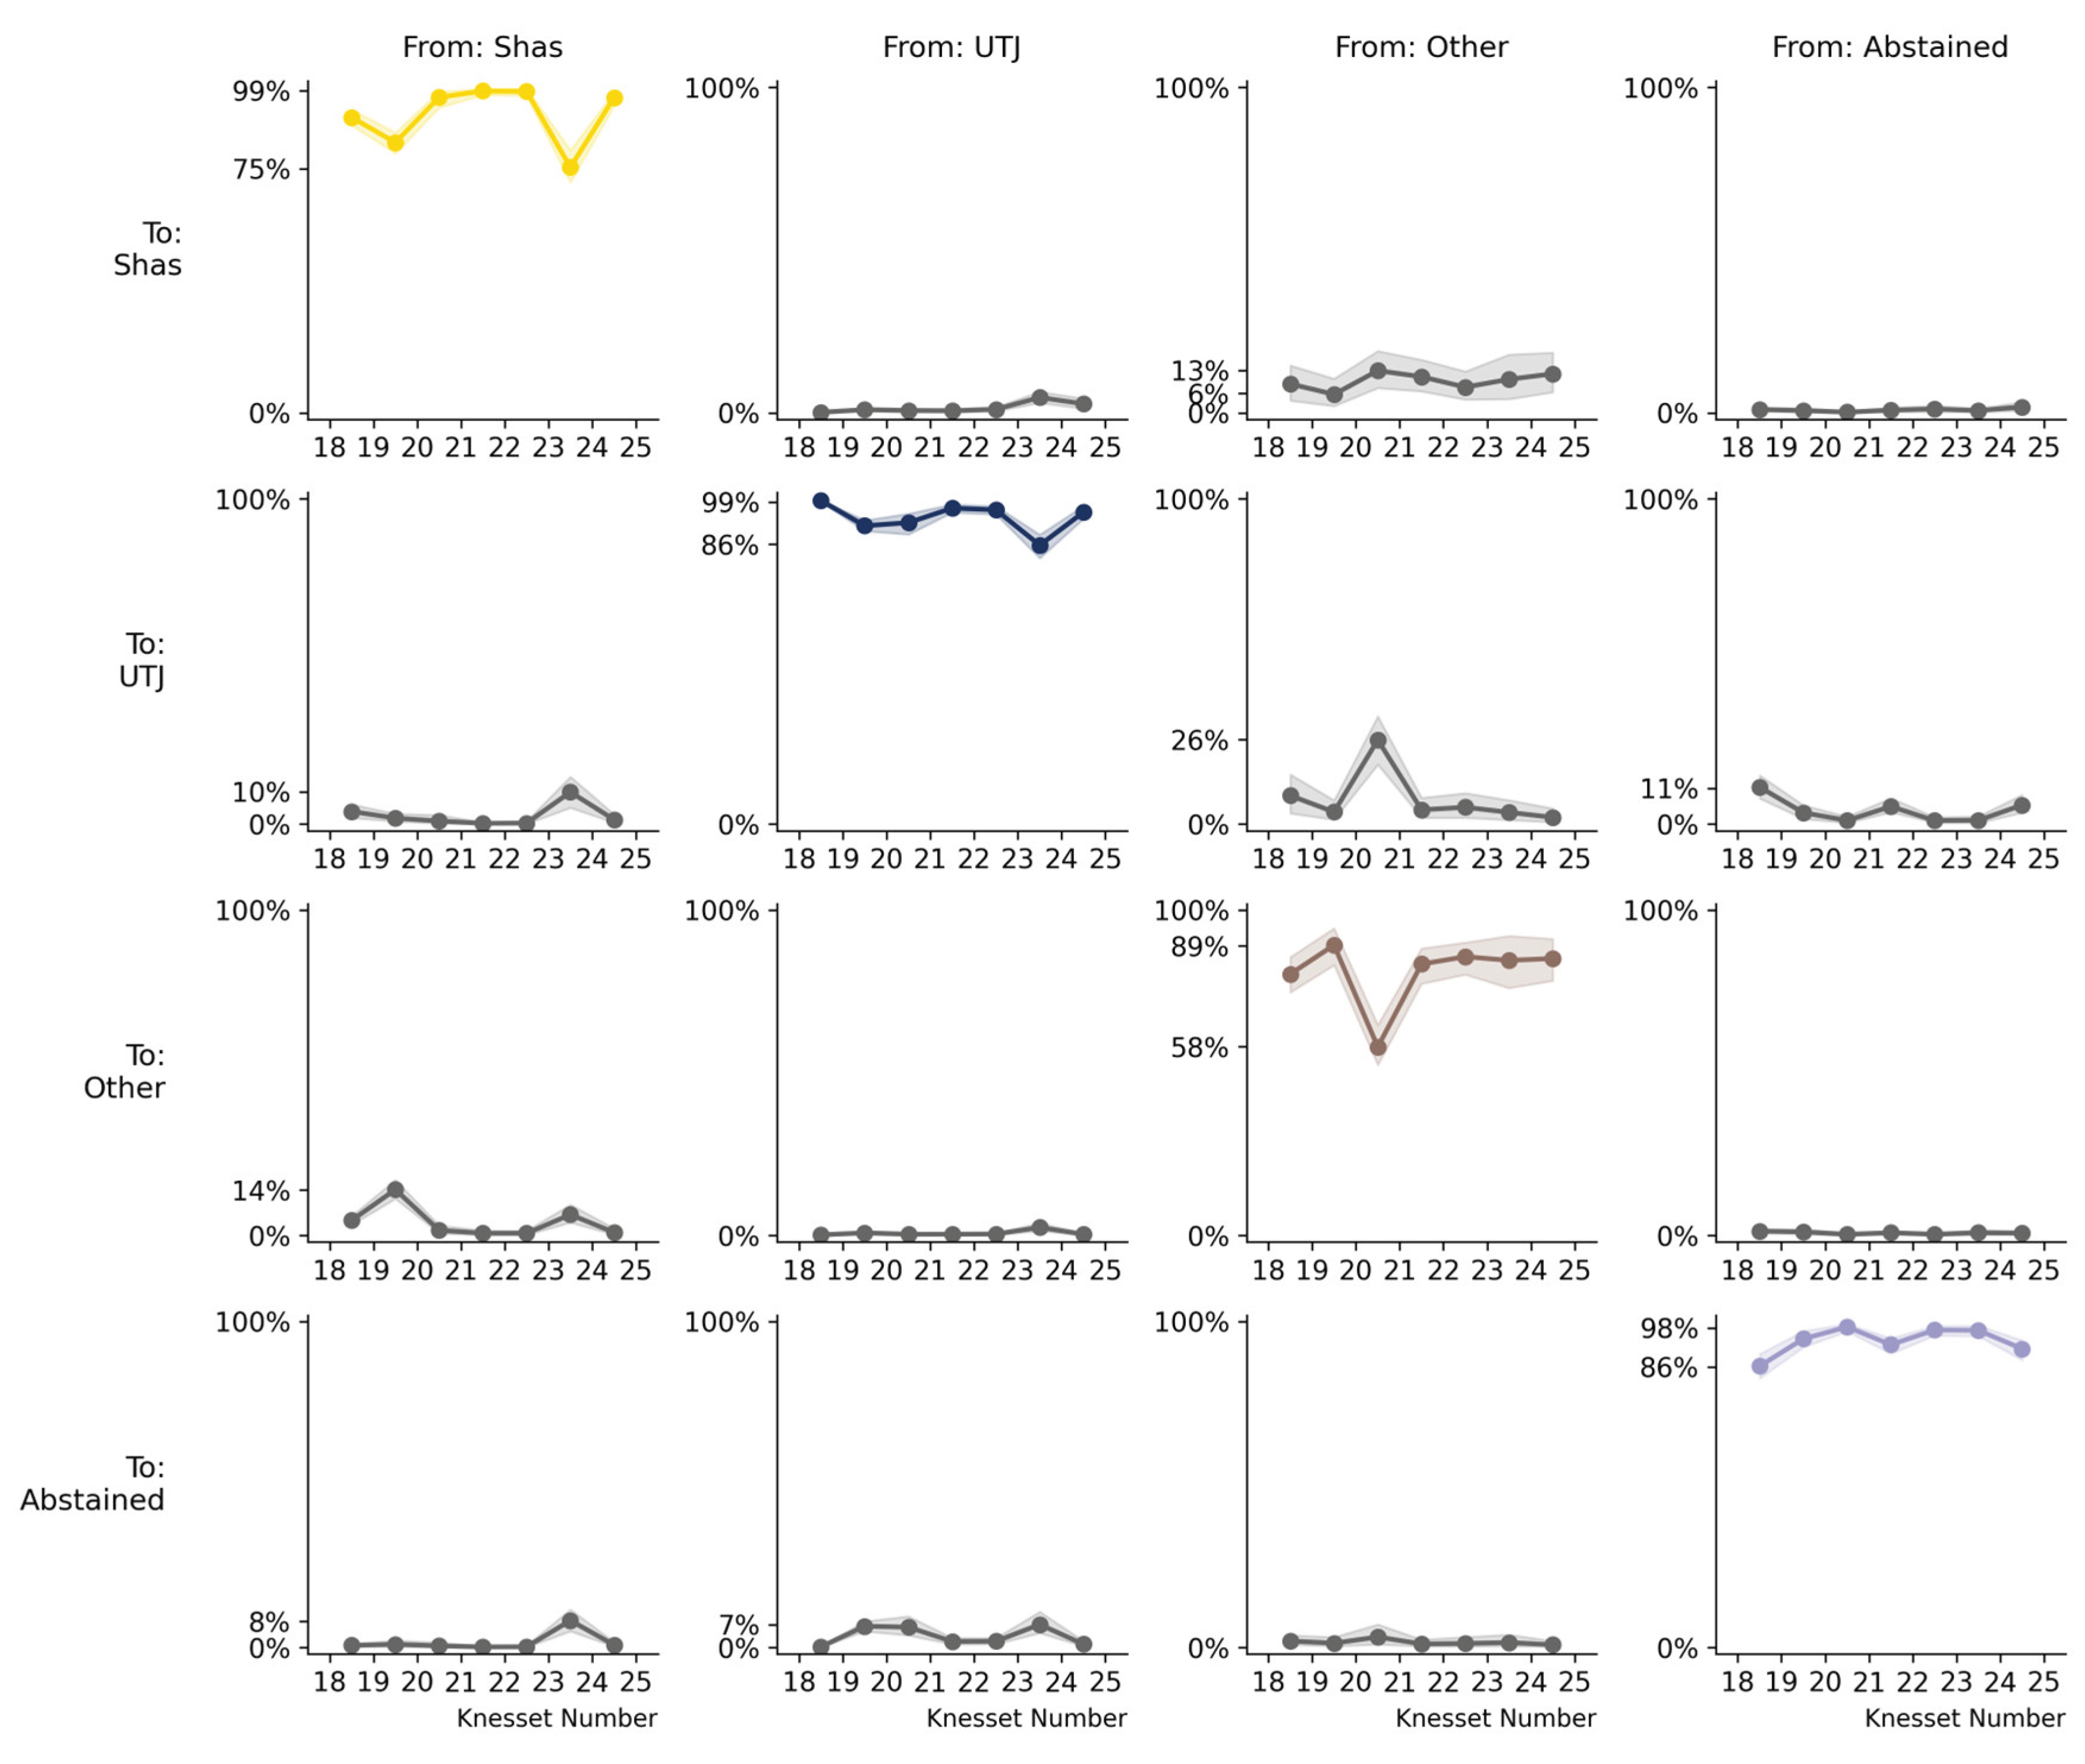
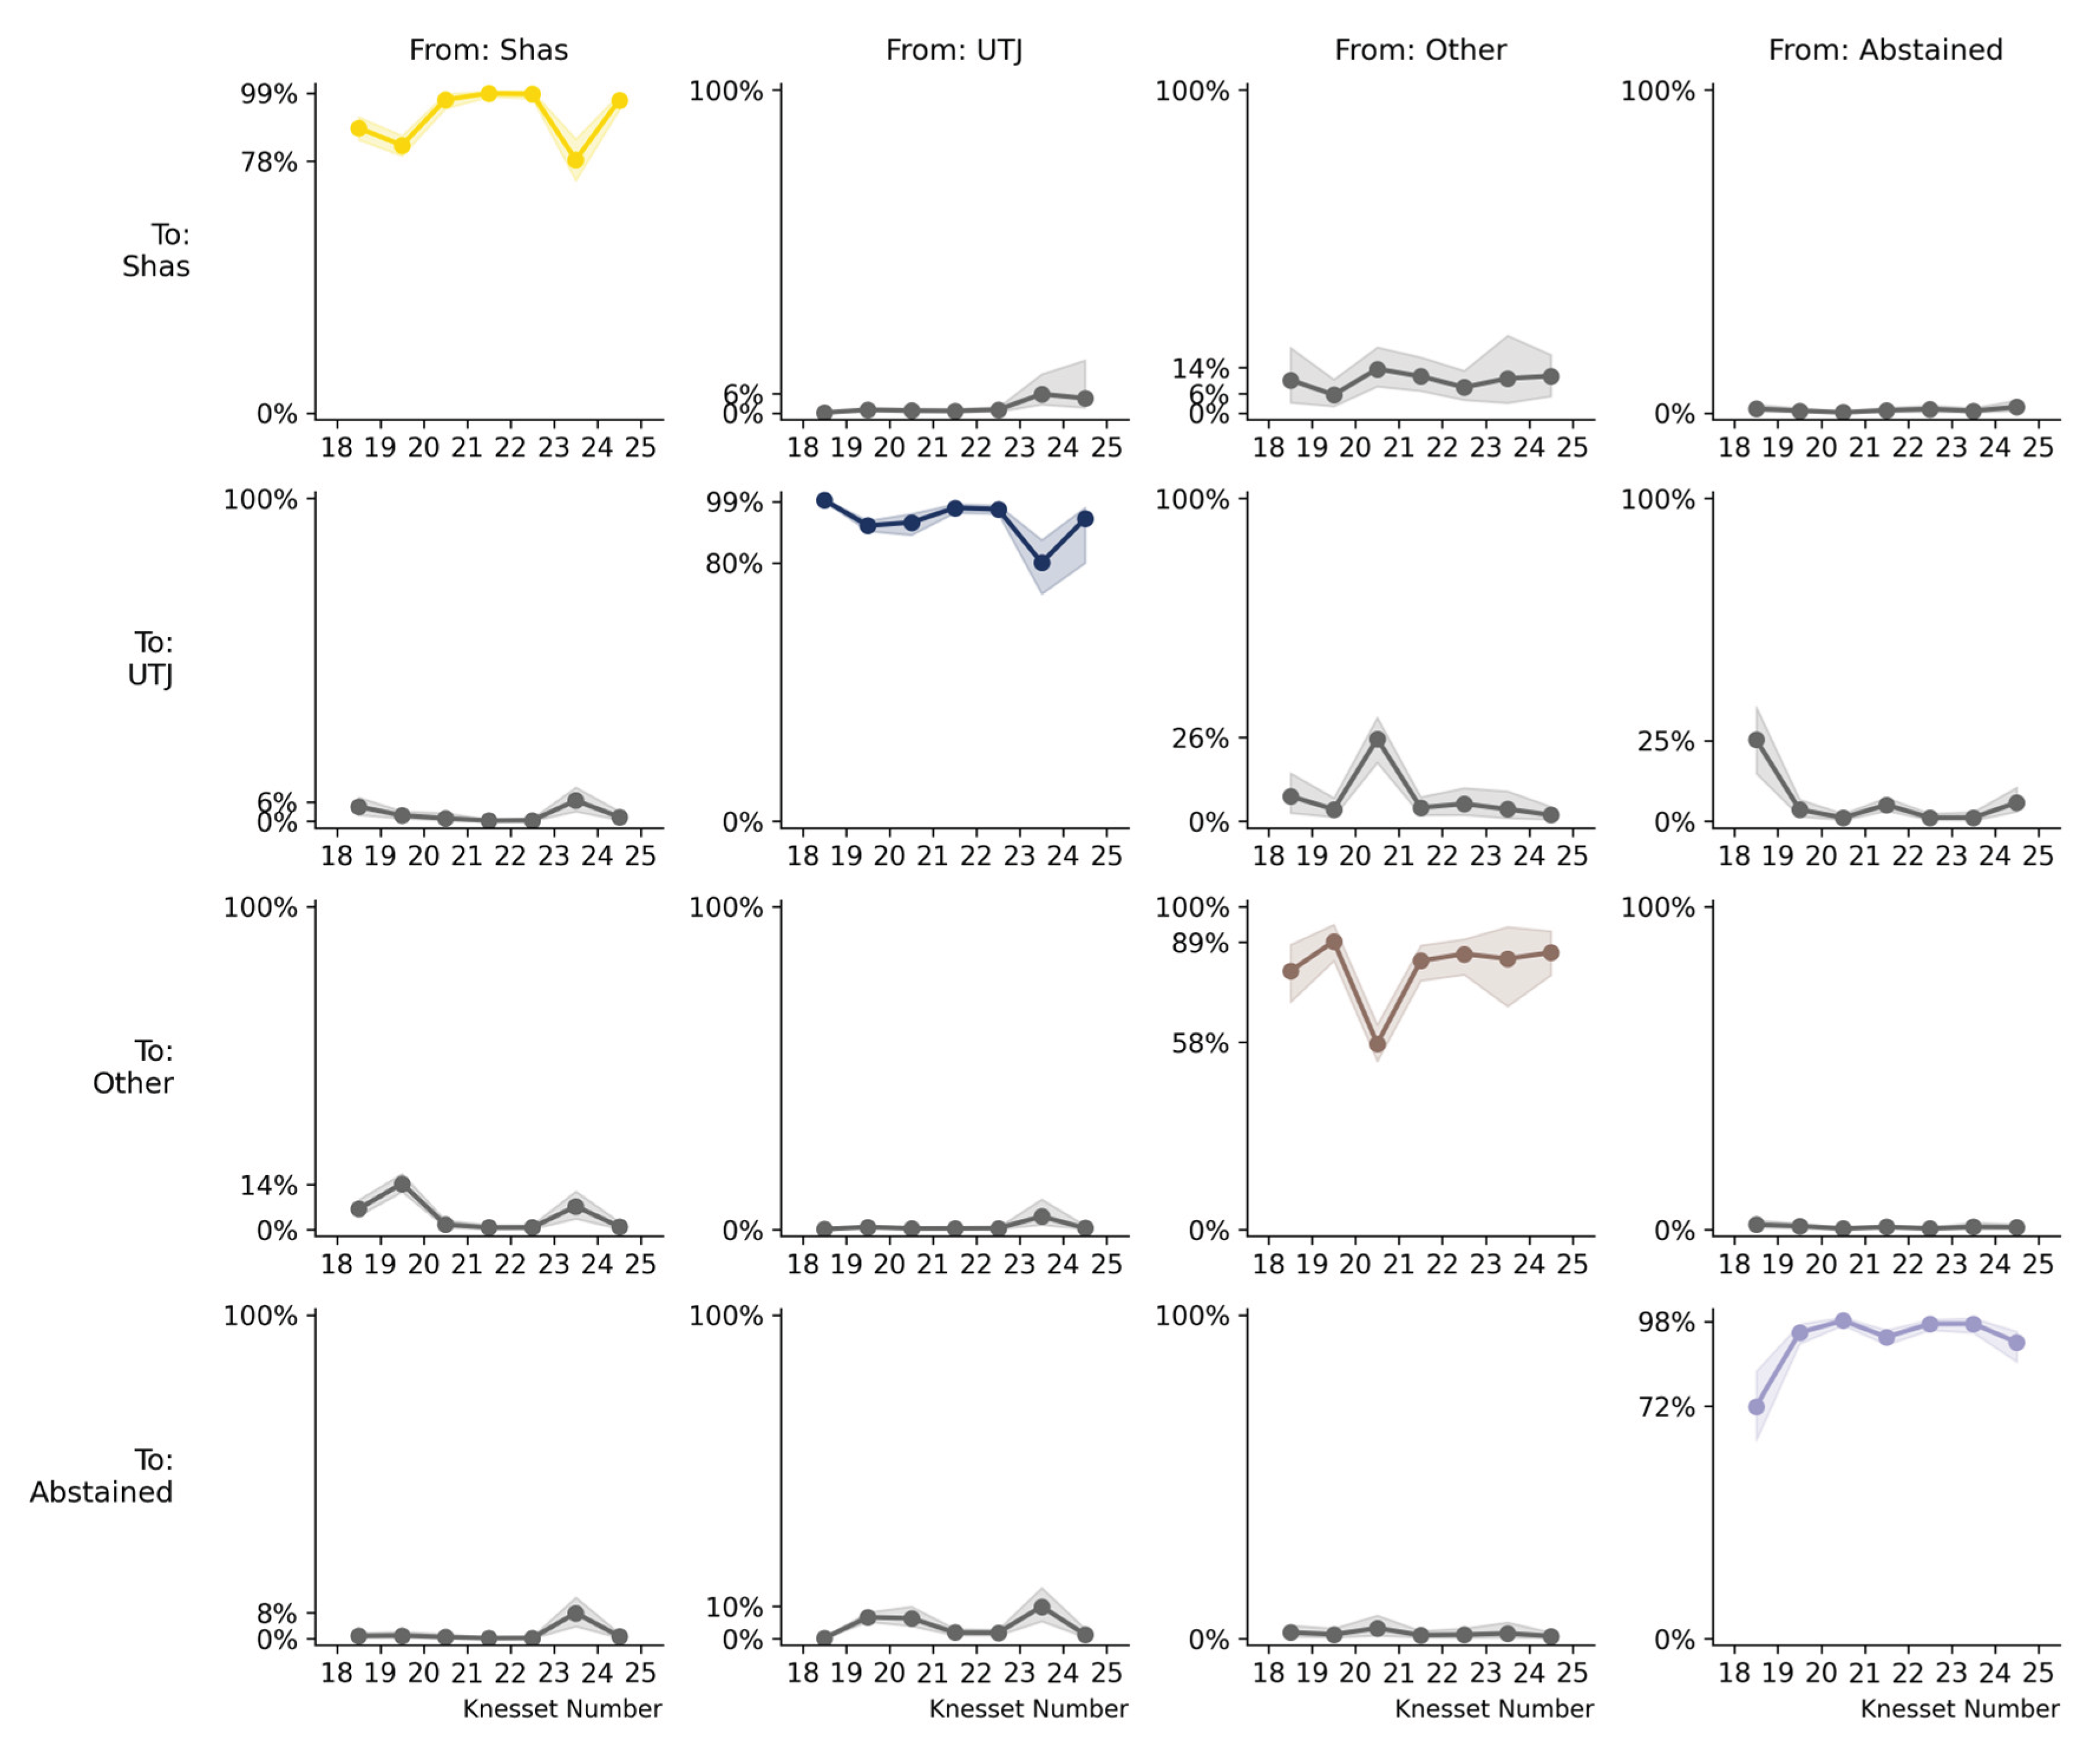
Figure 4.
Sharp drop in Shas-to-Shas loyalty and a surge in Shas-to-UTJ switching during the 23→24 transition. The transition matrices visualize voter flows between Shas, UTJ, other parties, and abstention across Knesset elections 18–25, highlighting the temporary collapse of Shas loyalty and the corresponding rise in cross-camp movement.
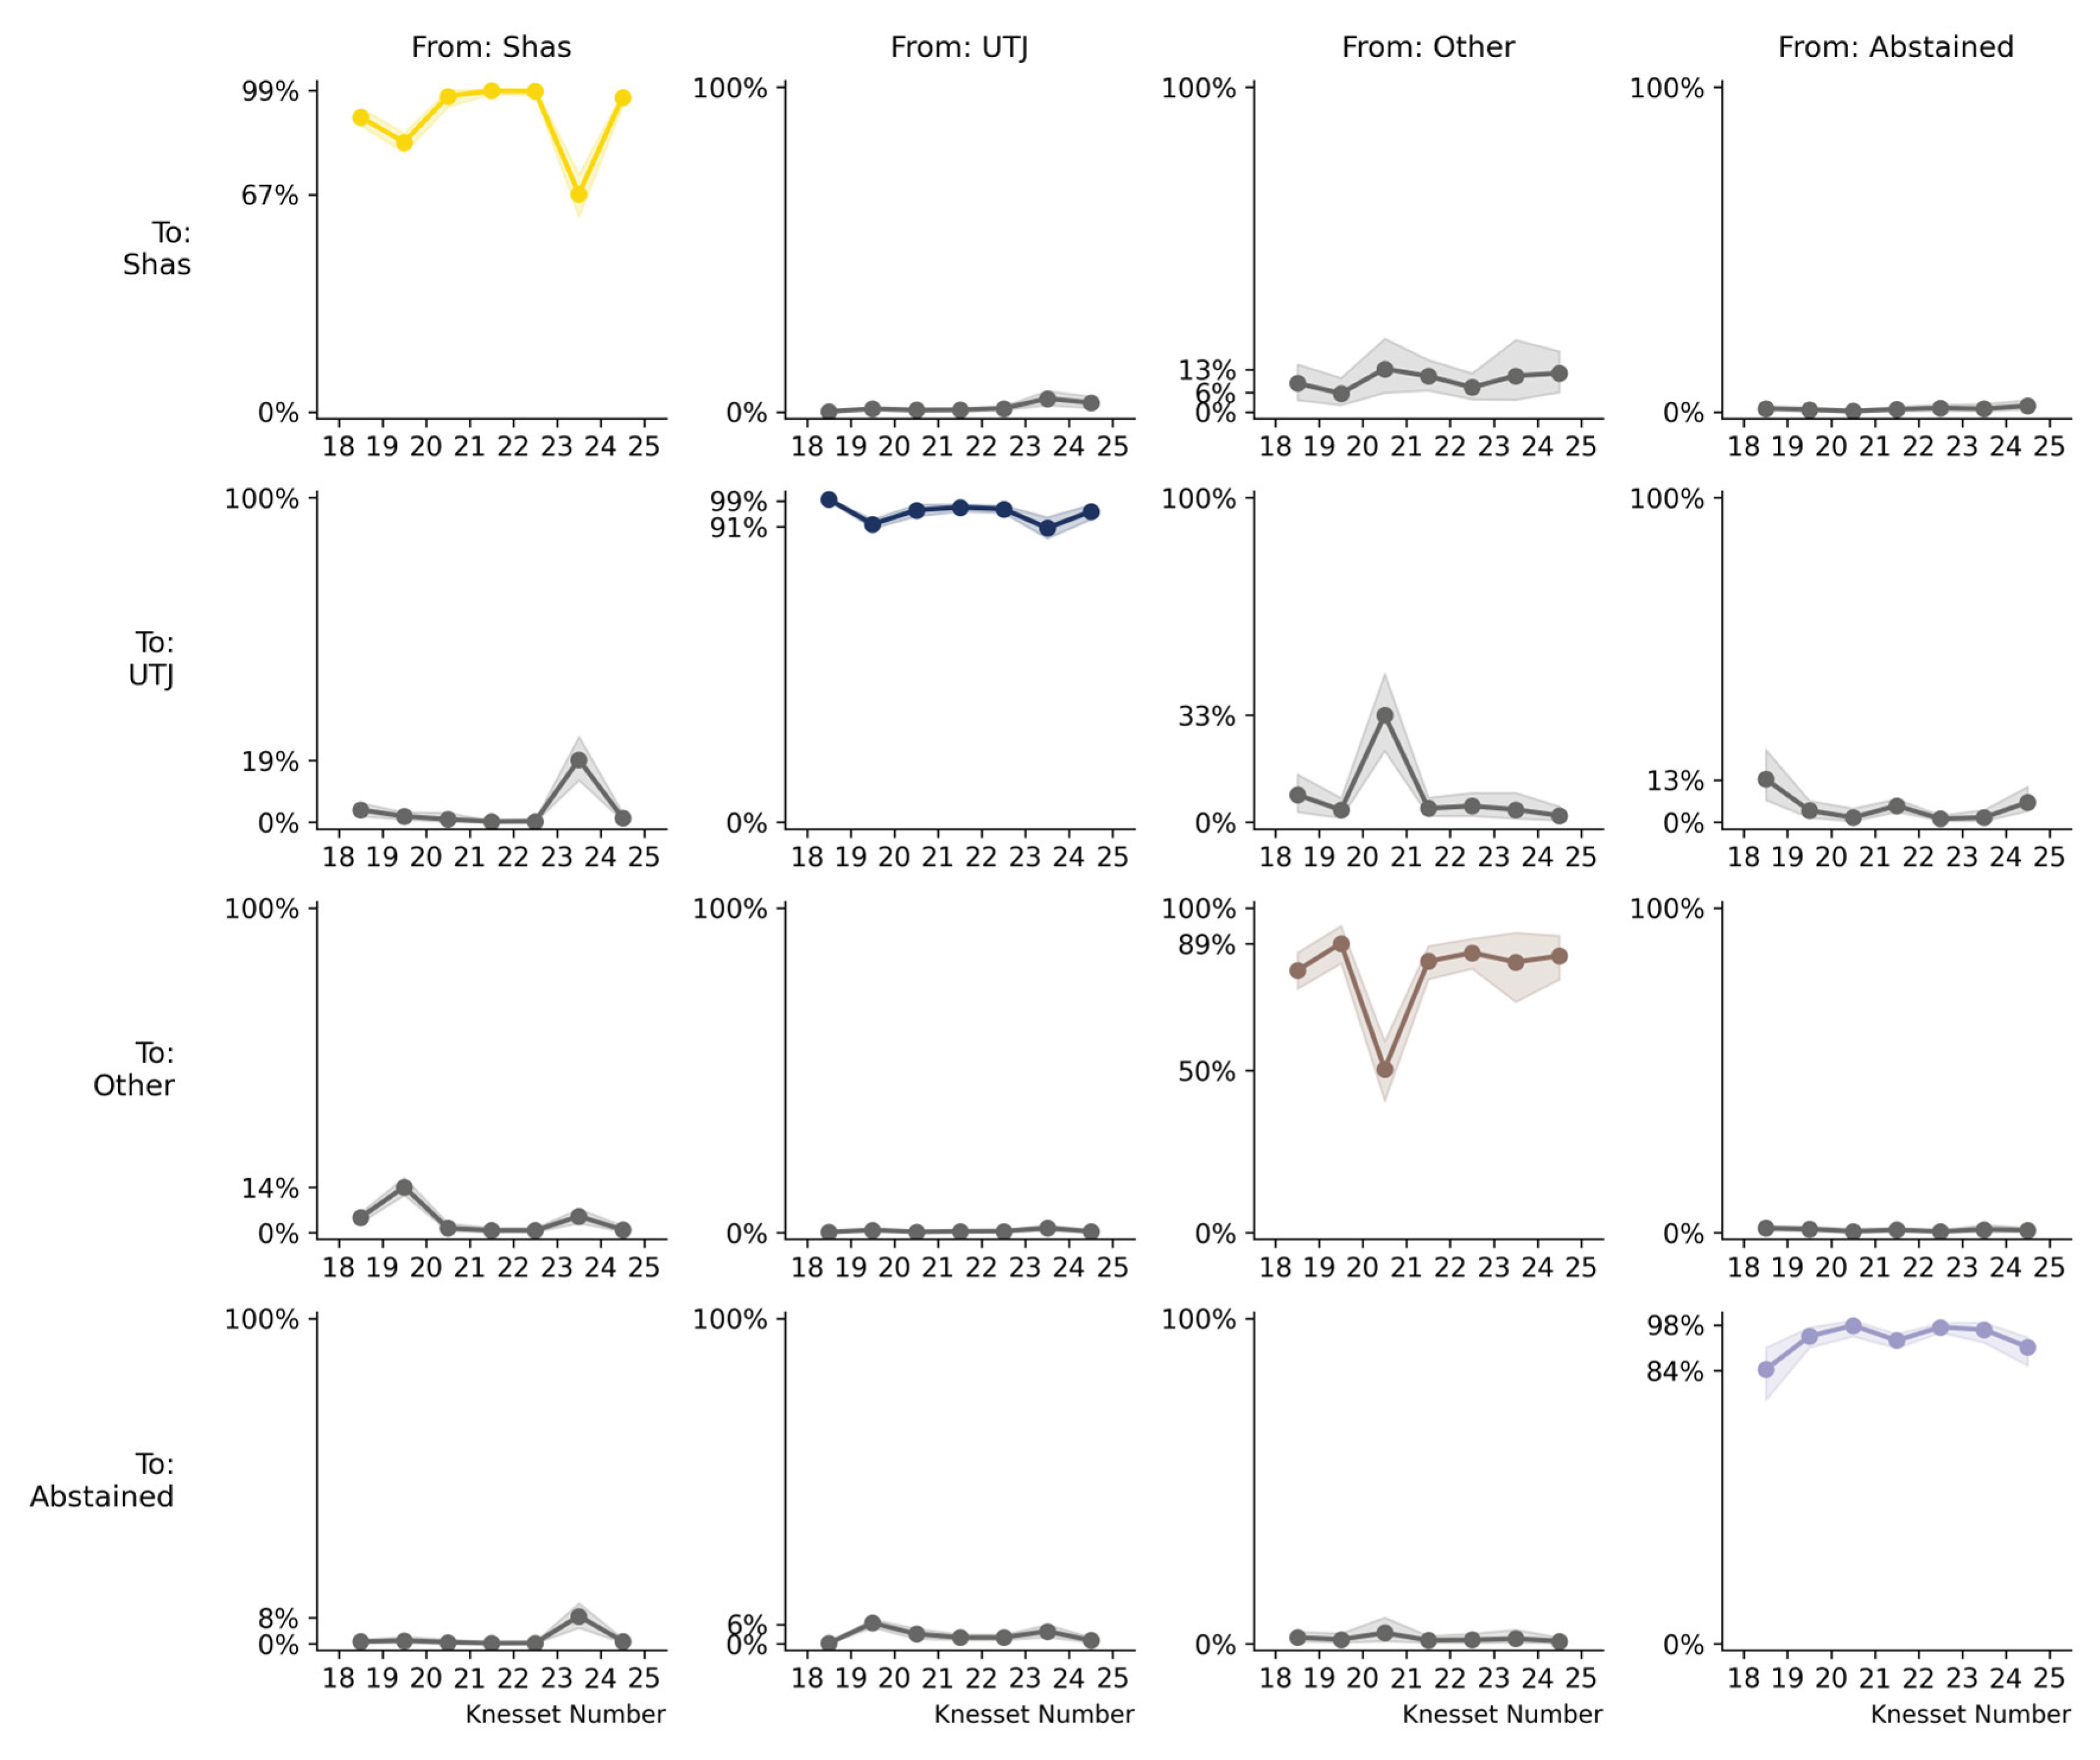

Table 1.
Election Dates and Intervals.
| Knesset | Election Date | Months Since Previous |
|---|---|---|
| 22 | September 17, 2019 | 5.3 |
| 23 | March 2, 2020 | 5.5 |
| 24 | March 23, 2021 | 12.7 |
| 25 | November 1, 2022 | 19.3 |
Disclaimer/Publisher’s Note: The statements, opinions and data contained in all publications are solely those of the individual author(s) and contributor(s) and not of MDPI and/or the editor(s). MDPI and/or the editor(s) disclaim responsibility for any injury to people or property resulting from any ideas, methods, instructions or products referred to in the content. |
© 2025 by the authors. Licensee MDPI, Basel, Switzerland. This article is an open access article distributed under the terms and conditions of the Creative Commons Attribution (CC BY) license (http://creativecommons.org/licenses/by/4.0/).
Copyright: This open access article is published under a Creative Commons CC BY 4.0 license, which permit the free download, distribution, and reuse, provided that the author and preprint are cited in any reuse.


