Introduction
Ethnic segregation is a global phenomenon shaping social dynamics, urban development, and political behavior [
1,
2]. While much research focuses on segregation between distinct racial or national groups, intra-group ethnic segregation—divisions within broader cultural or religious communities—also significantly influences societal structures [
3]. Understanding these patterns is key to addressing inequality and fostering cohesion.
Israel presents a compelling case for studying ethnic segregation due to its diverse population and complex social fabric. Beyond the Jewish-Arab divide, there are ethnic distinctions within Israel’s Jewish population, particularly between Ashkenazi (European descent) and Sephardic (Middle Eastern and North African descent) Jews. These divisions are evident in Israel’s ultra-Orthodox (Haredi; plural: Haredim) Jewish communities, which, despite shared religious practices, often maintain separate institutions and social networks [
4]. This study examines ethnic segregation within this sector, which wields significant societal influence.
Haredi residential patterns reflect the interplay of identity and space. A 2012 study by Flint, Benenson, and Alfasi [
5] documented “micro-segregation” within Jerusalem’s Sanhedria neighborhood, showing how sectarian distinctions shape localized residential patterns, even among economically similar groups. In a follow-up published by the same authors in 2013 [
6], they compared Ramat Shlomo, a state-planned Haredi neighborhood from the 1990s, to Sanhedria, which developed informally since the 1960s. This comparison illustrated how top-down versus bottom-up processes influence segregation. Both studies relied on labor-intensive surveys of sending surveyors to each and every household in the neighborhood. More recently, Keren-Kratz [
7] analyzed Knesset election data to provide broader, multi-year insights, documenting the Haredi community’s shift from integration to enclave formation since the 1970s, driven by socio-political changes like the rise of the “society of learners.”
This study builds on such work by using large-scale voting data to quantify residential segregation among Haredi communities. Voting patterns for two Haredi political parties—Shas (predominantly Sephardic) and United Torah Judaism (UTJ, primarily Ashkenazi)—serve as proxies for geographic distribution. Shas and UTJ represent distinct Haredi sub-groups, with Shas appealing to Sephardic voters through an integrative ideology addressing socio-economic and cultural grievances [
8]. This analysis not only measures voluntary segregation but also provides insights into the socio-political drivers of these patterns.
Findings reveal significant voluntary segregation within Haredi neighborhoods across Israel. This raises questions about the factors influencing such segregation, its implications for social cohesion, and its relevance to understanding ethnic dynamics in diverse societies. By leveraging political behavior as a demographic tool, this research offers a novel methodological framework that complements traditional Geographic Information System (GIS) approaches. Importantly, this method remains effective even in the absence of detailed GIS data, demonstrating its applicability in contexts where such information is unavailable.
Additionally, this study deepens our understanding of the intersection of ethnicity, religion, and political behavior in shaping community structures. By exploring intra-group ethnic segregation, it contributes to broader discussions on social inequality, community formation, and multicultural dynamics, offering insights relevant to policymakers and researchers addressing segregation in various global settings.
Ultimately, this study uncovers findings that I could not fully explain, and I hope this publication will inspire further analysis and collaboration to address these open questions and expand our collective understanding.
Methods
I analyzed voting data from Israeli Knesset elections to quantify residential segregation between Ashkenazi and Sephardic Haredi communities. I obtained data for recent elections (2015–2024) from the official website of the Central Elections Committee [
9]. Dr. Keren-Kratz generously provided earlier election data, which was unavailable in an analyzable format, after extracting it for his study [
7]. Additional demographic information was sourced from Israel Democracy Institute (IDI) [
10]. This dataset includes voting patterns from cities and areas with a prominent Haredi presence, focusing on the two main Haredi political parties: Shas and United Torah Judaism (UTJ).
Each Israeli citizen is assigned to a specific polling station based on their registered residential address. Polling stations can contain one or more ballot boxes, with each ballot box typically representing between 536 and 650 registered voters (25th and 75th percentiles, based on data from the most recent elections). This makes a single ballot box a proxy for relatively small residential areas. I identified ballot boxes where at least 75% of the votes were cast for Shas and UTJ combined, classifying these as homogeneous Haredi boxes. In cities with large non-Haredi populations, only the homogeneous Haredi boxes were analyzed to focus on clusters of the Haredi population. The analysis was limited to cities and towns with at least five such homogeneous Haredi boxes.
While UTJ voters are mostly Haredim, the majority of Shas voters across the entire Israeli population do not belong to the Haredi sector; it is estimated that only one-third of Shas voters are Haredi [
7]. However, due to the focus on homogeneous Haredi ballot boxes, I can safely assume that all the votes for UTJ and Shas in these boxes come from Haredi voters. No further preprocessing, such as anomaly detection or removal, was performed.
Measuring Segregation Patterns
If no internal segregation exists, the Shas/UTJ vote ratio within a city or area would remain approximately the same across all ballot boxes. To quantify deviations from this expectation, I calculated the Index of Dissimilarity for each city or area to measure the degree of segregation between the two groups. The Index of Dissimilarity (D) is defined as:
where:
Ai: Number of votes for Shas in the i-th box,
A: Total number of votes for Shas in the city,
Bi: Number of votes for UTJ in the i-th box,
B: Total number of votes for UTJ in the city.
The index ranges from 0 to 1, where 0 represents complete integration (even distribution), and 1 represents complete segregation (no overlap between groups). To provide a reference, I shuffled each city’s voting data 1,000 times and calculated the distribution of the dissimilarity index for these randomized datasets. I then ranked each haredi population cluster based on their dissimilarity scores to highlight relative segregation levels.
To examine factors contributing to segregation levels, I analyzed the correlation between the dissimilarity index and several variables, including the number of Haredi voting boxes, Haredi voters, and Haredi legal voters, as well as the overall Haredi population. Additional variables included the total number of voting boxes, total voters, total legal voters, and the ratios of Haredi-to-total voting boxes and Haredi-to-total legal votes.
Since these variables are closely related, regression analysis was deemed infeasible due to high collinearity. Instead, I performed Spearman correlation analysis to assess relationships between key variables and segregation levels. Spearman was chosen over Pearson correlation to avoid reliance on assumptions such as normality and linearity. To control for multiple comparisons, I applied the Benjamini-Yekutieli [
11] correction to the regression p-values.
The analysis was conducted using Python and associated libraries, including pandas and the multitest package by Josef Perktold, which is part of
statsmodels [
12] .
While the dissimilarity index provides a useful and widely accepted measure of segregation, it is important to acknowledge its inherent limitations to contextualize the findings. The index focuses on proportional representation and does not account for spatial separation or physical distances between groups. Incorporating Geographic Information System (GIS) data, such as residential coordinates or detailed neighborhood boundaries, would enable more nuanced spatial analysis and enhance the robustness of segregation studies [
13]. The geographical boundaries of citizens assigned to each ballot box are not publicly available in Israel. As a result, accurately measuring micro-segregation at the neighborhood level requires reliance on human surveyors [
5,
6]. However, using homogeneous Haredi ballot boxes serves as a reliable proxy for identifying segregation patterns, allowing for meaningful analysis on a country-wide scale.
Results and Discussion
Overview of Data
The collected dataset is summarized in
Table 1. It includes voting patterns from multiple Haredi-majority areas, providing insights into ethnic segregation between Ashkenazi and Sephardic Haredim.
Table 2 presents key metrics, including city name, number of voters, dissimilarity index values, and predominant party support in the latest, 25th Knesset elections. The total number of registered voters in Haredi-homogeneous ballot boxes was 1,226,667, of whom 789,393 cast legal votes. This is higher than the total Haredi population reported in these areas by the Israel Democracy Institute (936,602) [
10]. This discrepancy may arise from several factors, including IDI survey limitations, mixed populations in some neighborhoods, and the fact that non-Haredi individuals may vote for UTJ or Shas, particularly the latter [
7,
8].
Segregation Analysis
The analysis reveals significant levels of ethnic segregation within Israel’s Haredi communities, as quantified by the dissimilarity index over the entire study period.
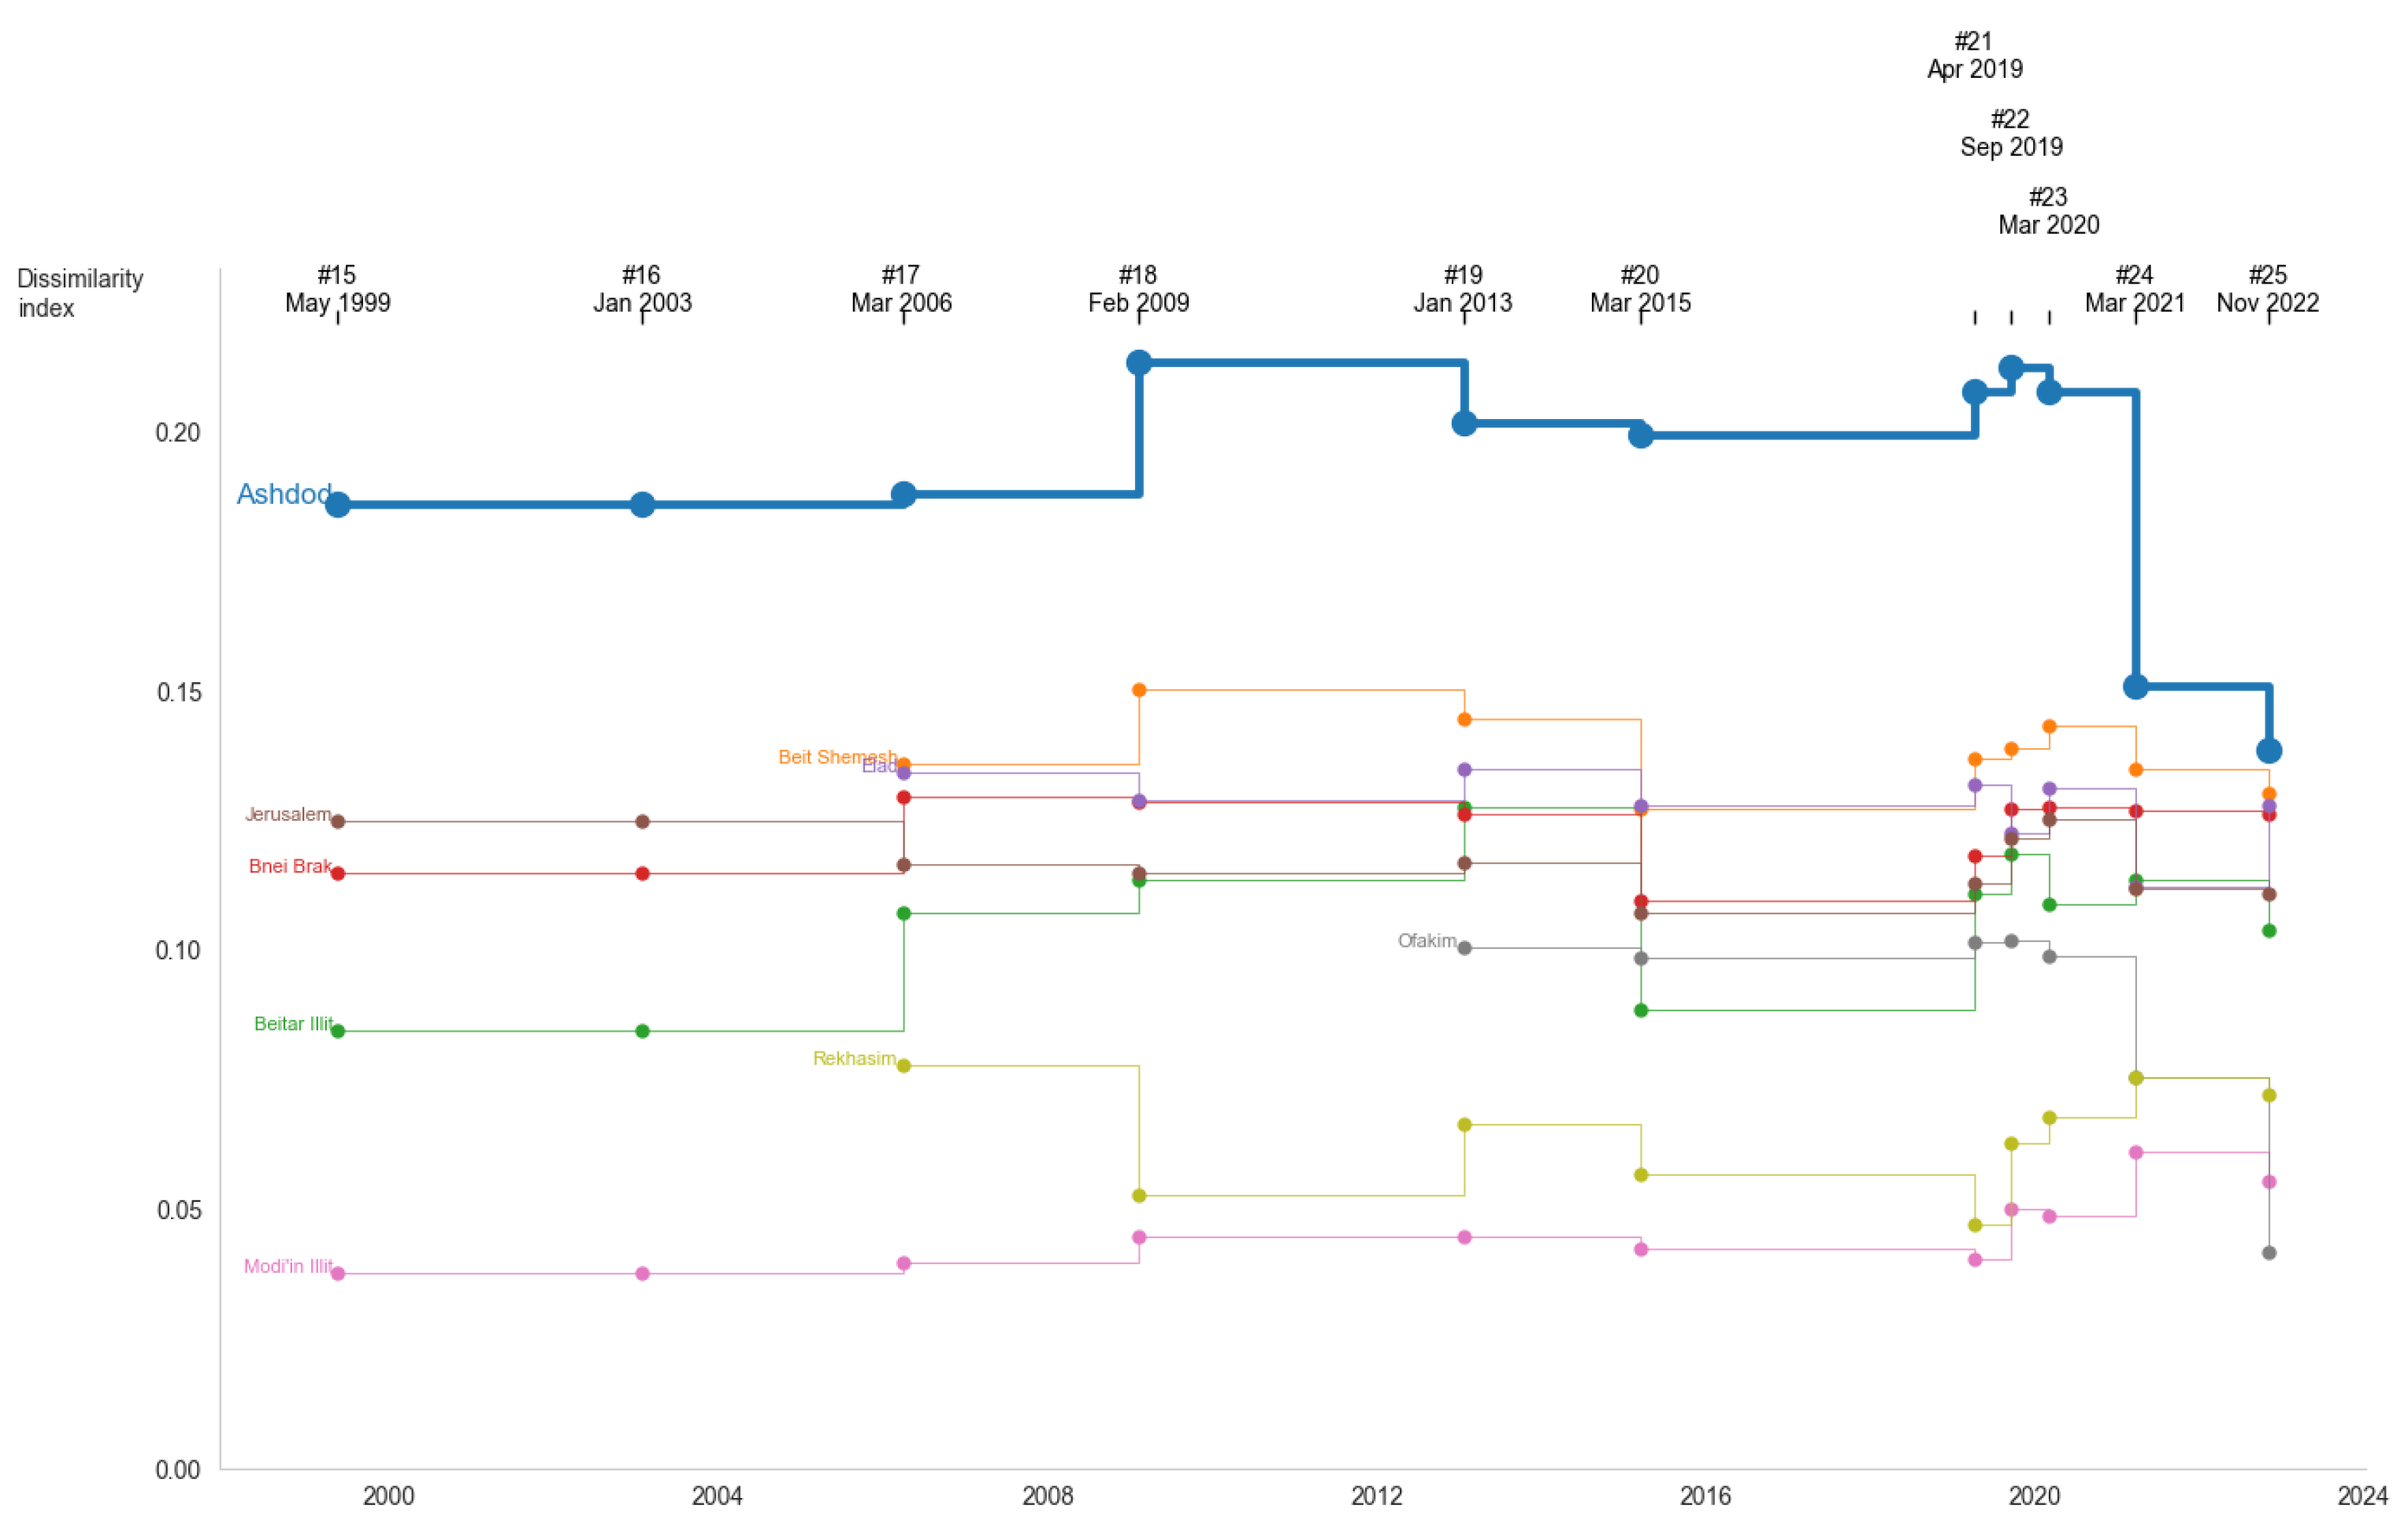
Figure 1.
Trends in ethnic segregation within Israel’s Haredi communities, as measured by the dissimilarity index, across multiple cities during Knesset election years (1999–2022). The line for Ashdod is thicker to emphasize the significant changes in segregation levels, raising an open question discussed in the paper regarding the unique dynamics in Ashdod.
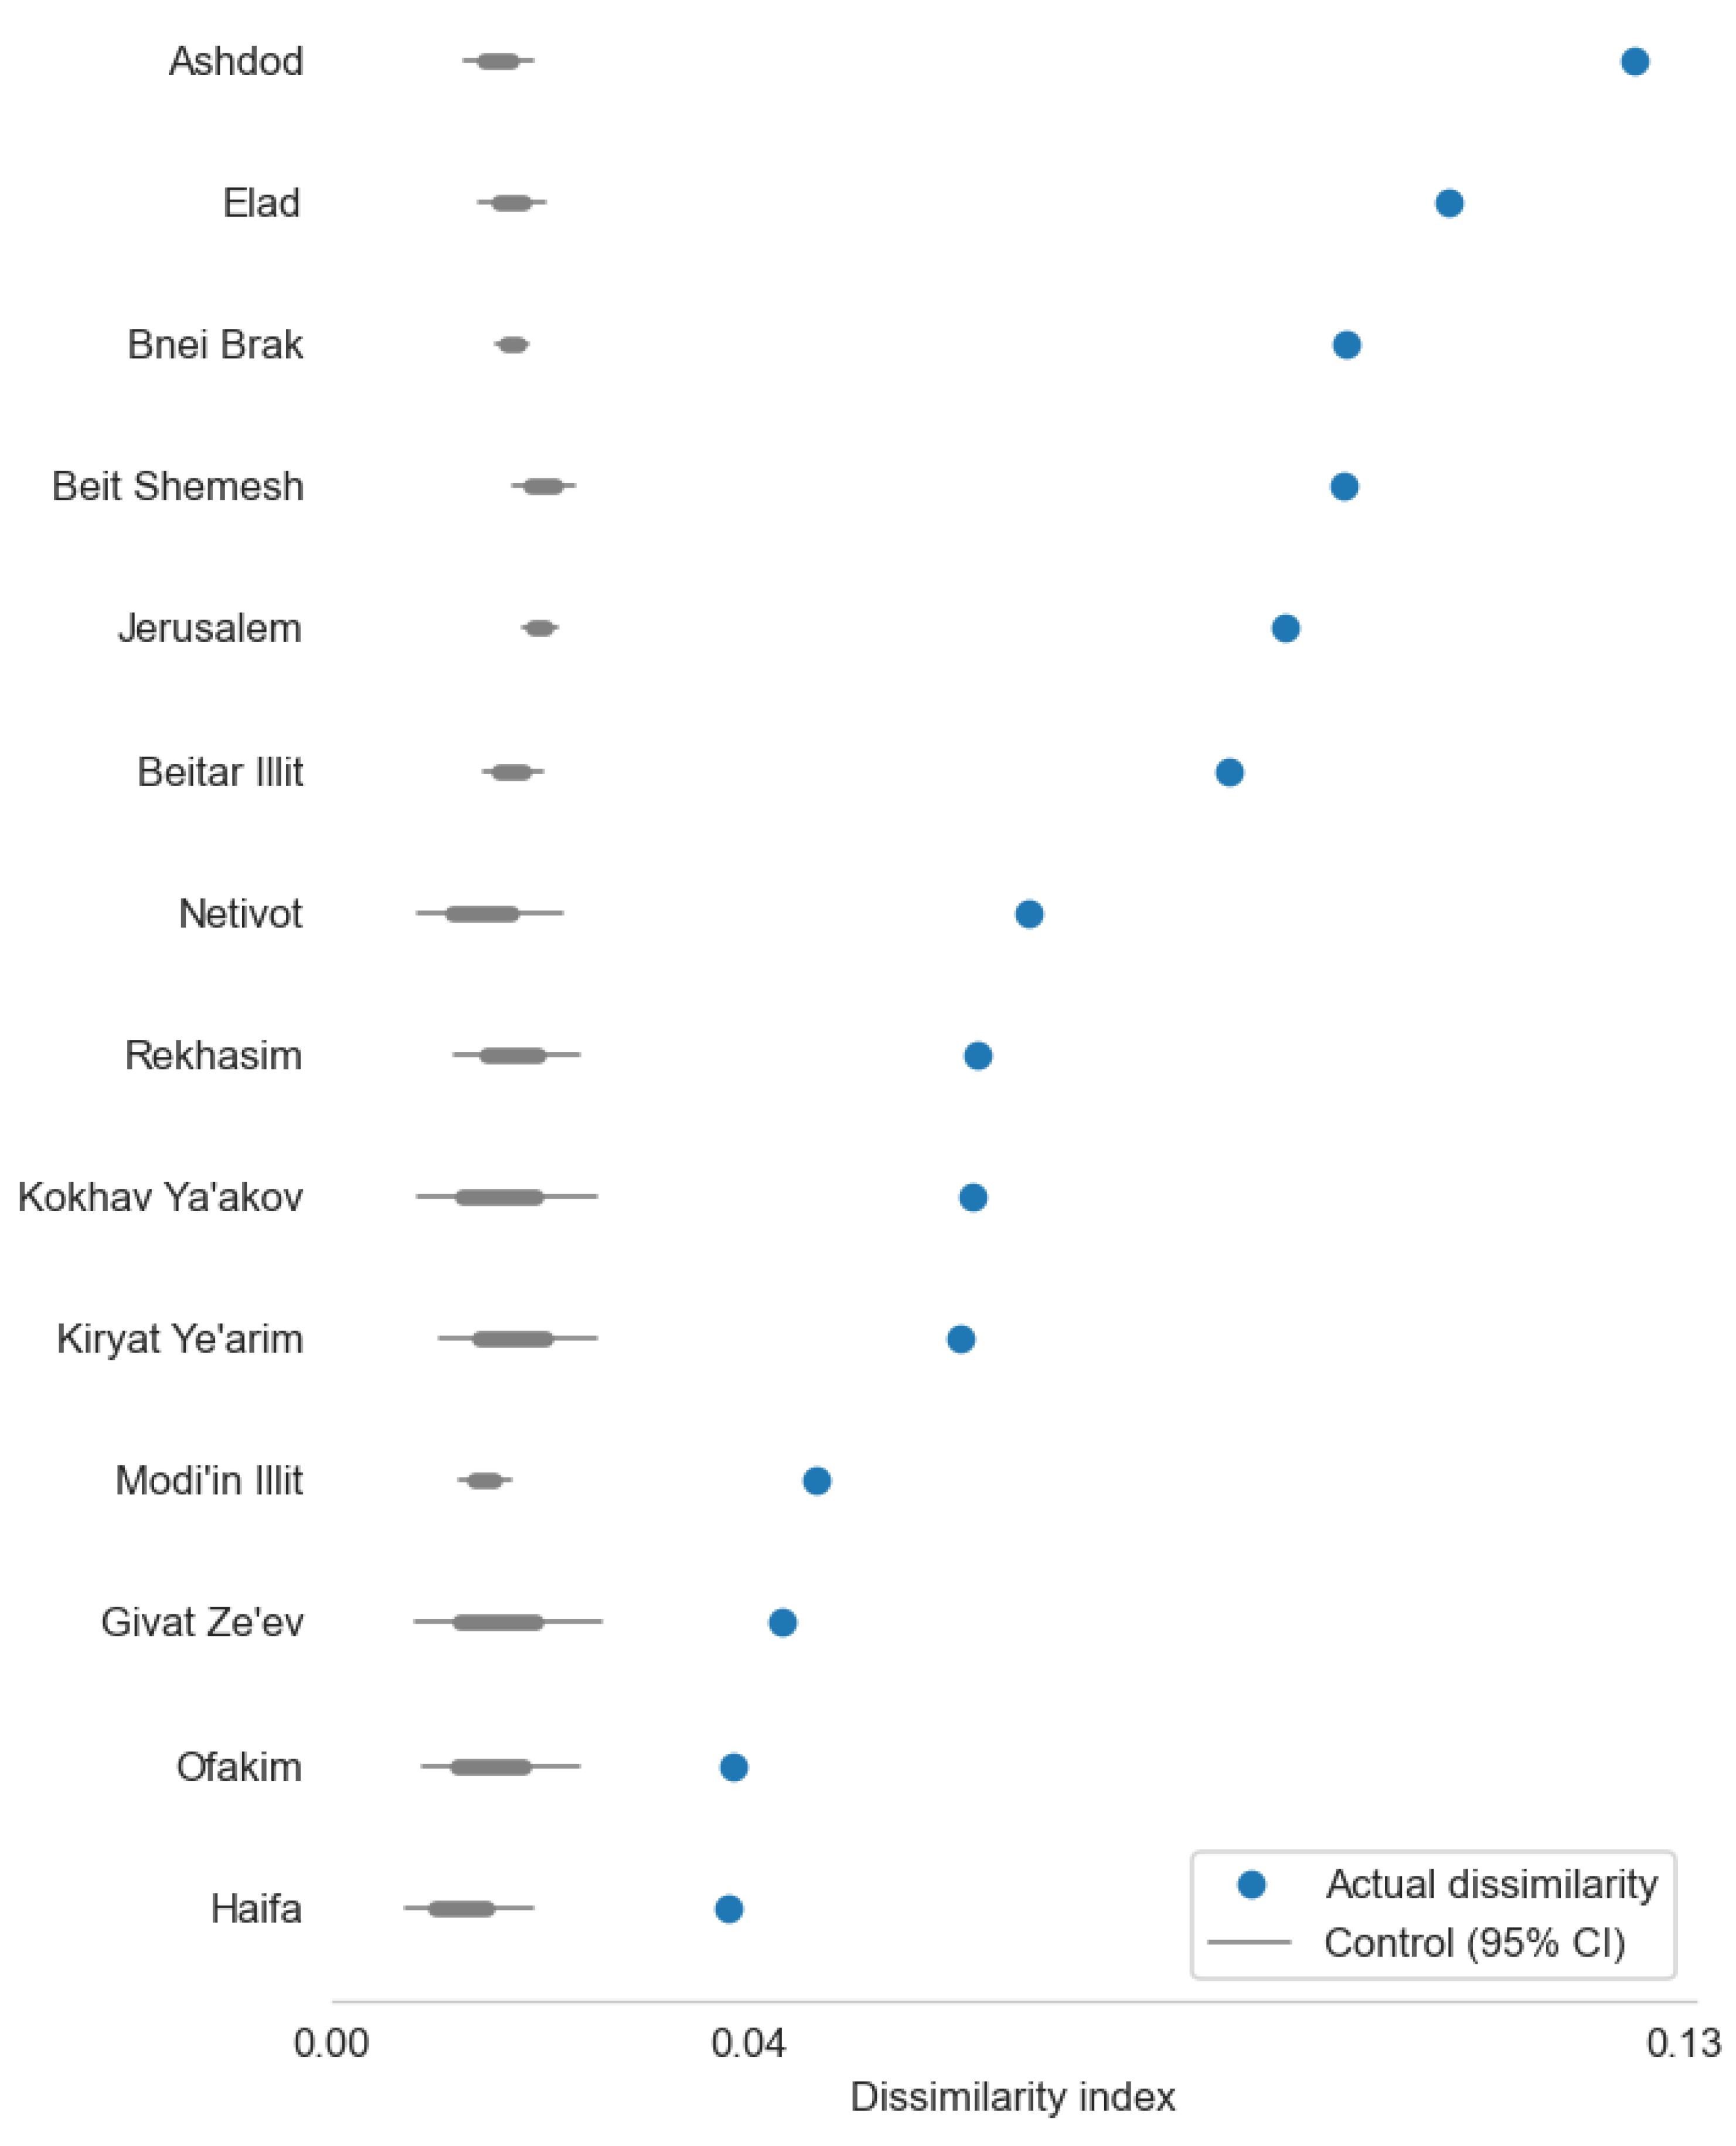
Looking at the latest data from 2022, cities such as Ashdod, Elad, and Bnei Brak exhibit the highest segregation levels, with dissimilarity scores of 0.125, 0.107, and 0.097, respectively. These values are substantially higher than the 95% confidence intervals of randomized shuffled data, demonstrating that the observed patterns are not random but reflect meaningful geographic and social separation (
Figure 2).
In comparison, a 2022 analysis of Black-White segregation in U.S. metro/micro areas [
14] eports a median dissimilarity index of 0.462, with values ranging from 0.211 to as high as 0.835 in the most segregated areas. This highlights the much higher levels of segregation observed in racial contexts within the United States. While Black-White segregation in the U.S. is often attributed to structural inequalities and systemic discrimination, segregation in Haredi communities appears to be driven more by cultural and religious differences. However, it is important to note that a direct comparison of these dissimilarity index values is not possible due to differences in methodology, including variations in geographic units, data sources, and the specific metrics used to assess segregation. These distinctions underscore the need to interpret the findings within their respective social and analytical contexts.
In 2012, Flint et al. [
5] quantified the separation in a single Haredi neighborhood of Sanhedria over the years. They used Moran’s I index over time. Direct comparison is not possible, as this index measures spatial autocorrelation, indicating the degree to which similar values cluster spatially, whereas the dissimilarity index assesses the evenness of distribution between two groups across a geographic area. Therefore, each index provides different insights into segregation patterns.
Correlation Analysis
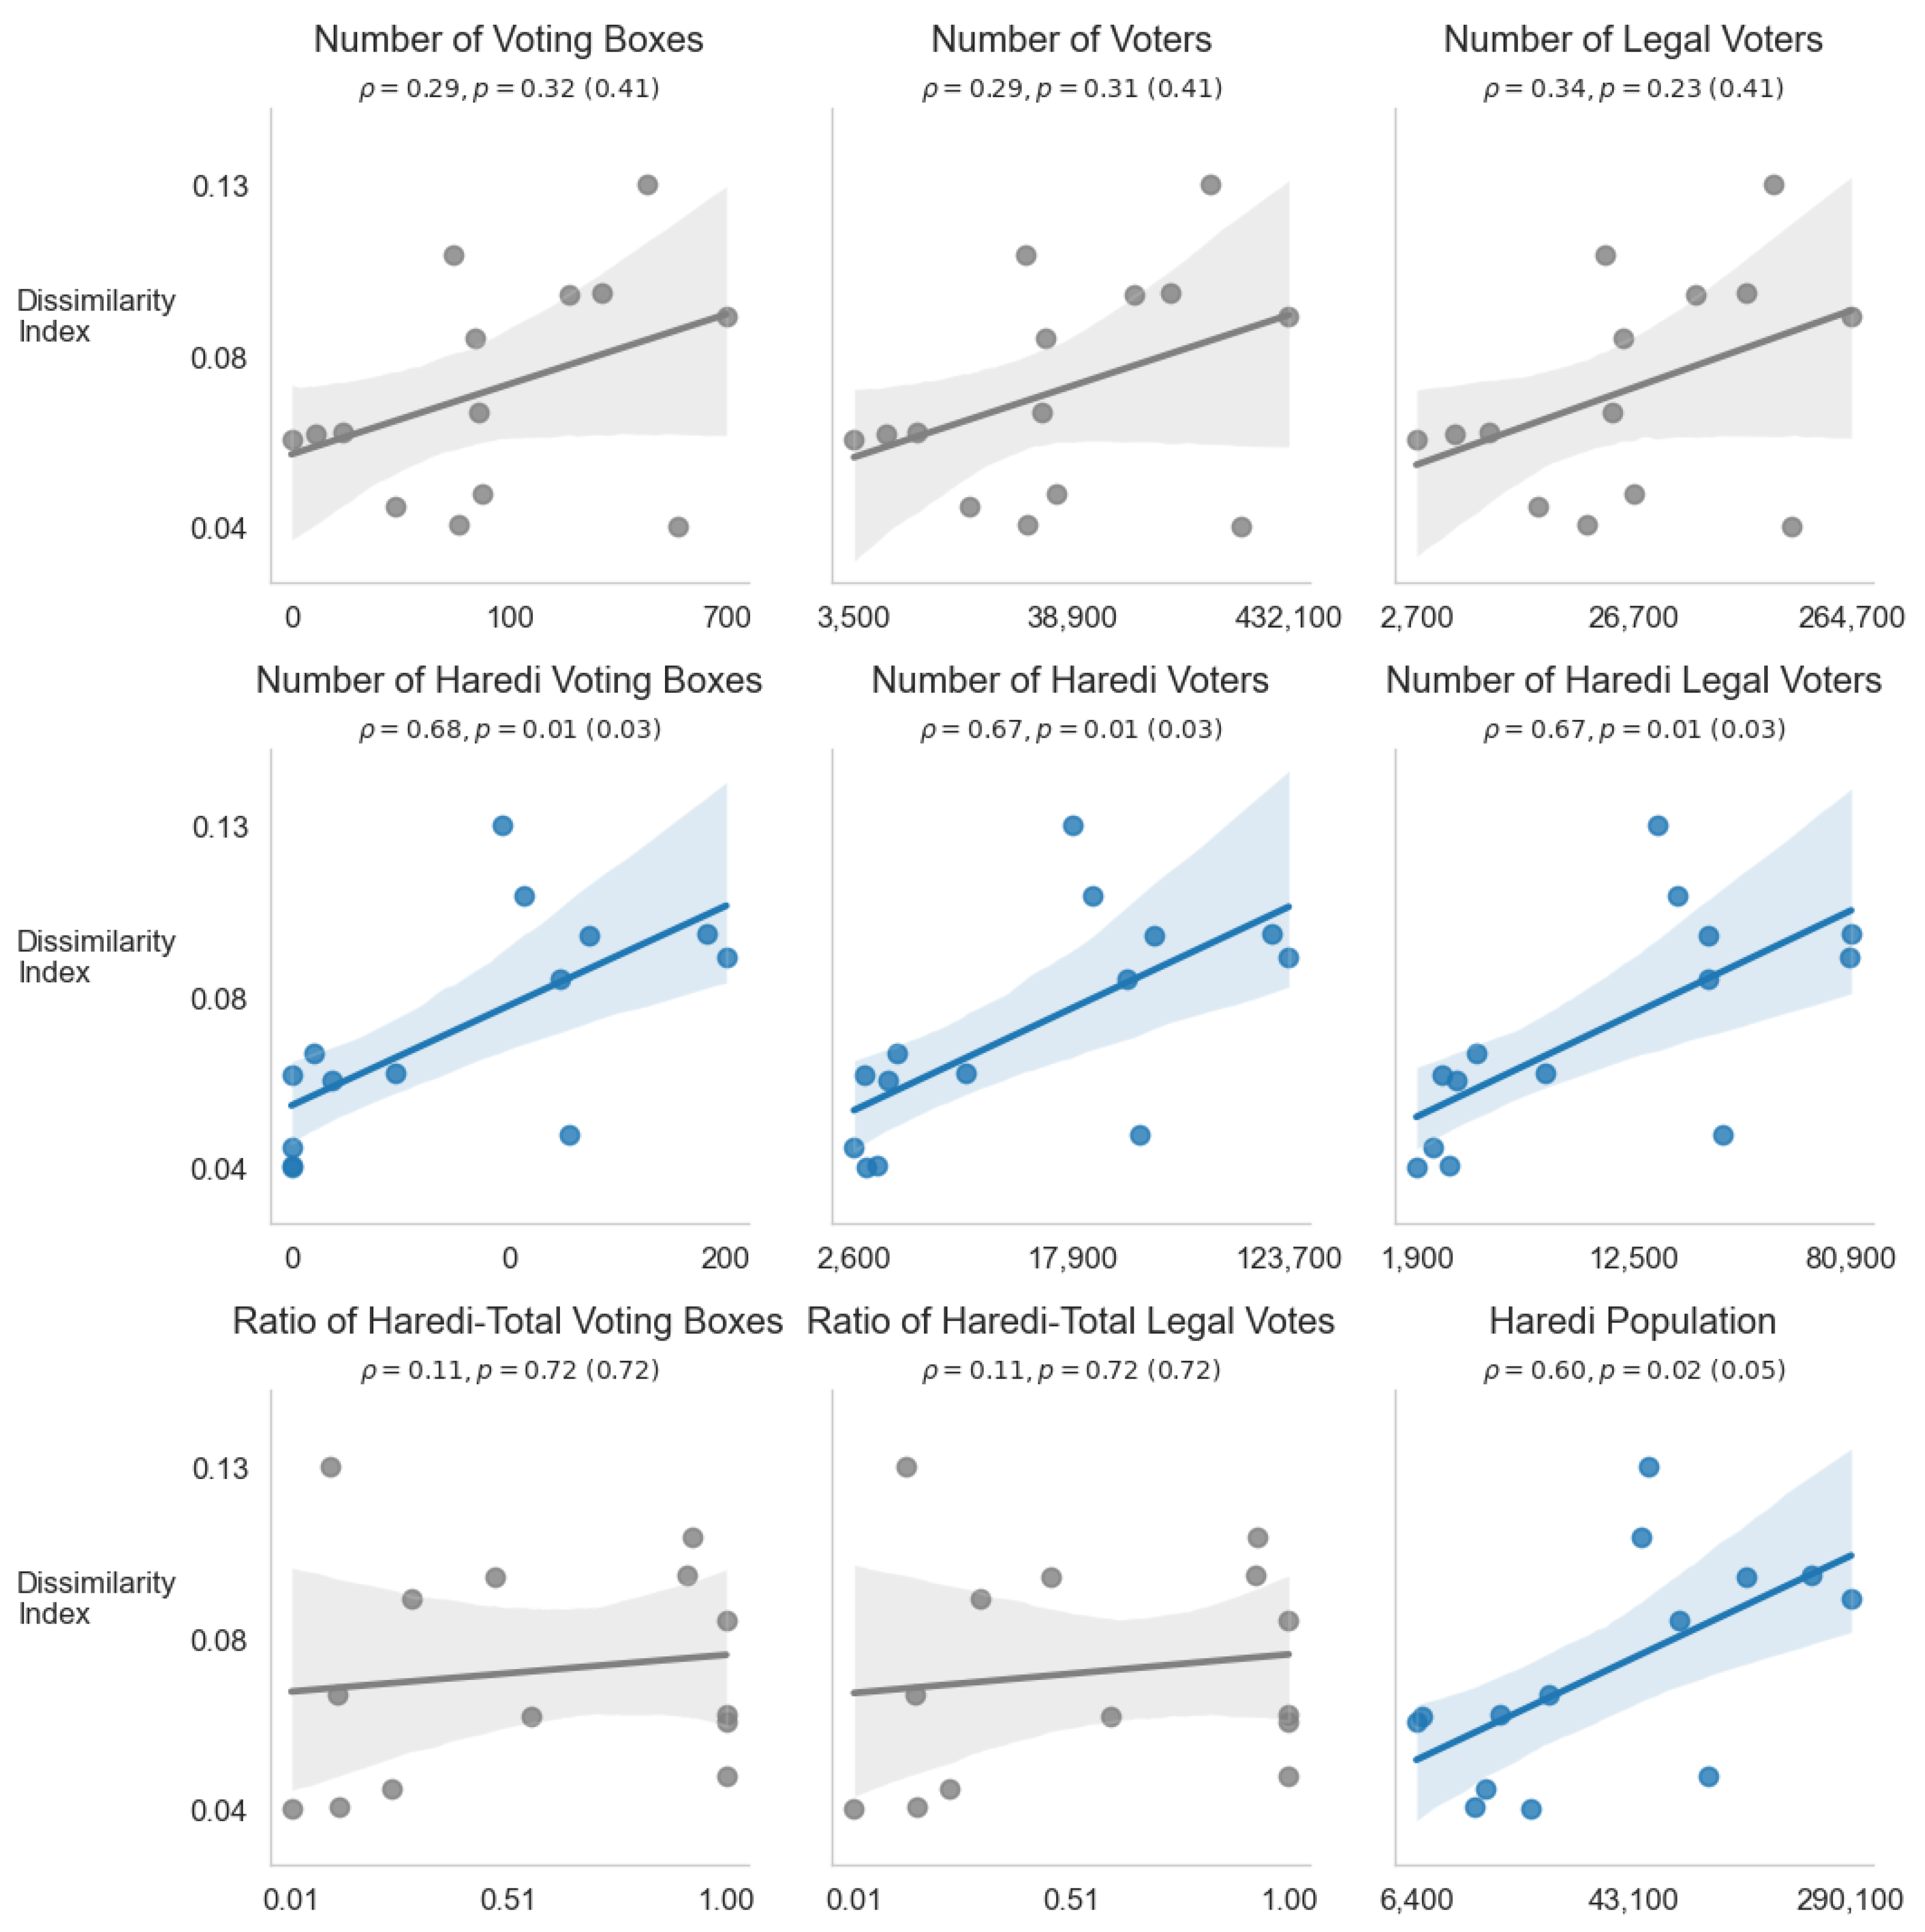
The Spearman correlation analysis identified a significant positive relationship between segregation levels measured in 2022 and variables such as the number of Haredi voting boxes (
) and the total number of Haredi voters (
). These findings suggest that segregation becomes more pronounced in areas with larger Haredi populations, potentially due to the capacity to establish separate religious, cultural, and communal hubs for Ashkenazi and Sephardic communities (
Figure 3).
The Curious Case of Ashdod
Of all the cities in this study, Ashdod stands out as the most noteworthy one. Ashdod is a large Israeli city on the coast of the Mediterranean Sea. The consistent increase in the Haredi population began in the early 1990s, alongside cities such as Beit Shemesh, Modi’in Ilit [
7]. Today, over one-fifth of the city’s population identifies as Haredi (see
Table 2). The thicker line in
Figure 1 shows the dynamics of the dissimilarity index in Ashdod, indicating a notably higher level of segregation over most of the study period, with a sharp drop in the index around the March 2021 elections. While its dissimilarityse index remains the highest among all the Haredi population clusters, it has converged closer to the values observed in the rest of the country.
This pattern contrasts with all other Haredi clusters, both old (such as Jerusalem and Bnei Brak) and new, where longstanding Haredi populations exhibit relatively stable dissimilarity indices. In Ashdod, however, the dynamics are still evolving, making it a significant case study for understanding how demographic shifts and cultural factors shape urban segregation in mixed-population cities.
Despite extensive efforts, no information could be found to explain the sharp drop in Ashdod’s dissimilarity index in 2021. This unexplained change underscores the need for further investigation into the social, political, or cultural factors that may have contributed to these dynamics.
Discussion
These results highlight the deep cultural and organizational divides within Israel’s Haredi society. Although both Ashkenazi and Sephardic Haredim share religious beliefs, their differences in liturgy, customs, and community structures often result in physical separation. This divide reflects broader dynamics of ethnic and value-based segregation[
15].
Our findings also align with theories of homophily and xenophobia, which may simultaneously drive segregation. Homophily reflects in-group preferences for shared culture and customs, while xenophobia stems from out-group avoidance. While our data does not distinguish between these mechanisms, their combined influence likely reinforces segregation. Future studies should explore their relative contributions, potentially through survey data or experimental approaches.
Urban venues such as synagogues, schools, and community centers specific to each ethnic group may further entrench segregation, as they act as cultural anchors shaping residential patterns [
16]. The persistence of these institutions underscores the role of physical and social infrastructure in maintaining ethnic divides.
The comparison between segregation in Haredi communities and Black-White segregation in the U.S. provides valuable context. While segregation in the U.S. is driven by structural inequalities, segregation in Haredi communities stems from cultural and religious differences. This highlights the unique drivers and implications of intra-group segregation.
Larger Haredi populations correlate with greater segregation due to the formation of distinct cultural hubs. These hubs reinforce separation through separate schools, synagogues, and community networks. This mechanism should be explored further to understand how it shapes residential patterns.
Ashdod emerges as a unique case study with dynamic segregation trends. The sharp decline in its dissimilarity index in 2021 raises important questions about demographic shifts or socio-political factors influencing this pattern. Investigating Ashdod could provide insights into the evolving nature of segregation.
Methodological limitations, such as the lack of GIS data and reliance on voting patterns as proxies for residential segregation, must be acknowledged. Incorporating spatial data in future research could improve the precision and depth of segregation analyses.
Finally, integrating quantitative approaches like agent-based modeling [
1] could provide deeper insights into the long-term evolution of segregation in Haredi communities. Such methods would complement this study’s findings by simulating how individual preferences and institutional factors interact to shape residential patterns over time.
Conclusions
This study highlights the extent of ethnic segregation within Israel’s Haredi communities, demonstrating that even within a seemingly homogenous religious group, significant intra-community divisions persist. Using voting data as a proxy for residential segregation, I offer a novel approach that complements traditional Geographic Information System (GIS) methods. This approach not only corroborates known segregation patterns but also sheds light on the sociopolitical factors driving these divisions. Future research could benefit from the inclusion of GIS data, if made available by governmental institutions in a responsible and anonymous manner, to enhance the depth and precision of such analyses.
The temporal trends observed in dissimilarity indices, such as Ashdod’s fluctuations, underscore the dynamic nature of segregation. These changes suggest evolving socio-political and demographic factors that warrant further investigation.
The distinct patterns of support for Shas and UTJ across different localities underline the enduring influence of ethnic identity in shaping community structures. These findings align with Schelling’s classic segregation model, which illustrates how even slight preferences for similarity can produce significant segregation at the macro level. This study extends these theoretical insights into the domain of intra-religious ethnic segregation, revealing that such divisions endure even within communities united by shared religious values, practices, and political goals.
By empirically demonstrating intra-community ethnic segregation and linking these patterns to broader theoretical frameworks, this study advances our understanding of the interplay between ethnicity, religion, and urban dynamics. It provides a foundation for future investigations into the mechanisms that sustain segregation and their implications for urban planning, community cohesion, and social integration.
Funding
This research received no external funding
Data Availability Statement
Conflicts of Interest
The authors declares no conflicts of interest.
References
- Bakens, J.; Pryce, G. Homophily Horizons and Ethnic Mover Flows among Homeowners in Scotland. Hous Stud 2019, 34, 925–945. [CrossRef]
- Zuccotti, C. V.; Lorenz, J.; Paolillo, R.; Rodríguez Sánchez, A.; Serka, S. Exploring the Dynamics of Neighbourhood Ethnic Segregation with Agent-Based Modelling: An Empirical Application to Bradford, UK. J Ethn Migr Stud 2023, 49, 554–575. [CrossRef]
- Petrescu-Prahova, M. Beyond Schelling: The Role of Attitudes toward In-Group and Out-Group Members in Ethnic Residential Settlement and Segregation 1; 2009.
- Friedman, M. The Haredi (Ultra-Orthodox) Society: Sources, Trends and Processes; The Jerusalem Institute for Israel Studies: Jerusalem, 1991.
- Flint, S.; Benenson, I.; Alfasi, N. Between Friends and Strangers: Micro-Segregation in a Haredi Neighborhood in Jerusalem. City Community 2012, 11, 171–197. [CrossRef]
- Alfasi, N.; Flint Ashery, S.; Benenson, I. Between the Individual and the Community: Residential Patterns of the Haredi Population in Jerusalem. Int J Urban Reg Res 2013, 37, 2152–2176. [CrossRef]
- Keren-Kartz, M. The Convergence of Israel’s Haredi Society into Geographical Enclaves: A Historical Overview. [Hebrew]. Horizons in Geography / אופקים בגאוגרפיה 2024.
- Peled, Y. Towards a Redefinition of Jewish Nationalism in Israel? The Enigma of Shas. Ethn Racial Stud 1998, 21, 703–727. [CrossRef]
- 9. Israel’s Central Election Committee.
- 2023; 10. Israel Democracy Institute Statistical Report on Ultra-Orthodox Society in Israel 2023; 2023.
- Emmert-Streib, F.; Moutari, S.; Dehmer, M. Multiple Testing Corrections. Elements of Data Science, Machine Learning, and Artificial Intelligence Using R 2023, 421–454. [CrossRef]
- Seabold, S.; Perktold, J. Statsmodels: Econometric and Statistical Modeling with Python. 2010.
- Wong, D.W. From Aspatial to Spatial, from Global to Local and Individual: Are We on the Right Track to Spatialize Segregation Measures? Recapturing Space: New Middle-Range Theory in Spatial Demography 2016, 77–98. [CrossRef]
- Pendergrass, R.W. The Relationship between Urban Diversity and Residential Segregation. Urban Science 2022, 6, 66. [CrossRef]
- Paolillo, R.; Lorenz, J. How Different Homophily Preferences Mitigate and Spur Ethnic and Value Segregation: Schelling’s Model Extended. 2018. [CrossRef]
- Rae, J.R.; Skinner-Dorkenoo, A.L.; Reiman, A.K.; Schmid, K.; Hewstone, M. Mixed Evidence for Interactive Effects of Outgroup Proportions and Intergroup Contact on Racial Bias in the United States. Soc Psychol Personal Sci 2022, 13, 476–489. [CrossRef]
|
Disclaimer/Publisher’s Note: The statements, opinions and data contained in all publications are solely those of the individual author(s) and contributor(s) and not of MDPI and/or the editor(s). MDPI and/or the editor(s) disclaim responsibility for any injury to people or property resulting from any ideas, methods, instructions or products referred to in the content. |
© 2025 by the authors. Licensee MDPI, Basel, Switzerland. This article is an open access article distributed under the terms and conditions of the Creative Commons Attribution (CC BY) license (http://creativecommons.org/licenses/by/4.0/).