
Submitted:
13 May 2025
Posted:
14 May 2025
You are already at the latest version
Abstract
Residential segregation remains a persistent challenge in European urban environments and is an increasingly focal point in urban policy debates. This issue is often intensified by immigration and social inequalities, contributing to the increase in ethnic and socioeconomic segregation. This study investigates the changing geographies of ethnic diversity and residential segregation in Riga, a post-socialist city with a historically diverse population and a recent increase in immigration. Using individual-level geo-referenced census data from 2000, 2011, and 2021, we examined changes in the spatial distribution of five major ethnic groups. Our analysis employs the Dissimilarity Index to measure ethnic residential segregation and Location Quotient to identify ethnic groups over- and under-represented across the city. The findings reveal that Riga's ethnic landscape is undergoing a gradual yet impactful transformation. The spatial distribution of ethnic groups is shifting, with the increasing segregation of certain groups, particularly traditional ethnic minorities, coupled with a growing concentration of Europeans and non-Europeans in the inner city. These findings align with the broader trends observed in European cities, where migration and globalization drive both ethnic diversification and segregation. However, the specific dynamics in Riga, particularly the persistence of traditional ethnic minority communities and the emergence of new ethnic groups, highlight the unique context of post-socialist urban landscapes.
Keywords:
ethnic groups
; diversity
; residential segregation
; population change
; census
1. Introduction
Contemporary global migration is substantially reshaping urban landscapes, as migrants predominantly settle in urban centers [1], leading to significant transformations in the ethnic composition of cities worldwide. This increasing diversification has spurred considerable research on its implications, particularly focusing on the complex dynamics of ethnic residential segregation and associated spatial inequalities. Understanding these patterns is crucial, as neighborhood ethnic composition can influence social interactions, access to resources, and the overall integration trajectories of diverse population groups within a city.
Ethnic segregation studies examine inter-ethnic encounters across numerous domains [2], with ethnic residential segregation being one of the key research areas. Changes in the ethnic makeup of neighborhoods can drive spatial transformations [3] and affect the residential choices and socioeconomic outcomes of individuals, both native- and foreign-born populations. However, the factors shaping migrant residential patterns are multifaceted and debated. While socioeconomic status and self-perception play a role, the extent to which neighborhood ethnic composition, particularly the presence of co-ethnics, directly dictates residential decisions varies significantly across contexts [4,5]. Some studies suggest that immigrants often prefer proximity to co-ethnics, yet may also favor living near native residents over other foreign groups [6]. Furthermore, factors like mixed-ethnicity households [7] and the complex pathways of long-term residents [8] add layers of complexity, indicating that spatial assimilation is not always a straightforward outcome. This ambiguity highlights the need for context-specific research on the drivers and consequences of migrant settlement patterns.
Across Europe, urban neighborhoods are becoming increasingly ethnically diverse [9,10,11], driving significant demographic, social, and economic shifts; for instance, diverse neighborhoods often exhibit younger population profiles among both foreign- and native-born residents [12,13], which can serve as a benefit in the context of aging European populations. Furthermore, while shifts in ethnic composition can present segregation risks, it is crucial to distinguish ethnic diversity from ethnic segregation [12]. These phenomena are not necessarily concurrent; rising multi-ethnicity can coexist with stable patterns of residential intermixing among minority groups [12,13]. Therefore, scholarly attention must extend beyond measuring ethnic segregation to examining the degree of residential intermixing within diverse urban areas.
While studies on ethnic diversity and segregation are numerous in Western European nations, often linked to post-colonial migration histories, research remains comparatively scarce in post-socialist countries. In these contexts, ethnic diversity frequently stems from different historical processes, including legacies of colonialism and periods where specific ethnic minorities were not necessarily socioeconomically disadvantaged relative to the majority [14], creating distinct contemporary dynamics. Furthermore, historical and place-specific factors, such as state-controlled housing allocation during the socialist era and privatization policies afterwards, continue to shape patterns of ethnic residential distribution in complex interactions with individual choices and structural factors [15,16].
Latvia's experience exemplifies these complexities. Its history, particularly during Soviet occupation, involved large-scale migration dynamics that significantly altered demographic makeup and strained ethnic relations. Upon regaining independence in 1991, Latvia emerged as a multi-ethnic nation with the highest proportion of ethnic minorities among the Baltic States, nearing half the population at the time [17,18,19]. Although large-scale immigration associated with the Soviet era ceased decades ago, its legacy persists in the country's ethnic composition, which remains unevenly distributed, with the majority of Latvia’s ethnic minority population residing in major cities, most notably the capital, Riga.
Simultaneously, the geography of contemporary immigration to Latvia has shifted considerably over the past decade, influenced by factors such as EU accession, geopolitical changes, and globalization. While historical research often focused on established "traditional" ethnic minority communities (primarily Russian-speakers), recent migration patterns are introducing new groups from diverse origins, including significant increases from non-European countries like India, Uzbekistan, Vietnam, and China [20]. Crucially, these new migrants are predominantly drawn to urban areas, particularly Riga. Given the tendency observed elsewhere in Europe for non-European-origin migrants to exhibit greater spatial separation than their European counterparts [4], investigating the specific residential patterns of the newly arriving non-European population alongside other major ethnic groups within the Riga context is particularly important. These intricate dynamics, driven by both enduring settlement patterns and contemporary migration, highlight the critical need for research to clarify how diverse ethnic groups are reconfiguring Riga's residential landscape in terms of ethnic concentration and intermixing within the distinctive post-socialist setting.
Therefore, this study aims to explore the residential geographies of ethnic diversity in Riga, utilizing individual-level geo-referenced population census data from 2000, 2011, and 2021. We seek to address the following research questions:
- How did the levels of ethnic residential segregation between major ethnic groups in Riga change between 2000 and 2021?
- How did the patterns of spatial over- and under-representation of major ethnic groups across Riga change between 2000 and 2021 at the chosen spatial scale?
A longitudinal analysis spanning these two decades provides insights into both longer-term shifts and more recent developments in ethnic residential patterns, including the geography of emerging groups. This study contributes to a deeper understanding of the dynamics shaping ethnic landscapes in post-socialist cities, offering findings relevant to urban planning and policy discussions concerning social cohesion and spatial inequalities in diverse urban environments.
This paper is structured as follows: Section 2 provides an essential background on Riga's historical context and the contemporary ethnic and sociodemographic landscape. Section 3 details the data sources and methodologies employed, including the Dissimilarity Index and Location Quotient. Section 4 presents the core findings on population changes, segregation trends, and the geographical distribution of ethnic groups. Finally, Section 5 discusses the implications of these findings within the broader literature and the specific context of Riga, highlighting the interplay between historical legacies and contemporary migration in shaping the city's ethnic geography.
2. Riga’s Ethnic and Sociodemographic Landscape
Riga, the capital of Latvia and the largest city in the Baltic States, possesses a demographic structure that is profoundly shaped by its historical trajectory. Its legacy as a Hanseatic League trading center, followed by governance under various external powers—including the Polish-Lithuanian Commonwealth, Sweden, the Russian Empire, Nazi Germany, and the Soviet Union—has cumulatively forged its contemporary ethnic composition. Soviet occupation, in particular, precipitated substantial demographic transformations through state-forced, large-scale migration policies. These policies significantly altered the city's ethnic balance, creating a complex sociodemographic landscape that persisted following the restoration of Latvia's independence. Consequently, Riga emerged as a city characterized by a substantial ethnic minority population, which, until the early 21st century, exhibited relatively low levels of socioeconomic and ethnic residential segregation [21].
Presently, Riga's ethnic landscape continues to evolve amidst the context of broader demographic challenges affecting the city, namely population decline and ageing. In 2021, the city's population was recorded at 615,000 inhabitants, approximately 20% lower than in 2000, constituting 32% of Latvia's total population. Despite this decline, Riga retained a distinctly multicultural character. Ethnic minorities represent 53% of the population, and 17% of the residents are foreign-born, originating from over 140 different countries [20]. Alongside established minority communities, recent migration flows, especially those emerging over the past decade, are contributing to increased diversity and raising considerations regarding the potential exacerbation of socio-spatial disparities within the urban fabric [22].
To facilitate a focused analysis of ethnic diversity patterns in Riga, this study categorizes the population into five aggregate groups: Latvians, Russians, other traditional ethnic minorities, Europeans, and non-Europeans. Although Russians constitute a traditional ethnic minority, their significant demographic weight necessitates their classification as a separate group. This approach permits a clearer examination of the spatial dynamics within the remaining traditional minority populations, which include Belarusians, Ukrainians, Poles, Lithuanians, Estonians, Jews, Roma, Armenians, Tatars, and Moldovans. An examination of key sociodemographic indicators revealed significant variations across these principal ethnic categories (see Table 1). Pronounced age structure differences are apparent: traditional minority groups, including Russians, present notably older mean ages than the younger non-European population segment. Latvians and Europeans had an intermediate mean age range. Furthermore, distinct gender compositions were observed. While Latvians, Russians, and other traditional ethnic minorities exhibit a higher proportion of females, European and, more markedly, non-European groups demonstrate substantially lower female representation.
Socioeconomic stratification was also evident when examining educational attainment and occupational status metrics. Europeans demonstrate a comparative advantage, showing the highest share of both university-educated individuals and those in high-status employment. Latvians also exhibit a relatively high representation in these domains. Conversely, traditional ethnic minorities tend to have a lower representation in higher education and, particularly, in high-status occupations relative to Latvians and Europeans. The non-European group presents a more complex profile: while possessing a high proportion of university graduates, their representation in high-status occupations is comparatively limited, aligning more closely with traditional minorities. Notably, this group constituted the largest proportion of those engaged in low-status occupations among all cohorts. Furthermore, the patterns of residential mobility diverge sharply. Non-European residents display exceptionally high mobility rates, more than double that of Europeans, and significantly exceeding the rates observed among Latvians, Russians, and other traditional ethnic minorities.
These pronounced sociodemographic variations across Riga's major ethnic groups imply potentially divergent integration pathways and varying degrees of socioeconomic mobility within the urban system. Understanding this intricate mosaic, shaped by historical legacies, ongoing demographic shifts, and significant inter-group differences in age, gender, socioeconomic standing, and residential stability, is fundamental. It provides an essential context for investigating the spatial dimensions of ethnic diversity and segregation explored in this study, recognizing that these population segments are not uniformly distributed but exhibit distinct geographical concentrations and patterns of intermixing across Riga's neighborhoods. The interplay between these sociodemographic characteristics and the evolving spatial organization of ethnic groups forms the foundation for subsequent analysis.
3. Materials and Methods
This study employed quantitative methodologies to analyze the residential geographies of major ethnic groups within Riga. The primary data source comprises census data for three distinct years: 2000, 2011, and 2021. These datasets provide comprehensive population coverage at a fine geographical resolution, including breakdowns by major ethnic groups. The Latvian census primarily determines ethnicity through self-reported affiliation utilizing predefined categories. Supplementary information, such as country of birth, country of previous residence, citizenship, and, in earlier censuses, language spoken, may also inform classification. While the system accommodates approximately 160 distinct ethnic identifications, it currently lacks categories for individuals of mixed ethnicities. Notably, the proportion of residents reporting categories of ''not selected'' or ''unknown'' for ethnicity increased over the study period.
To facilitate the detailed spatial analysis and visualization essential for urban analytics, this study utilizes a fine-grained hexagonal tessellation of the study area. A grid composed of 16-hectare hexagonal bins was generated, excluding bins with no resident population. Individual-level population data, geocoded by place of residence, were aggregated into these hexagonal bins. Each populated bin thus contains counts for the analyzed ethnic groups, enabling the calculation of spatial statistics. The demographic scale of these units has shifted over time; the median population within a 16-ha bin has decreased from 210 persons in 2000 to 193 persons in 2021. Concurrently, the peak density also decreased, with the maximum population in the most densely populated bin falling from approximately 6,700 to 4,600 residents over the same period.
The study area map (see Figure 1) also delineates Riga's broad urban structure, distinguishing between the inner-city zone, the Soviet-era housing estate zone, and the outer-city zone. These zones possess distinct historical development trajectories, built environment characteristics, demographic profiles, and migration histories. Consequently, it is hypothesized that the spatial distribution patterns of different ethnic groups vary significantly across these zones.
To investigate the ethnic geographies of Riga, two key quantitative measures were employed. The Location Quotient (LQ) was calculated for each 16-ha bin to assess the local concentrations of specific ethnic groups. Additionally, the Index of Dissimilarity (DI) was computed to measure the overall segregation between pairs of ethnic groups across all bins within the city. Data processing, calculation of segregation indices, and spatial visualization were performed using the Geo-Segregation Analyzer v.1.2 software [23] and ArcGIS Pro.
The Index of Dissimilarity (DI) was used to quantify the level of residential segregation between pairs of ethnic groups across 16-ha hexagonal bins. As a standard measure in segregation research, DI quantifies the degree of evenness in the distribution of two groups across spatial units. The index ranges from 0 to 1, where 0 signifies perfect integration (both groups are distributed identically across units) and 1 represents complete segregation (the two groups share no spatial units) [24]. The formula is:
where N is the total number of spatial units (hexagonal bins), xi is the population of ethnic group X in spatial unit i, yi is the population of ethnic group Y in spatial unit i, X is the total population of group X in the city, and Y is the total population of group Y in the city.
To visualize and quantify the relative concentration of specific ethnic groups at the local (16-ha bin) level, the Location Quotient (LQ) was calculated. The LQ compares the proportion of a specific ethnic group within a local unit to its proportion in the city as a whole. An LQ value of 1 indicates that the group's share in the bin is identical to its city-wide share. Values greater than 1 signify over-representation (concentration) of the group in the bin relative to the city, whereas values less than 1 indicate under-representation. A range between 0.85 and 1.20 is often considered indicative of a relatively balanced distribution [25]. The formula is:
where xi is the population of ethnic group X in spatial unit i, ti is the total population of all groups in spatial unit i, X is the total population of group X in the city, and T is the total population of all groups in the city.
4. Results
This section details the empirical findings on the evolving patterns of ethnic residential distribution and segregation in Riga between 2000 and 2021. The analysis starts with an examination of relative population shifts among the defined aggregate ethnic groups, followed by an assessment of inter-group residential segregation levels using the Index of Dissimilarity (DI). Finally, the geographical distribution and local concentration patterns of each aggregate group were explored using the Location Quotient (LQ). Employing major aggregate ethnic groups facilitates the identification of broader trends related to population dynamics, residential segregation, and spatial diversity, which might be obscured when analyzing numerous individual ethnicities separately. This approach is particularly pertinent for Riga, given its historically large minority population and the relatively small, albeit growing, size of more recently arrived ethnic groups.
4.1. Population Changes by Aggregate Ethnic Group
An analysis of population changes between 2000 and 2021 confirms significant shifts among major ethnic groups (see Figure 2). As anticipated, based on broader demographic trends, the populations classified as Russians and other traditional ethnic minorities experienced substantial declines, exceeding 30% for both groups. The Russian population has decreased by nearly 113,000 individuals. In contrast, the decline within the Latvian group was comparatively modest in both absolute and relative terms. Conversely, populations categorized as European and non-European exhibited growth. While modest in absolute terms, the relative increase exceeded 4% for the European group and a notable 25% for the non-European group. Consequently, the combined proportion of these two groups within Riga’s total population nearly doubled during this period, highlighting their increasing demographic presence.
A concurrent trend observed was more than a 90% increase in the number of individuals recorded with ''not selected'' or ''unknown'' ethnicity between 2000 and 2021. This considerable rise warrants acknowledgement, as the underlying factors—potentially including evolving self-identification patterns, the absence of mixed-ethnicity categories in the census, or other societal dynamics—are beyond the scope of this study's data but represent an important contextual factor. This trend imposes a limitation, as individuals in the ''not selected'' / ''unknown'' category, representing more than 4% of Riga's population in 2021, cannot be included in the analysis of the five defined aggregate ethnic groups.
4.2. Ethnic Residential Segregation
Inter-group residential segregation levels were assessed using the Index of Dissimilarity (DI) calculated at the 16-ha hexagonal bin scale for 2000, 2011, and 2021 (see Table 2). The values presented here indicate the degree of spatial separation between the pairs of ethnic groups. A general trend observed across the study period was an increase in DI values for most group pairings, suggesting a gradual rise in overall residential segregation within Riga. Specifically, the DI between Latvians and Russians, the city's two largest populations, indicated moderate segregation levels that increased slightly during the study period. Other traditional ethnic minority groups consistently exhibited low segregation from Russians, indicating considerable spatial overlap, while showing similar segregation from Latvians. Conversely, both European and non-European groups displayed substantially increasing segregation from Russians and other traditional ethnic minority groups. Segregation between Europeans and Latvians also increased slightly, as did segregation between non-Europeans and Latvians. Notably, the segregation level between Europeans and non-Europeans remained relatively stable, with an interim increase in 2011.
Table 2 also presents the IS values calculated between each specified group and all other residents combined. These values measure the overall residential separation of each group from the rest of the city's population. A consistent trend is that all five aggregate groups experienced an increase in this measure of separation between 2000 and 2021. The magnitude of this increase was most pronounced in the non-European group, followed by the European group. Examining the levels of separation by the end of the study period, other traditional minorities exhibited the lowest overall segregation. Russians displayed the next lowest level, followed by Latvians. The highest levels of overall spatial separation from the remaining population were recorded in the European and non-European groups.
4.3. Geographies of Ethnic Diversity
This subsection details the spatial distribution and concentration patterns of the five aggregate ethnic groups across Riga's neighborhoods, utilizing Location Quotients (LQs) calculated at the 16-ha bin level for 2000, 2011, and 2021 (Figure 3). Throughout the study period, Latvians consistently exhibited overrepresentation in inner-city and outer-city neighborhoods, while generally showing underrepresentation in the large Soviet-era housing estates, albeit with exceptions in specific greener or more prestigious locations within these estates (Figure 3a–c). Over time, their distribution appears to have become more homogeneous, with fewer areas of high over- or under-representation. Within the inner city, overrepresentation was notable on both banks of the Daugava River, with more optimal LQ values in the northern inner-city neighborhoods.
Russians and other traditional ethnic minorities display persistent and similar spatial patterns. Both remained significantly underrepresented in outer-city areas and showed increasing underrepresentation in many inner-city neighborhoods between 2000 and 2021 (Figure 3d–i). Concurrently, their overrepresentation intensified in specific northern and southern sections of the city, predominantly within the Soviet-era housing estates. While reflecting a shared tendency, these shifts towards greater spatial concentration and isolation were observed to be more pronounced for the Russian population compared to other traditional ethnic minorities.
The European group demonstrated increasing concentrations within the inner city, particularly on the right bank of the Daugava River, including marked growth in LQ values in northern inner-city areas (Figure 3j–l). In some peripheral inner-city areas, they transitioned from underrepresentation towards optimal level or slight overrepresentation. Localized areas of overrepresentation were also observed in the southern inner-city and its adjacent neighborhoods. However, underrepresentation persisted across most Soviet-era housing estates (barring some pockets of more affluent locations) and outer-city zones, where most areas remained unpopulated by Europeans, indicating a highly uneven distribution at the city scale.
The distribution of the non-European population has shifted considerably. In 2000, their pattern was characterized by small, scattered clusters of varying representations across the city. By 2021, the concentration had markedly increased in the right-bank inner city (Figure 3m–o) and decreased elsewhere. Inner-city neighborhoods like the Avoti neighborhood transitioned from widespread underrepresentation in 2000 to strong overrepresentation by 2021. This inner-city concentration also extended southward to the adjacent neighborhoods. Similar to Europeans, non-Europeans remained largely underrepresented in Soviet-era housing estates (except near higher education institutions) and exhibited only a minimal presence throughout most outer-city neighborhoods.
In summary, the LQ analysis revealed distinct and evolving spatial geographies for each aggregate ethnic group. Latvians displayed the most widespread distribution, becoming slightly more evenly distributed over time. Russians and other traditional minorities showed an increasing concentration within Soviet-era housing estates and a growing absence from inner- and outer-city zones. Europeans and non-Europeans both exhibited intensifying concentration within specific inner-city areas, contrasting with continued underrepresentation or even uninhibitedness across large parts of the remaining city, particularly the extensive Soviet-era estates and outer-city zones.
5. Discussion
This study investigated the dynamics of ethnic residential patterns, including segregation and spatial distribution, in Riga, Latvia, from 2000 to 2021, addressing a gap in research focusing on post-socialist urban contexts. Utilizing longitudinal census data, the analysis sought to understand how Riga's ethnic geography is being reshaped by the interplay of historical legacies, particularly Soviet-era migration, and contemporary diversification driven by new migration streams. Specifically, this period saw Riga's ethnic landscape transformed as new and rapidly growing non-European migrant communities became increasingly visible; their fast relative growth reflects broader European patterns of growing ethnic diversity due to migration and globalization. Simultaneously, Riga experienced an overall population decline, primarily driven by a decrease in long-established traditional ethnic minority populations. The findings provide insights into segregation trends and spatial reorganization, contributing to the broader understanding of ethnic intermixing and separation in European cities, yet simultaneously reflecting the distinct trajectory shaped by Riga's post-socialist context and specific historical legacies.
Regarding the first research question, our findings indicate a departure from Riga’s historical trajectory of relatively low ethnic segregation. Although a moderate overall increase in spatial separation between groups was observed using the Index of Dissimilarity (DI) between 2000 and 2021, the changes were notably uneven. The most significant increase occurred between established traditional minorities and newer European and non-European populations. Conversely, segregation involving the majority Latvian group and these newer populations increased only slightly. This differential pattern suggests complex underlying processes beyond a simple trend towards universal separation.
Addressing the second research question, the Location Quotient (LQ) analysis revealed distinct and evolving geographies for the major ethnic groups. A key finding was the increasing spatial concentration of established traditional ethnic minorities within specific urban zones, namely the large Soviet-era housing estates, concurrent with their diminishing presence in inner-city and outer-city areas, a pattern particularly pronounced for Russians. In contrast, Latvians exhibited a more widespread and increasingly even distribution, maintaining overrepresentation primarily in inner-city and outer-city zones. Furthermore, both European and, notably, rapidly growing non-European groups showed intensifying concentration within specific inner-city areas, often those characterized by Latvian overrepresentation.
The increasing segregation between traditional minorities and newer groups aligns with observations elsewhere regarding potentially distinct integration pathways or barriers for different migrant cohorts, which are potentially amplified by socioeconomic disparities or housing market dynamics. The persistent spatial clustering of traditional minorities in Soviet-era estates likely reflects the enduring legacy of socialist-era housing allocation and settlement patterns, possibly reinforced by linguistic or cultural factors leading to lower segregation between Russians and other traditional minorities. The relative stability in segregation levels involving Latvians and newer groups, particularly in the context of their increasing co-location in inner-city areas, suggests that diversification in certain zones occurs without precipitating high levels of segregation among these specific groups. This supports the crucial distinction between ethnic diversity and ethnic segregation – they are not necessarily concurrent phenomena.
The settlement patterns of newer groups, particularly their concentration in Latvian-majority inner-city areas and the general avoidance of traditional minority-dominated estates, provide empirical evidence relevant to the debate on migrant residential choices. While proximity to co-ethnics can be a factor, these findings suggest that for newer groups in Riga, proximity to the majority Latvian population and the specific characteristics of inner-city neighborhoods (potentially related to amenities, housing types, or employment and education access) may be significant drivers, aligning with studies suggesting preferences beyond simple co-ethnic concentration. The observed pattern contrasts somewhat with expectations derived from some European contexts, of potentially higher segregation for non-European groups; while their overall separation level increased, their spatial interaction with Latvians in specific zones is a key feature of Riga's current dynamic.
This study acknowledges limitations, primarily the inability to analyze the growing population reporting ''not selected'' or ''unknown'' ethnicity due to data constraints. As mentioned in the results, further exploration of this phenomenon is warranted, potentially offering insights into the complexities of ethnic self-identification in diverse, post-socialist societies.
In conclusion, this research provides context-specific answers to how ethnic residential segregation and spatial patterns have evolved in Riga over the last two decades. It highlights the unique interplay between post-socialist legacies and contemporary migration in shaping urban ethnic geographies. The findings confirm the value of fine-scale spatial analysis and underscore that diversification and segregation are complex, spatially variable, and group-specific processes. By detailing the divergent trajectories of traditional minorities versus newer groups, and identifying the inner city as a key site of diversification and intermixing involving Latvians and recent migrants, this study contributes empirical evidence to the understanding of ethnic residential dynamics in Central and Eastern European cities. The inner city of Riga, with its growing European and non-European population overrepresentation, presents a particularly intriguing area for further research. The specific drivers shaping these patterns, particularly the inner-city concentration of newer groups (potentially linked to housing markets, gentrification, social networks, or institutional factors), represent crucial avenues for future research, ideally incorporating micro-level and qualitative methods to deepen understanding. Furthermore, future research should explore how these changing ethnic residential patterns might impact the residential behavior of existing residents. These insights are pertinent to urban planning and policies aimed at fostering social cohesion in increasingly diverse cities.
Author Contributions
Conceptualization, M.B.; methodology, M.B. and S.B.; software, M.B. and S.B.; validation, S.B.; formal analysis, M.B. and S.B.; investigation, S.B.; resources, M.B.; data curation, M.B.; writing—original draft preparation, M.B. and S.B.; writing—review and editing, M.B. and S.B.; visualization, S.B.; supervision, M.B.; project administration, S.B.; funding acquisition, S.B. All authors have read and agreed to the published version of the manuscript.
Funding
This research was funded by the Recovery and Resilience Facility project "Internal and External Consolidation of the University of Latvia", grant number 5.2.1.1.i.0/2/24/I/CFLA/007.
Data Availability Statement
The datasets presented in this article are not readily available because the disaggregated data are sensitive, containing individual-level, geo-referenced ethnic information. Requests to access the datasets should be directed to maris.berzins@lu.lv.
Acknowledgments
During the preparation of this manuscript, the authors used Gemini Advanced 2.5 Pro (Google) for the purposes of text editing. The authors have reviewed and edited the output and take full responsibility for the content of this publication
Conflicts of Interest
The authors declare no conflicts of interest. The funders had no role in the design of the study; in the collection, analyses, or interpretation of data; in the writing of the manuscript; or in the decision to publish the results.
References
- Benassi, F.; Bonifazi, C.; Heins, F.; Lipizzi, F.; Strozza, S. Comparing Residential Segregation of Migrant Populations in Selected European Urban and Metropolitan Areas. Spat Demogr 2020, 8. [Google Scholar] [CrossRef]
- van Ham, M.; Tammaru, T. New Perspectives on Ethnic Segregation over Time and Space. A Domains Approach. Urban Geogr 2016, 37. [Google Scholar] [CrossRef]
- Tammaru, T.; Marcin´czak, S.; Aunap, R.; van Ham, M.; Janssen, H. Relationship between Income Inequality and Residential Segregation of Socioeconomic Groups. Reg Stud 2020, 54. [Google Scholar] [CrossRef]
- Lichter, D.T.; Parisi, D.; Ambinakudige, S. The Spatial Integration of Immigrants in Europe: A Cross-National Study. Popul Res Policy Rev 2020, 39. [Google Scholar] [CrossRef]
- Järv, O.; Masso, A.; Silm, S.; Ahas, R. The Link Between Ethnic Segregation and Socio-Economic Status: An Activity Space Approach. Tijdschrift voor Economische en Sociale Geografie 2021, 112. [Google Scholar] [CrossRef]
- Ibraimovic, T.; Hess, S. A Latent Class Model of Residential Choice Behaviour and Ethnic Segregation Preferences. Hous Stud 2018, 33. [Google Scholar] [CrossRef]
- Tindale, A.; Klocker, N. Neighborhood Ethnic Diversity and Residential Choice: How Do Mixed-Ethnicity Couples Decide Where to Live? Urban Geogr 2021, 42. [Google Scholar] [CrossRef]
- Bolt, G.; van Kempen, R. Ethnic Segregation and Residential Mobility: Relocations of Minority Ethnic Groups in the Netherlands. J Ethn Migr Stud 2010, 36. [Google Scholar] [CrossRef]
- Steele, L.G.; Abdelaaty, L. Ethnic Diversity and Attitudes towards Refugees. J Ethn Migr Stud 2019, 45. [Google Scholar] [CrossRef]
- Benassi, F.; Naccarato, A.; Iglesias-Pascual, R.; Salvati, L.; Strozza, S. Measuring Residential Segregation in Multi-Ethnic and Unequal European Cities. International Migration 2023, 61. [Google Scholar] [CrossRef]
- Catney, G.; Lloyd, C.D.; Ellis, M.; Wright, R.; Finney, N.; Jivraj, S.; Manley, D. Ethnic Diversification and Neighbourhood Mixing: A Rapid Response Analysis of the 2021 Census of England and Wales. Geographical Journal 2023, 189. [Google Scholar] [CrossRef]
- Catney, G.; Wright, R.; Ellis, M. The Evolution and Stability of Multi-Ethnic Residential Neighbourhoods in England. Transactions of the Institute of British Geographers 2021, 46. [Google Scholar] [CrossRef] [PubMed]
- Hårsman, B. Ethnic Diversity and Spatial Segregation in the Stockholm Region. Urban Studies 2006, 43. [Google Scholar] [CrossRef]
- Hess, D.B.; Tammaru, T. Modernist Housing Estates in the Baltic Countries: Formation, Current Challenges and Future Prospects. In Urban Book Series; 2019.
- Boterman, W.R.; Musterd, S.; Manting, D. Multiple Dimensions of Residential Segregation. The Case of the Metropolitan Area of Amsterdam. Urban Geogr 2021, 42. [Google Scholar] [CrossRef]
- Krišjāne, Z.; Bērziņš, M.; Sechi, G.; Krūmiņš, J. Residential Change and Socio-Demographic Challenges for Large Housing Estates in Riga, Latvia. In Urban Book Series; 2019.
- Rutland, P. Thirty Years of Nation-Building in the Post-Soviet States. Natl Pap 2023, 51. [Google Scholar] [CrossRef]
- Garda-Rozenberga, I.; Zirnite, M. Ethnic Diversity in the Construction of Life Stories in Latvia. Acta Baltico-Slavica.
- Németh, Á. Ethnic Diversity and Its Spatial Change in Latvia, 1897-2011. Post Sov Aff 2013, 29. [Google Scholar] [CrossRef]
- Central Statistical Bureau of Latvia Population and Its Characteristics Available online: https://data.stat.gov.lv/pxweb/en/OSP_PUB/START__POP__IR/.
- Krišjane, Z.; Berziņš, M.; Kratoviš, K. Occupation and Ethnicity: Patterns of Residential Segregation in Riga Two Decades after Socialism. In Socio-Economic Segregation in European Capital Cities: East Meets West; 2015.
- Krišjāne, Z.; Bērziņš, M. Intra-Urban Residential Differentiation in the Post-Soviet City: The Case of Riga, Latvia. Hungarian Geographical Bulletin 2014, 63. [Google Scholar] [CrossRef]
- Apparicio, P.; Martori, J.C.; Pearson, A.L.; Fournier, É.; Apparicio, D. An Open-Source Software for Calculating Indices of Urban Residential Segregation. Soc Sci Comput Rev 2014, 32. [Google Scholar] [CrossRef]
- Massey, D.S.; Denton, N.A. The Dimensions of Residential Segregation. Social Forces 1988, 67, 281–315. [Google Scholar] [CrossRef]
- Brown, L.A.; Chung, S.Y. Spatial Segregation, Segregation Indices and the Geographical Perspective. Popul Space Place 2006, 12. [Google Scholar] [CrossRef]
Figure 1.
The study area of Riga, illustrating the hexagon grid of 16-ha bins and neighborhoods by urban zones (inner city, Soviet-era housing estates, outer city).
Figure 1.
The study area of Riga, illustrating the hexagon grid of 16-ha bins and neighborhoods by urban zones (inner city, Soviet-era housing estates, outer city).
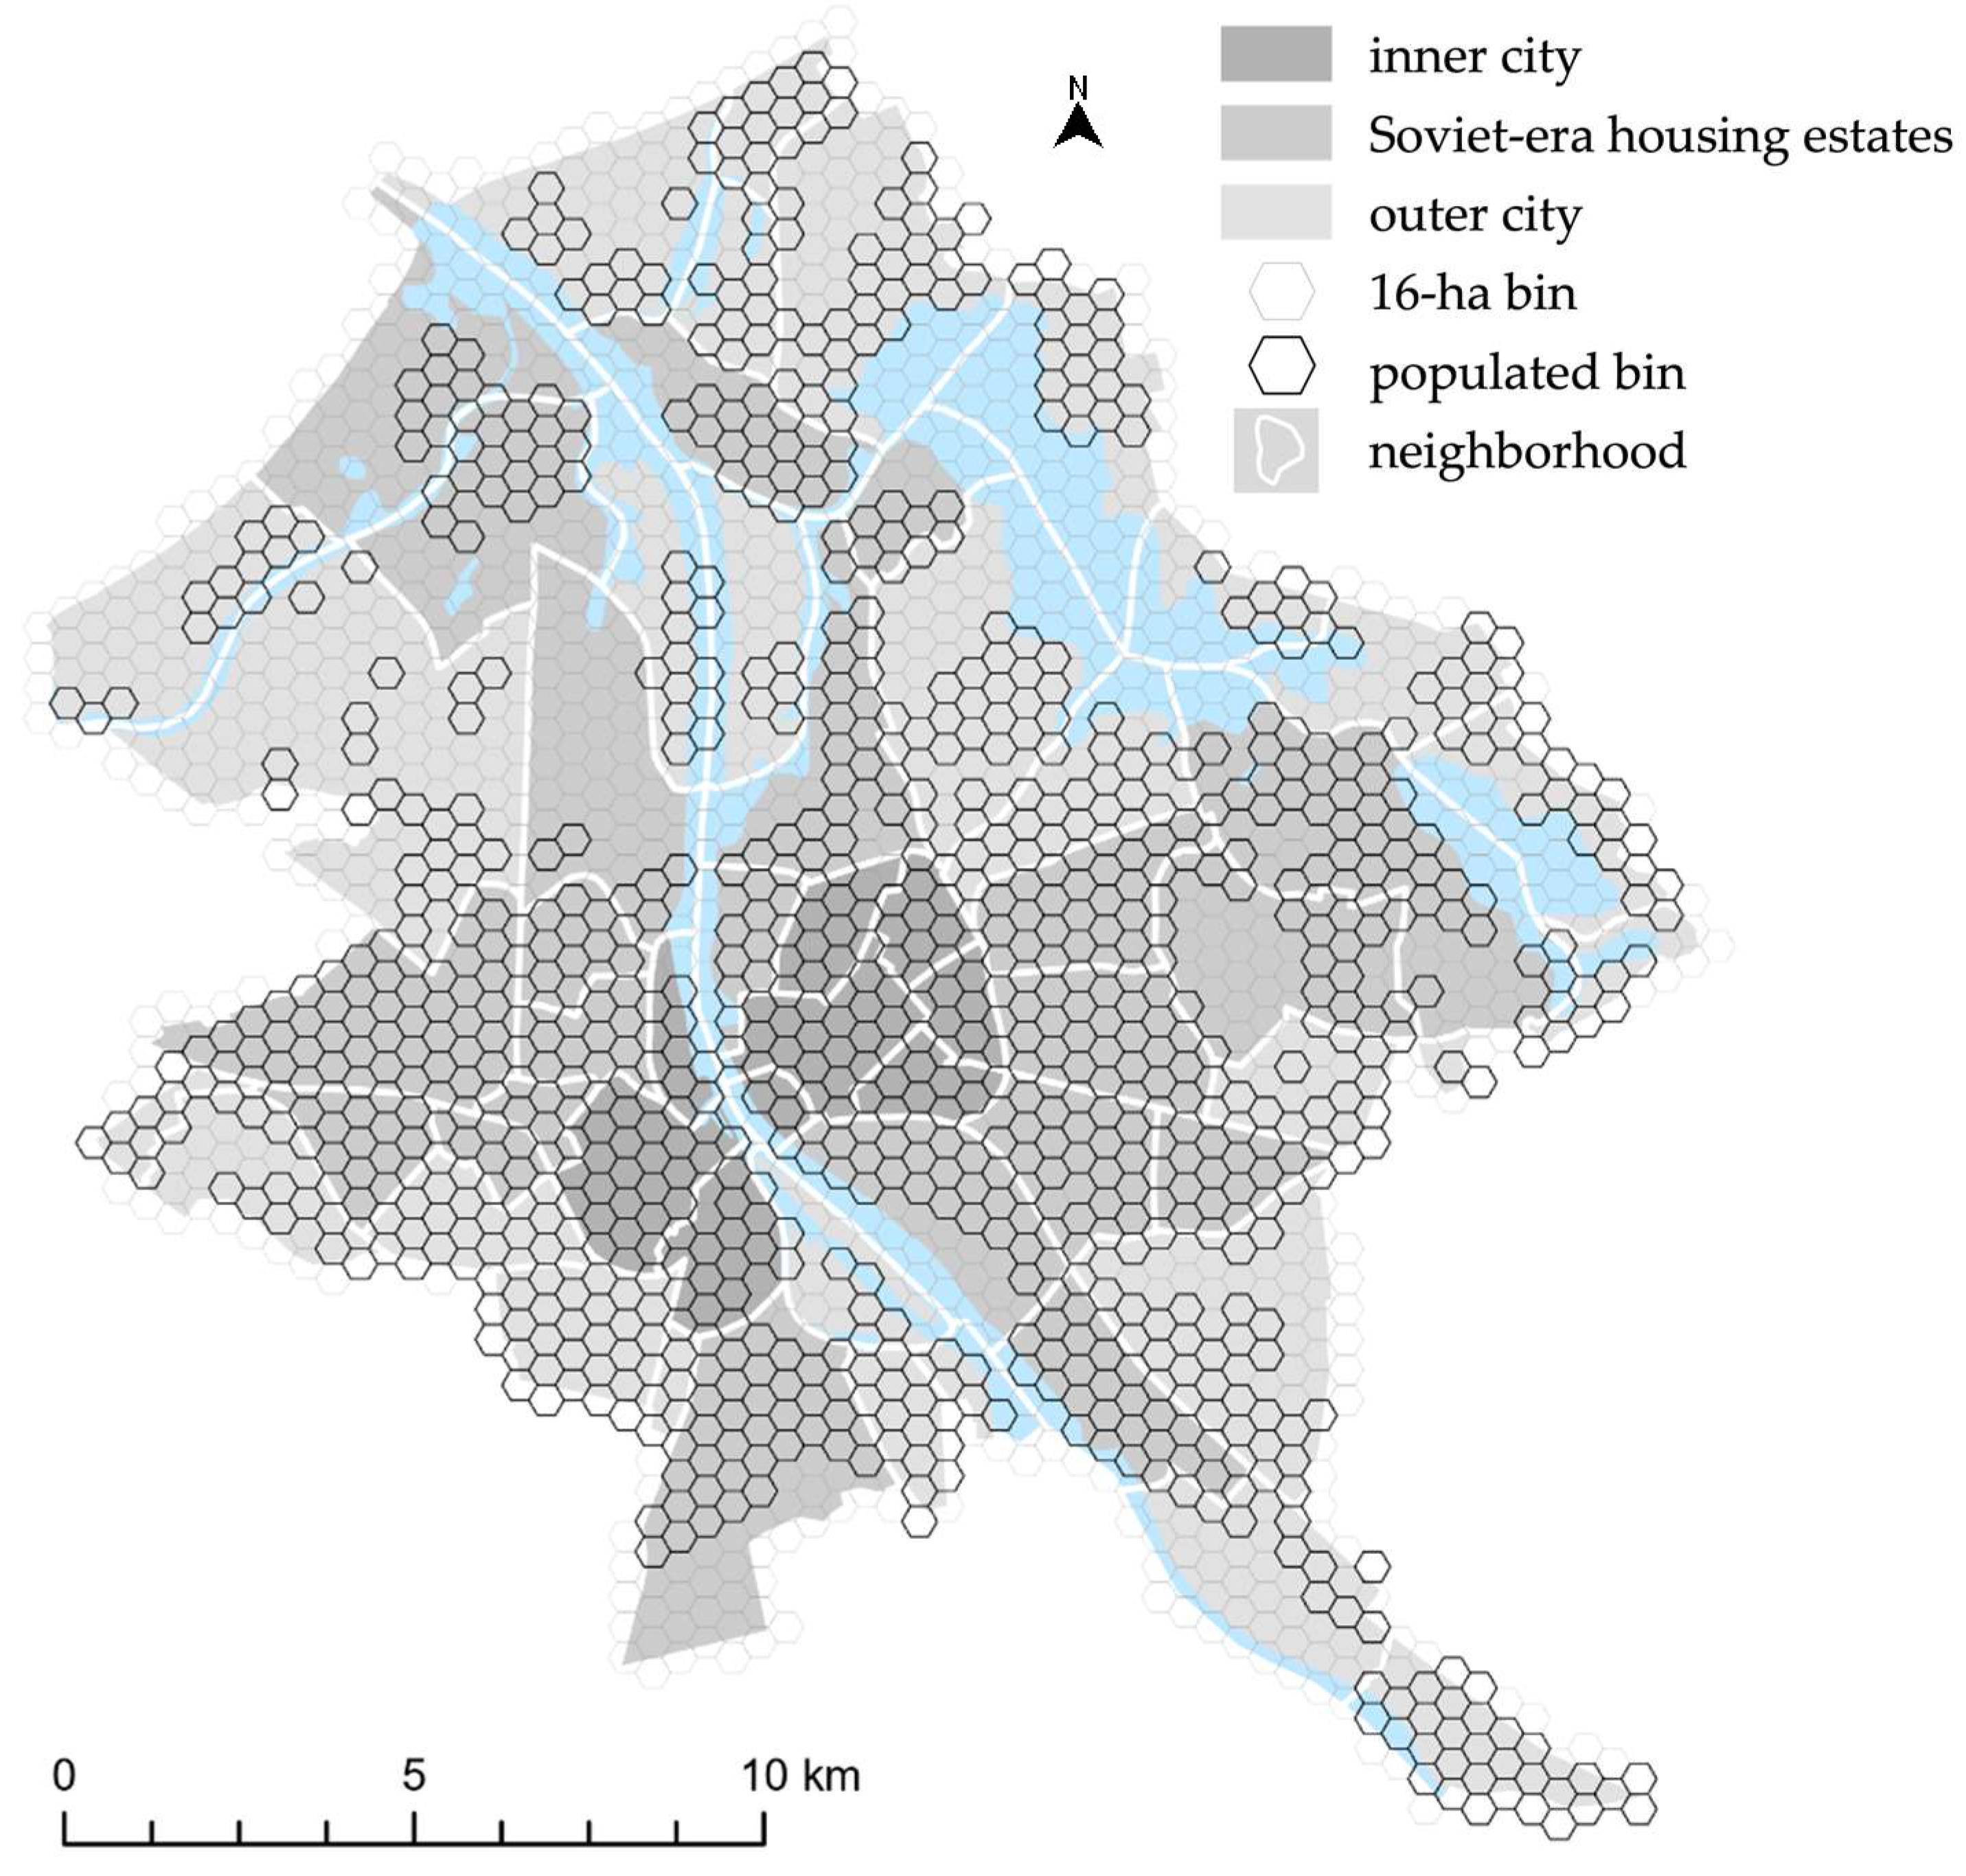
Figure 2.
Relative population changes (%) by major aggregate ethnic groups between 2000 and 2021 (Authors’ calculation based on data from the Central Statistical Bureau of Latvia).
Figure 2.
Relative population changes (%) by major aggregate ethnic groups between 2000 and 2021 (Authors’ calculation based on data from the Central Statistical Bureau of Latvia).
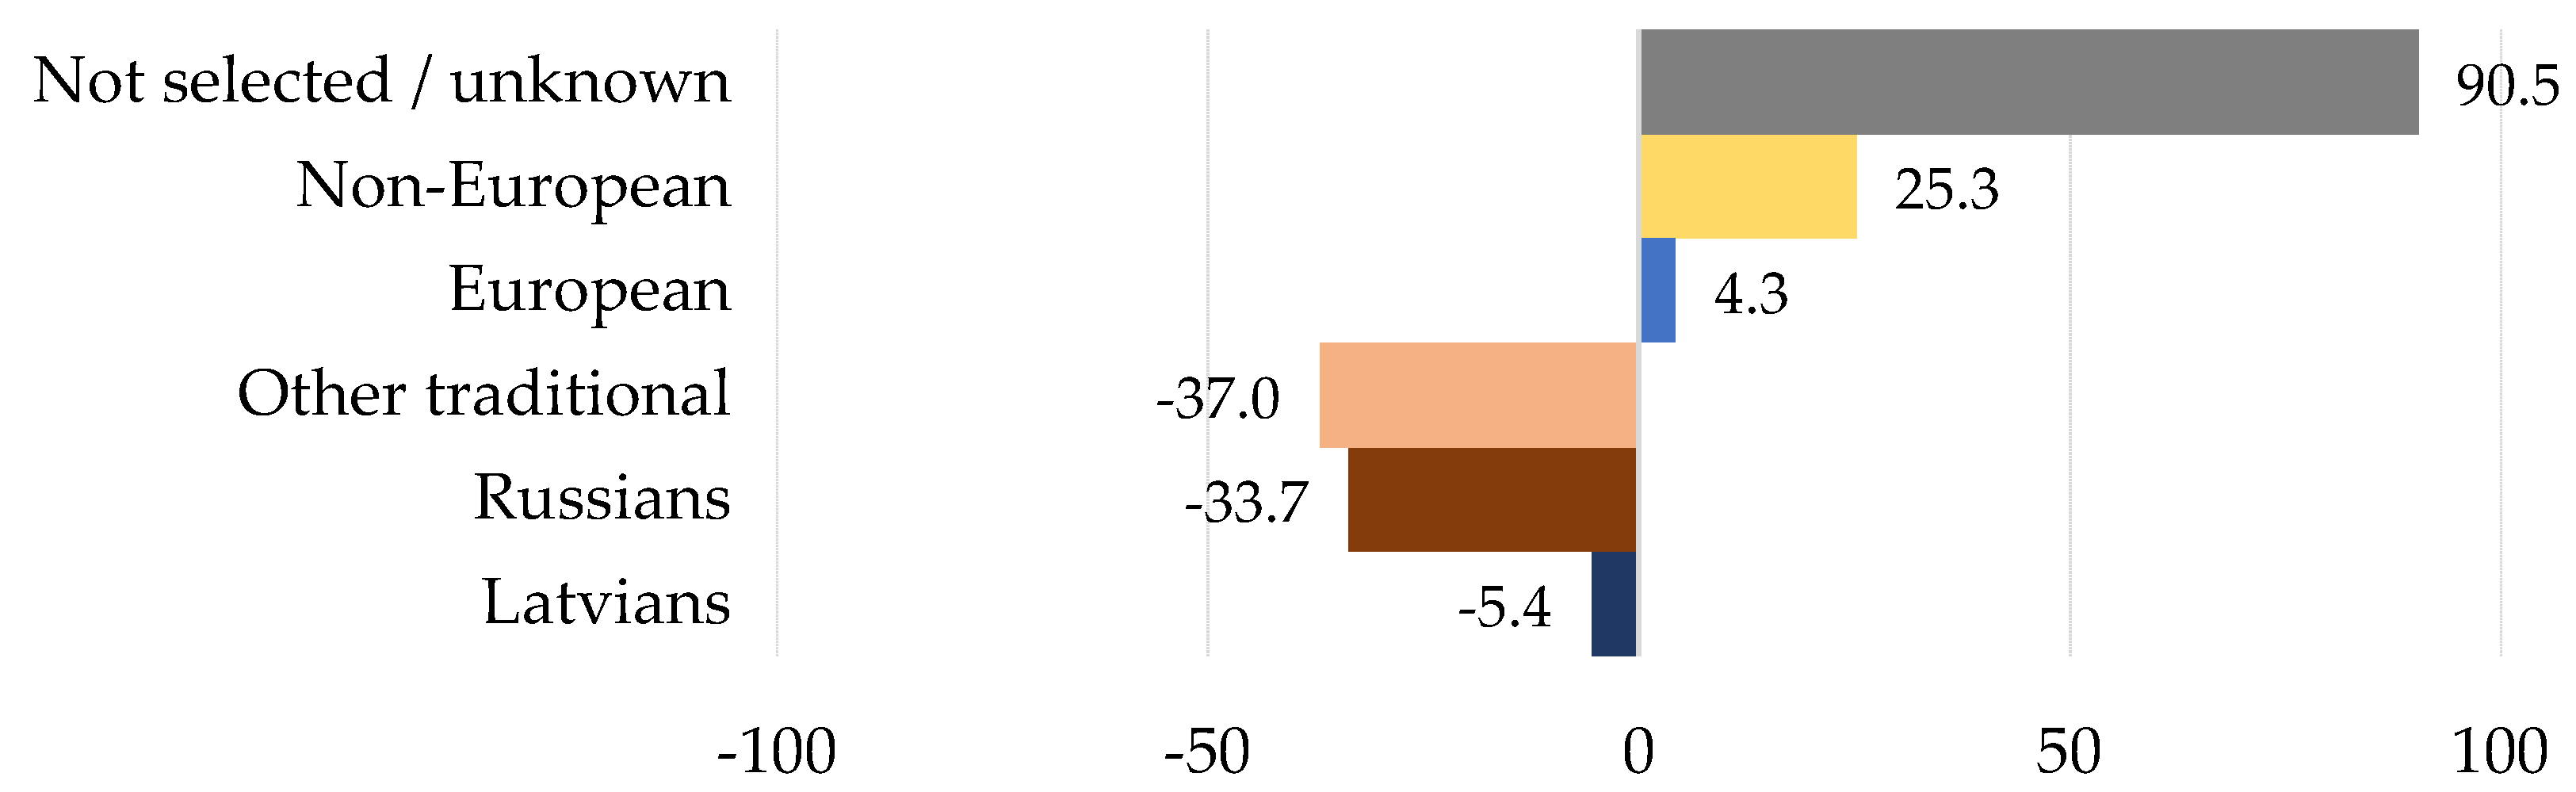
Figure 3.
Location Quotient (LQ) at 16-ha hexagon bin level by major aggregate ethnic group in Riga in 2000, 2011, and 2021 (Authors’ figure based on data from the Central Statistical Bureau of Latvia).
Figure 3.
Location Quotient (LQ) at 16-ha hexagon bin level by major aggregate ethnic group in Riga in 2000, 2011, and 2021 (Authors’ figure based on data from the Central Statistical Bureau of Latvia).
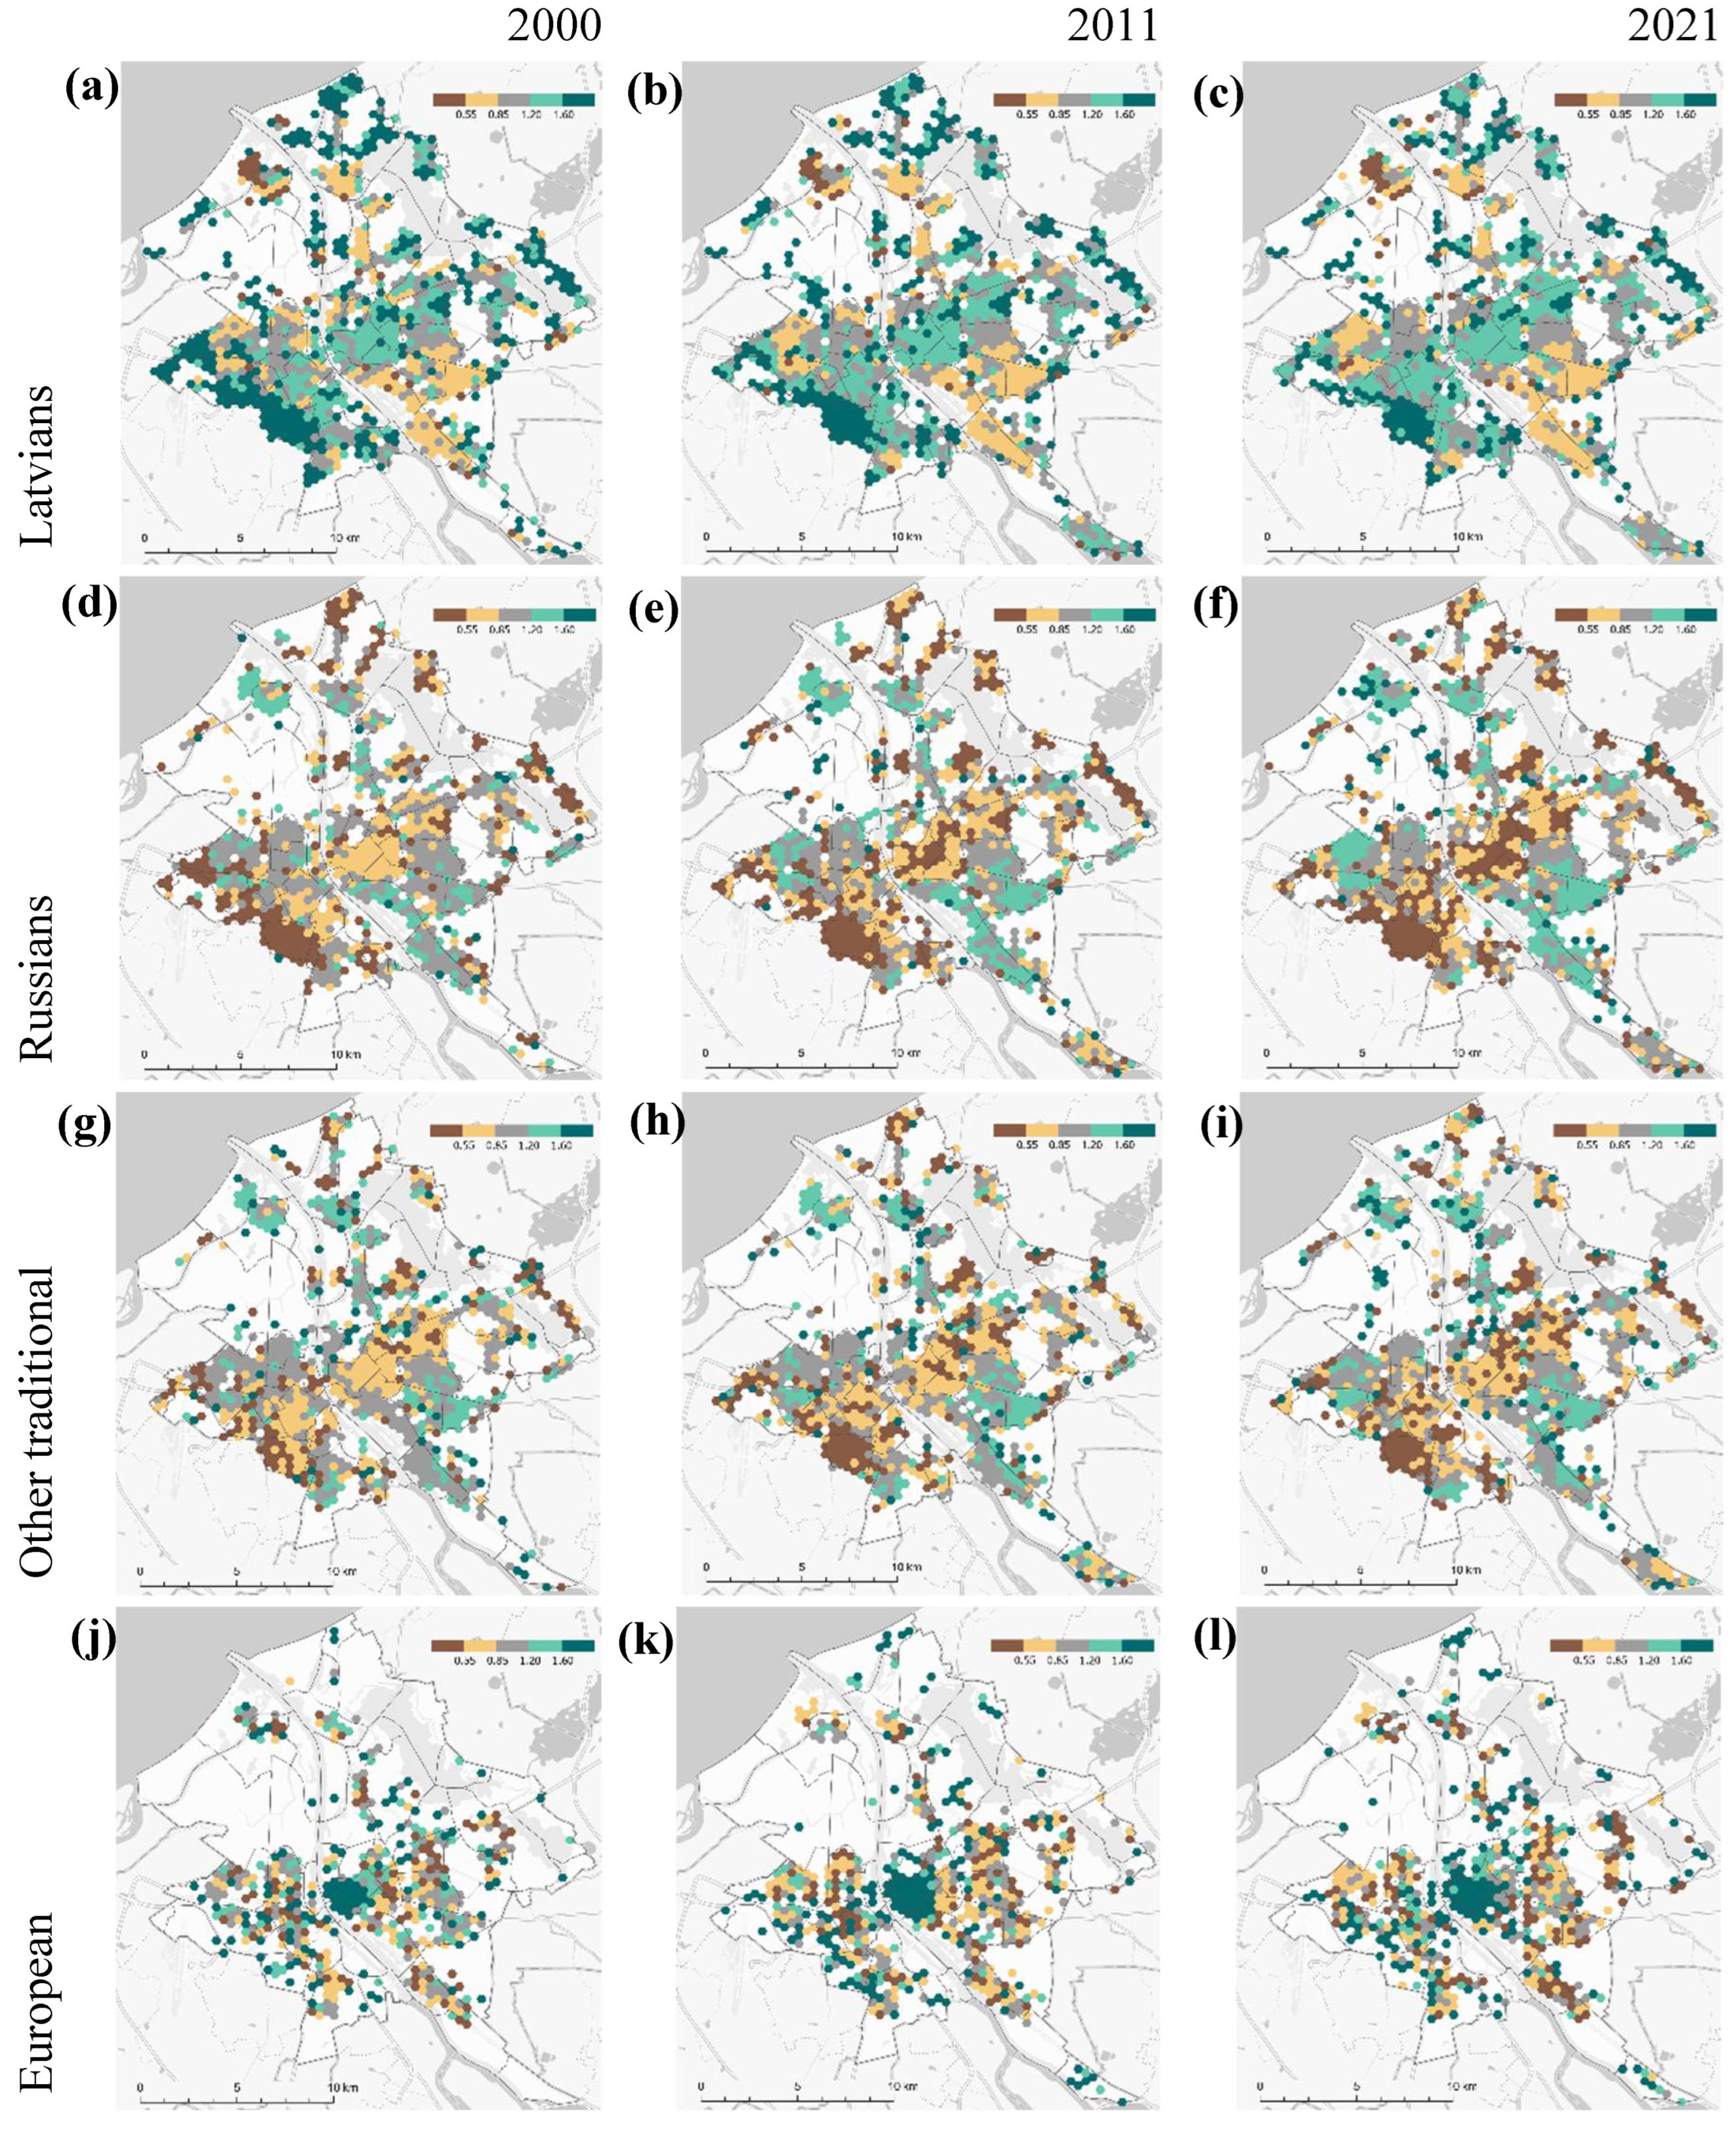
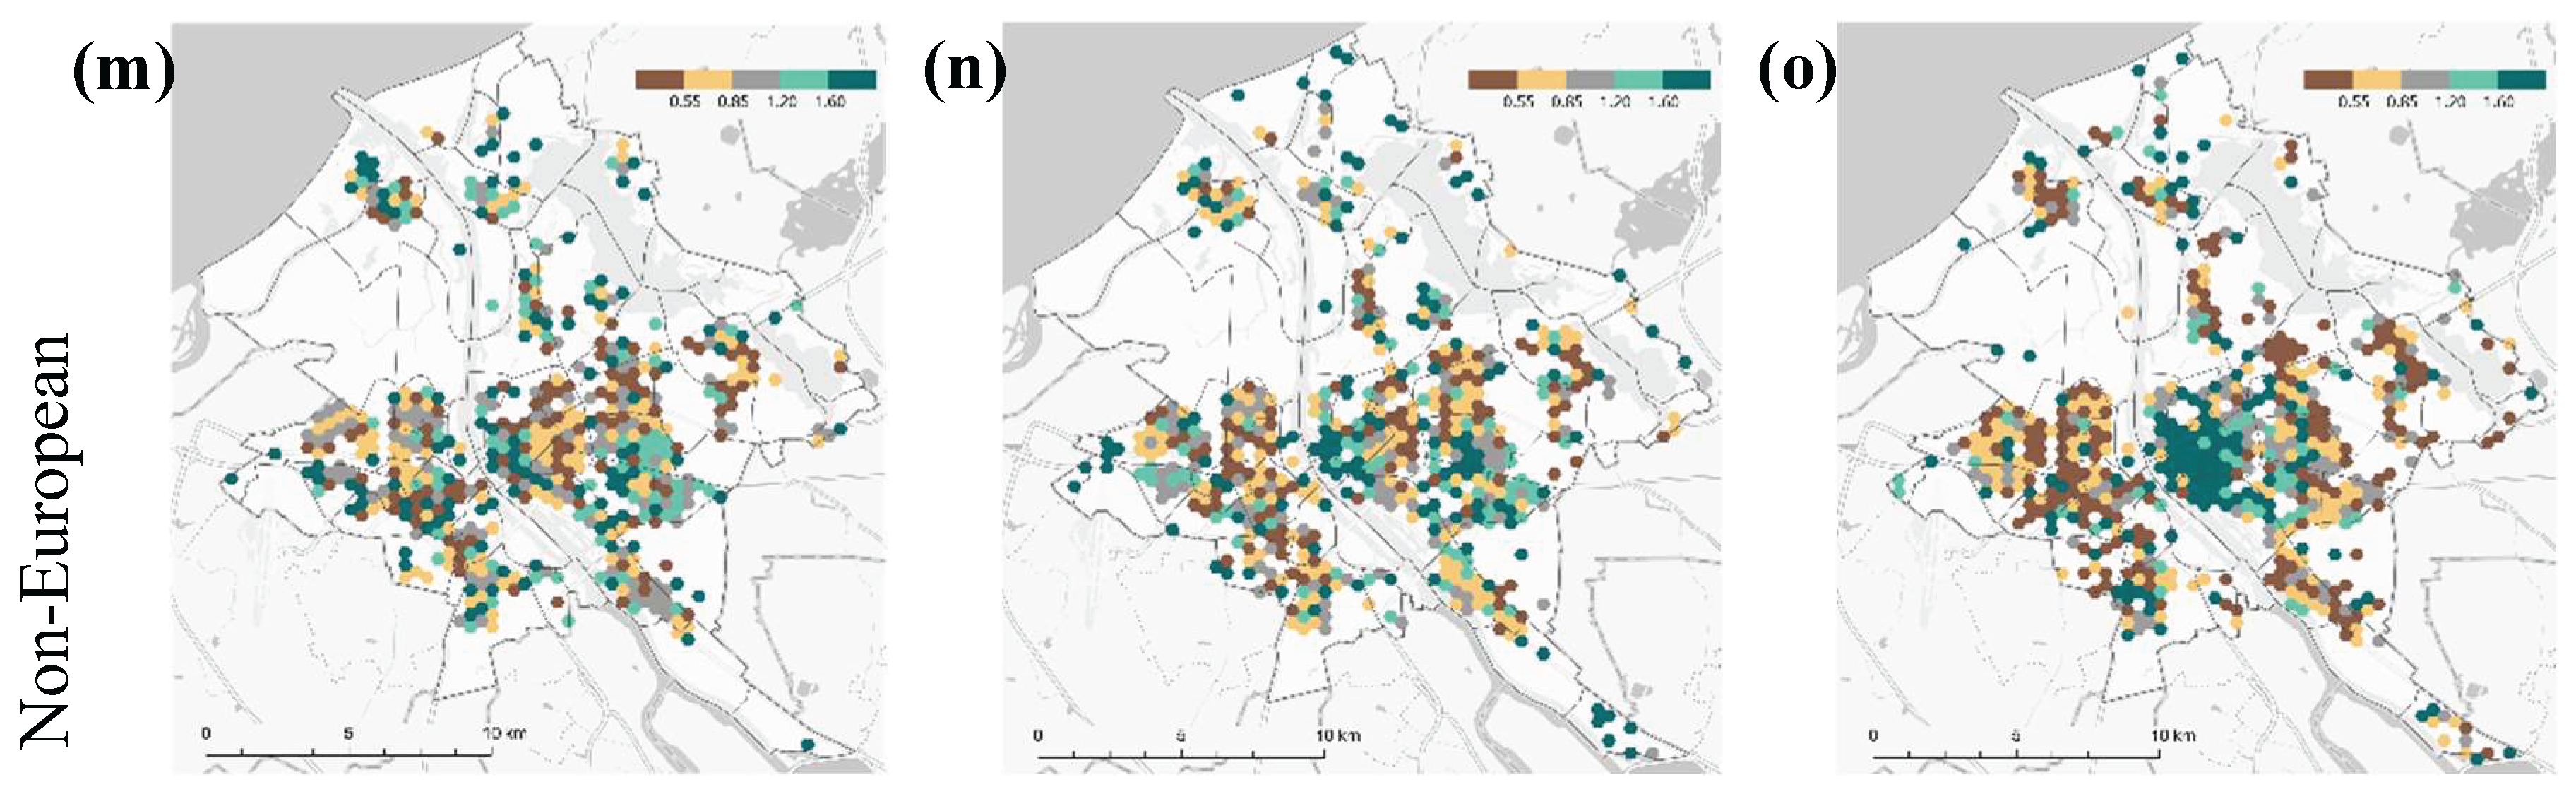

Table 1.
Sociodemographic indicators of major aggregate ethnic groups for Riga in 2021 (Authors’ calculation based on data from the Central Statistical Bureau of Latvia).
Table 1.
Sociodemographic indicators of major aggregate ethnic groups for Riga in 2021 (Authors’ calculation based on data from the Central Statistical Bureau of Latvia).
| Latvians | Russians | Other traditional* |
European | Non- European |
Total | |
|---|---|---|---|---|---|---|
| mean age | 40.0 | 47.9 | 53.4 | 41.2 | 37.0 | 43.0 |
| share (%) of 0-14 | 17.4 | 8.9 | 3.6 | 12.0 | 8.9 | 15.4 |
| share (%) of women | 56.3 | 56.3 | 56.8 | 40.8 | 33.5 | 55.6 |
| share (%) of university educated (18+) | 44.9 | 36.2 | 35.5 | 48.7 | 42.6 | 40.2 |
| share (%) of high-status occupations* | 41.4 | 26.3 | 27.4 | 46.5 | 27.4 | 34.0 |
| share (%) of low-status occupations* | 13.2 | 24.7 | 24.8 | 13.5 | 29.4 | 19.0 |
| share (%) of mobile residents** | 9.6 | 6.6 | 7.8 | 15.5 | 31.5 | 8.6 |
Notes: *other major ethnic minorities specific to Latvia and Riga city (Belarusians, Ukrainians, Poles, Lithuanians, Estonians, Jews, Roma, Armenians, Tatars, Moldovans).
Table 2.
Indices of Dissimilarity (DI) for major aggregate ethnic groups in Riga in 2000, 2011 and 2021 (Authors’ calculation based on data from the Central Statistical Bureau of Latvia).
Table 2.
Indices of Dissimilarity (DI) for major aggregate ethnic groups in Riga in 2000, 2011 and 2021 (Authors’ calculation based on data from the Central Statistical Bureau of Latvia).
| Latvians | Russians | Other traditional | European | Non-European | ||
|---|---|---|---|---|---|---|
| Latvians | 2000 | [0.22] | 0.23 | 0.23 | 0.29 | 0.31 |
| 2011 | [0.25] | 0.25 | 0.25 | 0.31 | 0.32 | |
| 2021 | [0.26] | 0.27 | 0.26 | 0.33 | 0.34 | |
| Russians | 2000 | 0.23 | [0.17] | 0.06 | 0.27 | 0.21 |
| 2011 | 0.25 | [0.20] | 0.07 | 0.34 | 0.25 | |
| 2021 | 0.27 | [0.22] | 0.07 | 0.40 | 0.39 | |
| Other traditional* | 2000 | 0.23 | 0.06 | [0.12] | 0.27 | 0.21 |
| 2011 | 0.25 | 0.07 | [0.14] | 0.34 | 0.25 | |
| 2021 | 0.26 | 0.07 | [0.15] | 0.38 | 0.37 | |
| European | 2000 | 0.29 | 0.27 | 0.27 | [0.26] | 0.32 |
| 2011 | 0.31 | 0.34 | 0.34 | [0.30] | 0.36 | |
| 2021 | 0.33 | 0.40 | 0.38 | [0.33] | 0.32 | |
| Non-European | 2000 | 0.31 | 0.21 | 0.21 | 0.32 | [0.24] |
| 2011 | 0.32 | 0.25 | 0.25 | 0.36 | [0.26] | |
| 2021 | 0.34 | 0.39 | 0.37 | 0.32 | [0.34] |
Notes: * Other major ethnic minorities specific to Latvia and Riga city (Belarusians, Ukrainians, Poles, Lithuanians, Estonians, Jews, Roma, Armenians, Tatars, Moldovans); indices of segregation (IS) are shown in [].
Disclaimer/Publisher’s Note: The statements, opinions and data contained in all publications are solely those of the individual author(s) and contributor(s) and not of MDPI and/or the editor(s). MDPI and/or the editor(s) disclaim responsibility for any injury to people or property resulting from any ideas, methods, instructions or products referred to in the content. |
© 2025 by the authors. Licensee MDPI, Basel, Switzerland. This article is an open access article distributed under the terms and conditions of the Creative Commons Attribution (CC BY) license (http://creativecommons.org/licenses/by/4.0/).
Copyright: This open access article is published under a Creative Commons CC BY 4.0 license, which permit the free download, distribution, and reuse, provided that the author and preprint are cited in any reuse.


