
Submitted:
26 November 2025
Posted:
26 November 2025
You are already at the latest version
Abstract
Synaptic plasticity is a fundamental mechanism underlying learning and memory, through which neuronal networks in the brain exhibit rhythmic activity at distinct frequencies (e.g., θ and γ oscillations) to enable efficient information processing and maintain network stability. However, the plasticity rules of in vitro neuronal networks under different stimulation frequencies, as well as their regulatory responses to rhythmic driving, remain insufficiently characterized. To investigate how in vitro neuronal networks achieve learning and memory processes, we cultured mice hippocampal networks on multielectrode arrays (MEAs) and conducted two related experiments. (1) Electrical stimulation patterns at distinct frequencies, combined with network connectivity analysis, demonstrated clear frequency-dependent plasticity, reflecting core properties of learning and memory. (2) Physiologically relevant rhythmic stimulation (θ: 7.8 Hz, γ: 40 Hz) with varying intensities was then applied. Although both rhythms induced distinct frequency-specific modulation, increasing stimulation intensity led to a pronounced suppression of frequency-dependent plasticity, revealing an intrinsic homeostatic regulatory mechanism. Together, out findings characterize frequency-dependent plasticity of in vitro hippocampal networks and uncover their adaptive homeostatic regulation under rhythmic modulation. These results advance our understanding of learning and memory mechanisms and provide a foundation for leveraging in vitro neural systems to perform complex learning and memory tasks.
Keywords:
in vitro microelectrode arrays
; synaptic plasticity
; rhythmic modulation
; homeostatic regulation
1. Introduction
Synaptic plasticity is the core mechanism underlying learning and memory in the nervous system. By modulating the strength of synaptic connections between neurons, it enables dynamic information regulation at the network level[1]. In neuronal culture systems, the collective manifestation of synaptic plasticity is referred to as network plasticity, which forms the foundation for learning and memory functions in biological neuronal networks (BNNs)[2].
Studies indicate that the frequency characteristics of neuronal network activity are closely related to their plasticity. During cognitive functions such as learning and memory, neural signals often display prominent theta (4–8 Hz) and gamma (30–80 Hz) oscillations. Gamma-band activity has been shown to drive cell-type–specific plasticity in the hippocampal CA3 region [3], while theta rhythms are essential for processes including memory formation and feature extraction[4]. Furthermore, theta–gamma cross-frequency coupling serves as an essential mechanism for working memory and cognitive control, facilitating the induction of synaptic plasticity and the formation of memory traces through inter-regional synchronous oscillations, thereby enhancing information encoding and regulatory efficiency[5,6,7]. Consequently, elucidating the mechanisms by which theta and gamma oscillations influence network plasticity is of great significance for understanding neural regulatory principles underlying learning and memory.
In vitro neural network models offer unique advantages for studying the mechanisms of learning and memory. These systems allow precise control of external inputs and eliminate individual variability and non-task-related neural interference[8]. Based on multi-electrode array (MEA) technology, in vitro neural networks preserve fundamental neuronal and synaptic properties and enable noninvasive, high temporal- and spatial-resolution detection of electrophysiological activities[9]。They also support programmable multi-site electrical stimulation, providing an ideal platform for investigating the formation, organization, and modulation of neuronal populations[10], as well as stimulus-induced network dynamics (Figure 1a)[11,12].
The spike timing dependent plasticity (STDP) framework provides a fundamental model for understanding synaptic regulation: when presynaptic spikes precede postsynaptic spikes, synaptic strength is potentiated; the reverse sequence leads to synaptic depression[13]. Moreover, high-frequency electrical stimulation can induce long-term potentiation (LTP)[14], whereas low-frequency stimulation tends to elicit long-term depression (LTD)[15]. Changes in synaptic strength are directly manifested in neuronal firing patterns: enhanced synaptic connections increase the synchrony of neuronal discharges, thereby strengthening functional connectivity, whereas weakened connections reduce firing synchrony, leading to attenuated functional connectivity.
Learning behavior is tightly coupled to synaptic plasticity. By modulating synaptic efficacy, STDP significantly enhances the learning efficiency of BNNs[16]. Moreover, during learning processes, neuronal firing activity often evolves toward structured and task-specific synchronous patterns[17]. Previous studies have utilized frequency-dependent plasticity to apply distinct electrical stimulation patterns in in vitro neuronal cultures, successfully achieving task-oriented modulation of network activity that exhibits learning- and memory-like behaviors[18,19,20,21]. However, due to variations in BNN characteristics, learning objectives, and encoding-decoding strategies, it is challenging to establish a clear mapping between stimulation methods and changes in synaptic structure within the network[2].
Additionally, relying solely on frequency-dependent plasticity is insufficient to reveal the dynamic regulatory mechanisms of brain networks. Introducing electrical stimulation patterns with physiological rhythmic characteristics can help investigate the regulatory effect of oscillations closer to the natural state on the network plasticity[22]. To date, systematic studies investigating the dynamic evolution of network plasticity under rhythm-based modulation in in vitro BNNs related to learning and memory remain deficient[23]. Therefore, exploring rhythmic modulation is of great importance for realizing functional shaping and intelligent learning and memory behaviors of in vitro neuronal networks.
Building upon this foundation, the present study employed hippocampal neuronal cultures derived from mice—this brain region is closely associated with learning and memory functions and exhibits prominent theta and gamma oscillations during higher cognitive processes [24,25]. Using the signal acquisition and stimulation capabilities of multi-electrode arrays, we systematically investigated the effects of different electrical stimulation frequencies on network connectivity, confirming that in vitro hippocampal BNNs exhibit frequency-dependent plasticity modulation with potential learning and memory capacities. Furthermore, we applied rhythmic electrical stimulation at theta (7.8 Hz) and gamma (40 Hz) frequencies with varying intensities to mimic intrinsic brain rhythms and analyzed corresponding changes in network firing patterns (Figure 1b). Our experiments revealed that increasing rhythmic stimulation intensity induced pronounced adaptive suppression of frequency-dependent plasticity, indicating the presence of a homeostatic regulatory mechanism that prevents sustained overexcitation and maintains balanced network activity. This study systematically delineates the frequency-dependent plasticity of in vitro hippocampal networks and provides experimental evidence for understanding the regulatory effects of rhythmic electrical stimulation on the plasticity of in vitro neuronal networks. These findings establish a foundation for the development of in vitro neural intelligent systems capable of more complex learning and memory functions.
2. Materials and Methods
2.1. Reagents and Apparatus
Phosphate-buffered saline (PBS, 0.1 M, pH 7.4) and sodium glutamate (≥99%) were procured from Shanghai Chemical Reagent Company. HBSS, DNase, papain, DMEM, and Neurobasal Plus Medium were supplied by Sigma Aldrich, and cy-tarabine was obtained from Thermo Fisher. The MEA interfaces were modified using an electrochemical workstation (Gamry Reference 600, Gamry Instruments). Electrophysiological recordings were conducted with a 128-channel acquisition system from Blackrock Microsystems. Additional instruments used throughout the experiments included a scanning electron microscope, a Blackrock preamplifier, a CO₂ incubator (Thermo Fisher), a dual-channel stimulator (Multichannel), and an oscilloscope (TPS2024, Tektronix).
2.2. Fabrication of In Vitro Microelectrode Arrays and Neuron Cultivation
In this study, a 60-channel microelectrode array (MEA) chip was designed and fabricated to establish an in vitro platform for neuronal culture and electrophysiological research. The electrode sites on the MEA surface enable high-precision detection of neuronal network electrophysiological signals as well as programmable electrical stimulation control. The fabrication of the MEA was based on surface micromachining processes within microelectromechanical systems (MEMS) technology, following the planar MEA structure previously developed in previous work[26,27]. The main fabrication steps and detailed parameters are provided in Figure S1. To enhance the electrical performance and biocompatibility of the electrodes, the MEA sites were modified with platinum nanoparticles (PtNPs) by Chronoamperometry. Owing to their excellent physicochemical stability, large specific surface area, and superior electrical conductivity, PtNPs can significantly improve the electrodes’ performance in both electrophysiological signal detection and stimulation delivery[28]. Consequently, the PtNPs-modified MEA exhibits excellent functionality and reliability in neuronal signal acquisition and electrical stimulation applications. The detailed PtNPs modification procedure is provided in Text S1.
In this study, hippocampal tissue was selected for in vitro neuronal culture. All animal procedures were approved by the Institutional Animal Care and Use Committee of the Aerospace Information Research Institute, Chinese Academy of Sciences, and conducted in strict accordance with the guidelines of the Beijing Association for Laboratory Animal Care (AIRCAS-006-1,09/14/2022). All surgical procedures, were performed following established ethical standards to minimize animal suffering. In this study, pregnant mice at embryonic day 15.5 were euthanized, and the uterus was removed for subsequent hippocampal tissue isolation and culture. Neuronal cultures were prepared following previously established protocols[29,30]. and detailed procedures for tissue isolation and culture are provided in Text S2.
2.3. Modulation of Network Connectivity Induced by Electrical Stimulation at Different Frequencies
To investigate whether the in vitro hippocampal neuronal networks in this study exhibit frequency-dependent plasticity at the network level, we designed two representative stimulation paradigms (detailed stimulation protocol shown in Figure 3a): “Disrupt” and “Stabilize”. The “Disrupt” paradigm involved low-frequency alternately stimulating two electrodes at 300 ms intervals, repeated 100 times, to weaken pre-existing network connections. The “Stabilize” paradigm employed 100 Hz high-frequency synchronous stimulation, synchronously applying voltage pulses to eight evenly distributed active electrodes on the MEA, repeated 100 times, to enhance network stability. Both stimulation paradigms utilized biphasic pulses with a negative-phase precedence configuration. The voltage amplitude is set at ±300 mV, and the pulse width is 200 microseconds. Following each stimulation trial, electrophysiological signals were continuously recorded for 3 minutes for subsequent analysis, with the first and the last trials serving as blank control without stimulation. To eliminate potential short-term dependence or transient elastic changes induced by specific stimulation patterns[31], the experiment was conducted with three consecutive “Disrupt”–“Stabilize” trial cycles, enabling a systematic evaluation of the effects of different stimulation paradigms on network connectivity modulation. The stimulation paradigm is provided in Table S1.
2.4. Modulation of Neuronal Firing Patterns by Rhythmic Stimulation
To investigate the long-term modulatory effects of rhythmic electrical stimulation on the in vitro biological neuronal network, this study selected 40 Hz and 7.8 Hz—typical frequencies within the γ and θ bands that play critical roles in learning and memory—as stimulation parameters. In the experimental design, a blank control group was first established, followed by three stimulation groups. Each stimulation group consisted of two trials, during which rhythmic electrical stimulation sequences at 40 Hz or 7.8 Hz were synchronously delivered to the entire network. The intensity of each stimulation group was adjusted based on the number of pulse repetitions in each trial: 100 pulses for Group 1, 1,000 for Group 2, and 10,000 for Group 3 (the specific stimulation procedure is shown in the Figure 5a, and pulse characteristics are consistent with the method described in Section 2.3). The stimulation paradigm is provided in Table S2. After each trial, electrophysiological activity was continuously recorded for 3 minutes for subsequent analysis.
2.5. Electrophysiological Analysis
In this study, neuronal firing signals were analyzed using Offline Sorter and Neuroexplorer software. The Valley-Seeking algorithm was employed to extract the spike signals recorded at each site. The spike signals from each site are considered a sequence of spikes from the neurons. Subsequent analyses of all data were conducted using MATLAB (MathWorks) and Python (Python Software Foundation).
3. Results
3.1. Enhanced Electrical Performance of MEA via Modification
In this study, we firstly fabricated the MEA using a MEMS-based process. As illustrated in Figure 2a, the resulting MEA consists of three-layer structure arranged from top to bottom. The top layer is an insulating layer containing exposed windows that allow direct contact with both the biological neural tissue and external interfacing devices. The middle layer is a conductive medal layer, in which electrode sites located at the central region are connected to peripheral bonding pads through metal wires, thereby enabling electrical interfacing with external devices. The bottom layer is a glass substrate that provides mechanical support and overall structural stability. In addition, a PDMS circular chamber surrounding the central electrode region defines the culture area, facilitating the growth and maintenance of biological neural tissue in vitro.
In addition, platinum nanoparticles (PtNPs) were applied to modify the electrode sites of the MEA to enhance their electrical performance and biocompatibility. Compared with unmodified electrodes, the PtNPs-modified electrodes exhibited a darker surface appearance (Figure 2b). Scanning electron microscopy (SEM) revealed that PtNPs were distributed on the electrode surface, forming a hierarchical granular morphology (Figure 2c) that markedly increased the effective surface area, thereby providing a more extensive interface for neuronal adhesion.
Figure 2.
Fabrication and Modification of MEA. (a) Illustration of the structure of the MEA. (b) Optical microscopy image of bare site and PtNPs modified sites (scale bar: 100µm). (c) SEM image of PtNPs deposited on electrode sites (scale bar: 800nm). (d) Impedance characteristic of PtNPs-modified sites and bare sites across various frequencies. (e) Phase characteristic of PtNPs-modified sites and bare sites across various frequencies. (f) Mean impedance and phase at 1 kHz for unmodified and PtNP-coated sites. *** indicates P < 0.001 (t-test, n = 5 per group). (g) The growth state of mice hippocampal neurons on the MEA surface (scale bar: 100μm). (h) The raw data of one-minute spontaneous electrophysiological signals from three representative active recording sites are shown (scale bars: 100 µV, 20 s). The high-frequency components were extracted, and the corresponding averaged action potential waveforms for each site are presented on the right (scale bars: 40 µV, 1 ms).
The electrochemical characteristics of the modified electrodes were assessed using electrochemical impedance spectroscopy (EIS) in phosphate-buffered saline (PBS), with measurements performed across frequencies ranging from 10 Hz to 10 kHz (Figure 2d–f). The results showed that, compared to the bare electrodes, PtNPs modification significantly reduced the impedance at 1 kHz (the typical frequency reflecting neuronal firing characteristics) from 877.4 ± 89.8 kΩ to 9.3 ± 2.3 kΩ, representing a 94-fold decrease. Meanwhile, the phase delay decreased from 70.3 ± 2.7° to 56.5 ± 3.2°. The substantial reduction in impedance enhanced efficiency of charge transfer between the electrode and the biological tissue, and effectively improving the signal-to-noise ratio (SNR) of electrophysiological recordings. Meanwhile, the decreases in phase delay increases both the response speed and the accuracy of electrical signal transmission, collectively leading to a substantial improvement in the overall electrical performance of the electrodes.
After culturing mice hippocampal neurons on the PtNPs-modified MEA for 21 days, optical microscopy image revealed well-formed synaptic connections among neurons, indicating the initial establishment of a network structure (Figure 2g). We recorded the spontaneous activity of the network. The left panel of Figure 2h presents the raw electrophysiological signals obtained from three representative channels, demonstrating a high SNR. We subsequently extracted the high-frequency components from each channel, and the corresponding average spike waveforms are shown on the right. further confirming the excellent capability of this MEA platform for high-quality multichannel neural signal detection.
3.2. Modulation of Network Firing Synchrony Following Electrical Stimulation Trials
Using the electrical stimulation protocol described in Section 2.3, we applied two stimulation patterns (“Disrupt” and “Stabilize”) to the in vitro biological neural networks, with a total of eight trials performed, as shown in Figure 3a. The raster plots in Figure 3b illustrate the spike activity recorded from a subset of active electrodes within one minute following each stimulation trial. In the initial “Control 1” trial (prior to stimulation), synchronous firing events were already observed at several active sites, suggesting that neurons near these electrodes may serve as key nodes for information transmission within the network. Across multiple stimulation trials, the firing patterns exhibited discernible variations. Moreover, after the full sequence of stimulations, the firing synchrony observed in “Control 2” was further enhanced compared with “Control 1”.
To more clearly elucidate the impact of electrical stimulation on network firing dynamics, we calculated the Pearson correlation coefficients between spike signals recorded from all electrode pairs, thereby quantifying neuronal synchrony (details provided in Text S3). As shown in Figure 3c, the synchrony heatmap of “Control 1” reveals the presence of initial functional connections among subsets of neurons prior to stimulation. In contrast, “Control 2” (Figure 3d) exhibited a marked increase in the number of synchronous firing nodes, indicating a substantial enhancement in overall network synchrony (synchrony analyses for all trials are provided in Figure S2). These findings indicate that the applied series of stimulation paradigms effectively enhanced the coordinated activity of the in vitro neural network and promoted the formation of functional connectivity patterns. Building on this observation, we then conducted a systematic investigation into the specific regulatory effects of the different stimulation paradigms on network functional connectivity.
Figure 3.
Analysis of network firing activity under a series of electrical stimulations (a) Schematic of frequency-dependent plasticity stimulation experiment: Red lightning represents low-frequency “Disrupt” stimulation applied alternately between two electrodes at 300 ms intervals, while blue lightning represents, high-frequency 100 Hz “Stabilize” stimulation applied synchronously to eight electrodes on the MEA. Each stimulation trial consisted of 100 pulses, with three consecutive “Disrupt” trials followed by three “Stabilize” trials. (b) The spike firing patterns recorded in the first minute of each trial are shown, with only the most active sites displayed in the figure. (c) Synchrony heatmap of firing nodes of “Control 1” trial which conducted before the electrical stimulation trials. (d) Synchrony heatmap of firing nodes of “Control 2” trial which conducted after the electrical stimulation trials.
3.3. Frequency-Dependent Bidirectional Modulation of Network Connectivity by Distinct Stimulation Patterns
Based on the preceding analysis of firing synchrony, this study further employed the Louvain algorithm to analyze the functional connectivity patterns of network firing nodes across different trials (Figure 3a), aiming to investigate how electrical stimulation at different frequencies modulates network connectivity. The Louvain algorithm exhibits both high efficiency and accuracy in identifying community structures within large-scale networks[32]。Based on the graph theory approach, this algorithm enables systematic analysis of neuronal clusters on the MEA, classifying and aggregating firing nodes into distinct subnetworks[33].
The analysis results were visualized as shown in Figure 4a, where connecting edges and their colors represent the functional connectivity and firing synchrony between nodes, while the node colors indicate their respective subnetworks. Distinct differences in subnetwork organization and nodes connectivity were observed across trials. This qualitative visualization suggests that the two stimulation paradigms exert clear modulatory effects on network connectivity. We therefore conducted further quantitative analyses to elucidate the specific regulatory influences of each stimulation mode on network connectivity.
We calculated the mean synchrony coefficient and the total number of functional connections among all active nodes in each trial. The results showed that the “Control 1” trial exhibited the lowest average network synchrony. During the “Disrupt” stimulation trials, the average synchrony remained relatively low, whereas in the “Stabilize” stimulation trials, it slightly increased, with a mild positive slope in the linear regression analysis (Figure 4b). As shown in Figure 4a, the number of active nodes remained stable across trials; however, after “Disrupt” stimulation trials, the total number of functional connections between nodes (180.67 ± 4.03) was significantly higher than that observed after “Stabilize” stimulation trials (151.33 ± 1.25) (Figure 4c). This may indicate that during the “Disrupt” trials, the network exhibits lower average firing correlations but a relatively higher number of connections. Such a pattern suggests that this stimulation paradigm weakens the synchrony or stability of functional connectivity and promotes the formation of new, low-correlation connections during network reorganization, thereby disrupting the network structure. In contrast, the “Stabilize” trials are characterized by higher mean firing correlations and fewer connections.
These findings indicate that “Disrupt” and “Stabilize” stimulations modulate network architecture by altering firing synchrony and communication connectivity between nodes. To further evaluate the specific regulatory effects of these two stimulation patterns on network connectivity, we integrated subnetwork information from all trials to construct an overall network representation and quantified network similarity across trials using the Levenshtein edit distance. As a classical sequence alignment algorithm, the Levenshtein distance has significant theoretical and practical value in biological sequence alignment and database similarity analysis[34].
We computed the network similarity between each trial and its preceding trial. Network similarity consistently remained low following each “Disrupt” stimulation, whereas it increased markedly after each “Stabilize” stimulation. Specifically, the mean similarity for “Disrupt” trials was 0.63 ± 0.06, in contrast to the substantially higher similarity of 0.89 ± 0.06 observed in “Stabilize” trials (Figure 4d).
These experimental observations align with established findings on synaptic plasticity regulation: low-frequency stimulation can induce long-term depression (LTD), thereby weakening synaptic connections, and paired stimulation between electrodes sharing common pathways more effectively drives plasticity changes[35]; in contrast, high-frequency and regular synchronous stimulation can significantly strengthen synaptic weights, as previous research has demonstrated that higher firing rates promote both short-term and long-term potentiation of plasticity[36,37]. Building on this theoretical framework, the low-frequency stimulation paradigm used in this study disrupted functional connectivity, whereas the high-frequency paradigm stabilized network connections, achieving bidirectional modulation of in vitro neural network connectivity. Collectively, these results further validate that the in vitro neural model used in this study exhibits frequency-dependent plasticity and demonstrates the potential for learning- and memory-related functions, while also providing an effective strategy and analytical framework for regulating functional connectivity in in vitro neuronal networks.
Figure 4.
Analysis of network functional connectivity. (a) Eight subgraphs correspond to the network communication patterns observed in each trial shown in Figure 3a. In each graph, nodes of different colors represent distinct subnetworks (note that the node colors are used solely to distinguish subnetworks and do not indicate functional attributes; thus, node colors of identical subnetworks may vary across experimental groups). The connecting edges between nodes represent functional connection. (b) Variation trend of the average synchrony coefficient of active nodes across trials. (c) Comparison of the total number of functional edges among active nodes between two stimulation patterns. *** indicates P < 0.001, t-test, n = 3 per group. (d) Comparison of the average network similarity between the two stimulation patterns. ** indicates P < 0.01, t-test, n = 3 per group.
3.4. Rhythmic Stimulation with Varying Intensities Modulates ISI Distribution and Firing Rate and of Network
After the experiments described in Section 2.3 confirmed that the in vitro hippocampal biological BNN exhibits clear frequency-dependent plasticity, we further applied rhythmic brain-like oscillatory electrical stimulation at varying intensities to investigate how the BNN responds under activity patterns that more closely resemble physiological brain dynamics. Following the protocol illustrated in Fig. 5a and described in Section 2.4, the entire in vitro network was subjected to two representative oscillatory stimulation—40 Hz and 7.8 Hz—mimicking the γ and θ rhythms that are critically involved in learning and memory processes. Interspike interval (ISI) analyses were then performed based on the spike sequences recorded from the ten effective electrode nodes in our experiments.
We first conducted a network-level ISI analysis (Figure 5b). At a moderate stimulation intensity of 100-pulse repetition, 40 Hz stimulation markedly increased the concentration of short-interval firing events, indicating enhanced spike synchrony relative to the control. In contrast, under the same stimulation intensity, 7.8 Hz stimulation substantially reduced short-interval firing events to levels lower than the control group. This phenomenon is consistent with frequency-dependent synaptic plasticity theory, wherein higher-frequency stimulation is more likely to induce synchronous network firing (LTP). However, at high stimulation intensities (≥1,000-pulse repetition), the differences in ISI distributions between the two frequencies diminished, and short-interval firing events converged to slow levels.
Further analysis (Figure 5c) showed that at 100-pulse repetition, 40 Hz stimulation elicited substantially more high-density firing events within the 50 ms window compared with the control, whereas 7.8 Hz stimulation produced the opposite effect. As stimulation intensity increased, although 40 Hz stimulation still produced slightly more short-interval spikes than 7.8 Hz stimulation, overall short-interval activity was markedly reduced relative to the control, and the difference between the two frequencies gradually diminished. The firing-rate dynamics displayed a similar trend (Figure 5d).
To determine whether the reduction in short-interval events was solely attributable to an overall decrease in firing rate, we calculated the proportion of spikes occurring within 50 ms intervals (Figure 5e). At 100-pulse repetition, 40 Hz stimulation significantly increased this proportion, whereas 7.8 Hz stimulation reduced it. With increasing stimulation intensity, the difference between the two groups progressively decreased, and both stabilized at relatively low levels.
As shown in Figure 5f, burst spike rate analysis (defined as the ratio of spikes within bursts to total spikes; calculation details provided in Text S4) further revealed that at 100-pulse repetition, 40 Hz stimulation increased the burst spike rate relative to the control, whereas 7.8 Hz stimulation reduced it. At higher stimulation intensities, the burst spike rate under 40 Hz stimulation remained higher than that induced by 7.8 Hz stimulation at the same intensity, but the difference between the two progressively diminished. These results indicate that although high-intensity stimulation substantially suppresses overall network firing, the regulatory differences of the burst activity under different rhythmic stimulation are still influenced by long-term regulation.
Taken together, all these findings demonstrate that under relatively low stimulation intensities, 40 Hz γ-rhythm stimulation more effectively enhances the overall firing rate and short-interval synchronous activity of the neuronal network compared with 7.8 Hz θ-rhythm stimulation, reflecting a characteristic modulation of firing patterns based on frequency-dependent plasticity. However, during prolonged rhythmic stimulation, the modulatory differences between the two frequencies diminish at the network level and eventually converge.
Figure 5.
Characteristics of network firing dynamics under rhythmic stimulation of different intensities. (a) Schematic of rhythmic electrical stimulation modulation experiment: Yellow lightning indicates γ-band (40 Hz) stimulation, while green lightning indicates θ-band (7.8 Hz) stimulation, both applied synchronously to all electrode sites of the in vitro network. The two rhythmic stimulation trials were alternated, with stimulation intensity progressively increased by adjusting the pulses repetition per trial from 100 times to 1,000 and then to 10,000. (b) Joint ISI distributions under various frequencies and intensities of rhythmic stimulation. (c) Boxplots showing the count of neural spikes occurring within a 50 ms window based on the joint ISI distribution. (d) Boxplot of firing rate in each trial. (e) Boxplot of proportion of firing events within 50 ms relative to the total events in each trial. (f) Boxplot showing the proportion of spikes that occur within bursts relative to all detected spikes (burst spike rate).
3.5. Adaptive Suppression of Network Synchrony Activity Under Prolonged Rhythmic Stimulation
Firing synchrony is a key metric for characterizing the regulatory effects of synaptic plasticity. Accordingly, using the same correlation-based analytical framework described in Section 3.2, we quantitatively assessed the level of spike-train synchrony within the network under rhythmic electrical stimulation of varying intensities. As shown in the heatmaps in Figure 6a, the neuronal cultures developed in vitro for 21 days had already formed relatively stable synaptic connectivity patterns; therefore, under spontaneous activity in the absence of external stimulation (Control trial), active nodes exhibited a baseline level of synchronous firing. Following 40 Hz stimulation with 100-pulse repetition, synchrony among several key nodes was slightly enhanced relative to the control group, and the overall synchronization level remained comparable to that of the Control trial. In contrast, 7.8 Hz stimulation at the same intensity markedly reduced network synchrony, with a visible decrease in the number of nodes exhibiting synchronous firing. When the stimulation intensity increased to 1,000-pulse repetition, 40 Hz stimulation continued to induce higher synchrony than 7.8 Hz, although the synchrony level was lower than that under the 100-pulse repetition condition. Further increasing the intensity to 10,000 repetitions resulted in uniformly low synchrony for both stimulation frequencies, with no significant difference between them.
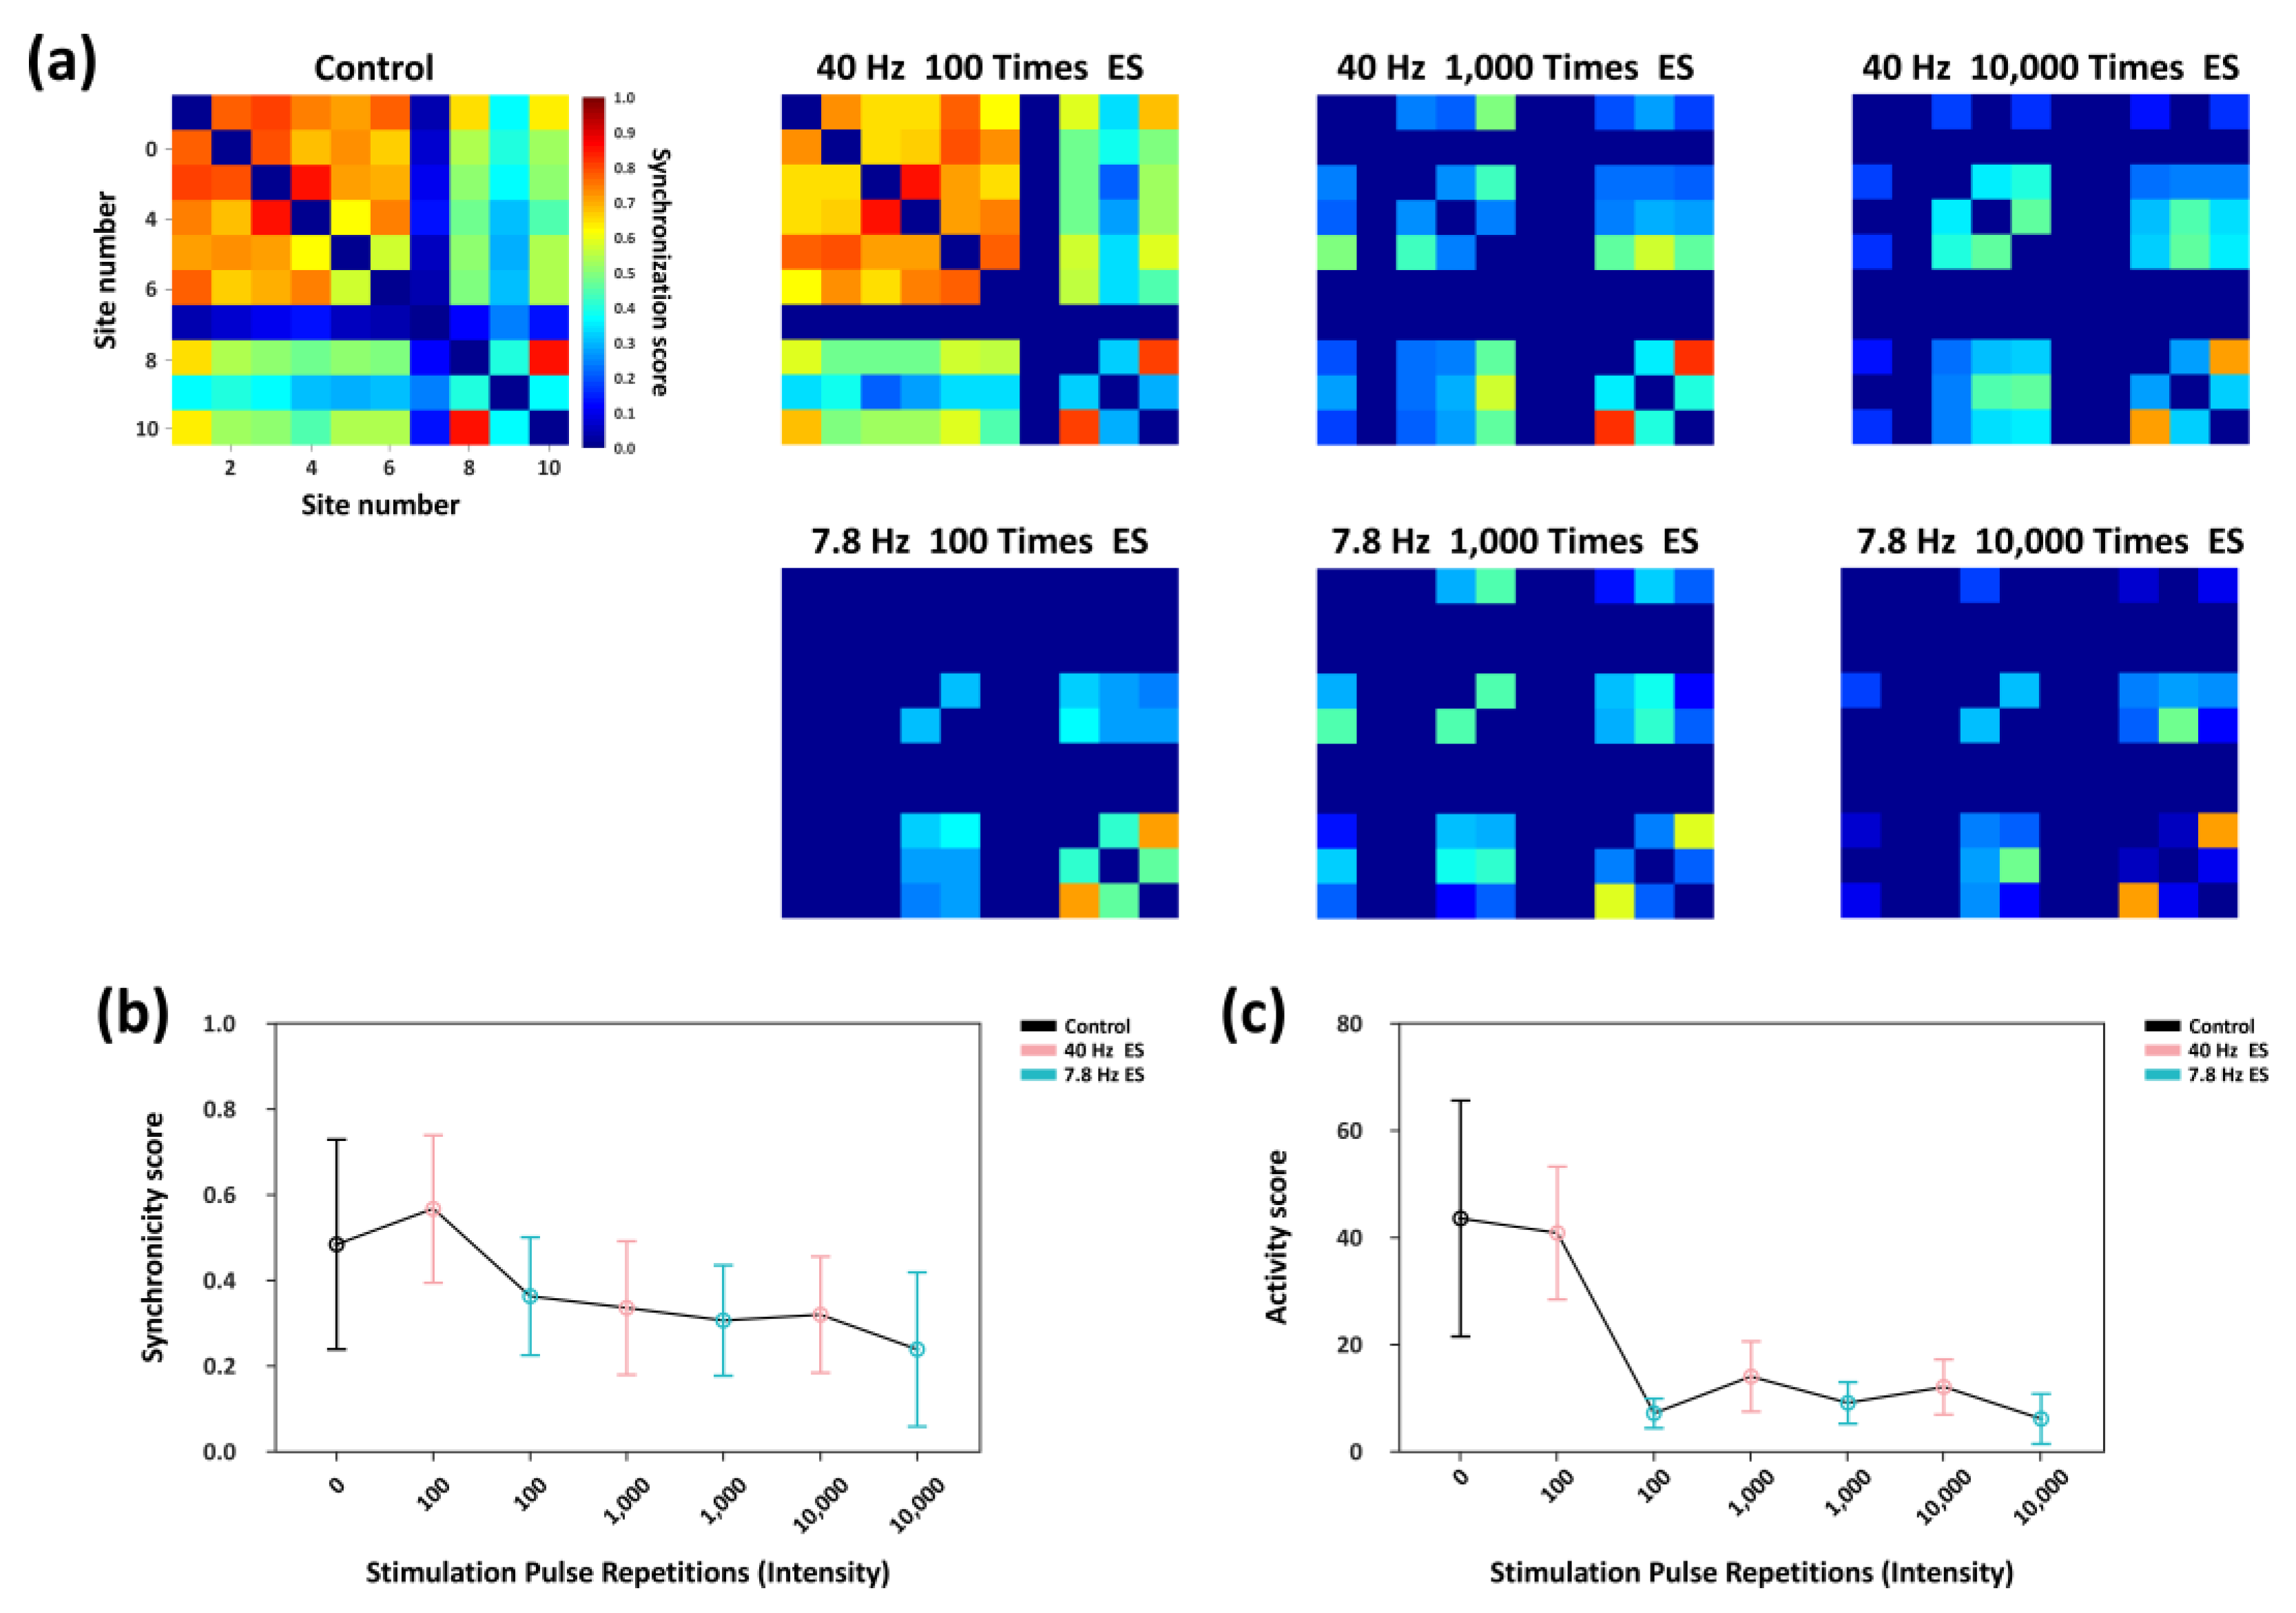
Figure 6.
Network synchronization characteristics under rhythmic electrical stimulation of different intensities. (a) Heatmaps illustrating the firing synchrony among active nodes across experimental trials. (b) Variations in the average firing synchrony between active nodes under different stimulation conditions. (c) Changes in the network synchronization activity in each trial, defined as the product of the number of effective connecting edges and their mean connection weight.
Figure 6b summarizes the changes in the average synchronization coefficient across effective nodes. Under 100 repetitions, 40 Hz stimulation significantly enhanced inter-node synchrony relative to the control condition, whereas 7.8 Hz stimulation reduced it. As stimulation intensity increased, the frequency-dependent difference in synchrony between the two stimulation conditions progressively diminished, and the overall synchronization level continued to decline. These results indicate that high-intensity rhythmic stimulation not only suppresses global network synchrony but also substantially attenuates the intrinsic frequency-dependent regulatory differences observed between 40 Hz and 7.8 Hz stimulation.
In addition, we defined a network synchronization activity index as the product of the total number of functional connections and their average synchronization coefficient. As shown in Figure 6c, at a stimulation intensity of 100 repetitions, 40 Hz stimulation produced no significant effect on this metric relative to the control trial, whereas 7.8 Hz stimulation produced a marked reduction. Although 40 Hz stimulation consistently yielded higher synchronization activity than 7.8 Hz across all stimulation intensities, the difference between the two decreased with increased intensity, and both remained at low levels.
Taken together, these findings demonstrate that rhythmic stimulation at 40 Hz and 7.8 Hz exerts distinct frequency-dependent regulation effects on network synchrony. However, under high-intensity, long-duration stimulation, this frequency dependence is markedly suppressed, and the overall level of network synchronization remained low.
4. Discussion
In this study, a 60-channel microelectrode array was fabricated based on MEMS technology, and platinum nanoparticles were electrodeposited onto the electrode surface using a two-electrode configuration (Figure 2a–c). This surface modification markedly reduced electrode impedance and phase delay, thereby improving the electrical performance of the MEA (Figure 2d–g).
Based on this platform, we first conducted electrical stimulation experiments at different frequencies to hippocampal neuronal networks cultured in vitro for 21 days. Low-frequency stimulation pattern significantly decreased network structural similarity before and after stimulation, indicating disruption of pre-existing functional connections. In contrast, high-frequency stimulation pattern maintained higher structural similarity, suggesting an enhancement of synaptic weights and stabilization of functional connectivity (Figure 4). These findings demonstrate that the in vitro neuronal network exhibits frequency-dependent plasticity, with different stimulation frequencies exerting bidirectional regulatory effects on network connectivity. This finding provides foundation for the subsequent experiments and offers new insights on network modulation strategies based on frequency-dependent plasticity and their corresponding analytical methodologies within the field of Synthetic Biological Intelligence (SBI)[19].
Furthermore, we investigated the regulation effects of biologically relevant rhythmic stimulation on the frequency-dependent plasticity of the in vitro neuronal network (Figure 5,Figure 6). Stimulation experiments with intensities of 100, 1,000, and 10,000-pulse repetition were conducted respectively. In each group of experiments, synchronous stimulation at 40 Hz and 7.8 Hz was applied to simulate the γ and θ rhythms within the brain. The analysis revealed that under low-intensity stimulation (100 repetitions), 40 Hz stimulation markedly enhanced burst activity and firing synchrony within the network, whereas 7.8 Hz stimulation produced the opposite effect, demonstrating a clear frequency-dependent plasticity regulation. However, under higher-intensity, prolonged rhythmic stimulation (≥1,000 repetitions), this frequency-dependent modulation was substantially attenuated, with overall network synchrony reduced and the differences of regulation effects between the two frequencies no longer significant.
Notably, this inhibitory effect was more pronounced under 40 Hz stimulation, suggesting a mechanism that prevents the network from sustaining a prolonged high-synchrony state. In contrast, 7.8 Hz stimulation reduced synchrony even at low intensities, resulting in weaker long-term effects. This phenomenon implies that during long-term rhythmic modulation, in vitro neuronal networks may exhibit a homeostatic balance mechanism to prevent excessive or persistent synchronous firing activity. Previous studies have reported that in the brain, memory processes often display a “γ-nested-in-θ” rhythmic pattern, where moderate inhibition and rebound recovery help prevent overexcitation and support stable memory ensemble formation[38]. Therefore, in long-term modulation experiments of in vitro neuronal networks, adopting multi-frequency alternating or nested stimulation paradigms—analogous to the brain’s intrinsic balance mechanism—may enable more efficient and stable network regulation.
This study primarily analyzed the regulatory effects of different stimulation patterns from the perspective of network electrophysiological activity. Future work may combine electrochemical detection techniques to investigate neurotransmitter dynamics under varying stimulation patterns, thereby elucidating the multi-level mechanisms underlying stimulation-induced plasticity. The present findings indicate that different rhythmic stimulation frequencies exhibit distinct inhibitory modulation effects during long-term regulation: high-intensity 40 Hz stimulation induced a significant inhibitory balancing effect, whereas long-term 7.8 Hz stimulation produced a much weaker response. This suggests that the stimulation intensity threshold required to achieve inhibitory balance may vary across frequencies. Systematic exploration across a broader range of frequency–intensity combinations will thus be essential to uncover the principles and boundary conditions of frequency- and intensity-dependent homeostatic mechanisms.
Moreover, as oscillatory frequency bands vary considerably among species[39,40], future studies on functional modulation of in vitro neuronal networks should account for species-specific rhythmic characteristics and stimulation intensity dependence. Establishing a cross-frequency and cross-intensity rhythmic modulation framework will enable more precise and stable regulation of in vitro neuronal network functionality.
5. Conclusions
This study first demonstrates the response characteristics of in vitro cultured hippocampal biological neuronal networks on a multichannel microelectrode array under electrical stimulation at different frequencies, revealing a pronounced frequency-dependent plasticity modulation pattern: high-frequency stimulation effectively stabilized and strengthened the functional connectivity of network, whereas low-frequency stimulation exerts a disruptive effect. These findings confirm that the in vitro neuronal model possesses frequency-dependent plasticity regulatory capabilities, providing a mechanistic basis for learning and memory functions, and offering effective approaches for regulating and analyzing functional connectivity in biological neuronal networks.
Building on these results, subsequent rhythmic-stimulation experiments demonstrated that the network firing modulation effects mediated by frequency-dependent plasticity under different rhythms are progressively diminished with increasing stimulation intensity, resulting in an insignificant difference in regulation effect. These findings suggest the existence of an intrinsic homeostatic regulatory mechanism within in vitro neuronal networks, which suppresses frequency-dependent plasticity to prevent the network from entering states of sustained hypersynchrony or hyperexcitability, thereby maintaining a balanced and efficient functional steady state.
Taken together, this study not only elucidates the fundamental frequency-dependent plasticity rules governing in vitro hippocampal neuronal networks but also uncovers an adaptive homeostatic mechanism underlying their responses to rhythmic modulation. These findings provide experimental evidence for understanding the regulatory principles that support learning and memory processes in in vitro neuronal systems and establishes a theoretical foundation for developing cross-frequency and cross-intensity plasticity modulation strategies.
Supplementary Materials
Figure S1. Fabrication process of in vitro multi-channel microelectrode arrays. Figure S2 Heatmaps of spike synchrony in network under low- and high-frequency electrical stimulation trials. Table S1 Experimental paradigm for network connectivity modulation under different stimulation frequencies. Table S2 Experimental paradigm for modulation of network firing patterns by rhythmic electrical stimulation. Text S1 Details of Platinum Nanoparticles (PtNPs) modification. Text S2 Details of mice hippocampal tissue isolation and neuronal culture. Text S3 Algorithm for neuronal firing synchrony coefficient. Text S4 Algorithm for burst staFtistics.
Acknowledgments
This work was sponsored by the National Natural Science Foundation of China (Nos. 62121003, T2293730, T2293731, 62171434, 62333020, 62471291), the National Key Research and Development Program of China (Nos. 2022YFC2402501, 2022YFB3205602), the Major Program of Scientific and Technical Innovation 2030 (No. 2021ZD02016030), the Joint Foundation Program of the Chinese Academy of Sciences (No. 8091A170201), the Scientific, Instrument Developing Project of the Chinese Academy of Sciences (No. PTYQ2024BJ0009).
References
- Abbott, L.F.; Nelson, S.B. Synaptic plasticity: Taming the beast. Nature neuroscience 2000, 3, 1178–1183. [Google Scholar] [CrossRef]
- Chen, Z.; Liang, Q.; Wei, Z.; et al. An overview of in vitro biological neural networks for robot intelligence. Cyborg and Bionic Systems 2023, 4, 0001. [Google Scholar] [CrossRef]
- Zarnadze, S.; Bäuerle, P.; Santos-Torres, J.; et al. Cell-specific synaptic plasticity induced by network oscillations. Elife 2016, 5, e14912. [Google Scholar] [CrossRef]
- Ter Wal, M.; Linde-Domingo, J.; Lifanov, J.; et al. Theta rhythmicity governs human behavior and hippocampal signals during memory-dependent tasks. Nature communications 2021, 12, 7048. [Google Scholar] [CrossRef]
- Abubaker, M.; Al Qasem, W.; Pilátová, K.; et al. Theta-gamma-coupling as predictor of working memory performance in young and elderly healthy people. Molecular Brain 2024, 17, 74. [Google Scholar] [CrossRef]
- Bocchio, M.; Nabavi, S.; Capogna, M. Synaptic plasticity, engrams, and network oscillations in amygdala circuits for storage and retrieval of emotional memories. Neuron 2017, 94, 731–743. [Google Scholar] [CrossRef] [PubMed]
- Zhang, T. Neural oscillations and information flow associated with synaptic plasticity. Sheng li xue bao:[Acta physiologica Sinica] 2011, 63, 412–422. [Google Scholar] [PubMed]
- Chao, Z.C.; Bakkum, D.J.; Wagenaar, D.A.; et al. Effects of random external background stimulation on network synaptic stability after tetanization: A modeling study. Neuroinformatics 2005, 3, 263–280. [Google Scholar] [CrossRef] [PubMed]
- Wei, Z.; Sun, T.; Shimoda, S.; et al. Bio-inspired engineering of a perfusion culture platform for guided three-dimensional nerve cell growth and differentiation. Lab on a Chip 2022, 22, 1006–1017. [Google Scholar] [CrossRef]
- Marom, S.; Shahaf, G. Development, learning and memory in large random networks of cortical neurons: Lessons beyond anatomy. Quarterly reviews of biophysics 2002, 35, 63–87. [Google Scholar] [CrossRef]
- Jimbo, Y.; Kasai, N.; Torimitsu, K.; et al. A system for MEA-based multisite stimulation. IEEE transactions on biomedical engineering 2003, 50, 241–248. [Google Scholar] [CrossRef]
- Martinoia, S.; Bonzano, L.; Chiappalone, M.; et al. In vitro cortical neuronal networks as a new high-sensitive system for biosensing applications. Biosensors and Bioelectronics 2005, 20, 2071–2078. [Google Scholar] [CrossRef] [PubMed]
- Caporale, N.; Dan, Y. Spike timing–dependent plasticity: A Hebbian learning rule. Annu. Rev. Neurosci. 2008, 31, 25–46. [Google Scholar] [CrossRef] [PubMed]
- Bliss, T.V.P.; Lømo, T. Long-lasting potentiation of synaptic transmission in the dentate area of the anaesthetized rabbit following stimulation of the perforant path. The Journal of physiology 1973, 232, 331–356. [Google Scholar] [CrossRef] [PubMed]
- Linden, D.J. Long-term synaptic depression in the mammalian brain. Neuron 1994, 12, 457–472. [Google Scholar] [CrossRef]
- Dura-Bernal, S.; Zhou, X.; Neymotin, S.A.; et al. Cortical spiking network interfaced with virtual musculoskeletal arm and robotic arm. Frontiers in neurorobotics 2015, 9, 13. [Google Scholar] [CrossRef]
- Azimirad, V.; Ramezanlou, M.T.; Shahabi, P. Learning of 2 dof robotic arm using integrated architecture of neural network and spike timing dependent plasticity[C]//2018 6th RSI International Conference on Robotics and Mechatronics (IcRoM). IEEE, 2018: 126-129.
- Chao, Z.C.; Bakkum, D.J.; Potter, S.M. Shaping embodied neural networks for adaptive goal-directed behavior. PLoS computational biology 2008, 4, e1000042. [Google Scholar] [CrossRef]
- Kagan, B.J.; Kitchen, A.C.; Tran, N.T.; et al. In vitro neurons learn and exhibit sentience when embodied in a simulated game-world. Neuron 2022, 110, 3952–3969. [Google Scholar] [CrossRef]
- Shahaf, G.; Marom, S. Learning in networks of cortical neurons. Journal of Neuroscience 2001, 21, 8782–8788. [Google Scholar] [CrossRef]
- Masumori, A.; Maruyama, N.; Sinapayen, L.; et al. Emergence of sense-making behavior by the stimulus avoidance principle: Experiments on a robot behavior controlled by cultured neuronal cells[C]//Artificial Life Conference Proceedings. One Rogers Street, Cambridge, MA 02142-1209, USA journals-info@ mit. edu: MIT Press, 2015: 373-380.
- Ibarra-Lecue, I.; Haegens, S.; Harris, A.Z. Breaking down a rhythm: Dissecting the mechanisms underlying task-related neural oscillations. Frontiers in Neural Circuits 2022, 16, 846905. [Google Scholar] [CrossRef]
- Massobrio, P.; Tessadori, J.; Chiappalone, M.; et al. In vitro studies of neuronal networks and synaptic plasticity in invertebrates and in mammals using multielectrode arrays. Neural plasticity 2015, 2015, 196195. [Google Scholar] [CrossRef]
- Nyhus, E.; Curran, T. Functional role of gamma and theta oscillations in episodic memory. Neuroscience & Biobehavioral Reviews 2010, 34, 1023–1035. [Google Scholar] [CrossRef]
- Tamura, M.; Spellman, T.J.; Rosen, A.M.; et al. Hippocampal-prefrontal theta-gamma coupling during performance of a spatial working memory task. Nature communications 2017, 8, 2182. [Google Scholar] [CrossRef]
- He, E.; Zhou, Y.; Luo, J.; et al. Sensitive detection of electrophysiology and dopamine vesicular exocytosis of hESC-derived dopaminergic neurons using multifunctional microelectrode array. Biosensors and Bioelectronics 2022, 209, 114263. [Google Scholar] [CrossRef] [PubMed]
- Zhang, K.; Deng, Y.; Liu, Y.; et al. Investigating Communication Dynamics in Neuronal Network using 3D Gold Microelectrode Arrays. ACS Nano 2024. [Google Scholar] [CrossRef] [PubMed]
- Xiao, G.; Xu, S.; Song, Y.; et al. In situ detection of neurotransmitters and epileptiform electrophysiology activity in awake mice brains using a nanocomposites modified microelectrode array. Sensors and Actuators B: Chemical 2019, 288, 601–610. [Google Scholar] [CrossRef]
- Ray, J.; Peterson, D.A.; Schinstine, M.; et al. Proliferation, differentiation, and long-term culture of primary hippocampal neurons. Proceedings of the National Academy of Sciences 1993, 90, 3602–3606. [Google Scholar] [CrossRef]
- Cano-Jaimez, M.; Tagliatti, E.; Mendonca, P.R.F.; et al. Preparation of dissociated mouse primary neuronal cultures from long-term cryopreserved brain tissue. Journal of Neuroscience Methods 2020, 330, 108452. [Google Scholar] [CrossRef]
- Wagenaar, D.A.; Pine, J.; Potter, S.M. Searching for plasticity in dissociated cortical cultures on multi-electrode arrays. Journal of negative results in biomedicine 2006, 5, 16. [Google Scholar] [CrossRef]
- Blondel, V.D.; Guillaume, J.L.; Lambiotte, R.; et al. Fast unfolding of communities in large networks. Journal of statistical mechanics: Theory and experiment 2008, 2008, P10008. [Google Scholar] [CrossRef]
- Lam, D.; Enright, H.A.; Cadena, J.; et al. Tissue-specific extracellular matrix accelerates the formation of neural networks and communities in a neuron-glia co-culture on a multi-electrode array. Scientific reports 2019, 9, 4159. [Google Scholar] [CrossRef]
- Berger, B.; Waterman, M.S.; Yu, Y.W. Levenshtein distance, sequence comparison and biological database search. IEEE transactions on information theory 2020, 67, 3287–3294. [Google Scholar] [CrossRef]
- Li, S.; Liu, Y.; Hua, S.; et al. Advanced Brain-on-a-Chip for Wetware Computing: A Review. Advanced Science 2025, 12, e08120. [Google Scholar] [CrossRef] [PubMed]
- Zhu, G.; Liu, Y.; Wang, Y.; et al. Different patterns of electrical activity lead to long-term potentiation by activating different intracellular pathways. Journal of Neuroscience 2015, 35, 621–633. [Google Scholar] [CrossRef] [PubMed]
- Pariz, A.; Esfahani, Z.G.; Parsi, S.S.; et al. High frequency neurons determine effective connectivity in neuronal networks. Neuroimage 2018, 166, 349–359. [Google Scholar] [CrossRef] [PubMed]
- Li, K.T.; He, X.; Zhou, G.; et al. Rational designing of oscillatory rhythmicity for memory rescue in plasticity-impaired learning networks. Cell Reports 2022, 39. [Google Scholar] [CrossRef]
- Watrous, A.J.; Lee, D.J.; Izadi, A.; et al. A comparative study of human and rat hippocampal low-frequency oscillations during spatial navigation. Hippocampus 2013, 23, 656–661. [Google Scholar] [CrossRef]
- Jacobs, J. Hippocampal theta oscillations are slower in humans than in rodents: Implications for models of spatial navigation and memory. Philosophical Transactions of the Royal Society B: Biological Sciences 2014, 369, 20130304. [Google Scholar] [CrossRef]
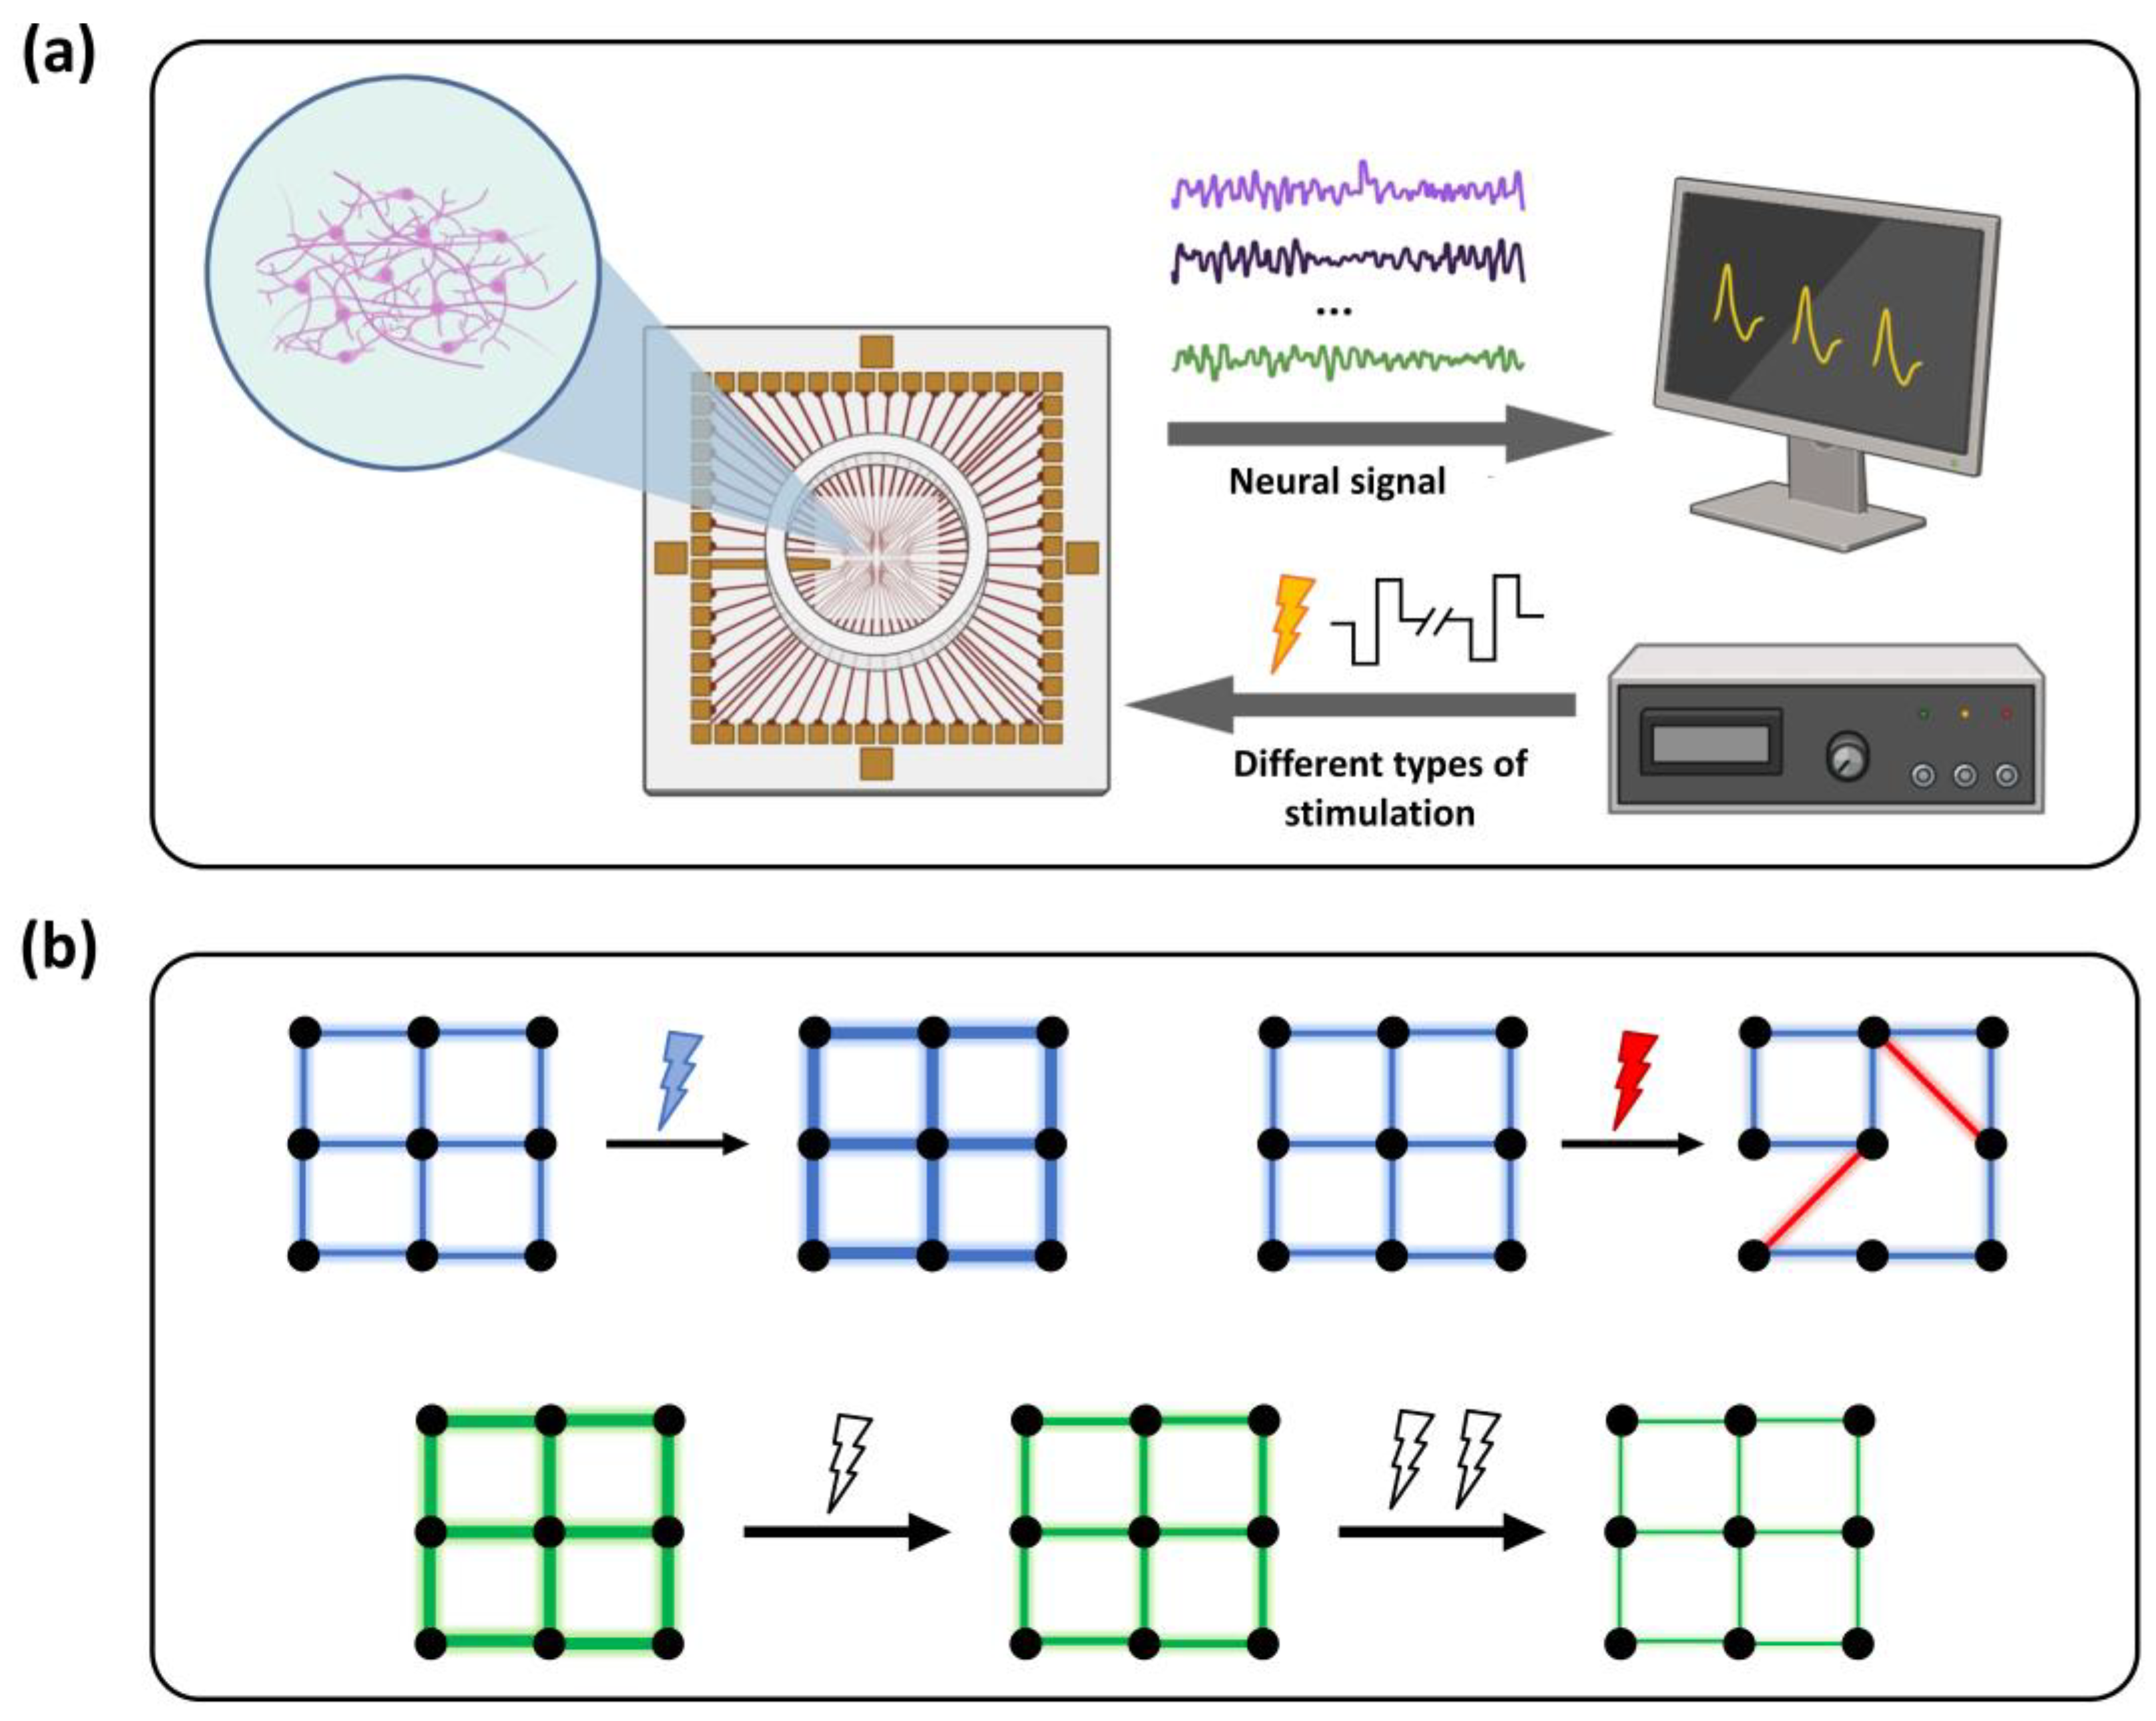
Figure 1.
Schematic diagram of the in vitro neuronal networks platform and electrical stimulation protocol. (a) Electrophysiological detection and electrical stimulation platform based on an in vitro microelectrode array (MEA). Hippocampal neurons were cultured in the medium within the circular area of the MEA surface. (b) Experimental scheme of electrical stimulation. The first row illustrates the regulatory effects of high- and low-frequency electrical stimulation on network functional connectivity, corresponding to network stabilization and disruption, respectively. The second row depicts the modulation of neuronal firing patterns under rhythmic stimulation of different intensities. As the stimulation intensity increases, the overall network activity gradually decreases, exhibiting an adaptive inhibitory response.
Disclaimer/Publisher’s Note: The statements, opinions and data contained in all publications are solely those of the individual author(s) and contributor(s) and not of MDPI and/or the editor(s). MDPI and/or the editor(s) disclaim responsibility for any injury to people or property resulting from any ideas, methods, instructions or products referred to in the content. |
© 2025 by the authors. Licensee MDPI, Basel, Switzerland. This article is an open access article distributed under the terms and conditions of the Creative Commons Attribution (CC BY) license (http://creativecommons.org/licenses/by/4.0/).
Copyright: This open access article is published under a Creative Commons CC BY 4.0 license, which permit the free download, distribution, and reuse, provided that the author and preprint are cited in any reuse.


