
Submitted:
26 November 2025
Posted:
27 November 2025
You are already at the latest version
Abstract
Shopping centers are significant traffic generators that influence traffic conditions on adjacent road networks. This study evaluates the impact of the Big Fashion shopping center in Novi Sad, Serbia, on two nearby signalized intersections and examines the effectiveness of reconstructing one of them into a turbo roundabout. Traffic counts conducted before (2015) and after (2020) the opening of the shopping center indicate notable increases in peak-hour traffic volumes: 8.38% at the Bulevar cara Lazara–Bulevar oslobođenja intersection and 6.96% at the Bulevar cara Lazara–Fruškogorska Street intersection. The increased demand contributed to higher delays and deteriorated levels of service. In 2023, the latter intersection was reconstructed into the region’s first turbo roundabout. Microsimulation (Synchro 11) using pre-reconstruction volumes revealed substantial operational improvements, including a reduction in the most critical left-turn delay from 165.5 s/veh to 11.9 s/veh. The results confirm that turbo roundabouts can effectively mitigate congestion and enhance intersection performance in urban environments with high directional turning movements.
Keywords:
turbo roundabout
; shopping center
; traffic impact assessment
; delay
; intersection performance
1. Introduction
Urban areas have experienced continuous increases in private car use, leading to higher traffic volumes, longer travel times, and reduced safety. These impacts highlight the importance of assessing how new developments influence the transport network. Intersections represent critical control points within this system, where capacity is reduced due to the interaction of conflicting flows. When demand approaches or exceeds capacity, delays rise rapidly, degrading the level of service.
With the expansion of commercial developments, particularly large shopping centers, traffic impacts have become an essential consideration in urban planning. Traffic Impact Assessment (TIA) is now a standard tool used to evaluate whether existing infrastructure can accommodate additional demand and to determine appropriate mitigation measures.
Turbo roundabouts are increasingly used as innovative alternatives to conventional two-lane roundabouts and signalized intersections. Developed to improve both safety and operational efficiency, they incorporate physically separated lanes that guide vehicles along predetermined paths. Drivers must select their exit lane before entering the roundabout, and due to the physical separation, this decision cannot be changed afterward [1]. This design minimizes conflict points and facilitates more efficient vehicle movement through the intersection. Additionally, turbo roundabouts often include supplementary channelization elements that help regulate vehicle speeds. Due to these advantages, turbo roundabouts are increasingly being considered as an optimal solution for improving traffic conditions in urban environments.
With the intensification of urban development and the reduction of public resources, assessing the traffic impacts of new projects has become an essential component of planning practice. Contemporary urban development projects routinely require comprehensive Traffic Impact Assessments (TIA) to evaluate how a proposed facility will affect traffic conditions and to identify appropriate mitigation measures. A TIA determines whether the existing transport network can accommodate the additional demand and recommends measures—such as road widening, intersection reconstruction, or the provision of new pedestrian and bicycle infrastructure—to minimize adverse effects.
This study investigates the impact of the Big Fashion shopping center in Novi Sad, Serbia, on the operation of two adjacent intersections. Furthermore, the reconstruction of one of these intersections into a turbo roundabout in 2023 provided an opportunity to evaluate its effectiveness under real-world traffic conditions. Microsimulation was employed to assess whether the new design delivers measurable operational benefits compared to the former signalized configuration
2. Literature Review
Land use refers to the activities carried out within a specific spatial area. Each type of land use generates a certain number of trips involving people or goods, which generates demand on the urban traffic network [2]. Numerous studies have analyzed the relationship between land use and traffic [3,4,5,6]. Although different methodological approaches and a certain degree of disagreement exist regarding causal relationships, the fundamental principle – that land use significantly influences the attractiveness of a location and the volume of generated trips – is widely accepted among researchers [3,4,5].
Changes in land use often lead to an increase in generated trips, which is reflected in the intensity of human and freight movement, and consequently in overall traffic volumes. Such changes can impose additional pressure on the existing transport infrastructure, particularly through the emergence of traffic congestion, a higher number of traffic accidents, and reduced efficiency of roadways that carry traffic volumes exceeding those originally planned [6].
A particular challenge in this context is represented by shopping centers, which function as all-day attraction zones [8]. Shopping centers are often visited by large numbers of people because of the wide range of products and services provided by the different retail outlets. The desirability of a location to users directly correlates with its impact on traffic flows [7]. Consequently, the construction of such facilities often requires additional infrastructural interventions in their immediate surroundings to ensure optimal traffic flow conditions.
An innovative solution increasingly applied in areas with high traffic volumes is the turbo roundabout, which serves as an alternative to conventional two-lane roundabouts. Turbo roundabouts were developed in 1996 by the Dutch engineer Fortuijn, whose goal was to design a roundabout with equal or higher capacity than a traditional two-lane roundabout, while maintaining the safety characteristics of a single-lane roundabout [9].
Over the past two decades, numerous studies have examined the performance characteristics of turbo roundabouts [10,11,12,13,14,15,16,17,18]. The majority of research shows their superiority in terms of traffic safety. One of the key features of these intersections is the presence of physical separators that prevent lane changing within the roundabout and clearly define vehicle trajectories. As a result, the number of conflict points is reduced from 24 (in standard two-lane roundabouts) to 14, thereby enhancing traffic safety [11]. Previous analyses using Petri Nets showed that turbo roundabouts, due to their reduced number of possible maneuvers and restricted lane changes, exhibit lower complexity and a higher level of traffic safety compared to conventional roundabouts [12]. Cruz et al. (2021) conducted an analysis comparing the safety performance of an existing two-lane roundabout and a proposed turbo roundabout designed for the same intersection. According to the findings of the study, which were based on simulations performed in VISSIM and analyses conducted in SSAM, turbo roundabouts exhibit 72% fewer conflicts compared to conventional two-lane roundabouts [14].
However, there is still a lack of consensus among researchers regarding the capacity of these intersections. A comparative analysis of capacity and safety characteristics between standard and turbo roundabouts on a complex urban roadway in eastern Sicily was conducted using simulation models developed in AIMSUN and SSAM. The results indicated that turbo roundabouts are more efficient than conventional ones, but primarily under conditions of heavy traffic. Under low and medium traffic volumes, multi-lane roundabouts may offer higher capacity [13]. One study analyzed the capacity and safety characteristics of four innovative roundabout types: turbo, flower, target, and four-flyover. The findings indicate that turbo roundabouts achieve optimal performance when the majority of traffic flows make right turns [15]. Similarly, a study analyzed the capacity of turbo roundabouts compared with single-lane and two-lane roundabouts. The findings suggested that turbo roundabouts provide higher capacity than two-lane roundabouts when the proportion of right-turning traffic on minor approaches exceeds 60% [16]. Another study compared the operational performance of three intersections located along the most congested arterial road in Ohrid – two signalized and one controlled by a STOP sign –with newly designed turbo roundabouts. The study demonstrated that turbo roundabouts generally deliver better operational performance than existing intersections [17]. A comparison of turbo and two-lane roundabouts based on Sarajevo traffic parameters showed that turbo roundabouts achieve better overall performance, particularly in terms of capacity on minor approaches [11]. A recent study using a virtual reconstruction of an existing multi-lane roundabout into a turbo roundabout demonstrated potential improvements in traffic capacity, safety, and aesthetics. The study also found that vehicle emissions could be reduced by up to 44% in the surrounding area and 23% within the intersection itself. These findings indicate that turbo roundabouts are an efficient and environmentally sustainable solution for urban intersection design [18].
The reviewed studies indicate that the capacity of turbo roundabouts largely depends on prevailing traffic conditions. Therefore, their advantages in this regard are not universal but are case-specific.
3. Methodology
The research methodology consisted of four primary stages: (1) selecting study intersections, (2) collecting traffic data, (3) conducting traffic flow simulations, and (4) performing comparative analysis (Figure 1).
3.1. Study Area and Intersection Selection
The study was conducted in the vicinity of a shopping center in the broader city center of Novi Sad. Positioned at the intersection of major urban roads, the center officially opened to the public in 2018. The shopping center has a total built-up area of 150,000 square meters, ranking it as the third largest in Serbia. Prior to its construction, the site was occupied by tennis courts and green spaces. Two intersections were selected due to their proximity to the facility and their role in accommodating access-related traffic.
- R1: Bulevar cara Lazara–Bulevar oslobođenja, a four-leg signalized intersection.
- R2: Bulevar cara Lazara–Fruškogorska Street, initially a three-leg signalized intersection and reconstructed as a turbo roundabout in 2023.
The shopping center is accessible via two access points, and both intersections accommodate movements directly connected to these access routes (Figure 2). The analyzed intersections are located within one of the most attractive urban zones of the city, which also includes several other major traffic generators. Consequently, traffic volumes at these intersections were relatively high even before the construction of the shopping center.
Intersection R1 is a standard four-leg at-grade intersection where Bulevar cara Lazara and Bulevar oslobođenja intersect (Figure 3a). Traffic at this intersection is regulated by traffic signals, with Bulevar oslobođenja representing the major road. The carriageway on each approach consists of two lanes in each direction, physically separated by a median island. Each approach includes four entry lanes and three exit lanes, with lane functions clearly defined by pavement markings (Figure 3b).
At Intersection R2, Bulevar cara Lazara intersects with Fruškogorska Street. Prior to reconstruction, the intersection was a three-leg, signalized junction (Figure 4a), with Bulevar cara Lazara serving as the major road. In June 2023, the reconstruction was finalized, and the intersection was converted into a turbo roundabout (Figure 4b). The upgraded roundabout consists of three approaches. The entry sections of the western and eastern approaches each include three lanes, while the southern approach contains two entry lanes. The movement of traffic streams is clearly defined by horizontal pavement markings and vertical traffic signs.
3.2. Data Collection
Traffic counts were conducted in 2015, 2020, 2022, and 2023 using manual observations at 15-minute intervals. Counts from 2015 and 2020 were used to assess the impact of the shopping center’s opening, while the 2022 and 2023 counts were used to evaluate the operational performance of the turbo roundabout.
The shopping center opened in December 2018. To assess its impact on traffic flow, counts were taken before its construction (2015) and after (2020). The 2015 counts were carried out on April 23 during three time intervals: 7:00–10:00, 13:00–16:00, and 18:00–21:00. The 2020 counts were conducted on June 25, from 3:00 p.m. to 4:00 p.m. at Intersection R1 and from 4:00 p.m. to 5:00 p.m. at Intersection R2. Flow values were expanded using available 24-hour traffic data from 2019.
To analyze the operational efficiency of the turbo roundabout, traffic counts collected at Intersection R2 in November 2022 (pre-construction) and November 2023 (post-construction) were used. The 2023 count was conducted between 2:00 p.m. and 4:00 p.m.
3.3. Traffic Flow Simulation
Traffic operations were evaluated using Synchro 11. To ensure the model accurately reflects real-world traffic conditions, a model calibration was conducted. The input data for the simulation included field-collected traffic data, as well as detailed geometric characteristics of the intersections and information regarding the traffic control schemes implemented at the study sites.
Performance metrics included average vehicle delay, level of service (LOS), volume-to-capacity (v/c) ratio, and estimated operating speeds. The Highway Capacity Manual (HCM) methodology was applied.
3.4. Data Analysis
The data analysis was based on the results of field measurements and simulation models. The traffic count data enabled a comparative assessment of traffic volumes before and after the construction of the shopping center, as well as before and after the reconstruction of Intersection R2 into a turbo roundabout. These data also served as input parameters for the simulation.
Comparisons were made for:
- –
- traffic volumes before and after the shopping center opened,
- –
- delays and LOS values before and after reconstruction, and
- –
- the performance of the turbo roundabout under identical traffic conditions.
4. Results
A comparative analysis of traffic data collected in 2015 and 2020 revealed a measurable increase in traffic volumes following the opening of the Big Fashion shopping center. The increase was evident at both analyzed intersections and was observed on a daily basis as well as during peak-hour conditions.
4.1. Intersection R1: Traffic Volumes and Operational Performance
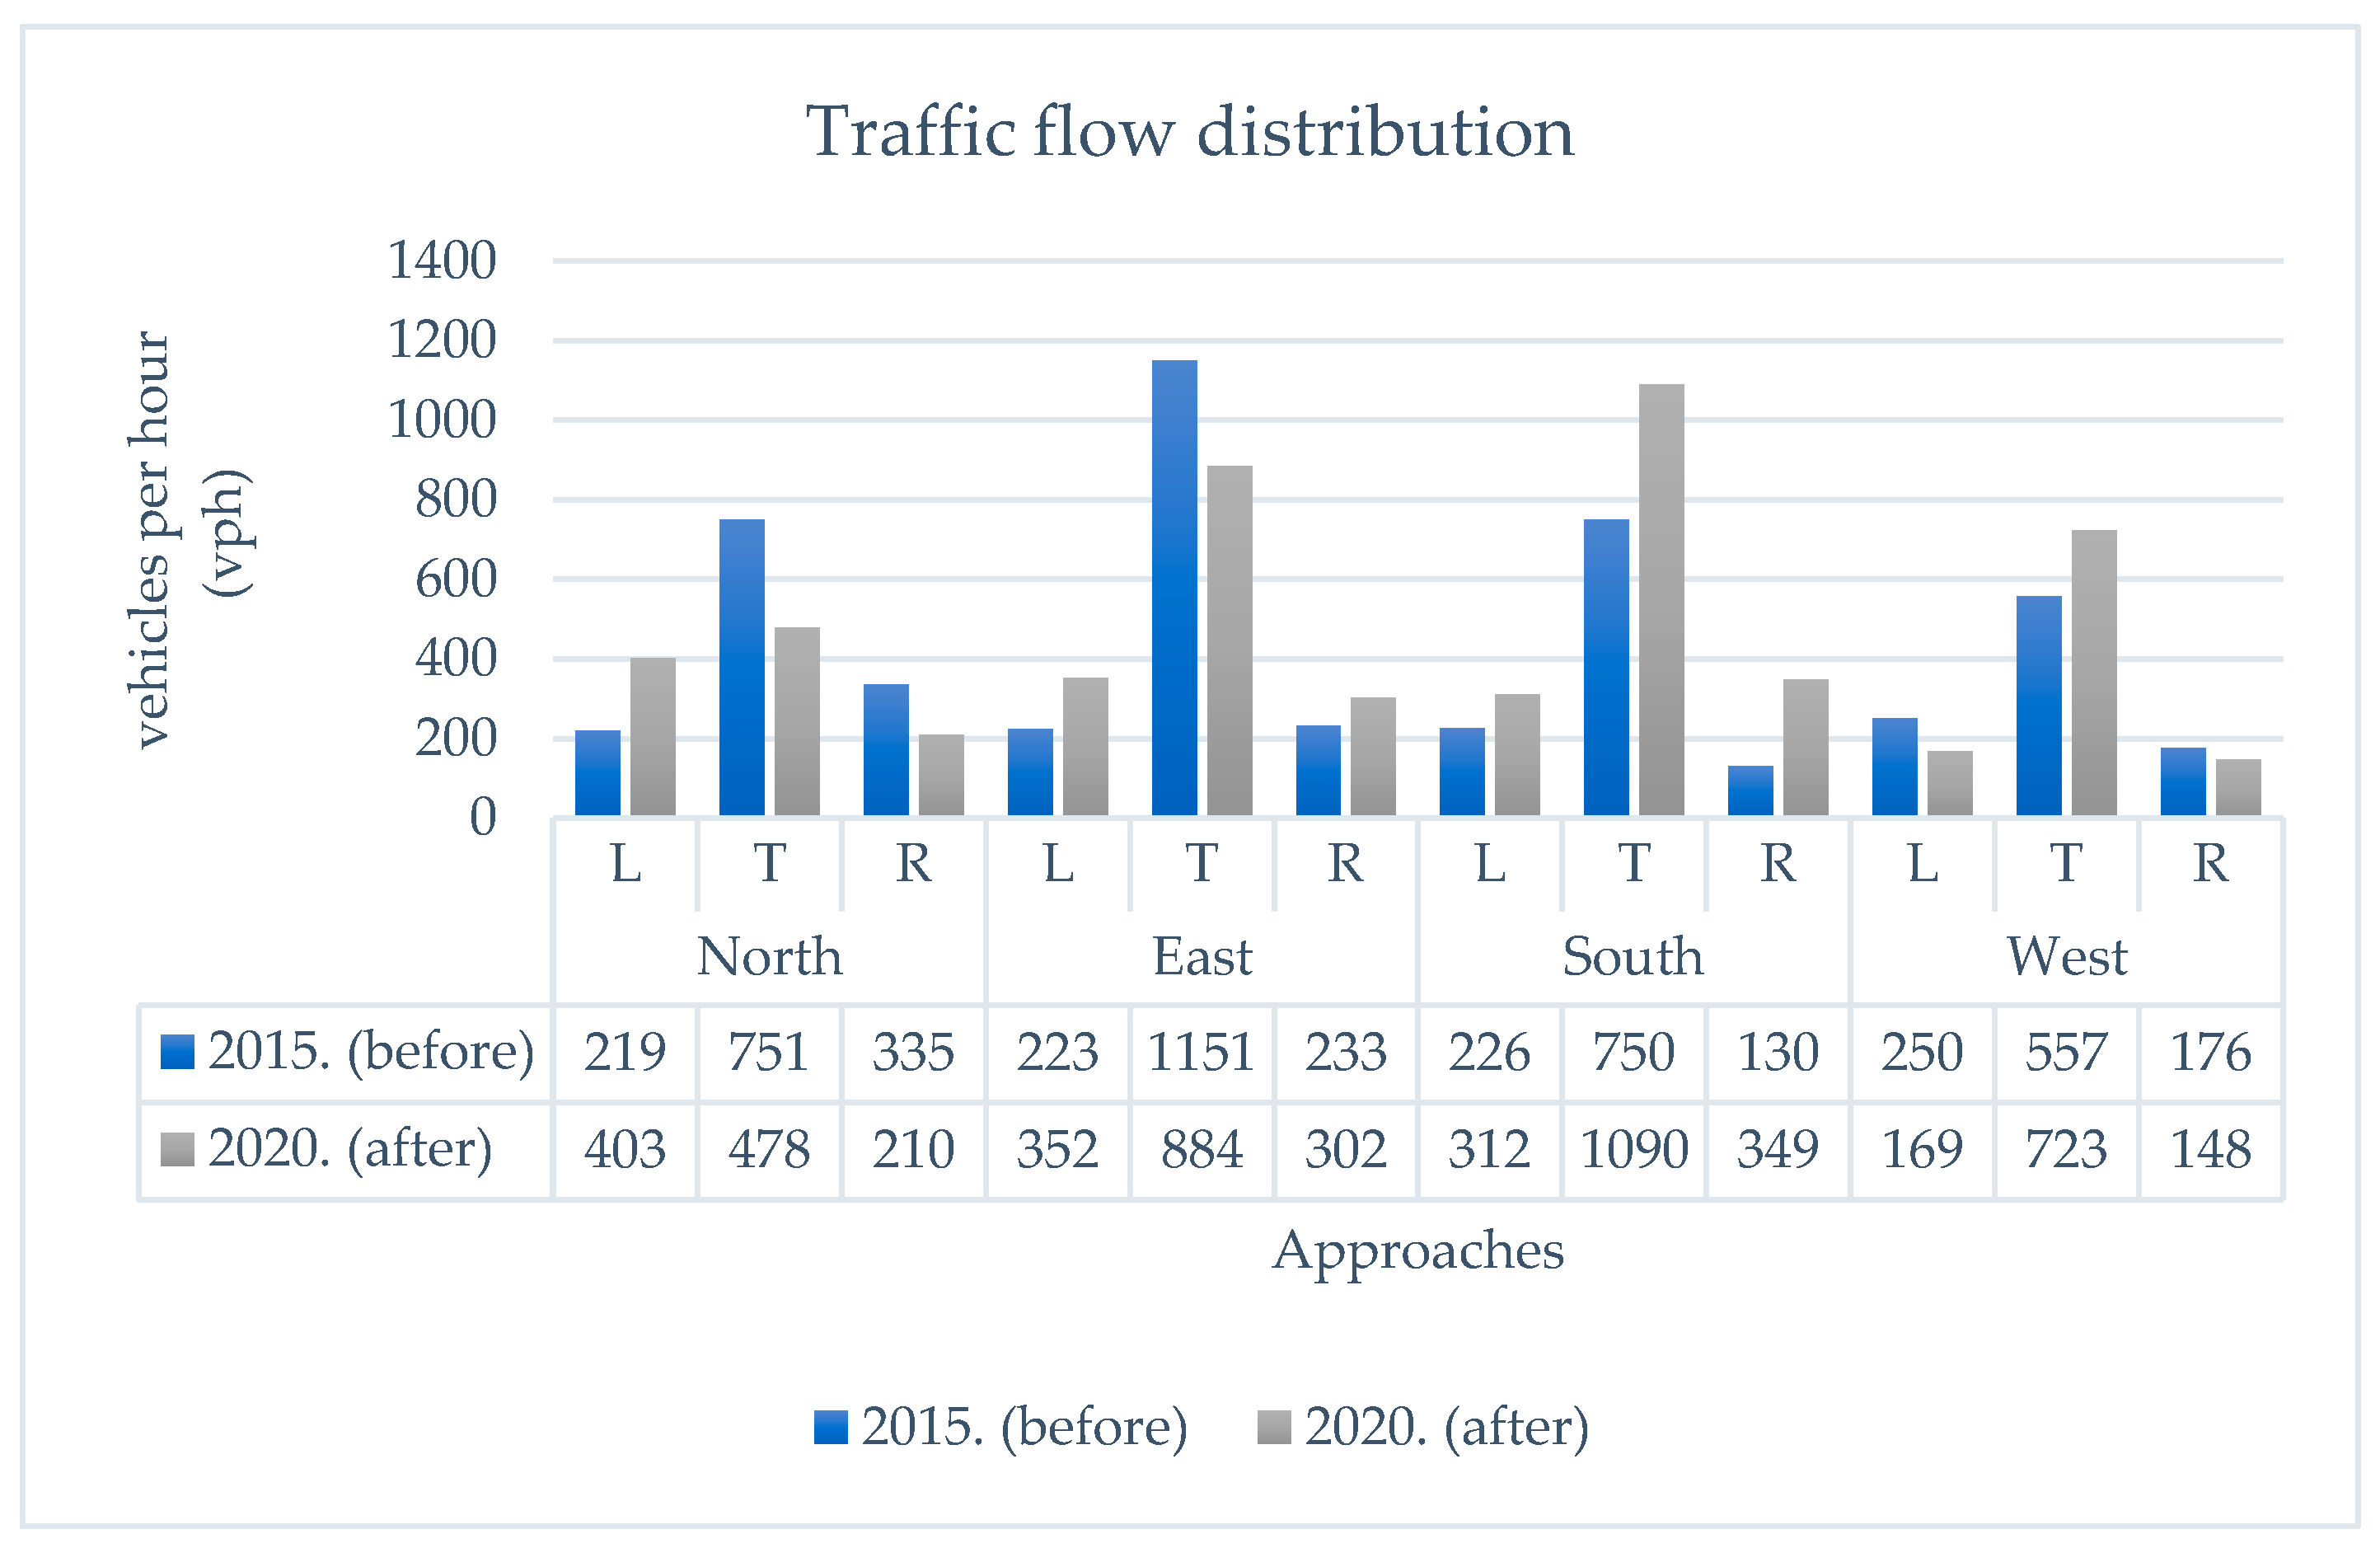
At Intersection R1, the highest traffic volumes occurred between 3:00 p.m. and 4:00 p.m. In 2015, 5,001 vehicles were recorded during this period, increasing to 5,420 vehicles in 2020. This represents an 8.38% rise in peak-hour demand. Directional flow analysis showed consistent increases across all movements from the southern approach, while on other approaches the most notable increases were recorded for movements oriented towards the shopping center. During the peak hour, 11.7% of vehicles traveling on the northbound exit approach made a turning movement toward the shopping center, indicating a substantial share of attraction-related trips.
Figure 5.
Distribution of traffic flow by movement direction before and after the construction of the shopping center at Intersection R1.
Figure 5.
Distribution of traffic flow by movement direction before and after the construction of the shopping center at Intersection R1.
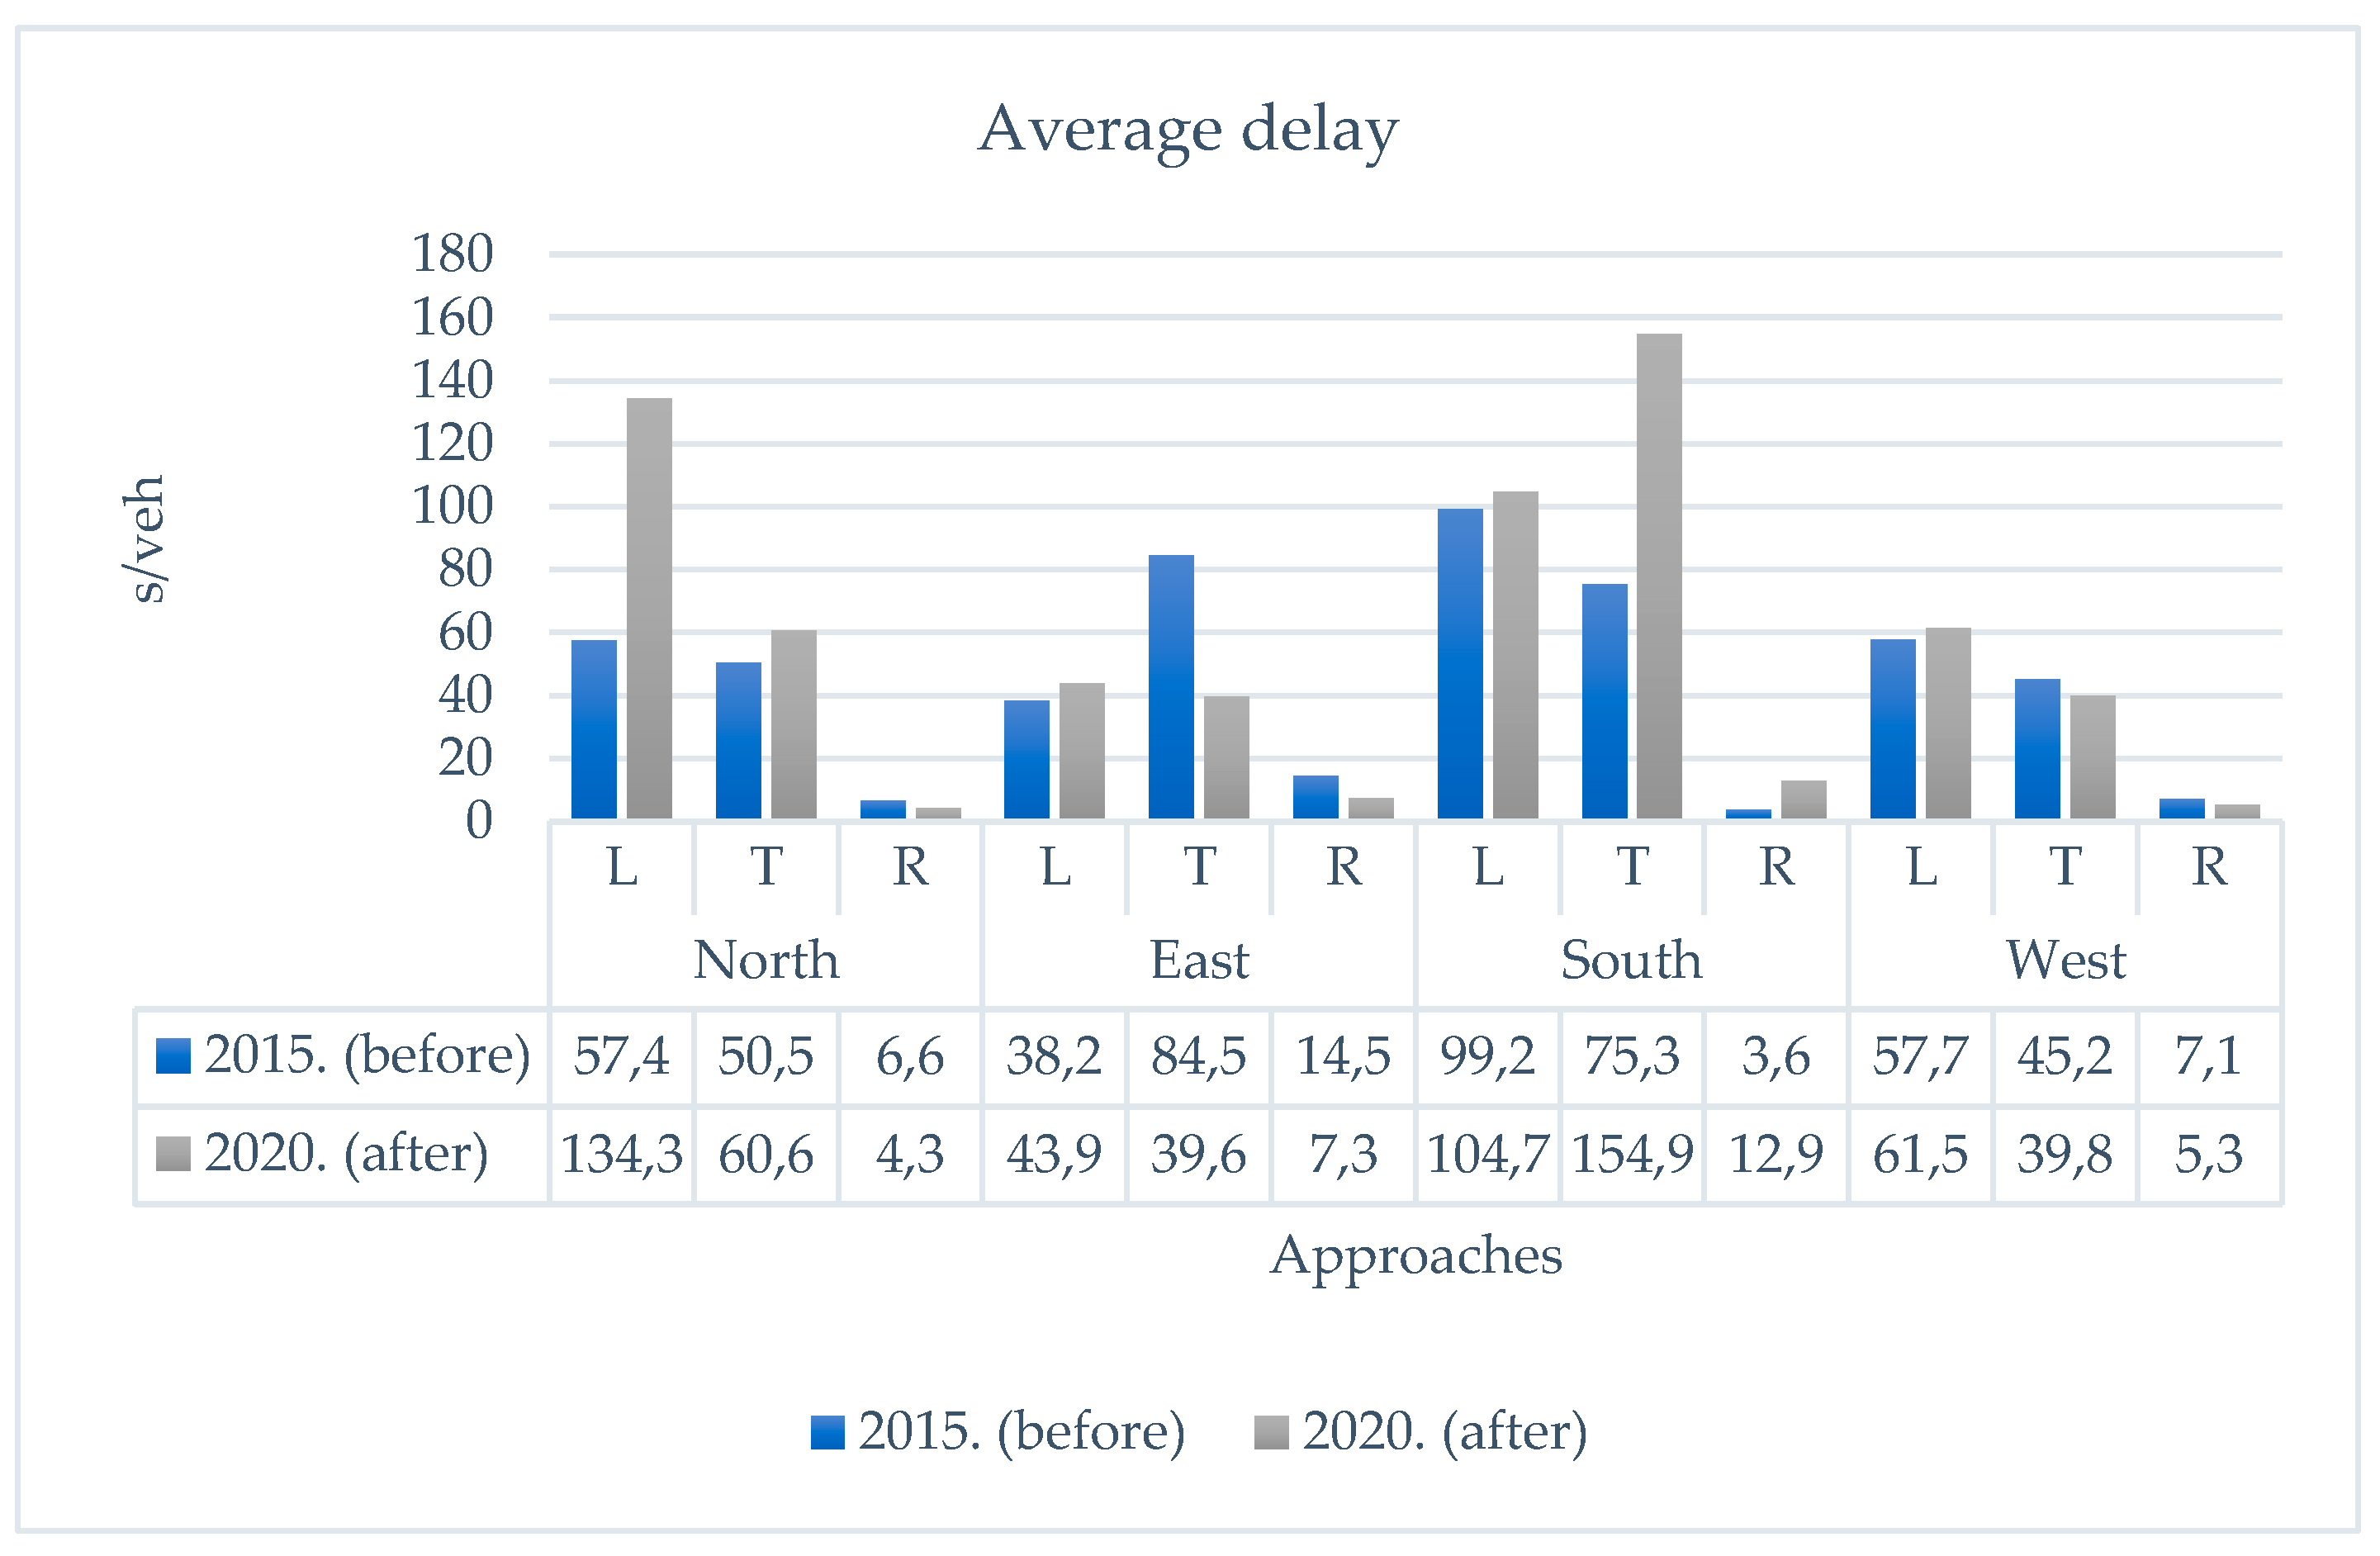
The increased volumes contributed to longer control delays. Average intersection delay rose from 56.0 s/veh in 2015 to 70.4 s/veh in 2020. Delays increased most significantly for movements directed toward the shopping center. The level of service (LOS) remained at LOS E both before and after the shopping center opened; thus, although delay worsened, the LOS category remained same (E).
Figure 6.
Average delay (s/veh) before and after the construction of the shopping center at Intersection R1.
Figure 6.
Average delay (s/veh) before and after the construction of the shopping center at Intersection R1.
4.2. Intersection R2: Traffic Volumes and Operational Performance
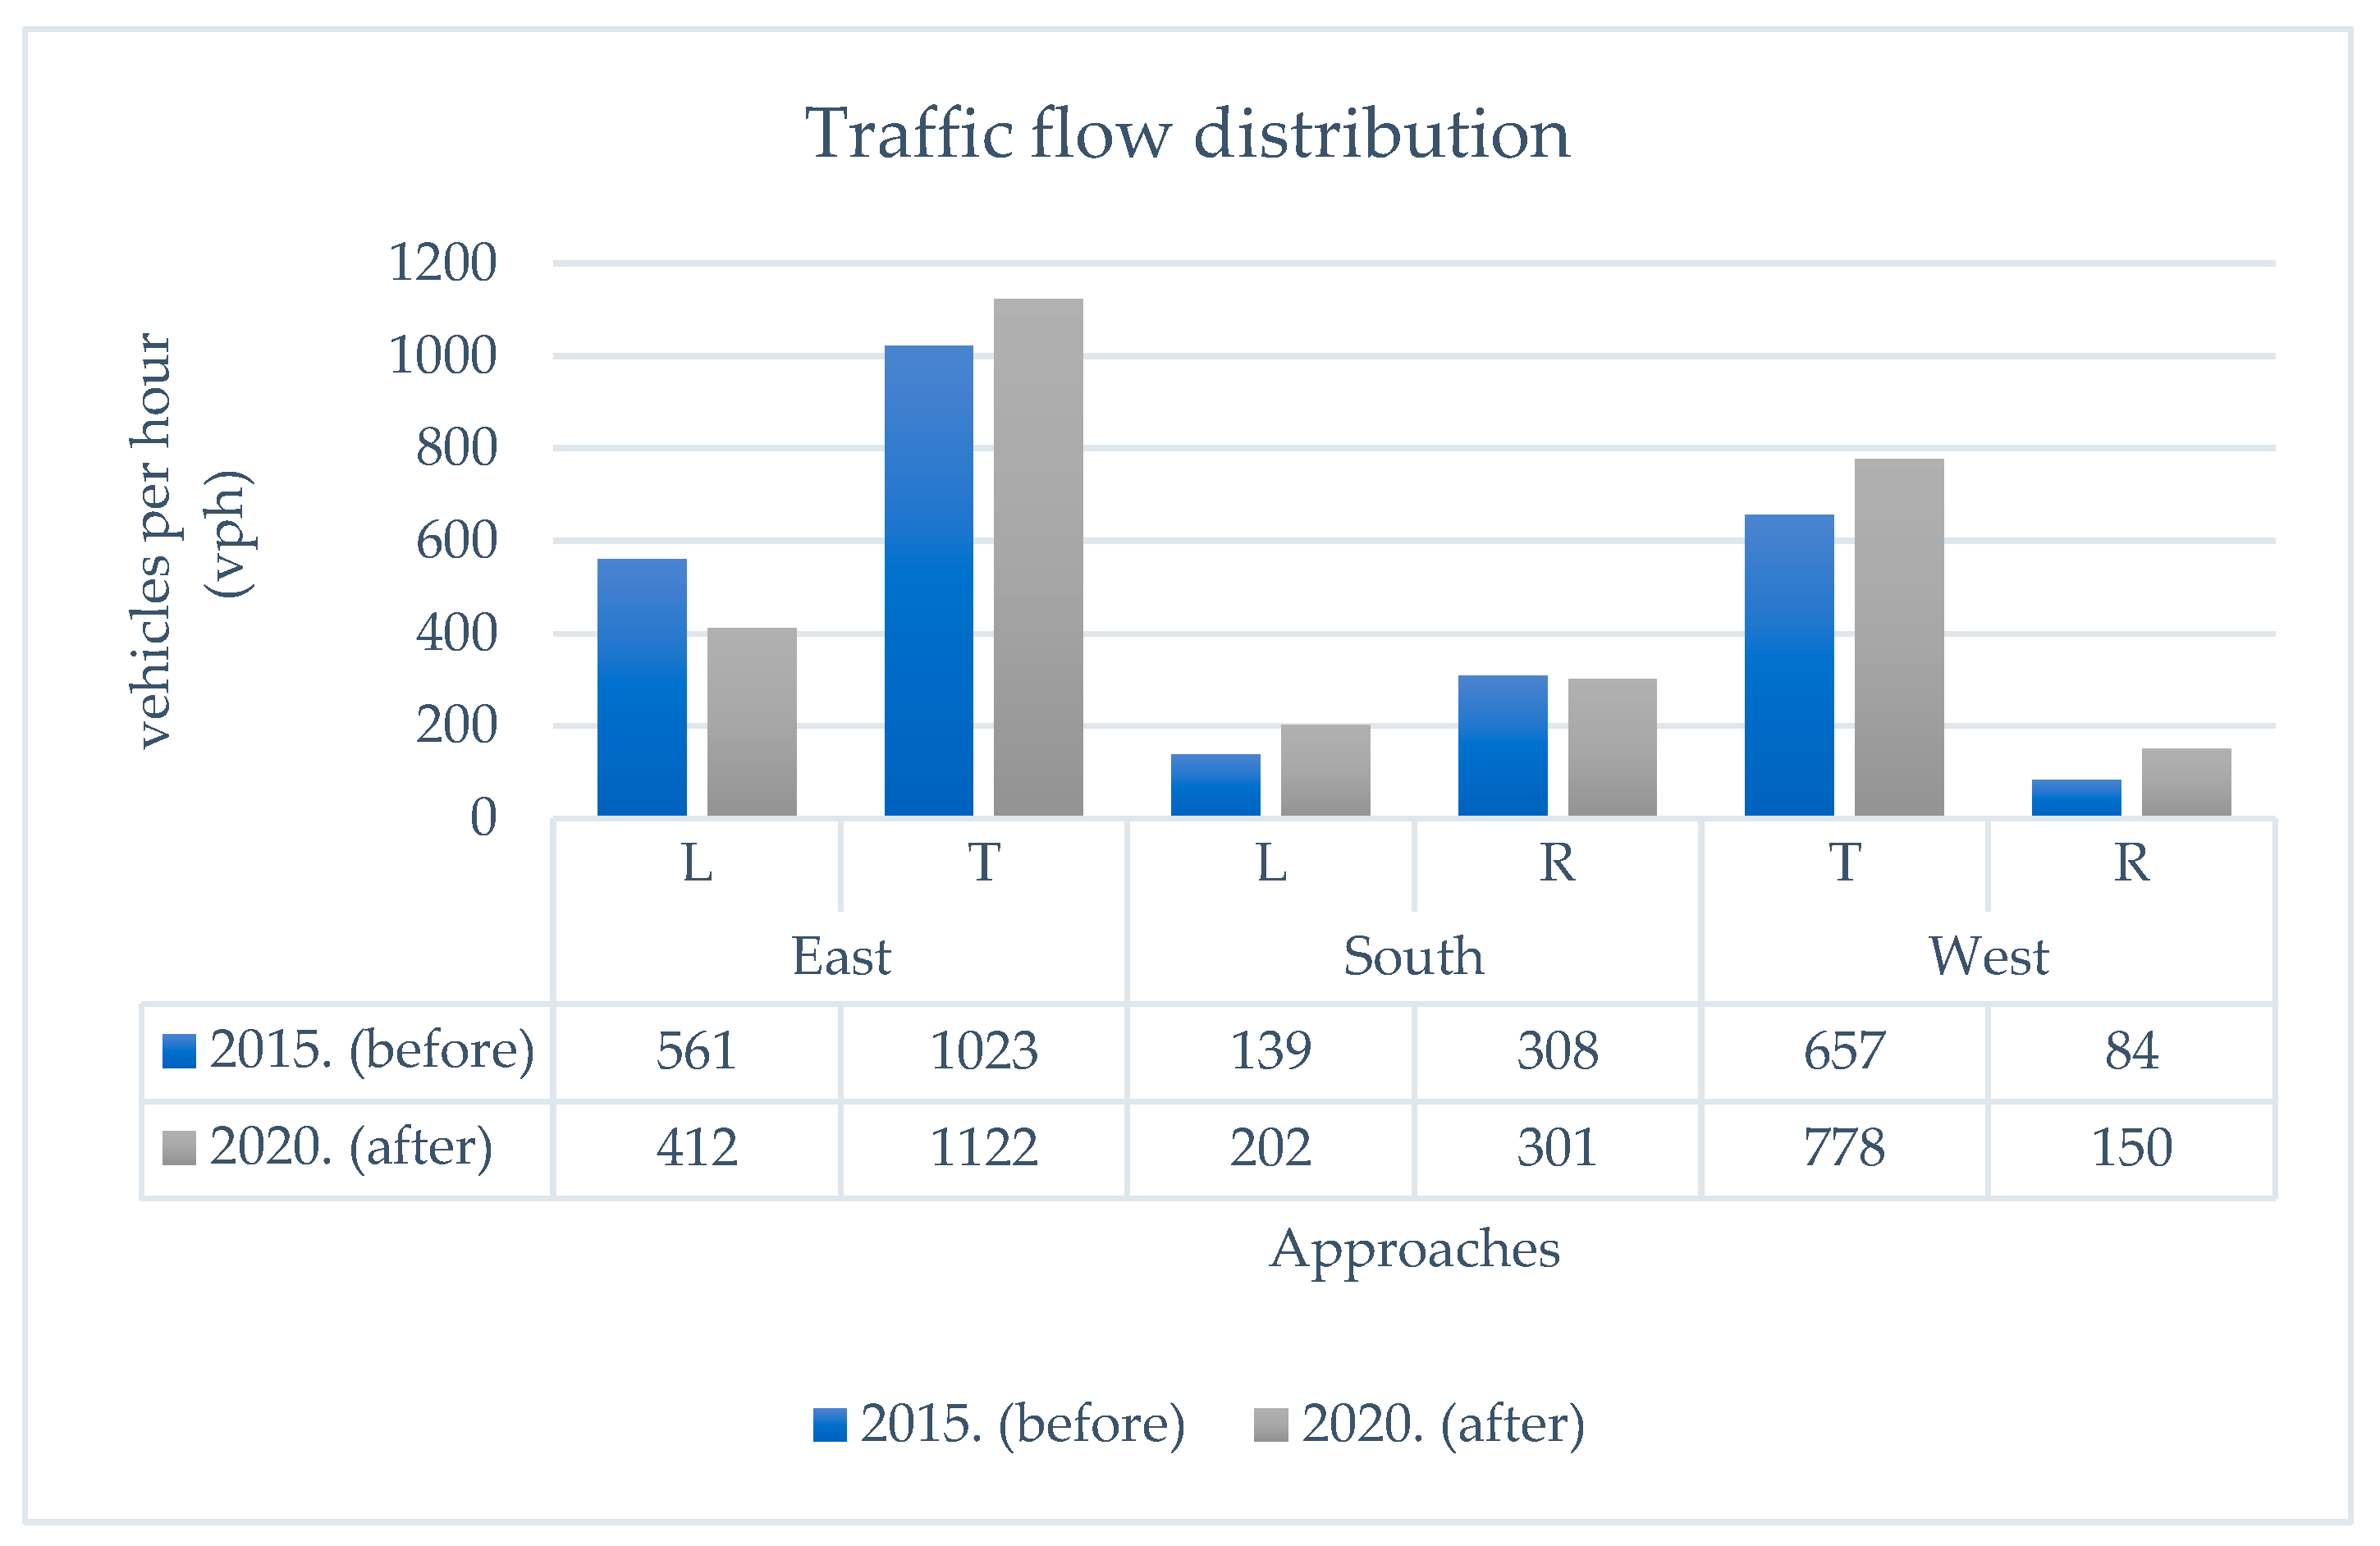
Although Intersection R2 experienced lower traffic demand than R1, traffic volumes also increased following the opening of the shopping center. During the peak hour (4:00–5:00 p.m.), traffic volume increased from 2,772 vehicles in 2015 to 2,965 vehicles in 2020, representing a 6.96% rise.
The highest increases occurred in movements directed toward the shopping center, particularly through movements from the eastern approach and left-turn movements from the southern approach. Approximately 9.1% of westbound exit vehicles turned toward the shopping center during the peak hour, confirming a clear change in directional flow patterns attributable to the new facility.
Figure 7.
Distribution of traffic flow by movement direction before and after the construction of the shopping center at Intersection R2.
Figure 7.
Distribution of traffic flow by movement direction before and after the construction of the shopping center at Intersection R2.
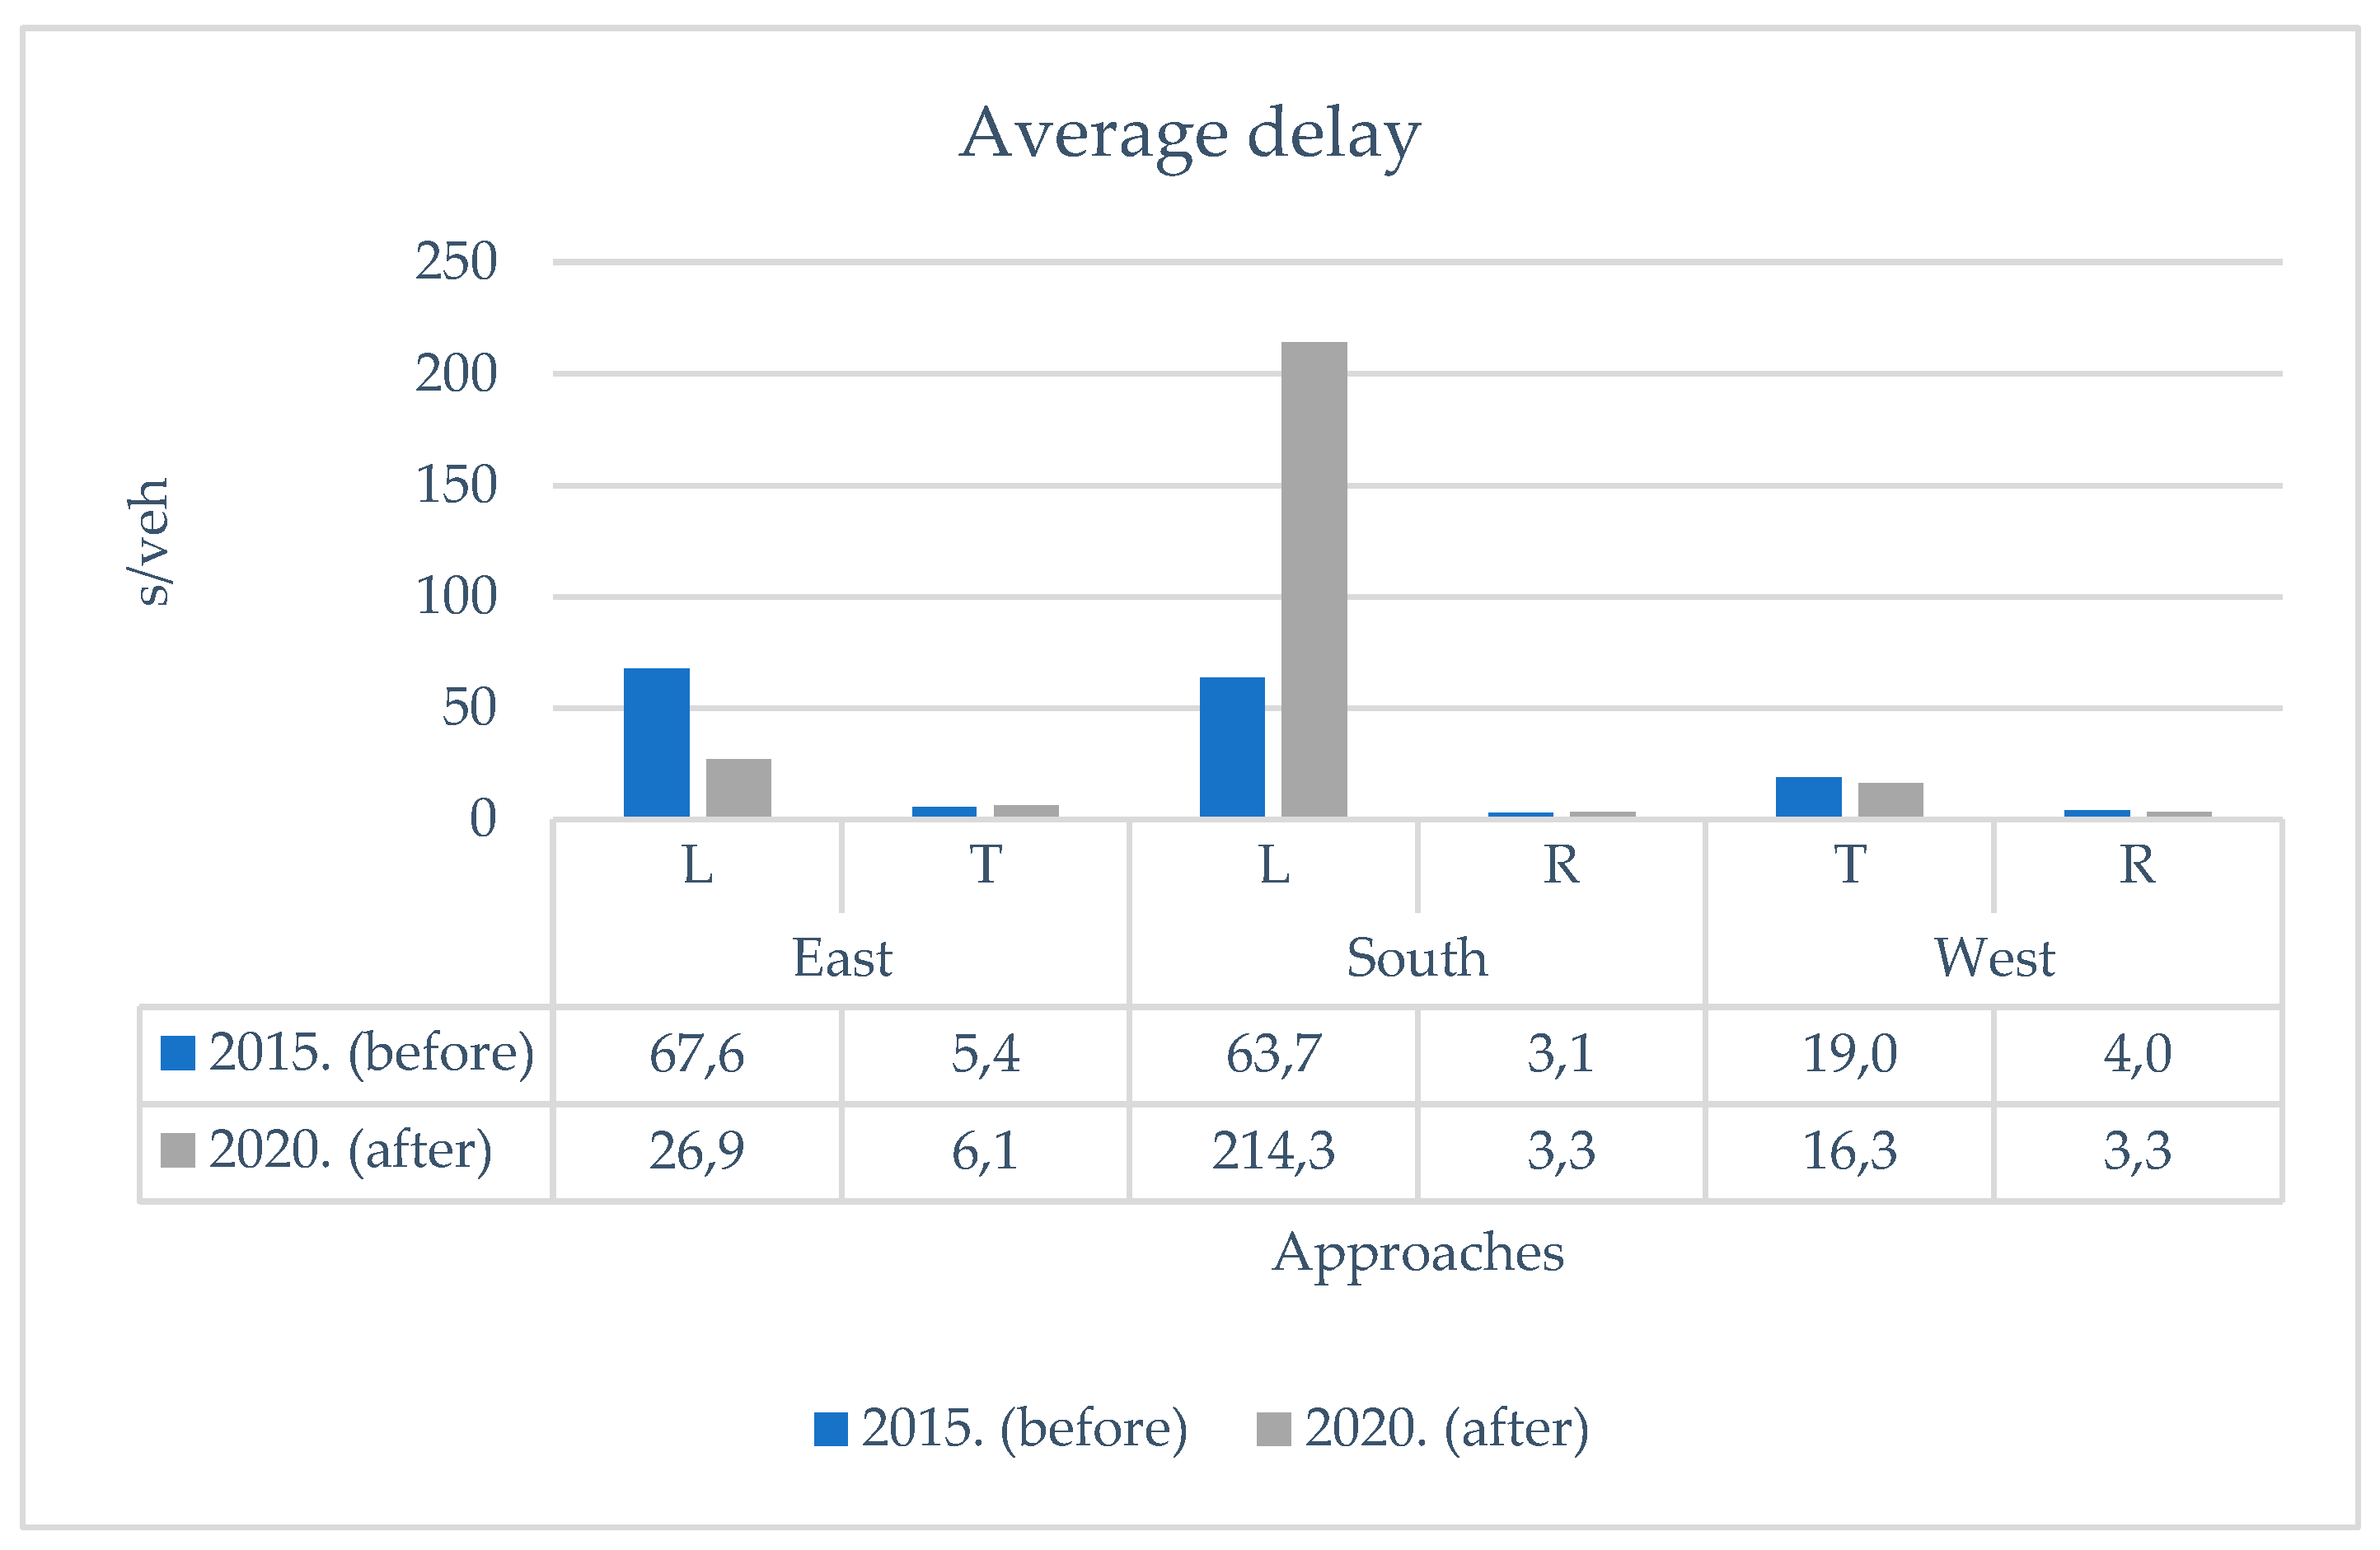
Average intersection delay increased from 26.4 s/veh to 30.1 s/veh between 2015 and 2020. The largest increase was recorded for the left-turn movement from the southern approach, where delay rose from 63.7 s/veh to 214.3 s/veh. Delays for other movements remained approximately unchanged.
Figure 8.
Average vehicle delays (s/veh) before and after the construction of the shopping center, at intersection R2.
Figure 8.
Average vehicle delays (s/veh) before and after the construction of the shopping center, at intersection R2.
4.3. Redistribution of Traffic Flows
The results confirm that the shopping center significantly influenced the redistribution of traffic flows. At Intersection R1, 11.7% of northbound outbound traffic turned toward the facility during the peak hour. At Intersection R2, 9.1% of westbound outbound traffic was directed toward the shopping center (Figure 9). These findings demonstrate increased trip attraction and a shift in directional travel patterns, further intensifying operational pressures at both intersections.
4.4. Reconstruction of Intersection R2
To improve operational performance under increased traffic demand, Intersection R2 was reconstructed into a turbo roundabout in 2023. A pre-/post-reconstruction comparison was conducted based on traffic counts collected in 2022 (before reconstruction) and 2023 (after reconstruction).
4.5. Turbo Roundabout Performance Evaluation
Traffic volume in 2023 showed a slight decrease compared with 2022, during the two-hour observation period (Figure 10). Before reconstruction in 2022, the three-leg signalized intersection recorded a total traffic volume of 6,747 vehicles during the two-hour observation period (3,280 vehicles in the first hour and 3,467 vehicles in the second hour). Passenger cars constituted the predominant share of traffic (96.6%). After the construction of the turbo roundabout (2023), the number of vehicles decreased to 5,620 during the same observation period. This included 2,832 vehicles during the first hour and 2,788 vehicles during the second hour. Notably, passenger cars accounted for the vast majority of these vehicles, constituting 94.6% of the total. The slight decline in traffic volume can be attributed to drivers’ initial unfamiliarity with the new traffic regulation, which may have led to partial avoidance of the intersection in the first months following reconstruction.
Because post-reconstruction volumes were lower than pre-reconstruction levels, the 2022 traffic volumes were used to evaluate the performance of the turbo roundabout (Figure 11a). Simulation results showed substantial operational improvements under identical traffic conditions.
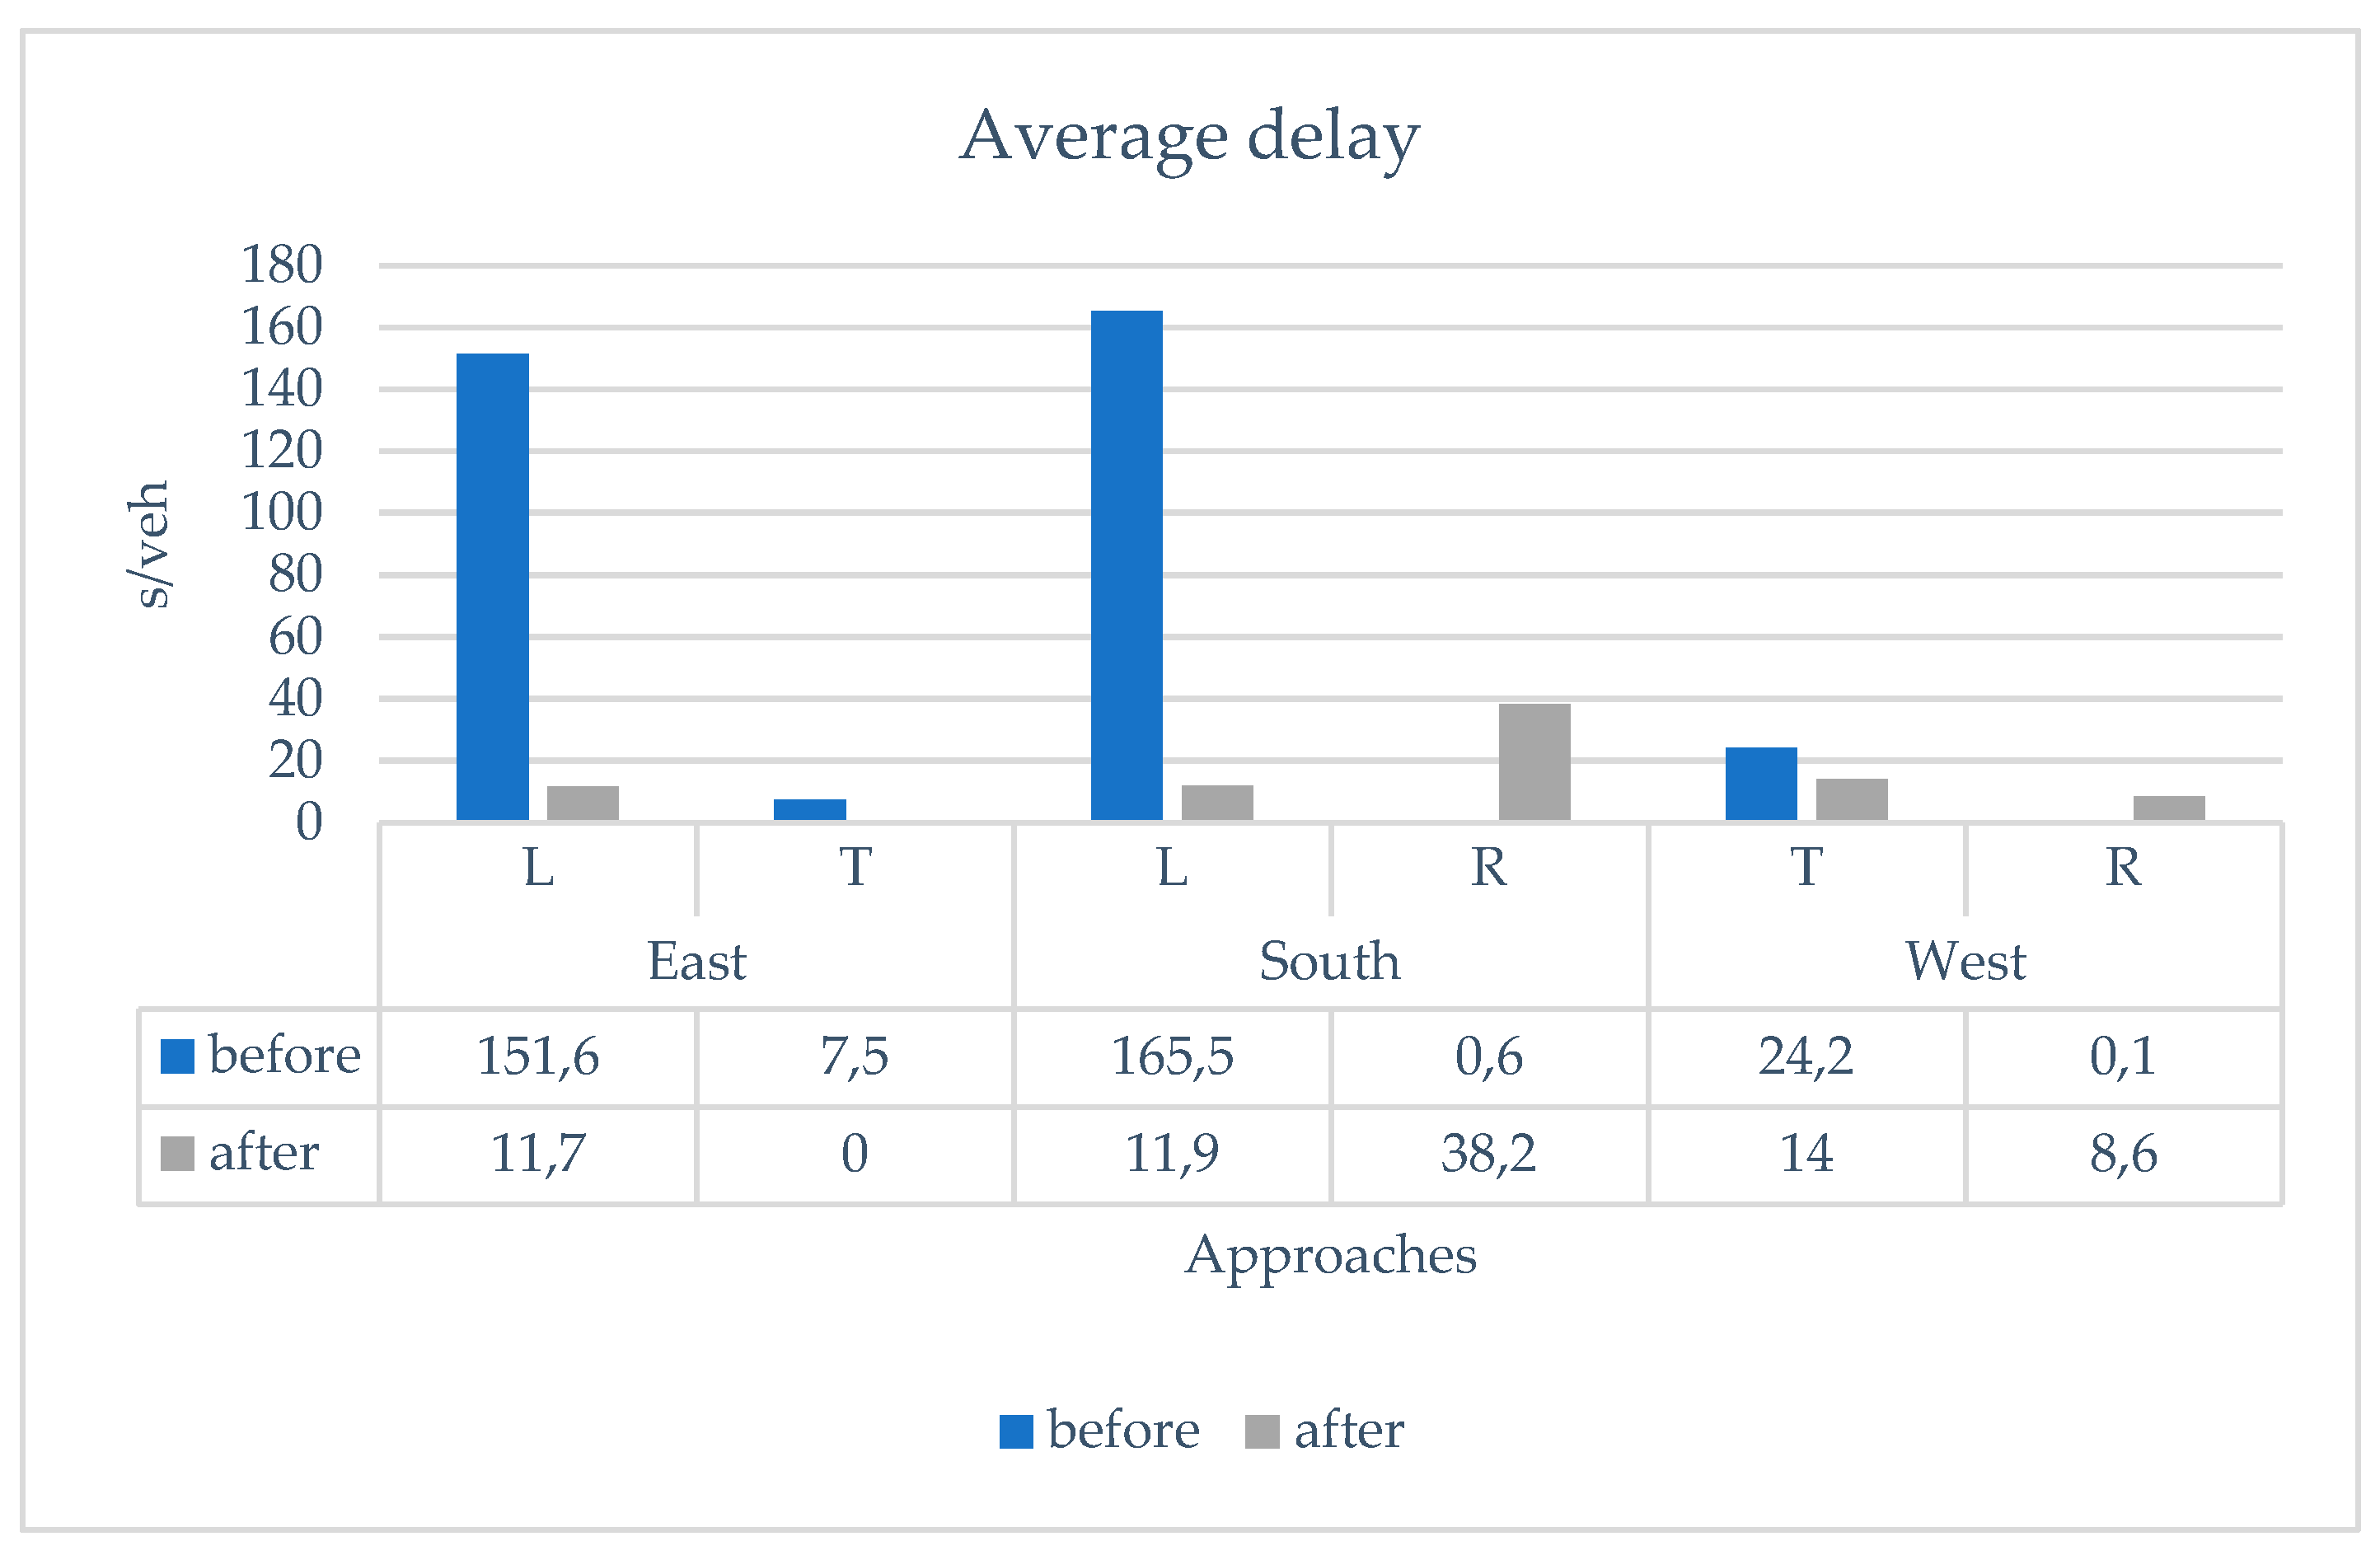
The analysis of average delays revealed a substantial reduction following the reconstruction of the intersection (Figure 12). The most significant improvement was observed for the left-turn movement from the southern approach. where average delay decreased from 165.5 s/veh (signalized intersection) to 11.9 s/veh (turbo roundabout). Similar improvements were recorded for the left-turn movement from the eastern approach, with delay decreasing from 151.6 s/veh to 11.7 s/veh.
The turbo roundabout achieved LOS A for all approaches (Figure 11b), with lower volume-to-capacity ratios and improved operational stability. The reconstruction also resulted in higher approach speeds, increasing to 30–45 km/h across all three legs of the roundabout.
5. Discussion
The findings of this study demonstrate that the opening of the Big Fashion shopping center produced measurable changes in traffic conditions at nearby intersections. Both study sites experienced increases in peak-hour traffic volumes, but the magnitude and operational consequences varied depending on geometric and control characteristics. At Intersection R1, the additional demand intensified delays but did not change the overall LOS category, suggesting that the intersection was already operating near capacity prior to the development. In contrast, Intersection R2 exhibited a pronounced sensitivity to turning movements, particularly those originating from the southern approach, where the increase in demand resulted in substantial growth in delay.
The reconstruction of Intersection R2 into a turbo roundabout produced clear operational improvements. Under identical traffic volumes, the roundabout configuration notably reduced critical delays and improved LOS across all approaches. These results reinforce previous research indicating that turbo roundabouts can enhance operational efficiency under conditions of high turning demand and constrained urban geometry. The reduction in conflict points and the physical lane separation contribute to improved vehicle flow and operational stability.
Nevertheless, several limitations should be acknowledged. The analysis was based on traffic counts collected on selected days that may not fully reflect temporal variability or long-term behavioral adaptation. Additionally, the study focused exclusively on operational indicators, without assessing safety outcomes, emissions, pedestrian or cyclist conditions, or broader environmental impacts. Future research could incorporate these dimensions to provide a more holistic assessment of the benefits and limitations of turbo roundabouts in urban settings.
6. Conclusions
This study confirms that large shopping centers act as significant trip attractors, contributing to noticeable increases in traffic demand on adjacent intersections. At the analyzed sites in Novi Sad, peak-hour traffic increased by 8.38% at Intersection R1 and by 6.96% at Intersection R2 after the opening of the Big Fashion shopping center. These increases also resulted in higher delays, particularly for movements oriented towards the new facility.
The subsequent reconstruction of Intersection R2 into a turbo roundabout provided an effective operational response to these challenges. The simulation results showed that the turbo roundabout substantially outperformed the former signalized intersection, reducing delays, improving LOS, and enabling more stable traffic flow under identical traffic loads. The inclusion of bypasses and channelized lanes contributed to these improvements.
The findings support the use of turbo roundabouts as a viable solution in urban areas experiencing high directional turning movements and increased pressure from commercial developments. However, designers must carefully consider geometric constraints, expected traffic volumes, and the long-term adaptability of users. While turbo roundabouts offer improved operational and safety performance under specific conditions, their effectiveness ultimately depends on context-sensitive application and comprehensive evaluation across multiple performance dimensions.
Author Contributions
Conceptualization, N.R. and V.M.; methodology, N.R., V.M. and J.M.S; software, N.R. and A.K.; validation, N.R. and J.M.S; formal analysis, A.K. and J.M.S.; investigation, V.M., A.K, and J.M.S.; resources, N.R. and V.M.; data curation, V.M.; writing—original draft preparation, A.K. and J.M.S.; writing—review and editing, J.M.S.; visualization, A.K.; supervision, N.R.; project administration, N.R. and V.M.; funding acquisition, N.R. and V.M.
Funding
This research has been supported by the Ministry of Science, Technological Development and Innovation (Contract No. 451-03-137/2025-03/200156) and the Faculty of Technical Sciences, University of Novi Sad through the project “Scientific and Artistic Research Work of Researchers in Teaching and Associate Positions at the Faculty of Technical Sciences, University of Novi Sad 2025” (No. 01-50/295).
Institutional Review Board Statement
Not applicable.
Informed Consent Statement
Not applicable.
Data Availability Statement
The research data available from authors upon email request.
Conflicts of Interest
The authors declare no conflict of interest.
Abbreviations
The following abbreviations are used in this manuscript:
| TIA | Traffic Impact Assessment |
| HCM | Highway Capacity Manual |
| s | second |
| veh | vehicle |
| LOS | Level of Service |
| V | volume |
| C | Capacity |
| vph | Vehicles per hour |
References
- Marić, B.; Branković, N. The problem with vehicles movement through a roundabout. Journal of Road and Traffic Engineering 2020, 66(1), 33-40. [CrossRef]
- Zhao, J.; Li, Z.; Liu, P. Using traffic data to identify land-use characteristics based on ensemble learning approaches. Journal of Transport and Land Use 2023, 16(1), 19–41. [CrossRef]
- Mirmoghtadaee, M. The relationship between land use, socio-economic characteristics of inhabitants and travel demand in new towns–a case study of Hashtgerd New Town (Iran). Int. J. Urban Sustain. Dev. 2012, 4, 39–62. [CrossRef]
- Acheampong, R.A.; Silva, E.A. Land use–transport interaction modeling: A review of the literature and future research directions. J. Transp. Land Use 2015, 8, 11–38. https://www.jstor.org/stable/26189164.
- Mukherjee, J.; Kadali, B.R. A comprehensive review of trip generation models based on land use characteristics. Transp. Res. Part D Environ. 2022, 109, 103340. [CrossRef]
- Ahmed, N.A.; Mahmood, T.S. Changes in Land Use and Its Impact on the Hierarchy of Roads in Ramadi City. IOP Conf. Ser. Earth Environ. Sci. 2021, 754, 012015. [CrossRef]
- Moses, K.P.; Sudharsanamurthy, P.; Madhivadhani, K. Study of Traffic Impact Assessment on Commercial Malls in an Urban Area–A Case Study of the Proposed Mall in Cuddalore Municipality. Tierärztliche Praxis 2021, 41, 516-529.
- Rakić, M. The model of shopping centres influence on traffic damand generation. Doctoral dissertation. University of Novi Sad, Faculty of Technical Sciences, Novi Sad, Republic of Serbia, 2025.
- Fortuijn, L.G. Turbo roundabouts: Design principles and safety performance. Transp. Res. Rec. 2009, 2096, 16–24. [CrossRef]
- Mauro, R.; Cattani, M.; Guerrieri, M. Evaluation of the safety performance of turbo roundabouts by means of a potential accident rate mode. Balt. J. Road Bridge Eng. 2015, 10, 28–38. [CrossRef]
- Šarić, A.; Lovrić, I. Multi-lane roundabout capacity evaluation. Front. Built Environ. 2017, 3, 42. [CrossRef]
- Balado, J.; Díaz-Vilariño, L.; Arias, P.; Novo, A. A safety analysis of roundabouts and turbo roundabouts based on Petri nets. Traffic Inj. Prev. 2019, 20, 400–405. [CrossRef]
- Leonardi, S.; Distefano, N. Turbo-roundabouts as an instrument for improving the efficiency and safety in urban area: An Italian case study. Sustainability 2023, 15(4), 3223. [CrossRef]
- Cruz, L.A.B.; Lyons, L.; Darghan, E. Complete-linkage clustering analysis of surrogate measures for road safety assessment in roundabouts. Rev. Colomb. Estad. 2021, 44, 91–121. [CrossRef]
- Tollazzi, T.; Mauro, R.; Guerrieri, M.; Rençelj, M. Comparative analysis of four new alternative types of roundabouts: "Turbo", "Flower", "Target" and "Four-Flyover" roundabout. Period. Polytech. Civ. Eng. 2016, 60, 51–60. [CrossRef]
- Vasconcelos, L.; Silva, A.B.; Seco, Á.M.; Fernandes, P.; Coelho, M.C. Turboroundabouts: Multicriterion assessment of intersection capacity, safety, and emissions. Transp. Res. Rec. 2014, 2402, 28–37. [CrossRef]
- Gredoska, N.; Bombol, K.; Nechoska, D.K. An evaluation of turbo roundabout performances: Case study of the city of Ohrid. Int. J. Traffic Transp. Eng. 2016, 6, 196–211. http://dx.doi.org/10.7708/ijtte.2016.6(2).07.
- Anagnostopoulos, A.; Galanis, A.; Kehagia, F.; Politis, I.; Theofilatos, A.; Lemonakis, P. Using a Microsimulation Traffic Model and the Vehicle-Specific Power Method to Assess Turbo-Roundabouts as Environmentally Sustainable Road Design Solutions. Future Transp. 2025, 5, 4. [CrossRef]
Figure 1.
Research methodology.

Figure 2.
Study area.

Figure 3.
Intersection R1: Bulevar oslobođenja – Bulevar cara Lazara.

Figure 4.
Intersection of Bulevar cara Lazara and Fruškogorska Street before (a) and after (b) reconstruction.
Figure 4.
Intersection of Bulevar cara Lazara and Fruškogorska Street before (a) and after (b) reconstruction.
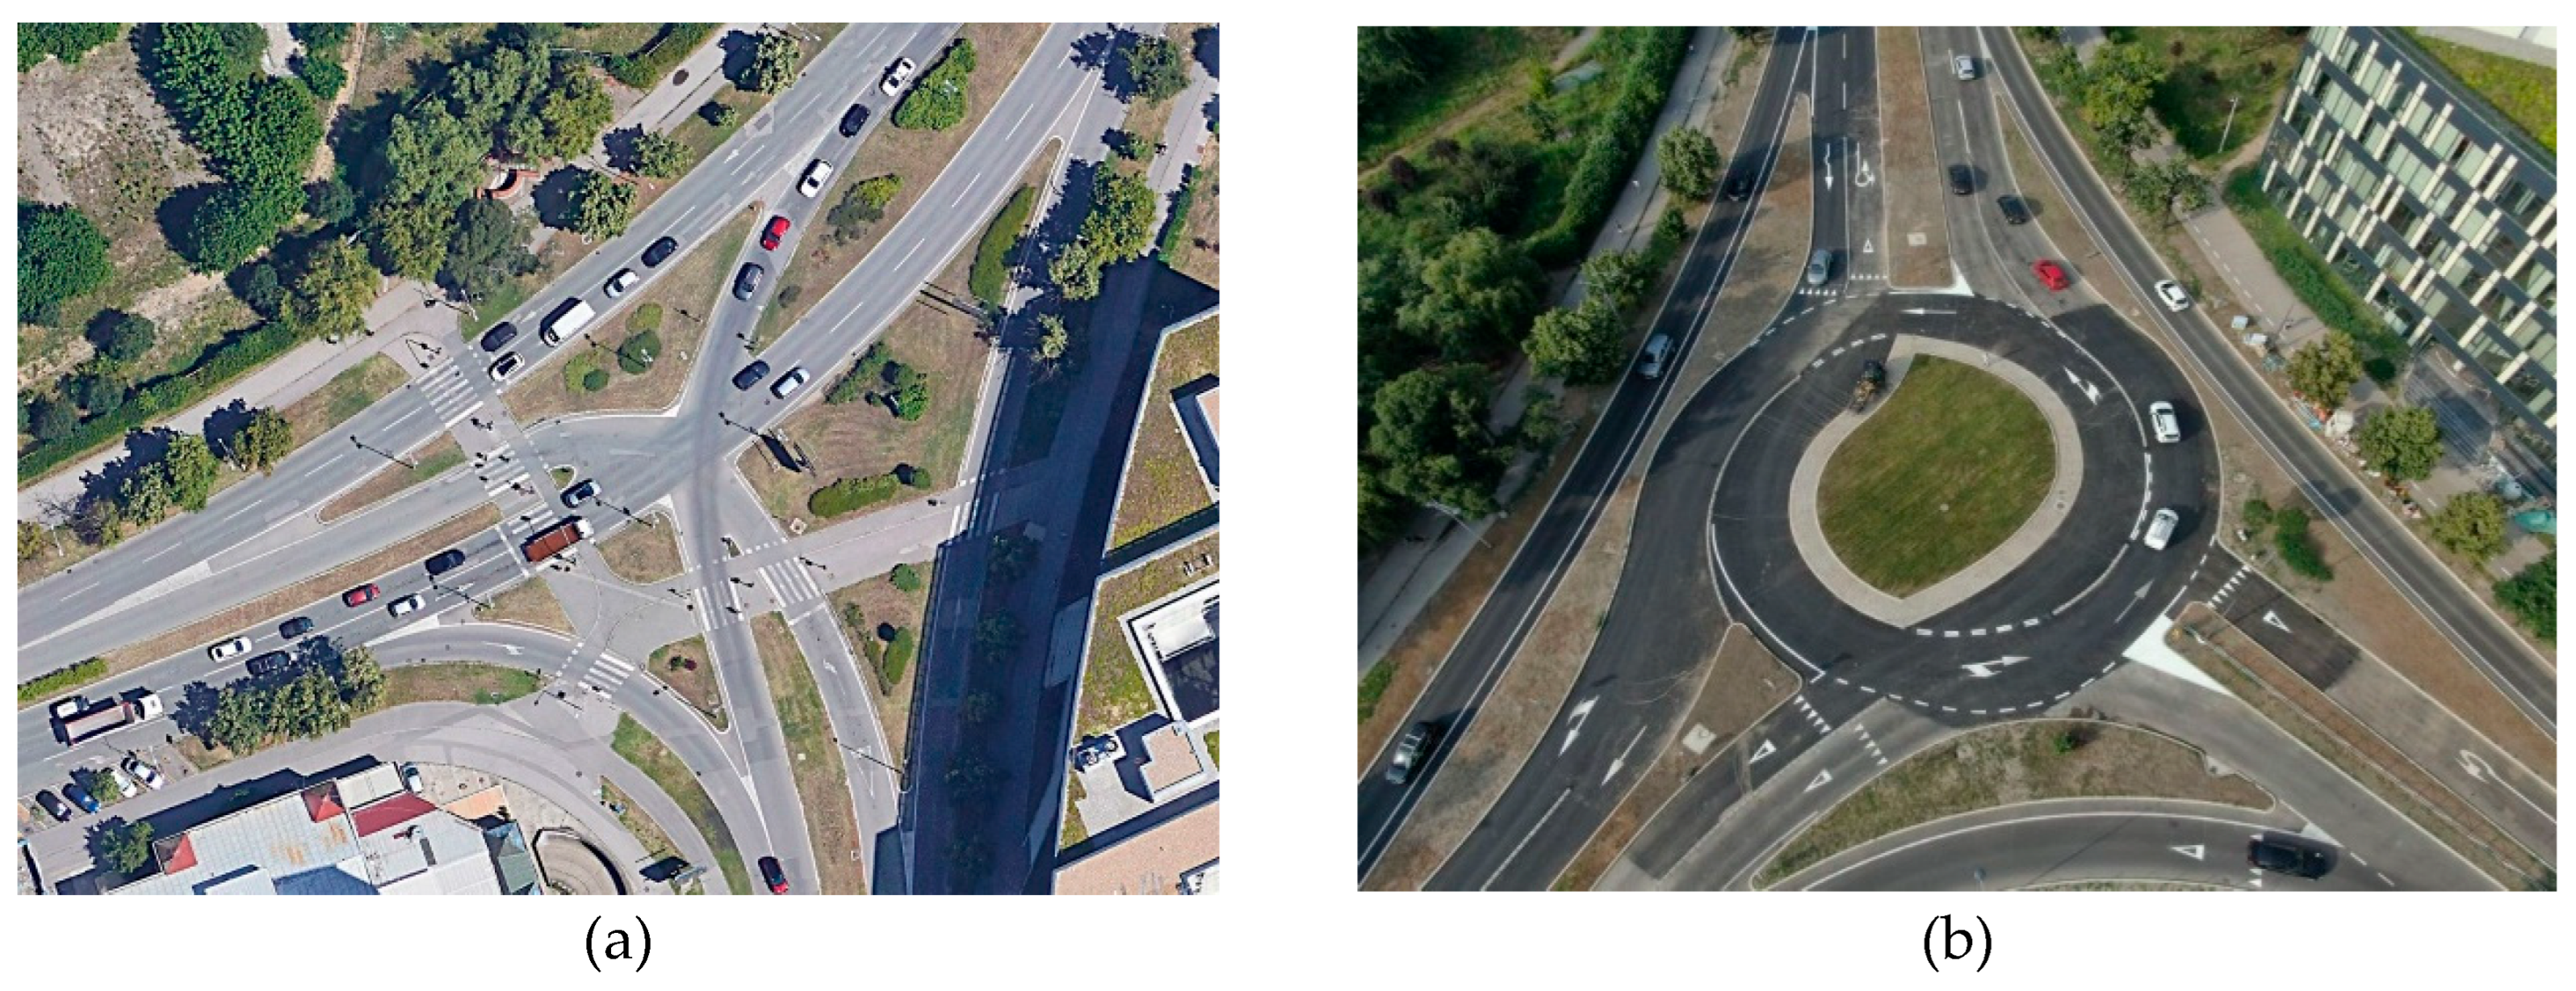
Figure 9.
Percentage of trips toward the “Big Fashion” shopping center from the total traffic flow at the outbound legs of the northern approach of intersection R1 and the western approach of intersection R2 during the peak hour.
Figure 9.
Percentage of trips toward the “Big Fashion” shopping center from the total traffic flow at the outbound legs of the northern approach of intersection R1 and the western approach of intersection R2 during the peak hour.
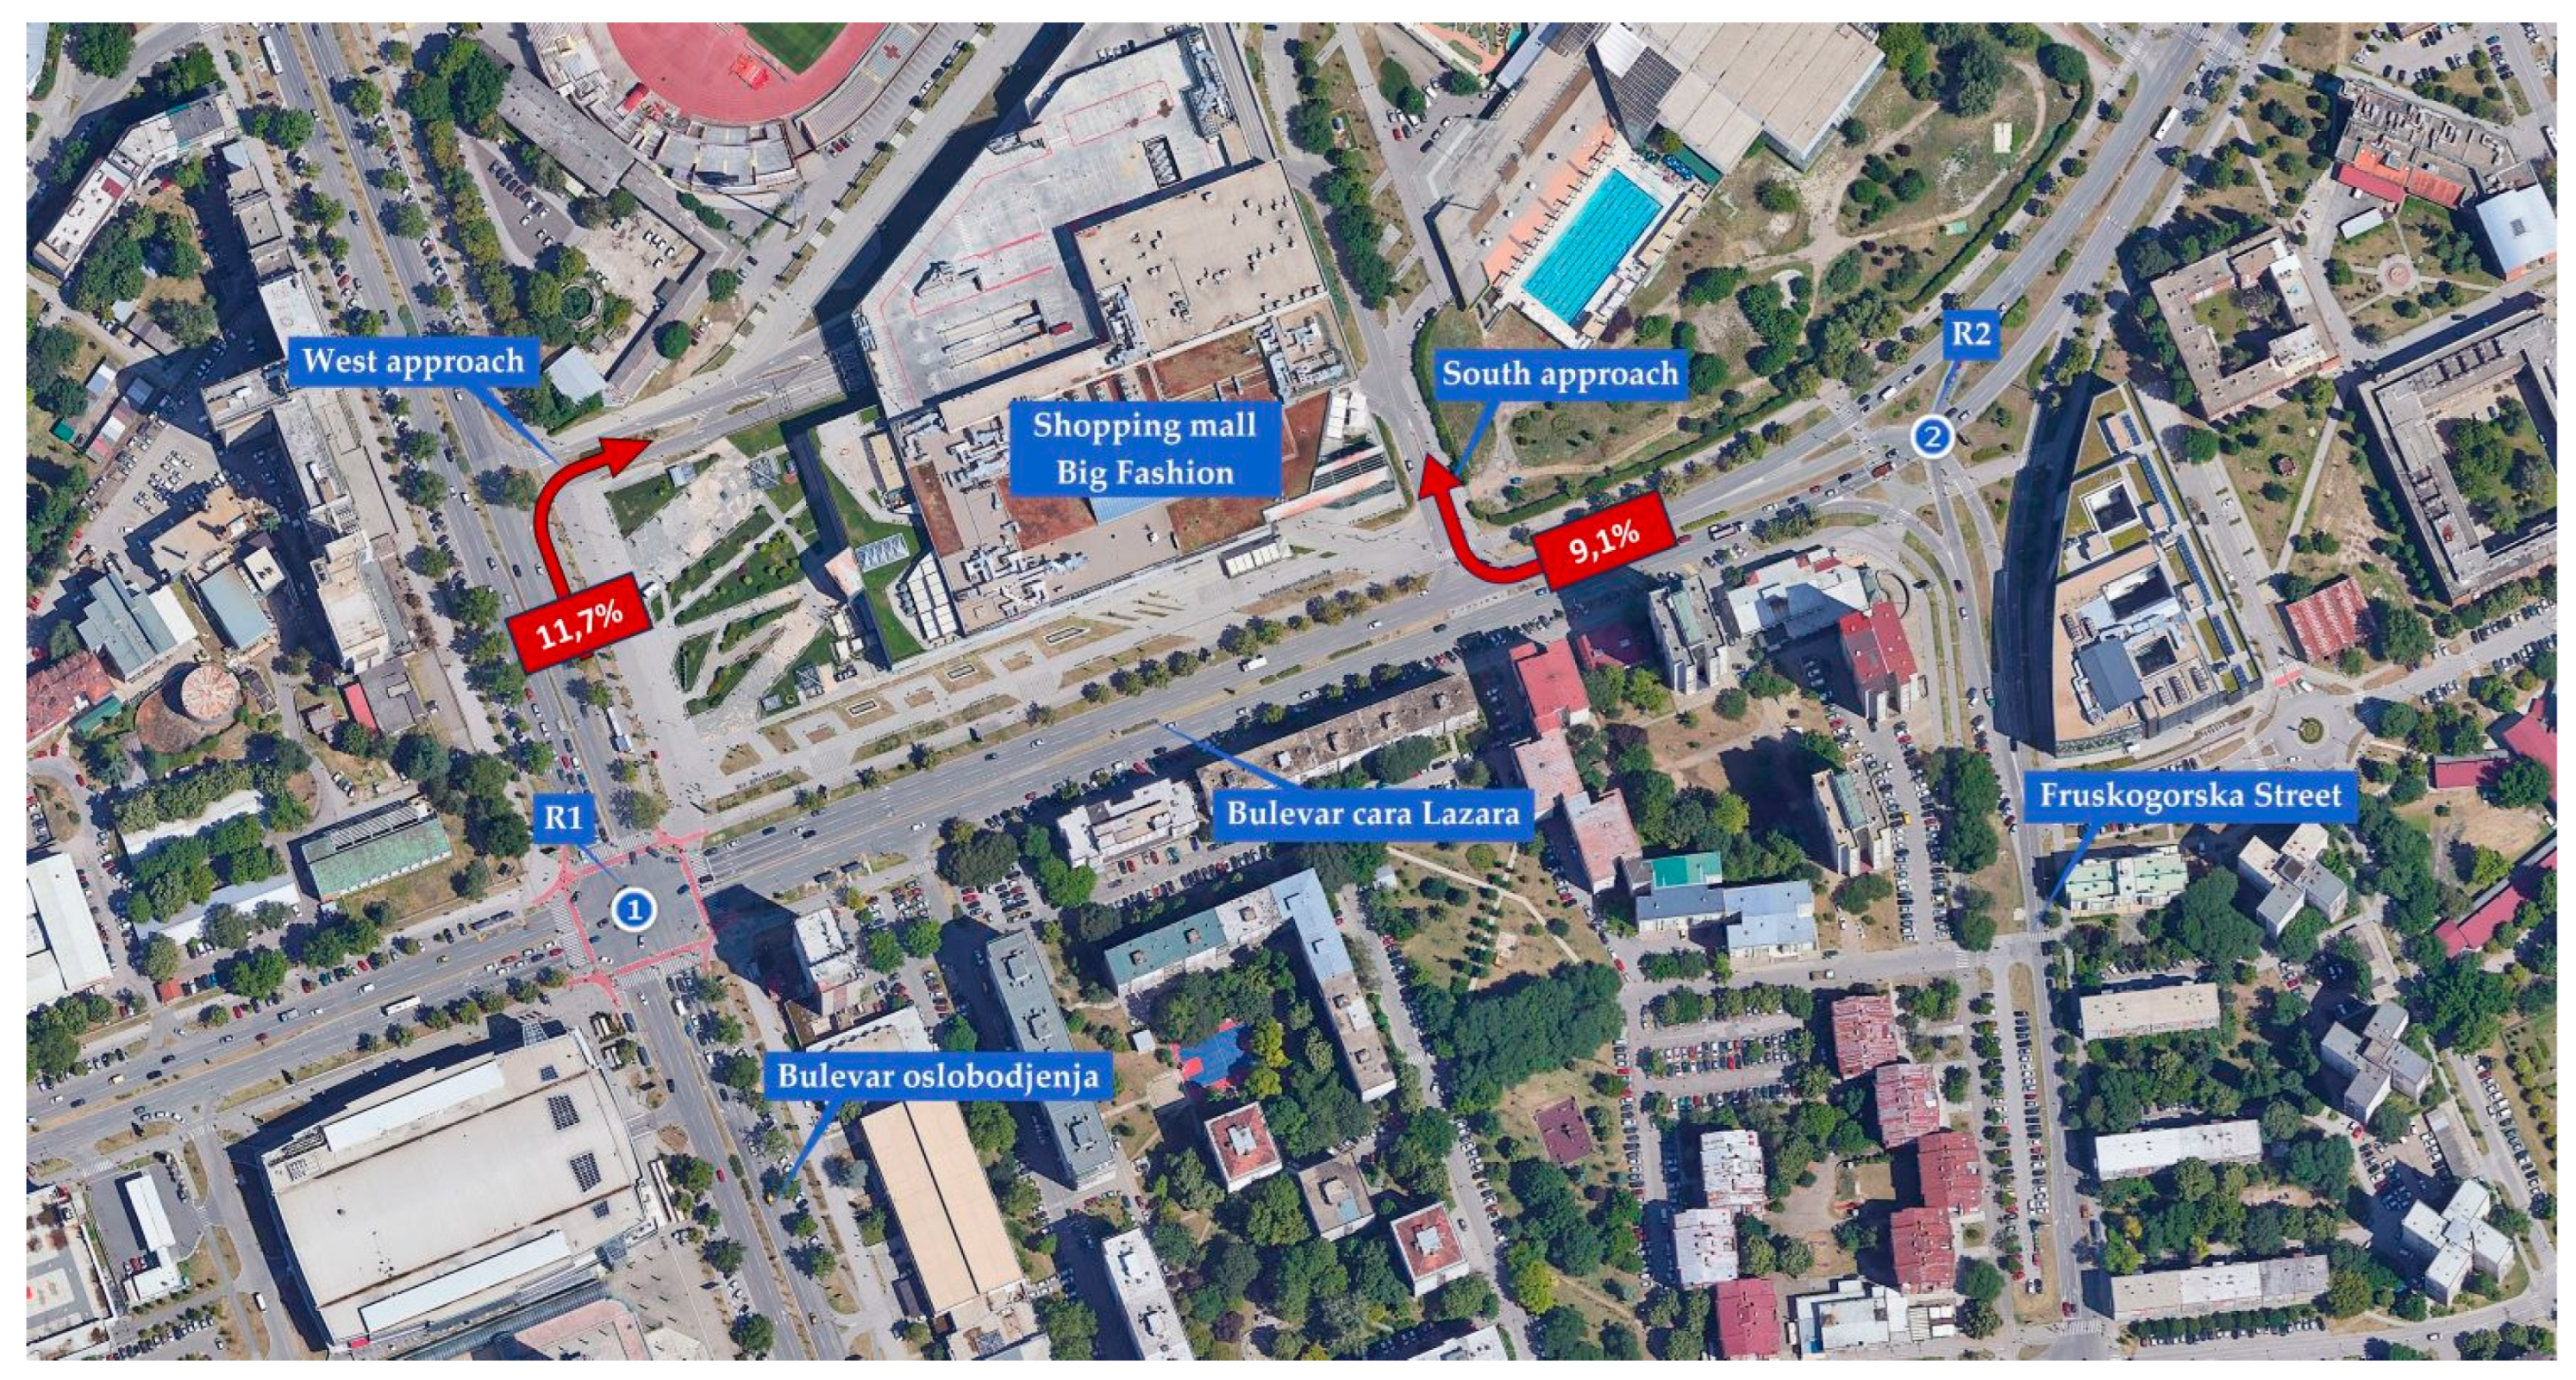
Figure 10.
Hourly traffic volumes at intersection R2.
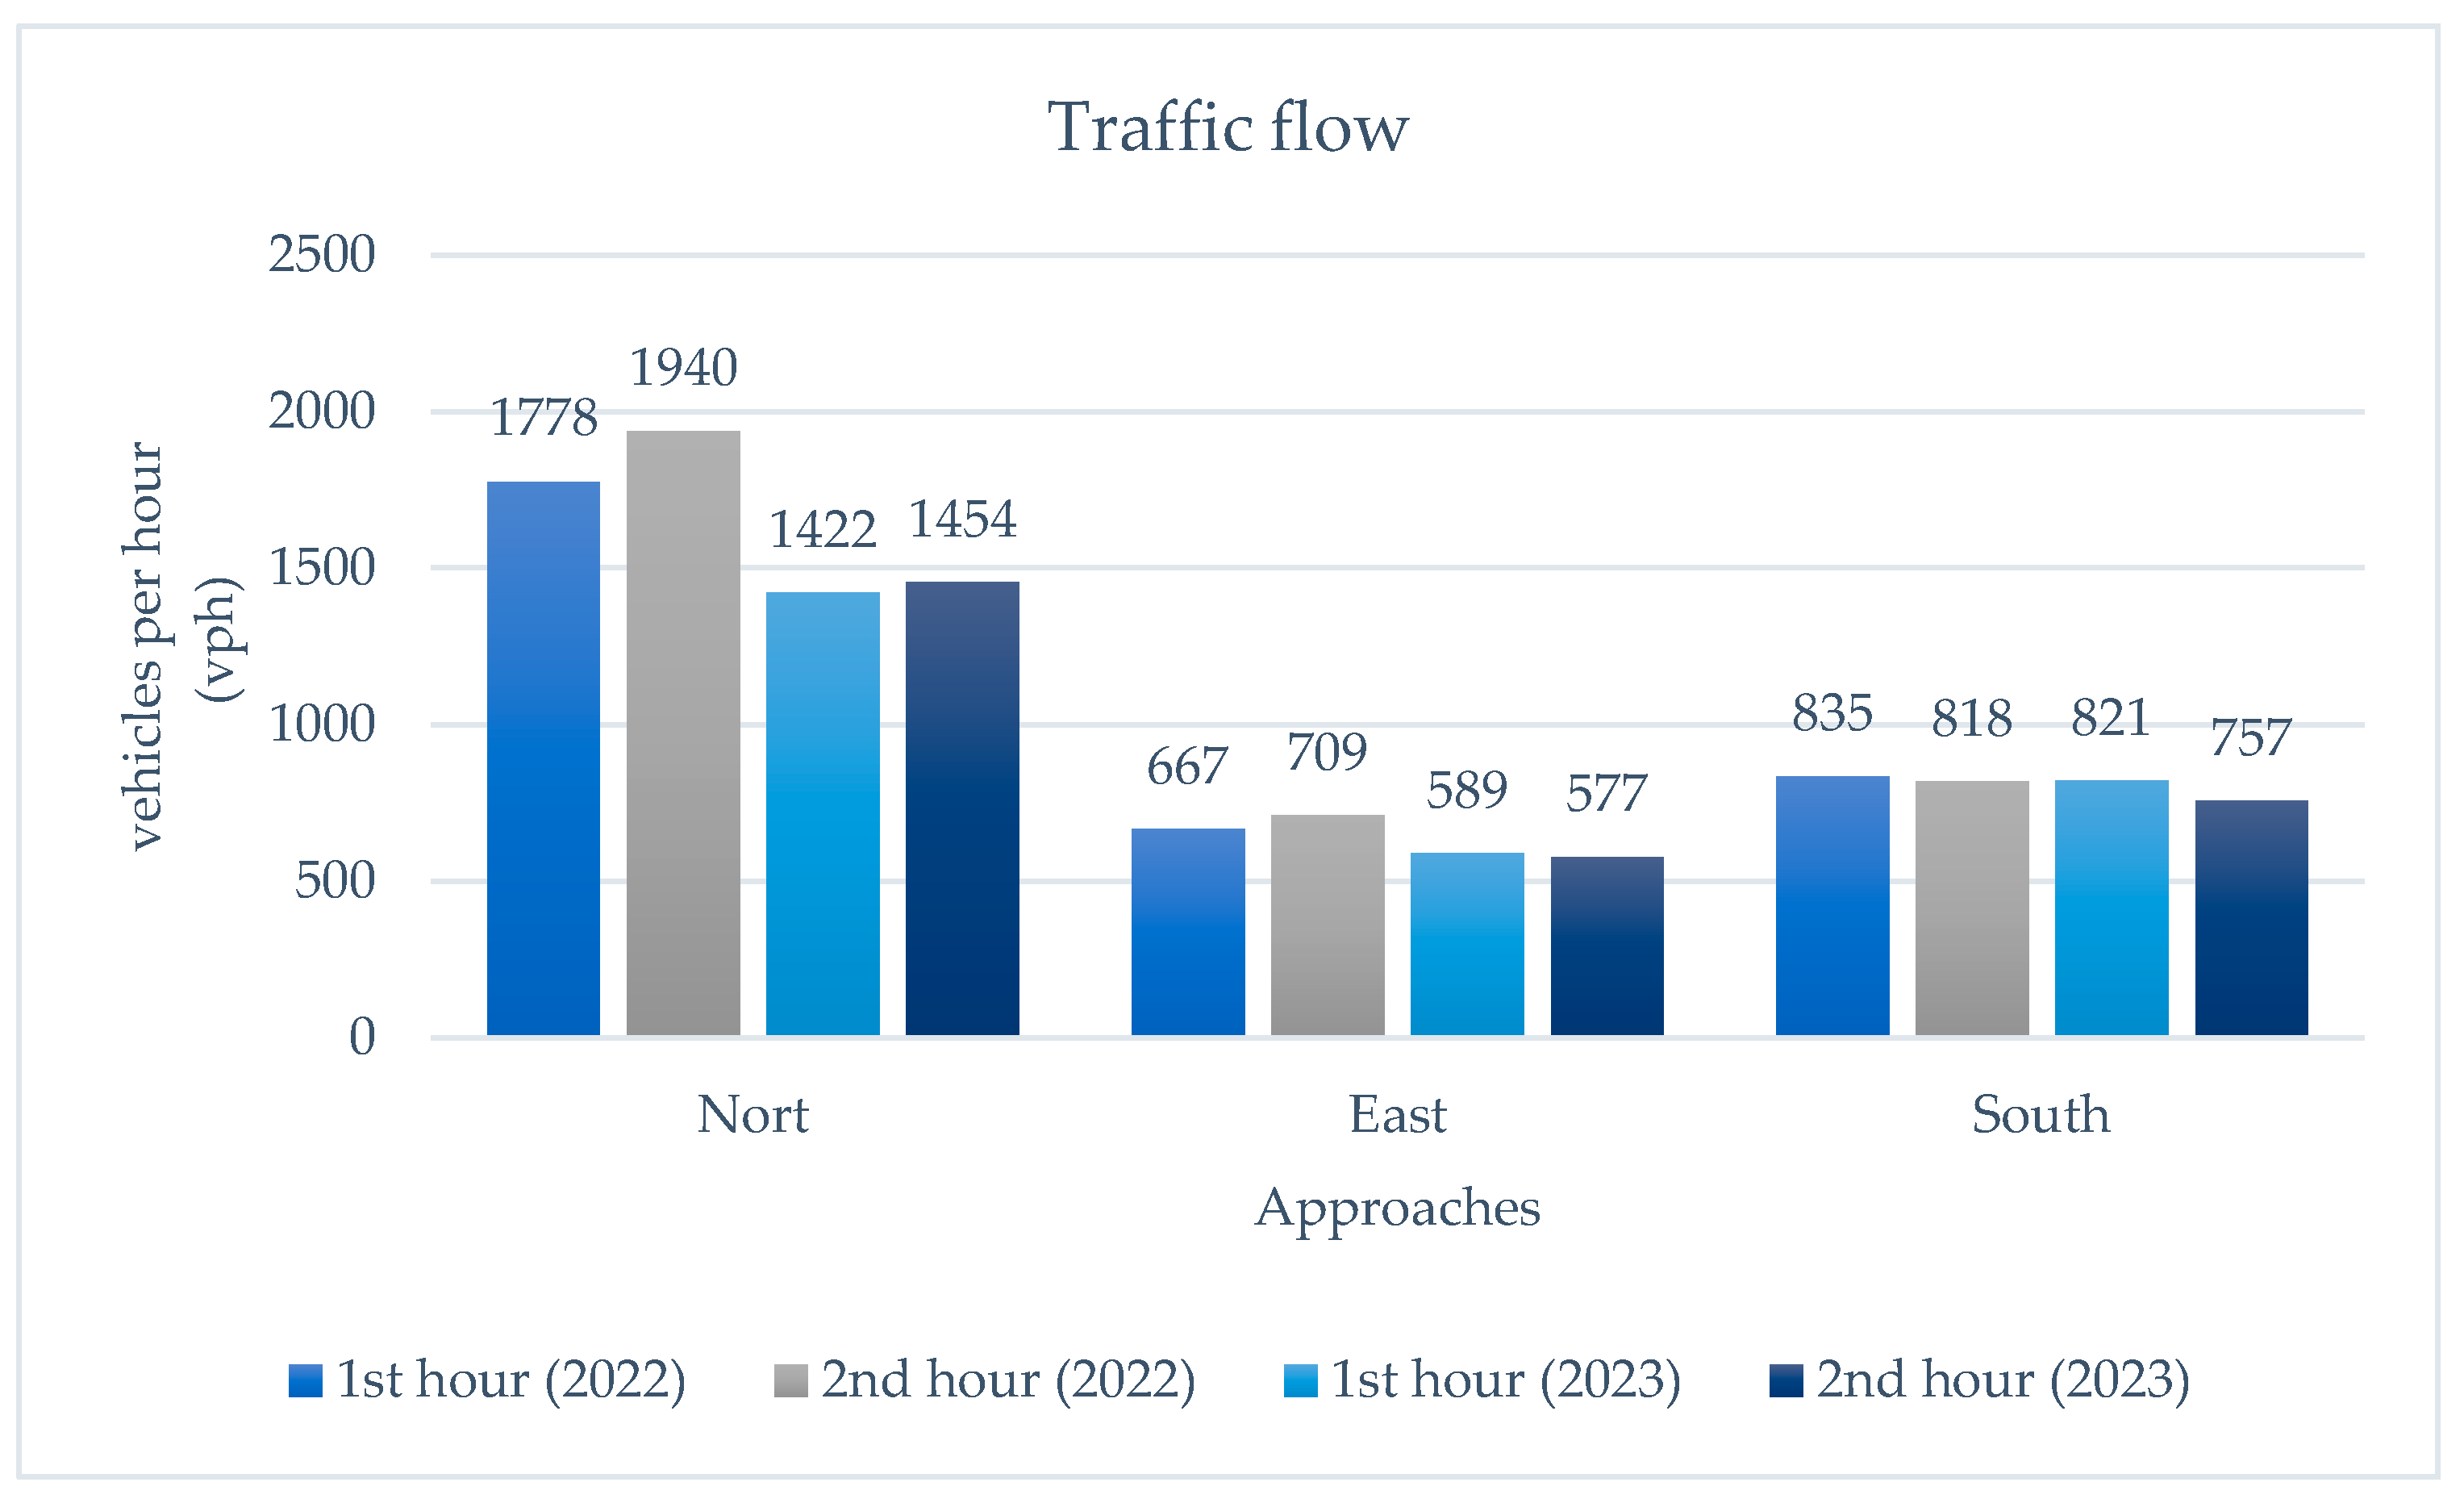
Figure 11.
Distribution of traffic flows used for simulation (a); level of service and capacity utilization at the turbo roundabout (b).
Figure 11.
Distribution of traffic flows used for simulation (a); level of service and capacity utilization at the turbo roundabout (b).
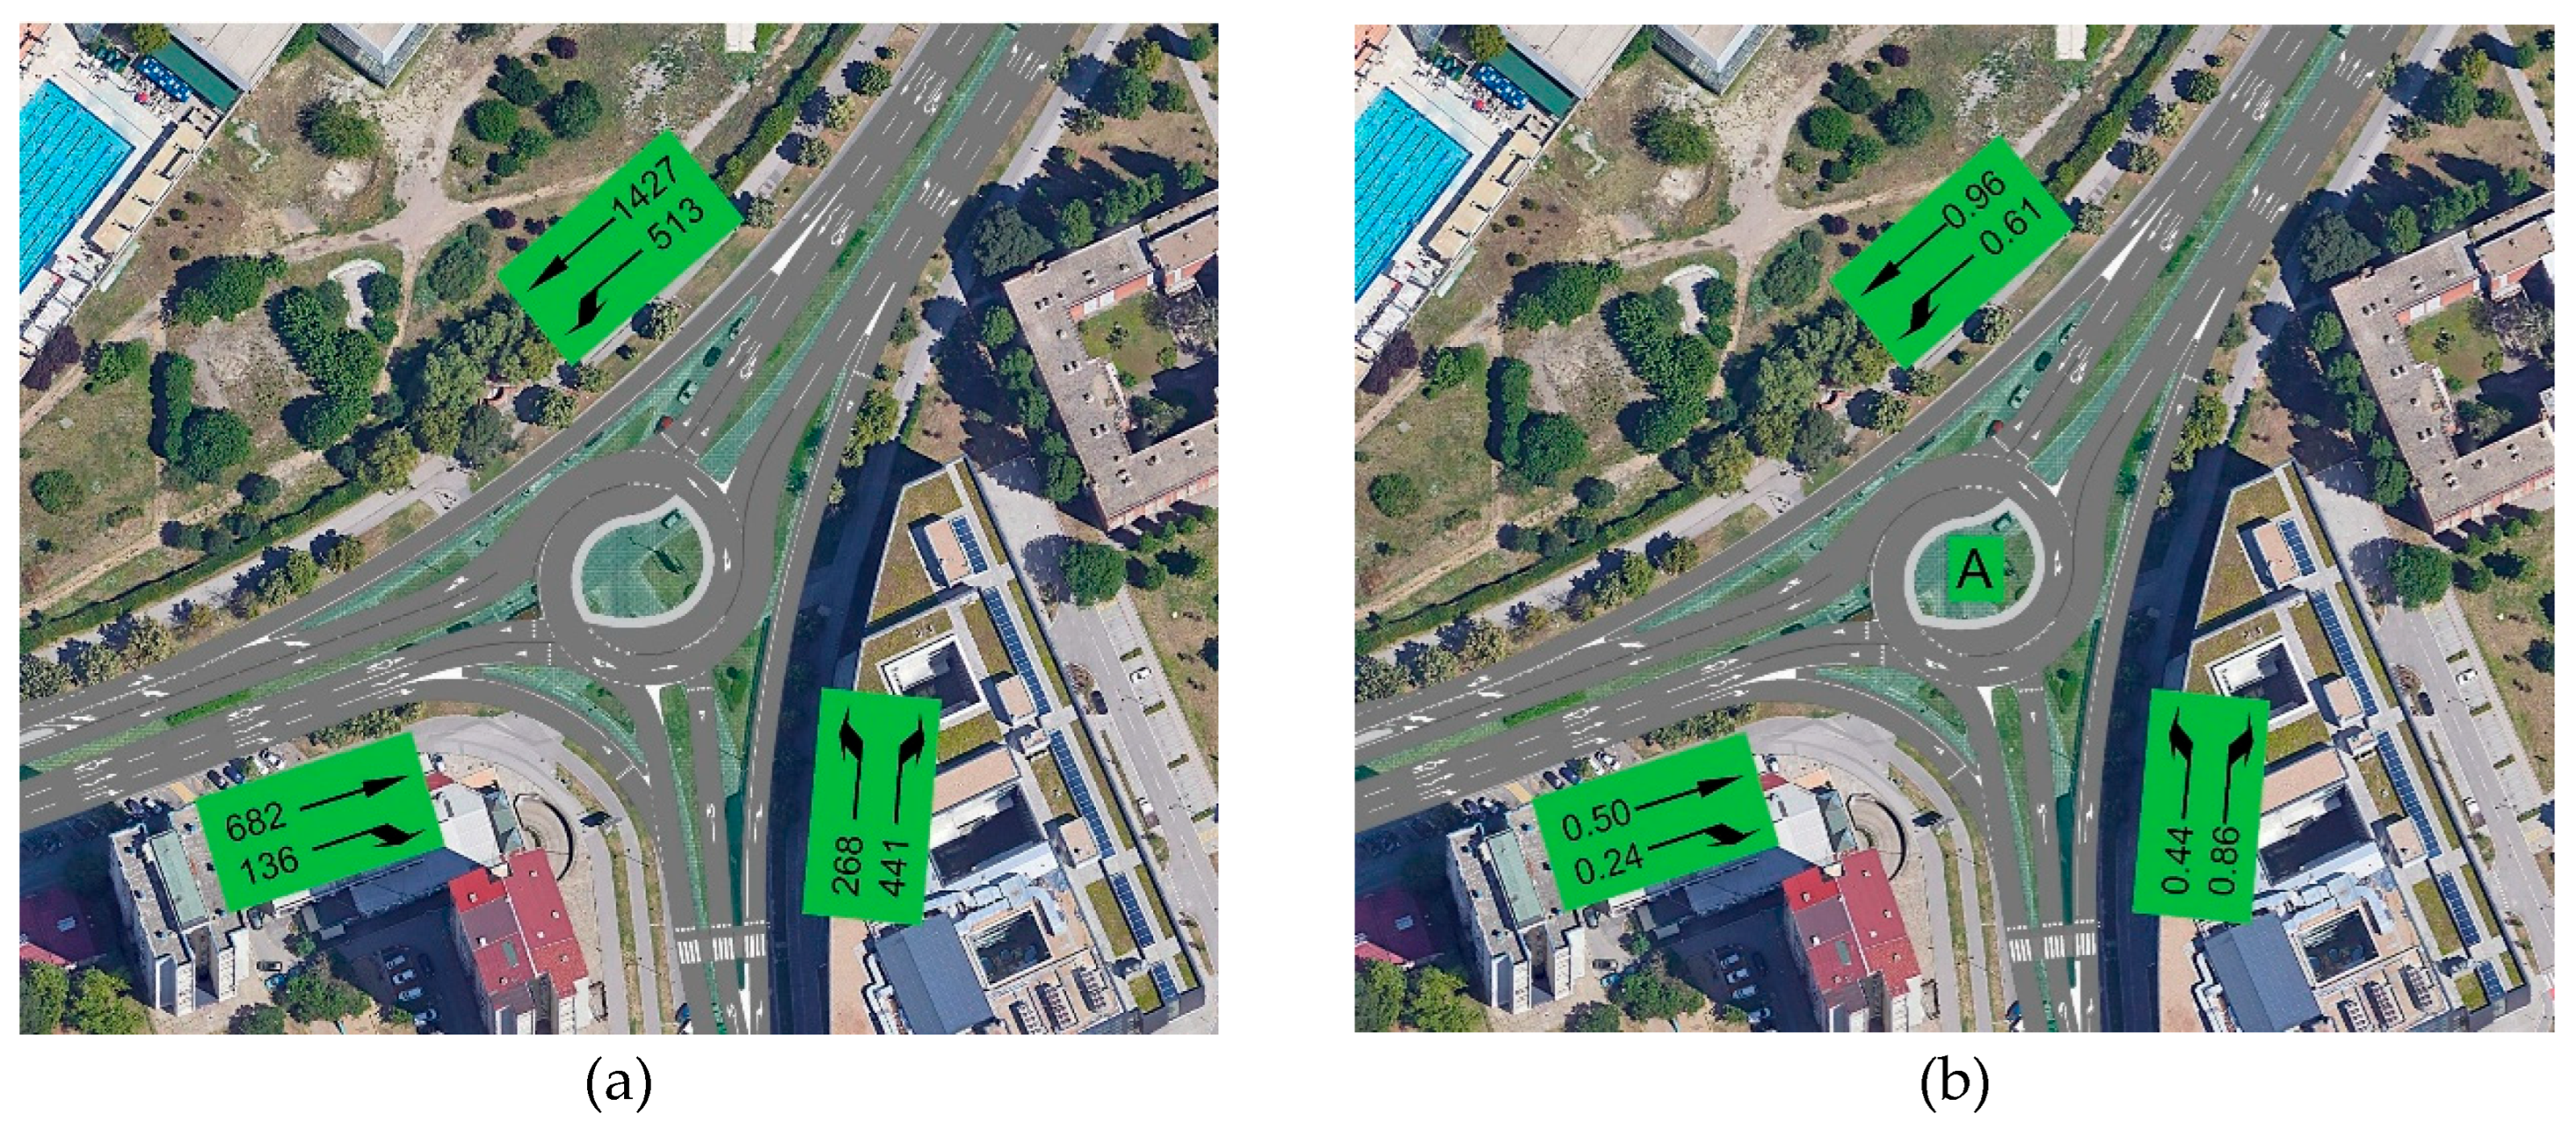
Figure 12.
Average delays (s/veh) before and after the reconstruction of intersection R2.
Disclaimer/Publisher’s Note: The statements, opinions and data contained in all publications are solely those of the individual author(s) and contributor(s) and not of MDPI and/or the editor(s). MDPI and/or the editor(s) disclaim responsibility for any injury to people or property resulting from any ideas, methods, instructions or products referred to in the content. |
© 2025 by the authors. Licensee MDPI, Basel, Switzerland. This article is an open access article distributed under the terms and conditions of the Creative Commons Attribution (CC BY) license (http://creativecommons.org/licenses/by/4.0/).
Copyright: This open access article is published under a Creative Commons CC BY 4.0 license, which permit the free download, distribution, and reuse, provided that the author and preprint are cited in any reuse.


