1. Introduction
Traffic congestion is a growing concern in urban areas, prompting traffic designers to explore innovative solutions for intersection design. Among these, roundabouts have gained attention for their ability to enhance traffic flow, reduce delays, minimize environmental impact, and improve safety [
1,
2,
3]. Despite advantages, roundabouts are not universally applicable; intersections with highly unbalanced traffic flows or those positioned within networks of signalized intersections often present challenges [
4,
5,
6,
7].
As a roundabout exceeds its designed capacity, or when conflicting flows increase, its performance deteriorates, leading to traffic congestion and delays [
4,
8]. Consequently, estimating the maximum capacity under varying levels of traffic demand would be helpful for the planning and design of roundabouts [
9]. Various countries have established technical regulations for the upper limits of traffic volume of roundabouts. In Norway [
10], for instance, single-lane roundabouts are estimated to have an Annual Average Daily Traffic (AADT) limit of 25 000 vehicles per day (veh/day), with the peak hour not exceeding 10% of the daily traffic. The maximum number of vehicles that can pass through during peak hour theoretically is 2700 vehicles per hour (veh/h), although, in practice, it has been shown to be around 2000 veh/h. In the USA [
7], single-lane, four-legged roundabouts are also limited to a capacity of 25 000 veh/day, with the ability to accommodate up to 1000 veh/h. It is recommended that the circulating flow in single-lane roundabouts should not exceed 1800 veh/h, and if exit flow exceeds 1200 veh/h, a double-lane exit may be necessary. Australian regulations [
11] recommend calculating daily capacity but suggest an approximate peak capacity of 1200 veh/h. Lastly, Slovenian [
12], Serbian [
13] and Croatian [
5] regulations dictate an AADT of 20 000 veh/day for medium-sized single-lane urban roundabouts without imposing additional restrictions or recommendations.
The integration of roundabout and signalized intersections presents additional complexities, especially when the distance between them influences their functionality. While roundabouts promote continuous flow by reducing stops and delays [
14], signalized intersections often disrupt this flow with their obligatory stop-and-go cycles. This interaction is particularly problematic when these intersections are placed in close proximity, potentially leading to reduced levels of service (LOS) and increased delays [
15,
16].
An analysis of existing regulations and research (discussed further in Chapter 2) reveals that most roundabout studies focus on isolated roundabouts – specifically their safety, capacity, and geometric design – often overlooking their interaction with adjacent intersections [
17,
18,
19]. The objective of this study is to analyze traffic indicators of a roundabout located in close proximity to a signalized intersection. The examined intersections are positioned at various distances and operate under different traffic conditions, some of which are based on preliminary experimental research. Traffic microsimulations are employed to assess the impact of varying distances between roundabouts and signalized intersections under diverse traffic volumes and distribution patterns. The aim is to evaluate the effect of these factors and, through the analysis of travel times between the roundabout and the signalized intersection, to develop a model for optimizing their integration within the urban network.
2. State of Art
When determining the optimal intersection type for a specific location, various factors should be considered, such as traffic volume, road layout, safety concerns, and the transportation system's overall objectives. This literature review examines research primarily related to optimizing the distance between intersections and analyzing the functionality of roundabouts using traffic microsimulations.
2.1. Signalised Intersection and Roundabout in Close Proximity
In urban areas, although a more significant number of intersections are signalized, the more common solution in reconstruction is a roundabout. The literature emphasizes that positioning a roundabout between two adjacent signalized intersections should be avoided [
5,
6,
17]. Lenters [
16], Hallmark [
14] and Benigar [
17] express concern that a roundabout in a coordinated signalized corridor will disrupt continuous traffic flow: downstream signals can more efficiently process vehicles in a platoon, and roundabouts disperse rather than form platoons. Unnecessary queuing may result when roundabouts are downstream of signalized intersections. On the other hand, if operating at or below capacity, roundabouts experience less queuing than signalized intersections - the queues for the signals will govern and, in the case of a more significant amount of traffic, have a negative impact on the roundabout capacity. At roundabouts, no reconstruction or subsequent signalization would improve capacity, so it is important to analyze and predict the increase in traffic volumes in the project period at the very start and, if possible, expect an even more significant increase than that at regular intersections [
5]. While the roundabout may solve safety and operational problems at one intersection, it may adversely affect another intersection upstream or downstream or corridor performance as a whole [
16]. As a result, consideration should be given to how roundabouts affect traffic operations in a corridor.
Hallmark et al. [
16] analyzed the impact of roundabouts on traffic flow in signalized corridors using traffic microsimulation through two case studies. In Ames, Iowa, a corridor along US-69 was examined under three scenarios: an optimized signal plan for the existing intersection, the addition of a left-turn lane, and replacing the existing intersection with a roundabout. The findings revealed that the roundabout reduced vehicle delay and travel times during peak hours. Still, similar improvements were observed with the alternative signalized solution incorporating the added left-turn lane. In Woodbury, Minnesota, the implementation of a two-lane roundabout resulted in reduced delay times; however, there were no significant changes in travel times.
Bared and Edara [
15] investigated the capacity of single-lane and two-lane roundabouts by comparing microsimulation results (VISSIM) with empirical and analytical models. Their findings indicated that microsimulation data were generally lower but closer to field measurement data collected in the United States. The study also examined the impact of placing a roundabout within a signalized corridor, noting that while roundabouts positively influence traffic flow under lower traffic volumes. However, when the roundabout operates near capacity, the fully signalized intersections have a slightly lower overall delay.
In the Report [
22] two corridors were evaluated through microsimulations: Grand Avenue Corridor and Radio Drive, USA, which involved the implementation of four-legged roundabouts. Both analyses showed only marginal reduction in stop delay and travel time with the introduction of roundabouts. The conclusion was that roundabout did not offer a significant advantage compared to adding left turn lanes and optimizing signal timings.
2.2. Microsimulations
The behavior of traffic systems is stochastic and depends on numerous factors. However, conducting experiments on real traffic networks can be time-consuming and pose safety risks. While various models have been developed to analyze different aspects of traffic flow, roundabout modeling has not received as much attention as signalized intersections [
23]. To evaluate the functionality of roundabouts, traffic microsimulations are typically used. These simulations consider various variables and parameters and model the movement of individual vehicles within a roundabout to provide a detailed view of traffic flow. Analyses can assess how well a roundabout handles traffic under different conditions by simulating vehicle behavior, such as acceleration, deceleration, lane changes, and merging. Microsimulations also allow for the evaluation of a roundabout's capacity and efficiency, including the determination of queue lengths, delays, and the number of vehicles that can pass through the roundabout over a given period [
9,
24,
25]. Furthermore, microsimulations can identify potential safety issues with a roundabout's design by simulating conflict points and assessing accident likelihood, thus proposing safety improvements. Chapter 2.1 highlights the benefits of incorporating microsimulations when planning corridor roundabout implementation. Numerous studies have demonstrated the value of utilizing microsimulations during the planning stage to assess the safety and operational impact of novel roundabout designs, such as those in the European road networks [
9,
26,
27]. Microsimulations, with correct input parameters, very realistically depict the actual situation, but the results show that capacity changes drastically with traffic factors. Therefore, many researchers are focusing on establishing improved capacity models for the calibration of microsimulations [
9,
28,
29].
While there is currently no research systematically analyzing the effect of signalized intersections on roundabouts within urban areas, existing studies emphasize the necessity of conducting thorough analyses prior to implementing any intersection changes. It is important to consider the broader traffic context when making these decisions. While the highway corridors in the USA differ from the urban zones of European cities, they demonstrate the viability of incorporating roundabouts into signalized networks in certain circumstances.
3. Materials and Methods
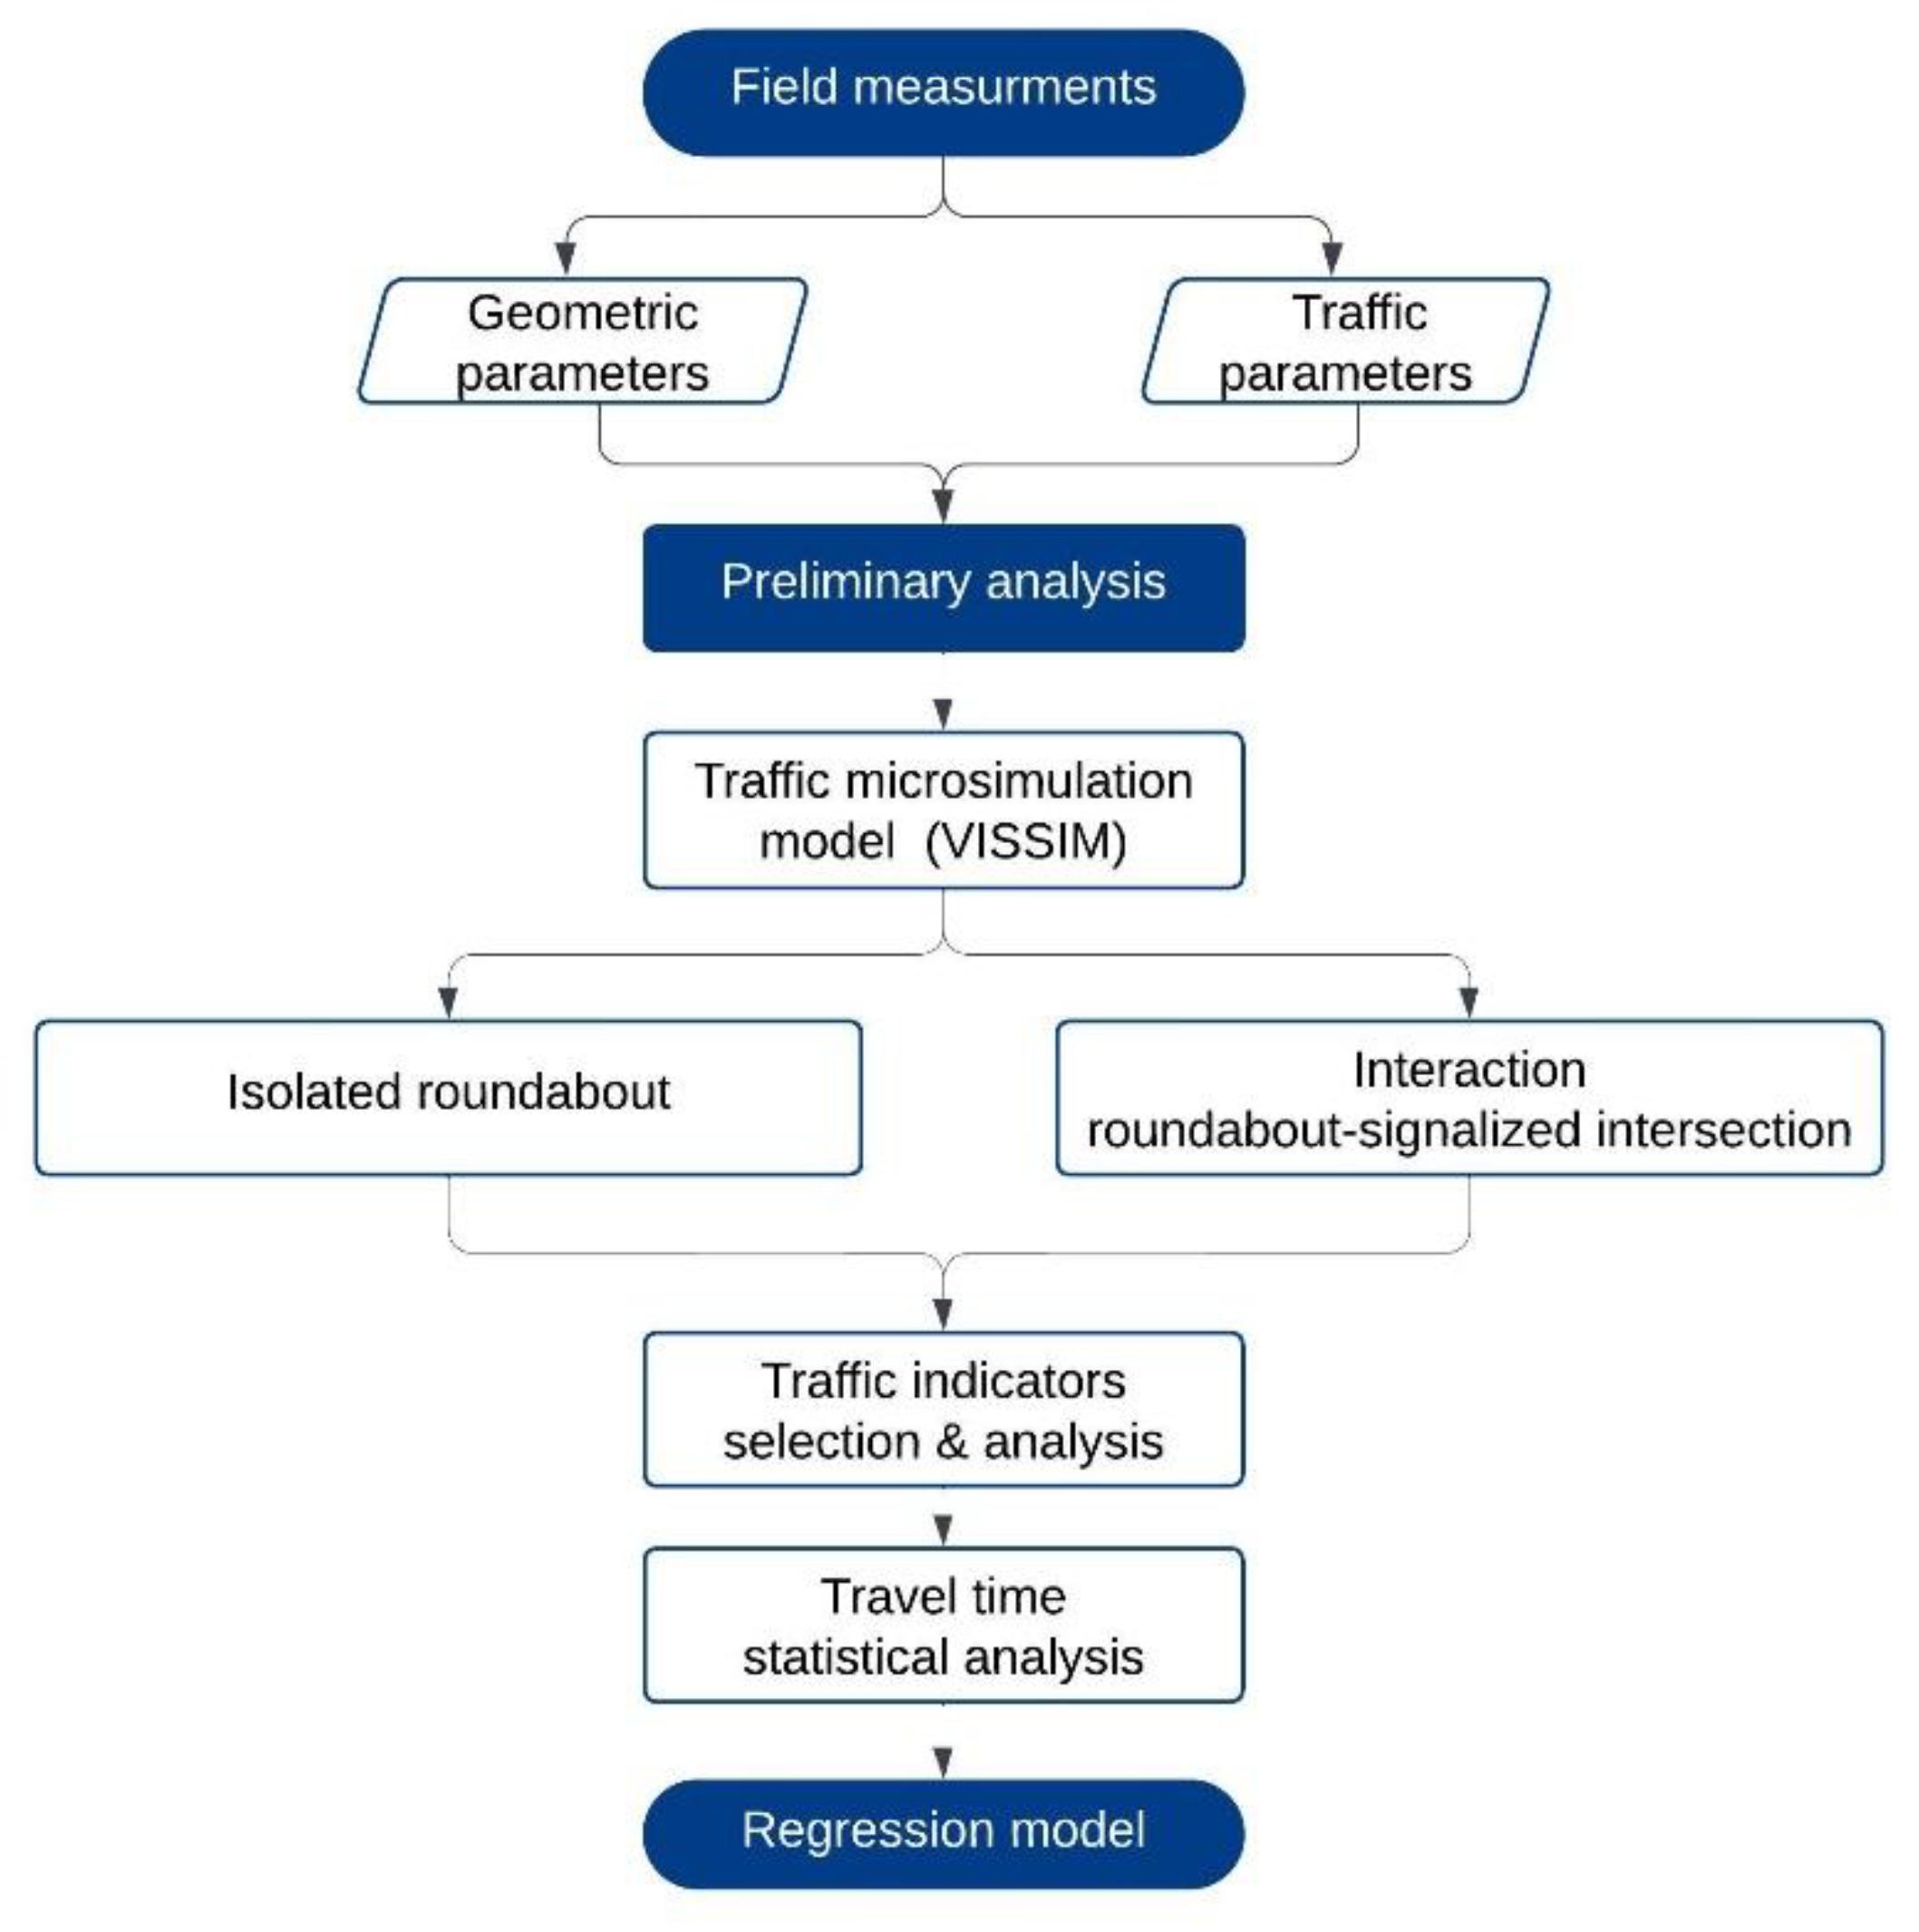
Based on field measurements, a preliminary analysis was conducted, which served as the foundation for creating traffic microsimulation models under various scenarios. The microsimulation models developed in VISSIM were employed to investigate different situations involving both isolated roundabouts and roundabouts interacting with signalized intersections. From the results, a regression model was established to predict travel time based on peak traffic load, traffic distribution, and the distance between intersections. The methodology is illustrated in the Flow Chart (
Figure 1).
VISSIM is a microscopic simulation program that enables analyses of traffic flows and the traffic flow indicators. Unlike other microsimulation models based on intersections and connections, the VISSIM network model is structured through links and connections, allowing for complex intersection modeling. The model employs a stochastic, discrete, time-adjusted approach that factors in psychophysical characteristics of a car following and algorithms based on driving rules for vehicles joining from the minor direction [
30]. Stochastic methods are commonly used in traffic engineering to account for uncertainties and variability in traffic patterns and behaviors, incorporating randomness to reflect real-world scenarios better [
31]. A preliminary analysis was conducted to define the input parameters for the VISSIM model.
3.1. Preliminary Analysis
The research study gathered data from seven single-lane roundabouts located in the wider area of the city of Rijeka, Croatia. Croatian Guidelines [
5] classify this size as medium-sized urban roundabouts (with outer radii ranging from 15 to 20 meters). This type of roundabout is typically constructed at intersections in urban areas that experience higher traffic loads. Their design and technical elements are selected to permit speeds of up to 40 km/h, and they have an estimated capacity of 20,000 vehicles per day [
5]. Traffic data collected in the field, as well as geometric elements, are presented in
Table 1. for every roundabout (RB) as follows:
number of approaches (APP)
outer radii [m] (R)
circulatory roadway width [m] (u)
entry radius [m] (Ren)
exit radius [m] (Rex)
posted speed limit major/minor direction [km/h] (PSL)
vehicle composition on major and minor direction (VehComp)
traffic volume per day [veh/day] (VehNum)
peak hour traffic volume [veh/h] (morning and evening)
traffic flow ratio of the major and minor direction (TFR) at peak hour [%]
To ensure the quality and integrity of the database, field measurements were conducted using Datacollect SRD radar traffic counters without interrupting the traffic flow (
Figure 2). On each approach, traffic counters were placed on a street light pole or traffic sign pole at a height of 2,20 m. Data was recorded in continuation for 24 hours on an average day (Wednesday and Thursday). Upon analyzing the data in
Table 1, it was discovered that between 10 000 and 23 000 vehicles pass through the roundabouts daily. To determine peak traffic hours, when congestion is at its highest due to increased traffic volume [
32], a more detailed analysis of the intersections was conducted. Traffic counter reports indicated that the morning peak hour typically occurs between 7 and 8 a.m., while the evening peak hour is between 4 and 5 p.m. Further analysis revealed that, on average, the afternoon peak hour experiences 1,19% more congestion, which served as the reference point for additional data analysis. Traffic counters also provide insight into the traffic structure, revealing that the main flow consists of an average of 94,5% cars, 3,5% trucks, 1% buses, and 1% Heavy Good Vehicles (HGV >13 m), while the minor flow comprises 95,3% cars, 3,5% trucks, 0,7% buses, and 0,5% HGV on average. Based on traffic volumes, it was determined that between 7,5% and 9,7% of the total daily traffic passes during the peak hour. The traffic flow ratio in the major and minor directions is very diverse among the observed roundabouts. Accordingly, different ratios were observed in further analysis (Chapter 3.2).
3.2. Traffic Microsimulation Model
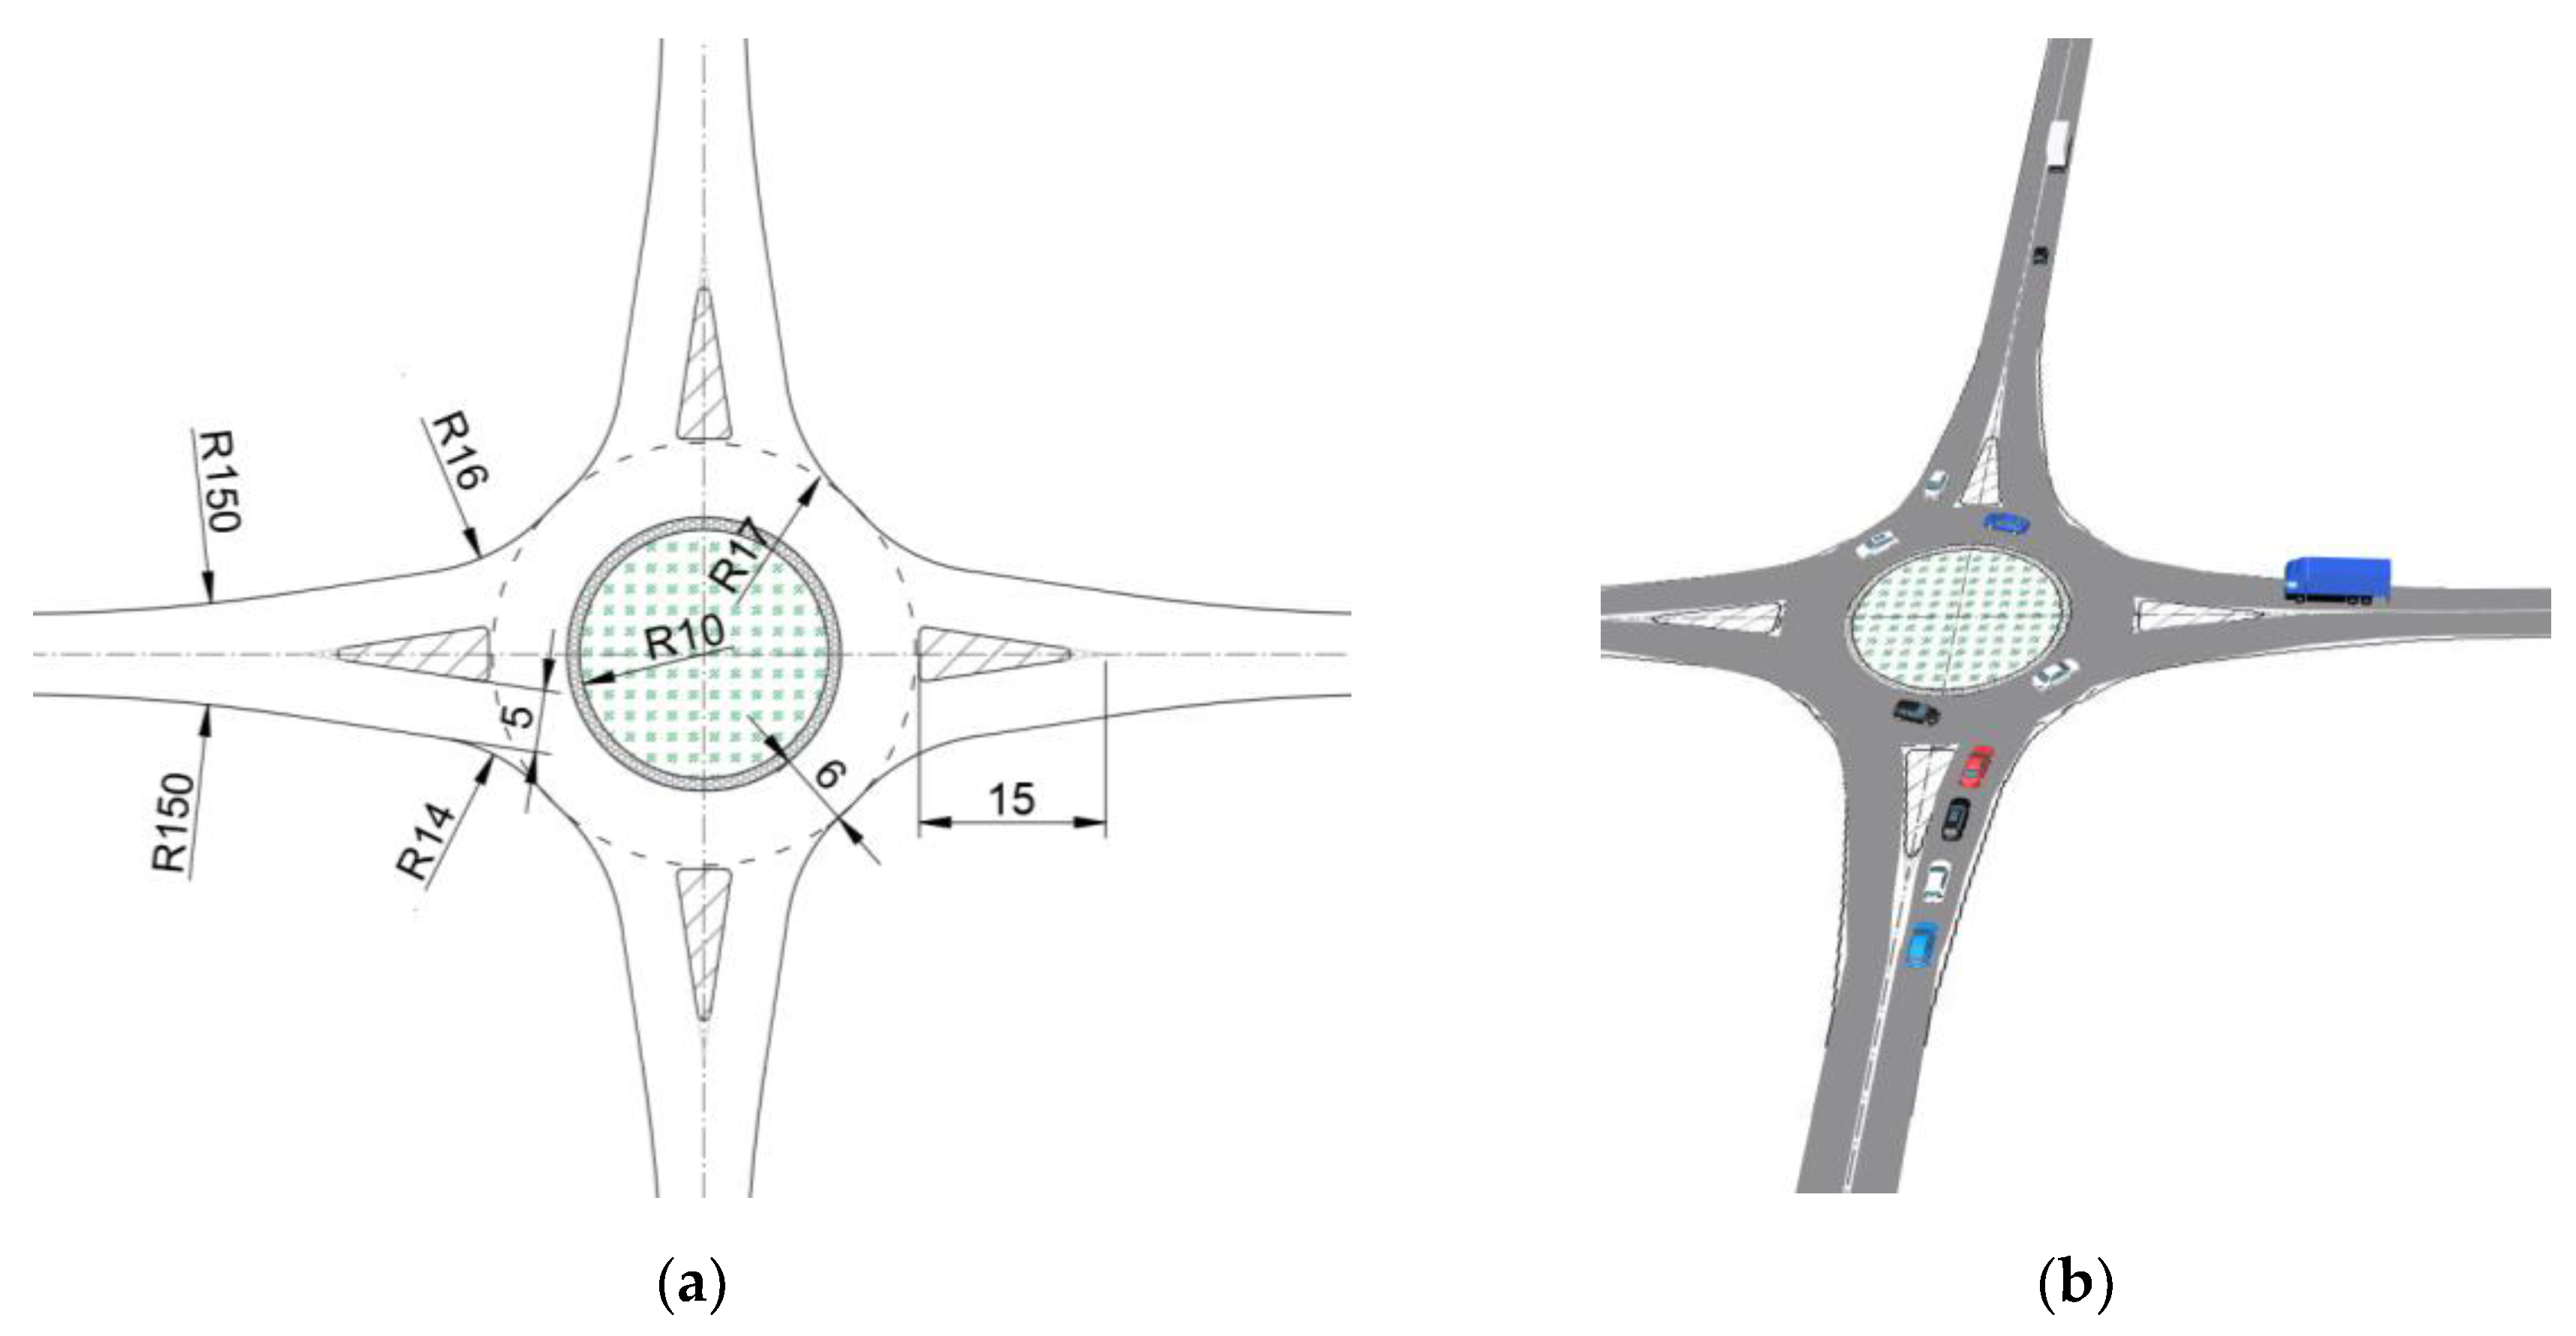
The microsimulation model was built using a standard single-lane urban roundabout of medium size, featuring an outer radius of 17 m. The model used the average geometric and traffic parameters of the roundabouts analyzed in Chapter 3.1, which are listed in
Table 2. The speed limit within a roundabout of this size, as specified by the Guidelines [
5], is 40 km/h. The defined approach speed is 50 km/h, all approaches are two-way. Šurdonja et al. (2013) suggested that the geometry of the intersection plays a significant role in the capacity of the roundabout itself, especially the design of the entrance and exit of the roundabout, that is, the distance achieved between the inflow and outflow points. For less complex and more relevant results, the ideal approach position without pedestrian interference was used (as shown in
Figure 2). The traffic structure was obtained by averaging the traffic counter data. In major directions, the traffic breakdown is as follows: 94,5% cars, 3,5% trucks, 1% buses (BUS), and 1% heavy goods vehicles (HGV, greater than 13 meters in length). In the minor direction, the vehicle composition is 95,3% cars, 3,5% trucks, 0,7% buses, and 0,5% heavy goods vehicles (
Table 2).
It should be noted that the Guidelines [
5] recommend against using a roundabout if more than 75% of daily traffic passes through the main direction. Ideally, the traffic volume should be uniform at 50%. The Guidelines, however, do not provide any restrictions on the number of vehicles during the peak hour.
After analyzing the peak hour traffic, the model was set for 5%, 6%, 7%, 8%, 9% and 10% of the maximum capacity of a medium-sized urban roundabout (20 000 veh/day), which equates for 1000 veh/h, 1200 veh/h, 1400 veh/h, 1600 veh/h, 1800 veh/h and 2000 veh/h as a peak hour traffic volume.
Given the limitations and preliminary data, three possible major-to-minor flow ratios were analyzed - 70:30, 60:40, and 50:50, as shown in
Table 3. In accordance with recommendations from [
31], ten simulations of the process were carried out for each scenario, with the average value being utilized. In total, 180 simulations of an isolated roundabout and 1620 simulations of the impact of a signalized intersection on an adjacent roundabout were carried out. The total number of microsimulations is 1800. The total duration of the simulation was 75 minutes, with 15 minutes as the initialization or warm-up period during which traffic was loaded into the road network and the system could reach equilibrium. The remaining 60 minutes were dedicated to the simulation.
Chapter 4.1 showcases the outcome of the analysis for the isolated roundabout, while the chapter 4.2 shows the analysis of the influence of a signalized intersection on the traffic indicators of the adjacent roundabout.
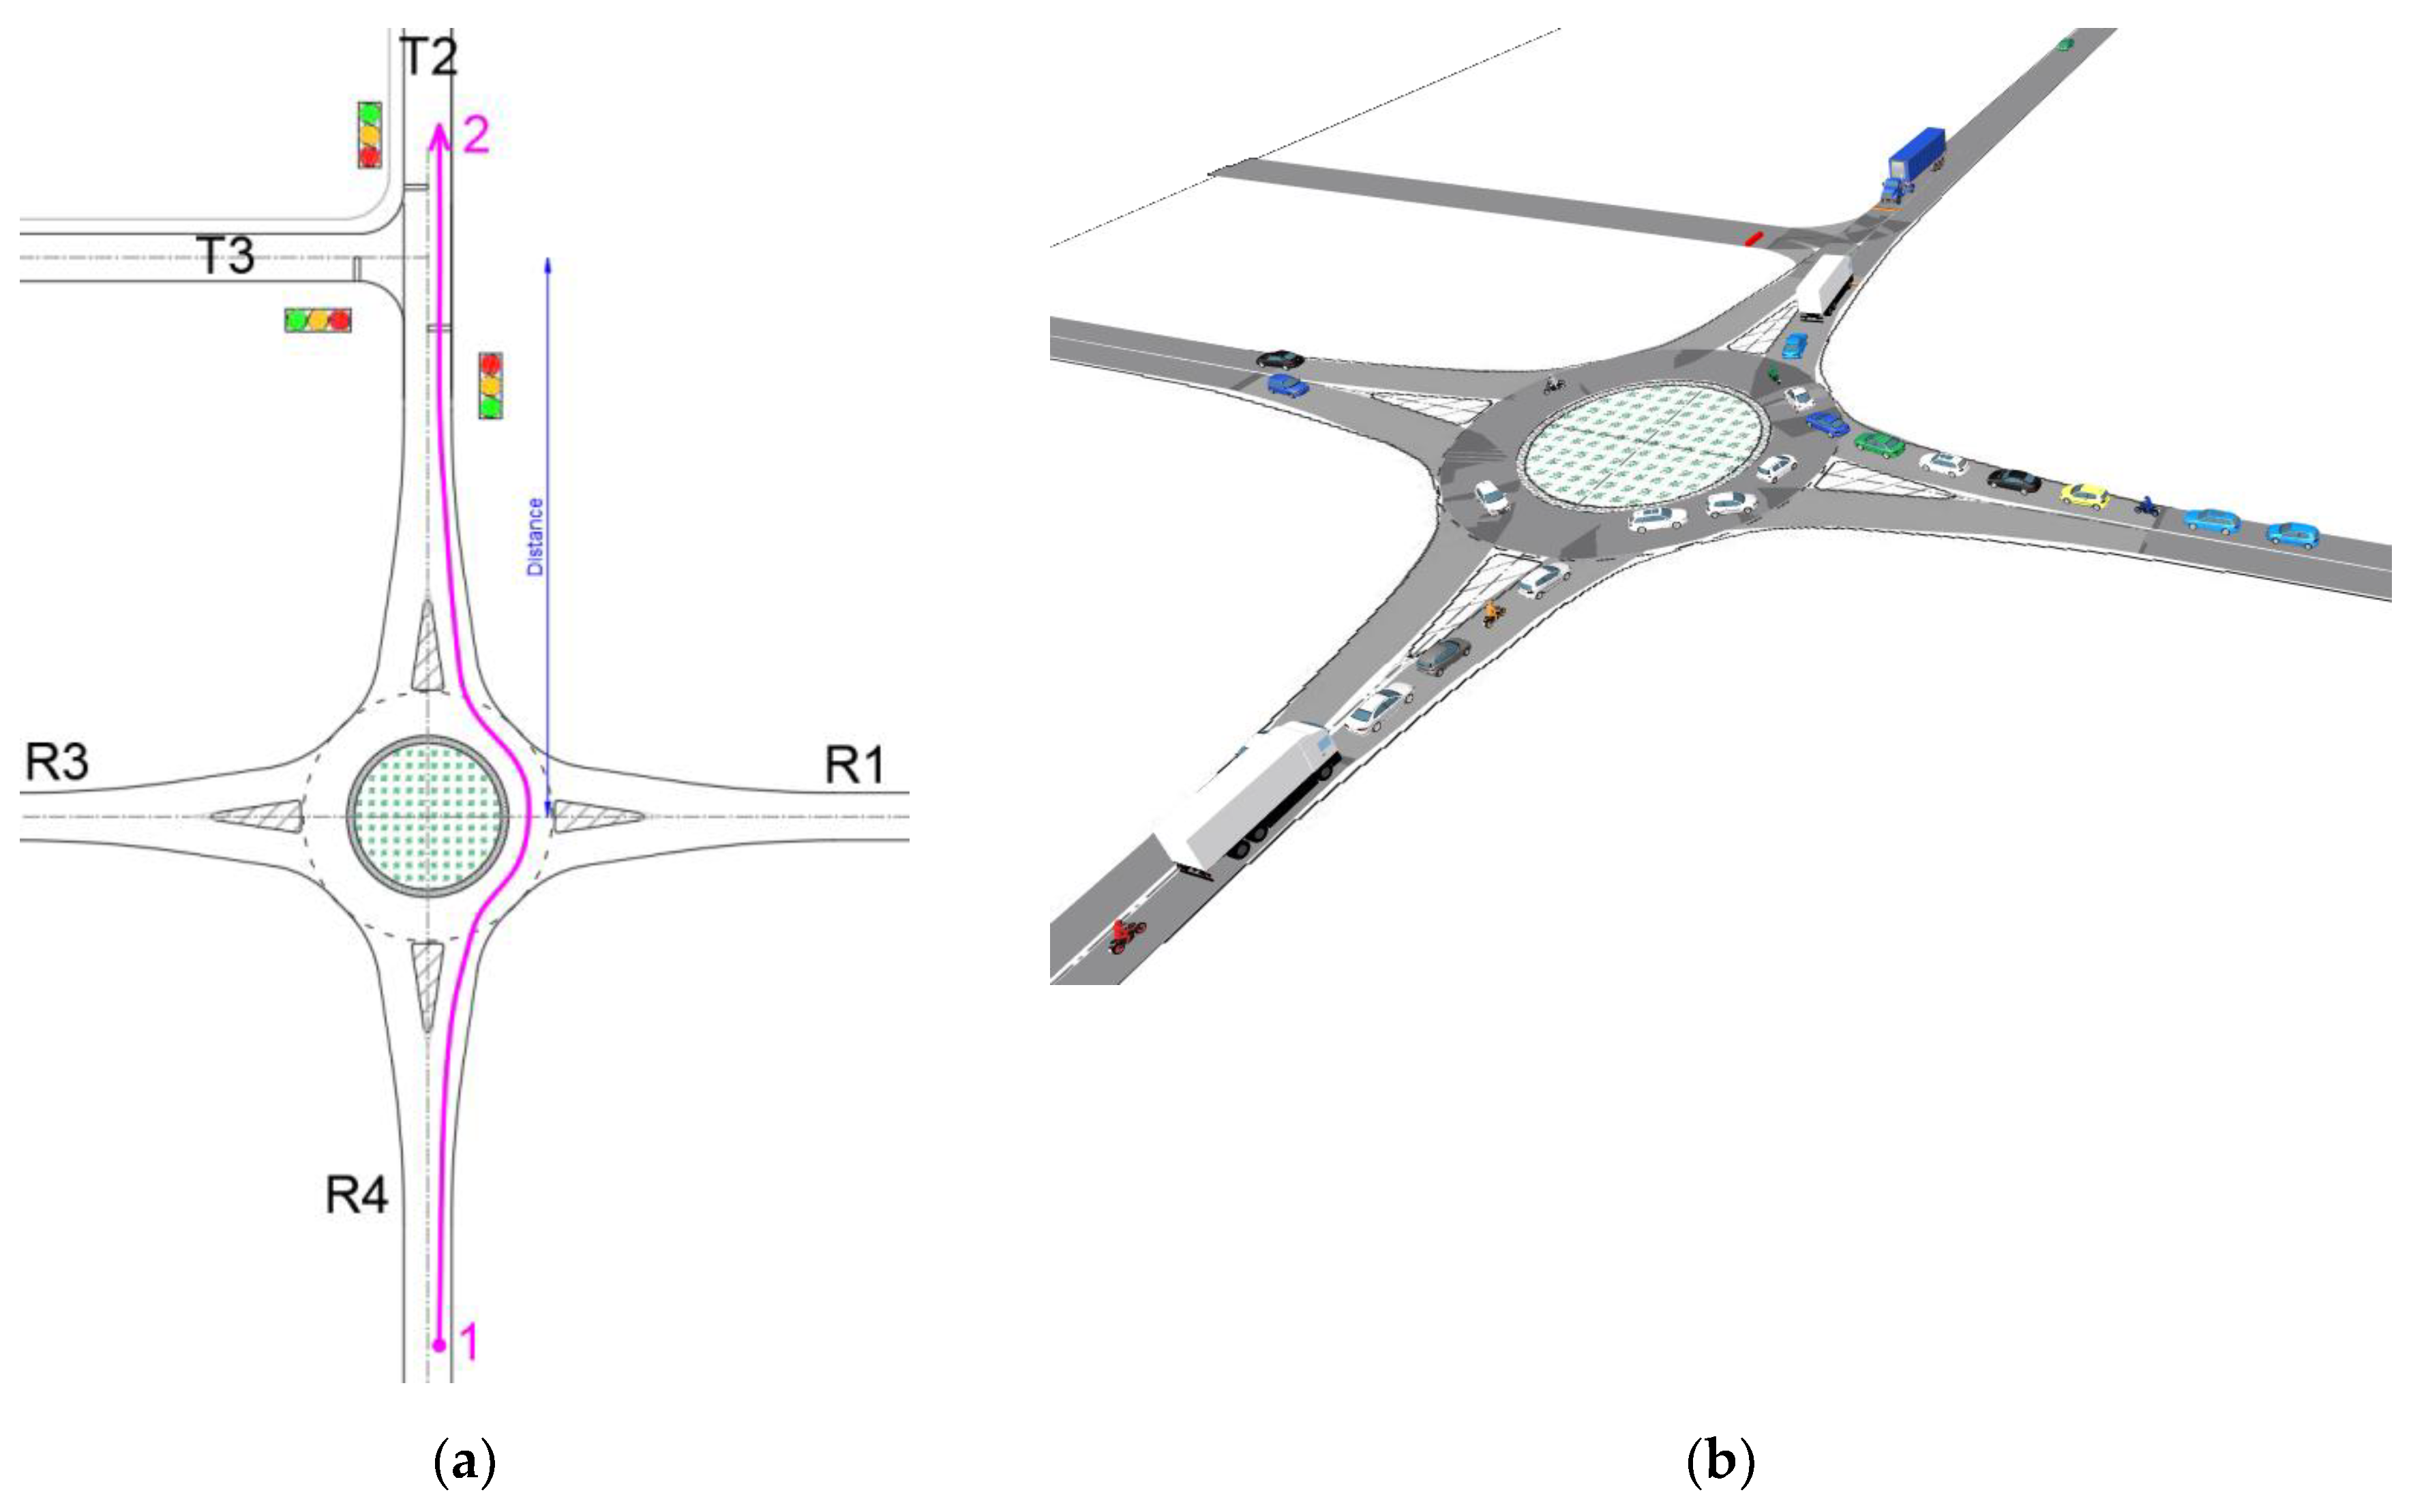
Following the successful modeling of an isolated roundabout, the subsequent step involved conducting a microsimulation to evaluate the effect of a signalized intersection on the adjacent roundabout. A three-leg signalized intersection was integrated into the network, with the distance between the roundabout’s central point and the signalized intersection ranging from 40 to 120 meters, as illustrated in
Figure 3. The minimum distance of 40 meters was established as the threshold for fitting both intersections' geometric elements. A distinct model was devised for every traffic load variation and distance of the roundabout and signalized intersection, amounting to a total of 54 models. Subsequently, each model variation underwent testing with varying traffic major to minor flow ratios.
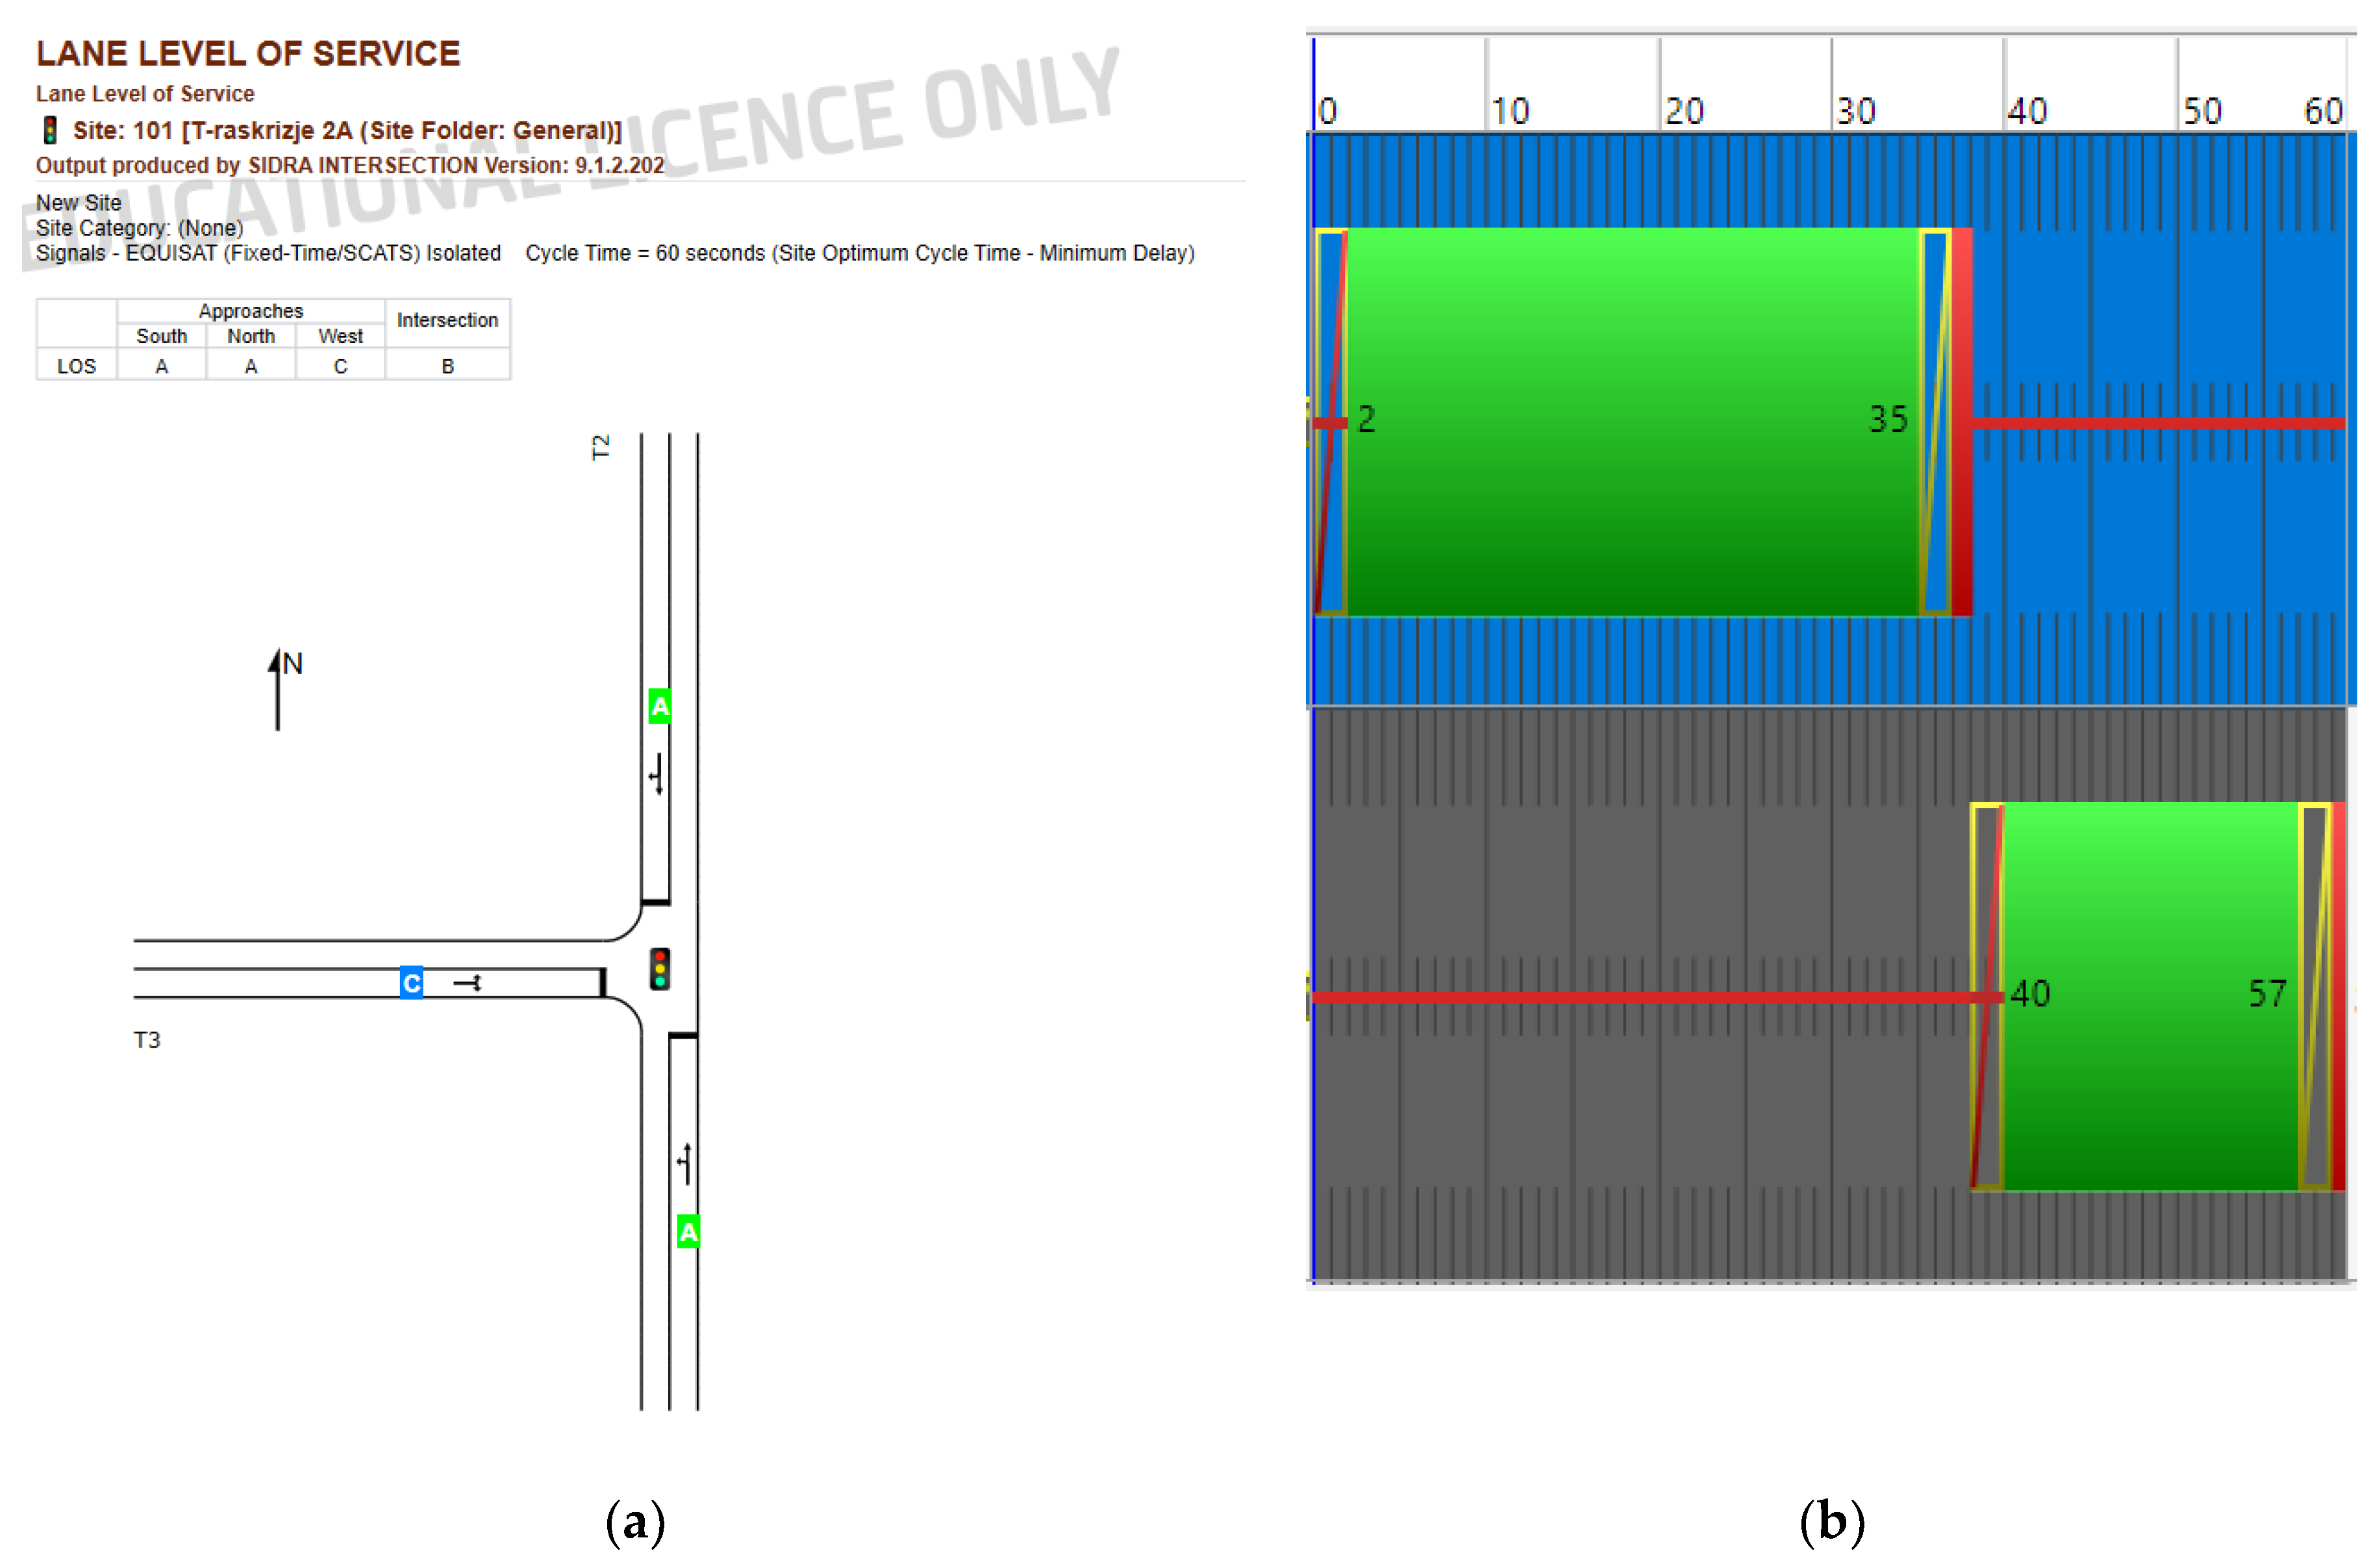
Determining the most effective cycle length for a traffic signal with two phases is dependent on a variety of factors, such as traffic volume, intersection geometry, and any unique conditions or attributes [
34,
35]. Typically, the cycle length ranges between 60 to 90 seconds [
36]. To determine the optimal cycle time, the signalized intersection was analyzed by the SIDRA Intersection program [
37]. The best level of service was obtained for a cycle of 60 seconds. It was determined that the first phase's green light lasts for 33 seconds, while the second phase's green light lasts for 17 seconds. The sequence of losses in the phase includes a 2-second yellow time, a 2-second red-yellow time, and a 1-second all-red time (as depicted in
Figure 4).
4. Results and Discussion
The results presented below are separated according to research phases: (1) isolated roundabout performance, (2) effects of the adjacent signalized intersection, and (3) statistical analysis and model development.
The results from the VISIM model are presented in
Table A1 (
Appendix A), which includes Average Queue Length (
QLen), Maximum Queue Length (
QLenMax), Number of vehicles passed through the roundabout (
VehPass), Level of Service (
LOS), Vehicle Delay (
VehDelay), Stop Delay, Number of stops (
Stops), Emission of CO (
EmissCo), Fuel Consumption (
Fuel) and vehicle travel time from roundabout to signalized intersection (
Travel Time). The travel time was analyzed for the route between defined points 1 and 2 which are 300 m away and include isolated or both intersections.
4.1. Isolated Roundabout
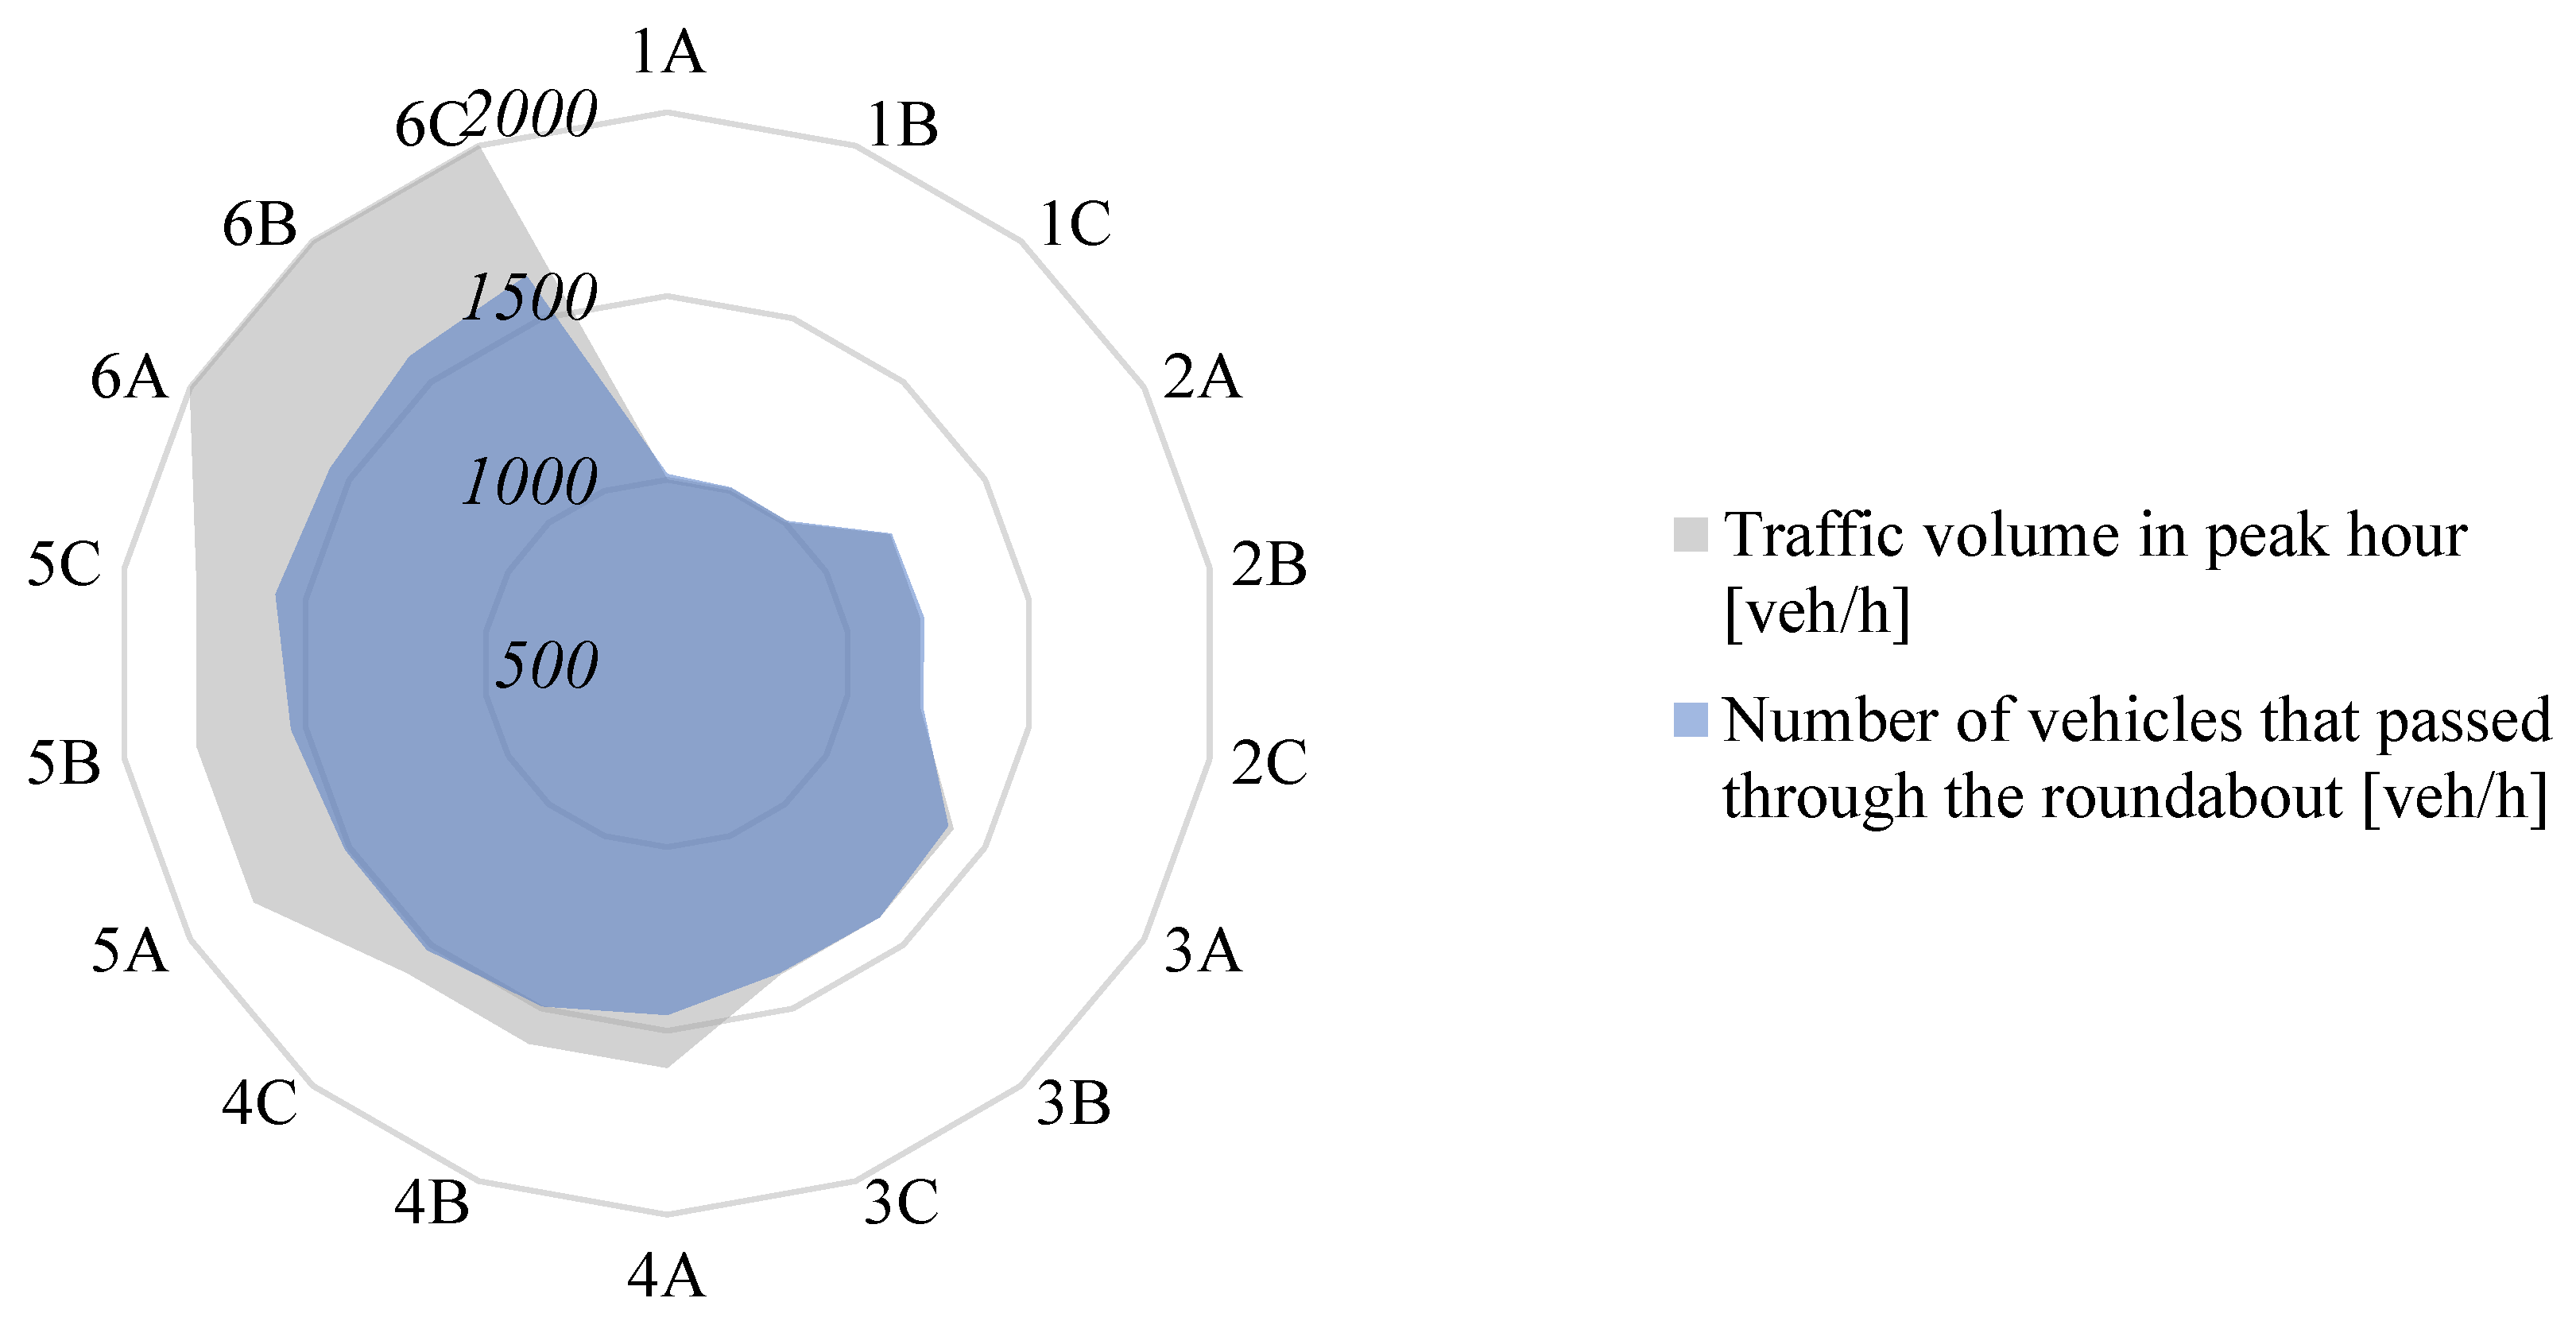
Under the lower peak-hour loads (1000-1400 veh/h), the roundabout demonstrates robust operational performance, characterized by minimal congestion and efficient traffic flow – with vehicle delay under 20 s/veh and travel time below 60 s. Congestion became severe at 9% and 10% of daily traffic (1800 veh/h and 2000 veh/h), where 15-22% of vehicles could not pass during the simulation period (
Figure 5). Delays in these scenarios increased significantly on average 3,57 times higher than the lower-load scenarios. The results also indicate that an even distribution (50:50) between major and minor direction yielded lower overall delays for moderate traffic loads. However, this trend does not hold true for scenarios with 8%, 9%, and 10% peak-hour traffic. Therefore, it is advisable to exercise caution when interpreting the results of these scenarios as they are not comparable to other results.
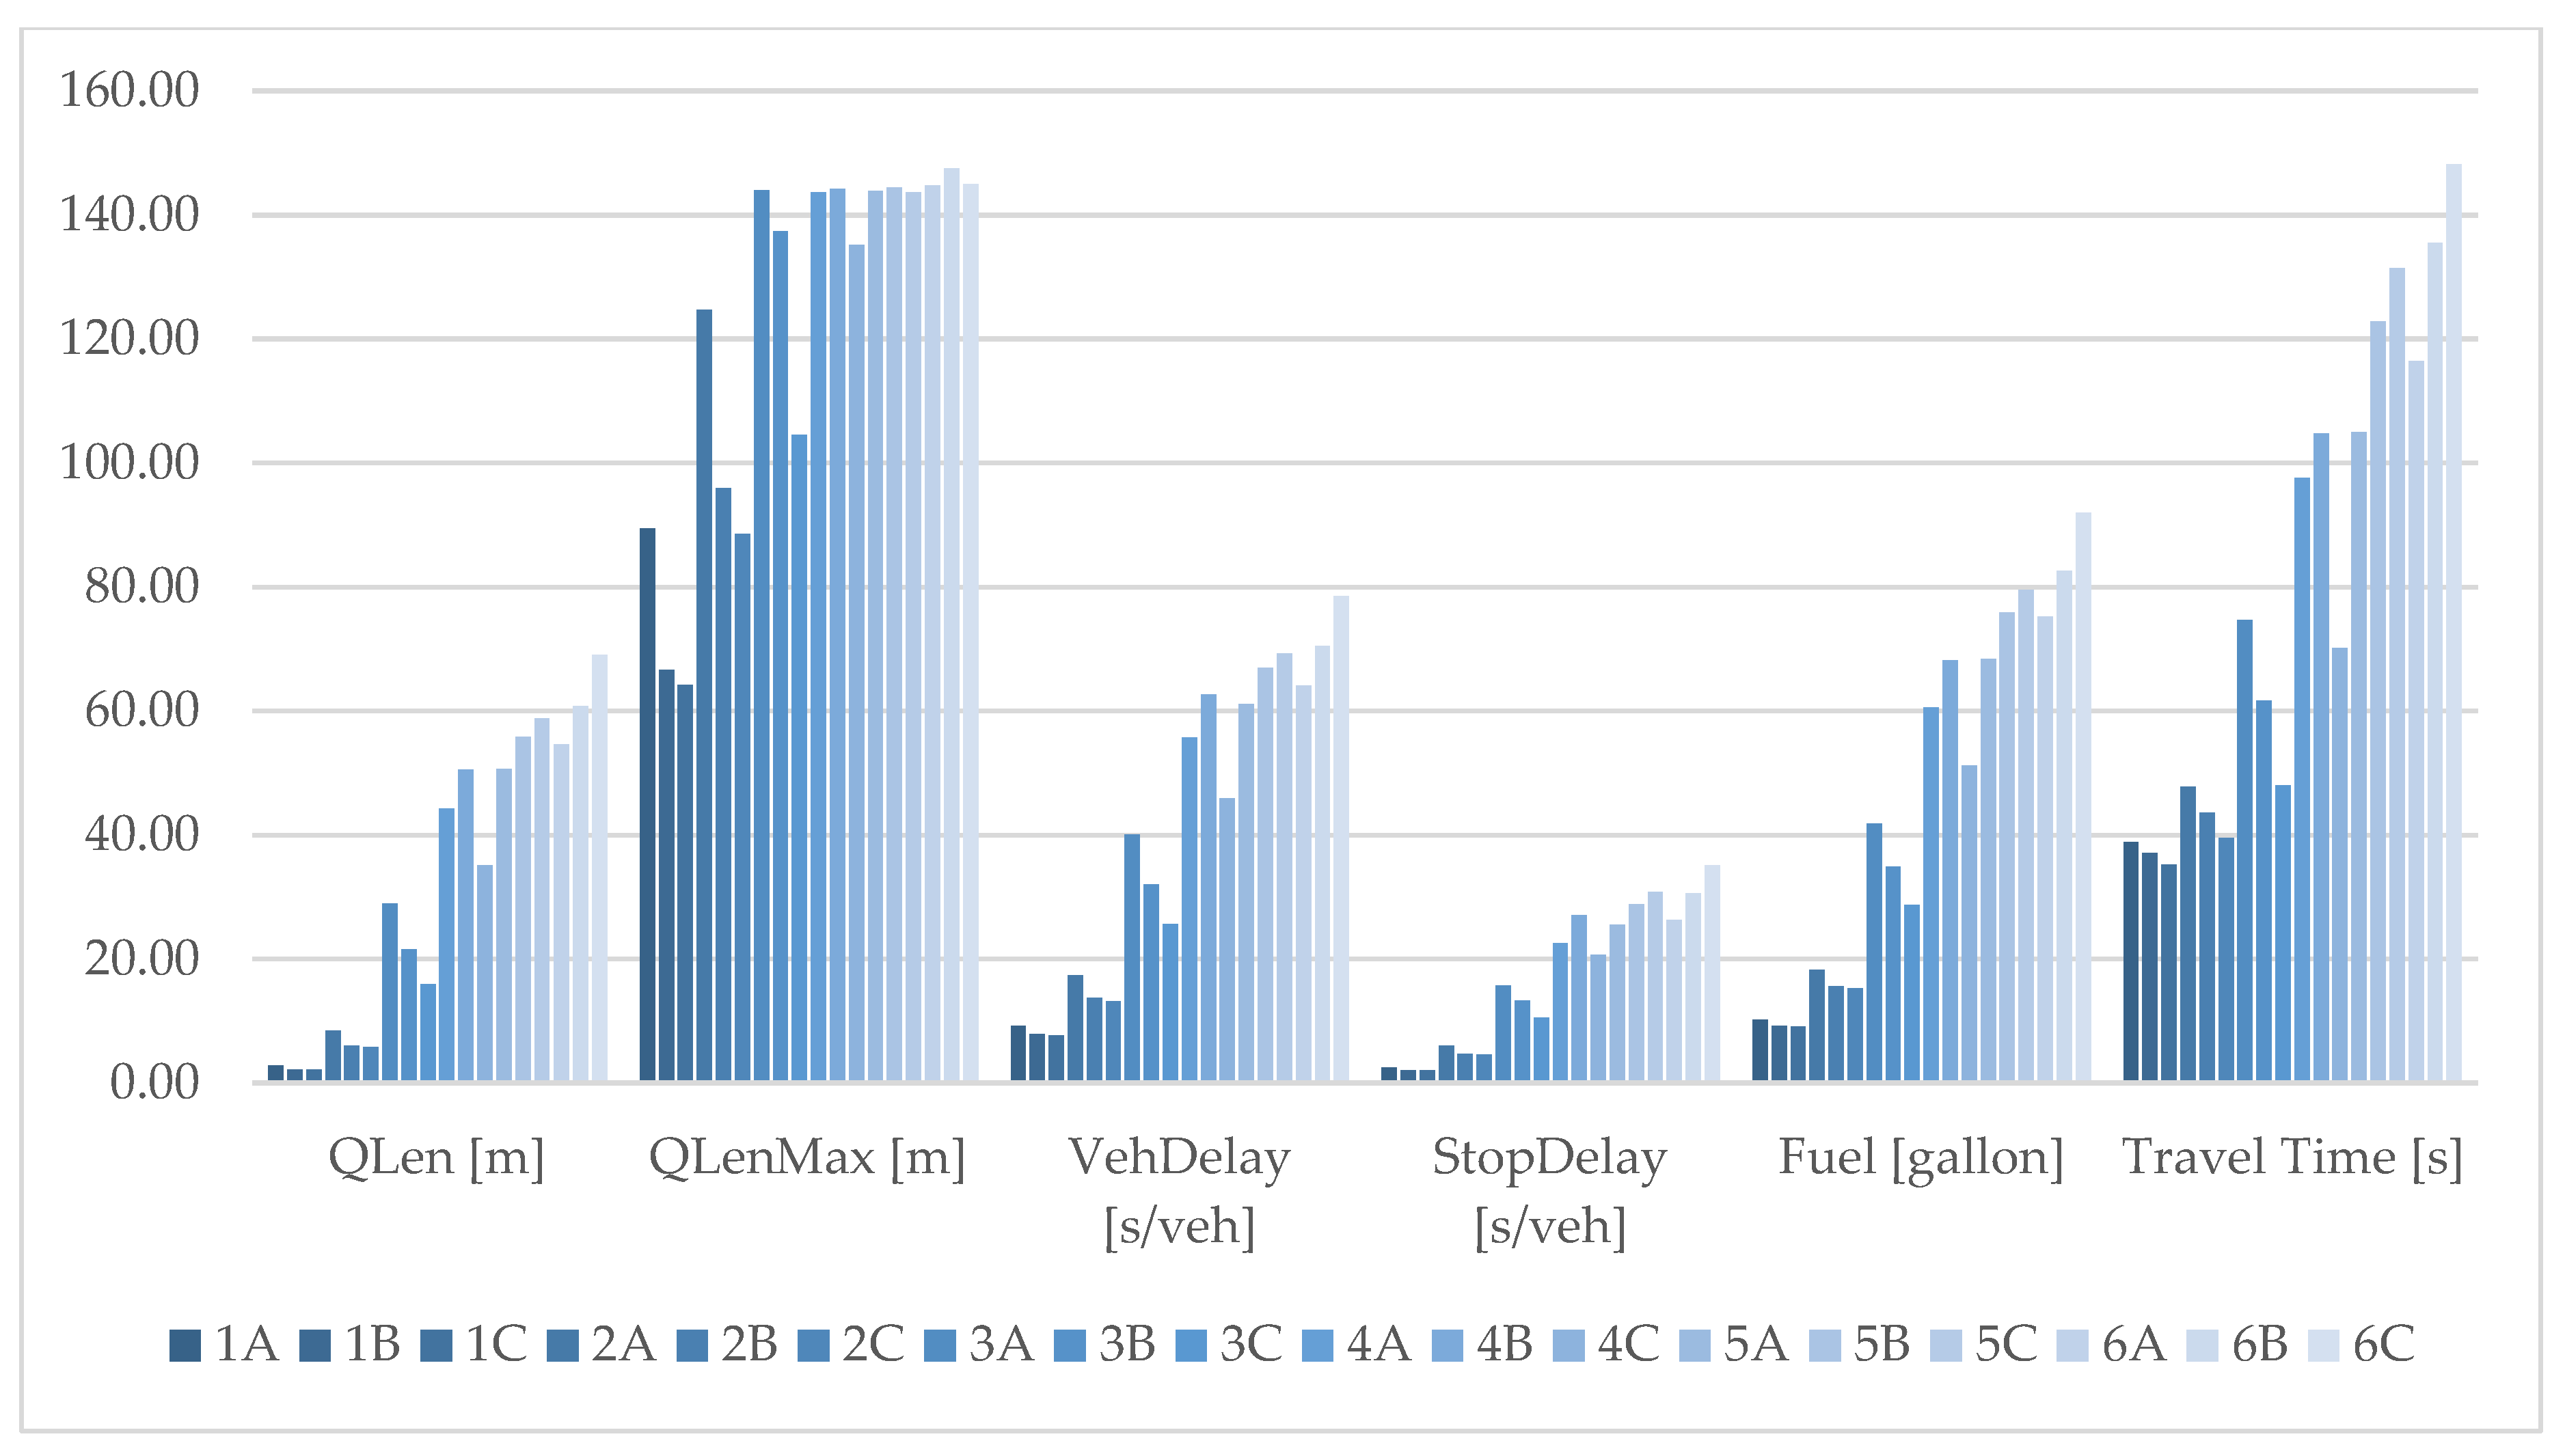
Average queue length and especially maximum queue length, increases significantly as peak hour traffic volume rises. With lower volumes (around 5% to 6%), roundabouts experience minimal queuing. However, as volumes approach 10%, queues become notably longer, often extending tens of meters or more.
With light traffic volume (5-6% of daily traffic in peak hour), average delays stay relatively low (under 10 s/veh), resulting in LOS A or B. At higher volumes (9-10%), vehicle delays become substantial (>50 s/veh), which corresponds to LOS E or F. As congestion increases, vehicles are required to slow down or stop more frequently, which in turn raises both stop rate and travel time. While travel time for lower volumes (5-6%) remains modest (around 30-40 s), they more than triple under heavy peak hour traffic (10%), reaching over 100 seconds. The resulting stop-and-go conditions, longer queues, and increased delays contribute to greater fuel consumption and emissions.
At lower volumes (5-6%), a more balanced ratio (70:30) leads to longer queues compared to a more balanced flow (50:50). However, when traffic volumes are high and more evenly split (50:50), all approaches tend to become congested. This results in higher average queues during balanced flow (50:50) compared to unbalanced flow (70:30), as multiple approaches are saturated. Comparison of traffic indicators of isolated roundabout are shown in
Figure 6.
4.2. Roundabout in the Interaction with Signalized Intersection
This section examines how adding a closely spaced signalized intersection affects two primary traffic indicators at the roundabout—vehicle delay and travel time—under varying traffic volumes, major-to-minor flow ratios, and distances between the roundabout and signalized intersection, as presented in
Table A1 (
Appendix A). Although different scenarios affect all traffic indicators (e.g., queue length, stops, emissions), the focus is on how vehicle delay and travel time respond to these alterations. Given that traffic indicators are highly correlated (
Table 4), similar patterns of change generally apply across most measures.
4.2.1. Influence of Intersection Spacing
At short distances of about 40 m to 50 m, congestion spillback frequently occurs. In these scenarios, vehicles queue across the circulatory roadway of the roundabout, causing travel times to increase by 30% to 40% relative to an isolated roundabout. For example, at a distance of 40 m between the two intersections, travel times can rise by at least 15 s to 20 s, and average vehicle delay increases by more than 10 s to 15 s per vehicle at peak-hour volumes over 1400 veh/h. At moderate traffic loads—around 1000 or 1200 veh/h—the system does not experience widespread gridlock even if the distance is short, but the negative effect of interaction is still observable. Travel times in these moderate scenarios can increase by 5 s to 15 s, and average delays can be 5 s to 10 s higher than for isolated roundabouts. As the distance increases to around 60 m or 80 m, the results show intermediate improvements. Although some spillback can still occur, vehicle delay and travel time do not rise as dramatically, and the roundabout’s circulating flows remain partially shielded from the upstream intersection. At greater distances of 100 m and beyond, the measured travel times and delays start to resemble those recorded at an isolated roundabout, with average delays sometimes dropping by tens of seconds compared to the short-distance cases. By 120 m, the congestion caused by the signalized intersection rarely propagates into the roundabout, allowing traffic to circulate with minimal additional waits.
4.2.2. Effect of Major-to-Minor Flow Ratios
When the major direction approach carries around 70% of the volume, it is more prone to queuing, especially at shorter distances, because red phase at the traffic signal can result with a queue in the main direction. At moderate volumes (e.g., 1200–1400 veh/h), total delay can still remain moderate if the distance is at least 60–80 m. With unbalanced flows, the most loaded approach experiences the largest change in travel time, particularly at short distances. At 40 m, travel times can increase by 10–15 s compared to increased spacing, as vehicles on the major approach face more frequent stoppage. The minor approach experiences fewer stoppages, resulting in less delay for that specific traffic stream.
At moderately unbalanced flow (60:40), under low to medium volumes (1000-1400 veh/h), delays remain manageable (under 30-40 s/veh for distance at least 60 m – and under 20 s/veh at volume below 1200 veh/h). At higher volumes (≥1600 veh/h), even a moderate imbalance can create notable queues if the distance to the intersection is short. Delays may be 5–10 s/veh lower at 80–100 m than at 40 m, reflecting fewer spillbacks. At volumes below 1400 veh/h, travel times stay around 50–70 s for the 300 m route at most distances. Only at short distances and high traffic loads (>1400 veh/h) do they escalate significantly, sometimes reaching 100 s or more. At 100 m or more, the flow often remains fluid enough that travel time stays 10–20 s lower than the 40 m scenario.
Balanced flow can be beneficial at lower volumes, as no single approach becomes disproportionately congested. This yields relatively low delays (often under 20 s/veh) if volumes are <1400 veh/h and the spacing is at least 60 m. However, at high volumes (≥1800 veh/h), having both directions equally loaded can overwhelm the roundabout if the signal queue spills back, causing sharp increases in delay, particularly at 40–50 m spacing. Under balanced conditions and lower traffic volumes, travel times can be the lowest among all flow splits if distances exceed 80–100 m. Yet, once the flow rises to 2000 veh/h, the roundabout can saturate quickly. Coupled with short intersection spacing, travel time in a 50:50 scenario may jump by 20–30 s or more compared to an 80–120 m distance.
4.2.3. Impact of Increasing Peak-Hour Traffic Volumes
Raising the peak-hour traffic volume from 1000 veh/h to 2000 veh/h exhibits a distinctly nonlinear impact on delay and travel time when a signalized intersection is nearby. At moderate volumes (1000-1200 veh/h), placing the signalized intersection 40 m from the roundabout increases the average delay by around 5 s to 15 s and can extend travel time by 10 s to 20 s compared to an isolated roundabout. While noticeable, these changes still generally correspond to a tolerable level of service.
As the volume increases to around 1600 veh/h or 1800 veh/h, queues from the signalized intersection spill back more frequently. Travel times can increase by 20% to 30% compared to an isolated roundabout, especially if the major and minor flows are evenly split and the distance to the signalized intersection is short. Average vehicle delay can exceed 50 s per vehicle at these higher volumes, and in extreme cases, with distances below 50 m, it can exceed 60 s or 70 s on certain approaches.
When volumes reach the upper limit of 2000 veh/h, the effect becomes even more severe if intersection spacing is inadequate. At distances of 40 m or 50 m, travel times often increase by 30% to 40% or more, and average vehicle delays can double relative to lower-load conditions, sometimes exceeding 70 s to 80 s per vehicle. In contrast, at distances near 100 m or more, the impact of these extreme congestions is greatly reduced. Queues spill back less frequently, and vehicle delays and travel times often remain within 10% to 20% of what is observed at an isolated roundabout.
4.3. Statistical Analysis
A Pearson correlation test assessed the relationships among the traffic indicators obtained from models developed in VISSIM. As expected, the results reveal a strong positive correlation among these indicators, shown in
Table 4. Descriptive statistics, detailed in
Table 5, illustrate a dataset characterized by considerable variability in traffic metrics. The skewness observed in many variables suggests that while "typical" conditions (centered around the median) may range from moderate to congested, there are also instances where conditions are significantly better or worse than average. Each metric was calculated based on 180 distinct scenarios. The travel time exhibits a median of 97,44 seconds, closely aligning with the mean of 103 seconds. The distribution indicates a wide range (over 170 seconds between the minimum and maximum), and a standard deviation near 50 seconds highlights substantial variability in travel times across the observations. Notably, the Travel Time indicator displayed the highest standard deviation and variance, prompting its selection for further model development.
Travel Time Model
The significant impact of peak hour traffic volume on travel time is clearly illustrated by the correlation presented in
Table 6. A higher number of vehicles during peak hours typically results in increased travel times. Additionally, the distance between a roundabout and a signalized intersection demonstrates a modest negative correlation; specifically, a shorter distance tends to contribute to longer travel times.
The statistical analysis employs a linear regression model utilizing a stepwise selection method to identify significant factors influencing travel time from a roundabout to a signalized intersection. This stepwise approach begins by incorporating the variable with the highest contribution as determined by the Student’s t-statistic and continues iteratively by adding variables that have a probability of less than 0.05 for entry. After three variables have been added, the method assesses the potential removal of variables using a probability threshold of 0.10. This iterative process of addition and elimination continues until no additional variables can be significantly included or excluded, ensuring that only the most impactful factors are retained (see
Table 7). The resulting three-variable model exhibits the lowest Mean Squared Error (MSE = 227,277) and the highest Coefficient of Determination (R² = 0,909). Additionally, it has a Mallows’ Cp value of 4,0, which closely aligns with the number of parameters (four, assuming the intercept is included), indicating a good balance between model fit and simplicity. The Akaike Information Criterion (AIC = 980,665) is at its minimum in this three-variable model compared to simpler models, demonstrating enhanced explanatory power by including all three predictors. As anticipated from the correlation matrix, peak hour traffic volume accounts for most of the variation, while distance and the percentage of traffic volume in the major direction provide further incremental explanatory power, thereby refining the predictions of travel time.
The statistics presented in
Table 8 show that the final model explains about 90,9% of the variation in travel time. The relatively low Root Mean Squared Error (RMSE=15,076) and Mean Absolute Percentage Error (MAPE=14,710) suggest a good predictive performance overall.
A model is highly statistically significant (F-statistic=587,953, p<0,0001). All three predictors are statistically significant (p<0,05), indicating that each contributes meaningfully to explaining travel time (
Table 9).
Travel time model is presented in:
where:
Travel Time (s) – travel time from point 1 to point 2 -(travel distance 300 m)
PHV (veh/h)– roundabout peak hour traffic volume
MDP (/) – the percentage of peak hour volume in major direction (eq. 0,7=70%)
D (m) – distance between roundabout and signalized intersection
5. Conclusions
The findings from this study offer insights into the integration of roundabouts and signalized intersections within urban traffic networks, particularly focusing on the influence of peak-hour traffic volume, flow ratios, and intersection spacing on key traffic performance indicators. Increasing peak-hour traffic volumes at standard-size roundabouts (from 5% to 10% of daily traffic) deteriorates traffic indicators, resulting in longer queues, higher delays, elevated stop rates, increased emissions, and extended travel times. These results are consistent with previous studies [
1,
9], indicating that higher traffic volumes degrade the Level of Service (LOS) at both isolated and interacting intersections.
The simulation results further reveal that isolated roundabouts outperform those located near signalized intersections. This difference is particularly pronounced at short distances (40-50 m), where vehicle delay and travel time increase substantially for all traffic volumes. These findings underscore the importance of maintaining adequate spacing between roundabouts and signalized intersections to reduce congestion spillback.
Traffic distribution was found to have a significant effect on roundabout performance. Under lower traffic volumes, balanced distribution (50:50) has a positive effect on the traffic flow of the roundabout. In comparison, at higher volumes, a balanced flow leads to systematic congestion across all approaches. These findings resonate with earlier research [
15], emphasizing that balanced traffic flows can minimize overall system delay and travel time at lower volumes but may result in network-wide saturation at higher volumes.
Furthermore, short distances between a roundabout and a signalized intersection amplify operational inefficiencies, leading to delays, fuel wastage, and emissions increase. For instance, distances below 50 m resulted in travel time increases by 30–40% compared to isolated scenarios. Proximity increased queue lengths, vehicle delays, travel times, and emissions, corroborating concerns about queue spillback between closely spaced intersections [
6,
16,
20,
21]. When the spacing exceeds 100 m, traffic indicators are not significantly different from those of isolated roundabouts.
Although roundabouts, in many cases, have a positive effect on traffic flow, these findings show that their integration within signalized networks should be carefully designed to avoid compounding delays and inefficiencies. The results in this research also emphasize the importance of traffic microsimulations, which enable realistic analysis of complex interactions under stochastic traffic conditions.
Future Research
Future research will expand the current scenario by incorporating traffic signal timing, varied traffic structures, and pedestrian movements. These scenarios will be analyzed through calibrated microsimulation models using data from real intersections, allowing direct comparisons of predicted and actual travel times. Furthermore, the analysis will delve deeper into environmental impacts, mainly focusing on fuel consumption and carbon dioxide emissions.
Author Contributions
Conceptualization, A.D.-T., I.I.O. and M.K.; methodology, M.K., A.D.-T. , I.I.O. and S.Š.; software, M.K.; formal analysis, M.K.; writing—original draft preparation, M.K.; writing—review and editing, A.D.-T., S.Š., I.I.O.; visualization, M.K.; supervision, A.D.-T. All authors have read and agreed to the published version of the manuscript.
Funding
This research is the result of the projects “Optimization of the design elements of the wider zone of the intersection” (uniri-iskusni-tehnic-23-86) and “Transportation infrastructure in the function of the safety of vulnerable road users” (uniri-iskusni-tehnic-23-85) supported by the University of Rijeka.
Data Availability Statement
The dataset presented in this study is a part of a research database created in a doctoral thesis research and is available upon request from the corresponding author.
Conflicts of Interest
The authors declare no conflicts of interest.
Appendix A
Table A1.
Microsimulation results.
Table A1.
Microsimulation results.
| Scenario |
Distance |
QLen |
QLenMax |
Veh Pass |
LOS |
Veh Delay |
StopDelay |
Stops |
Emiss CO |
Fuel |
Travel Time |
| m |
m |
m |
veh |
|
s/veh |
s |
|
g |
gallon |
s |
| 1A |
isolated RB |
2,82 |
89,44 |
1015 |
A |
9,20 |
2,44 |
0,52 |
709,55 |
10,15 |
38,83 |
| 40 |
3,75 |
89,24 |
1022 |
B |
16,23 |
7,30 |
0,90 |
997,55 |
14,27 |
48,29 |
| 50 |
2,55 |
86,99 |
1022 |
B |
12,65 |
4,72 |
0,71 |
854,82 |
12,23 |
47,82 |
| 60 |
2,26 |
81,53 |
1022 |
B |
11,42 |
4,08 |
0,62 |
791,60 |
11,32 |
47,67 |
| 70 |
2,22 |
85,58 |
1021 |
B |
10,94 |
3,69 |
0,60 |
773,73 |
11,07 |
48,73 |
| 80 |
2,36 |
85,61 |
1021 |
B |
10,93 |
3,61 |
0,59 |
769,01 |
11,00 |
49,13 |
| 90 |
2,52 |
94,67 |
1021 |
B |
10,98 |
3,61 |
0,59 |
772,12 |
11,05 |
50,05 |
| 100 |
2,64 |
93,02 |
1021 |
B |
11,07 |
3,68 |
0,60 |
779,92 |
11,16 |
50,48 |
| 110 |
2,62 |
86,62 |
1021 |
B |
10,77 |
3,53 |
0,60 |
771,65 |
11,04 |
50,09 |
| 120 |
2,68 |
90,04 |
1022 |
B |
10,64 |
3,48 |
0,58 |
760,30 |
10,88 |
50,15 |
| 1B |
isolated RB |
2,20 |
66,62 |
1010 |
A |
7,92 |
2,07 |
0,46 |
646,68 |
9,25 |
37,09 |
| 40 |
1,92 |
74,21 |
1015 |
B |
10,16 |
3,49 |
0,55 |
728,71 |
10,42 |
47,00 |
| 50 |
2,29 |
72,06 |
1014 |
B |
11,82 |
4,40 |
0,68 |
813,81 |
11,64 |
46,33 |
| 60 |
1,94 |
67,84 |
1014 |
B |
10,67 |
3,76 |
0,61 |
760,07 |
10,87 |
46,39 |
| 70 |
1,92 |
74,21 |
1015 |
B |
10,16 |
3,49 |
0,55 |
728,71 |
10,42 |
47,00 |
| 80 |
2,12 |
69,02 |
1014 |
B |
10,38 |
3,61 |
0,57 |
742,06 |
10,62 |
47,32 |
| 90 |
2,07 |
68,88 |
1014 |
B |
10,10 |
3,46 |
0,56 |
731,12 |
10,46 |
47,73 |
| 100 |
2,08 |
65,04 |
1014 |
B |
9,95 |
3,42 |
0,55 |
723,61 |
10,35 |
47,59 |
| 110 |
2,24 |
62,90 |
1014 |
B |
10,02 |
3,41 |
0,57 |
734,39 |
10,51 |
47,62 |
| 120 |
2,33 |
63,27 |
1013 |
B |
9,86 |
3,31 |
0,55 |
723,71 |
10,35 |
47,39 |
| 1C |
isolated RB |
2,14 |
64,26 |
1005 |
A |
7,71 |
2,06 |
0,46 |
634,43 |
9,08 |
35,23 |
| 40 |
3,07 |
78,96 |
1012 |
B |
14,29 |
6,11 |
0,85 |
916,86 |
13,12 |
44,50 |
| 50 |
2,18 |
67,89 |
1013 |
B |
11,62 |
4,34 |
0,67 |
794,18 |
11,36 |
44,89 |
| 60 |
1,94 |
66,16 |
1013 |
B |
10,55 |
3,77 |
0,60 |
747,79 |
10,70 |
45,04 |
| 70 |
1,91 |
55,20 |
1013 |
B |
10,25 |
3,64 |
0,57 |
729,34 |
10,43 |
45,58 |
| 80 |
1,87 |
55,65 |
1013 |
B |
9,95 |
3,48 |
0,56 |
719,39 |
10,29 |
46,41 |
| 90 |
1,92 |
52,10 |
1013 |
A |
9,89 |
3,46 |
0,55 |
714,49 |
10,22 |
46,84 |
| 100 |
1,95 |
51,16 |
1013 |
A |
9,77 |
3,39 |
0,54 |
709,54 |
10,15 |
46,02 |
| 110 |
2,11 |
52,48 |
1013 |
A |
9,85 |
3,43 |
0,57 |
720,84 |
10,31 |
46,47 |
| 120 |
2,21 |
57,17 |
1012 |
A |
9,61 |
3,28 |
0,56 |
712,15 |
10,19 |
46,38 |
| 2A |
isolated RB |
8,46 |
124,73 |
1204 |
C |
17,38 |
6,01 |
1,04 |
1277,48 |
18,28 |
47,79 |
| 40 |
12,87 |
126,72 |
1214 |
C |
30,16 |
15,31 |
1,67 |
1863,14 |
26,65 |
60,08 |
| 50 |
8,37 |
129,70 |
1213 |
C |
22,12 |
9,82 |
1,25 |
1482,76 |
21,21 |
57,19 |
| 60 |
7,01 |
128,27 |
1212 |
C |
19,43 |
8,16 |
1,10 |
1354,76 |
19,38 |
56,44 |
| 70 |
6,49 |
123,84 |
1211 |
C |
17,85 |
6,93 |
1,02 |
1279,45 |
18,30 |
57,06 |
| 80 |
7,22 |
132,81 |
1212 |
C |
18,41 |
6,69 |
1,09 |
1327,73 |
18,99 |
60,30 |
| 90 |
7,52 |
135,85 |
1212 |
C |
18,50 |
6,54 |
1,12 |
1346,89 |
19,27 |
61,99 |
| 100 |
7,20 |
131,95 |
1212 |
C |
17,67 |
6,21 |
1,07 |
1303,35 |
18,65 |
60,61 |
| 110 |
7,80 |
130,36 |
1210 |
C |
18,22 |
6,63 |
1,10 |
1327,91 |
19,00 |
61,28 |
| 120 |
8,29 |
136,00 |
1211 |
C |
18,57 |
6,78 |
1,12 |
1346,26 |
19,26 |
61,41 |
| 2B |
isolated RB |
6,01 |
95,91 |
1209 |
B |
13,69 |
4,68 |
0,84 |
1090,37 |
15,60 |
43,61 |
| 40 |
11,34 |
109,50 |
1211 |
C |
27,22 |
13,58 |
1,57 |
1739,35 |
24,88 |
57,55 |
| 50 |
7,74 |
110,63 |
1210 |
C |
20,81 |
9,20 |
1,22 |
1429,12 |
20,45 |
56,46 |
| 60 |
5,99 |
111,89 |
1212 |
C |
17,51 |
7,20 |
1,03 |
1269,54 |
18,16 |
55,68 |
| 70 |
5,34 |
111,04 |
1214 |
C |
15,66 |
6,10 |
0,92 |
1176,34 |
16,83 |
55,42 |
| 80 |
5,96 |
103,00 |
1213 |
C |
15,50 |
5,78 |
0,95 |
1188,19 |
17,00 |
57,86 |
| 90 |
5,63 |
102,44 |
1214 |
C |
15,62 |
5,72 |
0,94 |
1189,00 |
17,01 |
58,51 |
| 100 |
5,62 |
104,16 |
1214 |
C |
15,36 |
5,71 |
0,92 |
1170,89 |
16,75 |
57,49 |
| 110 |
5,96 |
103,00 |
1213 |
C |
15,50 |
5,78 |
0,95 |
1188,19 |
17,00 |
57,86 |
| 120 |
6,01 |
103,52 |
1214 |
C |
15,20 |
5,66 |
0,93 |
1171,88 |
16,77 |
56,85 |
| 2C |
isolated RB |
5,77 |
88,53 |
1208 |
B |
13,16 |
4,53 |
0,83 |
1065,80 |
15,25 |
39,52 |
| 40 |
9,03 |
101,47 |
1209 |
C |
23,50 |
11,33 |
1,38 |
1554,22 |
22,23 |
51,62 |
| 50 |
6,89 |
94,47 |
1212 |
C |
19,21 |
8,35 |
1,15 |
1356,21 |
19,40 |
51,77 |
| 60 |
5,49 |
93,87 |
1214 |
C |
16,67 |
6,84 |
0,99 |
1225,26 |
17,53 |
51,04 |
| 70 |
5,06 |
92,22 |
1213 |
C |
15,35 |
6,09 |
0,90 |
1150,11 |
16,45 |
52,17 |
| 80 |
4,83 |
85,72 |
1214 |
B |
14,81 |
5,62 |
0,90 |
1139,58 |
16,30 |
52,43 |
| 90 |
4,80 |
86,96 |
1213 |
B |
14,46 |
5,49 |
0,86 |
1109,29 |
15,87 |
52,71 |
| 100 |
5,16 |
88,87 |
1213 |
B |
14,73 |
5,57 |
0,89 |
1131,97 |
16,19 |
52,09 |
| 110 |
5,66 |
82,27 |
1213 |
C |
15,13 |
5,79 |
0,92 |
1158,59 |
16,57 |
53,22 |
| 120 |
6,23 |
84,51 |
1212 |
B |
15,51 |
5,98 |
0,95 |
1175,54 |
16,82 |
52,09 |
| 3A |
isolated RB |
28,94 |
143,97 |
1383 |
E |
40,10 |
15,67 |
2,61 |
2923,06 |
41,82 |
74,72 |
| 40 |
44,39 |
141,01 |
1345 |
E |
70,39 |
38,85 |
3,79 |
4157,02 |
59,47 |
97,45 |
| 50 |
36,74 |
141,12 |
1374 |
F |
57,70 |
29,81 |
3,26 |
3661,39 |
52,38 |
91,87 |
| 60 |
29,03 |
141,92 |
1392 |
E |
46,73 |
22,41 |
2,72 |
3148,50 |
45,04 |
86,25 |
| 70 |
26,04 |
141,43 |
1399 |
E |
41,64 |
18,40 |
2,55 |
2952,09 |
42,23 |
86,07 |
| 80 |
27,42 |
141,68 |
1391 |
E |
41,90 |
16,90 |
2,74 |
3064,28 |
43,84 |
93,50 |
| 90 |
26,68 |
144,49 |
1392 |
E |
40,16 |
15,41 |
2,70 |
3006,19 |
43,01 |
96,62 |
| 100 |
26,10 |
141,96 |
1394 |
E |
39,19 |
14,69 |
2,67 |
2965,92 |
42,43 |
96,23 |
| 110 |
26,88 |
142,28 |
1392 |
E |
39,69 |
15,11 |
2,68 |
2982,62 |
42,67 |
96,25 |
| 120 |
30,12 |
143,74 |
1390 |
E |
43,20 |
17,15 |
2,87 |
3170,27 |
45,35 |
97,43 |
| 3B |
isolated RB |
21,50 |
137,45 |
1400 |
D |
31,99 |
13,27 |
2,07 |
2436,40 |
34,86 |
61,72 |
| 40 |
33,73 |
138,36 |
1357 |
E |
56,93 |
32,35 |
3,03 |
3438,03 |
49,18 |
80,80 |
| 50 |
27,26 |
135,51 |
1392 |
E |
46,09 |
24,10 |
2,60 |
3039,61 |
43,49 |
75,15 |
| 60 |
22,32 |
135,49 |
1400 |
E |
38,71 |
18,75 |
2,28 |
2707,71 |
38,74 |
73,55 |
| 70 |
20,56 |
131,83 |
1403 |
D |
35,71 |
16,65 |
2,15 |
2565,94 |
36,71 |
76,28 |
| 80 |
21,90 |
137,39 |
1406 |
E |
36,48 |
16,28 |
2,27 |
2672,00 |
38,23 |
81,27 |
| 90 |
19,42 |
139,10 |
1412 |
D |
32,39 |
13,43 |
2,09 |
2475,42 |
35,41 |
82,41 |
| 100 |
18,36 |
137,42 |
1411 |
D |
30,54 |
12,36 |
2,00 |
2381,80 |
34,07 |
82,76 |
| 110 |
21,45 |
135,47 |
1408 |
D |
34,05 |
14,36 |
2,22 |
2593,00 |
37,10 |
81,65 |
| 120 |
22,34 |
136,17 |
1409 |
D |
34,65 |
14,92 |
2,23 |
2609,03 |
37,33 |
82,42 |
| 3C |
isolated RB |
15,93 |
104,59 |
1395 |
D |
25,62 |
10,54 |
1,64 |
2005,99 |
28,70 |
48,03 |
| 40 |
28,44 |
127,60 |
1360 |
D |
49,18 |
26,68 |
2,77 |
3122,95 |
44,68 |
69,65 |
| 50 |
21,93 |
115,05 |
1388 |
E |
39,31 |
19,83 |
2,33 |
2709,76 |
38,77 |
67,75 |
| 60 |
16,95 |
115,87 |
1402 |
D |
31,55 |
14,77 |
1,92 |
2316,71 |
33,14 |
64,73 |
| 70 |
15,20 |
119,68 |
1404 |
D |
28,70 |
12,89 |
1,76 |
2162,76 |
30,94 |
64,50 |
| 80 |
14,68 |
115,00 |
1405 |
D |
27,86 |
12,11 |
1,75 |
2135,39 |
30,55 |
67,75 |
| 90 |
13,56 |
120,68 |
1403 |
D |
25,88 |
10,97 |
1,64 |
2025,29 |
28,97 |
68,67 |
| 100 |
14,09 |
119,26 |
1403 |
D |
25,99 |
10,82 |
1,68 |
2050,22 |
29,33 |
68,10 |
| 110 |
16,31 |
119,92 |
1403 |
D |
28,15 |
11,93 |
1,82 |
2187,85 |
31,30 |
68,63 |
| 120 |
17,05 |
110,92 |
1401 |
D |
28,64 |
12,32 |
1,85 |
2210,35 |
31,62 |
66,75 |
| 4A |
isolated RB |
44,30 |
143,66 |
1456 |
F |
55,77 |
22,51 |
3,85 |
4231,74 |
60,54 |
97,59 |
| 40 |
53,74 |
143,83 |
1382 |
F |
80,76 |
43,75 |
4,54 |
4952,19 |
70,85 |
117,27 |
| 50 |
51,41 |
145,27 |
1415 |
F |
75,19 |
39,13 |
4,36 |
4840,89 |
69,25 |
115,22 |
| 60 |
50,00 |
144,32 |
1441 |
F |
71,26 |
35,60 |
4,23 |
4762,62 |
68,13 |
115,56 |
| 70 |
48,38 |
144,51 |
1467 |
F |
67,45 |
31,80 |
4,22 |
4757,27 |
68,06 |
117,44 |
| 80 |
44,96 |
147,38 |
1464 |
F |
61,55 |
26,59 |
4,12 |
4562,37 |
65,27 |
119,09 |
| 90 |
41,32 |
146,21 |
1461 |
F |
56,35 |
22,79 |
3,93 |
4311,75 |
61,68 |
122,54 |
| 100 |
41,86 |
146,24 |
1464 |
F |
56,53 |
23,29 |
3,90 |
4308,82 |
61,64 |
122,13 |
| 110 |
43,88 |
143,64 |
1468 |
F |
57,81 |
24,19 |
3,95 |
4374,35 |
62,58 |
121,30 |
| 120 |
45,06 |
146,44 |
1467 |
F |
58,66 |
24,47 |
4,00 |
4429,02 |
63,36 |
120,73 |
| 4B |
isolated RB |
50,50 |
144,23 |
1492 |
F |
62,64 |
27,07 |
4,27 |
4762,86 |
68,14 |
104,80 |
| 40 |
53,79 |
143,39 |
1395 |
F |
79,49 |
42,80 |
4,58 |
4992,80 |
71,43 |
126,76 |
| 50 |
51,57 |
144,76 |
1429 |
F |
75,04 |
38,78 |
4,45 |
4936,20 |
70,62 |
124,76 |
| 60 |
49,64 |
143,97 |
1459 |
F |
70,41 |
35,11 |
4,23 |
4799,48 |
68,66 |
117,58 |
| 70 |
49,28 |
144,62 |
1473 |
F |
68,28 |
32,44 |
4,30 |
4850,34 |
69,39 |
121,99 |
| 80 |
51,66 |
145,81 |
1486 |
F |
69,66 |
31,56 |
4,62 |
5136,94 |
73,49 |
134,91 |
| 90 |
50,91 |
146,04 |
1500 |
F |
67,20 |
29,65 |
4,56 |
5089,13 |
72,81 |
135,22 |
| 100 |
46,24 |
145,53 |
1481 |
F |
61,46 |
26,25 |
4,21 |
4674,01 |
66,87 |
127,60 |
| 110 |
47,34 |
144,09 |
1481 |
F |
61,92 |
26,57 |
4,24 |
4702,66 |
67,28 |
125,60 |
| 120 |
51,87 |
145,45 |
1488 |
F |
66,47 |
29,14 |
4,54 |
5020,93 |
71,83 |
130,84 |
| 4C |
isolated RB |
35,11 |
135,15 |
1516 |
E |
45,94 |
20,64 |
3,01 |
3577,69 |
51,18 |
70,15 |
| 40 |
44,58 |
140,60 |
1405 |
E |
68,86 |
38,53 |
3,85 |
4328,53 |
61,92 |
113,12 |
| 50 |
39,95 |
138,80 |
1439 |
F |
61,77 |
33,13 |
3,56 |
4092,22 |
58,54 |
104,40 |
| 60 |
38,33 |
139,13 |
1476 |
F |
57,95 |
29,92 |
3,46 |
4050,55 |
57,95 |
100,02 |
| 70 |
38,76 |
138,36 |
1498 |
F |
56,54 |
28,34 |
3,43 |
4059,08 |
58,07 |
100,05 |
| 80 |
41,19 |
145,03 |
1517 |
F |
58,46 |
27,76 |
3,78 |
4392,95 |
62,85 |
114,85 |
| 90 |
41,56 |
149,32 |
1525 |
F |
57,57 |
26,86 |
3,73 |
4365,95 |
62,46 |
114,80 |
| 100 |
37,78 |
138,31 |
1524 |
F |
52,35 |
24,13 |
3,42 |
4030,90 |
57,67 |
104,69 |
| 110 |
37,42 |
137,97 |
1515 |
F |
51,49 |
23,45 |
3,43 |
3992,15 |
57,11 |
100,88 |
| 120 |
39,70 |
138,81 |
1509 |
F |
53,52 |
24,40 |
3,57 |
4121,32 |
58,96 |
105,88 |
| 5A |
isolated RB |
50,60 |
143,94 |
1511 |
F |
61,11 |
25,49 |
4,24 |
4778,26 |
68,36 |
105,04 |
| 40 |
57,74 |
142,61 |
1394 |
F |
85,71 |
47,80 |
4,75 |
5224,48 |
74,74 |
132,22 |
| 50 |
54,63 |
143,71 |
1435 |
F |
80,46 |
42,90 |
4,63 |
5198,02 |
74,36 |
130,74 |
| 60 |
53,73 |
150,82 |
1476 |
F |
75,77 |
38,47 |
4,60 |
5224,68 |
74,75 |
128,92 |
| 70 |
53,78 |
147,46 |
1487 |
F |
73,77 |
36,07 |
4,59 |
5215,26 |
74,61 |
131,50 |
| 80 |
50,53 |
148,24 |
1492 |
F |
69,56 |
32,21 |
4,56 |
5115,19 |
73,18 |
139,62 |
| 90 |
47,38 |
152,51 |
1504 |
F |
64,44 |
28,46 |
4,32 |
4882,14 |
69,84 |
140,49 |
| 100 |
49,46 |
157,51 |
1508 |
F |
65,45 |
28,88 |
4,45 |
5010,68 |
71,68 |
140,58 |
| 110 |
48,79 |
149,15 |
1516 |
F |
63,73 |
27,65 |
4,39 |
4950,85 |
70,83 |
139,48 |
| 120 |
50,38 |
158,84 |
1514 |
F |
63,42 |
27,01 |
4,42 |
4962,01 |
70,99 |
134,47 |
| 5B |
isolated RB |
55,87 |
144,49 |
1538 |
F |
66,98 |
28,78 |
4,68 |
5302,28 |
75,86 |
122,82 |
| 40 |
59,55 |
144,83 |
1424 |
F |
86,48 |
47,77 |
4,93 |
5462,40 |
78,15 |
146,03 |
| 50 |
56,74 |
143,80 |
1456 |
F |
81,99 |
43,80 |
4,79 |
5400,59 |
77,26 |
147,07 |
| 60 |
55,93 |
144,37 |
1494 |
F |
78,13 |
39,32 |
4,85 |
5508,12 |
78,80 |
144,76 |
| 70 |
56,00 |
144,92 |
1506 |
F |
77,67 |
38,47 |
4,85 |
5539,10 |
79,24 |
149,15 |
| 80 |
56,37 |
149,71 |
1516 |
F |
76,03 |
35,81 |
5,03 |
5665,85 |
81,06 |
156,44 |
| 90 |
55,97 |
148,00 |
1531 |
F |
74,41 |
34,41 |
5,00 |
5660,21 |
80,98 |
158,39 |
| 100 |
55,68 |
153,20 |
1530 |
F |
72,90 |
33,30 |
4,93 |
5577,16 |
79,79 |
158,91 |
| 110 |
55,58 |
154,23 |
1538 |
F |
71,15 |
31,89 |
4,86 |
5520,22 |
78,97 |
154,53 |
| 120 |
56,98 |
154,61 |
1534 |
F |
71,71 |
31,83 |
4,94 |
5575,04 |
79,76 |
151,03 |
| 5C |
isolated RB |
58,87 |
143,66 |
1582 |
F |
69,30 |
30,78 |
4,76 |
5555,93 |
79,48 |
131,43 |
| 40 |
62,09 |
143,65 |
1439 |
F |
91,41 |
51,73 |
5,11 |
5735,44 |
82,05 |
177,03 |
| 50 |
60,55 |
142,78 |
1466 |
F |
87,41 |
47,80 |
5,02 |
5700,95 |
81,56 |
172,56 |
| 60 |
60,33 |
144,06 |
1502 |
F |
84,50 |
44,36 |
5,10 |
5836,85 |
83,50 |
170,26 |
| 70 |
61,85 |
145,32 |
1528 |
F |
83,66 |
42,08 |
5,21 |
5993,49 |
85,74 |
171,75 |
| 80 |
60,92 |
148,62 |
1531 |
F |
81,87 |
40,08 |
5,30 |
6025,84 |
86,21 |
180,14 |
| 90 |
61,56 |
150,85 |
1536 |
F |
81,79 |
39,74 |
5,37 |
6098,63 |
87,25 |
185,57 |
| 100 |
59,61 |
155,53 |
1539 |
F |
78,10 |
36,91 |
5,22 |
5920,80 |
84,70 |
182,40 |
| 110 |
59,36 |
145,42 |
1547 |
F |
75,56 |
34,98 |
5,12 |
5825,61 |
83,34 |
174,19 |
| 120 |
60,78 |
144,53 |
1548 |
F |
75,96 |
35,25 |
5,16 |
5866,44 |
83,93 |
175,23 |
| 6A |
isolated RB |
54,67 |
144,81 |
1560 |
F |
64,10 |
26,31 |
4,60 |
5261,06 |
75,27 |
116,42 |
| 40 |
62,91 |
147,22 |
1424 |
F |
91,27 |
51,68 |
5,05 |
5652,75 |
80,87 |
148,31 |
| 50 |
59,30 |
143,75 |
1451 |
F |
87,06 |
47,36 |
5,01 |
5639,78 |
80,68 |
150,20 |
| 60 |
57,05 |
147,64 |
1494 |
F |
81,51 |
42,58 |
4,85 |
5583,71 |
79,88 |
147,80 |
| 70 |
57,53 |
150,86 |
1511 |
F |
79,75 |
40,19 |
4,92 |
5659,75 |
80,97 |
149,75 |
| 80 |
55,98 |
150,32 |
1518 |
F |
77,29 |
37,28 |
4,99 |
5675,12 |
81,19 |
156,12 |
| 90 |
53,25 |
158,29 |
1531 |
F |
71,56 |
33,00 |
4,79 |
5458,03 |
78,08 |
160,18 |
| 100 |
54,99 |
161,34 |
1531 |
F |
72,77 |
33,36 |
4,95 |
5596,87 |
80,07 |
161,41 |
| 110 |
55,47 |
158,73 |
1550 |
F |
70,60 |
31,58 |
4,87 |
5560,21 |
79,55 |
154,84 |
| 120 |
56,04 |
168,05 |
1553 |
F |
69,02 |
29,92 |
4,81 |
5493,01 |
78,58 |
151,85 |
| 6B |
isolated RB |
60,78 |
147,59 |
1590 |
F |
70,50 |
30,63 |
4,98 |
5778,95 |
82,67 |
135,55 |
| 40 |
65,19 |
145,38 |
1449 |
F |
94,28 |
53,63 |
5,24 |
5933,07 |
84,88 |
170,41 |
| 50 |
62,38 |
144,44 |
1469 |
F |
90,76 |
49,17 |
5,33 |
6002,29 |
85,87 |
175,00 |
| 60 |
61,82 |
151,85 |
1512 |
F |
86,64 |
45,74 |
5,19 |
5991,93 |
85,72 |
169,48 |
| 70 |
62,54 |
148,01 |
1527 |
F |
85,88 |
43,82 |
5,32 |
6123,26 |
87,60 |
171,66 |
| 80 |
61,67 |
152,21 |
1549 |
F |
82,30 |
39,74 |
5,39 |
6184,09 |
88,47 |
176,65 |
| 90 |
62,21 |
158,29 |
1556 |
F |
82,26 |
39,76 |
5,38 |
6204,31 |
88,76 |
183,91 |
| 100 |
61,45 |
159,44 |
1560 |
F |
79,78 |
37,25 |
5,39 |
6171,19 |
88,29 |
178,67 |
| 110 |
61,33 |
156,47 |
1557 |
F |
78,21 |
36,50 |
5,29 |
6048,11 |
86,53 |
178,00 |
| 120 |
63,22 |
160,33 |
1575 |
F |
77,60 |
35,66 |
5,29 |
6106,96 |
87,37 |
174,24 |
| 6C |
isolated RB |
69,02 |
145,05 |
1622 |
F |
78,58 |
35,13 |
5,44 |
6426,57 |
91,94 |
148,21 |
| 40 |
73,02 |
143,66 |
1474 |
F |
101,32 |
57,92 |
5,64 |
6447,24 |
92,24 |
203,93 |
| 50 |
69,67 |
145,19 |
1502 |
F |
98,15 |
54,35 |
5,67 |
6526,83 |
93,37 |
203,86 |
| 60 |
69,71 |
146,96 |
1499 |
F |
95,19 |
50,87 |
5,71 |
6480,02 |
92,70 |
192,10 |
| 70 |
69,08 |
145,79 |
1539 |
F |
93,18 |
48,10 |
5,74 |
6629,49 |
94,84 |
196,70 |
| 80 |
68,58 |
151,08 |
1550 |
F |
91,43 |
45,87 |
5,85 |
6707,81 |
95,96 |
206,93 |
| 90 |
68,25 |
153,50 |
1562 |
F |
89,87 |
44,62 |
5,81 |
6703,21 |
95,90 |
207,41 |
| 100 |
68,13 |
160,31 |
1566 |
F |
87,74 |
42,52 |
5,82 |
6673,57 |
95,47 |
203,84 |
| 110 |
67,82 |
160,63 |
1572 |
F |
85,02 |
40,36 |
5,73 |
6573,89 |
94,05 |
200,44 |
| 120 |
68,82 |
163,00 |
1576 |
F |
84,70 |
39,73 |
5,72 |
6581,26 |
94,15 |
194,86 |
References
- Retting, R.A.; Mandavilli, S.; Russell, E.R.; McCartt, A.T. Roundabouts, traffic flow and public opinion. Traffic Engineering and Control 2006, 47, 268-272.
- Jackson, M.; Rakha, H.A. Are Roundabouts Environmentally Friendly? An Evaluation for Uniform Approach Demands. In Proceedings of the Transportation Research Board; Washington DC, United States, 2012.
- Brilon, W. Safety of Roundabouts: International Overview. In Proceedings of the Transportation Research Board 95th Annual Meeting; Washington DC, United States, 2016.
- Kennedy, J. V; Peirce, J.; Summersgill, I. International Comparison of Roundabout Design Guidelines; Crowthorne, UK, 2007. Available online: https://www.trl.co.uk/uploads/trl/documents/PPR206_secure.PDF (accessed on 10 February 2024).
- Hrvatske ceste Smjernice za projektiranje kružnih raskrižja na državnim cestama (in Croatian); Rijeka, Hrvatska, 2014. Available online: https://hrvatske-ceste.hr/uploads/documents/attachment_file/file/106/SMJERNICE_KRUZNA_RASKRIZJA-HRVATSKE_CESTE.pdf (accessed on 08 January 2024).
- Tollazzi, T. Alternative Types of Roundabouts; Springer Tracts on Transportation and Traffic; Springer Cham: New York, USA, 2015; Vol. 6; ISBN 978-3-319-09083-2.
- Federal Highway Administration Roundabouts: An Informational Guide; McLean, Virginia, 2000. Available online: https://www.fhwa.dot.gov/publications/research/safety/00067/00067.pdf (accessed on 16 March 2024).
- Brilon, W. Roundabouts: A State of the Art in Germany. Transportation research circular 2005. Available online: https://www.researchgate.net/publication/237635143_Roundabouts_A_State_of_the_Art_in_Germany (accessed on 16 March 2024).
- Li, H.; Li, J.; Yang, Z.; Wu, J.; Chen, X. Micro-simulation study on capacity of roundabout. IEEE Conference on Intelligent Transportation Systems, Proceedings, ITSC 2011, 852–857. [CrossRef]
- Ministry of Transport Roundabouts - Application and Design: A Practical Manual; Netherlands, 2009. Available online: https://nmfv.dk/wp-content/uploads/2012/06/RDC_Netherlands.pdf (accessed on 02 February 2024).
- Austroads Guide to Road Design. Part 4B, Roundabouts; Sydney, Australia, 2023. Available online: https://austroads.gov.au/publications/road-design/agrd04b (accessed on 08 February 2024).
- Direkcija Republike Slovenije za ceste Tehnička specifikacija za javne ceste - krožna križišča (in Slovenian); Slovenia, 2012. Available online: https://www.gov.si/assets/organi-v-sestavi/DRSI/Dokumenti-DRSI/Tehnicne-specifikacije/Ukinjene-TSC/TSC_03_341_2010_Krozna_krizisca.pdf (accessed on 08 February 2024).
- Javno preduzeće Putevi Srbije Priručnik za projektovanje puteva u Republici Srbiji (in Serbian); Beograd, Serbia, 2012. Available online: https://www.putevi-srbije.rs/pdf/harmonizacija/prirucnik_za_projektovanje_puteva/SRDM5-3-kruzne-raskrnice(120427-srb-konacni).pdf (accessed on 10 February 2024).
- Demir, H.G.; Demir, Y.K. A Comparison of Traffic Flow Performance of Roundabouts and Signalized Intersections: A Case Study in Nigde. The Open Transportation Journal 2020, 14, 120–132. [CrossRef]
- Bared, J.; Edara, P. Simulated Capacity of Roundabouts and Impact of Roundabout Within a Progressed Signalized Road. Transportation research circular 2005. Available online: https://onlinepubs.trb.org/Onlinepubs/circulars/ec083/59_Baredpaper.pdf (accessed on 22 April 2024).
- Hallmark, S.; Fitzsimmons, E.J.; Isebrands, H.N.; Giese, K. Roundabouts in Signalized Corridors: Evaluation of Traffic Flow Impacts. Transp Res Rec 2010, 2182, 139–147. [CrossRef]
- Federal Highway Administration Roundabouts: An Informational Guide- Second Edition; Washington D.C., SAD, 2010. Available online: https://nap.nationalacademies.org/catalog/22914/roundabouts-an-informational-guide-second-edition (accessed on 15 May 2024).
- Tey, L.S.; Salim, M.S.; Shah, S.M.R.; Ranjitkar, P. Safety and operational performance of roundabouts. Int J Eng Adv Technol 2019, 8, 198–203. [CrossRef]
- Rodegerdts, L.A.; Jenior, P.M.; Bugg, Z.H.; Ray, B.L.; Schroeder, B.J.; Brewer, M.A. Evaluating the Performance of Corridors with Roundabouts. Evaluating the Performance of Corridors with Roundabouts 2014. [CrossRef]
- Lenters, M. Roundabouts near Traffic Signals. In Proceedings of the TexITE Meeting; Texas District of Institute of Transportation Engineers: San Antonio, 2014., Available online: https://www.texite.org/wp-content/uploads/meeting-presentations/F145B2.pdf (accessed on 10 November 2023).
- Benigar, M. Mreža kružnih raskrižja u urbanom prostoru - Temeljni principi definiranja (in Croatian). In Proceedings of the 9. slovenski kongres o cestah in prometu; Portorož, 2008; pp. 147–157.
- Isebrands, H.; Hallmark, S.; Fitzsimmons, E.; Stroda, J. Toolbox to Evaluate the Impacts of Roundabouts on a Corridor or Roadway Network; Minnesota Department of Transportation, Minnesota, 2008. Available online: https://www.lrrb.org/pdf/200824.pdf (accessed on 06 February 2024).
- Ištoka Otković, I. Using Neural Networks in the Process of Calibrating the Microsimulation Models in the Analysis and Design of Roundabouts in Urban Areas. Doctoral Thesis, University of Maribor, Faculty of Civil Engineering: Maribor, 2011. Available online: https://dk.um.si/IzpisGradiva.php?id=18811 (accessed on 08 May 2024).
- Luo, H.; Deng, M.; Chen, J. Queue Length Estimation Based on Probe Vehicle Data at Signalized Intersections. J Adv Transp 2023, 2023. [CrossRef]
- Šurdonja, S.; Nežić, D.; Deluka-Tibljaš, A. Mikrosimulacijski model proračuna kapaciteta kružnog raskrižja (in Croatian). Pomorski zbornik 2015, 49–50, 143–165. Available online: https://hrcak.srce.hr/138199 (accessed on 05 December 2023).
- Giuffrè, T.; Trubia, S.; Canale, A.; Persaud, B. Using Microsimulation to Evaluate Safety and Operational Implications of Newer Roundabout Layouts for European Road Networks. Sustainability 2017, 9, 2084. [CrossRef]
- Bulla-Cruz, L.A.; Laureshyn, A.; Lyons, L. Event-based road safety assessment: A novel approach towards risk microsimulation in roundabouts. Measurement (Lond) 2020, 165. [CrossRef]
- Rui-jun, G. A New Calculation Method of Capacity of Roundabout—Settled Proportion Interweave Section Volume Restrict Method. Journal of Transportation Systems Engineering and Information Technology 2006.
- Tollazzi, T.; Šrami, M.; Lerher, T. Roundabout Arm Capacity Determined by Microsimulation and Discrete Functions Technique. Promet - Traffic&Transportation 2008, 20. Available online: https://traffic.fpz.hr/index.php/PROMTT/article/view/1013 (accessed on 05 April 2024).
- Šraml, M.; Jovanović, G. Mikrosimulacije u prometu; Fakulteta za gradbeništvo: Maribor, 2014. Available online: https://core.ac.uk/download/pdf/67578766.pdf (accessed on 20 March 2023).
- PTV GROUP PTV VISSIM 10: User Manual; 2018; https://www.scribd.com/document/418753937/Vissim-11-Manual (accessed on 25 March 2023).
- Allen, W.G. Analysis of Corridor Traffic Peaking. Transp Res Rec 1991.
- Šurdonja, S.; Deluka-Tibljaš, A.; Babić, S. Optimization of roundabout design elements. Tehnički vjesnik 2013, 20, 533–539. Available online: https://hrcak.srce.hr/file/153034 (accessed on 20 January 2024).
- Li, H.; Wang, D.; Qu, Z. Research on the Optimal Method of Cycle Length for Signalized Intersection. Proceedings of the International Conference on Applications of Advanced Technologies in Transportation Engineering 2004, 371–376. [CrossRef]
- Builenko, V.; Pakhomova, A.; Pakhomov, S. Optimization of the method for collecting source data to calculate the length of the traffic light control cycle. Transportation Research Procedia 2018, 36, 90–94. [CrossRef]
- Hrvatske ceste Smjernice za prometnu svjetlosnu signalizaciju na cestama (in Croatian); Hrvatska, 2001; Available online: https://narodne-novine.nn.hr/clanci/sluzbeni/2001_07_61_996.html (accessed on 20 January 2024).
- Akcelik & Associates PTY LTD SIDRA Intersection 9.1 - User Guide 2022.
|
Disclaimer/Publisher’s Note: The statements, opinions and data contained in all publications are solely those of the individual author(s) and contributor(s) and not of MDPI and/or the editor(s). MDPI and/or the editor(s) disclaim responsibility for any injury to people or property resulting from any ideas, methods, instructions or products referred to in the content. |
© 2025 by the authors. Licensee MDPI, Basel, Switzerland. This article is an open access article distributed under the terms and conditions of the Creative Commons Attribution (CC BY) license (http://creativecommons.org/licenses/by/4.0/).