
Submitted:
28 October 2023
Posted:
30 October 2023
You are already at the latest version
Abstract
Efficient traffic management at signalized intersections is integral to urban infrastructure development, requiring accurate estimation of delay times to mitigate congestion and enhance overall transportation systems. Traditional methodologies, including empirical observations and microsimulation software, have been prevalent in assessing delay times; however, their limitations have prompted the exploration of novel technologies like LiDAR (Light Detection and Ranging) sensors. This research study investigates and compares the accuracy of delay time estimations obtained from LiDAR sensor technology with those derived from microsimulation in AIMSUN. LiDAR sensors, known for their high-resolution, real-time data collection capabilities, offer a promising avenue for precise measurement of delay times at signalized intersections. Nonetheless, challenges in sensor placement, environmental influences, and data processing complexities suggest the need for further development and validation. In parallel, microsimulation software, exemplified by AIMSUN, provides a virtual platform for scenario testing but relies on assumptions that may not always mirror real-world traffic dynamics accurately. The comparative analysis conducted in this study aims to critically examine the discrepancies and potential complementarity between delay times obtained from LiDAR sensor technology and those derived from microsimulation in AIMSUN. The research involves an in-depth evaluation of real-time, high-resolution data collected by LiDAR sensors, assessing their accuracy in capturing the intricate movements and behavior of vehicles at signalized intersections. Simultaneously, AIMSUN microsimulation delay time models are scrutinized for their ability to accurately replicate these observed delay times. The disparities identified serve as critical insights into the challenges of both methodologies, prompting the discussion on the prospects of integrating LiDAR-derived data and microsimulation calibration processes to enhance the precision and reliability of delay time estimations. Future traffic management strategies can significantly benefit from a more accurate understanding of delay times, and this study endeavors to contribute to the advancement of methodologies in traffic engineering for more effective urban transportation systems.The paper's findings illuminate the potential and limitations of both LiDAR sensor technology and microsimulation in estimating delay times at signalized intersections. The results highlighted that the LiDAR sensors could accurately calculate delay times at a signalized intersection. Furthermore, the calculated delay time differences by LiDAR and AIMSUN at three days with the highest vehicle volumes (counts) are always less than 6.5%.
Keywords:
LiDAR Sensor Technology
; Signalized Intersections
; Delay Time
; Microsimulation
; AIMSUN Software
; LiDAR-Derived Data
1. INTRODUCTION
Transportation systems are fundamental components of modern urban infrastructure, and the efficiency of these systems greatly influences the quality of life in cities [1,2,3]. Signalized intersections, being crucial nodes in road networks, play a pivotal role in traffic flow management. Accurate estimation of delay times at these intersections is imperative for effective traffic engineering, infrastructure development, and congestion alleviation [1,2,4,5,6]. Traditionally, delay times have been estimated using empirical observations or through microsimulation software, with each method carrying its own set of advantages and limitations [7,8]. In recent years, the emergence of LiDAR (Light Detection and Ranging) sensor technology has introduced a new approach for real-time data collection and analysis in transportation studies [1,2,4,5,6,9]. This research aims to explore and compare the accuracy of delay time estimations at signalized intersections obtained through LiDAR sensor technology and microsimulation in AIMSUN, shedding light on the strengths and limitations of each approach.
LiDAR sensor technology has gained prominence in various fields due to its ability to generate highly precise three-dimensional spatial data by emitting laser pulses and measuring their reflections [9]. In the realm of traffic analysis, LiDAR sensors offer the advantage of capturing real-time, high-resolution data, which could potentially revolutionize the way delay times are measured and traffic patterns are understood at signalized intersections. However, the application of LiDAR in traffic engineering, particularly in accurately estimating delay times, poses challenges related to sensor placement, environmental interferences, and data processing intricacies. This paper seeks to critically assess the potential of LiDAR in providing accurate delay time estimations and to investigate its feasibility as a reliable tool for traffic analysis.
In parallel, microsimulation software like AIMSUN has been widely employed in traffic engineering to model and predict traffic behavior at signalized intersections. These tools simulate complex traffic scenarios, allowing for the analysis of different parameters affecting delay times [10]. Despite their utility, microsimulation models rely on various assumptions and input data that may not always precisely replicate real-world traffic dynamics. Thus, this study aims to juxtapose the accuracy of delay time estimations from AIMSUN simulations with the real-time data acquired through LiDAR sensors. By comparing these two methods, this research endeavors to explore the discrepancies, limitations, and potential synergies between empirical data collected by LiDAR technology and simulated data in AIMSUN, offering insights into the reliability and accuracy of each approach.
2. DATA ANALYSIS
This study focuses on the intersection of Marlboro Pike and Brooks Dr. in Coral Hills, MD, USA. In order to understand intersection safety conditions, LiDAR data for June 2023 was analyzed. Figure 1 shows the location of the intersection and the main land-uses surrounding it. Two red circles indicate the locations of the LiDAR sensors.
During the specified time interval (June 2023), the volume of vehicles, pedestrians, and bicyclists was analyzed. Diurnal counts of vehicles, pedestrians, and bicycles were used to identify morning, midday, and afternoon peak hours. To compare the LiDAR and AIMSUN delay times in June 2023, three days with peak daily volumes (counts) were identified and June 2nd, June 1st, and June 9th were identified as three days with the highest vehicle volumes, respectively. In other words, the highest frequency of vehicles (including cars, buses, trucks, and trailers) have been passed through the intersection on June 2nd, 1st, and 9th, respectively. The Figure 2 shows the total daily vehicles volumes (counts) in June 2023.
As shown in Figure 2, June 2nd, 1st, and 9th were shown by red dots as three days with the highest frequency of passing vehicles. In each day, the peak hour of the day was specified. Hereupon, 16:45 – 17:45 PM on June 1st (=2528 counts), 17:00 – 18:00 PM on June 2nd (=2556 counts), and 16:45 – 17:45 PM on June 9th (=2310 counts) were identified as daily peak hours. Figure 3, Figure 4 and Figure 5 show the peak hour vehicle counts in different intersection’s approaches.
The speed changes at the intersection are shown in Figure 6.
In Figure 6, 37.5 km/h, 29.7 km/h, 40.7 km/h, and 30.1 km/h are collected by the LiDAR sensors as the average speeds in NS (SBT), EW (WBT), SN (NBT), and WE (EBT). According to the speed diagram, diurnal speeds are higher on the north-south approach to the intersection.
Phase #6 of the traffic signal is the focus of the study. Marlboro Pike and Brooks Dr. intersection has the highest number of yellow and red light runners in Phase #6 covering the southbound side of the intersection. Over June 2023, 3112 red light runners were recorded for South Bound Straight Thru (SBT or NS), and 204 events were recorded for South Bound Left Turn (SBL or NE). The delay time of one phase of the traffic signal at a signalized intersection can influence and potentially increase the number of yellow and red light runners due to various behavioral and psychological factors. LiDAR sensors can monitor delays in different approaches to intersections based on volumes of passing vehicles, pedestrians, and bicyclists, number of stops, as well as traffic signal timing. LiDAR sensors function by emitting laser pulses and measuring the time it takes for these pulses to return after hitting objects in their path. In the context of signalized intersections, LiDAR sensors are strategically placed to capture data on various elements impacting traffic flow.
- 1)
- Vehicle Volume Monitoring: LiDAR sensors accurately capture the number and types of vehicles passing through different approaches to the intersection. This data helps in understanding traffic density and patterns, which are critical for optimizing signal timings and identifying congestion points.
- 2)
- Pedestrian and Bicyclist Detection: LiDAR sensors are sensitive enough to detect pedestrians and bicyclists, allowing for their inclusion in the overall traffic analysis. This data is crucial for ensuring their safety and optimizing signal timings to accommodate their movements.
- 3)
- Number of Stops and Delay Monitoring: By detecting the speed of vehicles and the points at which they stop, LiDAR sensors provide insights into the number of stops and delays at the intersection. This information is vital for assessing the efficiency of traffic flow and identifying areas requiring improvement.
- 4)
- Traffic Signal Timing Optimization: The data collected by LiDAR sensors aids in optimizing traffic signal timings. By analyzing the traffic flow patterns, the sensors can suggest adjustments to signal cycles and phase durations, reducing delays and improving overall traffic efficiency.
The implementation of LiDAR sensors in signalized intersections offers a multifaceted approach to delay monitoring. These sensors, equipped with advanced technology, accurately and continuously gather real-time data, enabling a dynamic assessment of traffic conditions. By precisely detecting and measuring distances, speeds, and traffic patterns, LiDAR sensors provide a comprehensive understanding of delays in different intersection approaches. Hereupon, two LiDAR sensors located at the intersection of Marlboro Pike and Brooks Dr. in Coral Hills, MD, USA, specified the delay time for phase #6 in peak daily hours of June 1st, 2nd, and 9th as shown in Table 1. Delay times during peak hours are highlighted in yellow.
In order to compare the accuracy of calculated delay times by two LiDAR sensors with AIMSUN software, the intersection was simulated in AIMSUN and three peak hours on June 1st, 2nd, and 9th were analyzed. AIMSUN software stands as a pioneering tool for simulating and evaluating transportation networks, particularly in calculating delay times within various approaches to simulated signalized intersections. AIMSUN offers a sophisticated platform that leverages microsimulation techniques to replicate real-world traffic scenarios within a virtual environment [11,12,13]. Using advanced algorithms and modeling capabilities, the software accurately computes delay times in different approaches to signalized intersections by simulating the intricate interactions among vehicles, pedestrians, and bicyclists. This simulation software employs a detailed representation of the traffic network, factoring in lane configurations, signal timings, and the behavior of diverse road users to precisely estimate delays within each approach. The data generated from these simulations is invaluable in understanding traffic performance and optimizing signal timing strategies to mitigate delays effectively.
AIMSUN’s ability to calculate delay times in various approaches to simulated signalized intersections lies in its capacity to model complex traffic scenarios. By considering multiple variables such as traffic volume, signal phasing, road geometry, and individual driver behaviors, the software accurately predicts delays [10,11,12,13]. It accounts for the intricacies of interactions among vehicles, including merging, lane changes, and signal-controlled movements. AIMSUN’s simulation algorithms replicate real-world conditions with high fidelity, allowing for a detailed analysis of delays specific to each approach within signalized intersections. The comprehensive nature of AIMSUN software in evaluating delay times within simulated signalized intersections lies in its ability to generate detailed and insightful data. By running simulations that reflect real-world scenarios, AIMSUN captures and processes a wide array of data points. These include vehicle trajectories, travel times, queue lengths, and the time vehicles spend at intersections, offering a thorough understanding of delay times within different approaches. This detailed information is instrumental in assessing the effectiveness of potential interventions or signal timing adjustments aimed at reducing delays and optimizing traffic flow.
AIMSUN software utilizes various mathematical equations and algorithms to compute delay times in different approaches to simulated signalized intersections. The key equations and methodologies commonly employed in AIMSUN software for delay time calculations are described.
A common method to calculate delay times at signalized intersections is the Highway Capacity Manual (HCM) method. This method employs mathematical models such as the Webster’s Delay Model or the HCM’s Signalized Intersection Methodology to estimate delays [11,12]. The delay at a signalized intersection is determined by accounting for various factors, including the number of vehicles, signal timings, control delay, and geometric features. The delay equation (Equation 1) typically incorporates cycle length, effective green time, and saturation flow rate to estimate the delay experienced by vehicles within an approach to the intersection.
Delay=Total Control Delay + Total Intersection Delay
Equation (1) combines control delay (time spent waiting at the red signal) and intersection delay (time spent while moving through the intersection). These delays are influenced by factors like cycle length, green time, arrival patterns, and clearance times at intersections.
Queuing theory is often applied in traffic engineering to model delays at intersections. Equations derived from queuing theory, such as the M/M/1 or M/M/c models, can estimate the delay incurred by vehicles waiting in queues. These models consider the arrival rate of vehicles, service rate (how quickly vehicles move through the intersection), and the number of service channels (lanes) to estimate delays due to queuing (Equation 2).
where λ is the arrival rate and μ is the service rate.
Average Delay=(1/(μ−λ)) − (1/μ)
AIMSUN uses microsimulation techniques, which involve simulating individual vehicle movements and interactions. The software uses car-following models like the Intelligent Driver Model (IDM) or Gipps’ model, which are based on differential equations governing vehicle acceleration, speed, and spacing to estimate delays caused by traffic dynamics and interactions between vehicles.
Equation (3) is the IDM equation that represents a car-following model where is the acceleration, V is the vehicle speed, a is the maximum acceleration, is the desired speed, s is the spacing between vehicles, and is the minimum spacing. AIMSUN’s calculations and delay estimation incorporate these and similar mathematical models to simulate and compute delay times within different approaches to simulated signalized intersections. These equations might vary based on specific intersection configurations, traffic conditions, and simulation parameters.
Figure 7 illustrates the simulated network in AIMSUN.
Three peak hours on June 1st, 2nd, and 9th were simulated. Calibrating a simulated signalized intersection within AIMSUN software is a pivotal and meticulous process essential for ensuring the accuracy of the simulation model’s representation of real-world traffic conditions. The calibration process in AIMSUN necessitates adjusting a myriad of parameters and model settings to align with empirical data or observed behaviors within the actual signalized intersection. This iterative process significantly fortifies the reliability and validity of the simulation outcomes. The calibration procedure entails several essential steps and considerations. Initially, it involves the meticulous collection and validation of real-world data, encompassing traffic volumes, vehicle counts, signal timings, and vehicle trajectories, acting as a benchmark against which the simulation is refined. Model initialization commences with building a foundational simulation model mirroring the physical attributes of the signalized intersection, ensuring faithful replication of road layouts, lanes, traffic signals, and signal sequencing. Furthermore, the heart of the calibration process involves adjusting diverse model parameters to accurately mirror the observed data. Parameters subject to calibration include traffic demand, signal timings, driver behavior models, and saturation flow rates, necessitating fine-tuning to match real-world behaviors and conditions. Subsequent validation iterations involve running simulations, comparing outputs with observed data, and iteratively modifying parameters until the simulated results align closely with the real-world data. Sensitivity analyses are conducted to gauge the impact of parameter changes on simulation outcomes, ensuring the model’s robustness across varying traffic scenarios. Thorough documentation of the calibrated model, including parameter values and assumptions, is crucial for transparency and potential future validations. The aforementioned steps were followed in this research to calibrate the simulated signalized intersection in AIMSUN software. After simulating the network, 54.5 sec, 59.8 sec, and 56.7 sec were calculated as delay times. Figure 8 demonstrates the calculated delay time values by LiDAR sensors and AIMSUN software.
Figure 9 shows the accuracy of AIMSUN delay times compared to LiDAR delay times.
The comparison between collected delay times by two LiDAR sensors at signalized intersections and those derived from microsimulation in AIMSUN has unveiled significant insights into the accuracy and applicability of this cut-edge technology in traffic analysis. This research’s findings revealed that the LiDAR sensors could accurately calculate delay times at a signalized intersection. Factors such as calibration, input data accuracy, and model assumptions are critical considerations that impact the accuracy of delay time estimations. Understanding these discrepancies is crucial in refining the methodologies used in AIMSUN and other similar software, enabling more reliable and realistic modeling of traffic behavior and intersection performance. Furthermore, the findings indicated that employing LiDAR sensors for delay time estimation presents a promising and innovative approach. The precision and real-time data collection capabilities of LiDAR technology offer a unique advantage in accurately measuring delay times at signalized intersections. The high-resolution and three-dimensional nature of LiDAR data provide a detailed understanding of vehicle movements, enabling more accurate calculations of delay times compared to traditional methods [14,15]. However, despite its potential, challenges related to the need for meticulous sensor placement, environmental factors affecting sensor performance, and data processing complexities remain. Addressing these challenges is imperative for optimizing the accuracy and reliability of delay time calculations using LiDAR sensors.
3. CONCLUSION
This study highlighted the inherent disparities between simulated and real-world delay times, emphasizing the complexities and limitations associated with the application of LiDAR and AIMSUN in estimating delay times. The comparative analysis conducted between delay times derived from LiDAR sensor technology and those obtained through microsimulation in AIMSUN has presented an insightful examination of two distinct methodologies for estimating delay times at signalized intersections. This study has highlighted the unique advantages and challenges inherent in both approaches. LiDAR sensor technology demonstrated its potential as a powerful tool for measuring delay times with high precision and real-time data acquisition. The three-dimensional and detailed data provided by LiDAR sensors offer a promising avenue for accurately capturing vehicle movements and calculating delay times. However, challenges surrounding sensor placement, environmental interferences, and data processing complexities suggest that further advancements and refinements are necessary for widespread adoption in accurate delay time estimations at signalized intersections.
Moreover, the comparison between delay times obtained by LiDAR sensor technology and microsimulation in AIMSUN emphasizes the need for a synergistic approach that capitalizes on the strengths of both methodologies. While LiDAR technology excels in real-time data collection, microsimulation software like AIMSUN provides a virtual platform for scenario testing and predictive analysis. The observed disparities between the two methods underscore the significance of integrating real-time, high-resolution data from LiDAR sensors into the calibration and validation processes of microsimulation models. Combining the accuracy of LiDAR data with the predictive capabilities of microsimulation can potentially enhance the reliability and precision of delay time estimations in traffic analysis. However, it is crucial to address the challenges identified in both methodologies for more robust and accurate estimations. The complexities of LiDAR technology, such as environmental influences and sensor calibration, must be mitigated to ensure its effectiveness across various traffic scenarios and conditions [16,17,18,19]. Similarly, microsimulation models in AIMSUN and similar software necessitate continuous refinement and validation using empirical data from advanced sensor technologies like LiDAR. The findings of this research highlighted that the LiDAR sensors installed at Marlboro Pike and Brooks Dr. in Coral Hills, MD, USA could calculate the delay times with proper precision. As can be seen in Figure 9, the calculated delay time differences by LiDAR and AIMSUN at three days with the highest vehicle volumes (counts) are always less than 6.5%.
Future research should concentrate on refining LiDAR technology to overcome environmental challenges and varying traffic scenarios. Simultaneously, it is essential to refine microsimulation models, integrating LiDAR-derived data for robust calibration and validation. This dual-pronged approach will foster advancements in traffic engineering, enabling more accurate estimations of delay times and thereby contributing to the development of efficient traffic management strategies and infrastructure improvements. For future studies in the realm of assessing delay times at signalized intersections, examining the potential application of machine learning algorithms within microsimulation frameworks to optimize model calibration and improve the fidelity of simulated delay times would be an instrumental avenue for future exploration. Additionally, the study could extend its scope to encompass a broader range of traffic scenarios and environmental conditions to validate the robustness of the combined approach, ensuring its adaptability and accuracy in diverse real-world settings. By advancing the synergy between LiDAR sensor technology and microsimulation software, future studies could significantly contribute to the development of more reliable methodologies for estimating delay times at signalized intersections, thereby enhancing traffic management strategies and facilitating more efficient urban transportation systems.
1. REFERENCES
- Ansariyar, A. Enhancing Intersection Efficiency Through Smart Green Time Allocation at a Signalized Intersection Equipped with two LiDAR Sensors. 2023. [Google Scholar] [CrossRef]
- Ansariyar, A. Efficiency Improvement at Signalized Intersections: Investigating Smart Green Time Allocation with Two LiDAR Sensors and AIMSUN Microsimulation. 2023. [Google Scholar] [CrossRef]
- Mondal, S.; Gupta, A. Microsimulation-based framework to analyse urban signalised intersection in mixed traffic. In Proceedings of the Institution of Civil Engineers-Transport; Thomas Telford Ltd., 2020; pp. 1–13. [Google Scholar]
- Ansariyar, A. Precision in Motion: Assessing the Accuracy of LiDAR Sensors for Delay Time Calculation at Signalized Intersections. 2023. [Google Scholar] [CrossRef]
- Ansariyar, A. Real-time Traffic Control and Safety Measures Analysis Using LiDAR Sensor during Traffic Signal Failures. 2023. [Google Scholar] [CrossRef]
- Ansariyar, A. Providing a comprehensive traffic safety analysis collected by two LiDAR sensors at a signalized intersection. 2023. [Google Scholar] [CrossRef]
- Wu, J.; Xu, H.; Zhang, Y.; Tian, Y.; Song, X. Real-time queue length detection with roadside LiDAR data. Sensors 2020, 20, 2342. [Google Scholar] [CrossRef] [PubMed]
- Gu, Y.; Hashimoto, Y.; Hsu, L.T.; Iryo-Asano, M.; Kamijo, S. Human-like motion planning model for driving in signalized intersections. IATSS Res. 2017, 41, 129–139. [Google Scholar] [CrossRef]
- Ansariyar, A.; Taherpour, A. Investigating the accuracy rate of vehicle-vehicle conflicts by LIDAR technology and microsimulation in VISSIM and AIMSUN. Adv. Transp. Stud. 2023, 61. [Google Scholar]
- Ansariyar, A.; Tahmasebi, M. Investigating the effects of gradual deployment of market penetration rates (MPR) of connected vehicles on delay time and fuel consumption. J. Intell. Connect. Veh. 2022, 5, 188–198. [Google Scholar] [CrossRef]
- Moyano, C.M.; Ortega, J.F.; Mogrovejo, D.E. Efficiency analysis during calibration of traffic microsimulation models in conflicting intersections near Universidad del Azuay, using Aimsun 8.1; 2018. [Google Scholar]
- Barceló, J.; Casas, J. Dynamic network simulation with AIMSUN. In Simulation approaches in transportation analysis: Recent advances and challenges; Springer: Boston, MA, USA, 2005; pp. 57–98. [Google Scholar]
- Casas, J.; Ferrer, J.L.; Garcia, D.; Perarnau, J.; Torday, A. Traffic simulation with aimsun. Fundam. Traffic Simul. 2010, 173–232. [Google Scholar]
- Ansariyar, A.; Taherpour, A. Statistical analysis of vehicle-vehicle conflicts with a LIDAR sensor in a signalized intersection. Adv. Transp. Stud. 2023, 60. [Google Scholar]
- Ansariyar, A.; Ardeshiri, A.; Sadeghvaziri, E.; Jeihani, M. Investigating the effect of Connected Vehicles (CVs) route guidance on mobility by microsimulation. Adv. Transp. Stud. 2023, 60. [Google Scholar]
- Fang, F.C.; Elefteriadou, L. Some guidelines for selecting microsimulation models for interchange traffic operational analysis. J. Transp. Eng. 2005, 131, 535–543. [Google Scholar] [CrossRef]
- Fang, F.C.; Elefteriadou, L. Capability-enhanced microscopic simulation with real-time traffic signal control. IEEE Trans. Intell. Transp. Syst. 2008, 9, 625–632. [Google Scholar] [CrossRef]
- Arabul, E.; Girach, A.; Rarity, J.; Dahnoun, N. Precise multi-channel timing analysis system for multi-stop LIDAR correlation. In 2017 IEEE International Conference on Imaging Systems and Techniques (IST); 2017; pp. 1–6. [Google Scholar]
- Donati, S.; Martini, G.; Pei, Z.; Cheng, W.H. Analysis of timing errors in time-of-flight LiDAR using APDs and SPADs receivers. IEEE J. Quantum Electron. 2020, 57, 1–8. [Google Scholar] [CrossRef]
Figure 1.
Marlboro Pike & Brooks Dr. intersection [1].
Figure 1.
Marlboro Pike & Brooks Dr. intersection [1].
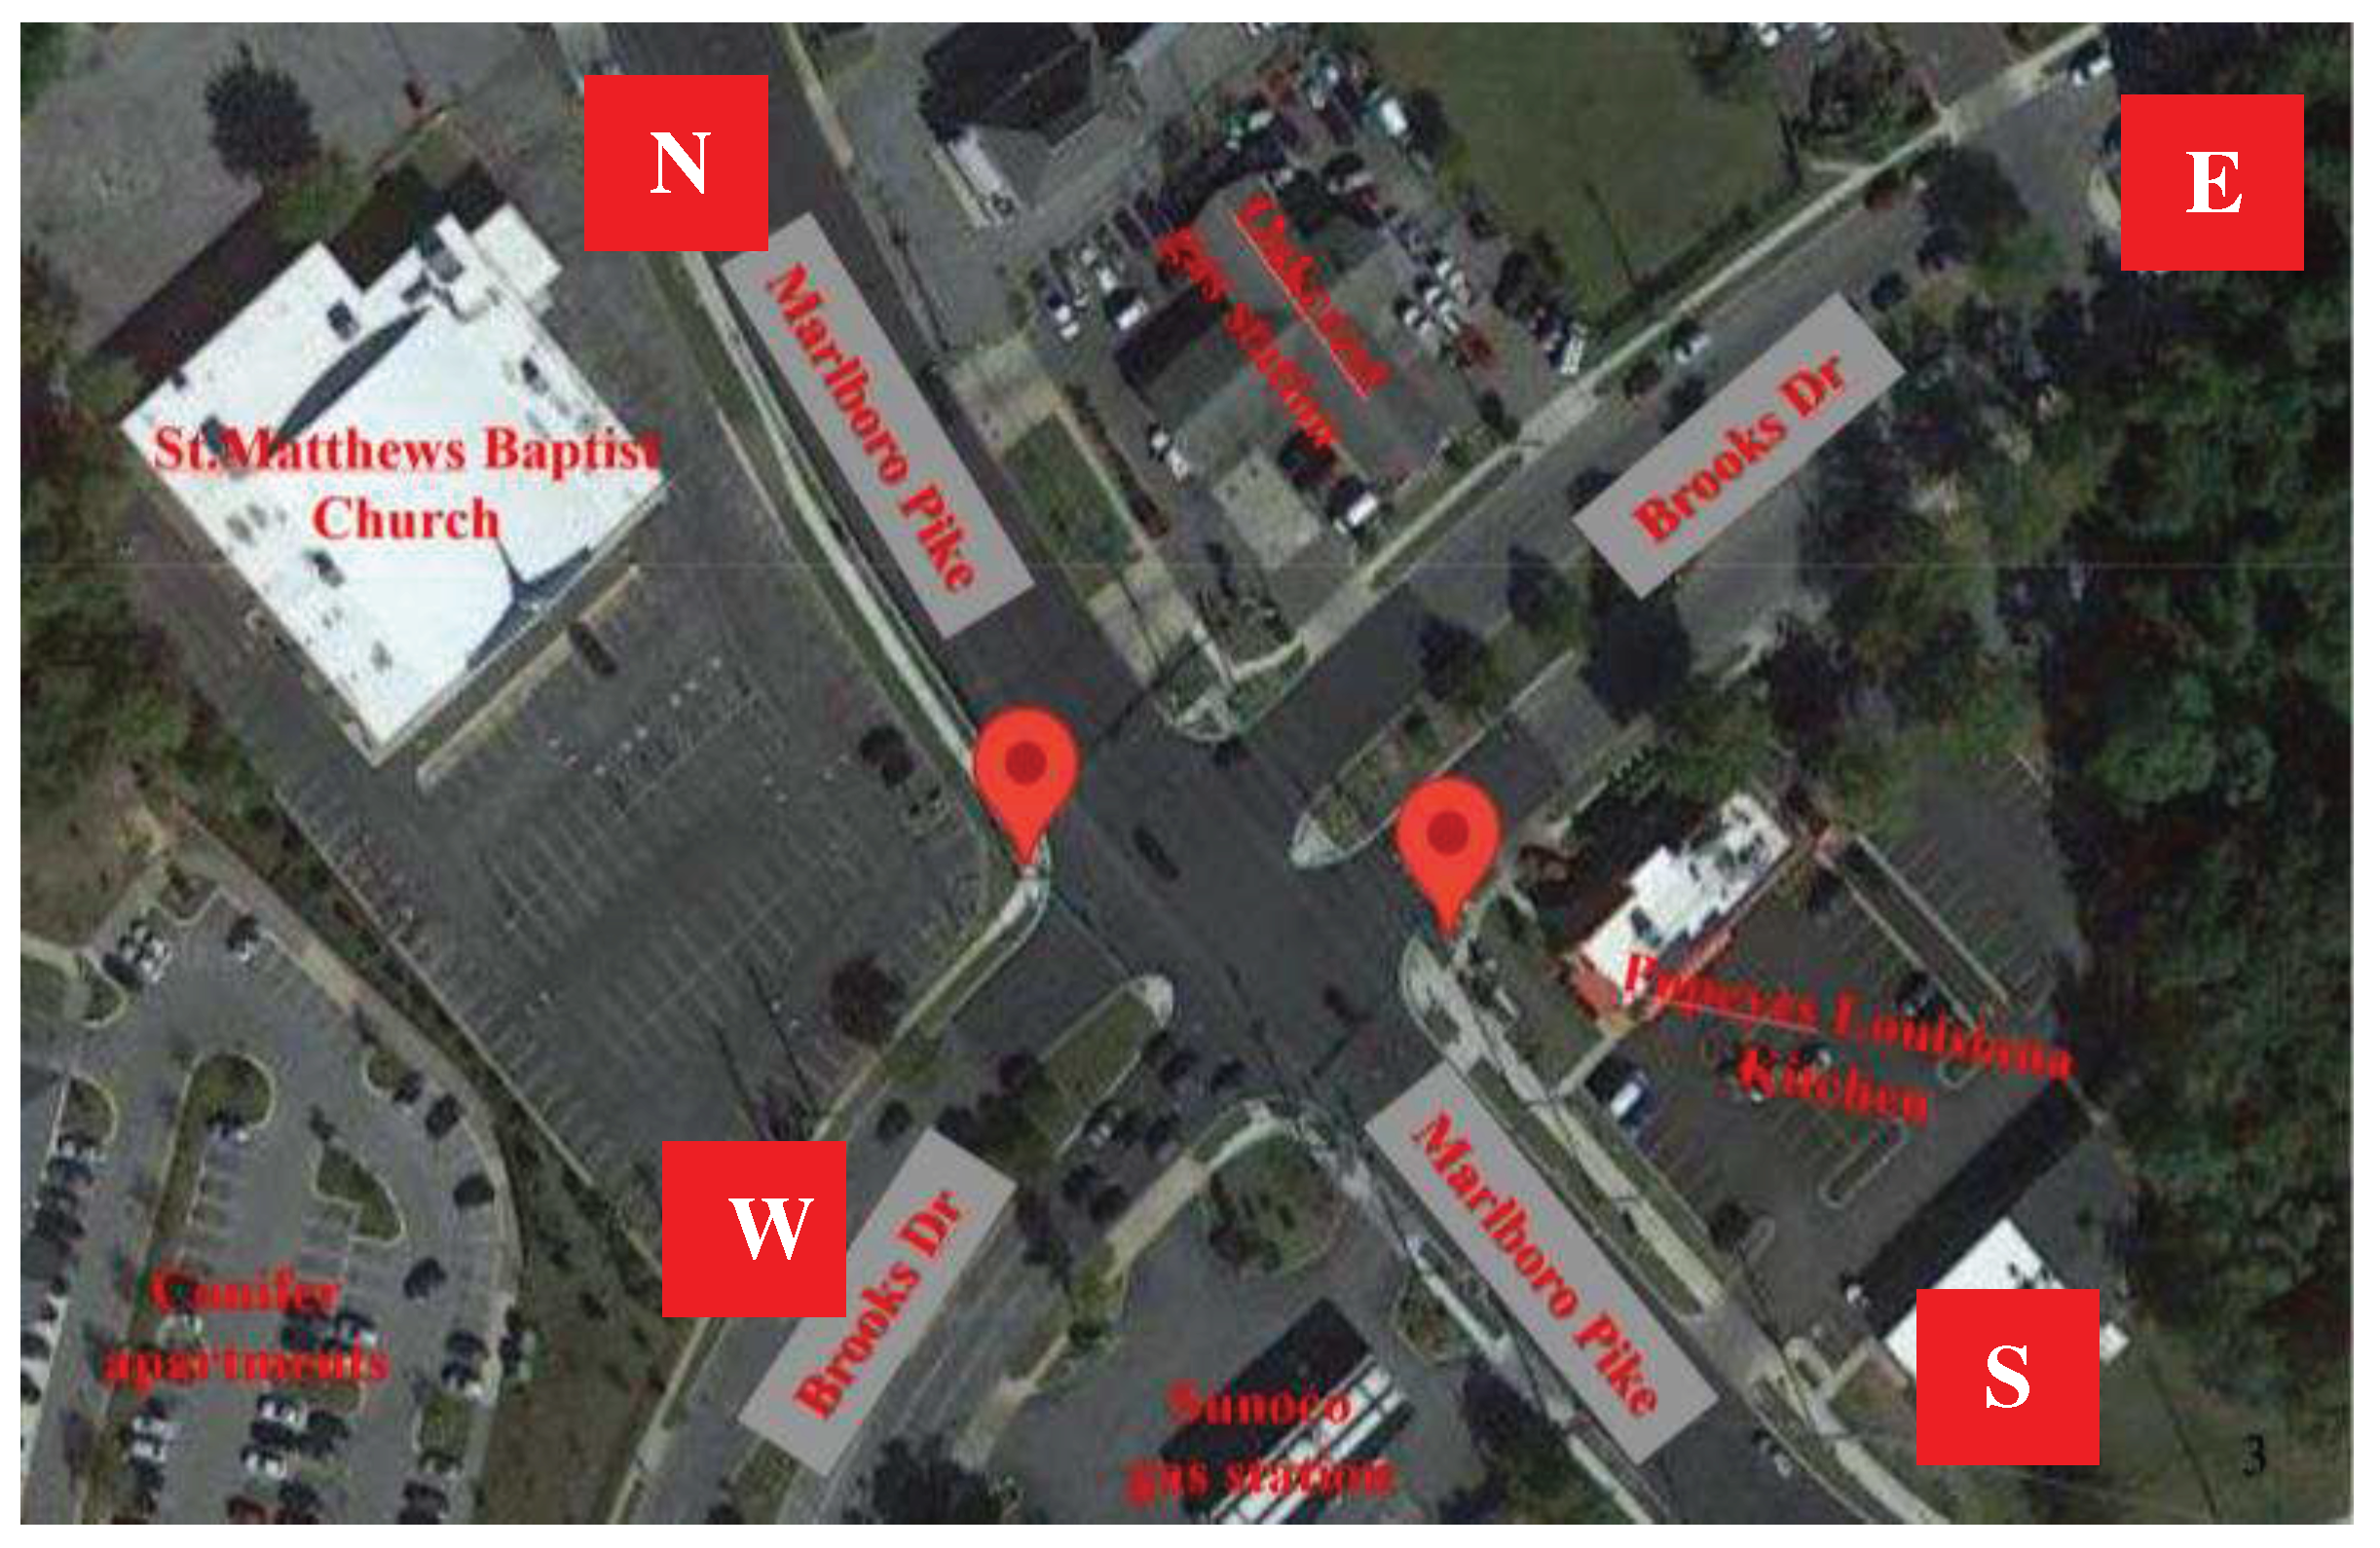
Figure 2.
Total Passing Vehicle Volumes (Counts) in June 2023.
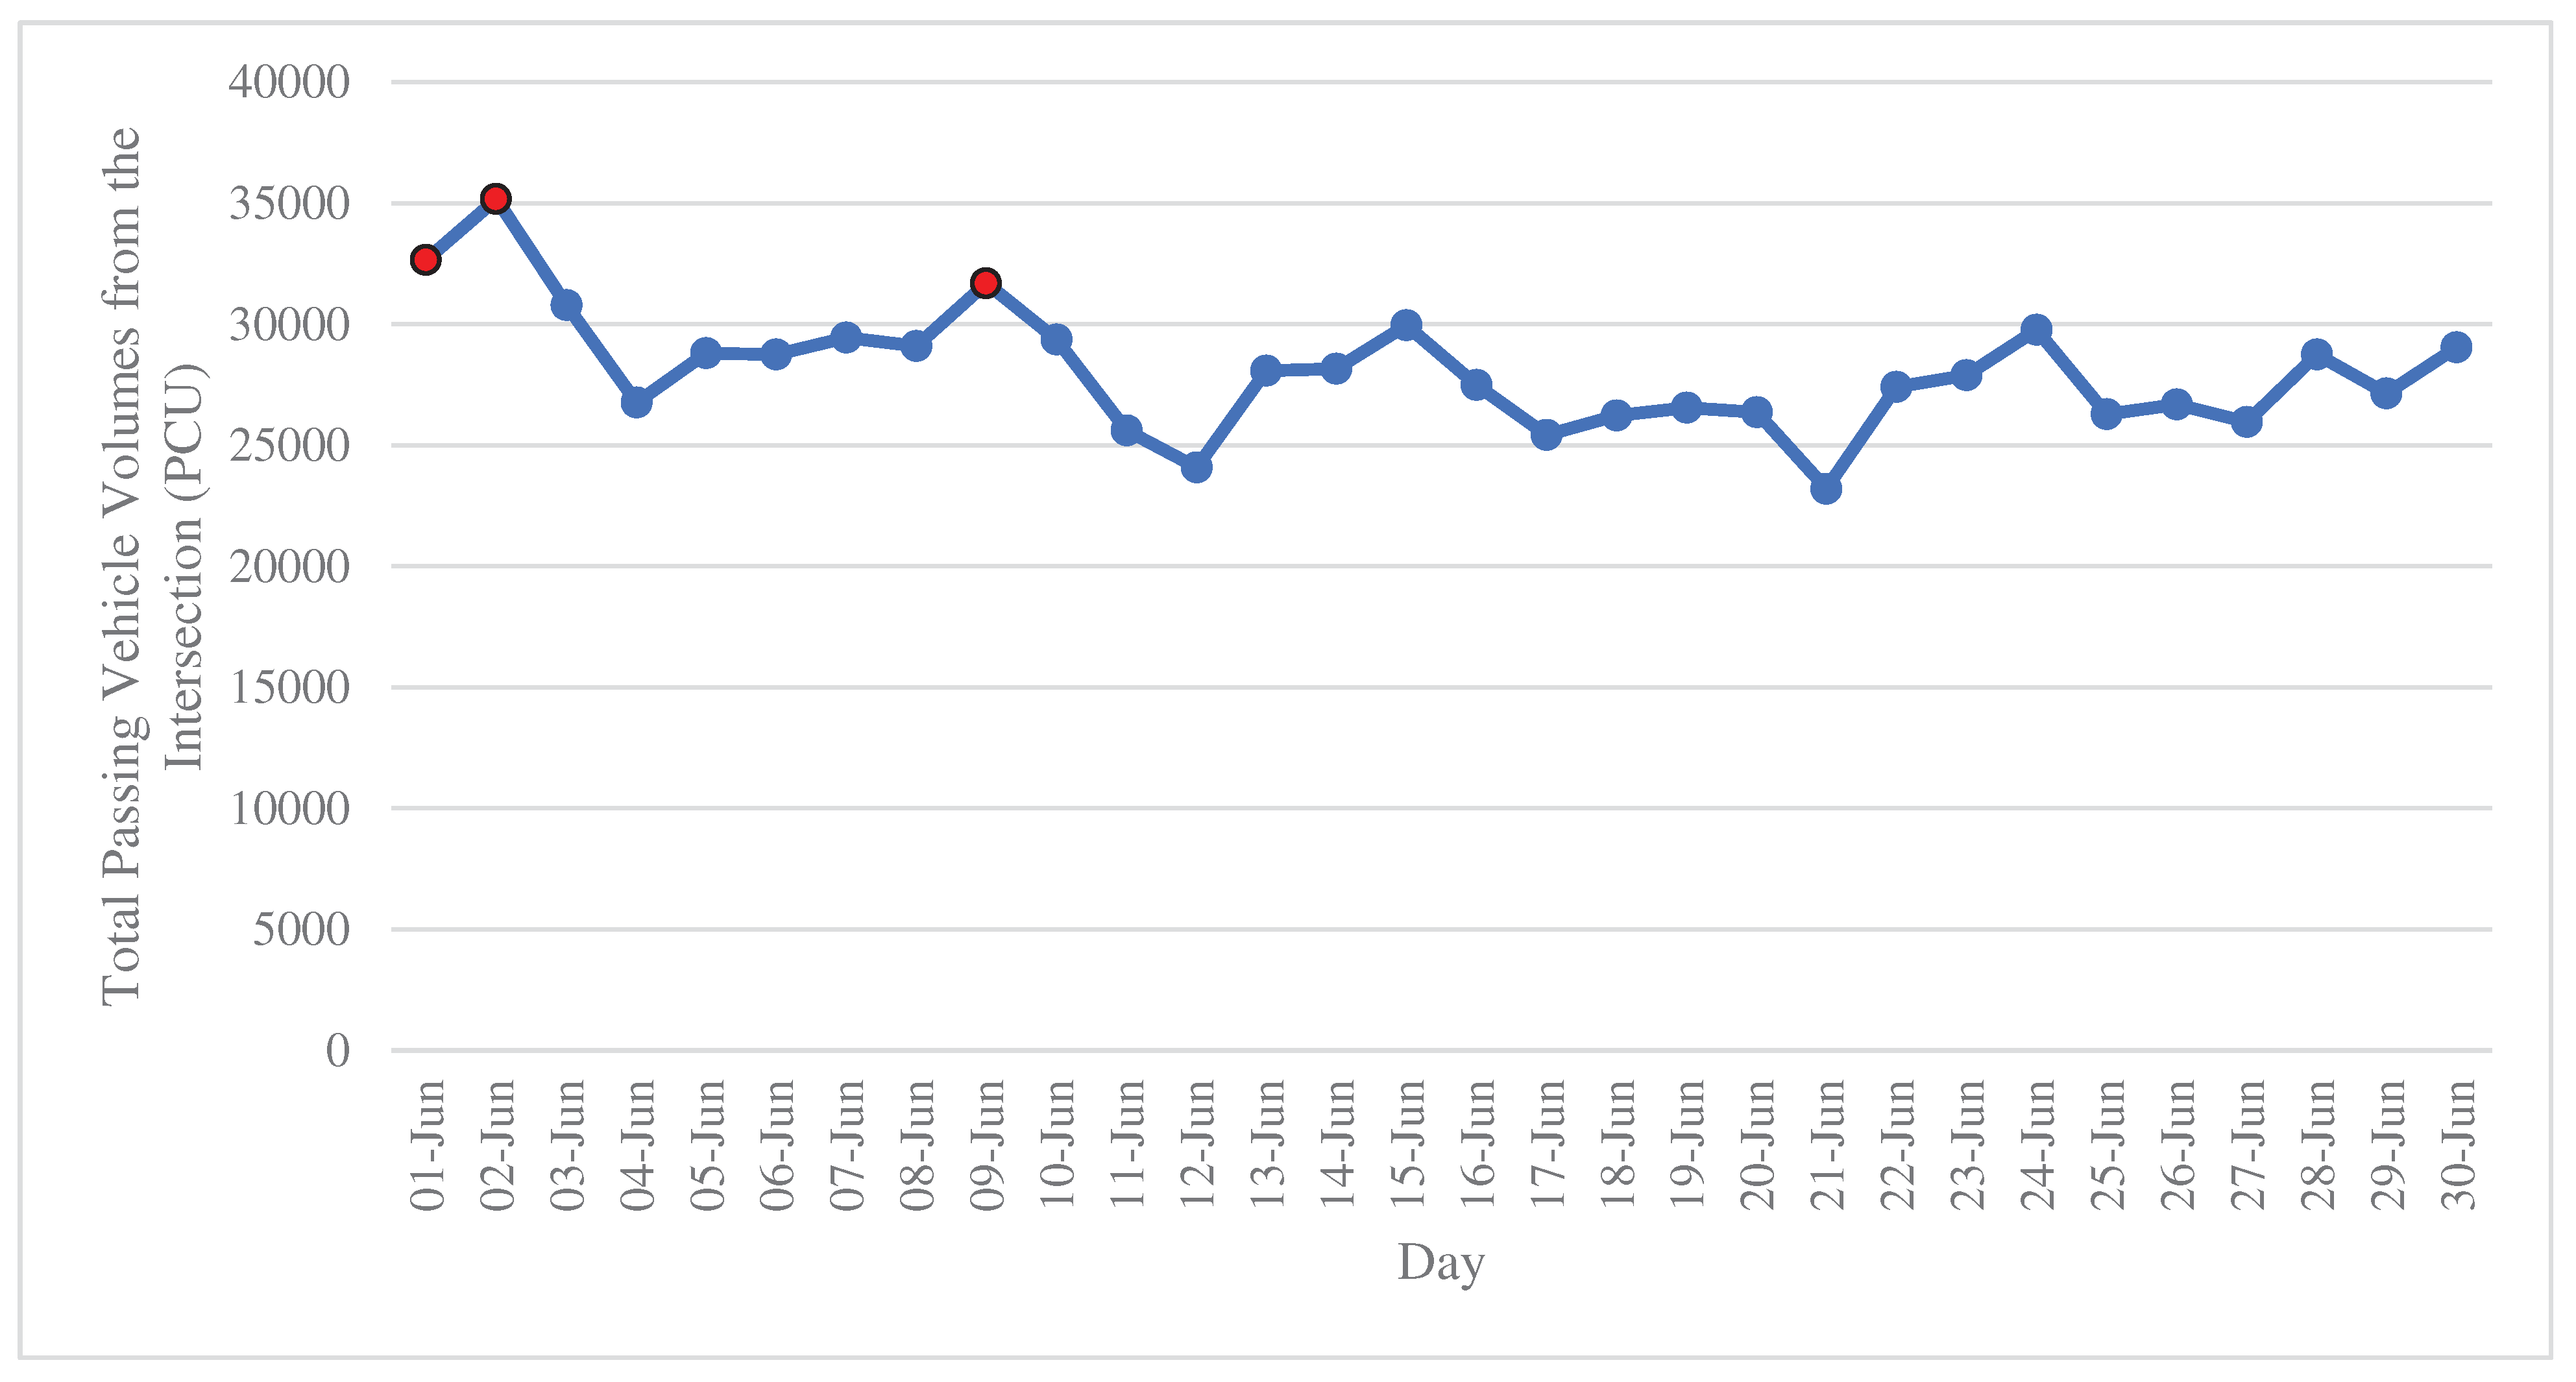
Figure 3.
Peak Hour of June 1st (Vehicle Volumes - 16:45 - 17:45 PM).
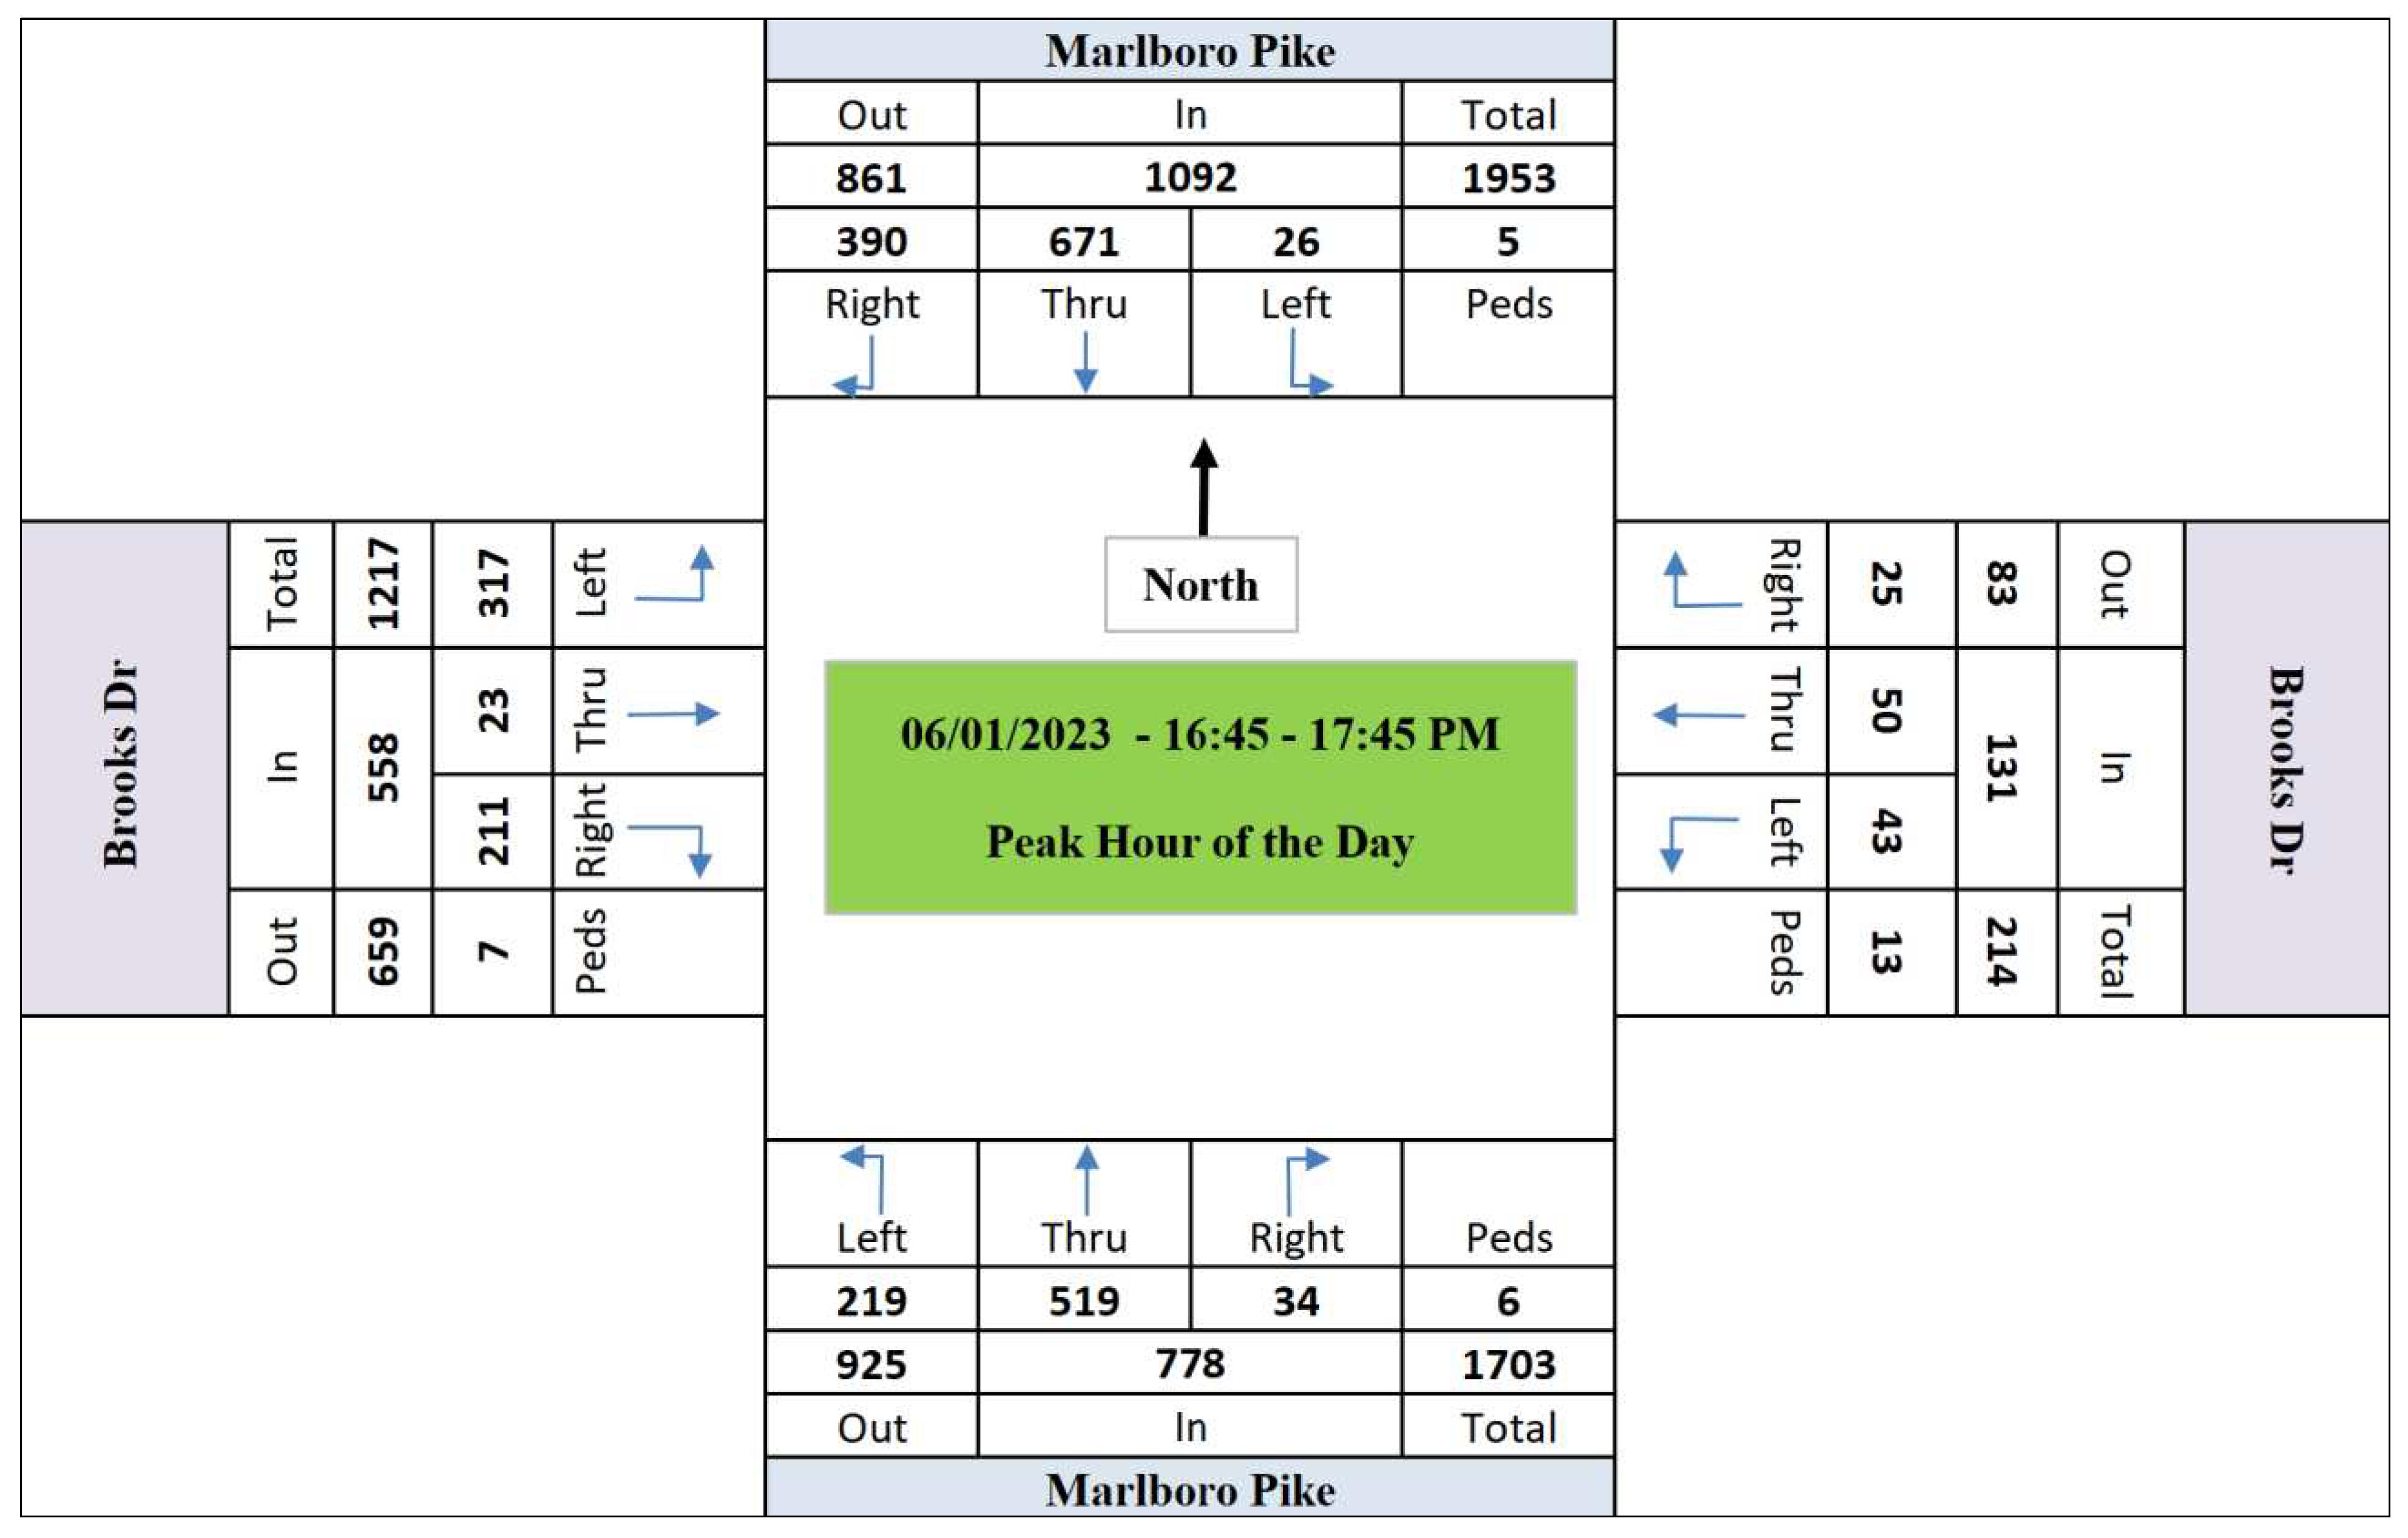
Figure 4.
Peak Hour of June 2nd (Vehicle Volumes - 17:00 - 18:00 PM).
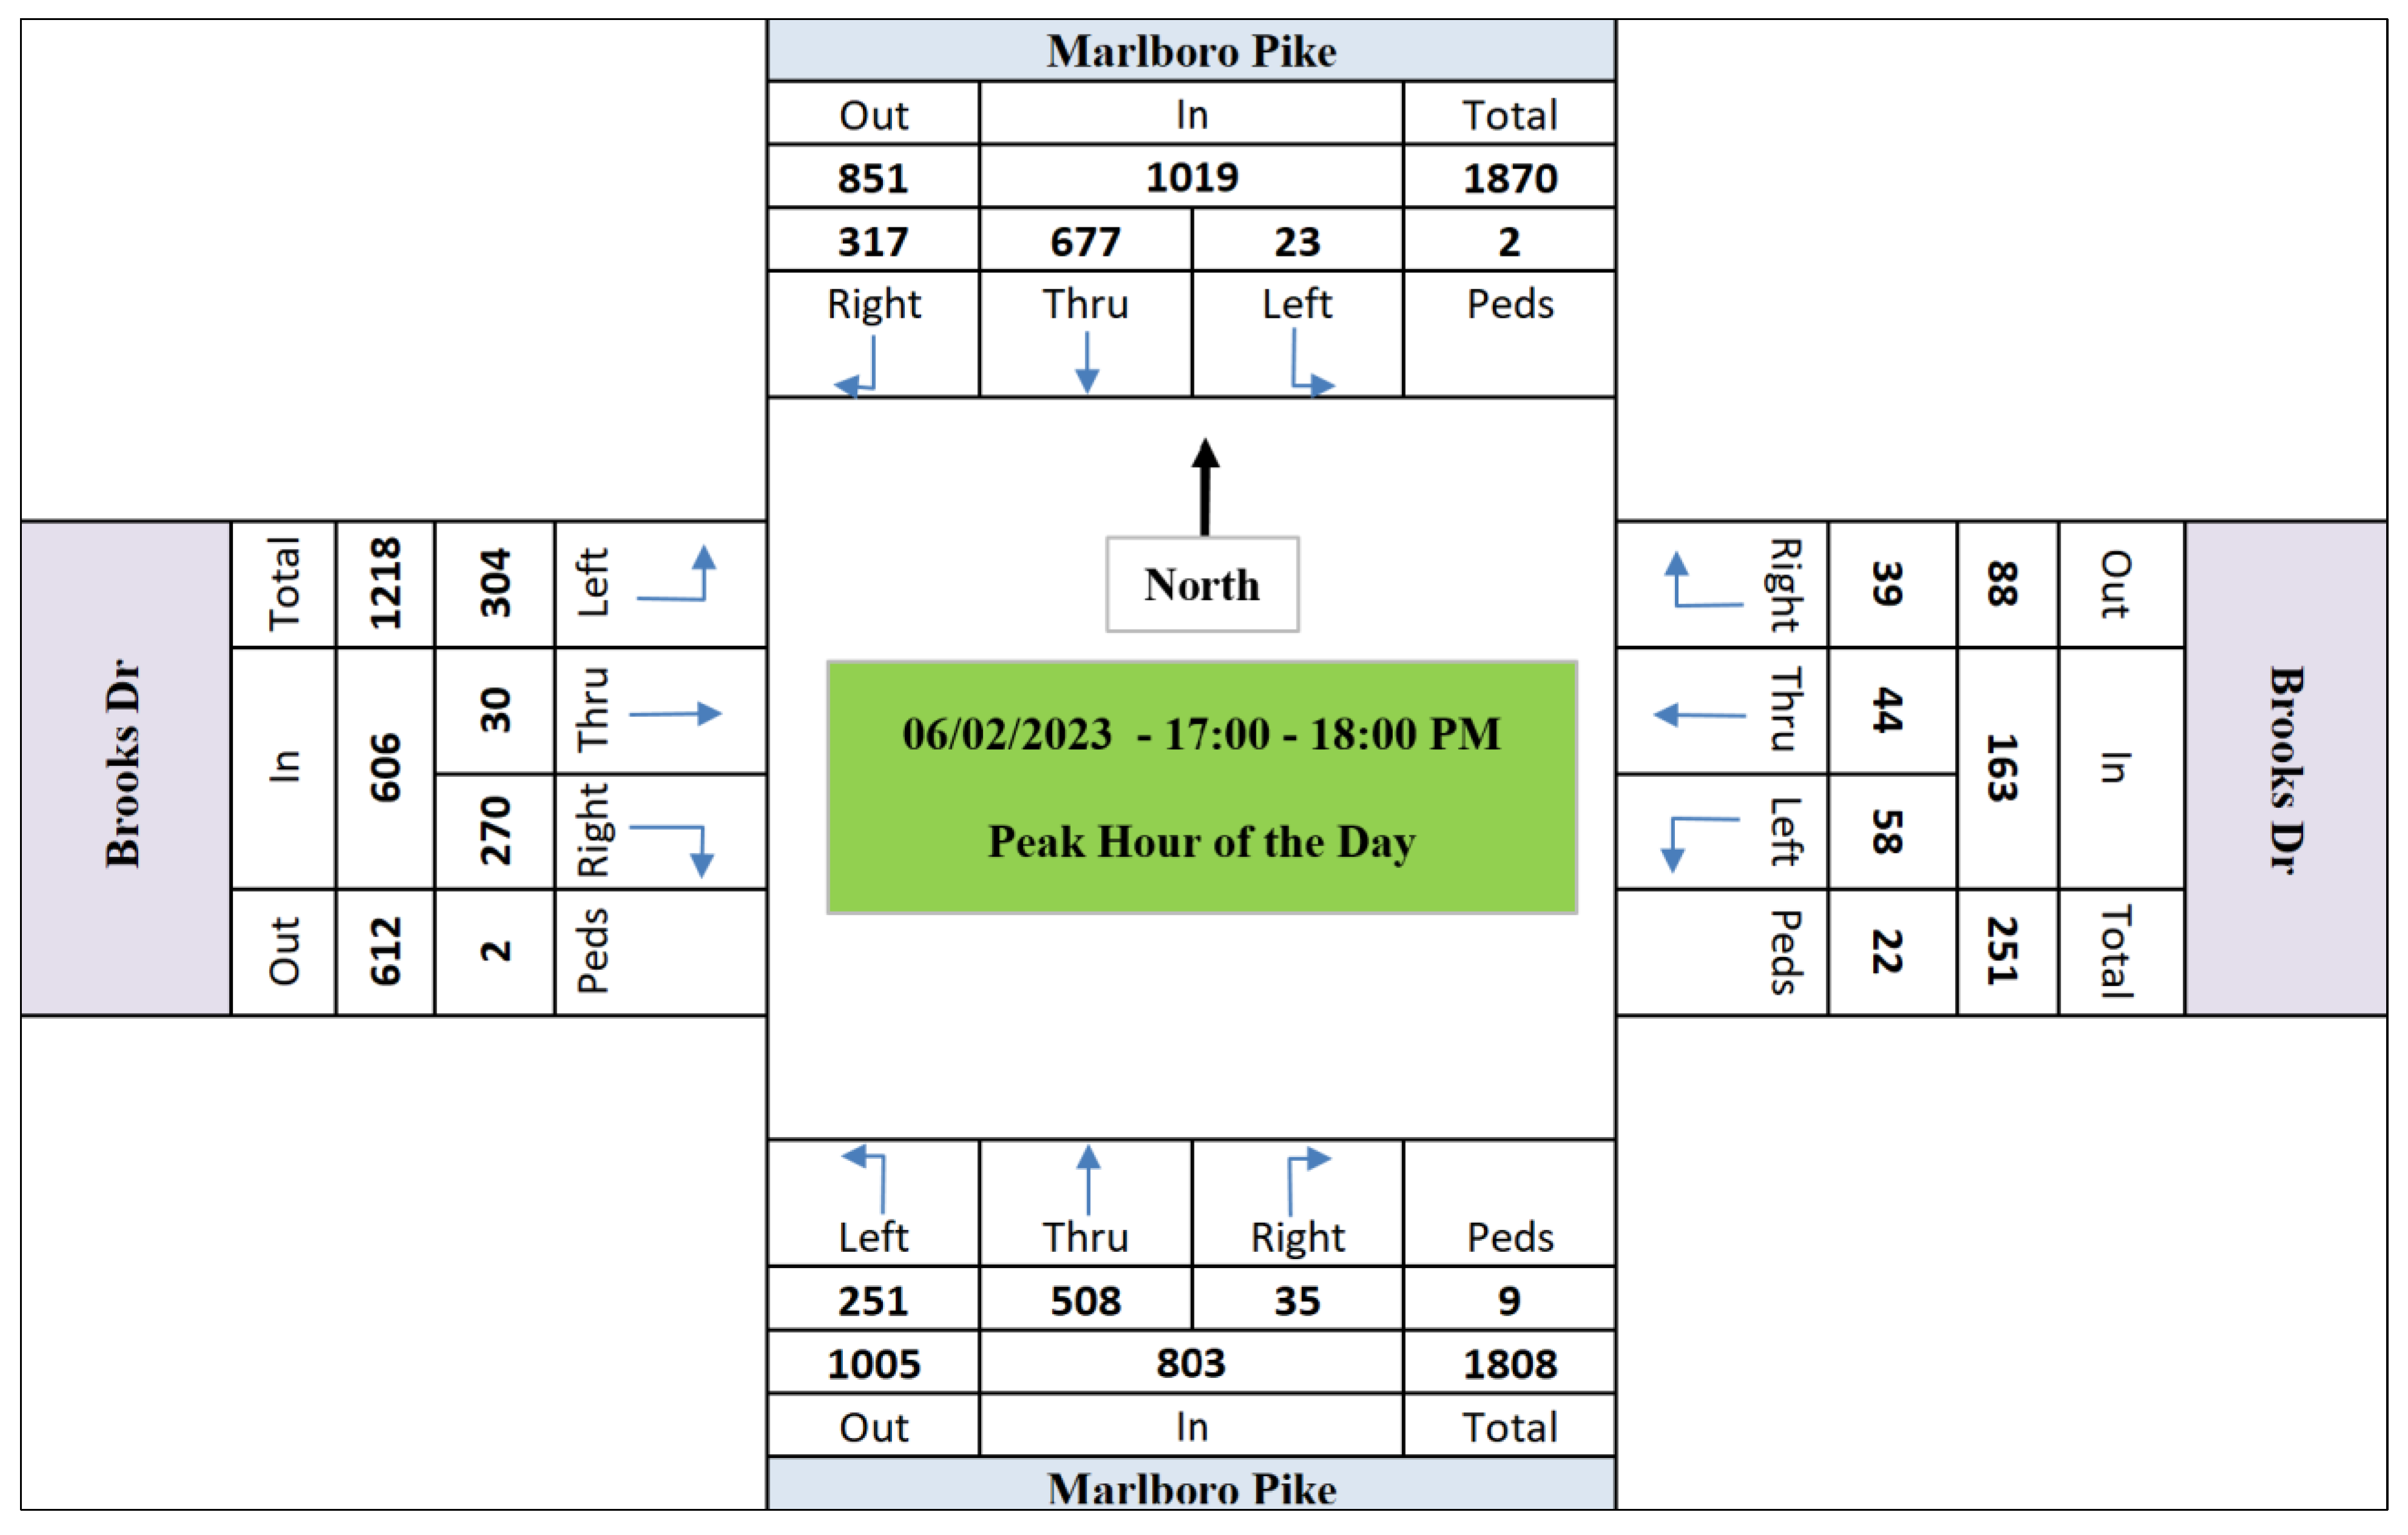
Figure 5.
Peak Hour of June 9th (Vehicle Volumes - 16:45 - 17:45 PM).
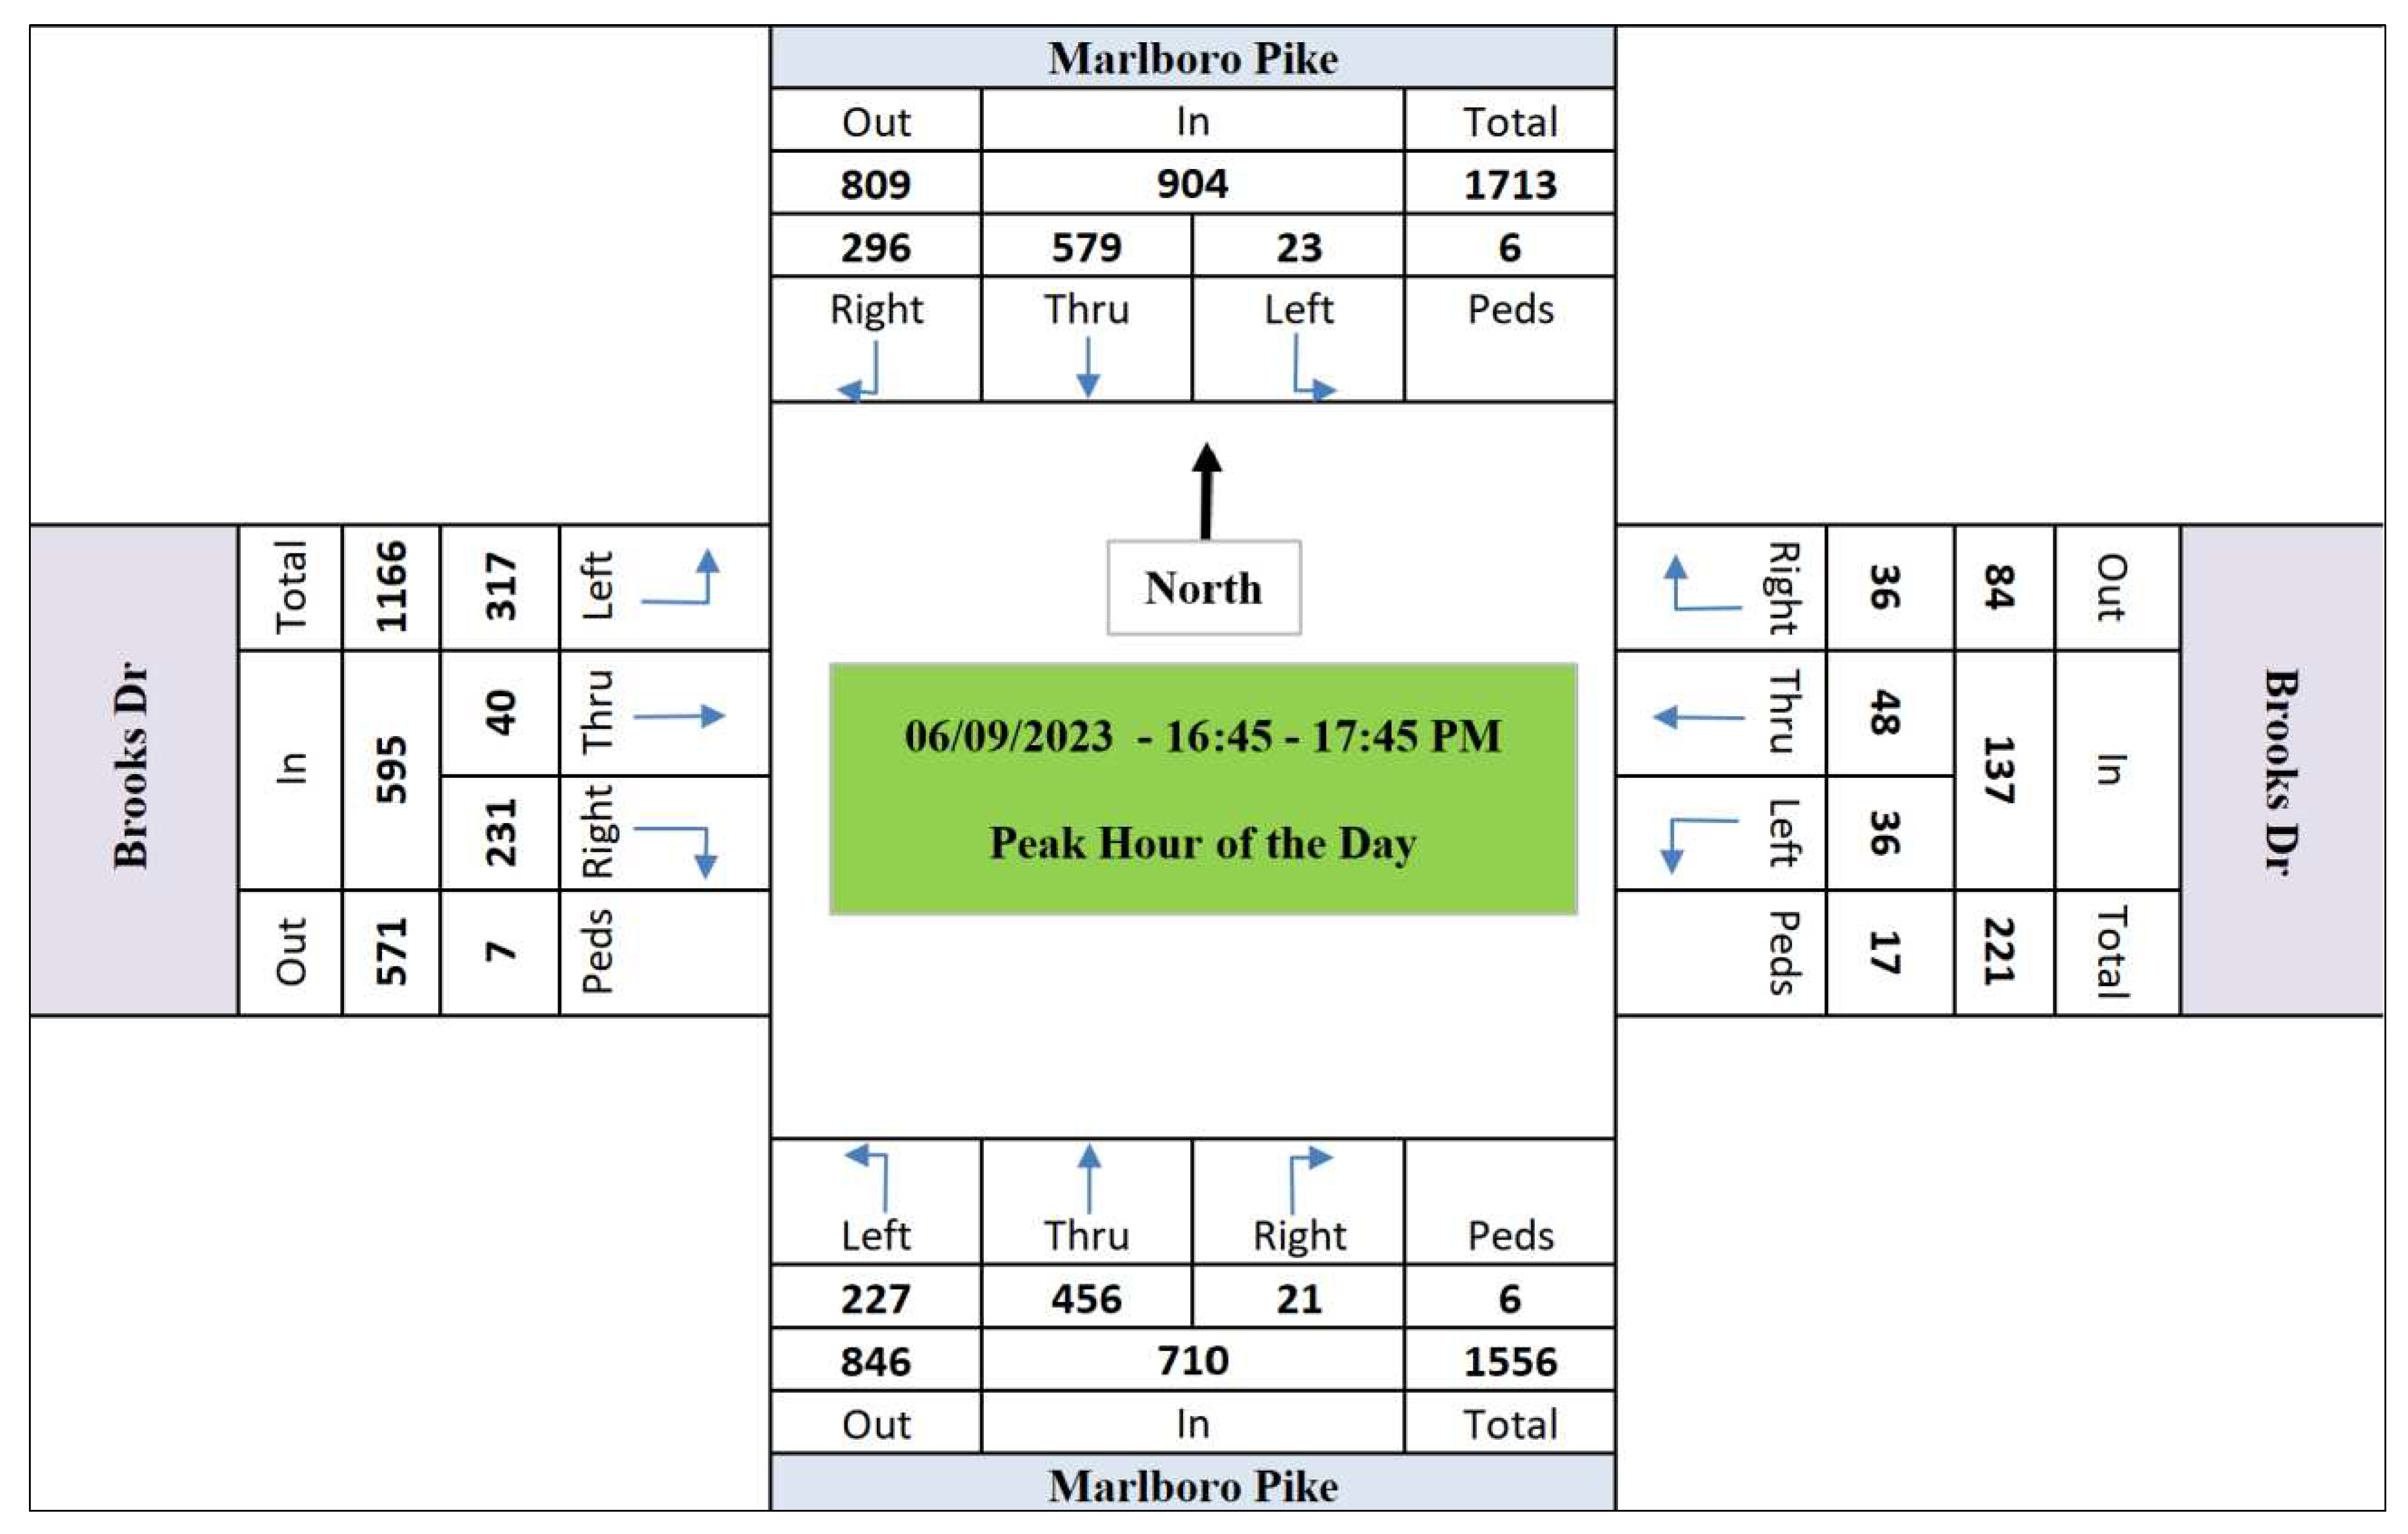
Figure 6.
Speed Changes In Different Intersection’s Approaches – June 2023.
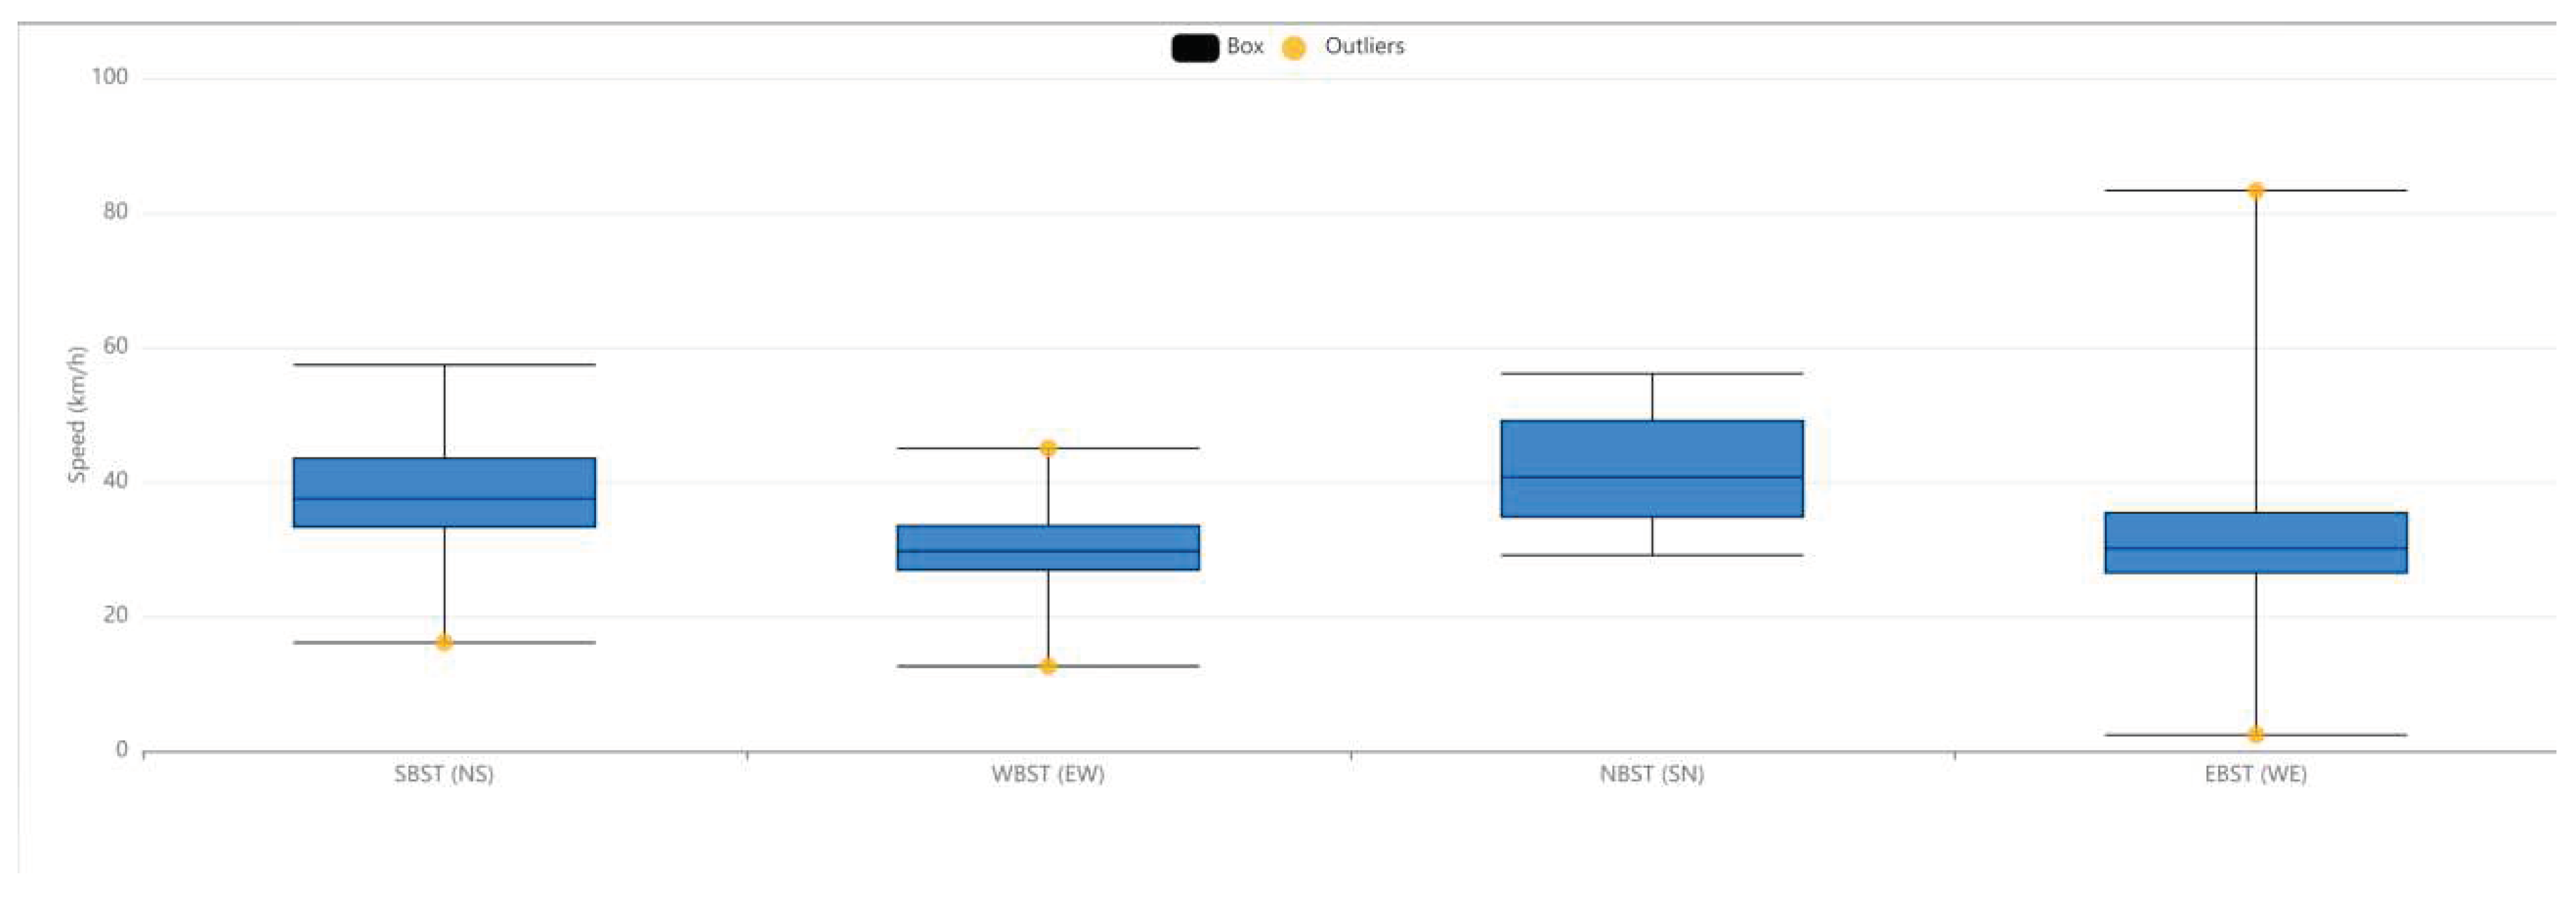
Figure 7.
Simulated Network in AIMSUN.
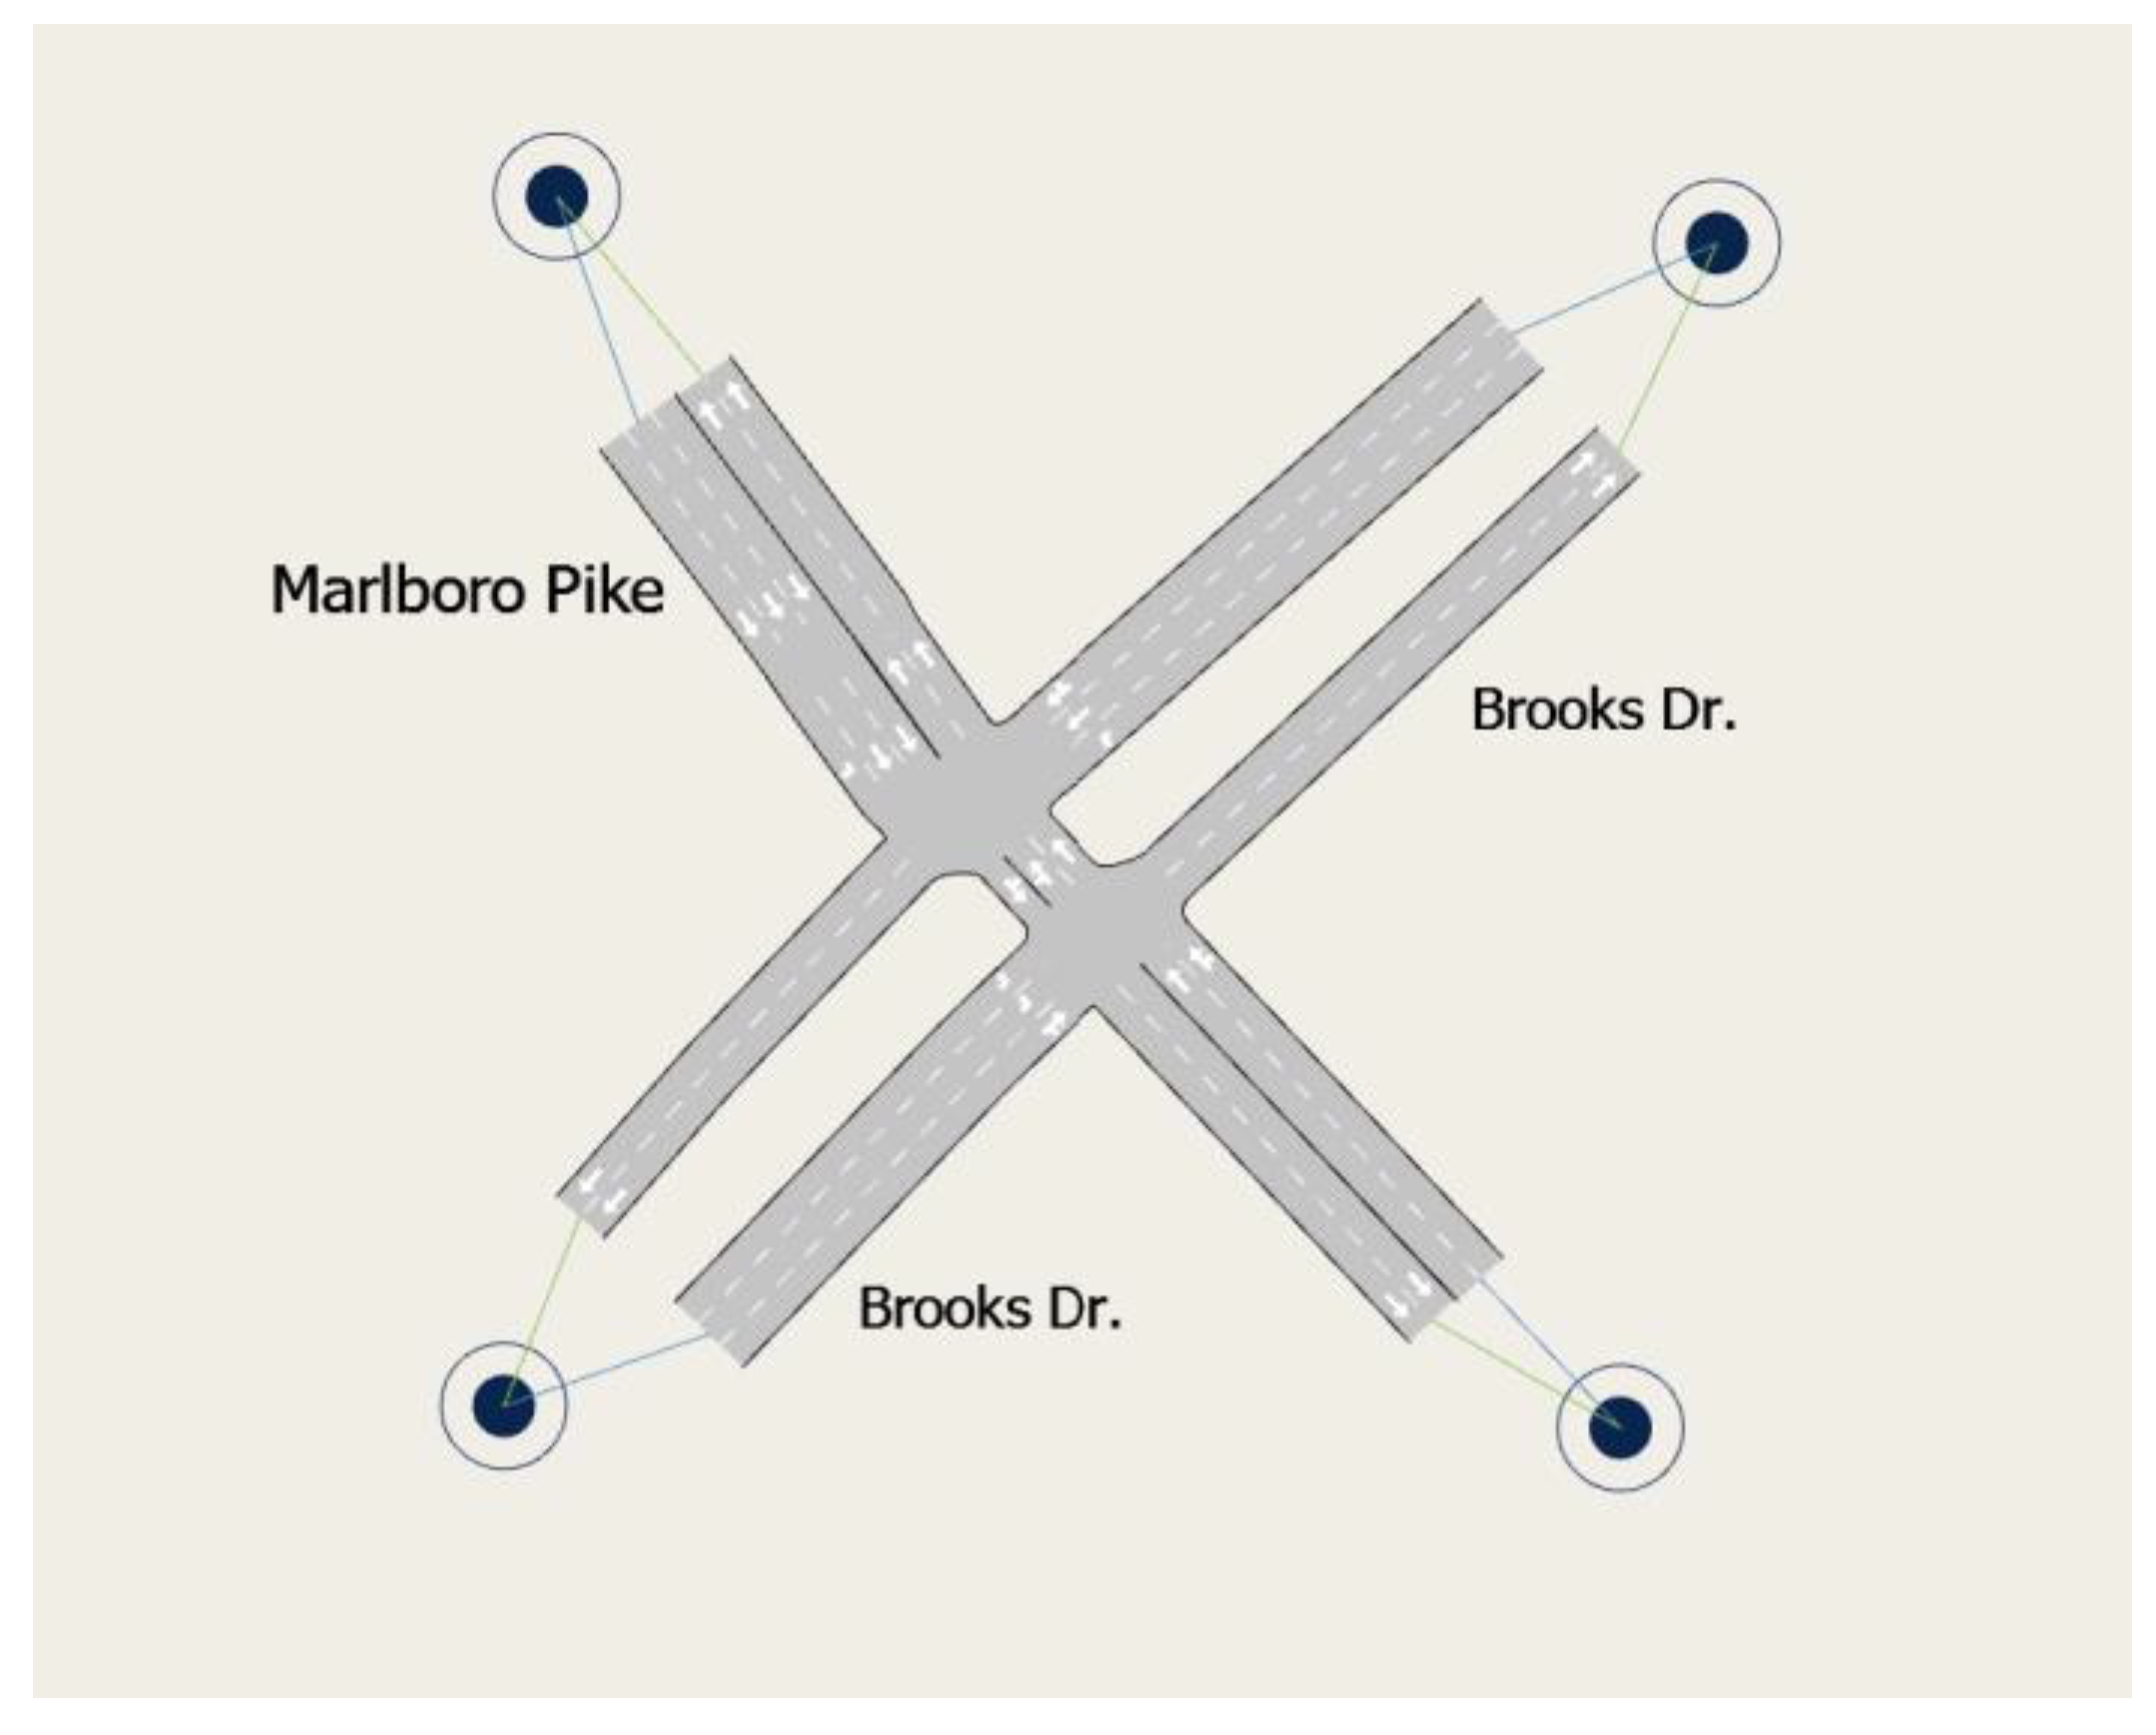
Figure 8.
The delay times calculated by LiDAR Sensors and AIMSUN.
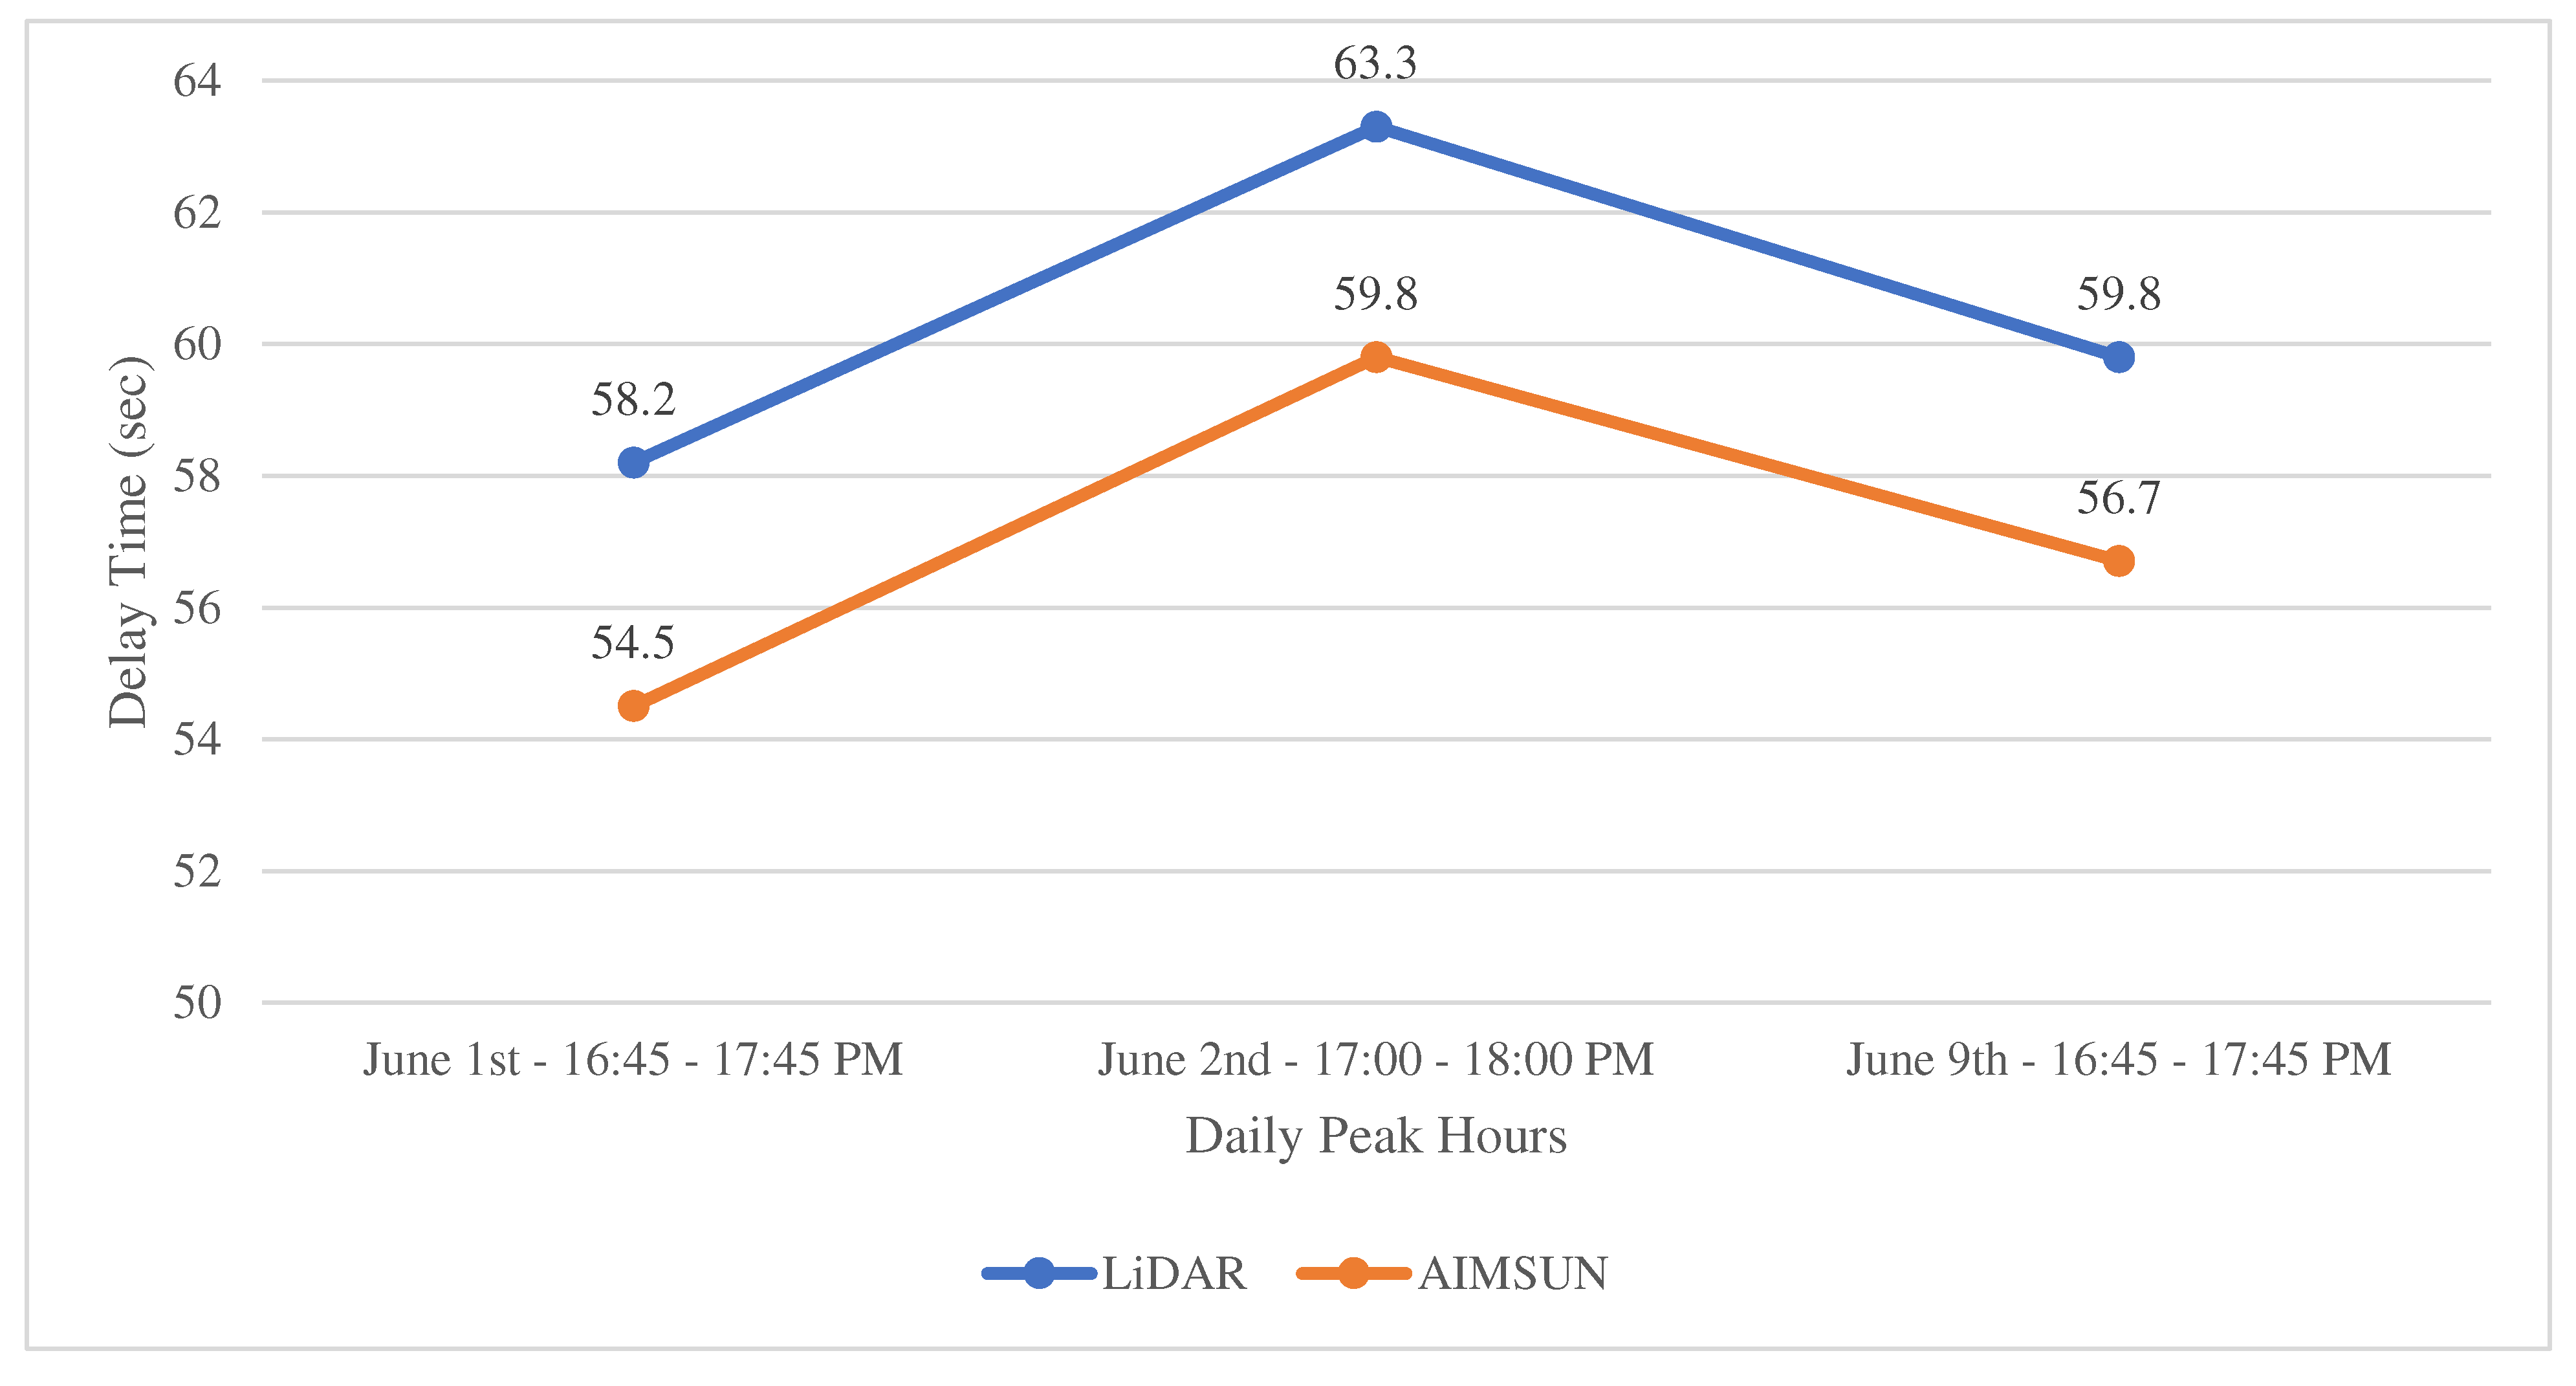
Figure 9.
The Differences (%) of AIMSUN Delay Times Compared to LiDAR Delay Times.
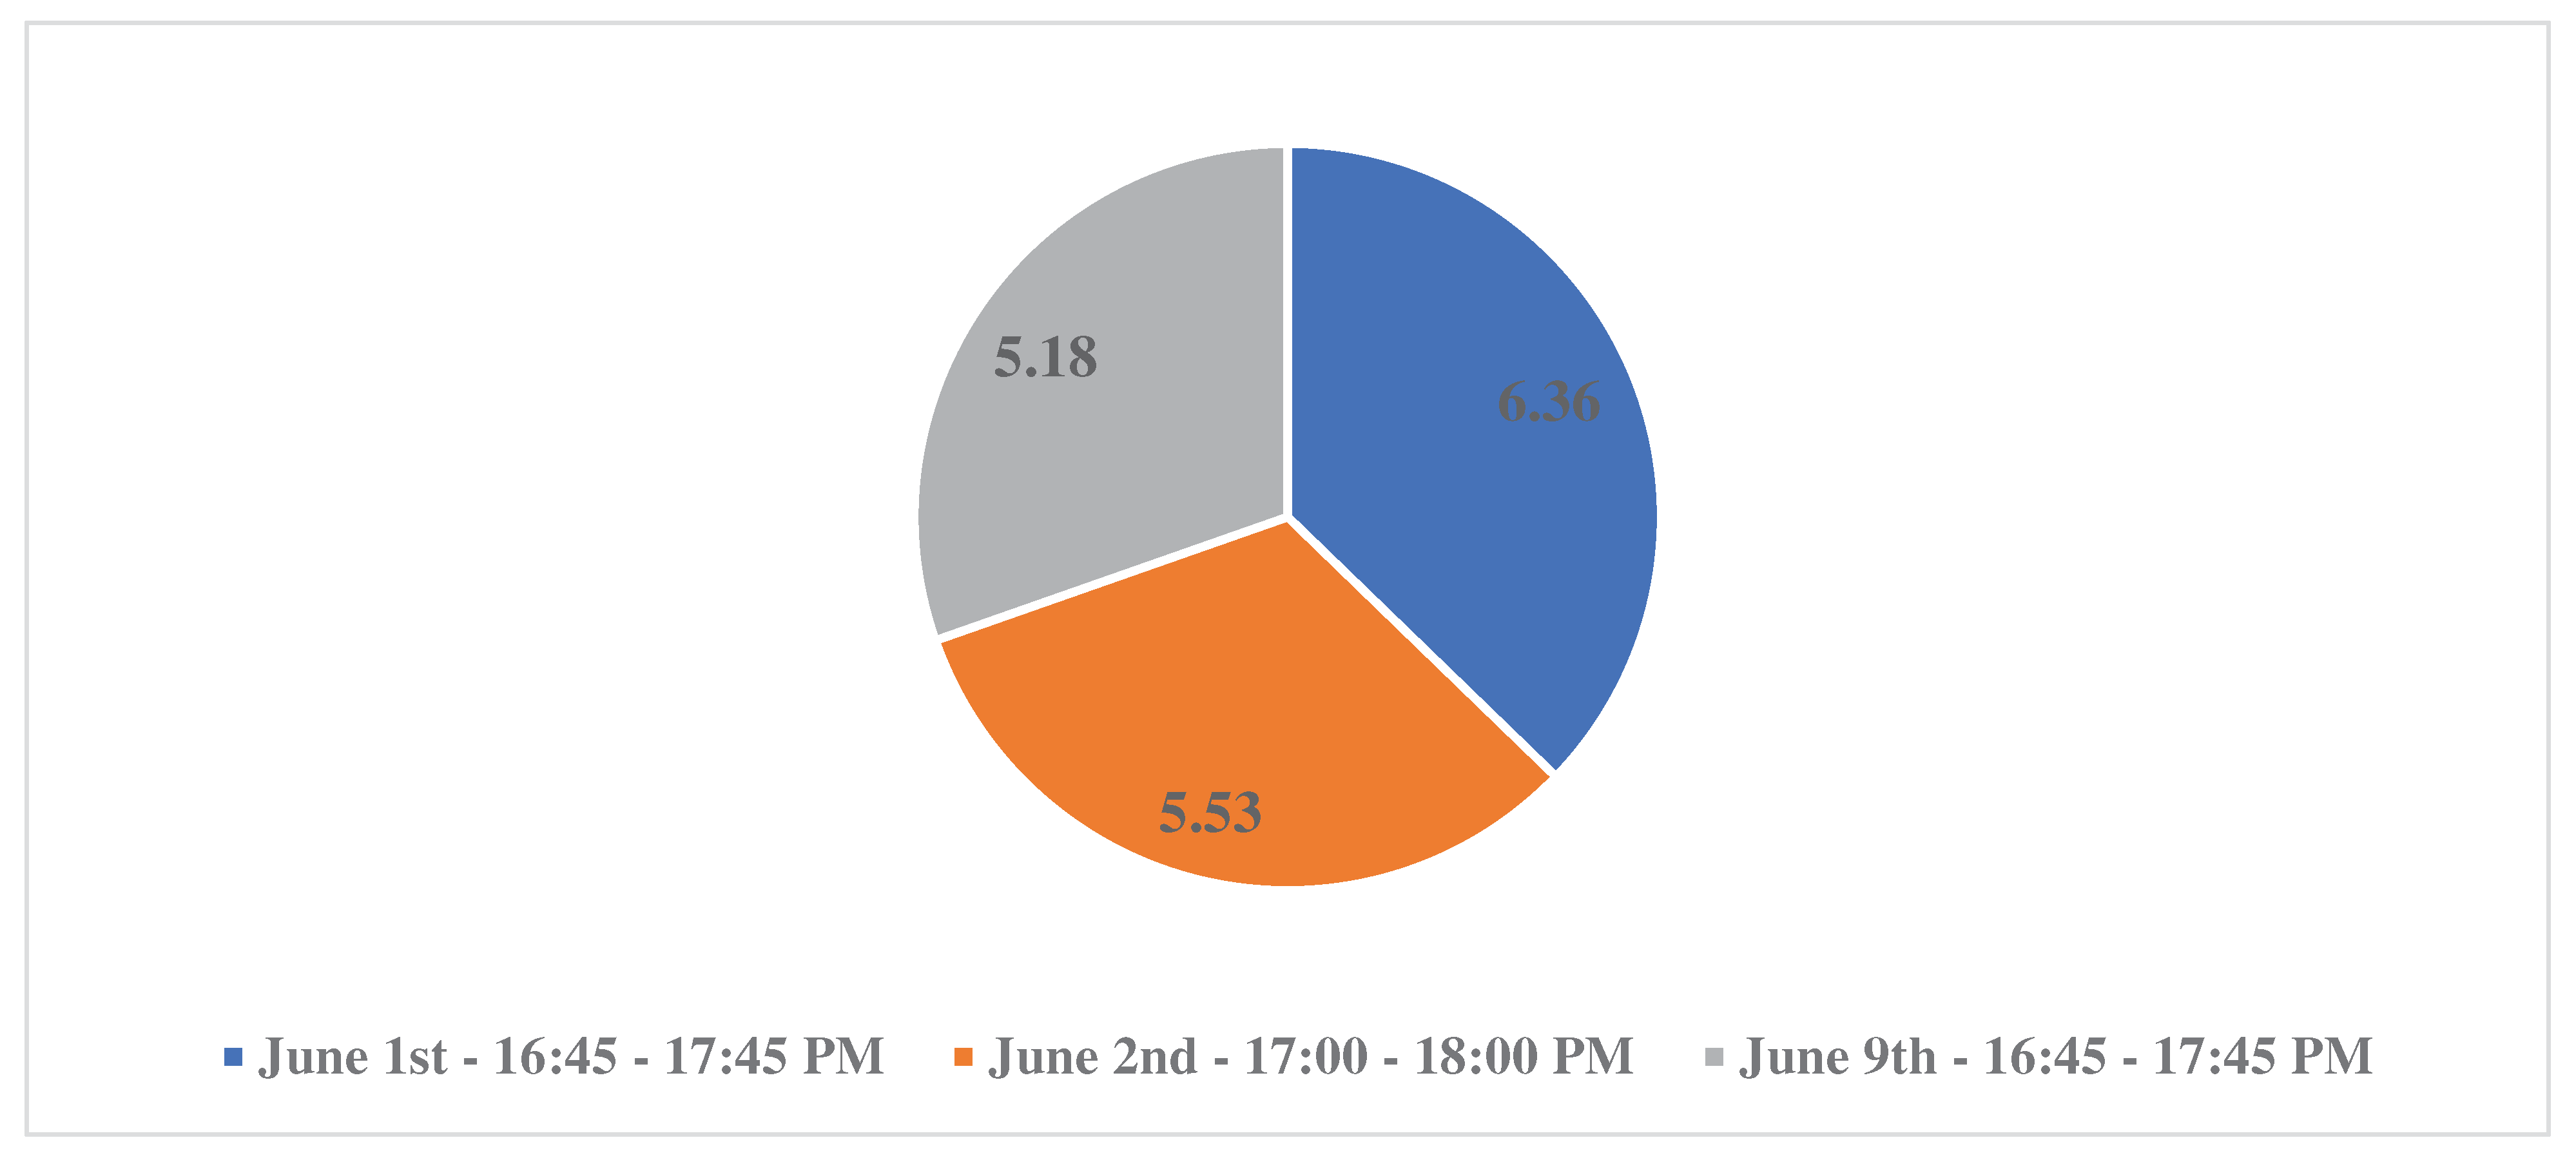

Table 1.
Hourly Delay Time collected by two LIDAR sensors at Phase #6 – June 1st, 2nd, and 9th.
| 00:00 - 01:00 AM | 35.9 | 37.9 | 37.6 |
| 01:00 - 02:00 AM | 44.9 | 39.9 | 41.4 |
| 02:00 - 03:00 AM | 51.6 | 47.4 | 45.9 |
| 03:00 - 04:00 AM | 56.4 | 58.9 | 58.3 |
| 04:00 - 05:00 AM | 60.0 | 59.1 | 56.8 |
| 05:00 - 06:00 AM | 58.0 | 57.4 | 55.0 |
| 06:00 - 07:00 AM | 62.2 | 60.7 | 60.1 |
| 07:00 - 08:00 AM | 63.9 | 64.6 | 63.0 |
| 08:00 - 09:00 AM | 53.9 | 64.4 | 60.2 |
| 09:00 - 10:00 AM | 64.6 | 63.1 | 61.6 |
| 10:00 - 11:00 AM | 59.7 | 63.8 | 65.5 |
| 11:00 - 12:00 AM | 65.2 | 63.3 | 65.9 |
| 12:00 - 13:00 PM | 65.0 | 61.5 | 66.3 |
| 13:00 - 14:00 PM | 60.6 | 69.0 | 65.5 |
| 14:00 - 15:00 PM | 62.8 | 68.1 | 65.9 |
| 15:00 - 16:00 PM | 61.1 | 63.1 | 68.9 |
| 16:00 - 17:00 PM | 57.5 | 60.8 | 60.5 |
| 16:45 – 17:45 PM | 58.2 | 61.2 | 59.8 |
| 17:00 - 18:00 PM | 60.3 | 63.3 | 63.0 |
| 18:00 - 19:00 PM | 59.0 | 58.9 | 60.0 |
| 19:00 - 20:00 PM | 55.9 | 52.8 | 56.0 |
| 20:00 - 21:00 PM | 40.9 | 47.6 | 51.3 |
| 21:00 - 22:00 PM | 36.9 | 47.1 | 57.4 |
| 22:00 - 23:00 PM | 27.5 | 39.8 | 35.9 |
| 23:00 - 24:00 PM | 29.4 | 31.3 | 27.6 |
Disclaimer/Publisher’s Note: The statements, opinions and data contained in all publications are solely those of the individual author(s) and contributor(s) and not of MDPI and/or the editor(s). MDPI and/or the editor(s) disclaim responsibility for any injury to people or property resulting from any ideas, methods, instructions or products referred to in the content. |
© 2023 by the authors. Licensee MDPI, Basel, Switzerland. This article is an open access article distributed under the terms and conditions of the Creative Commons Attribution (CC BY) license (http://creativecommons.org/licenses/by/4.0/).
Copyright: This open access article is published under a Creative Commons CC BY 4.0 license, which permit the free download, distribution, and reuse, provided that the author and preprint are cited in any reuse.


