
Submitted:
25 November 2025
Posted:
26 November 2025
You are already at the latest version
Abstract
Controlling seismic wave propagation to protect critical infrastructure through metamaterials has emerged as a frontier research topic. The narrow bandgap and heavy weight of a resonant seismic metamaterial(SM) limit its application for securing buildings. In this research, we first develop a two-dimensional(2D) seismic metamaterial with gammadion-shaped chiral inclusions achieving a high relative bandgap width of 77.34%. And its effective mass density is investigated to clarify the generation mechanism of bandgap due to negative mass density between 12.53 - 28.33 Hz. Then, the gammadion-shaped pillars are introduced on a half-space to design a three-dimensional(3D) chiral SM to attenuate Rayleigh waves within a wider low-frequency range. Further, time-frequency analyses for real seismic waves and scaled experimental tests confirm the practical feasibility of the 3D SM. Compared with common resonant SMs, our chiral configurations offer a wider attenuation zone and lighter weight.
Keywords:
chiral structure
; seismic metamaterial
; bandgap
; negative effective mass density
; earthquake prevention
1. Introduction
As a natural disaster, earthquakes represent significant threats to human infrastructure, and millions of earthquakes occur annually worldwide. Therefore, reinforcing the building through the implementation of a supplementary passive energy dissipation system holds significant importance. However, conventional damping methods often fail to meet the practical aseismic demands due to the inaccuracies of structural design and the complexity of its nonlinear cracking mechanism[1,2]. In addition, it is not applicable to existing buildings or ancient buildings. Thus, people prefer to seek a way to control the seismic waves before they reach the buildings.
Metamaterials[3,4,5], as artificially engineered composites with wave manipulation capabilities, have evolved from electromagnetic field over two decades ago[6] to elastic and acoustic fields rapidly[7,8,9]. The bandgap is one of their important properties, which means waves cannot propagate through the metamaterials in a specific frequency range[10]. Numerous attempts have been undertaken to create metamaterials aimed at obtaining targeted bandgap properties[11,12,13]. Younes et al.[14,15] conducted theoretical studies on acoustic wave transmission through a two-dimensional (2D) configuration of cylindrical pillars located on a half-space substrate surface, while experimentally validating two distinct bandgap categories: locally resonant and Bragg-type bandgaps. It is well known that the locally resonant metamaterial is more suitable for the seismic waves as it can offer a low-frequency bandgap, which means it is able to manipulate longer wavelengths through compact structural configurations. Therefore, locally resonant metamaterials open a new way for earthquake prevention, which can attenuate seismic waves in the bandgap before they reach our target buildings. Metamaterials applied in the seismic wave manipulation is described as seismic metamaterials(SMs).
In the last decade, SMs based on resonant structures have been designed and tested to produce low-frequency bandgaps. Palermo et al.[16] introduced the SM, developed through embedding sub-wavelength-scale resonant structures beneath the ground surface. Du et al.[17] proposed a 2D SM composed of periodically arranged steel pillars filled with concrete and embedded within a soil medium, achieving a protective barrier against guided Lamb waves and surface waves. Li et al.[18] and Zeng et al.[19] proposed a SM based on inertial amplification to generate low-frequency bandgaps. Zhao et al.[20] proposed a multi-point mass resonance metamaterial for low-frequency surface waves attenuation. However, these works mainly focus on realizing low-frequency bandgaps and have the problem of narrow bandwidth due to the inherent defect of resonant structures. To solve this problem, Zeng et al.[21] and Du et al.[22] continuously optimized the shapes of the resonant structures of SMs. More recently, Chen et al.[23] proposed a gradient-index SM achieving an omnidirectional, low-frequency and ultra-broadband wave attenuation. Ahmed et al.[24] proposed a lightweight design using auxetic geometry, which further lowers the bandgap frequencies of SM and enhances its practical feasibility .
Chirality, or handedness, has played an important role in optics, biology and medicine for decades. Recently, chirality has started to play a role in the field of mechanics. Kuang et al.[25] and Dong et al.[26] comprehensively discussed the progress and prospects of chiral materials. We noticed that chiral structures, which are characterized by unique mechanical properties including high shear rigidity and negative mass density, were regarded as a superior choice for engineering applications[27]. Chiral topology metamaterials were proposed for energy absorption[28]. Auxetic metamaterials based on chiral structures with high auxeticity and stiffness were usually used for the application of vibration isolation because of its special directional propagation mechanism[29,30].
Elastic chiral metamaterial is also proved to have a significantly effect on its dispersion curves, attaining a wide bandgap at low frequencies[31,32]. Zhu et al.[33] explored an elastic metamaterial beam incorporating a chiral lattice architecture, demonstrating the capability to enable broadband vibration suppression while maintaining its structural load-bearing performance. Tan et al.[34] developed an improved three-ligament chiral structure with flexure hinges for a better attenuation zone. Li et al.[35] presented a hybrid acoustic metamaterial consisted of chiral and anti-chiral ligaments, which was verified to have good vibration attenuation performance. Zhang et al.[36] investigated the wave behavior of the octa-chiral lattices with local resonators. Inspired by recent presentations of chiral metamaterials with broad bandgap property, we try to combine local resonance mechanisms with chiral SMs to achieve better seismic wave attenuation while maintaining engineering feasibility.
In this paper, we design two types of chiral SMs, including an embedded SM and a pillar-type SM, for two-dimensional and three-dimensional situations, respectively. The wave attenuation performance is systematically analyzed through finite element simulations in harmonic regimes, complemented by time-frequency analysis of historical seismic records to establish real-world spectral characteristics. Band structure calculations and transmission coefficient analyses are conducted to respectively characterize bandgap properties and quantify attenuation magnitude. To validate practical applicability, scaled prototypes fabricated through 3D printing undergo experimental testing, creating a cross-verification framework between numerical simulations and experimental measurements.
2. Model and Method
The metamaterial is constructed by periodically embedding gammadion-shaped chiral structures into the substrate on a two-dimensional (2D) square lattice (lattice constant is a). Geophysical survey data shows that the wavelengths of natural seismic waves are in the order of 100m, thus we consider the lattice constant a to be 5 meters, which is about λ/20 of the seismic waves. Figure 1a shows the schematic diagram of the gammadion-shaped chiral structure unit, and its corresponding geometric parameters are labeled on it.
Considering the feasibility of practical applications, soil is designated as the substrate medium and conventional construction material, such as steel, is selected for the material of the structure. It is postulated that both materials are linear elastic, isotropic and homogeneous. The parameters of the materials are given in Table 1 and geometric parameters are listed in Table 2.
The dispersion behavior of elastic waves in periodic lattices is characterized by the dispersion relation ω(k), linking angular frequency ω to wave vector k. This relation is obtained by solving the frequency-domain elastic wave equation under time-harmonic excitation.
Suppose that the seismic waves propagate along the x-y plane. In a time-harmonic field, displacement can be written as:
where u denotes the displacement vector, r means the position vector, and ω signifies the angular frequency. The elastic wave propagation in inhomogeneous materials can be expressed by:
where C represents the fourth-order elasticity tensor and ρ signifies the mass density of the material.
According to the Bloch’s theorem and Floquet periodic boundary conditions, the displacement in the unit cell can be written as
where R is the lattice translation vector and k is the wave vector.
Substituting equations (2) and (3) into (1) via the Galerkin method transforms the partial differential equations into a discrete generalized eigenvalue problem. The unit cell’s discretized equation of motion can be expressed in the following matrix form:
where M and K are the global mass and stiffness matrices, respectively.
In order to obtain the band structures and the transmission coefficient of the proposed structures, the numerical analysis technique in this work is the finite element method. The representative computed unit cell can be meshed based on structure variations and partitioned into finite elements interconnected via nodes. Here, by using mesh, Eq.(4) is discretized and subsequently solved to determine the unknowns ω and u with wave vector k sweeping the edges of the first irreducible Brillouin zone. The first irreducible Brillouin zone for the periodic composite with the square lattice is shown in Figure 1b.
3. Discussion
3.1. Band Structures of the 2D Chiral SM
For the embedded SM with a gammadion-shaped chiral steel inclusion, its band structures are calculated to predict its bandgap properties. We use COMSOL Multiphysics to perform finite element simulation calculations. Select the solid module and apply periodic boundary conditions in the x-direction and y-direction of the structure. Use free triangular mesh for partitioning and choose the characteristic frequency for study. The structure is shown in Figure 1a, and the band structures are shown in Figure 2. It is easily found that one complete bandgap with a width of 15.80Hz is obtained, which is produced between the third and forth bands. To evaluate the property of the bandgap more accurately, we calculate the relative bandwidth of bandgap (RBW): the ratio of the total width(Δω) to the centre frequency of bandgap(ω0). To highlight the advantage of chiral inclusion, we also compute the band structures of the SM with an achiral inclusion at a same duty ratio. As we can see from Figure 2, the RBW of the chiral SM is up to 77.34%(Figure 2a), while the RBW of the achiral SM is only 26.96%(see Figure 2b). Both structures generate bandgaps via local resonance, and under the same duty ratio, bandgap differences are attributed to chirality. Clearly, gammadion-shaped chiral inclusions significantly widen the bandgap compared to achiral ones.
3.2. Effective Mass Density of the Chiral SM
In this section, based on the effective medium theory[17,21,37], dynamic effective mass density of our designed chiral SM above are numerically determined under the low-frequency assumption, where wavelength is much larger than the size of the resonant unit. Four boundaries of the unit cell (depicted in Figure 1a) are considered to experience a global displacement. Thus, the effective mass of the unit cell can be numerically calculated through the averaged reaction force in the boundaries, which can be written as
where the meff is the effective mass and F is the average reaction force in the four boundaries. The u denotes the displacement vector, and ω signifies the angular frequency. The effective mass density is defined as the volume-averaged mass, formulated as
where ρeff is the effective mass density, vcell is the volume of the unit cell, and h is the thickness of the structure.
As shown in Figure 3, when the frequency of the incidence wave gradually increases, the resonant response is excited by the chiral inclusion at 12.98Hz. It can be easily found that the negative effective mass density is obtained in the range from 12.98Hz to 28.33Hz, which agrees with the bandgap in Figure 2a. From this point, it can be inferred that the generation mechanism of bandgap is negative effective mass density based on dipole resonance of chiral structure.
3.3. Effects of Geometric Parameters
Based on the preceding analysis, it is evident that the generation of wide bandgap in the system originates from the local resonance of the chiral structure. Regarding the emergence of the bandgap, the chiral structure’s geometric parameters serve as a fundamental role. In the following section, we will analyze the effects of geometric parameters on the bandgap characteristics. When the value of structure arms width b varies, while other parameters are maintained consistent with prior specifications, the effect on the bandgap width is depicted in Figure 4a. It is observed that both the lower and upper boundaries of the bandgap shift to higher frequencies as b increases. The upper boundary exhibits a more pronounced upward trend compared to the lower boundary, with the bandgap width coming to the largest when b is 0.6m. In Figure 4b, as the value of structural arm length c increases while other parameters are left unchanged, both the upper and lower bandgap boundaries exhibit a progressive upward shift, and then the upper boundary tends to be stable. The widest bandgap arises when c is 1.35m. The progression pattern of these bandgaps indicates that the geometric parameters of the chiral structure exert a substantial influence on the location and width of band gaps.
In order to clarify the effect of parameter changes on the bandgap, we select several sets of parameters to observe the vibration modes of the corresponding structures, as shown in Figure 5. It can be seen that, at low frequencies, the structures can be regarded as periodic scatterers (steel) connected by narrow connectors (soil). At the lower boundary state of the bandgap (the modes of A1-F1 marked in Figure 4), the displacement is mainly concentrated in the scatterer, and the arrows on the surface clearly show the rotation of the scatterer. At this time, the bandgap opens mainly due to the rotation of the chiral scatterer. Since the scatterer has a relatively large mass, the local resonance bandgap is at a low frequency. At the upper boundary state (the modes of A2-F2 marked in Figure 4), the chiral structure guides and concentrates energy into the soil within its grooves. The colour, which represent the displacement amplitude, illustrates the locality of the displacement, while the arrows on the surface indicate the direction of energy flow. Due to the relatively low soil mass, the localised resonance bandgap is at a higher frequency. When the scatterer's arm length is thin (i.e., small b value, such as the A2 mode) or short (i.e., small c value, such as the D2 mode), the guiding effect of the scatterer on displacement is relatively weak, and energy may flow around the scatterer. When the scattering body's arm length is thicker (i.e., larger b value, such as the C2 mode) or longer (i.e., larger c value, such as the F2 mode), the guiding effect on displacement is more pronounced, with displacement being largely confined within the groove formed by the scattering body's chiral arms. These modes indicate that the bandgap is generated by local resonance, and the chirality plays a very important role in the formation of the bandgap.
3.4. Frequency Domain Analysis
Next, we further verify the shielding results of the chiral SM by calculating the transmission coefficient of seismic wave propagation in 2D finite system. Additionally, the incident and transmitted wave displacement field distributions are analyzed to demonstrate the shielding capability of the proposed SM. The model used in frequency domain calculations is a finite system composed of 50 unit cells sandwiched by two homogeneous parts of the soil, as shown in Figure 6a. The cells are arranged in a 2D array with 10 rows in the x-direction and 5 columns in the y-direction. The unit cell parameters are maintained consistent with mentioned above, as shown in Table 1 and Table 2. Perfectly matched layers(PMLs) are implemented at both ends along the x-direction to minimize reflections originating from the model domain boundaries. Periodic boundary conditions are imposed on the finite periodic composite in the y-direction. A specified displacement is applied as a line source on the left side of the model to excite incident waves, which is marked as a blue line in Figure 6a. The wave is captured at the red line after passing through the structures.
For a more quantitative analysis, a frequency domain analysis spanning 0 Hz to 32 Hz is conducted, with the transmission coefficient versus frequency along Γ-X direction being computed. The transmission spectrum (TS) is processed as
where u1 is the displacement with structures and u0 is the displacement without structures. The TS along ΓX direction is calculated and the result is shown in Figure 6b, in which the attenuation region agrees well with the bandgap in Figure 2a.
To demonstrate the shielding capability of the SM, the total displacement fields of incident waves both within and beyond the bandgap are extracted, respectively, as shown in Figure 6c. At 5Hz beyond the bandgap, the incident wave is partially reflected and partially passes through the SM. In contrast, the incident wave can barely penetrate the SM when the frequency is 14Hz within the bandgap. This result demonstrates that the vibration is attenuated efficiently for seismic waves within the bandgap.
3.5. Attenuation Characteristics for the 3D Chiral SM
Actually, seismic waves originate from the interplay between bulk and surface waves resulting from complex underground geological configurations, among which Rayleigh waves are the most dangerous surface waves for buildings. Thus, we also develop a three-dimensional(3D) chiral SM for Rayleigh waves. Here, we mainly focus on whether attenuation effect still exist for surface waves in a half space. In order to figure out the transmission coefficient, 10 unit cells are arranged on a substrate with a thickness of 20a. The geometry model is presented in Figure 7a, in which the gray and blue areas represent soil and steel, respectively. A periodic boundary condition is implied to achieve an infinite array of units in the y direction. Week reflective boundary conditions are applied on the boundaries of the substrate. A boundary load along z-direction is applied on the line source to model an incident surface wave. After passing through the structures, the wave is captured at the integral area. The transmission coefficient is calculated in the same way as in the 2D SM. The attenuation regions is presented in Figure 7b. A low-frequency broadband attenuation zone from 2.3-18Hz can be seen provided by the structure. Additionally, the total displacement fields for the incident waves within and beyond the bandgaps are also withdrawn, as shown in Figure 7c. From the displacement field, it can be seen that the incident wave is a Rayleigh wave, and the structure can indeed prevent the propagation of the wave. For instance, at 1.5Hz beyond the bandgaps, the incident wave is partially localized on the structures and partially passes through the structures. However, at 5.5Hz in the bandgap, the incident surface wave is significantly attenuated and almost unable to propagate the 4th unit cell. Therefore, previously designed structures still have a very significant attenuation in a half-space for surface waves.
3.6. Robustness Analysis
The infuence of the insertion depth into the surface for gammadion-shaped pillars is not considered in the model mentioned above. However, in actual engineering, the insertion depth of the structure is a factor that cannot be ignored. In order to prove the applicability of the designed structure, we conduct research on its robustness.
As shown in the Figure 8a, we modify the depth of the pillar insertion into the ground based on Figure 7a. To comprehensively simulate various scenarios, we test the multiple cases with half buried underground, fully buried, not buried, and buried at random depths. The transmission spectrum calculation results are shown in the Figure 8b. In the cases of partial insertion with different depths, the insertion depth has a negligible impact on the transmission spectrum, only when fully buried will it have a slight effect on the result. Introducing randomness even results in slightly better outcomes. However, overall, these slight differences do not affect the attenuation effect of the structure. The results demonstrate that the insertion depth only has a tiny impact on the effectiveness of the structures in attenuating waves, and the structures exhibit good robustness. For simplicity of calculation, the influence of insertion depth will no longer be considered in subsequent experiments.
3.7. Time Domain Analysis
To further validate the shielding effect of our proposed 3D SM for Rayleigh waves, a time-transient harmonic analysis is conducted. The computed model is the same as that in Figure 7a, where amplitude modulation(AM) wave source in the z-direction are applied as the boundary load and the attenuated displacements are collected in the integral region behind the structures. The wave source emits a 5 Hz amplitude-modulated wave with 19-cycle Hanning-shaped modulation, active for 30 seconds. To highlight the attenuation effects, the displacements without and with the SM structures are overlaid on the same graph for comparison, in which the black line is the displacement without SM and the red line is the displacement with SM, as shown in Figure 9. It can be seen that the SM has a very significant attenuation effect with a 76.45% attenuation at the peaks.
Different from the AM wave source, the real seismic excitation is characterized by randomness and a low-frequency dominance. In order to be more relevant to the real situation, we further choose a classical seismic wave signal (1952, Northern Calif-02) in our simulation experiments [38]. Figure 10a,b show the time-domain profile of the seismic signal and its corresponding frequency content spectrum, in which the main excitation is predominantly concentrated within the frequency range of 0.1 Hz to 15 Hz and concentrates in the first 30 seconds. The seismic signal is applied on the boundary load along the z-direction and the acceleration values for the cases with and without SM at the integral region in both time and frequency domains are calculated shown in Figure 11, in which the black curves represent cases without SM and the red ones depict those with SM. These results prove that the seismic waves are effectively suppressed after introducing the SM structures.
4. Experimental Results
In the previous sections, the effectiveness of the proposed structure for seismic wave attenuation has been fully demonstrated theoretically and via simulation. In this part, the validity and feasibility of the proposed SM is verified by experiments. A 1:100 scaled experimental platform is built, and the epoxy is selected as the material of SM instead of steel. The material parameters of epoxy are density of 1180 kg/m3, Young’s modulus of 4.35×10⁹ Pa and Poisson’s ratio of 0.368.[39,40] The sample of unit cell is custom-made through 3D printing technology as shown in Figure 12a.
The experimental substrate configuration is fabricated as a glass box (dimensions: 1.2m×0.5m×0.5m), filled with sand to basically simulate the half-space environment. Due to the surface waves' operating wavelength being substantially greater than the sand particle dimensions, the sand-SM interaction is deemed negligible. The glass box is high enough so that the body waves and the surface waves can be separated. Place pebbles along the surrounding boundaries of the box to minimize reflections of the walls. The entire experimental setups are shown in Figure 12b. However, due to the difficulty of completely eliminating the reflective influence of the walls, we change the arrangement of the structural units. As shown in Figure 12c, the samples are periodically arranged in a 4×5 manner, with 2 samples in the middle removed and replaced with an accelerometer(X&K Tech., XK101S) labelled as D in Figure 12b to pick up the signals. Another accelerometer is placed in a symmetrical position as a comparison group without structural function, labelled as E. The experimental setup is implemented as follows: Through a vibration exciter (SP, Inc., JZK-50) labelled as C positioned near the sand surface on one side of the glass box, body wave excitation is introduced. The excitation signal, generated by a signal generator (uT, uT8904FRS-DY) labelled as A, undergoes a frequency sweep from 30 Hz to 230 Hz and is subsequently amplified by a power amplifier (SP, Inc., YE5874A) labelled as B. Vertical surface acceleration components with and without SM configurations are captured at measurement points D and E as mentioned above, using two accelerometers which are connected to a signal acquisition unit (uT, uT8904FRS-DY). The acceleration data, denoted as Ad at point D and Ae at point E, are processed via analysis software (uT, uTekSs) labelled as F, enabling the calculation of the transmission spectrum (TS) defined by
Meanwhile, the corresponding numerical simulations are performed to match the experimental model, whose computed model is shown in Figure 12d, with the same dimensions as the experimental equipment. The transmission spectrum is shown in Figure 13, with numerical simulation results of this model also overlaid as a comparison. The first attenuation zone exists in the frequency range of 63-138Hz, which shows a significant attenuation, even better than the simulation results. The second attenuation zone in the range of 175-210Hz are in good agreement with the simulation results and the attenuation effect is also obvious.
The experimental data exhibit broad consistency with the simulation predictions, confirming the validity of the numerical model. But there is still a small amount of deviation, possibly due to the fact that the experimental setup is not able to completely eliminate reflected waves and the individual materials are not completely isotropic.
5. Conclusion
In summary, we have proposed gammadion-shaped chiral metamaterials for full-mode seismic waves for protecting target buildings against earthquake damages. It is found that our SM based on the gammadion-shaped chiral structures has larger RBW (77.31%) than the SM with common non-chiral structures under the condition of the same duty ratio. Multiphysics simulations combining band structure analysis, transmission characterization, and negative mass density identification systematically verify both their shielding efficacy and wave attenuation mechanisms for the SM under the bulk wave incidence. Importantly, a 3D SM for surface waves is exploited through a validation framework, incorporating real seismic signal reconstruction and 3D-printed scaled prototype testing, confirms the SM system's operational robustness across theoretical predictions and experimental measurements. This work demonstrates chiral SM’s promising potential applications in seismic shielding.
Acknowledgments
This work was supported by National Natural Science Foundation of China (Grant Nos: 41974059, 12174353 and 41830537 ).
References
- Shi, Z. and J. Huang, Feasibility of reducing three-dimensional wave energy by introducing periodic foundations. Soil Dynamics and Earthquake Engineering, 2013. 50: p. 204-212. [CrossRef]
- Symans, M.D., et al., Energy Dissipation Systems for Seismic Applications: Current Practice and Recent Developments. Journal of Structural Engineering, 2008. 134(1): p. 3-21. [CrossRef]
- Du, Q., et al., Multiband and polarization-independent left-handed metamaterial with cross fractal structure. Optics Communications, 2013. 301-302: p. 74-77. [CrossRef]
- Viktor, G.V., THE ELECTRODYNAMICS OF SUBSTANCES WITH SIMULTANEOUSLY NEGATIVE VALUES OF AND μ. Soviet Physics Uspekhi, 1968. 10(4): p. 509.
- Pendry, J.B., Negative Refraction Makes a Perfect Lens. Physical Review Letters, 2000. 85(18): p. 3966-3969. [CrossRef]
- Smith, D.R., et al., Composite Medium with Simultaneously Negative Permeability and Permittivity. Physical Review Letters, 2000. 84(18): p. 4184-4187. [CrossRef]
- Jiang, W.X., et al., Invisibility cloak without singularity. Applied Physics Letters, 2008. 93(19): p. 194102. [CrossRef]
- Liu, Z., et al., Locally Resonant Sonic Materials. Science, 2000. 289(5485): p. 1734-1736. [CrossRef]
- Wang, G., et al., Two-Dimensional Locally Resonant Phononic Crystals with Binary Structures. Physical Review Letters, 2004. 93(15): p. 154302. [CrossRef]
- Langley, R.S., N.S. Bardell, and H.M. Ruivo, THE RESPONSE OF TWO-DIMENSIONAL PERIODIC STRUCTURES TO HARMONIC POINT LOADING: A THEORETICAL AND EXPERIMENTAL STUDY OF A BEAM GRILLAGE. Journal of Sound and Vibration, 1997. 207(4): p. 521-535. [CrossRef]
- Bonnecaze, R.T., et al., Systematic design of phononic band–gap materials and structures by topology optimization. Philosophical Transactions of the Royal Society of London. Series A: Mathematical, Physical and Engineering Sciences, 2003. 361(1806): p. 1001-1019.
- Hussein, M.I., et al., Optimal synthesis of 2D phononic crystals for broadband frequency isolation. Waves in Random and Complex Media, 2007. 17(4): p. 491-510. [CrossRef]
- Phani, A.S., J. Woodhouse, and N.A. Fleck, Wave propagation in two-dimensional periodic lattices. The Journal of the Acoustical Society of America, 2006. 119(4): p. 1995-2005. [CrossRef]
- Achaoui, Y., et al., Experimental observation of locally-resonant and Bragg band gaps for surface guided waves in a phononic crystal of pillars. Physical Review B, 2011. 83(10): p. 104201. [CrossRef]
- Khelif, A., et al., Locally resonant surface acoustic wave band gaps in a two-dimensional phononic crystal of pillars on a surface. Physical Review B, 2010. 81(21): p. 214303. [CrossRef]
- Palermo, A., et al., Engineered metabarrier as shield from seismic surface waves. Scientific Reports, 2016. 6(1): p. 39356. [CrossRef]
- Du, Q., et al., Elastic metamaterial-based seismic shield for both Lamb and surface waves. AIP Advances, 2017. 7(7): p. 075015. [CrossRef]
- Li, L., et al., Seismic metamaterials based on coupling mechanism of inertial amplification and local resonance. Physica Scripta, 2023. 98(4): p. 045024.
- Zeng, Y., et al., Seismic metamaterials: Generating low-frequency bandgaps induced by inertial amplification. International Journal of Mechanical Sciences, 2022. 221: p. 107224. [CrossRef]
- Zhao, C., Z. Gao, and X. Zhang, Low-Frequency Surface Wave Attenuation of Multi Point Mass Resonance Metamaterials. Journal of Vibration Engineering & Technologies, 2024. [CrossRef]
- Zeng, Y., et al., Low-frequency broadband seismic metamaterial using I-shaped pillars in a half-space. Journal of Applied Physics, 2018. 123(21): p. 214901. [CrossRef]
- Du, Q., et al., H-fractal seismic metamaterial with broadband low-frequency bandgaps. Journal of Physics D: Applied Physics, 2018. 51(10): p. 105104. [CrossRef]
- Chen, H.-Y., et al., Gradient-index surface acoustic metamaterial for steering omnidirectional ultra-broadband seismic waves. Extreme Mechanics Letters, 2023. 58: p. 101949. [CrossRef]
- Saddek, A.A., et al. Metamaterials of Auxetic Geometry for Seismic Energy Absorption. Materials, 2023. 16. [CrossRef]
- Kuang, H., C. Xu, and Z. Tang, Emerging Chiral Materials. Advanced Materials, 2020. 32(41): p. 2005110. [CrossRef]
- Dong, J., Y. Liu, and Y. Cui, Emerging chiral two-dimensional materials. Nature Chemistry, 2024. 16(9): p. 1398-1407. [CrossRef]
- Prall, D. and R.S. Lakes, Properties of a chiral honeycomb with a poisson's ratio of — 1. International Journal of Mechanical Sciences, 1997. 39(3): p. 305-314. [CrossRef]
- Bacigalupo, A., V. Diana, and L. Gambarotta, Energy absorbing multilayered self-recovering metamaterials with chiral topology. International Journal of Solids and Structures, 2023. 273: p. 112213. [CrossRef]
- Zhang, Q., et al., Mechanics and Wave Propagation Characterization of Chiral S-Shaped Auxetic Metastructure. Acta Mechanica Solida Sinica, 2022. 35(4): p. 571-586. [CrossRef]
- Zhang, K., et al., Study on the mechanism of band gap and directional wave propagation of the auxetic chiral lattices. Composite Structures, 2020. 238: p. 111952. [CrossRef]
- Dai, P., et al., Band gap of shear horizontal waves for one-dimensional phononic crystals with chiral materials. Physical Review E, 2024. 109(2): p. 025001. [CrossRef]
- Liu, X.N., et al., Wave propagation characterization and design of two-dimensional elastic chiral metacomposite. Journal of Sound and Vibration, 2011. 330(11): p. 2536-2553. [CrossRef]
- Zhu, R., et al., A chiral elastic metamaterial beam for broadband vibration suppression. Journal of Sound and Vibration, 2014. 333(10): p. 2759-2773. [CrossRef]
- Tan, W., et al., Band gap adjustment of an improved three-ligament chiral structure with flexure hinges. Journal of the Brazilian Society of Mechanical Sciences and Engineering, 2022. 44(8): p. 341. [CrossRef]
- Li, X.-f., et al., Bandgap tuning and in-plane wave propagation of chiral and anti-chiral hybrid metamaterials with assembled six oscillators. Physica A: Statistical Mechanics and its Applications, 2023. 615: p. 128600. [CrossRef]
- Zhang, K., et al., Tunable wave propagation in octa-chiral lattices with local resonators. Composite Structures, 2019. 220: p. 114-126. [CrossRef]
- Zhou, X. and G. Hu, Analytic model of elastic metamaterials with local resonances. Physical Review B, 2009. 79(19): p. 195109. [CrossRef]
- NGA-Subduction Portal: Ground-Motion Record Selection and Download. The B. John Garrick Institute for the Risk Sciences. InteractiveResource. [CrossRef]
- Bai, J., et al., Split-type seismic metamaterials with pseudo-surface wave weakening mechanism. Soil Dynamics and Earthquake Engineering, 2024. 184: p. 108858. [CrossRef]
- Zeng, Y., et al., A broadband seismic metamaterial plate with simple structure and easy realization. Journal of Applied Physics, 2019. 125(22): p. 224901. [CrossRef]
Figure 1.
(a)The structure unit of 2D chiral SM, where the yellow part is the steel and the gray part is the soil. (b)The first irreducible Brillouin zone for the periodic composites with a square lattice: Γ= (0, 0), X =(π/a,0), M =(π/a, π/a), Y =(0, π/a).
Figure 1.
(a)The structure unit of 2D chiral SM, where the yellow part is the steel and the gray part is the soil. (b)The first irreducible Brillouin zone for the periodic composites with a square lattice: Γ= (0, 0), X =(π/a,0), M =(π/a, π/a), Y =(0, π/a).
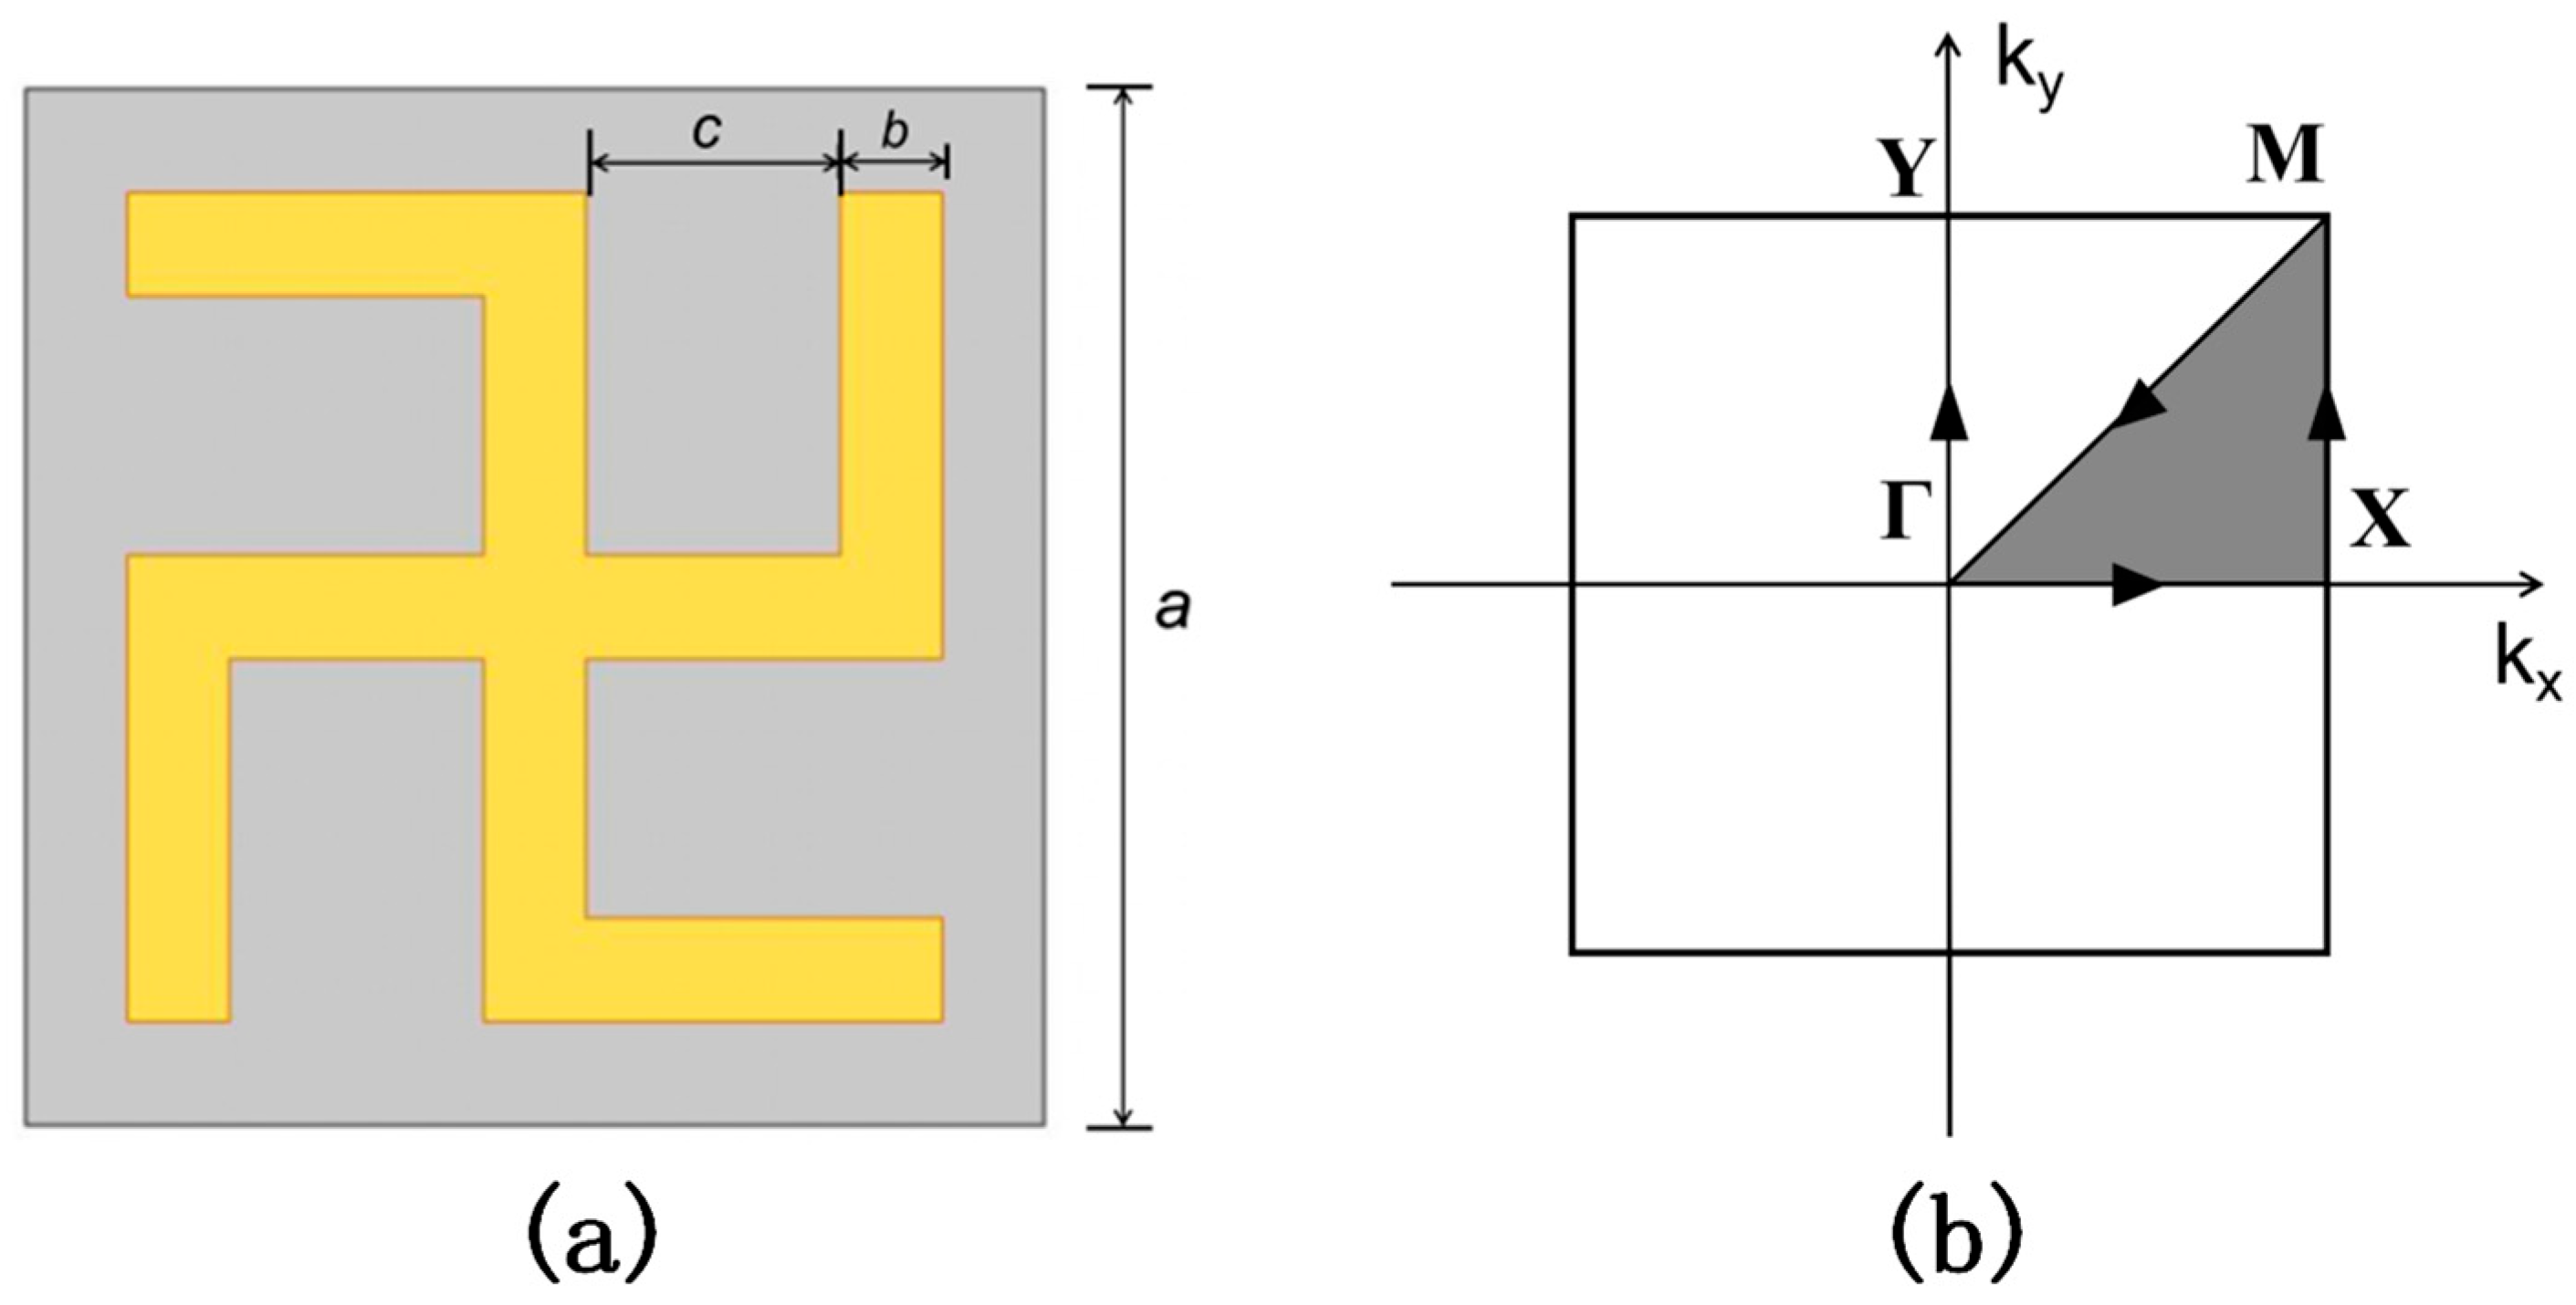
Figure 2.
Band structures of SMs with different inclusions: (a) gammadion-shaped chiral inclusion, (b) cross-shaped inclusion.
Figure 2.
Band structures of SMs with different inclusions: (a) gammadion-shaped chiral inclusion, (b) cross-shaped inclusion.
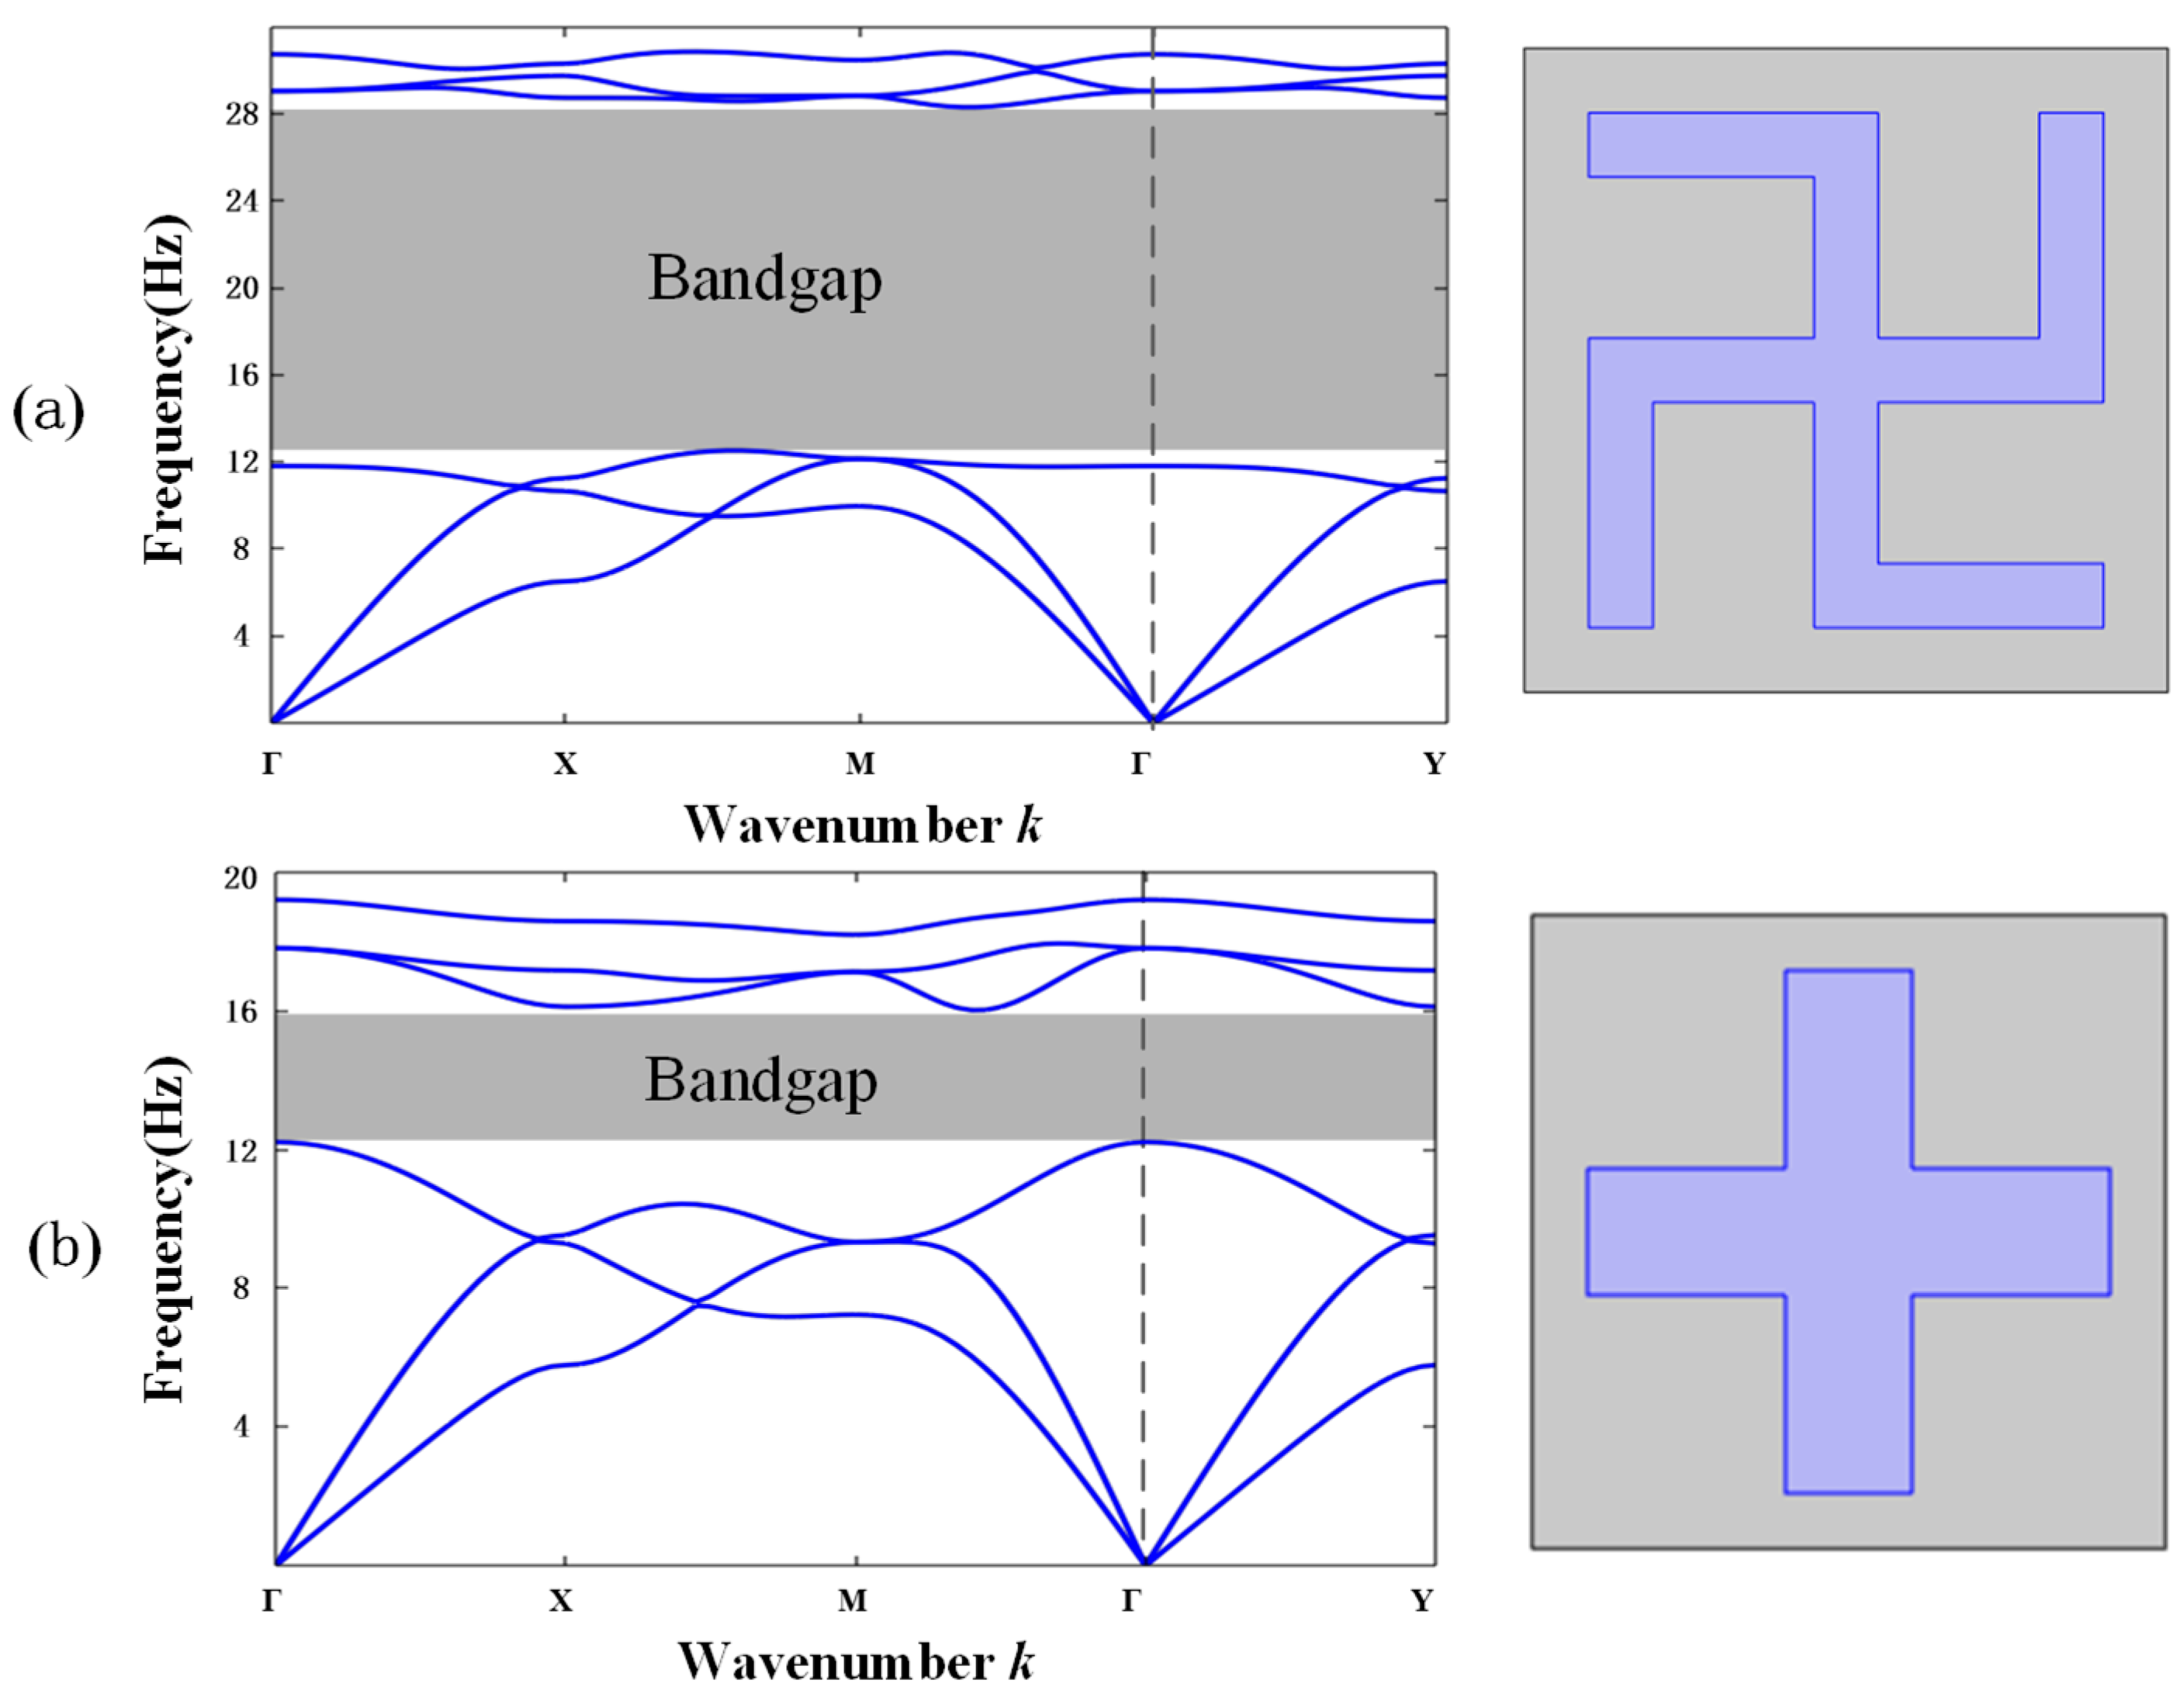
Figure 3.
Effective mass density of the chiral SM, where the gray area represent the negative value part.
Figure 3.
Effective mass density of the chiral SM, where the gray area represent the negative value part.
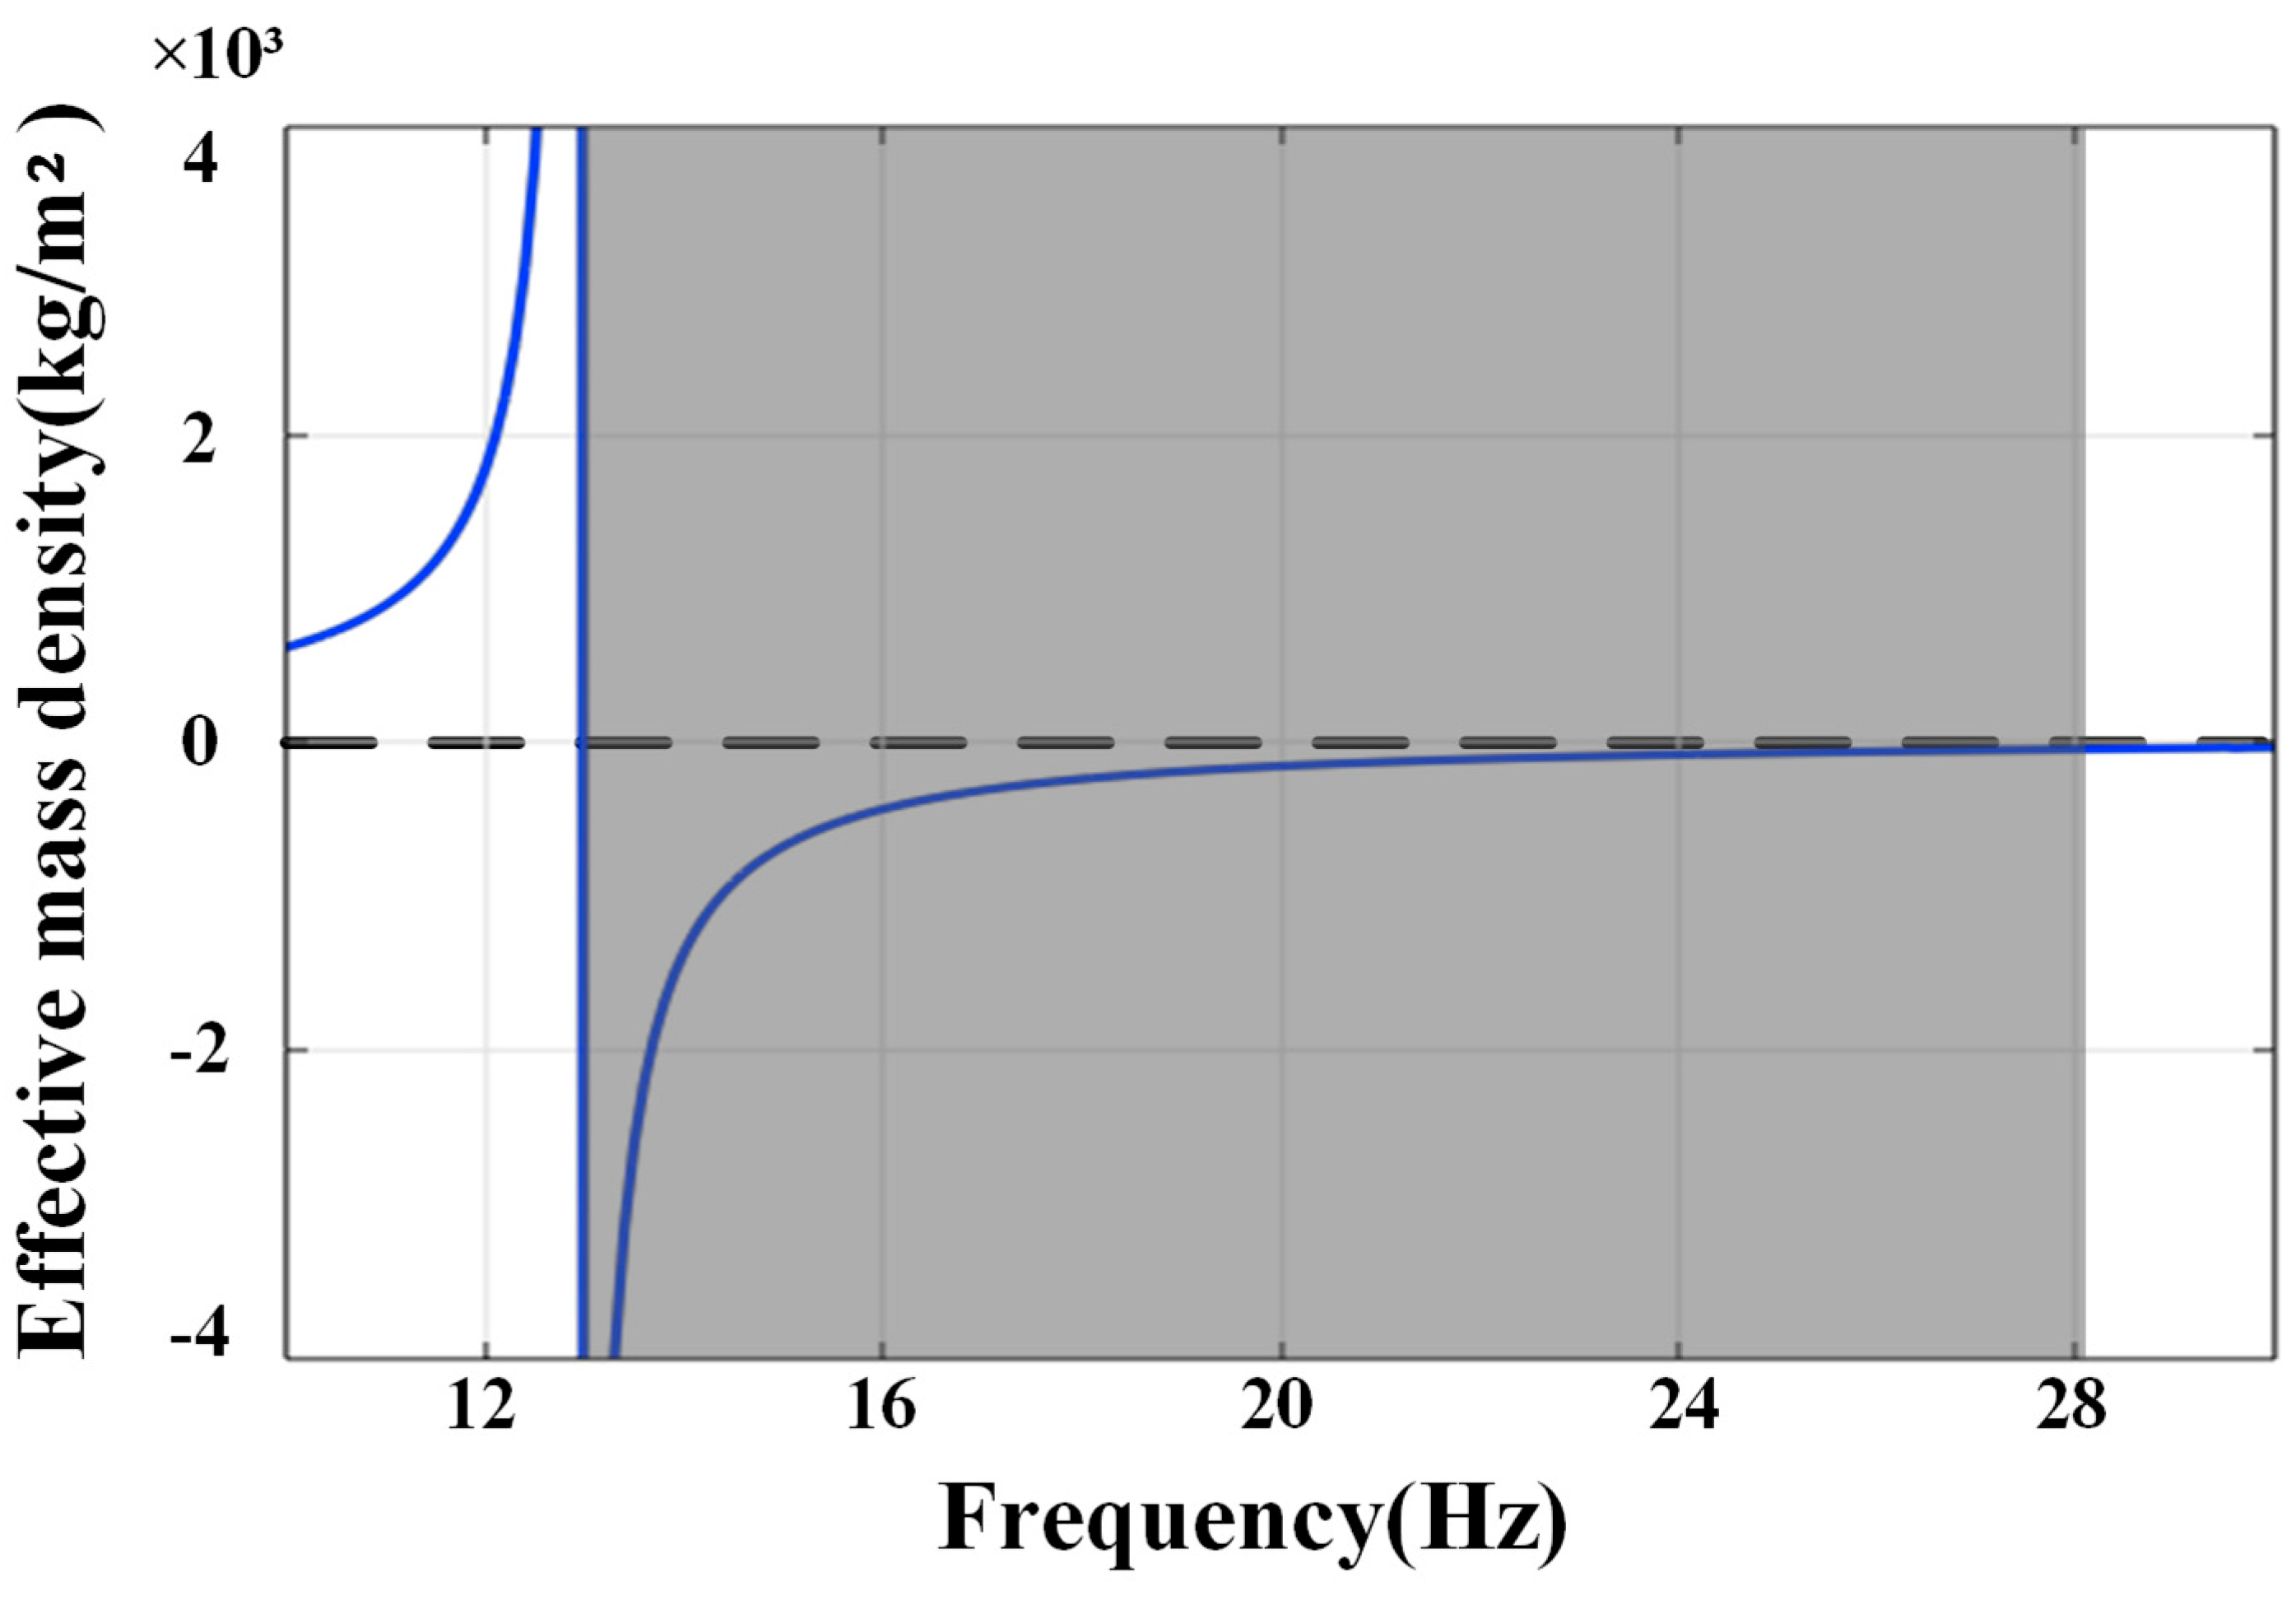
Figure 4.
Effect of geometrical parameters on bandgap extension. The gray shades represent the bandgap. (a)Bandgap changes when parameter b is modified. (b)Bandgap changes when parameter c is modified.
Figure 4.
Effect of geometrical parameters on bandgap extension. The gray shades represent the bandgap. (a)Bandgap changes when parameter b is modified. (b)Bandgap changes when parameter c is modified.
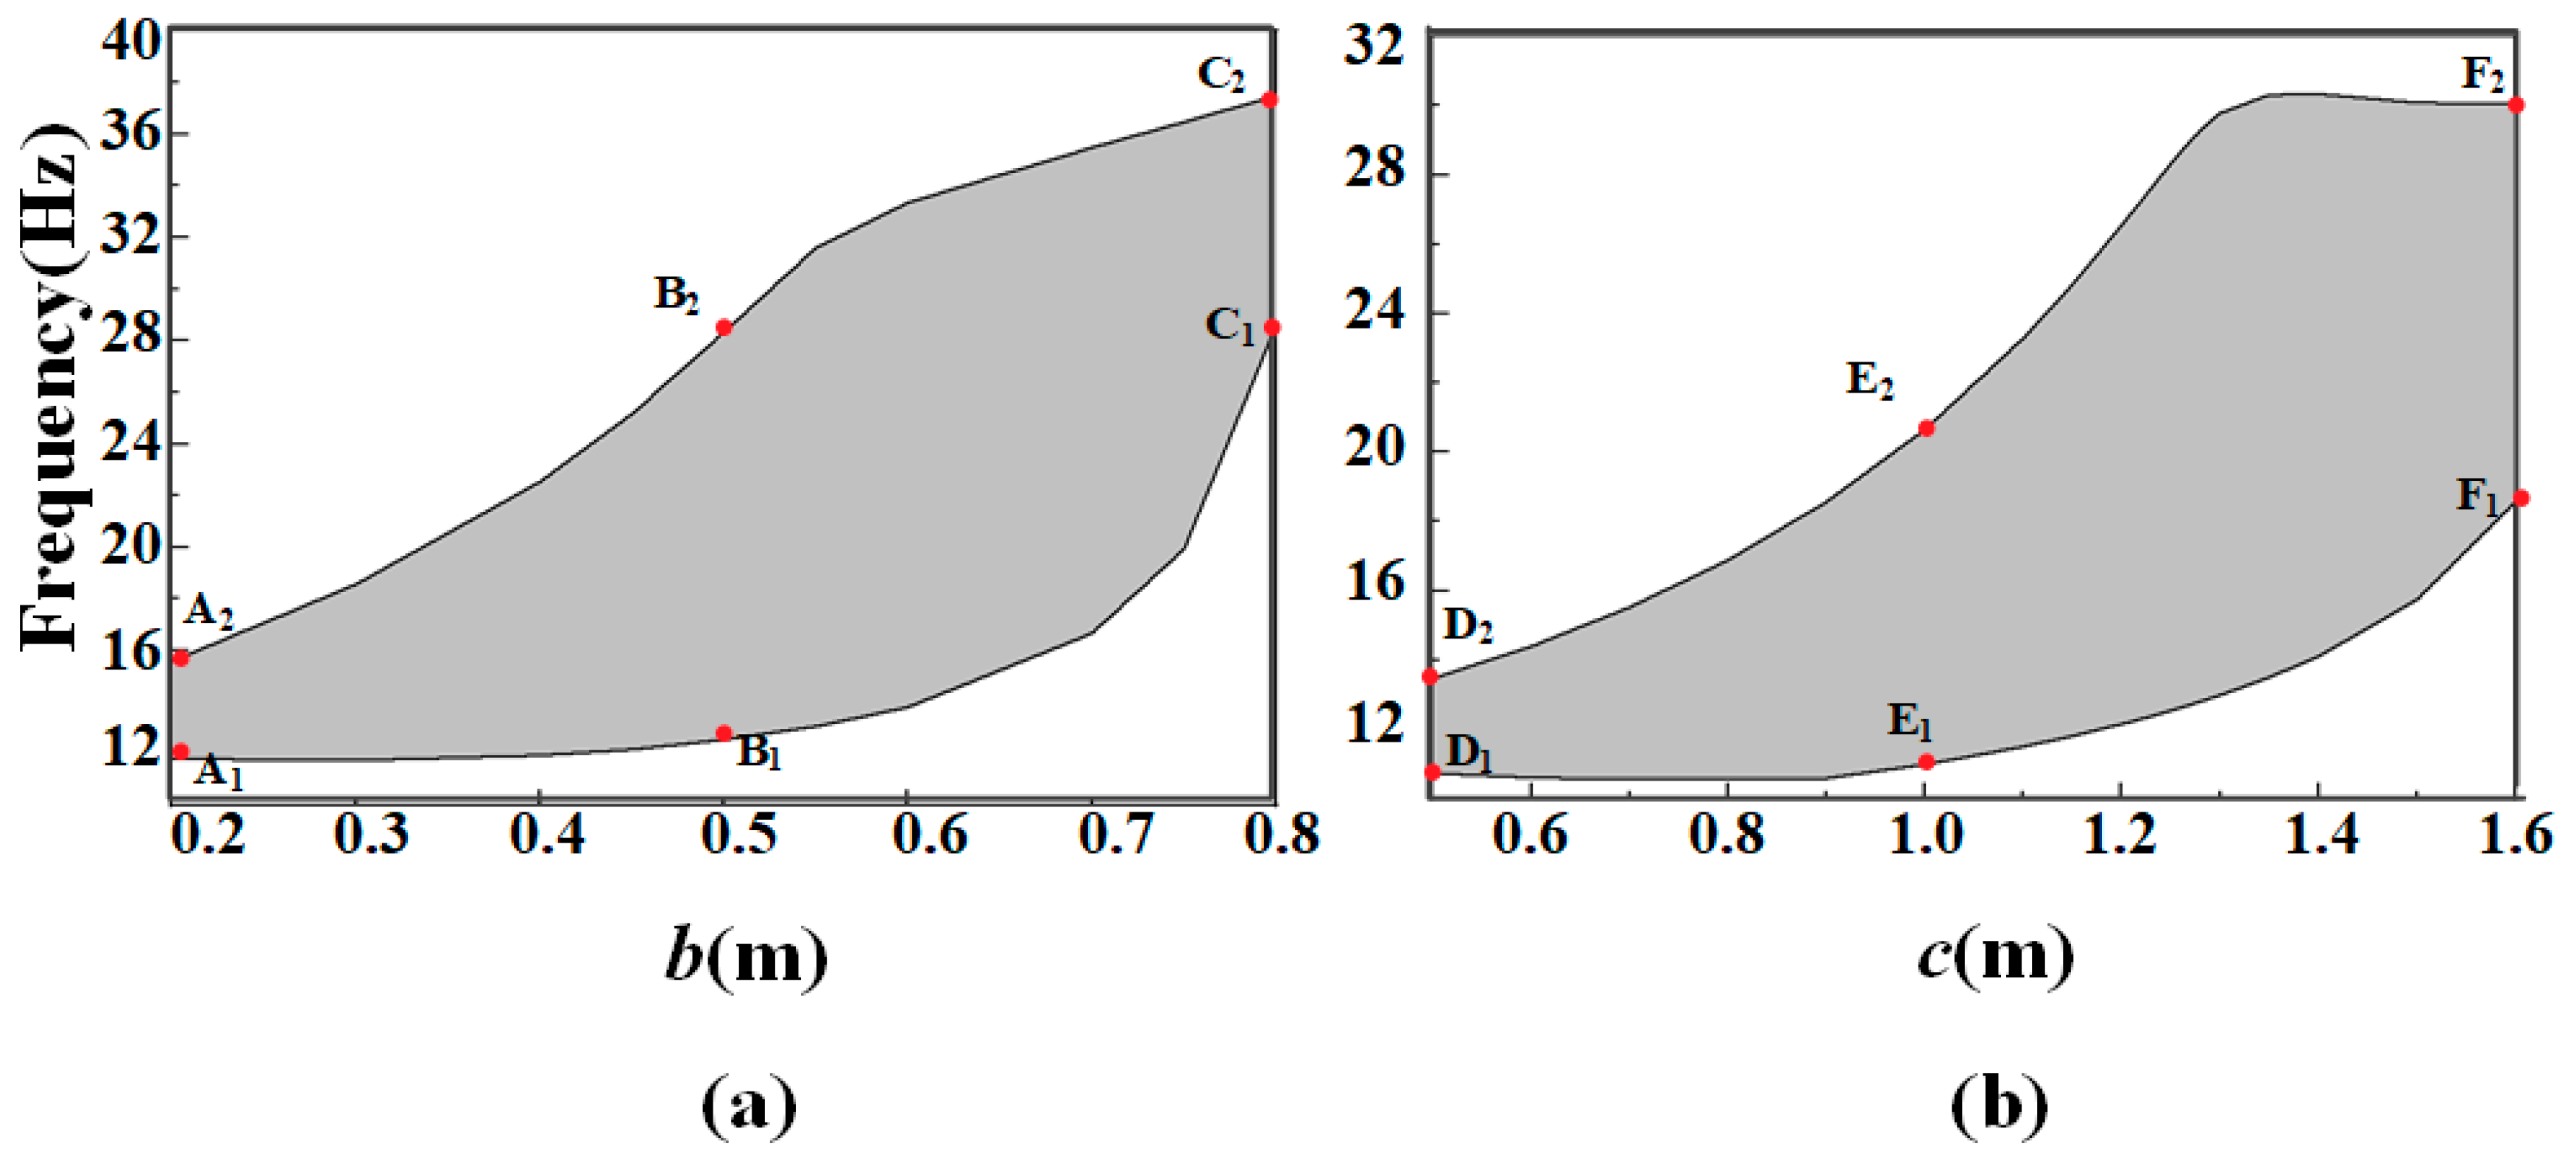
Figure 5.
Vibration modes at the upper and lower boundaries of the bandgap when modifying parameters. The A-C group shows the cases where only parameter b is changed, and the D-F group shows the cases where only parameter c is changed. The mode with subscript 1 is at the lower boundary of the bandgap, and the subscript 2 represent the mode is at the upper boundary.
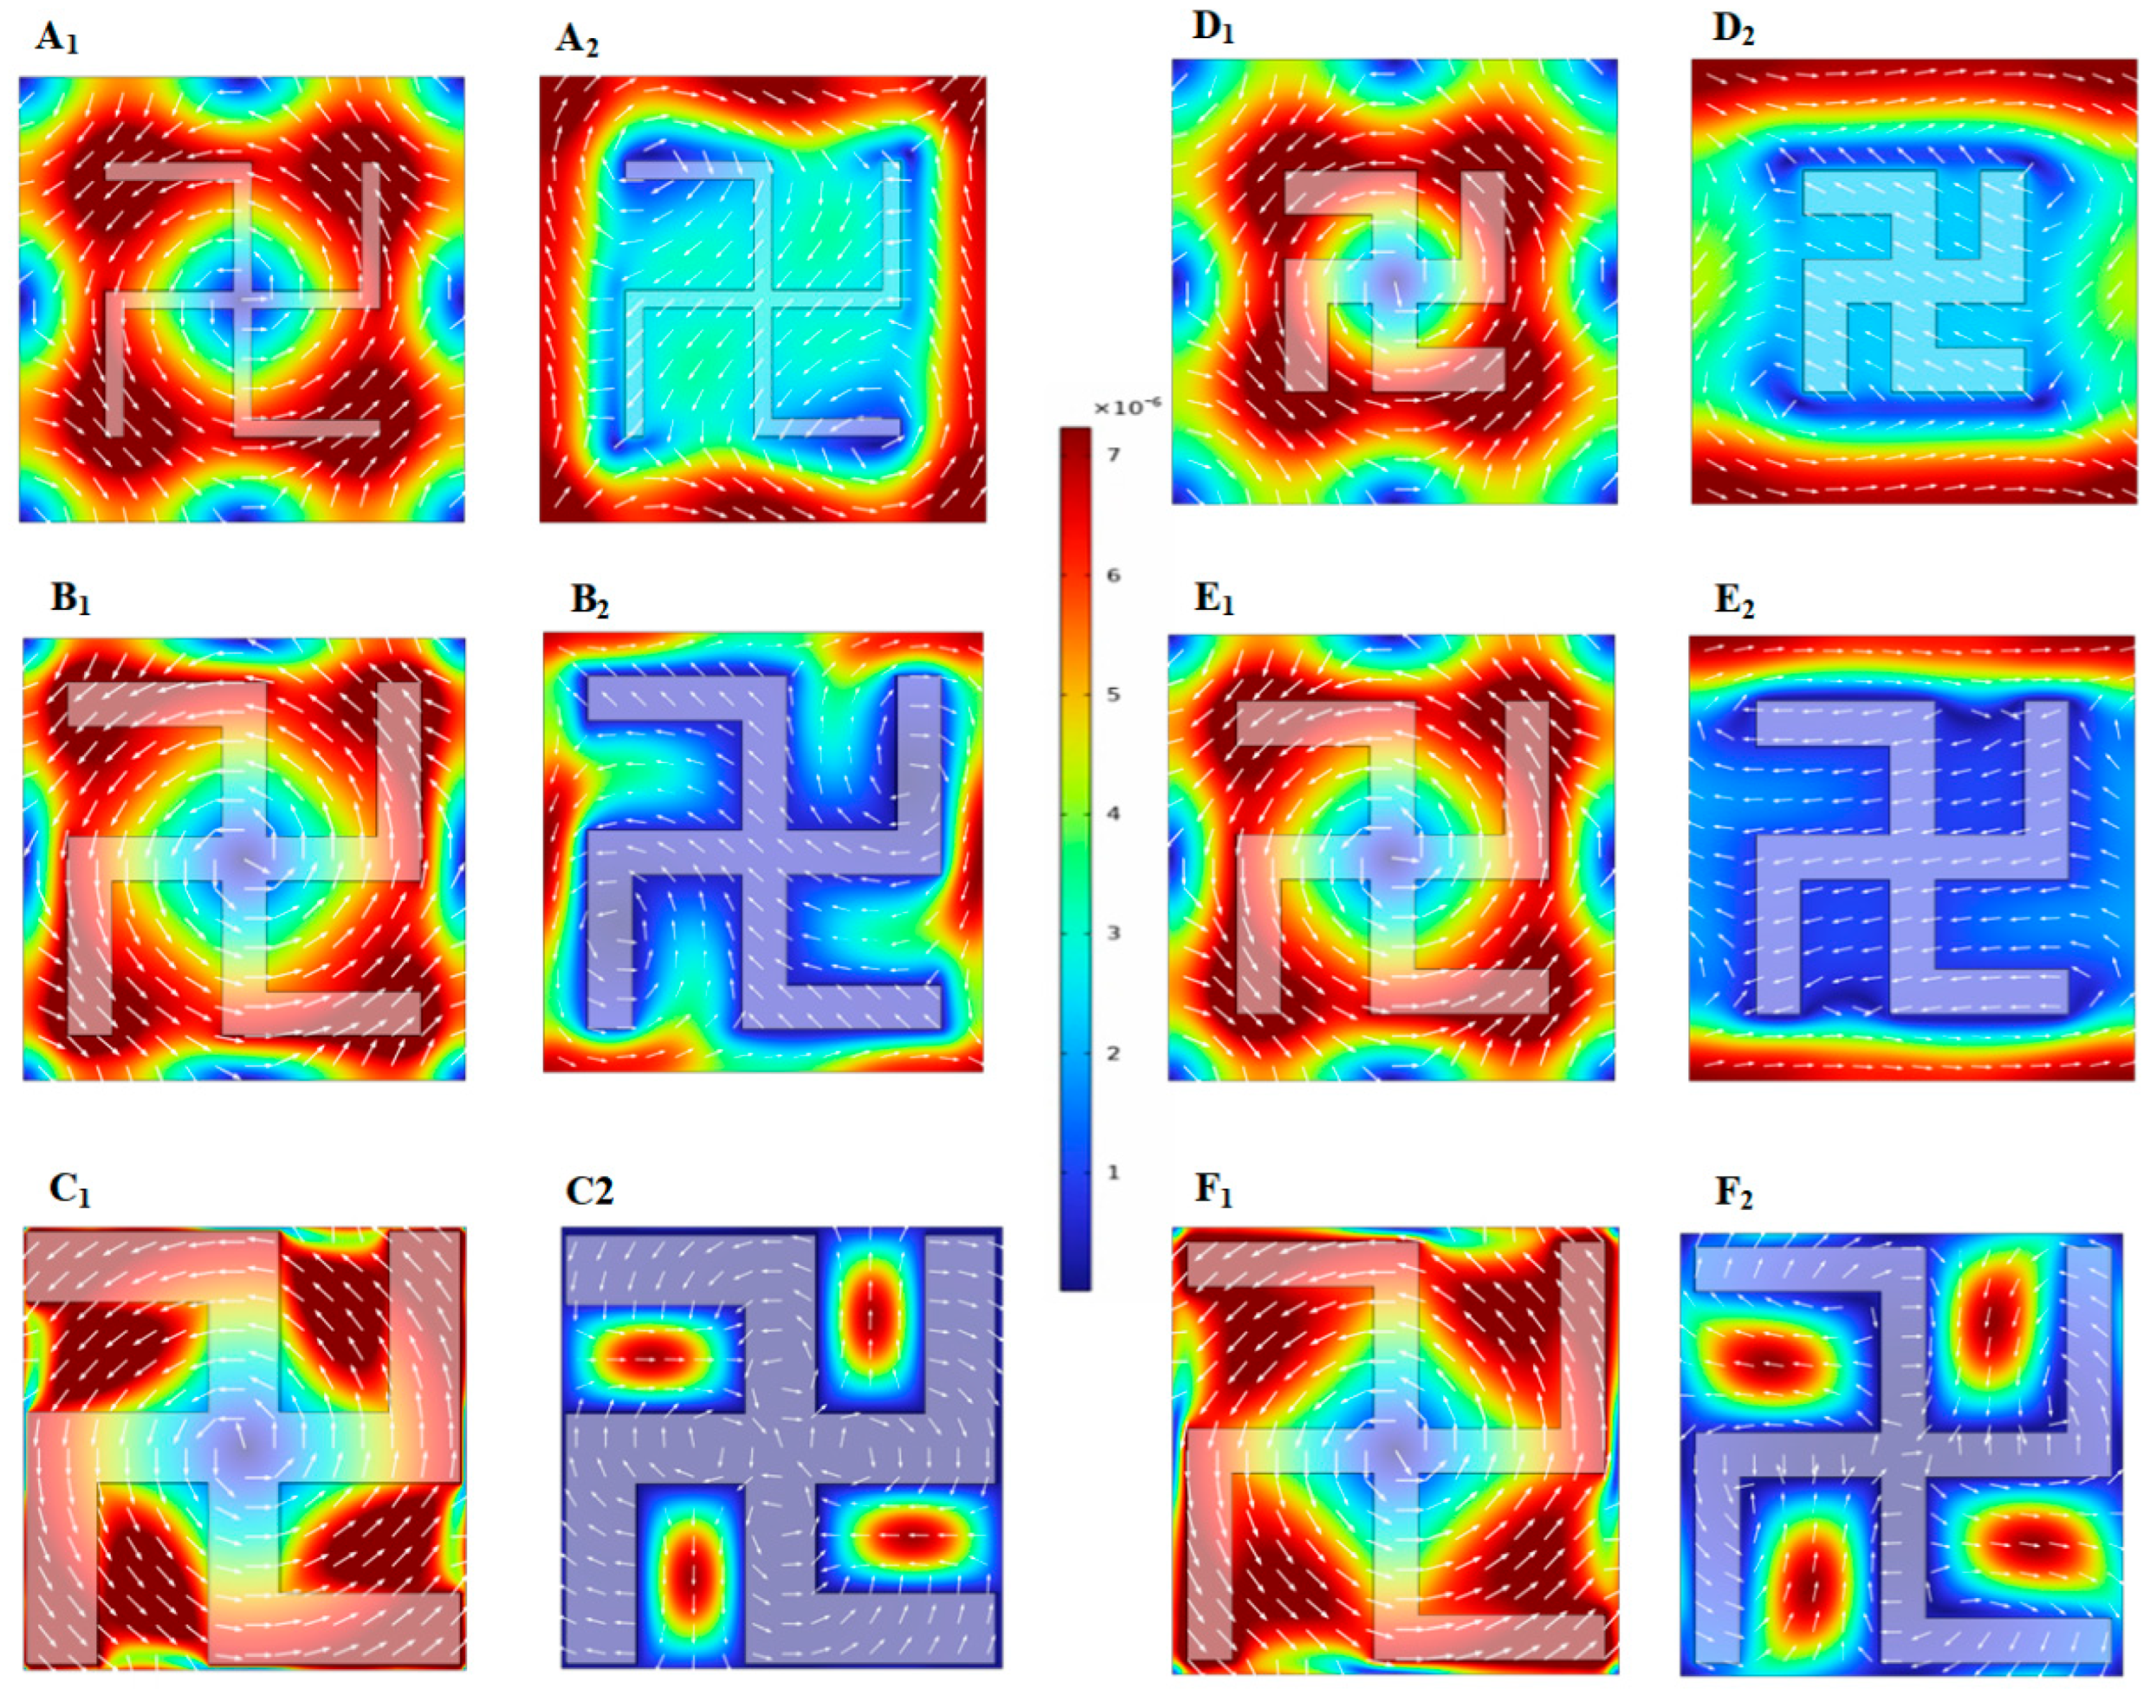
Figure 6.
(a)Model used in frequency domain calculations. (b)The band structure of the chiral SM in the ΓX direction and the TS of the periodic array of the chiral SM, where the gray areas indicate the bandgap and attenuation zone. (c)The displacement field distributions at 5Hz and 14Hz, respectively.
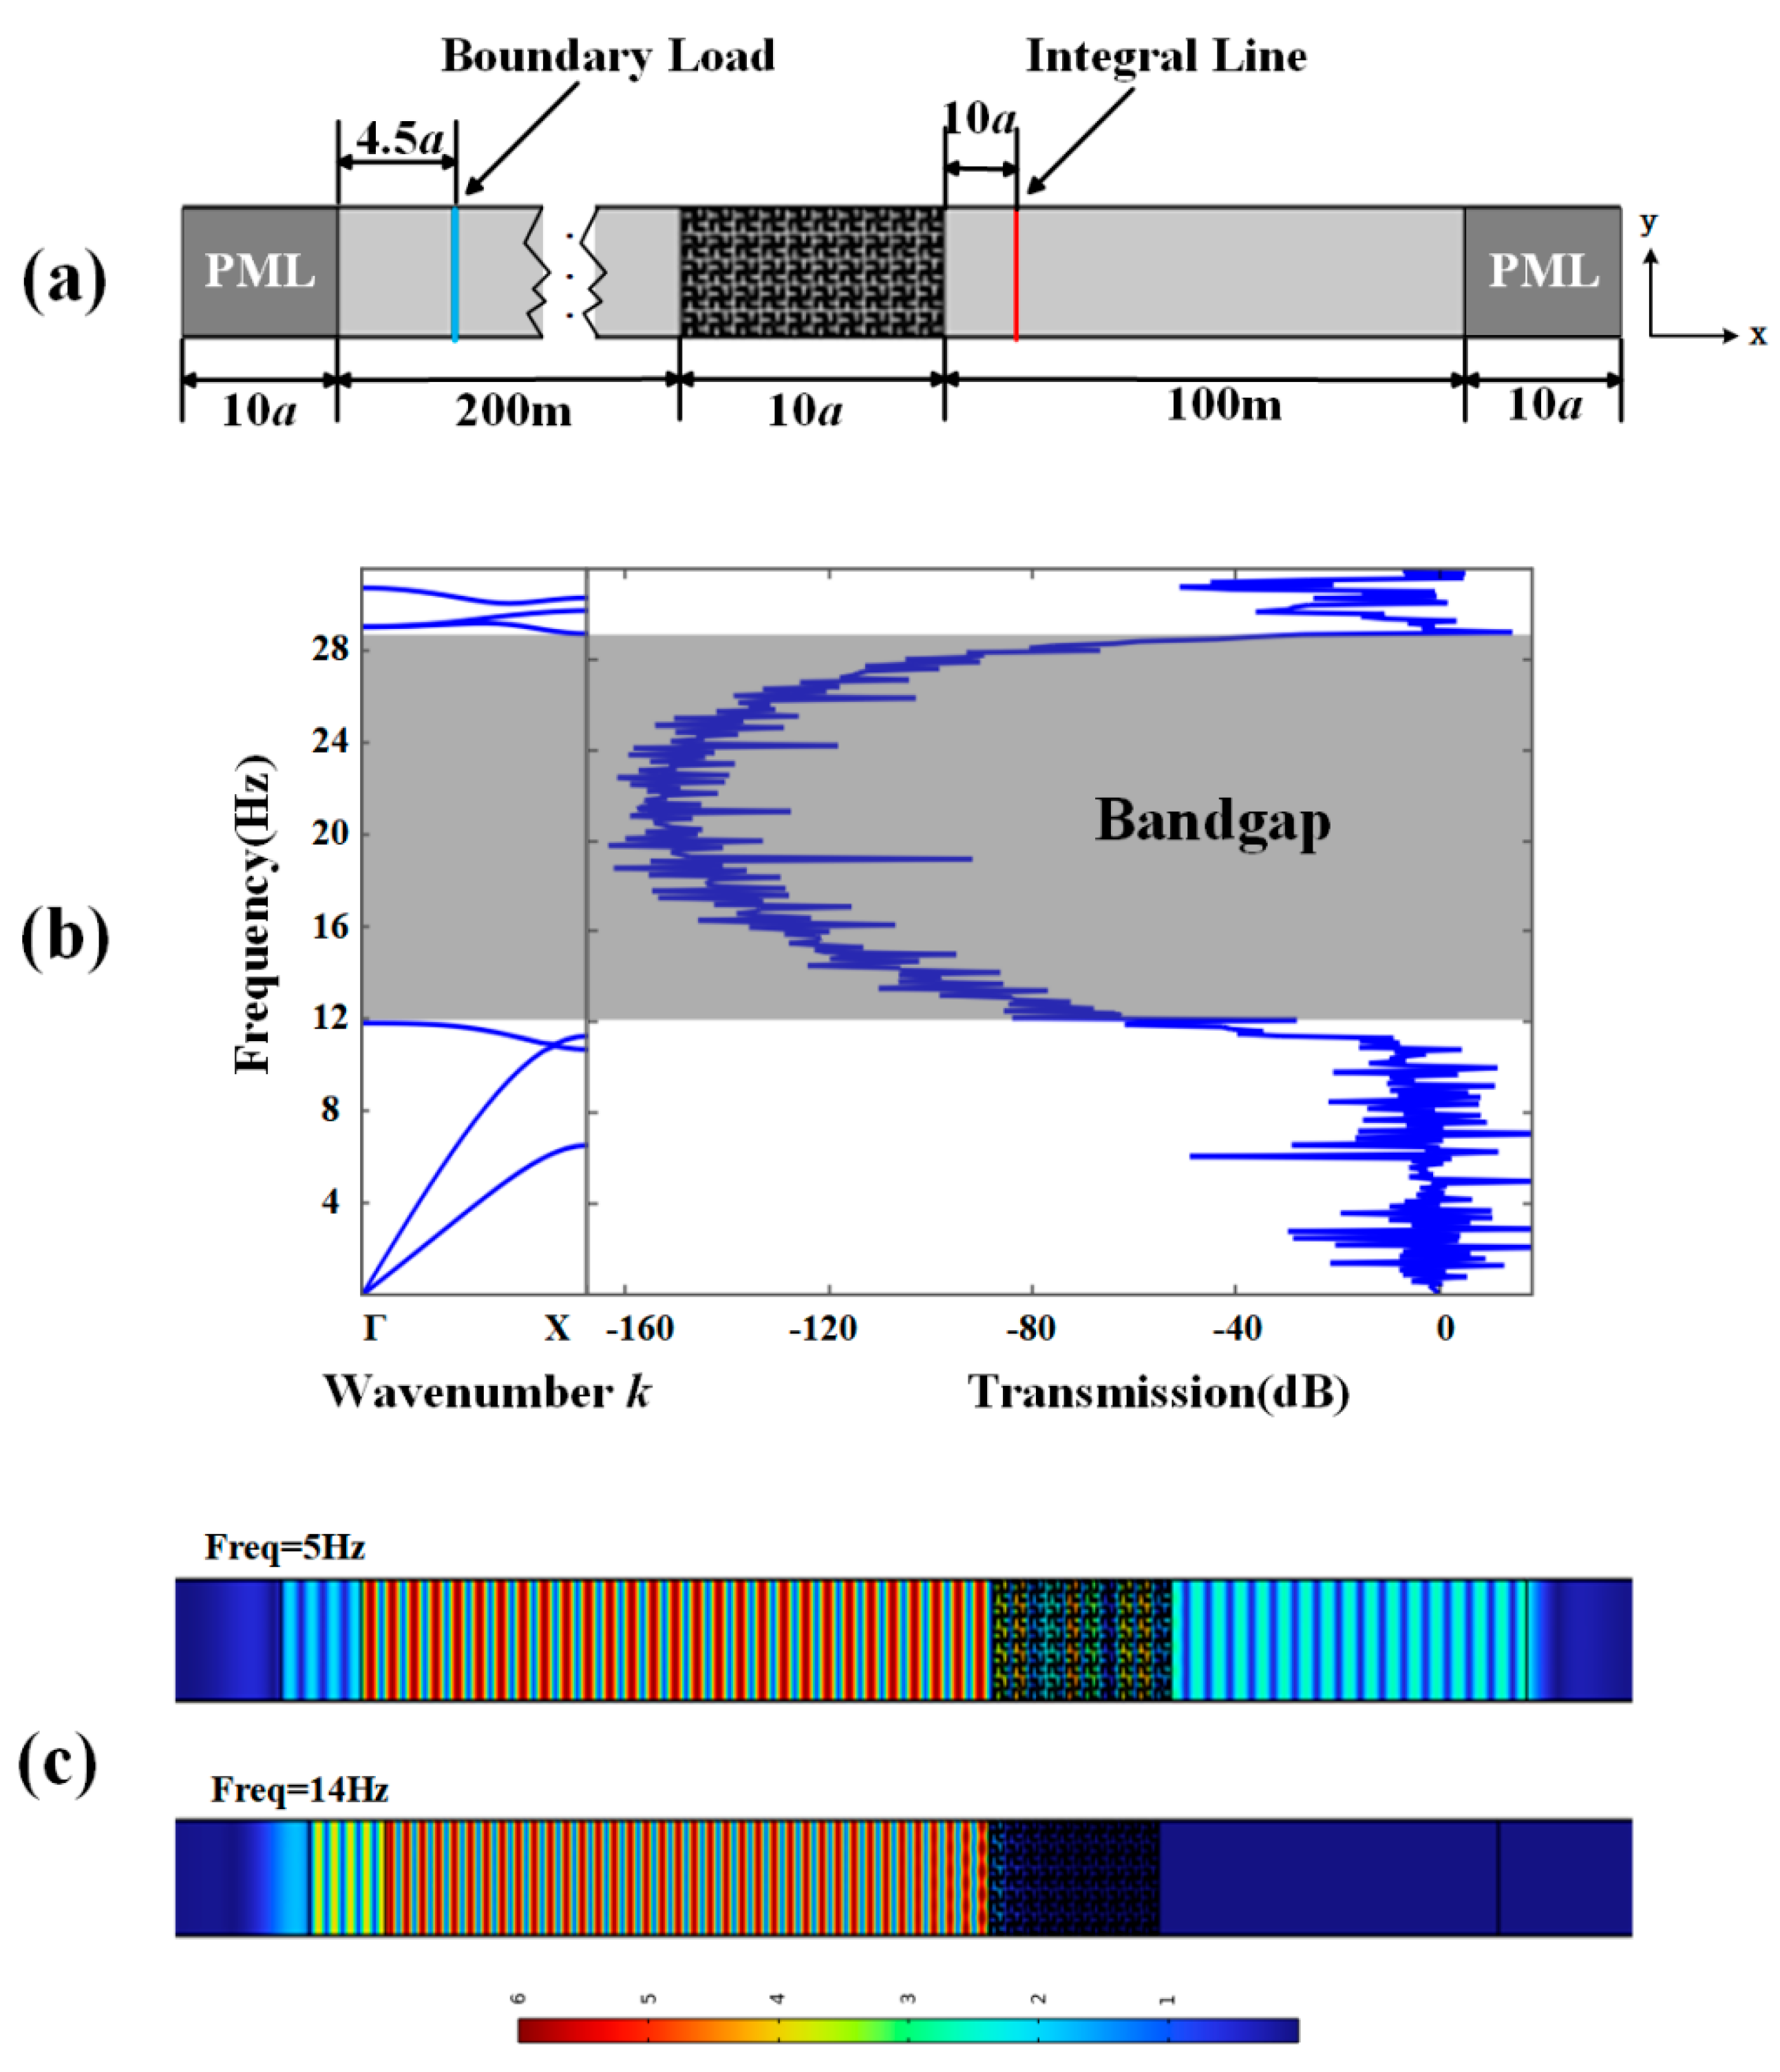
Figure 7.
(a)Schematic picture of finite system used for transmission calculations. (b)The transmission coefficient of the structure. The gray area is the attenuation zone. (c)The displacement field distributions at 1.5Hz and 5.5Hz, respectively.
Figure 7.
(a)Schematic picture of finite system used for transmission calculations. (b)The transmission coefficient of the structure. The gray area is the attenuation zone. (c)The displacement field distributions at 1.5Hz and 5.5Hz, respectively.
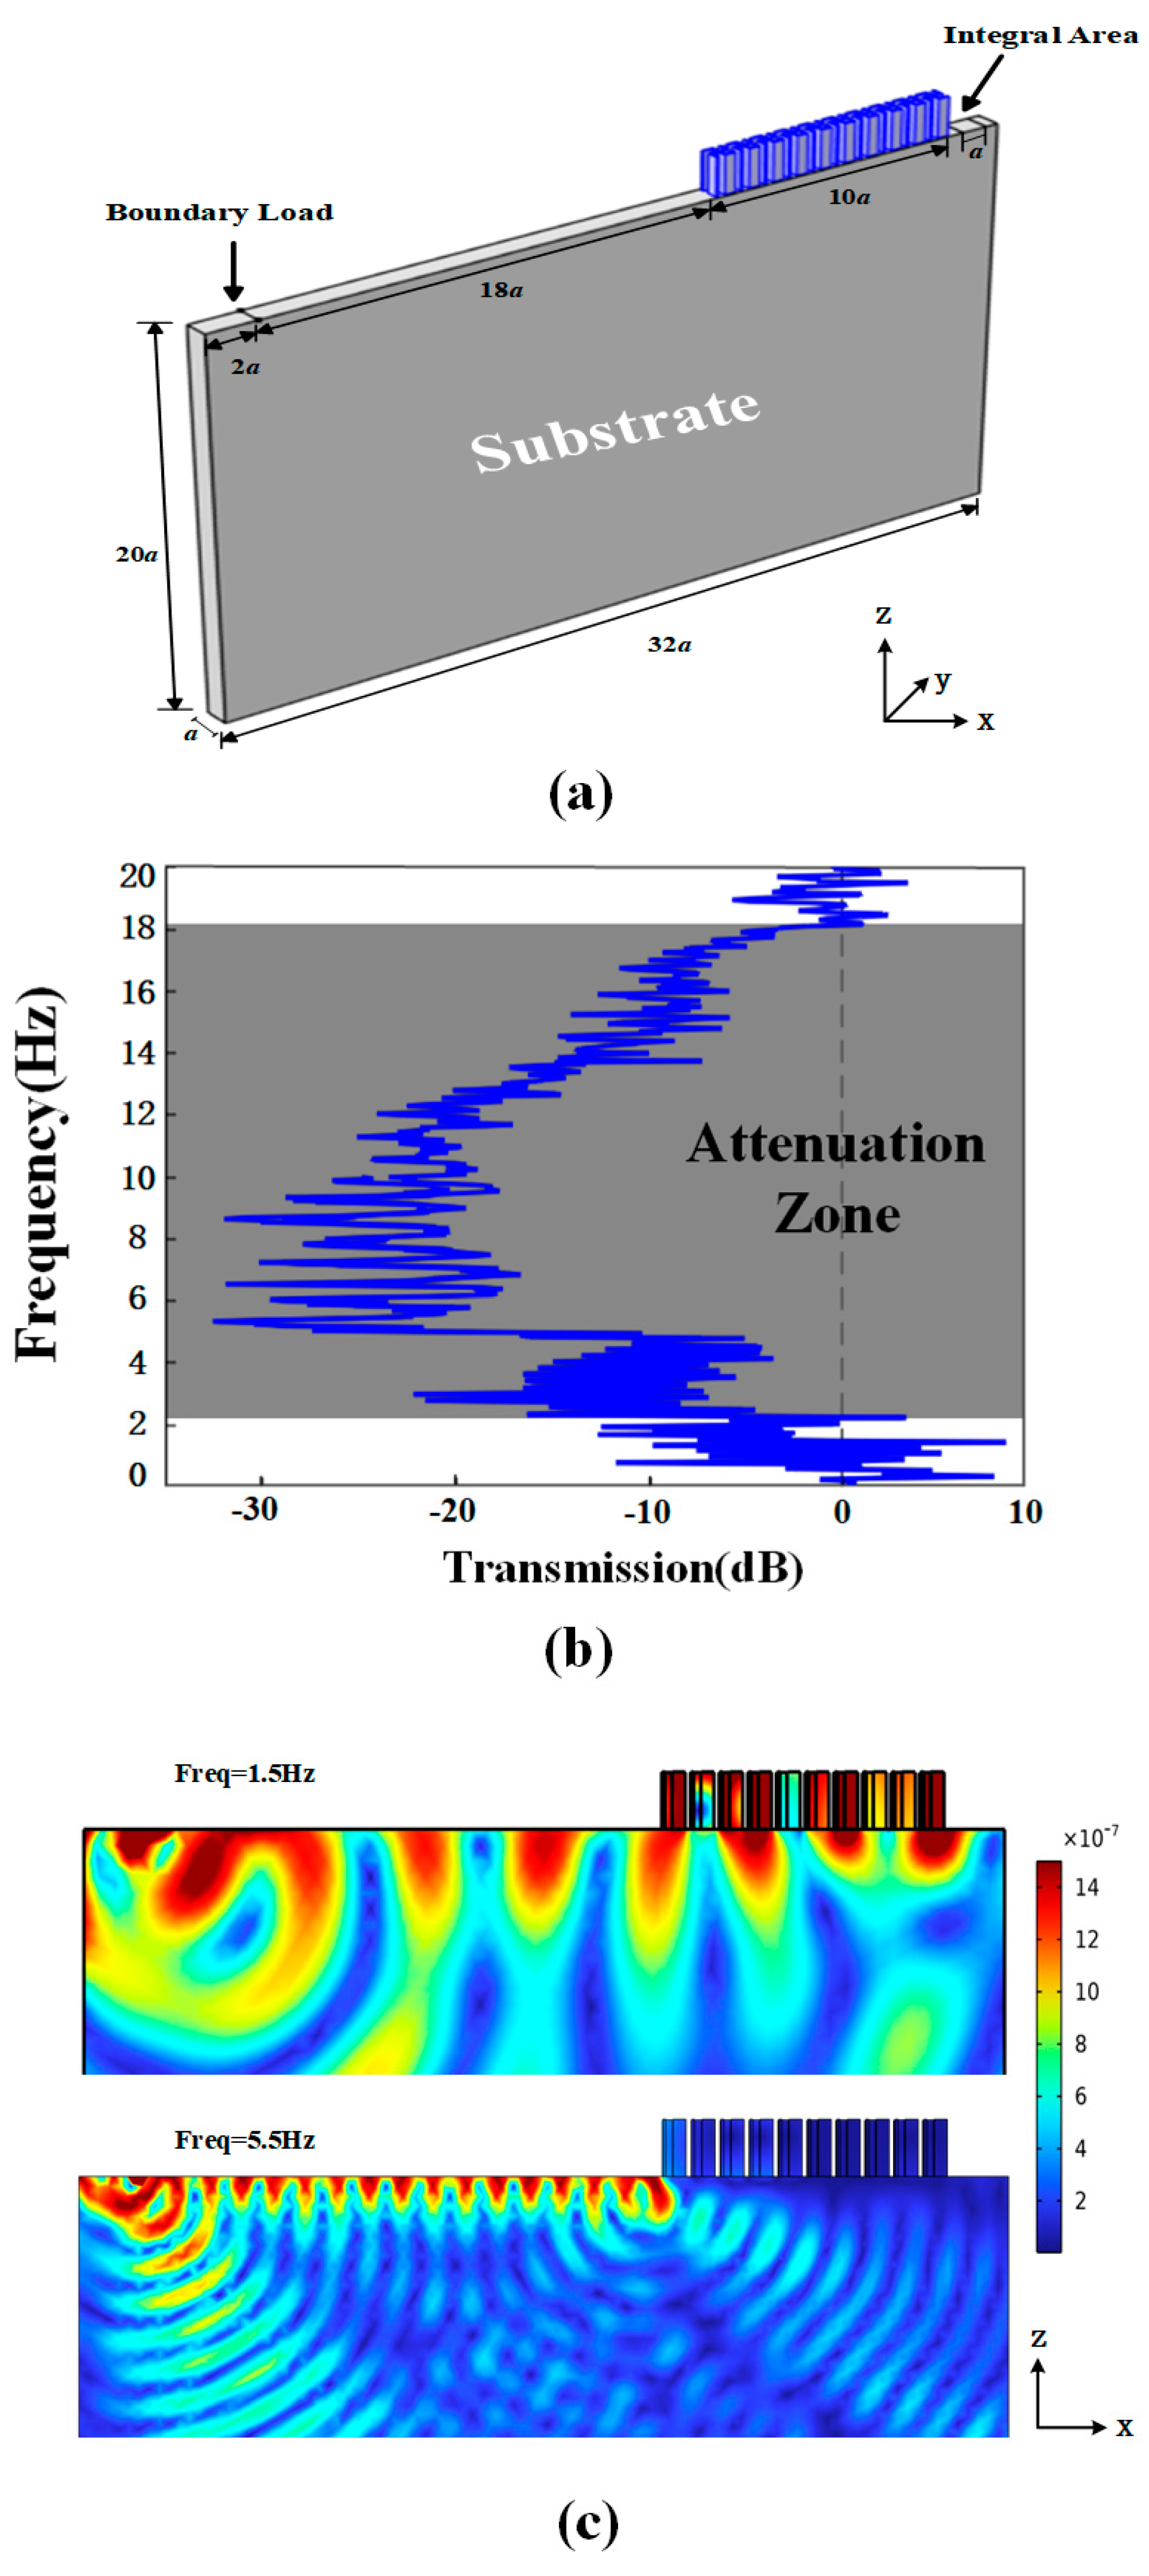
Figure 8.
(a)Schematic picture of different insertion depth. (b)The transmission coefficient of different insertion depth.
Figure 8.
(a)Schematic picture of different insertion depth. (b)The transmission coefficient of different insertion depth.
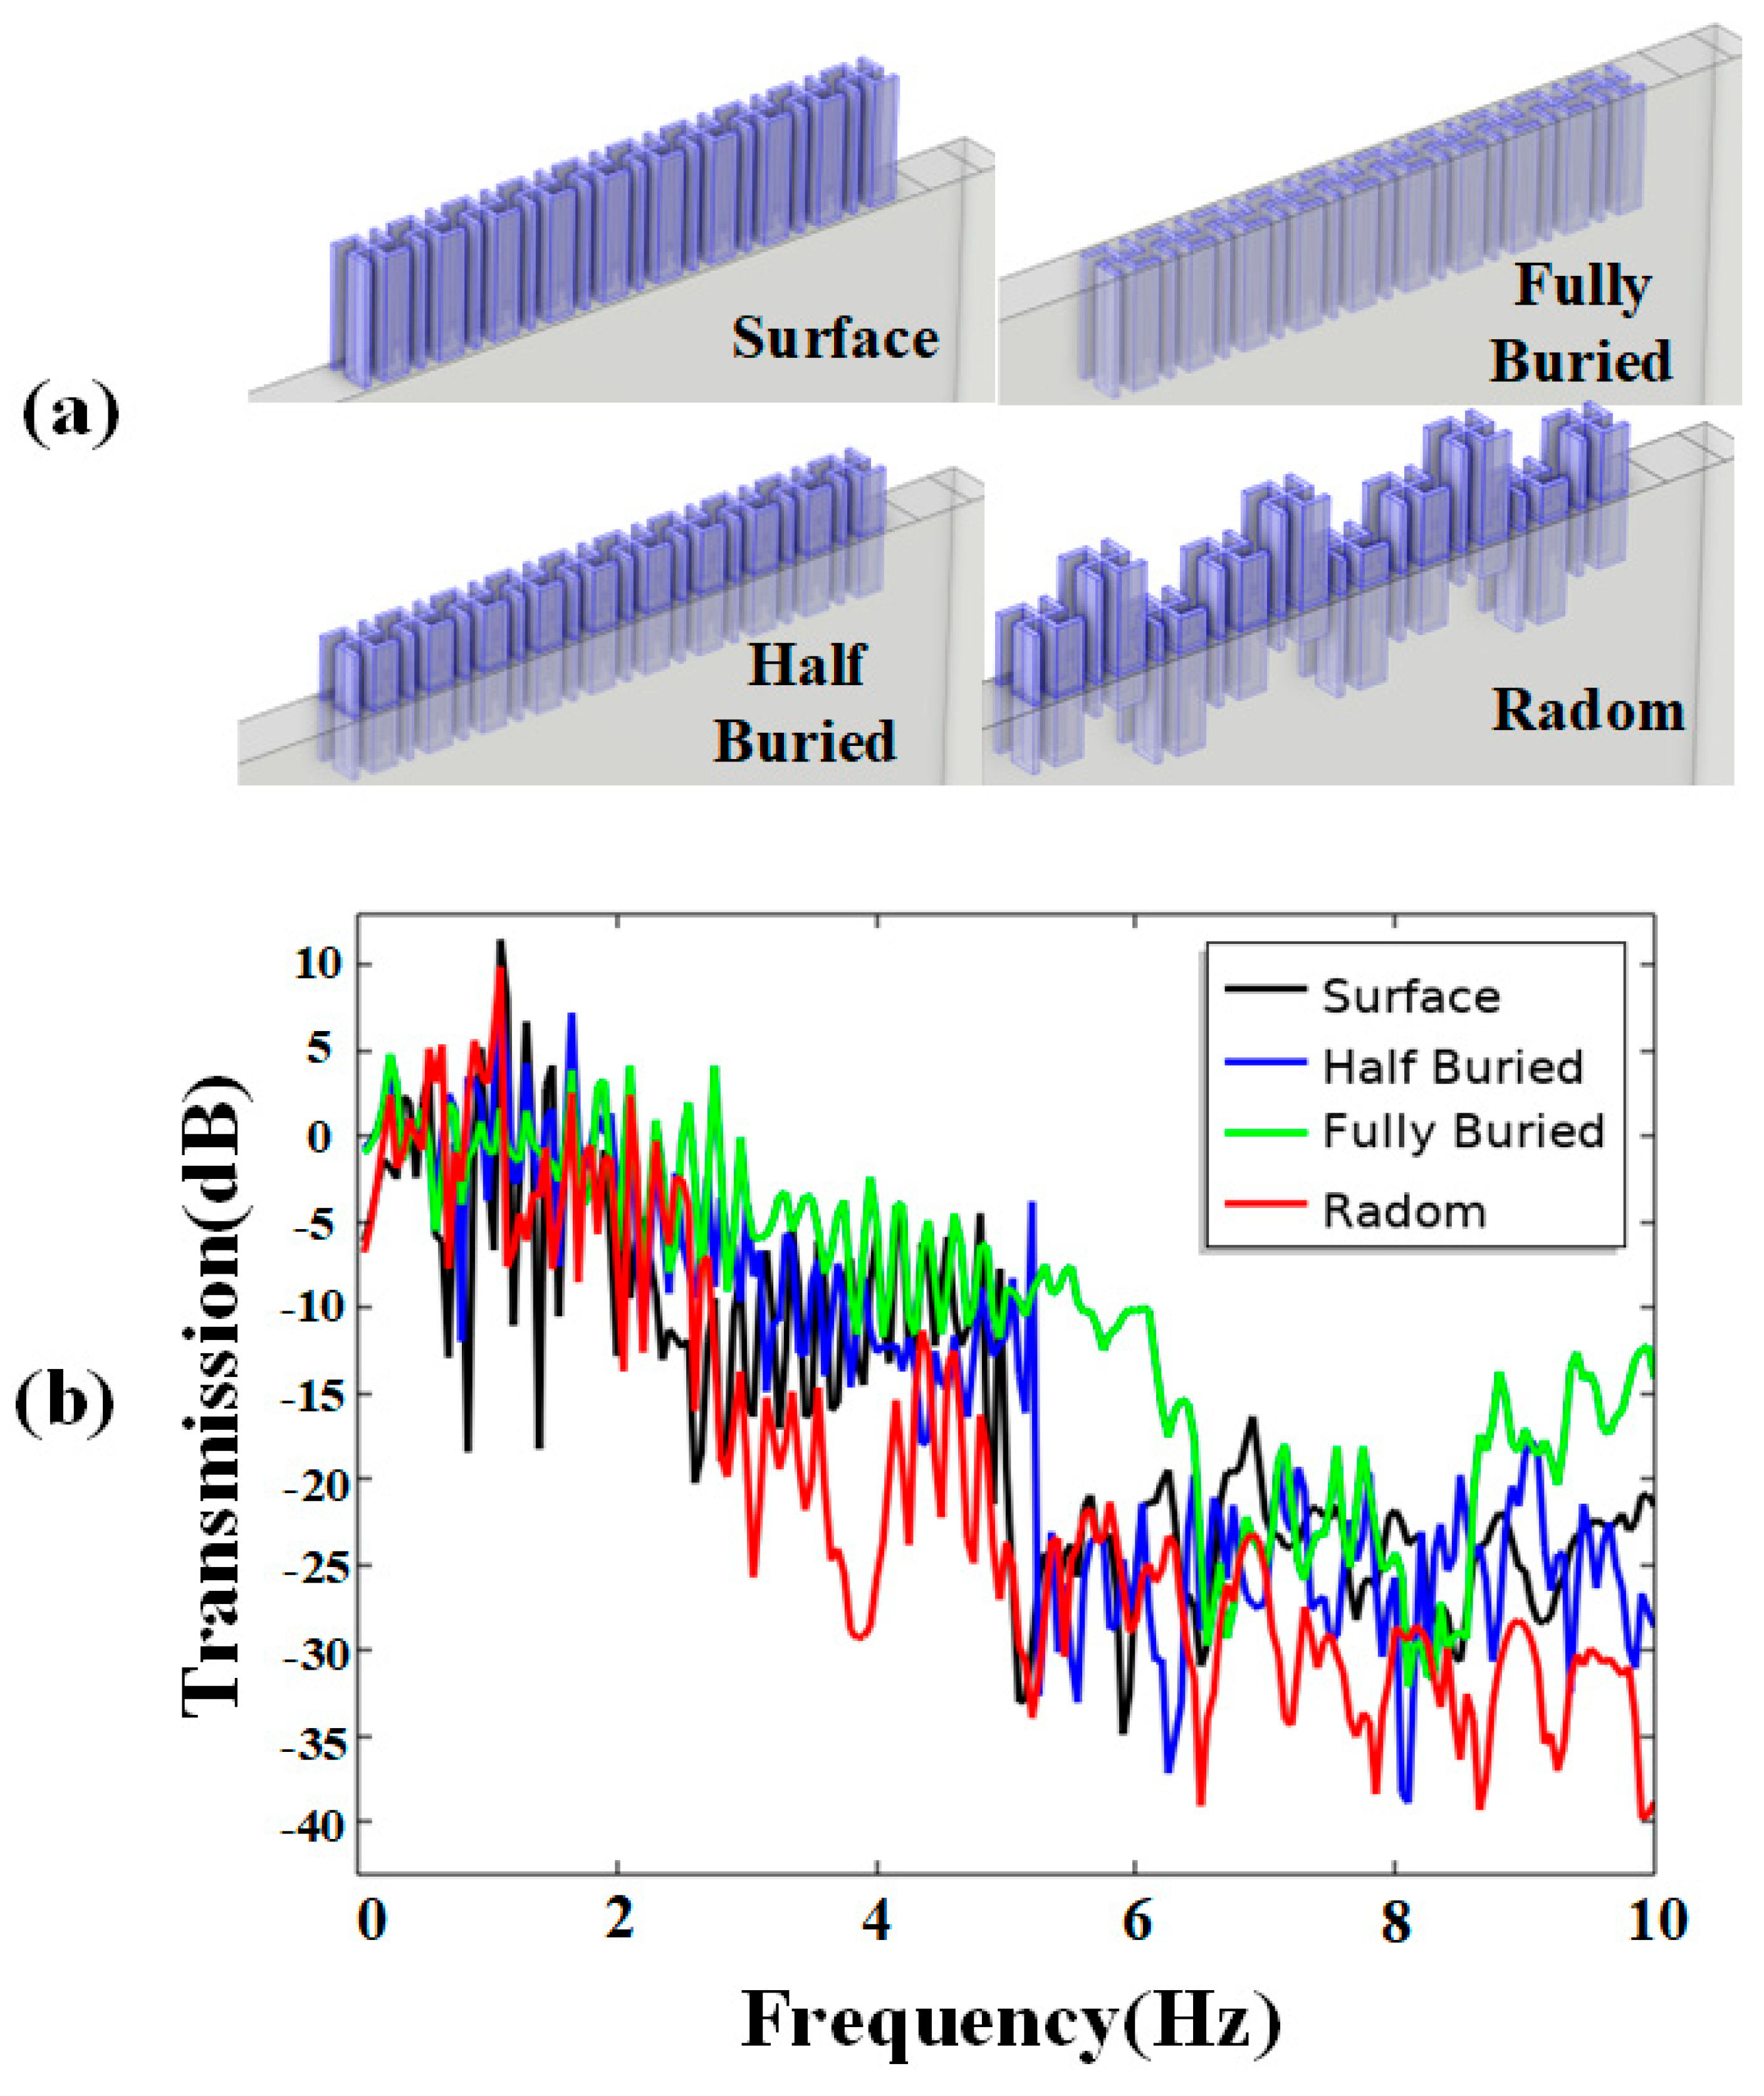
Figure 9.
AM wave attenuation results, where the black line is the displacement without SM and the red line is the displacement with SM attenuation. The model used is the same as Figure 7a.
Figure 9.
AM wave attenuation results, where the black line is the displacement without SM and the red line is the displacement with SM attenuation. The model used is the same as Figure 7a.
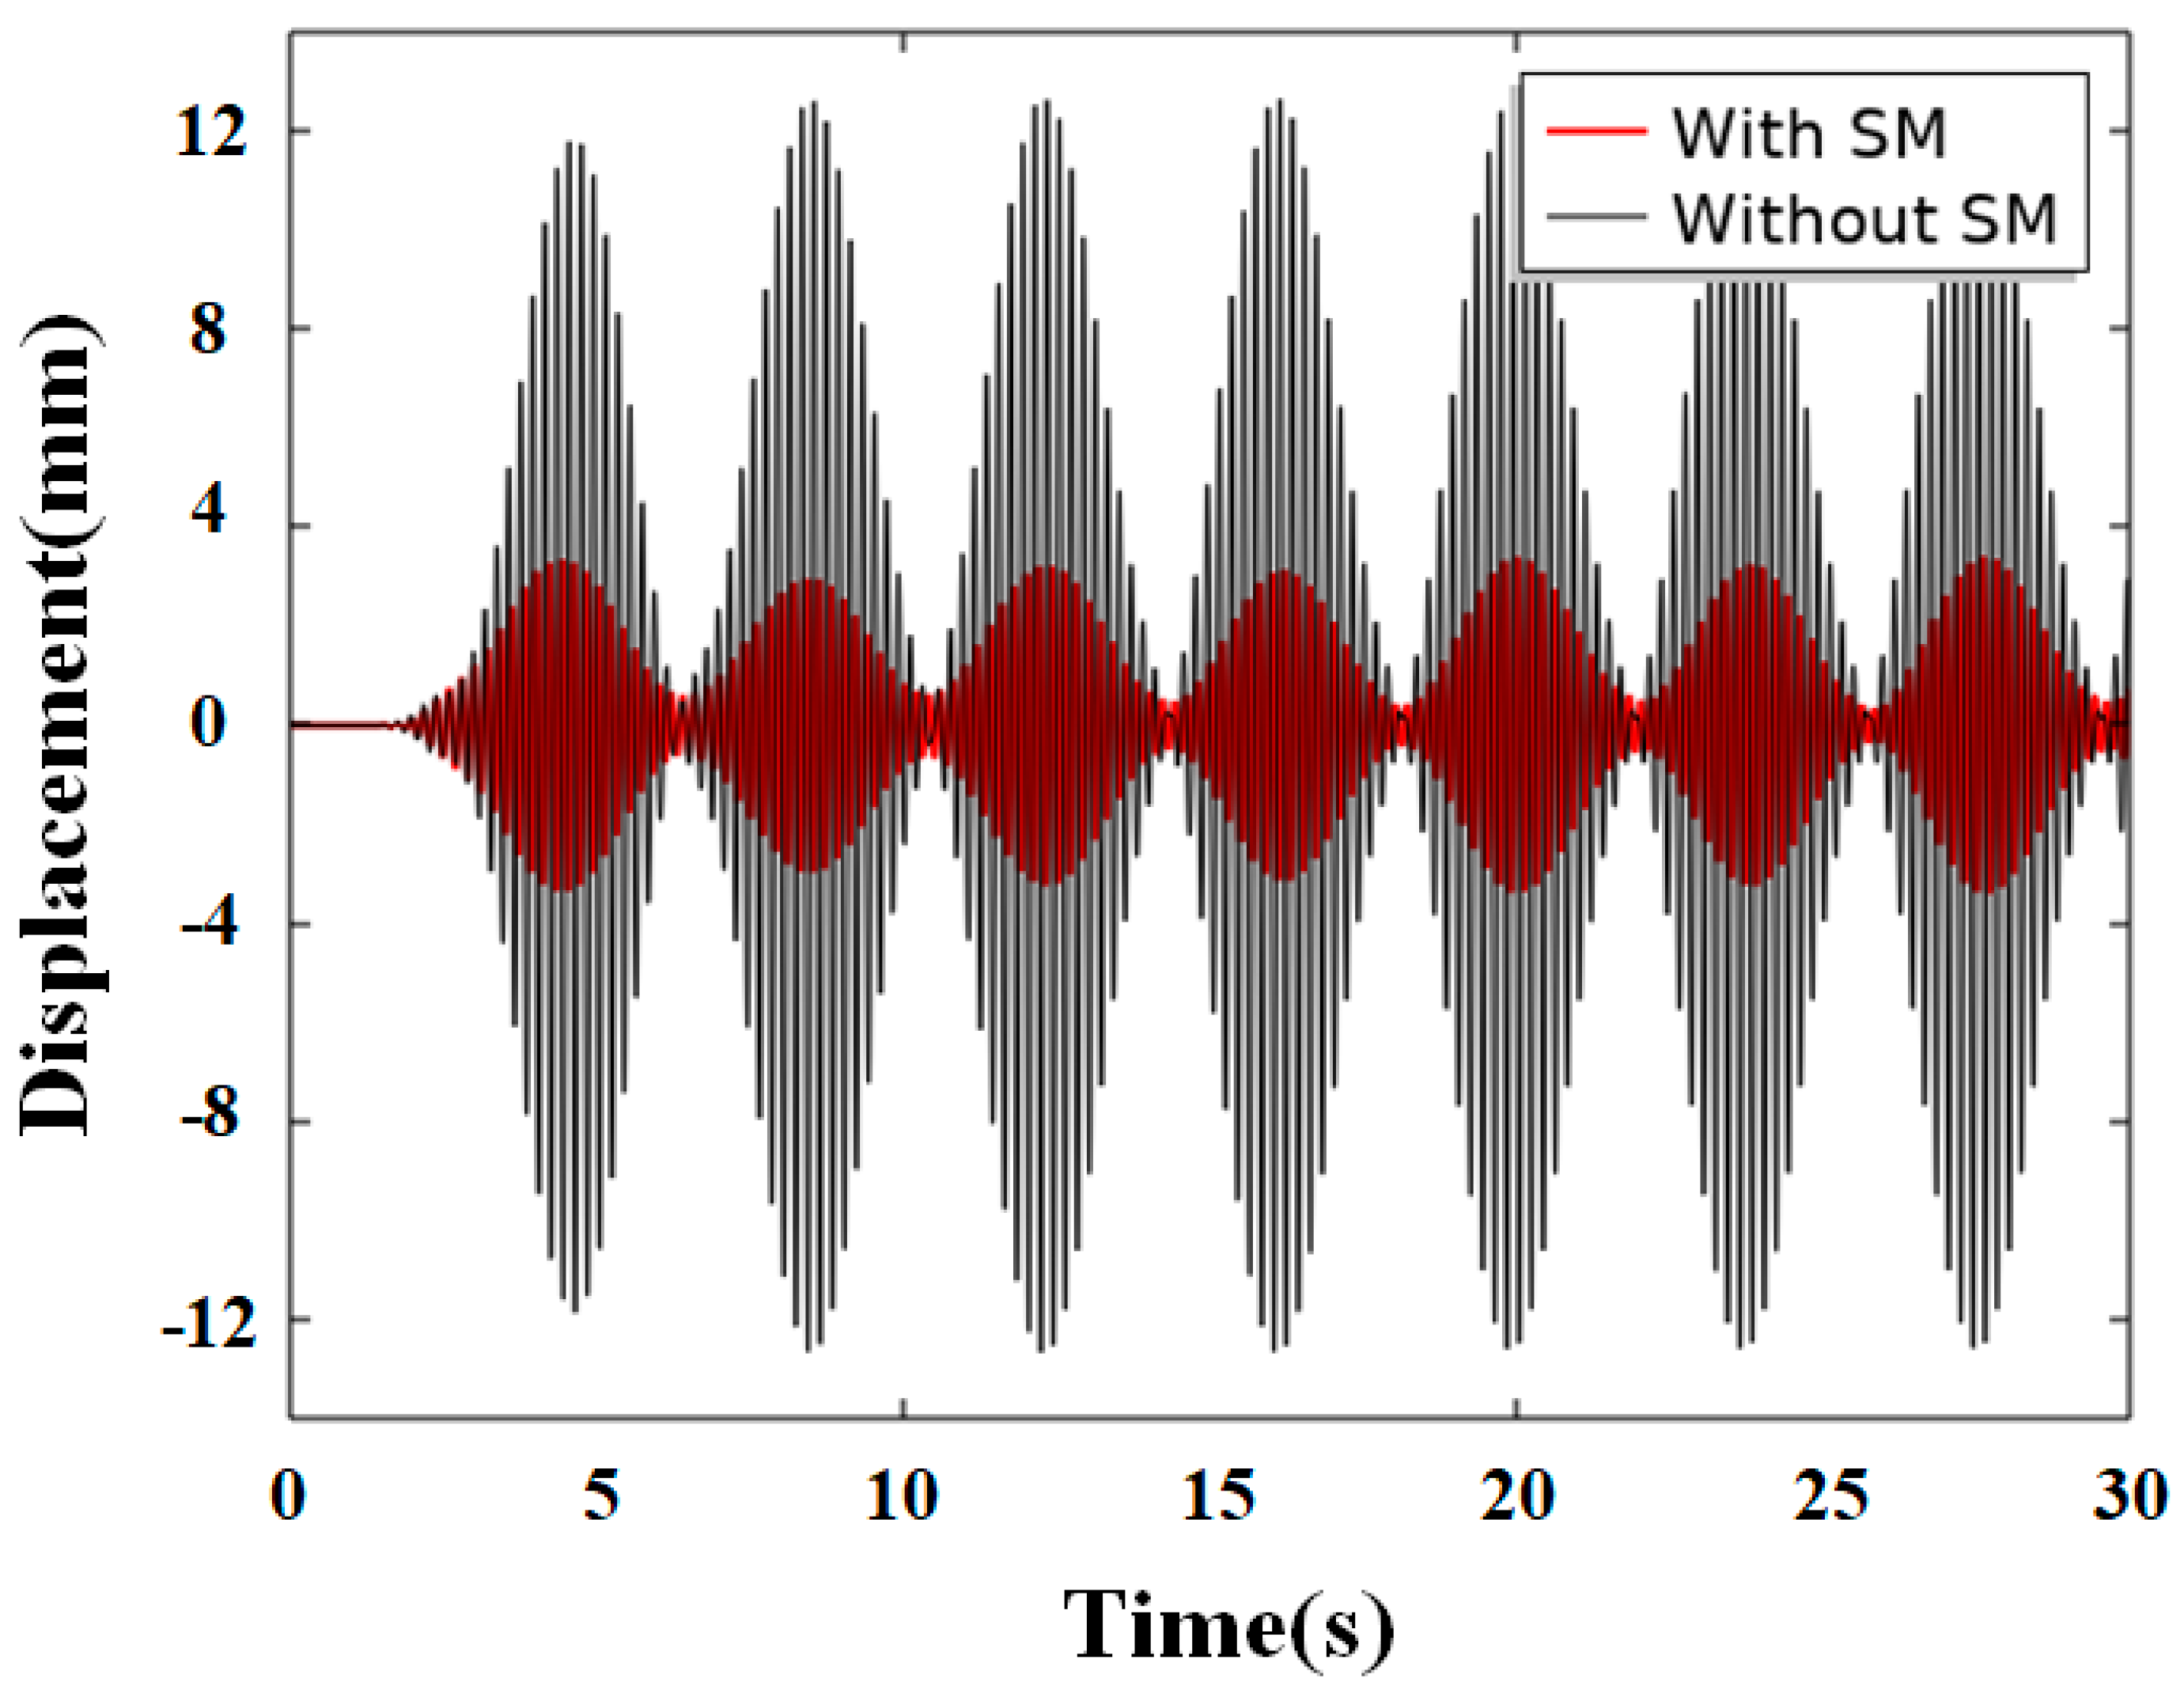
Figure 10.
Seismic excitation signal: (a) temporal variation; (b) frequency domain composition.
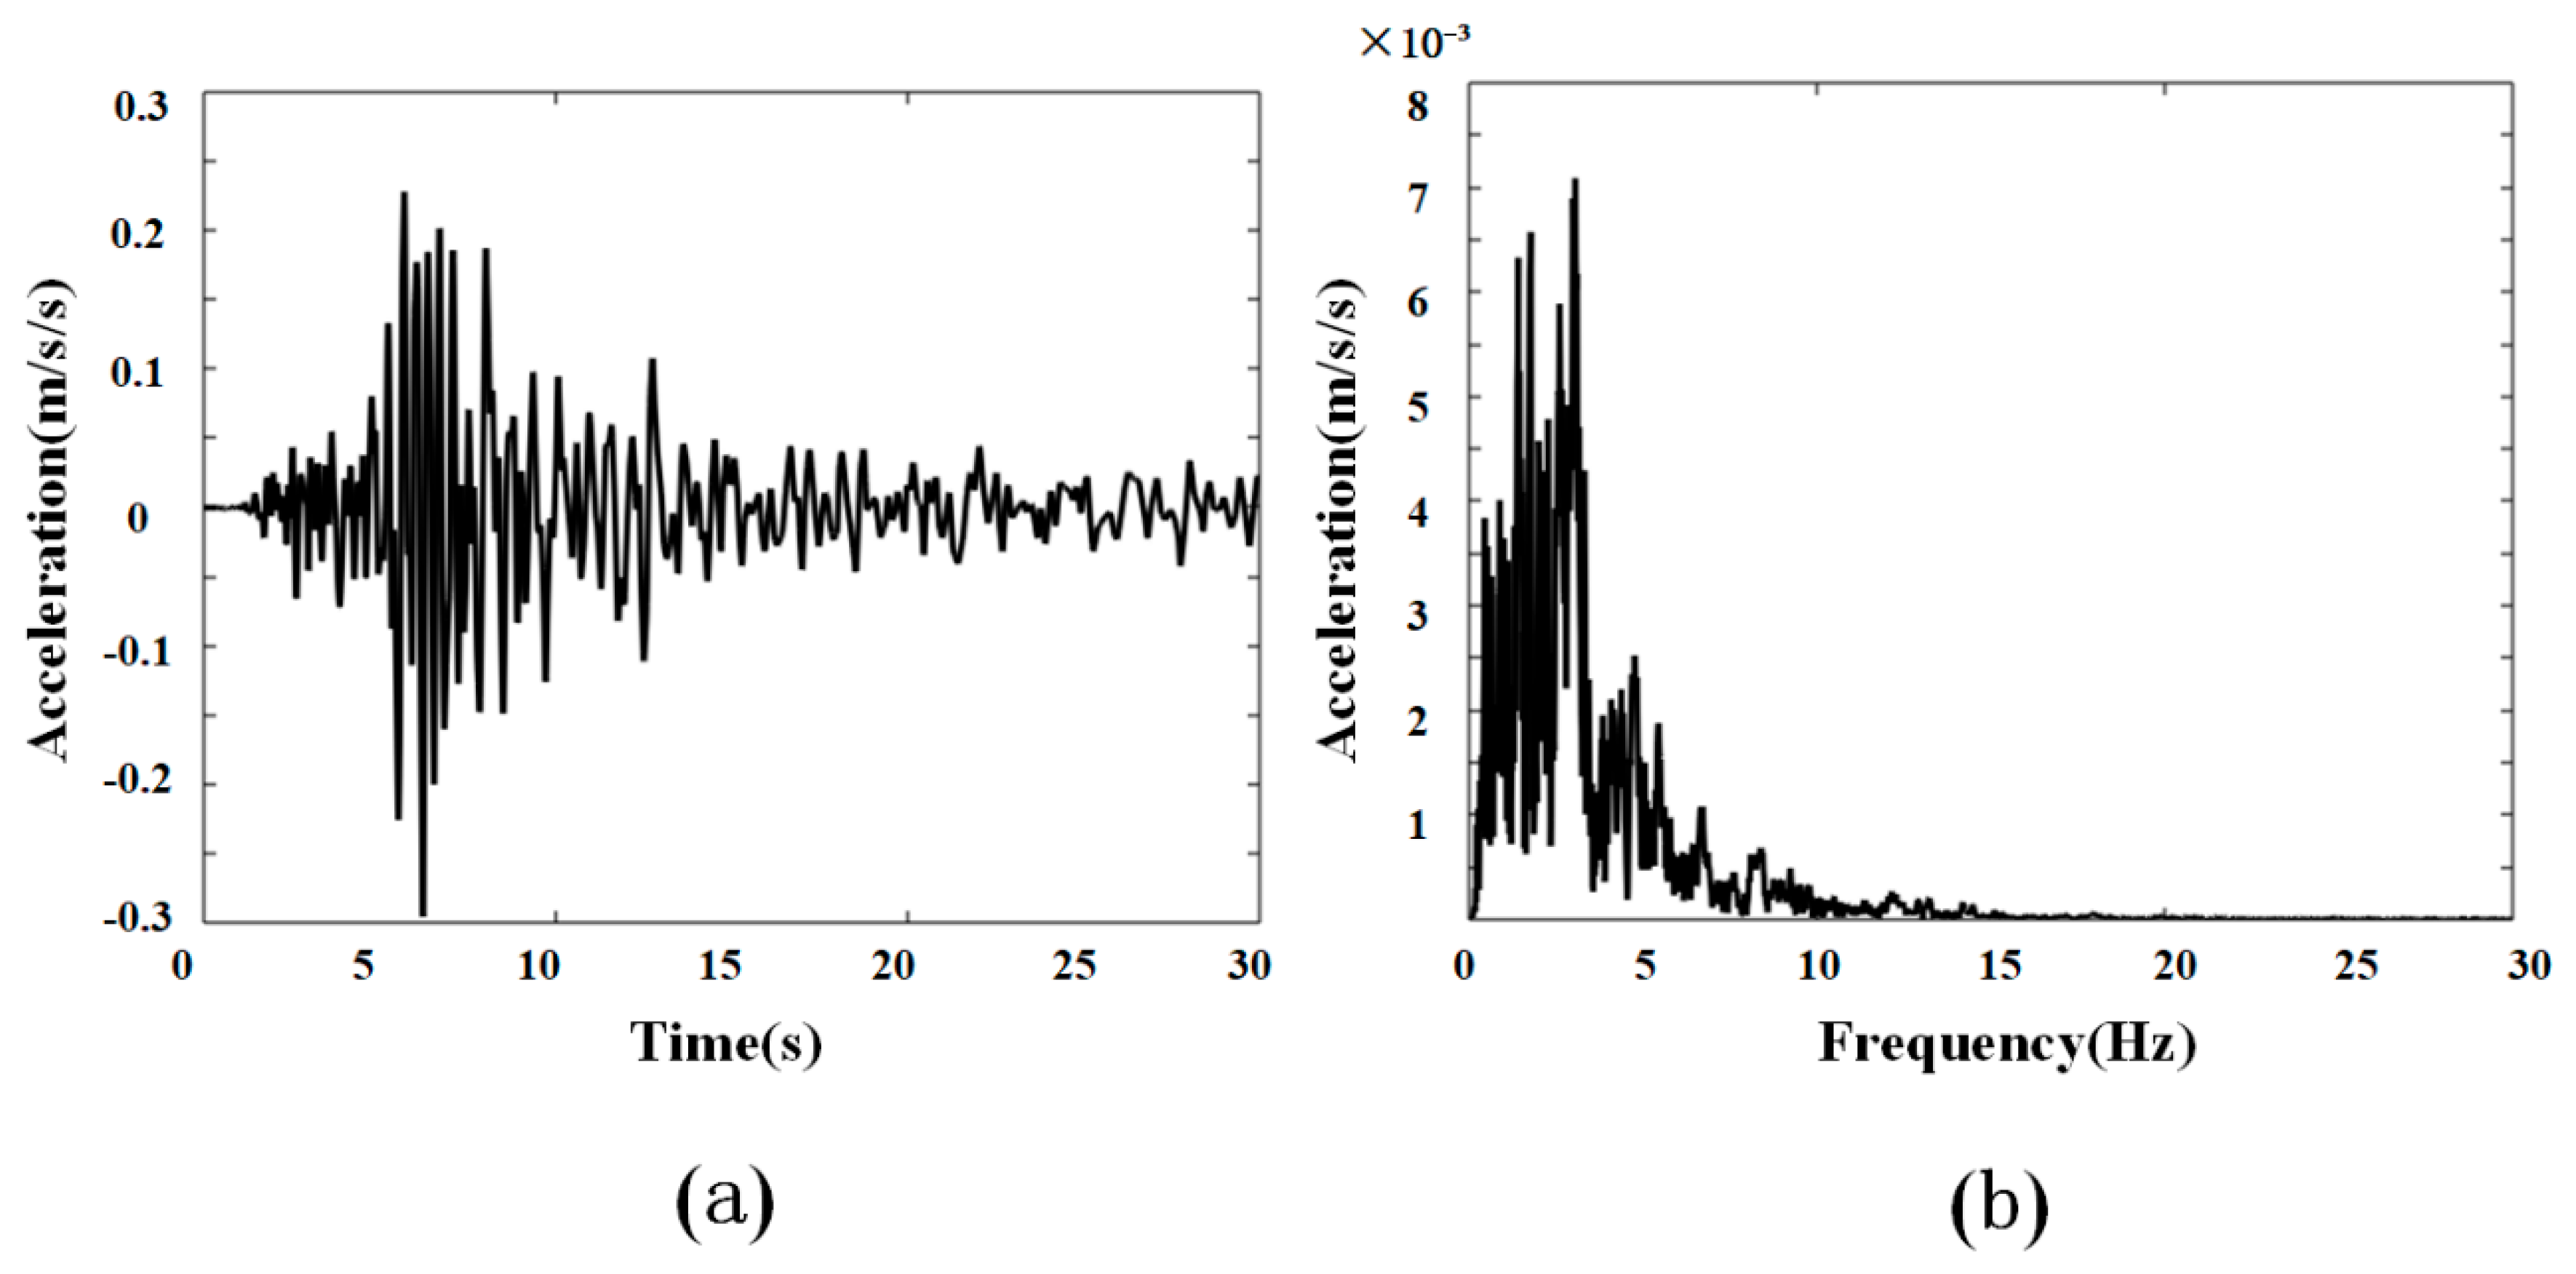
Figure 11.
Dynamic response of the excitation signal: (a) temporal response of the seismic wave; (b) spectral response of the seismic wave. The black curves represent cases without SM and the red ones depict results with SM attenuation.
Figure 11.
Dynamic response of the excitation signal: (a) temporal response of the seismic wave; (b) spectral response of the seismic wave. The black curves represent cases without SM and the red ones depict results with SM attenuation.
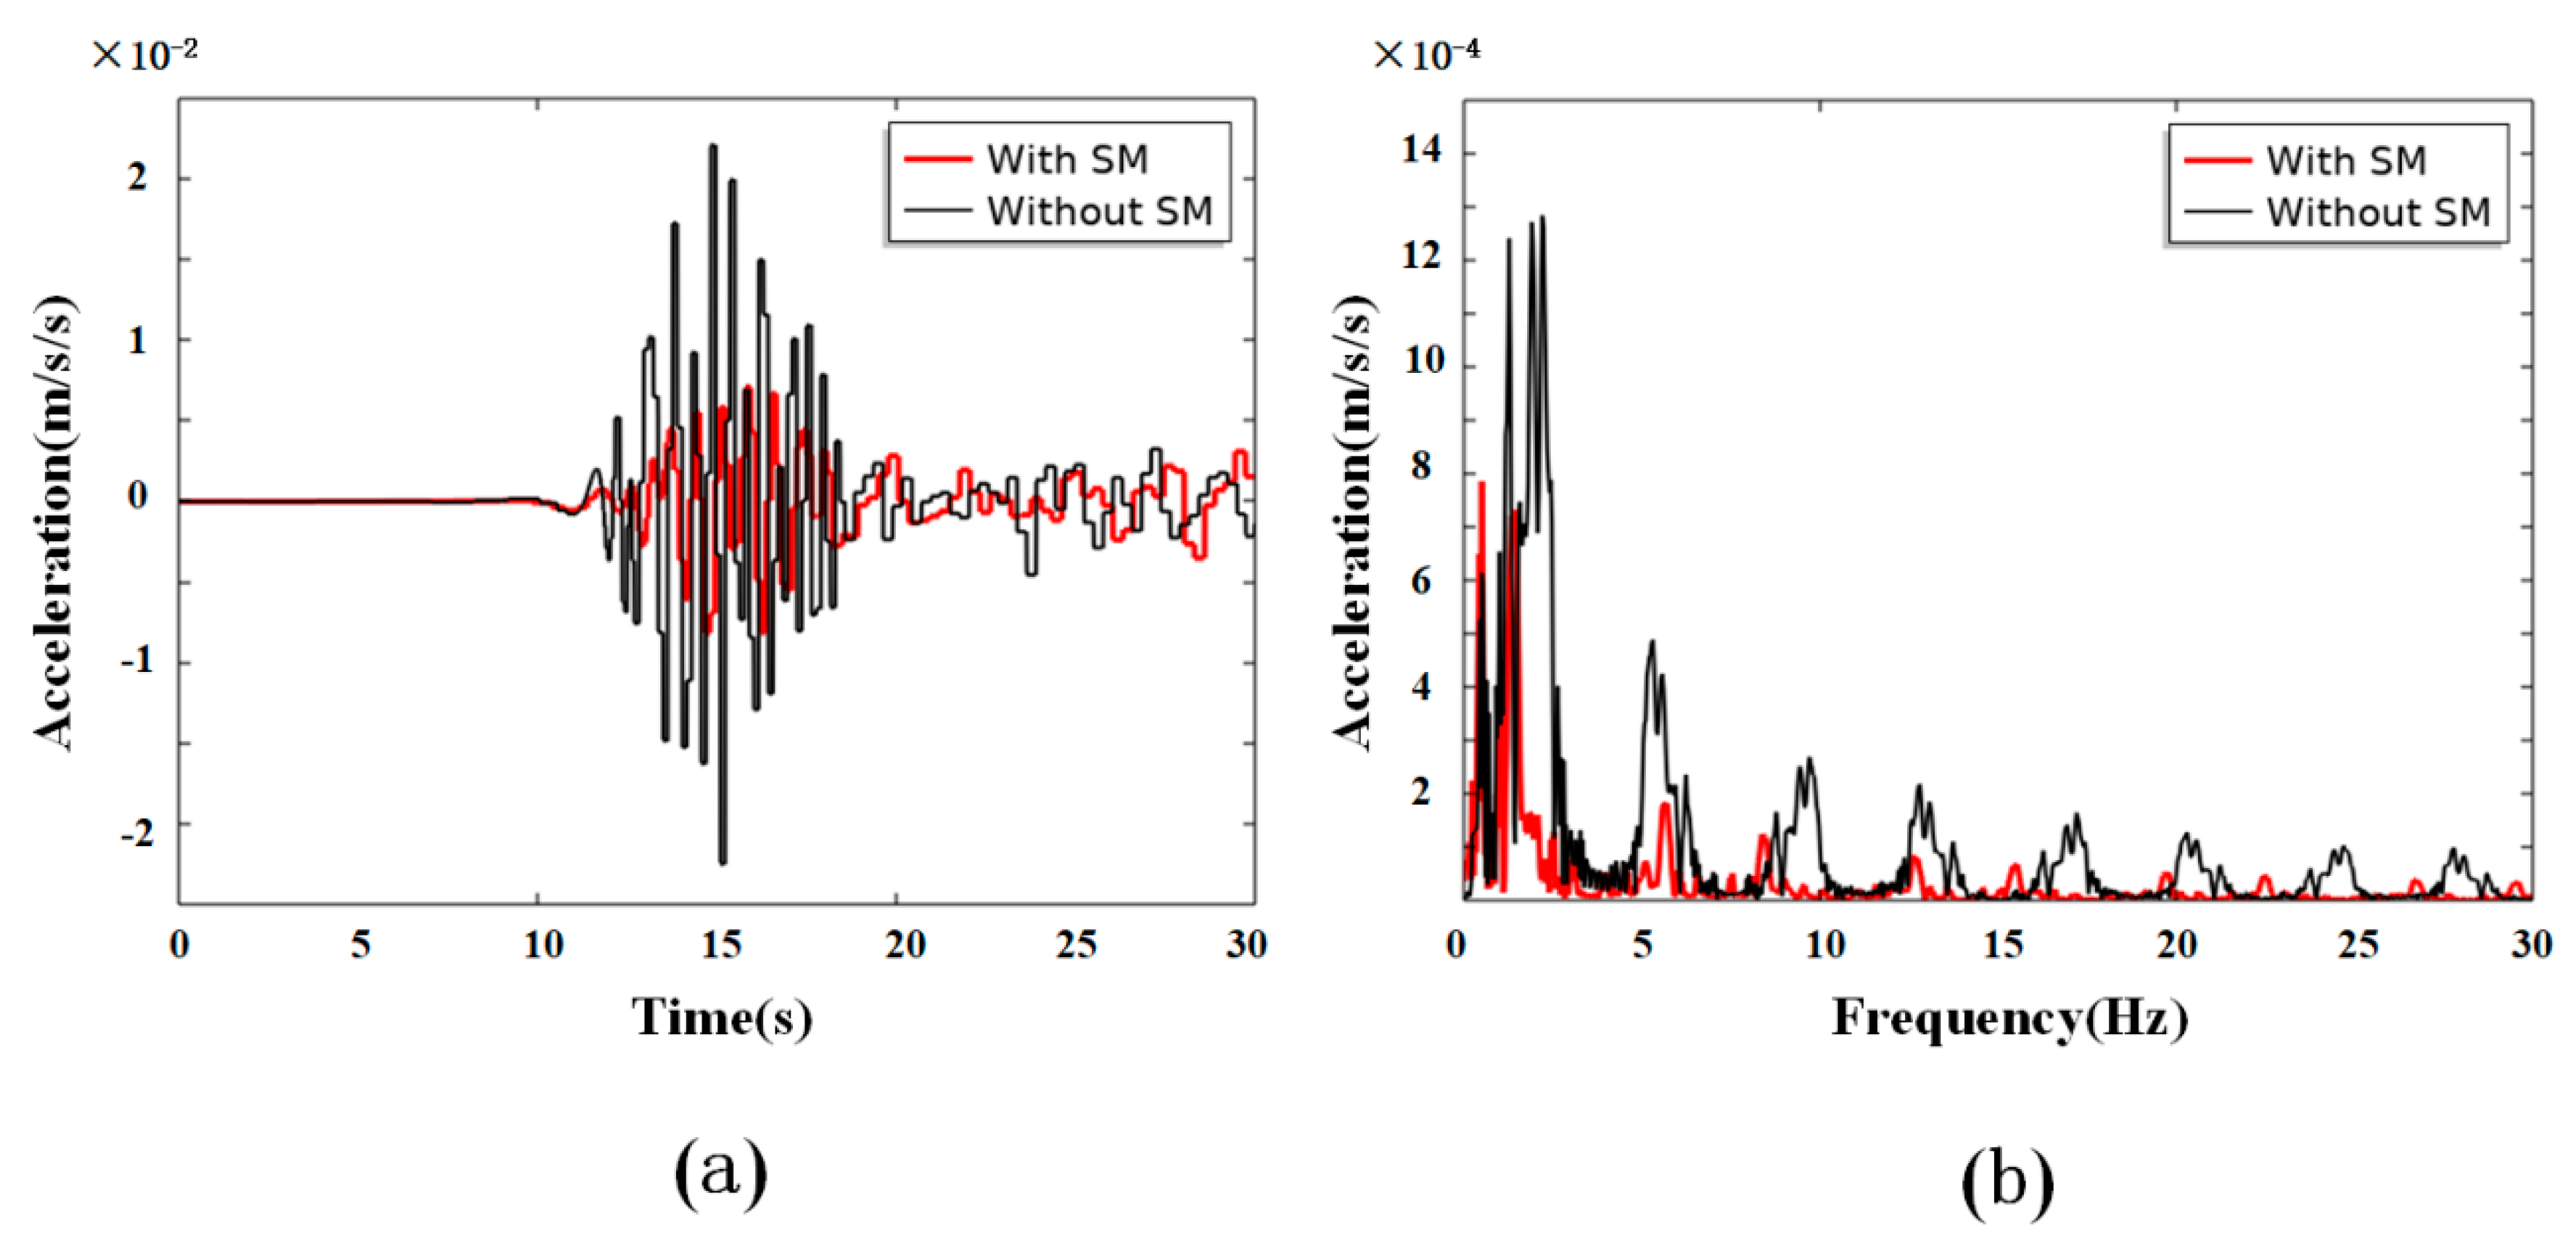
Figure 12.
Experimental setups. (a)Dimensions of a 1:100 reduced epoxy sample.(b)Installation of experimental equipment.(c)Arrangement of the samples.(d)Model for finite element simulation.
Figure 12.
Experimental setups. (a)Dimensions of a 1:100 reduced epoxy sample.(b)Installation of experimental equipment.(c)Arrangement of the samples.(d)Model for finite element simulation.
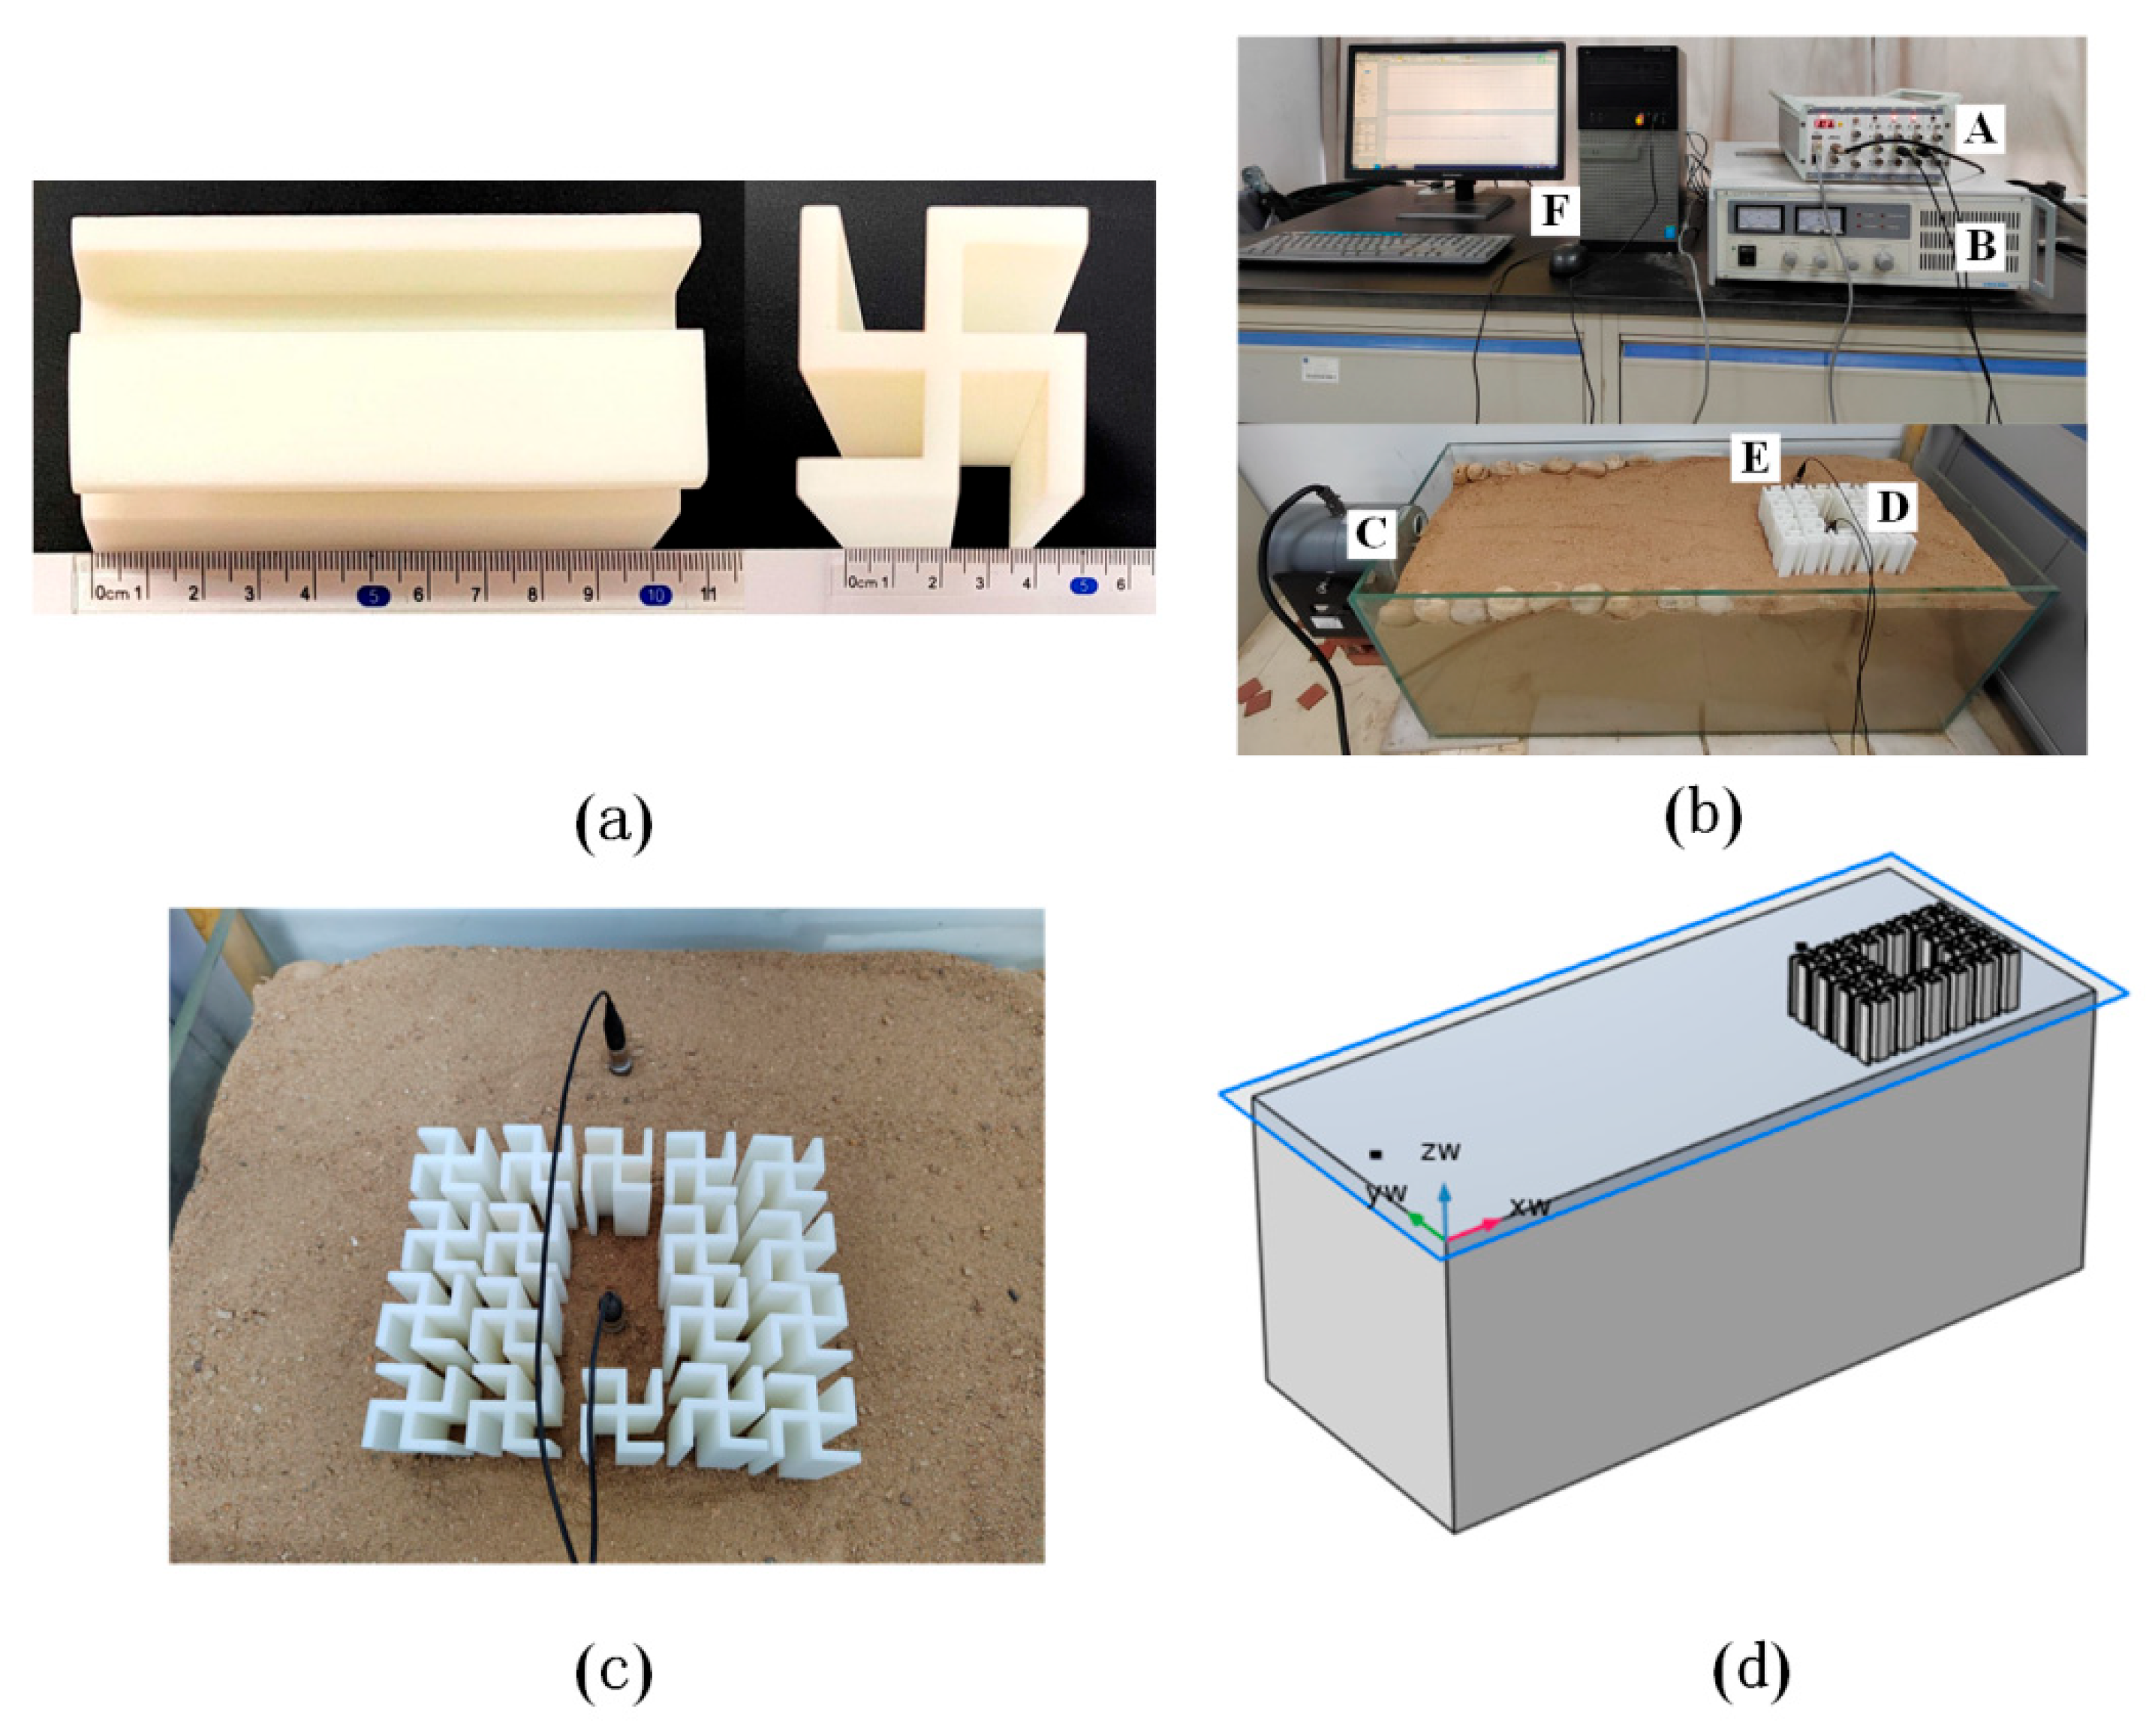
Figure 13.
Experimental results. The blue curve is the finite element simulation results and the red curve is the experimental results.
Figure 13.
Experimental results. The blue curve is the finite element simulation results and the red curve is the experimental results.
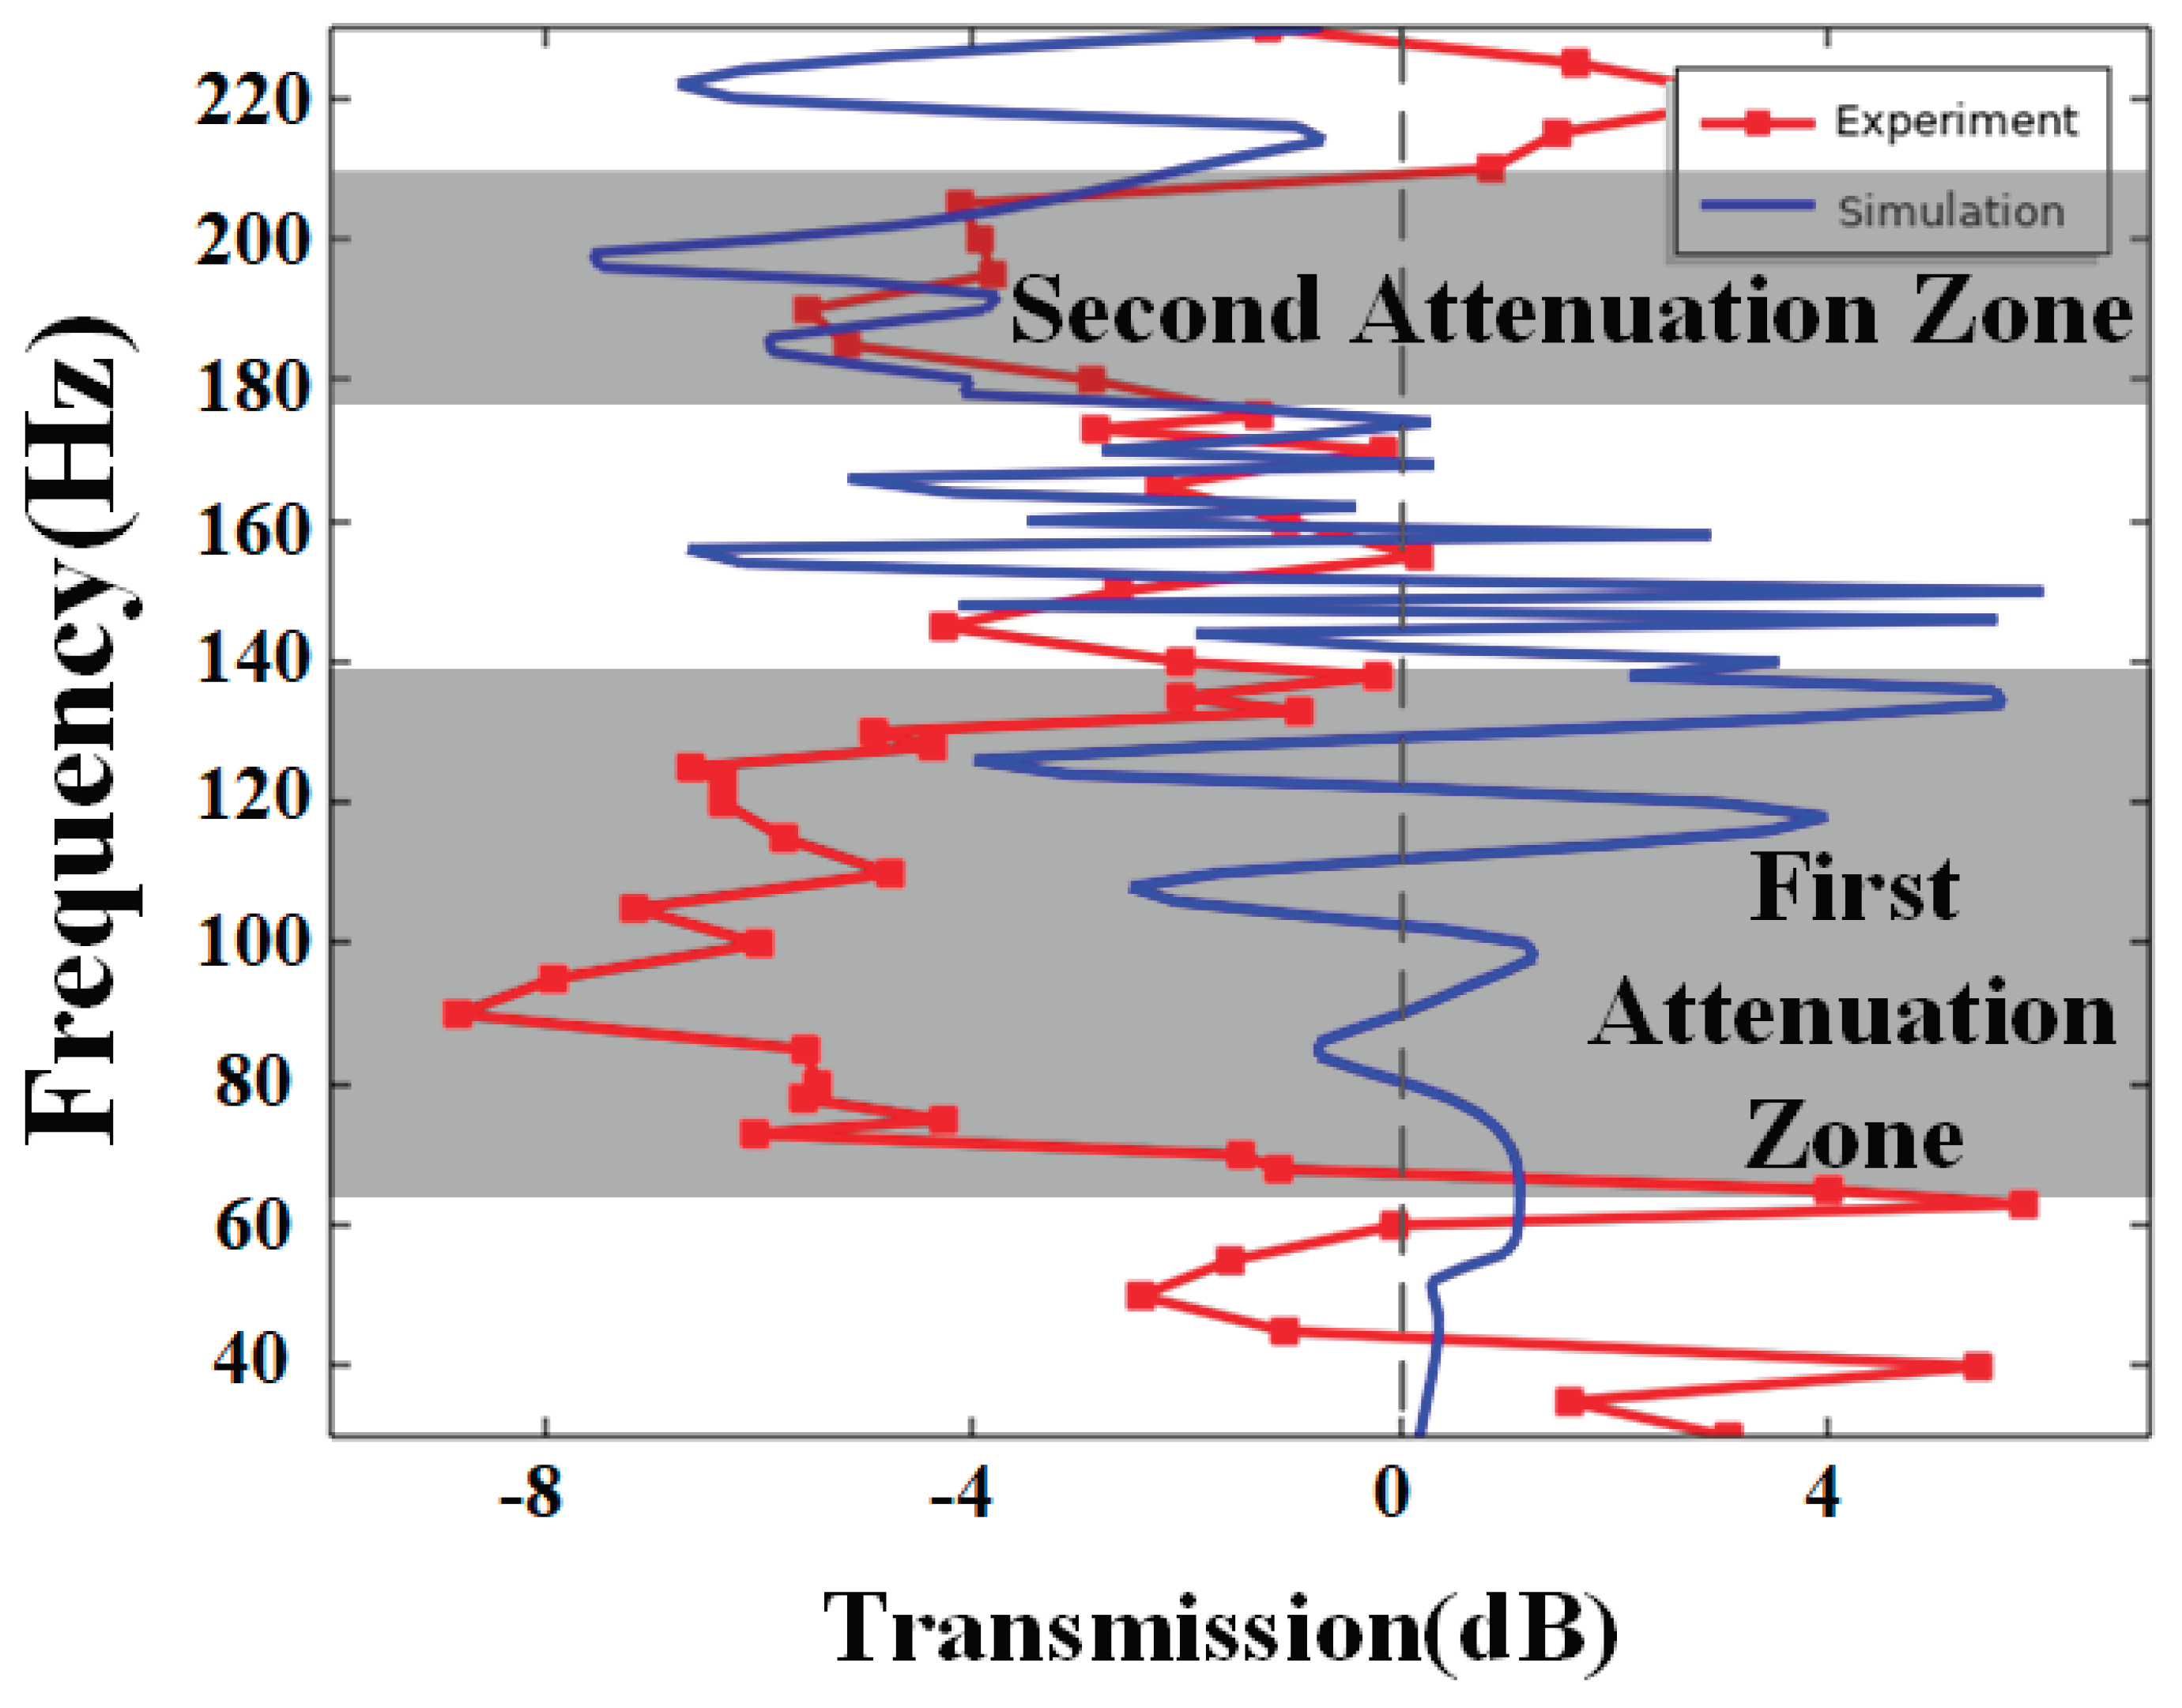

Table 1.
Material parameters of unit cell.
| Material | Density(kg/m3) | Young’s modulus(Pa) | Poisson’s ratio |
| steel | 7800 | 2.06×10¹¹ | 0.3 |
| soil | 1800 | 2×10⁷ | 0.3 |
Table 2.
Geometric parameters of unit cell.
| a(m) | b(m) | c(m) |
| 5 | 0.5 | 1.25 |
Disclaimer/Publisher’s Note: The statements, opinions and data contained in all publications are solely those of the individual author(s) and contributor(s) and not of MDPI and/or the editor(s). MDPI and/or the editor(s) disclaim responsibility for any injury to people or property resulting from any ideas, methods, instructions or products referred to in the content. |
© 2025 by the authors. Licensee MDPI, Basel, Switzerland. This article is an open access article distributed under the terms and conditions of the Creative Commons Attribution (CC BY) license (http://creativecommons.org/licenses/by/4.0/).
Copyright: This open access article is published under a Creative Commons CC BY 4.0 license, which permit the free download, distribution, and reuse, provided that the author and preprint are cited in any reuse.


