Submitted:
24 November 2025
Posted:
25 November 2025
You are already at the latest version
Abstract
Vaccines save lives, but only if they are available at health facilities for administration. Stockouts occur for various reasons, including inaccurate forecasting and resupply calculations. Population-based forecasts are typically used for immunization programs, yet are often based on inaccurate population estimates. This retrospective study analyzed available routine facility-level data from two districts in Mozambique to provide insights for improved supply chain management, including resupply decisions, at the facility level. Data from August to October 2023 were collected and analyzed for wastage rate, session cohort, and forecast accuracy. Results show that district-level wastage rates are nominally different from World Health Organization standards, while significantly different at the facility level. Analysis also showed divergence of vaccination doses provided to a session cohort during the month-long time period. Using population-based forecast for resupply methodology consistently undersupplied facilities, while using the number of doses of administered BCG as a proxy for the population provided a more accurate forecast with some chance of oversupply for a few vaccines. The results suggest an opportunity to shift from a one-size-fits-all approach to forecasting and resupply decisions, leveraging existing data systems, applying tailored wastage rates, and adjusting inventory management policies to ensure vaccine availability.
Keywords:
sustainable vaccine supply and procurement
; forecasting
; wastage rate
; immunization supply chain
1. Background
Immunization is one of the most cost-effective and beneficial health interventions to improve health and reduce vaccine-preventable diseases, particularly in young children [1]. Since the establishment of the Essential Program on Immunization (EPI) five decades ago, an estimated 154 million lives have been saved through vaccines [2]. While impressive increases in vaccine coverage have been made in the past decade worldwide, research has also identified a few standard causes of children being unvaccinated or under-vaccinated, including remoteness from and difficult access to health services, low education level or socioeconomic status of the mother or caregiver, low maternal use of health services, and health system factors such as vaccine stockouts at the health facility level [3,4].
Having a reliable supply of vaccines available at the service delivery point is critical to ensuring timely vaccine coverage. One study in South Africa found that 62% of missed vaccinations were due to stockouts at the facility level [5]. Additional studies have also shown the negative impacts of vaccine stockouts on coverage rates and trust in the health system [6,7]. As a global analysis of stockouts in 2017 in African countries shows, the frequency and degree of stockouts vary between and even within countries, with an estimated 50% of these countries reporting stockouts of at least one vaccine for at least one month at national and district levels [8], as well as notable stockouts at the facility level [9].
One reason noted for stockouts is inadequate forecasting and stock management, accounting for 18% of national and subnational stockouts in one global analysis conducted using data from 2011–2015 [10]. The World Health Organization (WHO) provides guidance on three methods to forecast vaccine needs: using the target population, previous consumption, or the size of the immunization sessions [11]. Most low- and middle-income countries typically use target population estimates as the main national level forecasting methodology, which can result in forecasting error, as it is well documented that target population estimates are often inaccurate [12,13,14].
The population-based forecasting method begins with population figures and applies multiplication of various assumptions to reach the total number of vaccines needed. The population figures are determined by demographic and age groups that are to receive immunizations, such as pregnant women, girls aged 9–14, infants, and surviving infants. Additional assumed factors include growth factors, EPI schedule, coverage rates per scheduled dose, and wastage rates. A 25% buffer stock is added to mitigate unpredictable variability in supply and demand.
Global standard vaccine wastage rates established by WHO are typically used as the standard to calculate vaccine need and are determined by characteristics of the vaccine (i.e., vial size, lyophilized versus liquid). These global standards may not reflect the nuances of country or regional immunization services. Planning tools, such as the WHO Wastage Rate Calculator [15], are available; however, they focus on national level estimates and thus miss the granularity of sub-national level differences. Furthermore, studies have shown the binomial nature of wastage rates and how rates can be calculated for facility-level open vial wastage, yet this relationship depends on session size, which is not readily available through reporting systems [16]. These standards, when applied as assumptions across the aggregate dataset, introduce errors and miscalculations for national forecasts. These errors and miscalculations are compounded as vaccines move through the supply chain, impacting resupply calculations for facility-level vaccine needs.
The challenge of inaccurate forecasts and target populations is particularly salient in settings characterized by infrequent censuses, demographic complexity, and resource constraints, such as in Mozambique. Mozambique has traditionally used the census population from the National Statistics Institute (INE in Portuguese), adjusted by estimated annual growth, as the basis of its forecast. Mozambique has recently introduced different methodologies for the national vaccine forecast [17]; however, this has yet to be fully adopted and applied at the sub-national or facility levels. Vaccine distribution typically follows a four-tier system from national to province, to district, and to health facilities, with some slight variations between provinces, using the standard INE population for the forecasts with wastage and buffer added. Anecdotally, health facilities obtain emergency top-ups between scheduled distribution cycles in the event of stockouts, but these top-ups are often not reflected in the information management system. Stockouts at the facility level are a common event [18,19]. While many factors influence stock availability at the facility level, using the target population to estimate vaccine need is likely a contributing factor.
In this context, this study analyzed available routine facility-level data in Mozambique in an effort to inform and provide insights for improved supply chain management, including resupply decisions, at the facility level.
2. Methodology
2.1. Study Design
This retrospective study used purposeful sampling to select two districts, Nhamatanda and Gorongosa, in Sofala Province, Mozambique, and included all health facilities in each district (22 and 20, respectively, at the time). These two districts were specifically selected for inclusion in this study due to their notable similarities in key socioeconomic indicators and similar health care infrastructure. According to INE 2024 estimates, both districts have similar population sizes (349,422 in Nhamatanda and 218,788 in Gorongosa) and comparable population distribution patterns of urban/rural ratios. A separate analysis for forecast accuracy was conducted in Gorongosa based on available HMIS data for 12 months.
2.2. Data Collection
Routine administrative data on service delivery and supply chain reporting were collected for three months (August to October 2023) from the government’s health information management system (HMIS) and the immunization logistics information management system (LMIS). Additional facility-level data were collected for the same time period, using stock cards of all vaccines, monthly facility reports on immunization activities, and daily summary sheets. Daily summary sheets track vaccines administered and vials opened each day and are used to aggregate data for the monthly facility reports. Target population estimates for each district were also obtained from INE. Table 1 provides details of data sources and data points collected.
A data collection plan was developed. Four research assistants were trained on the content and the data collection tool. This was followed by a pre-testing of the tool in two facilities. Adjustments of the tool were made based on the results of pre-testing. The facilities were informed about the study, and dates for the visit were scheduled. Each data collection team reported to a supervisor daily.
Data collection was conducted using SurveyCTO. Data were collected from the stock cards. Photos were taken of daily summary sheets, and data were input into SurveyCTO at a later time. The provincial team extracted LMIS and HMIS data for all facilities in the two provinces. Data were collected on all child vaccines and the EPI schedule based on the session cohort; HPV and tetanus were omitted because they target different populations (Table 2, Table 3).
2.3. Data Management and Analysis
Data were reviewed and cleaned before the analysis, including the elimination of facilities that did not have complete data sets for the time period or did not provide certain vaccines. For easy management, data were captured and analyzed in Excel, and results were presented in tables and graphs generated by both Excel and Tableau. Based on available data, the analysis considered three primary outcomes: wastage rate, session cohort, and forecast accuracy themes.
The first outcome was calculated wastage rates for each vaccine per facility using existing data in Gorongosa district only. Wastage is considered the vaccine doses that are consumed or used but not administered to a person.
The reported consumption data from the LMIS were compared to doses administered as reported through HMIS. What was consumed but not reported as an administered dose was calculated to be wastage, as in the calculation described here:
This calculation was done for each vaccine, month, and facility.
The analysis also calculated district-level wastage rate by averaging the various facility and monthly wastage rates into one representative district wastage rate. The calculated wastage rates by vaccine were compared to the global standards provided by WHO.
The analysis did not distinguish between closed-vial or open-vial wastages. Closed-vial wastage is often due to expiry, vial breakage, or exposure to extreme temperatures (heat or freezing), and open-vial wastage is often an inevitable part of immunization programs using multi-dose vials.
The second outcome considered the divergence of vaccines administered from the EPI schedule, as expected per the session cohort. The session cohort was defined by the age groups expected to receive the same number of vaccines per schedule and visit, aggregated for the month. For example, based on the EPI schedule in Mozambique, a two-month-old should receive one dose each of DPT, OPV, PCV, and rotavirus during the same visit. For this analysis, vaccine doses administered were compared to the other vaccines reported to be administered in their relevant session cohort by month. Divergence from the maximum scheduled doses in the session cohort implies missed opportunities to vaccinate and was correlated with reported stockouts at the end of each month.
Finally, the third outcome analyzed forecast accuracy in Gorongosa district for 12 months, comparing two methodologies for resupply calculations for the facility level: the traditional INE target population estimates as determined by census data and extrapolated for subsequent years, and the reported number of BCG doses administered the previous year as a proxy for the target population (infants), justified by a high BCG coverage rate and a relatively high adherence to first ante-natal care visits and facility-level births.
Secondary outcomes looked at completeness of reports, frequency of stockouts, and the number of children immunized in order to provide insight into the study setting and context.
Data collection and analysis procedures were coordinated and conducted with the immunization program of the Ministry of Health and the Provincial Directorate of Health.
3. Results
Data from the HMIS was collected for all facilities in the two districts for August to October 2023. LMIS data were collected only for Gorongosa district, as the LMIS had not yet been deployed in Nhamatanda. The time period covered was July to October to capture the beginning stock balance for August as reported at the end of July. Daily summary sheets were collected from 30 facilities, but the lack of data completeness prevented inclusion in this analysis. Stock data were collected from stock cards at the facility level, but it was not included in the analysis because it was often incomplete. For further analysis of forecast accuracy in Gorongosa, HMIS data from January to December 2023 were included in the data collection. For Gorongosa, 16 of 17 facilities had datasets for all usable sources for the duration of three months. Data collection was conducted in November and December 2023 (Table 4).
We reviewed the LMIS and HMIS data for the 16 facilities that reported to both systems for the three months. The calculated consumption data is very closely aligned with the reported consumption data in the LMIS. Results revealed that of the 480 instances (facilities by vaccines), there was a 74% match between “doses opened” in HMIS and doses consumed in LMIS; 6% were not matching, and 10% had one field left empty (Table 5).
Additionally, in Gorongosa, using zero stock at the end of a month as reported in LMIS to measure a stockout, an average of 32% of the vaccines and 27% of the facilities experienced a stockout, varying across vaccines between 13% to 41% (1st to 3rd quartile) and varying across facilities between 11% to 44% (1st to 3rd quartile) respectively. The duration of the stockouts is unknown. There were no reported national-level stockouts during the study period.
Figure 1 shows the total number of vaccines administered by facility, as reported in the HMIS, reflecting the variation in facility size and target populations.
3.1. Wastage Rate
To understand the feasibility of calculating wastage rates tailored to the facility and district levels, the reported consumption data from the LMIS were compared to doses administered as reported through HMIS. What was consumed but not reported as an administered dose was calculated as wastage. The analysis did not distinguish between closed-vial or open-vial wastage. Despite the inclusion of a designated field for reporting both open and closed vaccine vial wastage on monthly HMIS forms, the completeness of this data is consistently low and was not considered in this analysis.
Results show that average wastage rates (either calculated from site wastage rates or calculated from the total doses administered and consumed) at the district level using data from the facilities are nominally different from WHO standards for MR and IPV. Results are significantly different for BCG, OPV, DPT, Rota, and PCV, with the first having a higher calculated wastage rate and the rest showing lower calculated wastage rates (Figure 2). For BCG, the WHO standard guidance is to plan for a 50% wastage rate; however, the calculated wastage rate at the district level was 64%.
Particularly compelling insights emerged from reviewing the facility-level wastage rates, which indicated a large range of wastage rates across vaccines. For example, Figure 3 shows particularly high variability for the two lyophilized vaccines, BCG and MR, with BCG wastage rates ranging from 40% to 85% and MR ranging from 8% to 68%. Each dot represents a different facility and month, reflecting variability, local realities, and/or quality of reported data.
Session size, specifically the number of children attending a facility for vaccine services, is a key factor influencing wastage rates, especially for lyophilized vaccines. Figure 4 compares the wastage rate to the doses administered of that vaccine at the facility per month as a proxy for session size, since session size is not a readily available indicator. Logically, facilities with a lower volume of doses administered in a month (likely linked to smaller facilities or population targets) will result in higher wastage rates, particularly for BCG and MR. The outcomes (Figure 4) are similar to those previously identified in studies that have demonstrated this relationship between the birth cohort of the catchment area and the session frequency. Wastage rates in the negative indicate a gain in the system and are likely as a result of data quality issues.
3.2. Completeness of Recommended Vaccine Administration per Age Group, Session Cohort, and Schedule
To understand the extent of divergence from the EPI schedule for the session cohort, the analysis considered the number of doses administered in a session cohort by facility as reported in the HMIS for the facility level and compared with reported zero stock at the end of the month.
By reviewing the EPI schedule and using it to group the vaccination doses into a session cohort administered in a facility by month, inconsistencies were identified. For example, in a given month, if a two-month-old is to be vaccinated per the EPI schedule, they should receive their first doses of DPT, PCV, RV, and Polio. However, none of the facilities reported the same number of doses as expected per schedule and cohort. One example of this analysis of a single facility for the two-month-old cohort indicates 103 children were vaccinated with their first DPT dose in August (Figure 5). Despite the co-administration schedule, the analysis shows a divergence in the administration of the other vaccines slated for simultaneous delivery. We created a new calculation to capture the extent of this divergence by comparing the percentage difference of total doses administered of each vaccine in the session cohort from the maximum doses given per cohort/schedule. This divergence implies a missed opportunity to vaccinate, either in August or in a previous month.
Although the reason for the divergence is unknown, the analysis considered the extent of assumed stockouts based on zero stock reported at the end of the month via LMIS and the correlation to the missed opportunities to vaccinate (Figure 6). Results show that the extent of reported stockouts in a facility appears to be correlated with an increased divergence from maximum scheduled doses in a session cohort for all vaccines except MR. The exception for MR could be due to fewer instances for MR to be divergent from other vaccines since the first dose is only provided with PVC for 9 month olds, and the second dose is provided alone at 18 months.
3.3. Forecast Accuracy
The final analysis considered the forecast accuracy for the facility-level resupply decisions in Gorongosa district by comparing the traditional methodology of using target INE population estimates with a proxy population estimate derived from the average monthly number of administered doses of BCG. Forecast accuracy was estimated by calculating the difference between the number of doses administered to those projected by the two different estimates, divided by the selected forecast. For example, if 110 doses were administered, and the INE-based estimates forecasted for 100 doses, the resulting difference is 10/100 or 10% (under-forecasted). If the BCG-based estimates forecasted for 120 doses to be administered, the result for BCG would be -10/120 or -8.3% or (8.3% over-forecasted). Values above 0% would reflect an under-forecast, 0% as accurate, and below 0% as an over-forecast.
It is important to note that resupply decisions are not solely based on the projected number of doses to be administered. An allowance covers open-vial wastage; buffer stock is added to accommodate for distribution disruptions and inaccurate forecasts; and the final order takes into consideration what is in stock at the time of the order. Since wastage rates and buffer stocks are determined as a proportion of the demand forecast, this additional allowance was not part of the analysis of the forecast for demand of doses to be administered.
Results show that the BCG-based forecast provided on average 12% more doses than used for all months, facilities, and vaccines, and the INE-based forecasts provided on average 20% fewer doses than used for all months, facilities, and vaccines (Figure 7).
Reviewing the data by facility, fewer doses were forecasted using INE-based estimates (between 4% and 59% less) than what were actually administered (Figure 8). The excess in availability of doses that were administered was possibly due to beginning inventory stock, allowances for buffer stock and wastage rate included in planning, and possibly unaccounted for emergency top-ups between scheduled distributions. On the other hand, with the BCG-based forecasts, every facility would have, on average, over-forecasted (4–24%). Figure 8 shows an example of the range of both INE and BCG-based forecast errors by facility, where each dot represents the percent forecast error per vaccine per month.
Similarly, results viewed by vaccine (Figure 9) also show under-forecasts on average with INE-based population figures (between 10% to 42% less) and accurate to over-forecasts with BCG-based forecasts (0% to 21% more).
4. Discussion
Ensuring reliable vaccine availability at the health facility level is a requirement for the success of any immunization program. While numerous factors influence vaccine availability and use, including the accuracy of the national-level forecast, distribution logistics, cold chain functionality, and demand volatility, this study focuses on a single, pivotal aspect: the accuracy of resupply calculations and the possible connection to missed opportunities to vaccinate. We analyzed how optimizing these resupply calculations through more accurate wastage rates and tailored forecasts can improve planning to meet the actual demand for vaccines at the facility level and reduce the chances of missed doses. This analysis identified several aspects that can be improved in the forecasting and resupply process, as well as in priorities and management approaches for service delivery, particularly related to data collection.
It has been noted that national-level forecasting is one of the weakest aspects in public health supply chains [20]. The results of inaccurate national-level forecasts can be exacerbated throughout the levels of the supply chain, resulting in stockouts at the facility level, increasing the risk of unvaccinated children and higher disease burden, or overstock, leading to higher wastages and costs. Inaccuracies in national-level forecasts can create inefficiencies and disruptions in the supply chain, inequitable distribution of vaccines, loss of productivity due to managing the disruptions, and financial waste for vaccine procurement. These standard national forecasting practices are then replicated in resupply decisions at lower levels, leading to and exacerbating similar risks of under- or overstock and reactive management of these situations. More accurate forecasts and resupply decisions can lead to a more efficient and resilient vaccine supply chain, mitigating the risks of both stockouts and costly oversupply.
This analysis demonstrates how using INE estimates of target populations for re-supply decisions consistently under-supplies the facilities as compared to the true vaccine need based on the actual consumption, which should incorporate demand for doses administered and wastage. Our analysis shows that additional children were still vaccinated, even if facilities were under-supplied, which was likely mitigated by buffer stock, lower wastage rate than was planned for, and presumably emergency top-ups or interfacility sharing. Supply chain best practices suggest that buffer stock should not be considered part of the forecastable demand and is meant to mitigate variability in both demand and supply. However, this analysis shows that for the immunization program in Mozambique, buffer stock is likely being used to address the demand resulting from under-forecasts. This results in constraints and other workarounds to ensure vaccine availability when the buffer stock is not rightly calculated to address an uptake in demand or delays in supply delivery. More accurate forecasts would reduce the reliance on and volume of buffer stock and could contribute to a higher number of children being vaccinated with fewer stockouts and workarounds.
Using BCG as a proxy target population resulted in improved forecast accuracy, with some possibility of overstock. This may be a situation unique to this specific district or even to Mozambique due to relatively high facility-based births and high adherence to BCG for newborns. However, these results do make the case for using alternative forecasting methodologies to average out biases and errors, provide complementary information, leverage diverse data types, and improve the accuracy of the final forecast.
The other aspect of an accurate forecast is having accurate wastage rates. Quite logically, facilities that serve smaller populations had higher wastage rates, particularly for BCG and MR. This commonly occurs in immunization programs, and resupply quantities to these facilities should be adjusted accordingly. The WHO global standards for wastage rates have been the common guidance since the establishment of immunization programs, when the requisite data were not available for calculating accurate wastage rates. The global standards served a purpose, yet with mature data information systems and modern analytics now available, immunization programs can more accurately calculate wastage rates for a tailored benchmark that reflects the reality of different health facilities and their communities [21].
An additional area for improvement is a better understanding of losses and adjustments. The logistics system in Mozambique, like in many countries, does not easily allow for reporting of losses and adjustments to record closed-vial wastage in the system. If losses and adjustments were part of reporting forms and designed to be easily used by staff, the closed-vial wastage rate could be calculated using the losses and adjustments field, and the wastage rates identified in this analysis would be representative of open-vial wastage only. With that insight, both open- and closed-vial wastages could be easily identified and addressed with different interventions.
The analysis related to session cohorts and missed opportunities identifies some gaps in service delivery through the divergence in the administration of vaccines in a session cohort, or possibly poor data quality practices in reporting, as suggested by monthly reports. There are many reasons why a child does not receive a vaccine according to the schedule, such as failure to screen for eligibility, vaccine hesitancy, or stockouts, as corroborated by our results. Analyzing the data from a monthly aggregation to compare the vaccines that should be received by session cohort provides insight into the possible relationship between missed doses and stockouts. While the analysis does not provide a definitive explanation for the divergence, in the absence of daily reports or true session size, this methodology can serve as a diagnostic tool that guides supervisors in identifying and addressing the underlying factors affecting performance and areas for follow-up with health care providers. Further study using this methodology is warranted to incorporate more robust statistical analysis and a larger dataset to more definitively quantify the impact of stockouts on missed opportunities to vaccinate.
This analysis demonstrates that while existing data and information management systems are available, their full potential is not being realized to address modern challenges in managing immunization programs and supply chains. Data completeness presented a challenge, particularly with the daily summary sheets and stock cards and their use in verifying LMIS and HMIS data. However, the analysis used data from the HMIS and LMIS, demonstrating that monitoring of immunization services can be achieved with these sources. This finding suggests that there are possibilities to streamline the routine data collection process to minimize resource use and reduce the administrative load on health personnel. Results showed a relatively high match between the LMIS and HMIS data reporting doses opened, indicating decent data quality with room for continuous improvement. Practical experiences show that consistently using and reviewing data will lead to quality improvements as routine analysis helps to identify and correct errors, inconsistencies, and gaps [22,23]. The absence of robust feedback loops for facility-level monthly reports may contribute to underreporting. When health workers lack visibility into how their submitted data is used for decision-making, resource allocation, and stock monitoring, the perceived value of accurate and timely reporting diminishes, thus weakening the incentive for consistent and thorough documentation.
In conclusion, this unique analysis challenges standard one-size-fits-all approaches to vaccine program management that have been the norm for decades by demonstrating that existing data, when analyzed with innovative methods, can provide nuanced and actionable insights. It makes the case for strengthening information systems at all levels of immunization programs and supporting more mature programs by using existing data sources in different and unique ways. The analysis suggests that applying tailored wastage rates to the facility level and using alternative and multiple methodologies for forecasting and resupply calculations could improve forecast accuracy, reserve buffer stock for their intended use, contingencies inherent in a supply chain, and thereby increase vaccine availability. We have demonstrated the importance of reviewing each part of the forecast equation that determines how much product is stocked—the demand (e.g., accurate population estimates and appropriate forecasting methodologies), tailored wastage rates, and inventory policies (e.g., buffer stock)—and fine-tuning as data allow.
By combining transactional data reported in the LMIS and HMIS for analysis at the facility level, this approach successfully identifies service delivery gaps (e.g., missed opportunities for vaccination), allows for more accurate supply chain decisions (e.g., through using tailored wastage rates), identifies possible errors in quality data reporting, and provides insight into the link between session cohorts and doses administered. These findings suggest that further research with a larger volume of data and across multiple countries would be beneficial to validate the results and revise standard methods of data use for improved insights.
Ultimately, this work illustrates a path forward for immunization programs to leverage their maturing data systems, transforming existing information from a passive record into a dynamic asset for more accurate forecasting and resupply calculations. This shift from reactive reporting to proactive, data-driven decision-making is essential for ensuring reliable vaccine availability and sustainable vaccine supply and procurement.
5. Limitations
Our findings have a number of important limitations to consider when interpreting results. Data were inconsistent and incomplete across data sources. The analysis can not determine any distinction between open- versus closed-vial wastage, which is an important distinction for vaccine management. Additionally, no data were available on emergency top-ups of stock between distribution cycles, emergency orders, or interfacility transfers, which creates a challenge in determining true, real-time stock levels at the facilities. The sample in this analysis comes from only two districts in Mozambique and may not be generalizable to other areas or countries. Future implementation research and quality improvement approaches should be undertaken to gain a broader data set for further analysis. Notwithstanding these limitations, we believe that the current findings demonstrate the potential for a new data-driven framework to enhance supply chain management, thereby justifying subsequent exploration and validation.
Informed Consent
Informed consent was obtained from all individuals who participated in data collection activities involving direct human interaction.
Data availability
Data is available upon request from the corresponding author with all facility identifier information removed.
Author Contributions
Conceptualization: W.P. Methodology: W.P and L.A. Formal Analysis: L.A. and W.P. Validation: S.S and T.R. Data Collection and Cleaning: S.S. and T.R. Writing – Original Draft Preparation: W.P. Writing – Review & Editing: L.A.; W.P. Data Visualization: L.A.
Funding
This study was conducted as part of the Immunization Collaborative Supply Planning Strengthening project, funded by the Gates Foundation, (Grant Number INV-060578), and partly supported by the Gavi Supply Chain Strengthening project (HSIS 12145 11 22).
Institutional Review Board Statement
This work was determined to be exempt from the requirement for IRB review under the applicable guidance for research involving the analysis of publicly available data or existing data sources that do not contain private, identifiable information.
Acknowledgments
Authors greatly appreciate the Ministry of Health of Mozambique and the Essential Program on Immunization for being part of this study and their commitment to continuous improvement of immunization activities. Particular thanks go to the Provincial Health Department of Sofala Province.
Conflicts of Interest
The authors declare no conflict of interest. The funders had no role in the design of the study; in the collection, analyses, or interpretation of data; in the writing of the manuscript, or in the decision to publish the results.
References
- Bloom, D.E.; Canning, D.; Weston, M. The Value of Vaccination. Adv. Exp. Med. Biol. 2011, 697, 1–8. [Google Scholar] [CrossRef] [PubMed]
- Shattock, A.J.; Johnson, H.C.; Sim, S.Y.; et al. Contribution of Vaccination to Improved Survival and Health: Modelling 50 Years of the Expanded Programme on Immunization. Lancet 2024, 403, 2307–16. [Google Scholar] [CrossRef] [PubMed]
- Utazi, C.E.; Pannell, O.; Aheto, J.M.K.; et al. Assessing the Characteristics of Un- and under-Vaccinated Children in Low- and Middle-Income Countries: A Multi-Level Cross-Sectional Study. PLOS Glob. Public Health 2022, 2, e0000244. [Google Scholar] [CrossRef]
- Nnaji, C.A.; Wiysonge, C.S.; Adamu, A.A.; et al. Missed Opportunities for Vaccination and Associated Factors among Children Attending Primary Health Care Facilities in Cape Town, South Africa: A Pre-Intervention Multilevel Analysis. Vaccines 2022, 10, 785. [Google Scholar] [CrossRef]
- Burnett, R.J.; Mmoledi, G.; Ngcobo, N.J.; et al. Impact of Vaccine Stock-Outs on Infant Vaccination Coverage: A Hospital-Based Survey from South Africa. Int. Health 2018, 10, 376–81. [Google Scholar] [CrossRef]
- Sato, R.; Thompson, A.; Sani, I.; et al. Effect of Vaccine Direct Delivery (VDD) on Vaccine Stockouts and Number of Vaccinations: Case Study from Bauchi State, Nigeria. Vaccine 2021, 39, 1445–51. [Google Scholar] [CrossRef] [PubMed]
- Gooding, E.; Spiliotopoulou, E.; Yadav, P. Impact of Vaccine Stockouts on Immunization Coverage in Nigeria. Vaccine 2019, 37, 5104–10. [Google Scholar] [CrossRef] [PubMed]
- Iwu, C.J.; Ngcobo, N.; Jaca, A.; et al. A Systematic Review of Vaccine Availability at the National, District, and Health Facility Level in the WHO African Region. Expert. Rev. Vaccines 2020, 19, 639–51. [Google Scholar] [CrossRef] [PubMed]
- Kanja, L.W.; Karimi, P.N.; Maru, S.M.; et al. Factors That Affect Vaccines Availability in Public Health Facilities in Nairobi City County: A Cross-Sectional Study. Pan Afr. Med. J. 2021, 38, 72. [Google Scholar] [CrossRef] [PubMed]
- Lydon, P.; Schreiber, B.; Gasca, A.; et al. Vaccine Stockouts around the World: Are Essential Vaccines Always Available When Needed? Vaccine 2017, 35, 2121–2126. [Google Scholar] [CrossRef] [PubMed]
- World Health Organization. Mid-Level Management Course for EPI Managers: Module 8, Vaccine Management; World Health Organization: Geneva, 2017; Available online: https://www.afro.who.int/sites/default/files/2018-03/block%203%20module%208%20-%20web.pdf.
- Brown, D.W.; Burton, A.H.; Gacic-Dobo, M.; et al. A Comparison of National Immunization Programme Target Population Estimates with Data from an Independent Source and Differences in Computed Coverage Levels for the Third Dose of DTP Containing Vaccine. WJV 2014, 4, 18–23. [Google Scholar] [CrossRef]
- Brown, D.W.; Burton, A.H.; Feeney, G.; et al. Avoiding the Will O’ the Wisp: Challenges in Measuring High Levels of Immunization Coverage with Precision. WJV 2014, 4, 97–99. [Google Scholar] [CrossRef]
- Brown, D.W.; Feeney, G.; Burton, A.H. Raising Awareness Among Immunization Programme Managers to the Potential Bias Resulting from the Application of Fixed Factors to Obtain Target Population Size Estimates. TOPGHJ 2012, 5, 15–18. [Google Scholar] [CrossRef]
- World Health Organization. Vaccines Wastage Rate Calculator; World Health Organization: Geneva; Available online: https://docs.google.com/document/d/1_Q0eOwhJi_VPqKGaRGenmsh9AAArChGppHtAzmsVnA4/edit?tab=t.0. Accessed 08/15/2025.
- Colrain, P.; Chang Blanc, D.; Grundy, J.; Kone, S. The binomial nature of immunization session size distributions and the implications for vaccine wastage. Vaccine 2020, 38, 3271–3279. [Google Scholar] [CrossRef] [PubMed]
- John Snow Inc. Mozambique Case Study: Maturing the Annual Forecasting Process; JSI: Washington, DC, 2024; Available online: https://publications.jsi.com/JSIInternet/Inc/Common/_download_pub.cfm?id=26227&lid=3. Accessed 08/15/2025.
- Powelson, J.; Magadzire, B.P.; Draiva, A.; et al. Determinants of Immunisation Dropout among Children under the Age of 2 in Zambézia Province, Mozambique: A Community-Based Participatory Research Study Using Photovoice. BMJ Open 2022, 12, e057245. [Google Scholar] [CrossRef] [PubMed]
- Magadzire, B.P.; João, G.; Bechtel, R.; et al. Reducing Missed Opportunities for Vaccination in Mozambique: Findings from a Cross-Sectional Assessment Conducted in 2017. BMJ Open 2021, 11, e047297. [Google Scholar] [CrossRef]
- Subramanian, L. Effective Demand Forecasting in Health Supply Chains: Emerging Trend, Enablers, and Blockers. Logistics 2021, 5, 12. [Google Scholar] [CrossRef]
- Akhlaghi, L.A.; Prosser, W. Vaccine wastage through a new lens: improving estimates through analytics. Vaccine Insights 2025, 4, 249–256. [Google Scholar]
- Nutley, T.; Reynolds, H.W. Improving the use of health data for health system strengthening. Glob. Health Action 2013, 6. [Google Scholar] [CrossRef] [PubMed]
- Loshin, D. The Practitioner’s Guide to Data Quality Improvement 2010; Elsevier.
Figure 1.
Total number of vaccines administered by facility, July–Oct. 2023 (Source: HMIS).
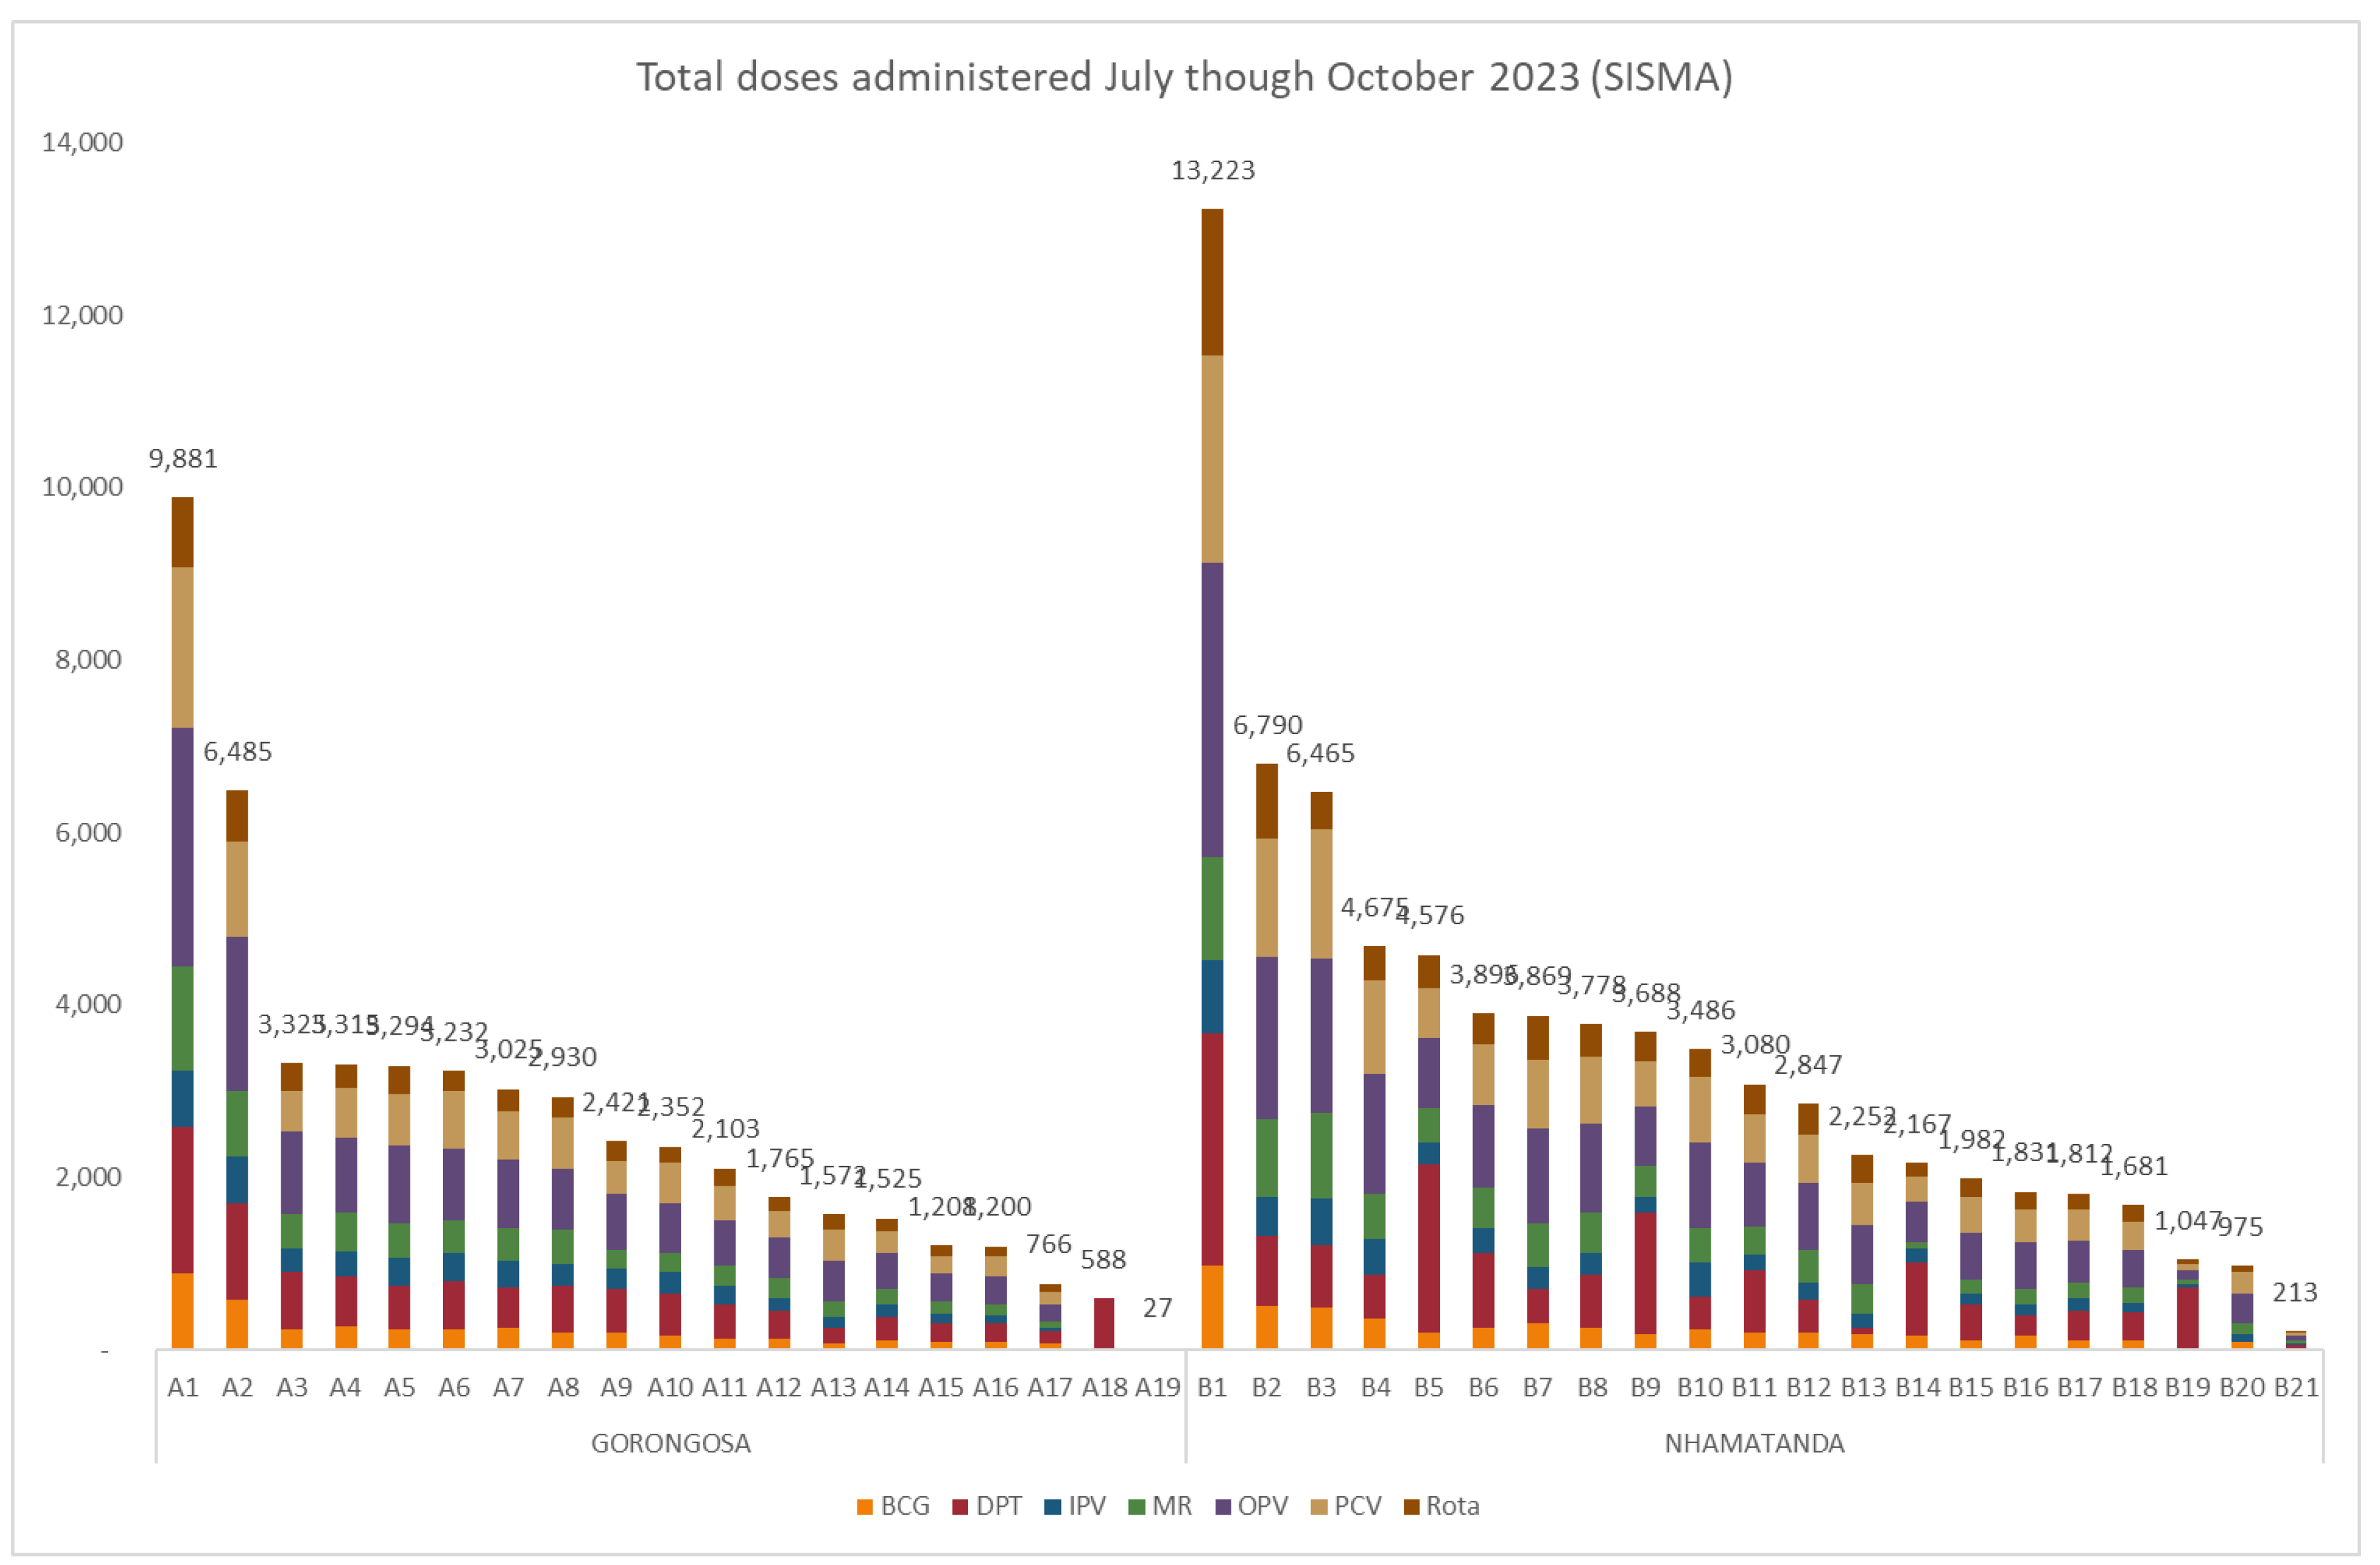
Figure 2.
District-level calculated wastage rates.
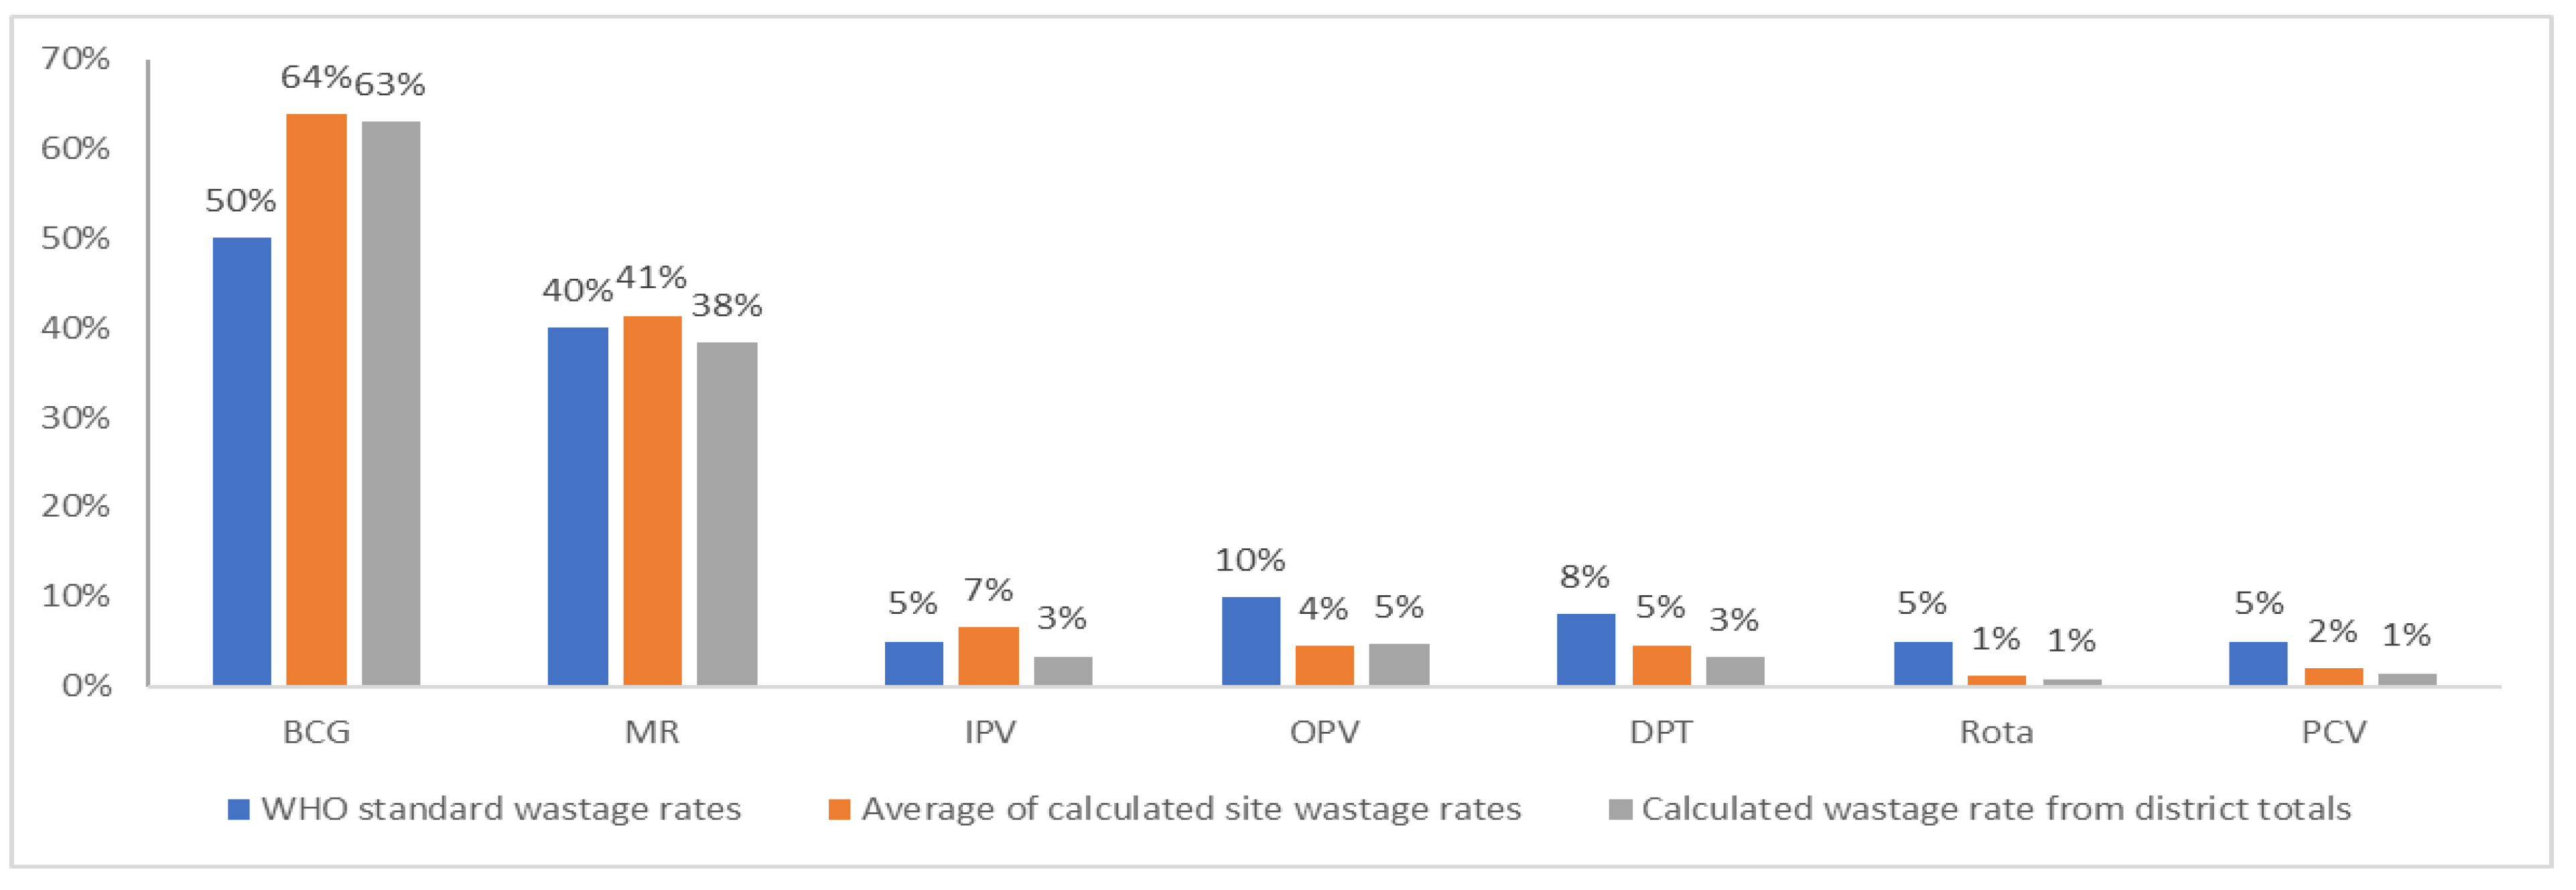
Figure 3.
Calculated wastage rate by facility showing the range and median, with each dot representing a health facility’s calculated wastage rate for one month.
Figure 3.
Calculated wastage rate by facility showing the range and median, with each dot representing a health facility’s calculated wastage rate for one month.
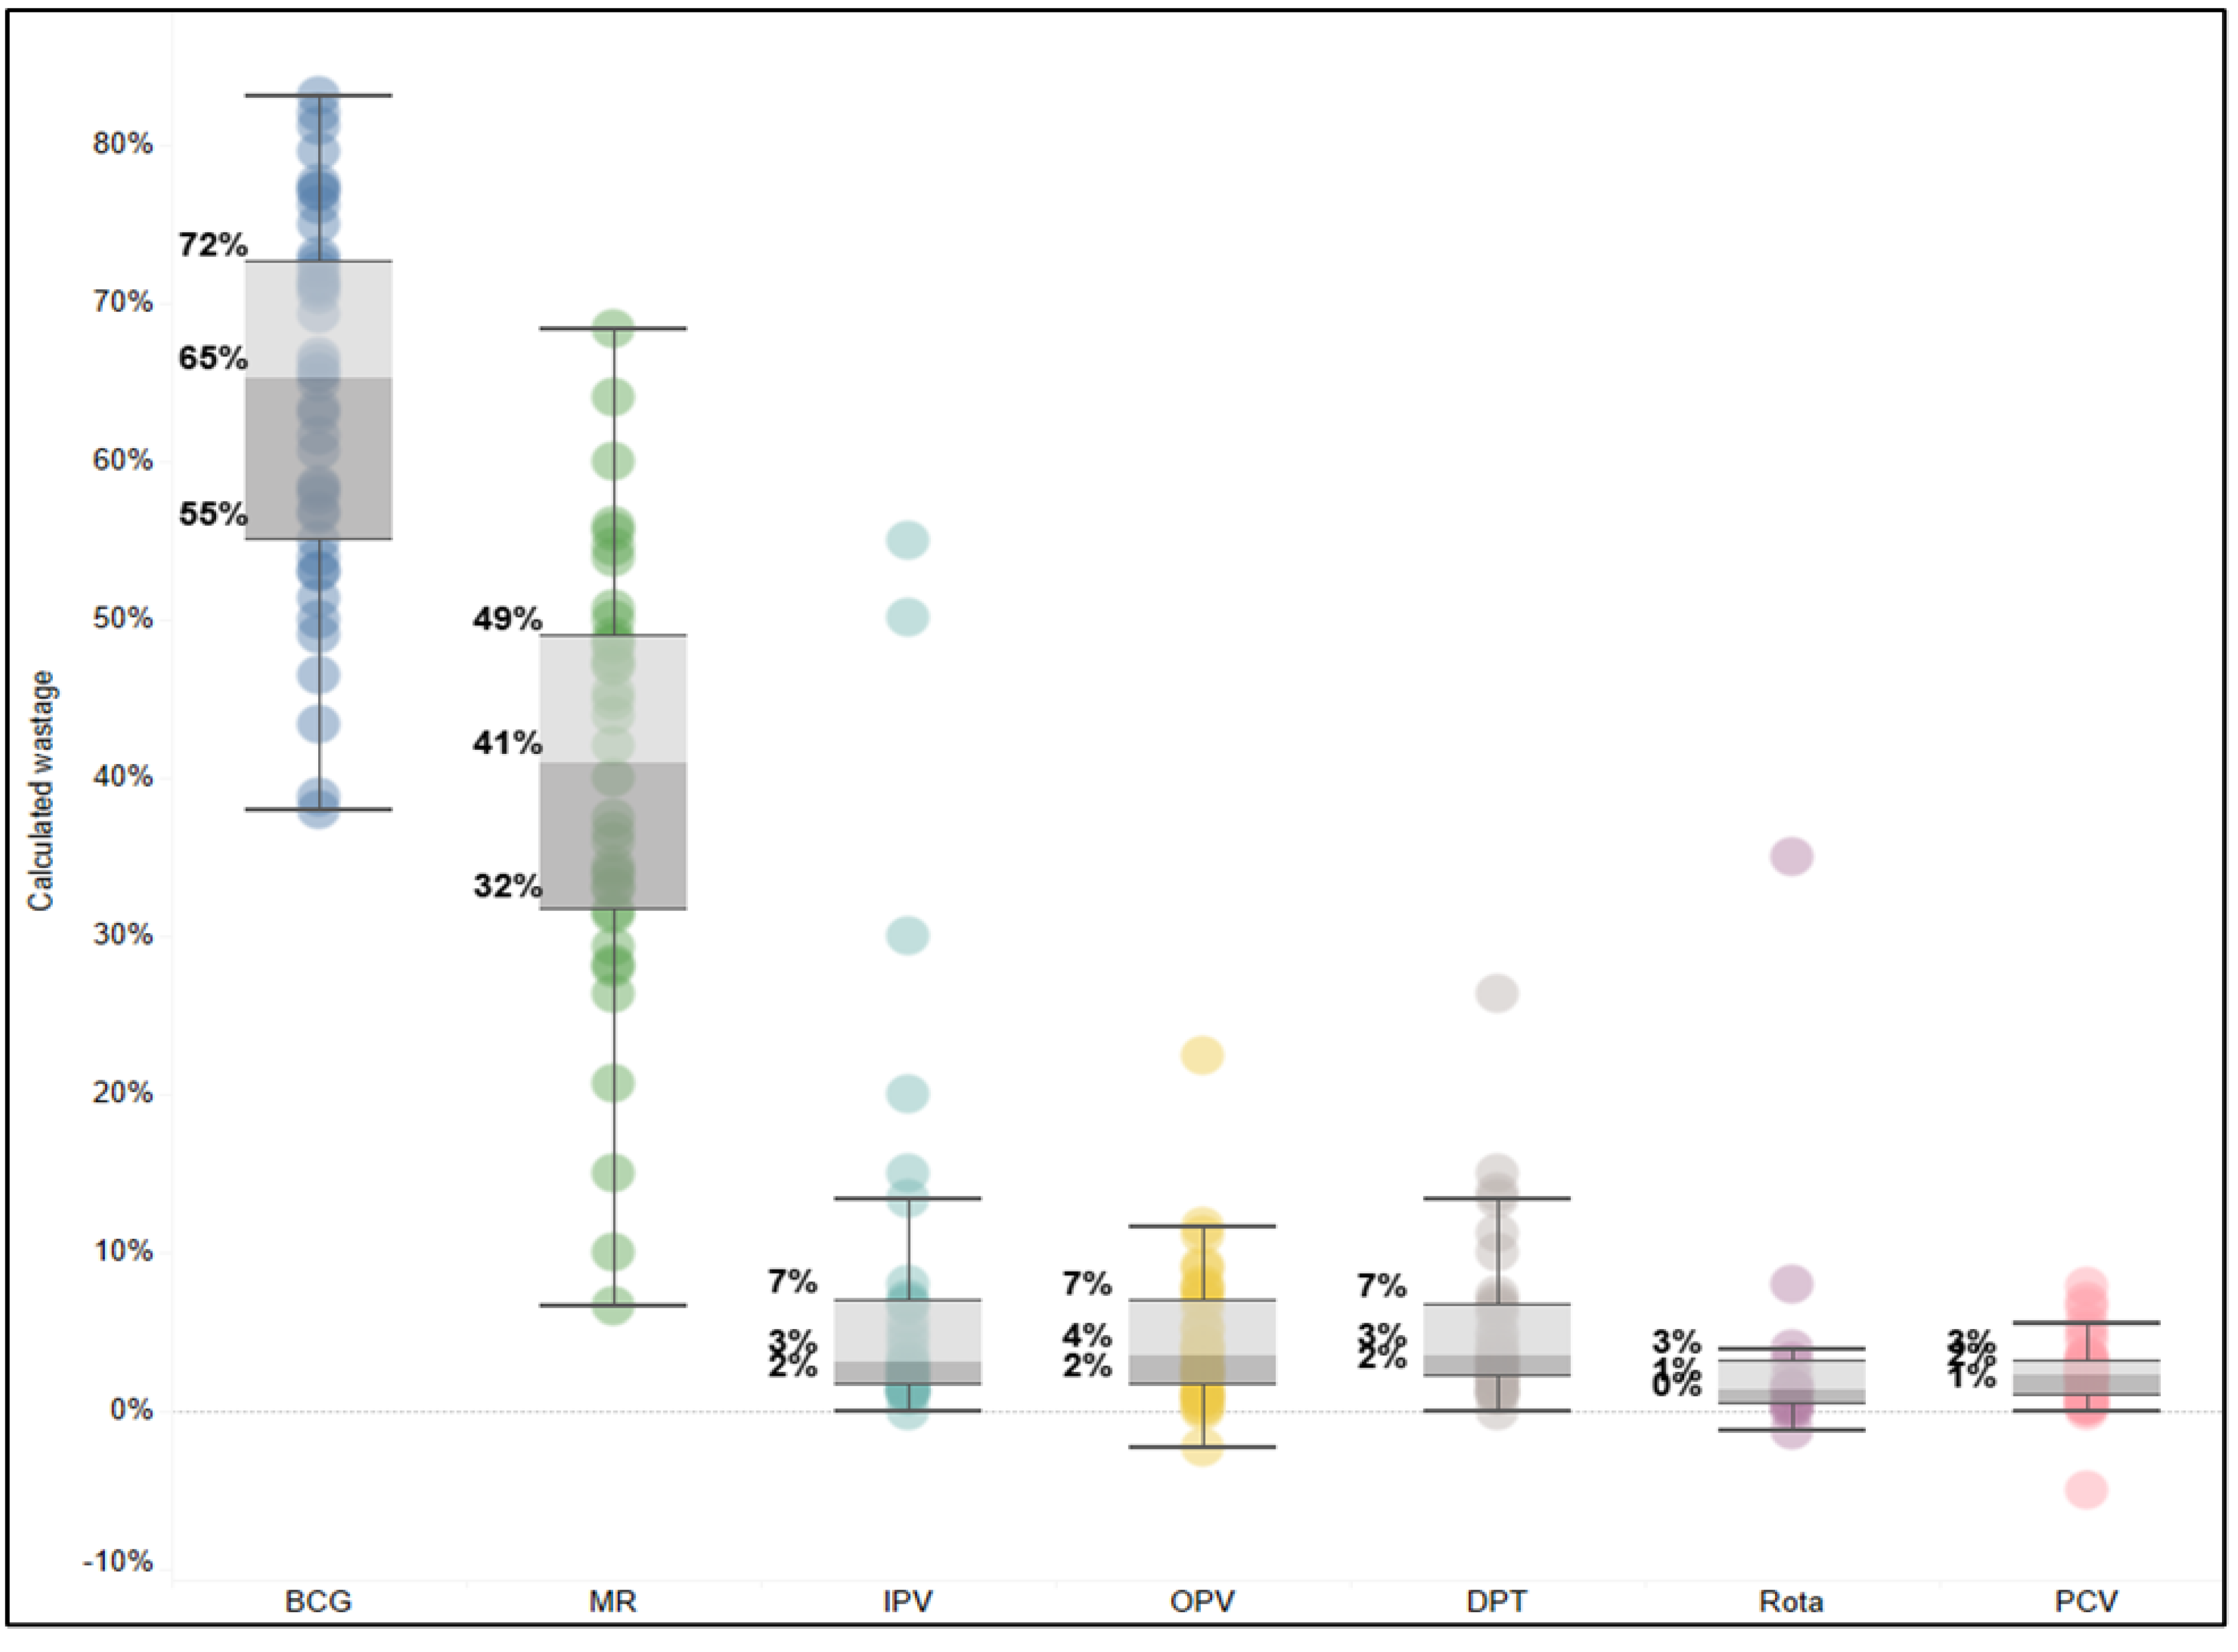
Figure 4.
Results of wastage rate compared to doses administered as a proxy for session size.
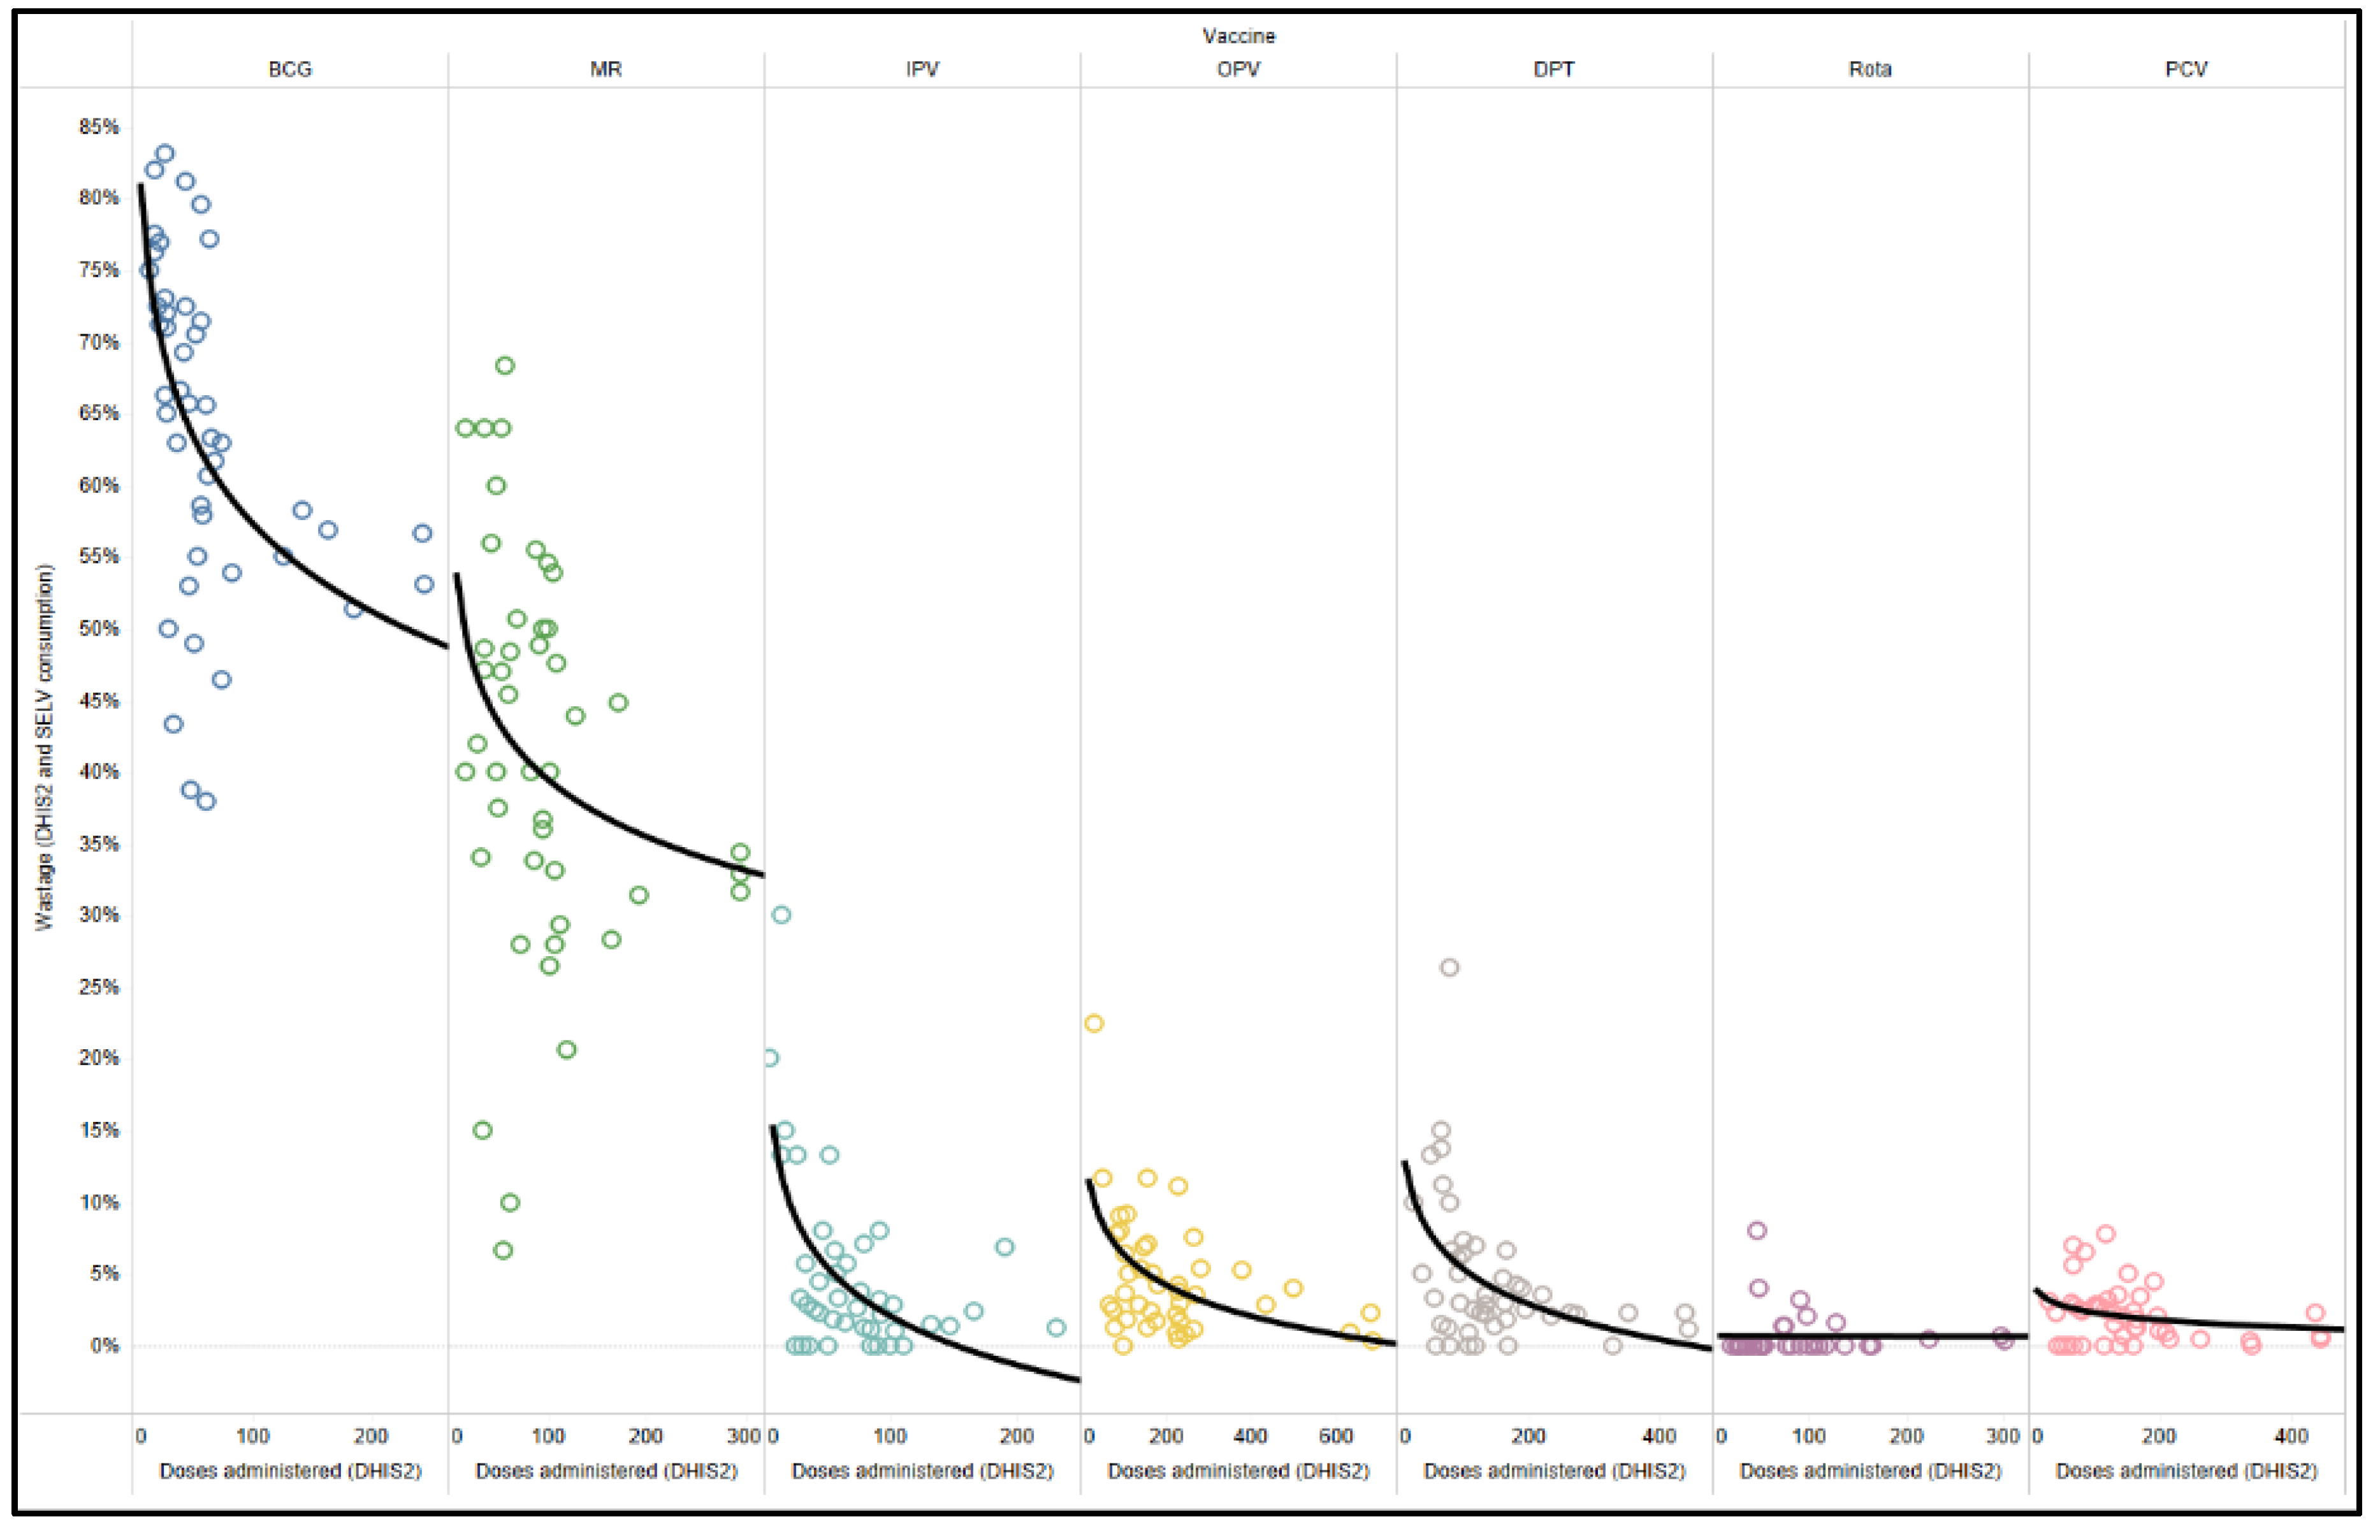
Figure 5.
Facility example of one month of a session cohort and missed opportunities to vaccinate.
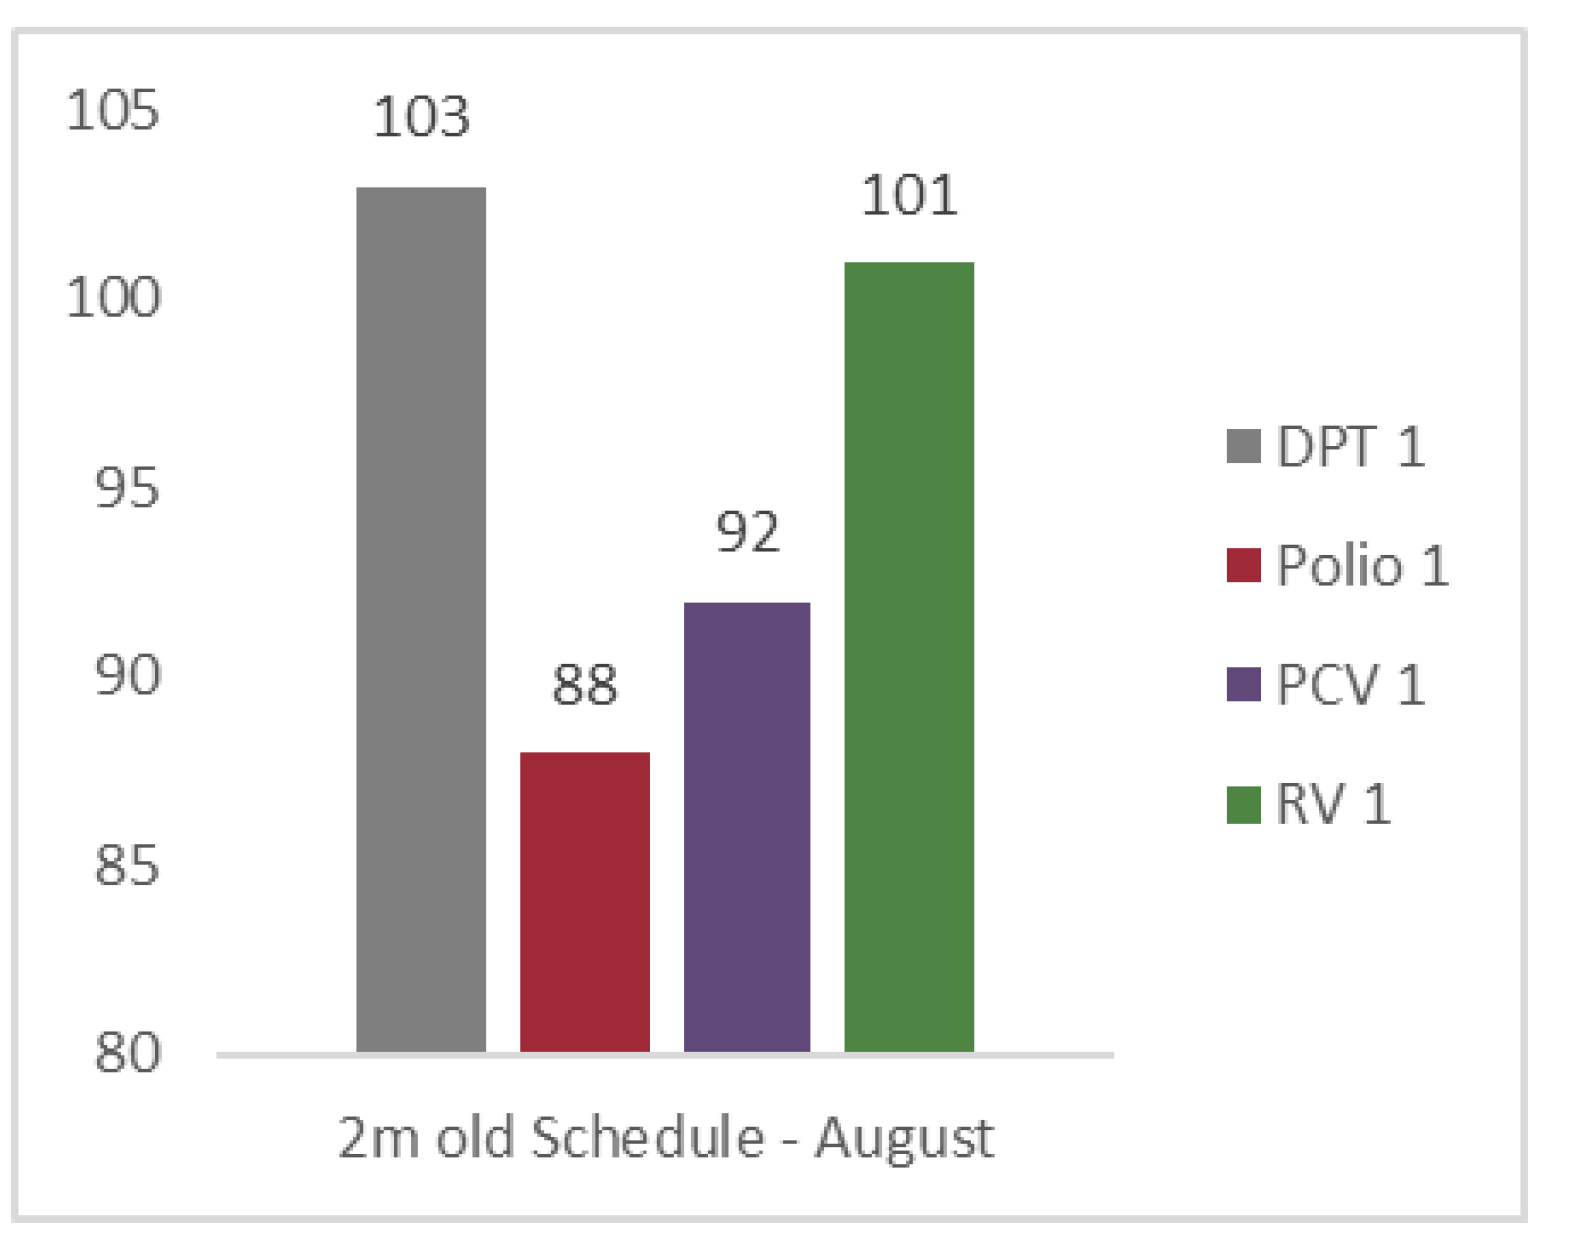
Figure 6.
Average divergence from maximum doses per session cohort correlated with reported stockouts.
Figure 6.
Average divergence from maximum doses per session cohort correlated with reported stockouts.
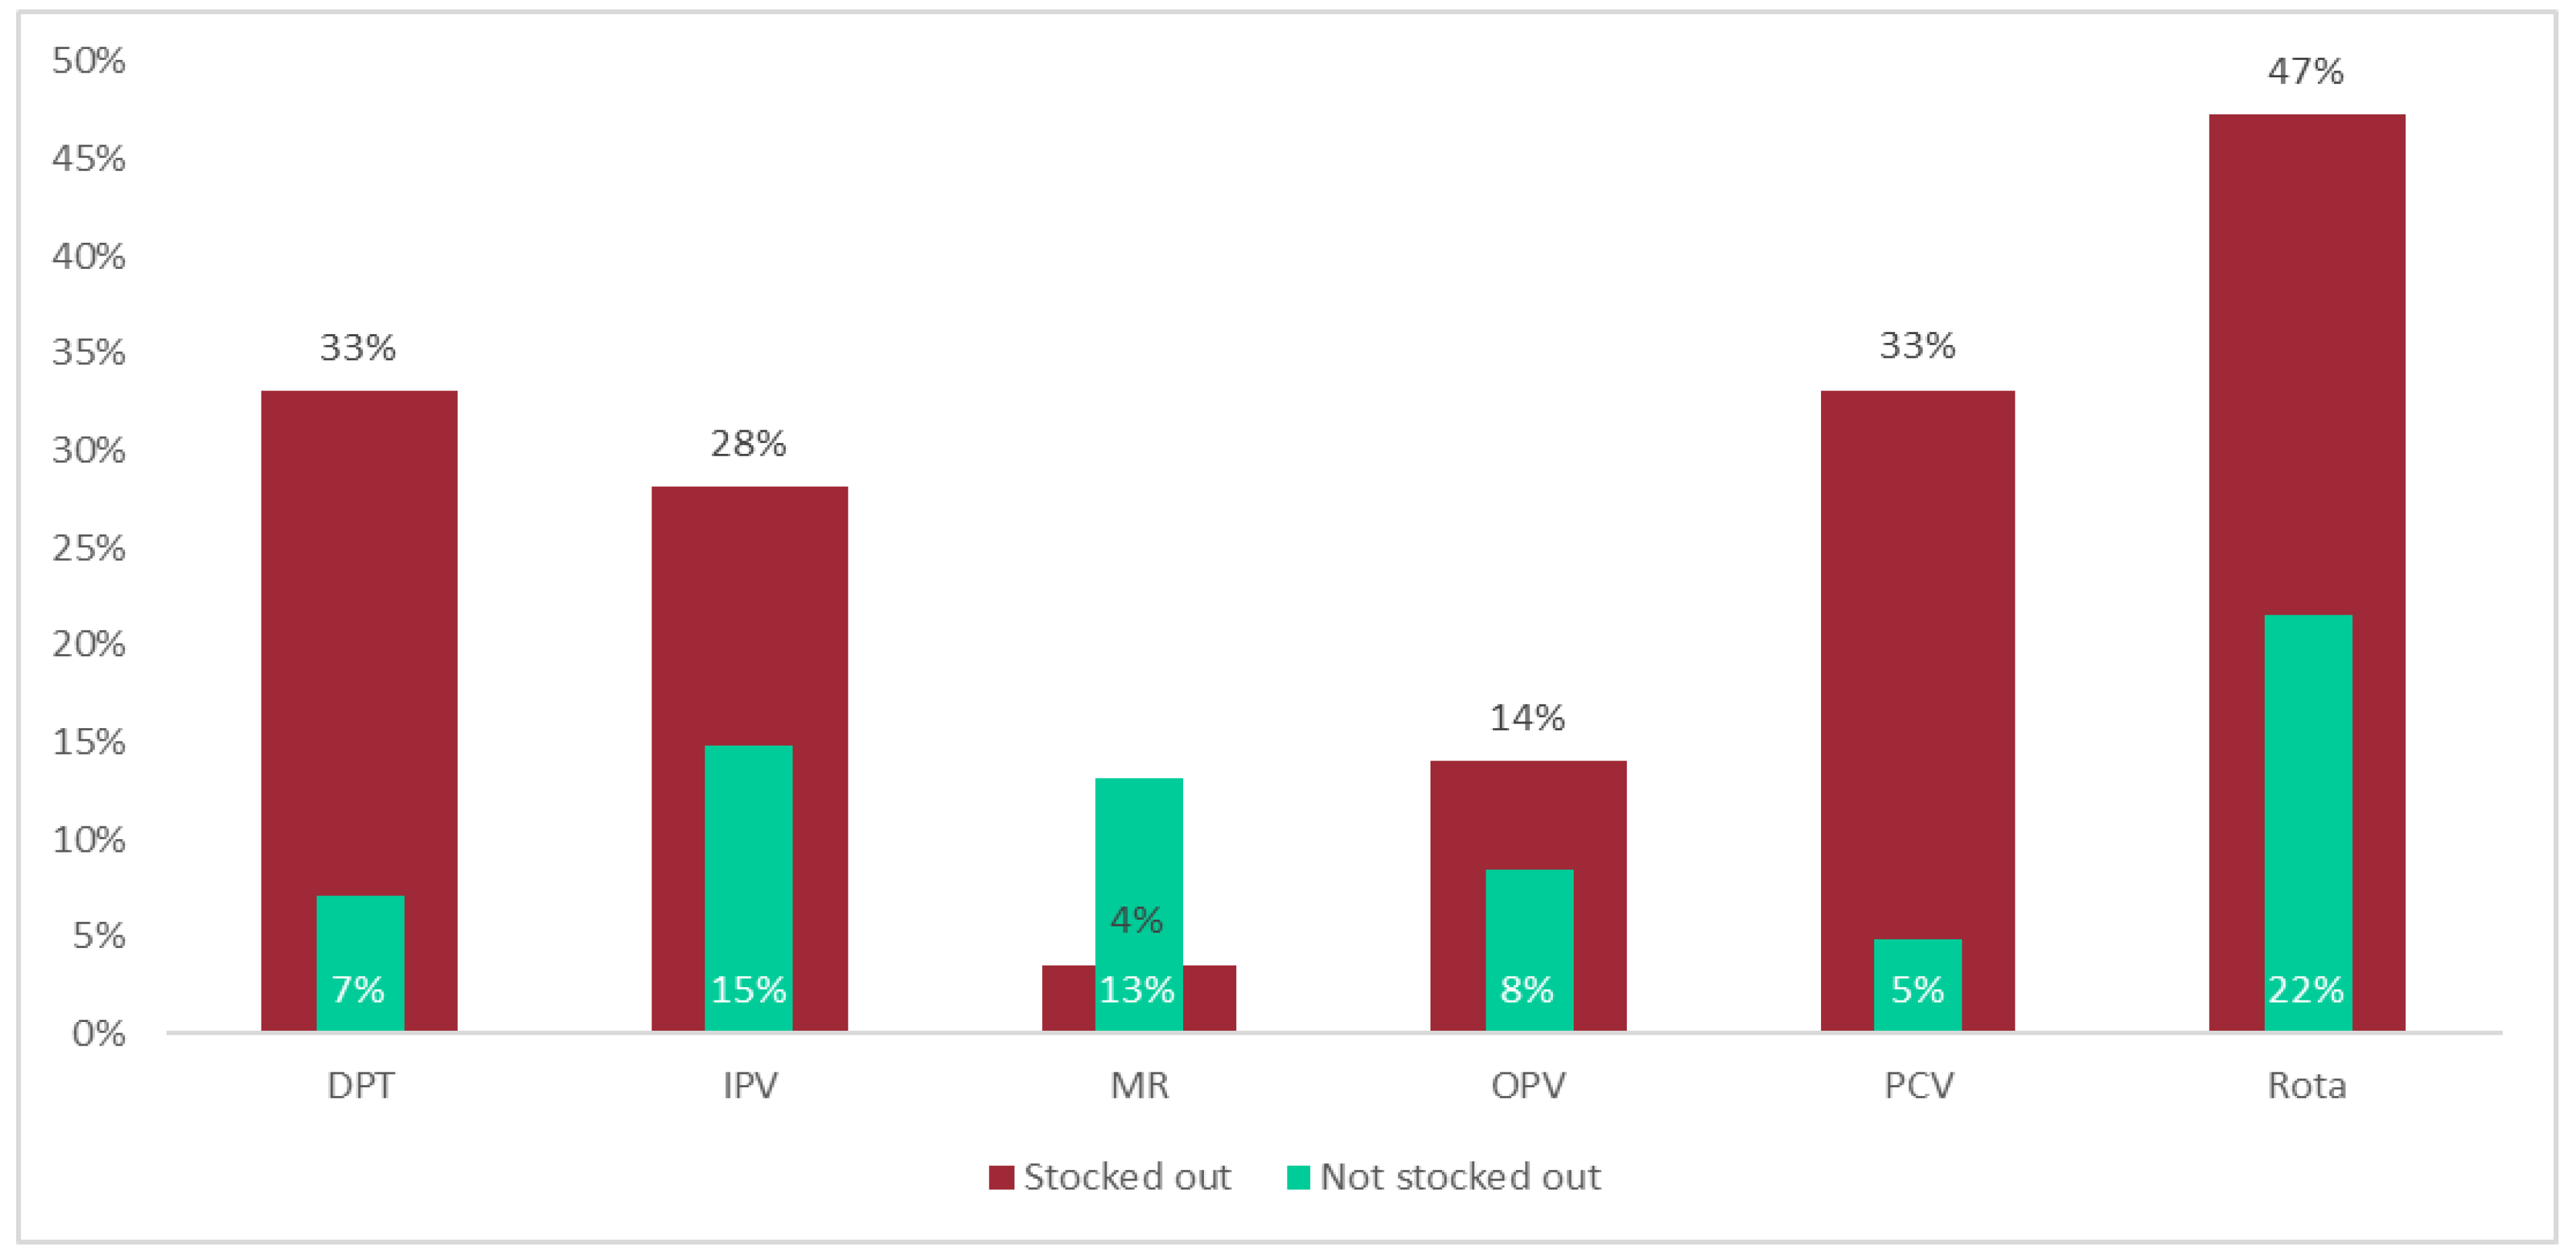
Figure 7.
Range of forecast error percent averages for doses administered compared to INE- and BCG-based forecasts across all vaccines and facilities.
Figure 7.
Range of forecast error percent averages for doses administered compared to INE- and BCG-based forecasts across all vaccines and facilities.
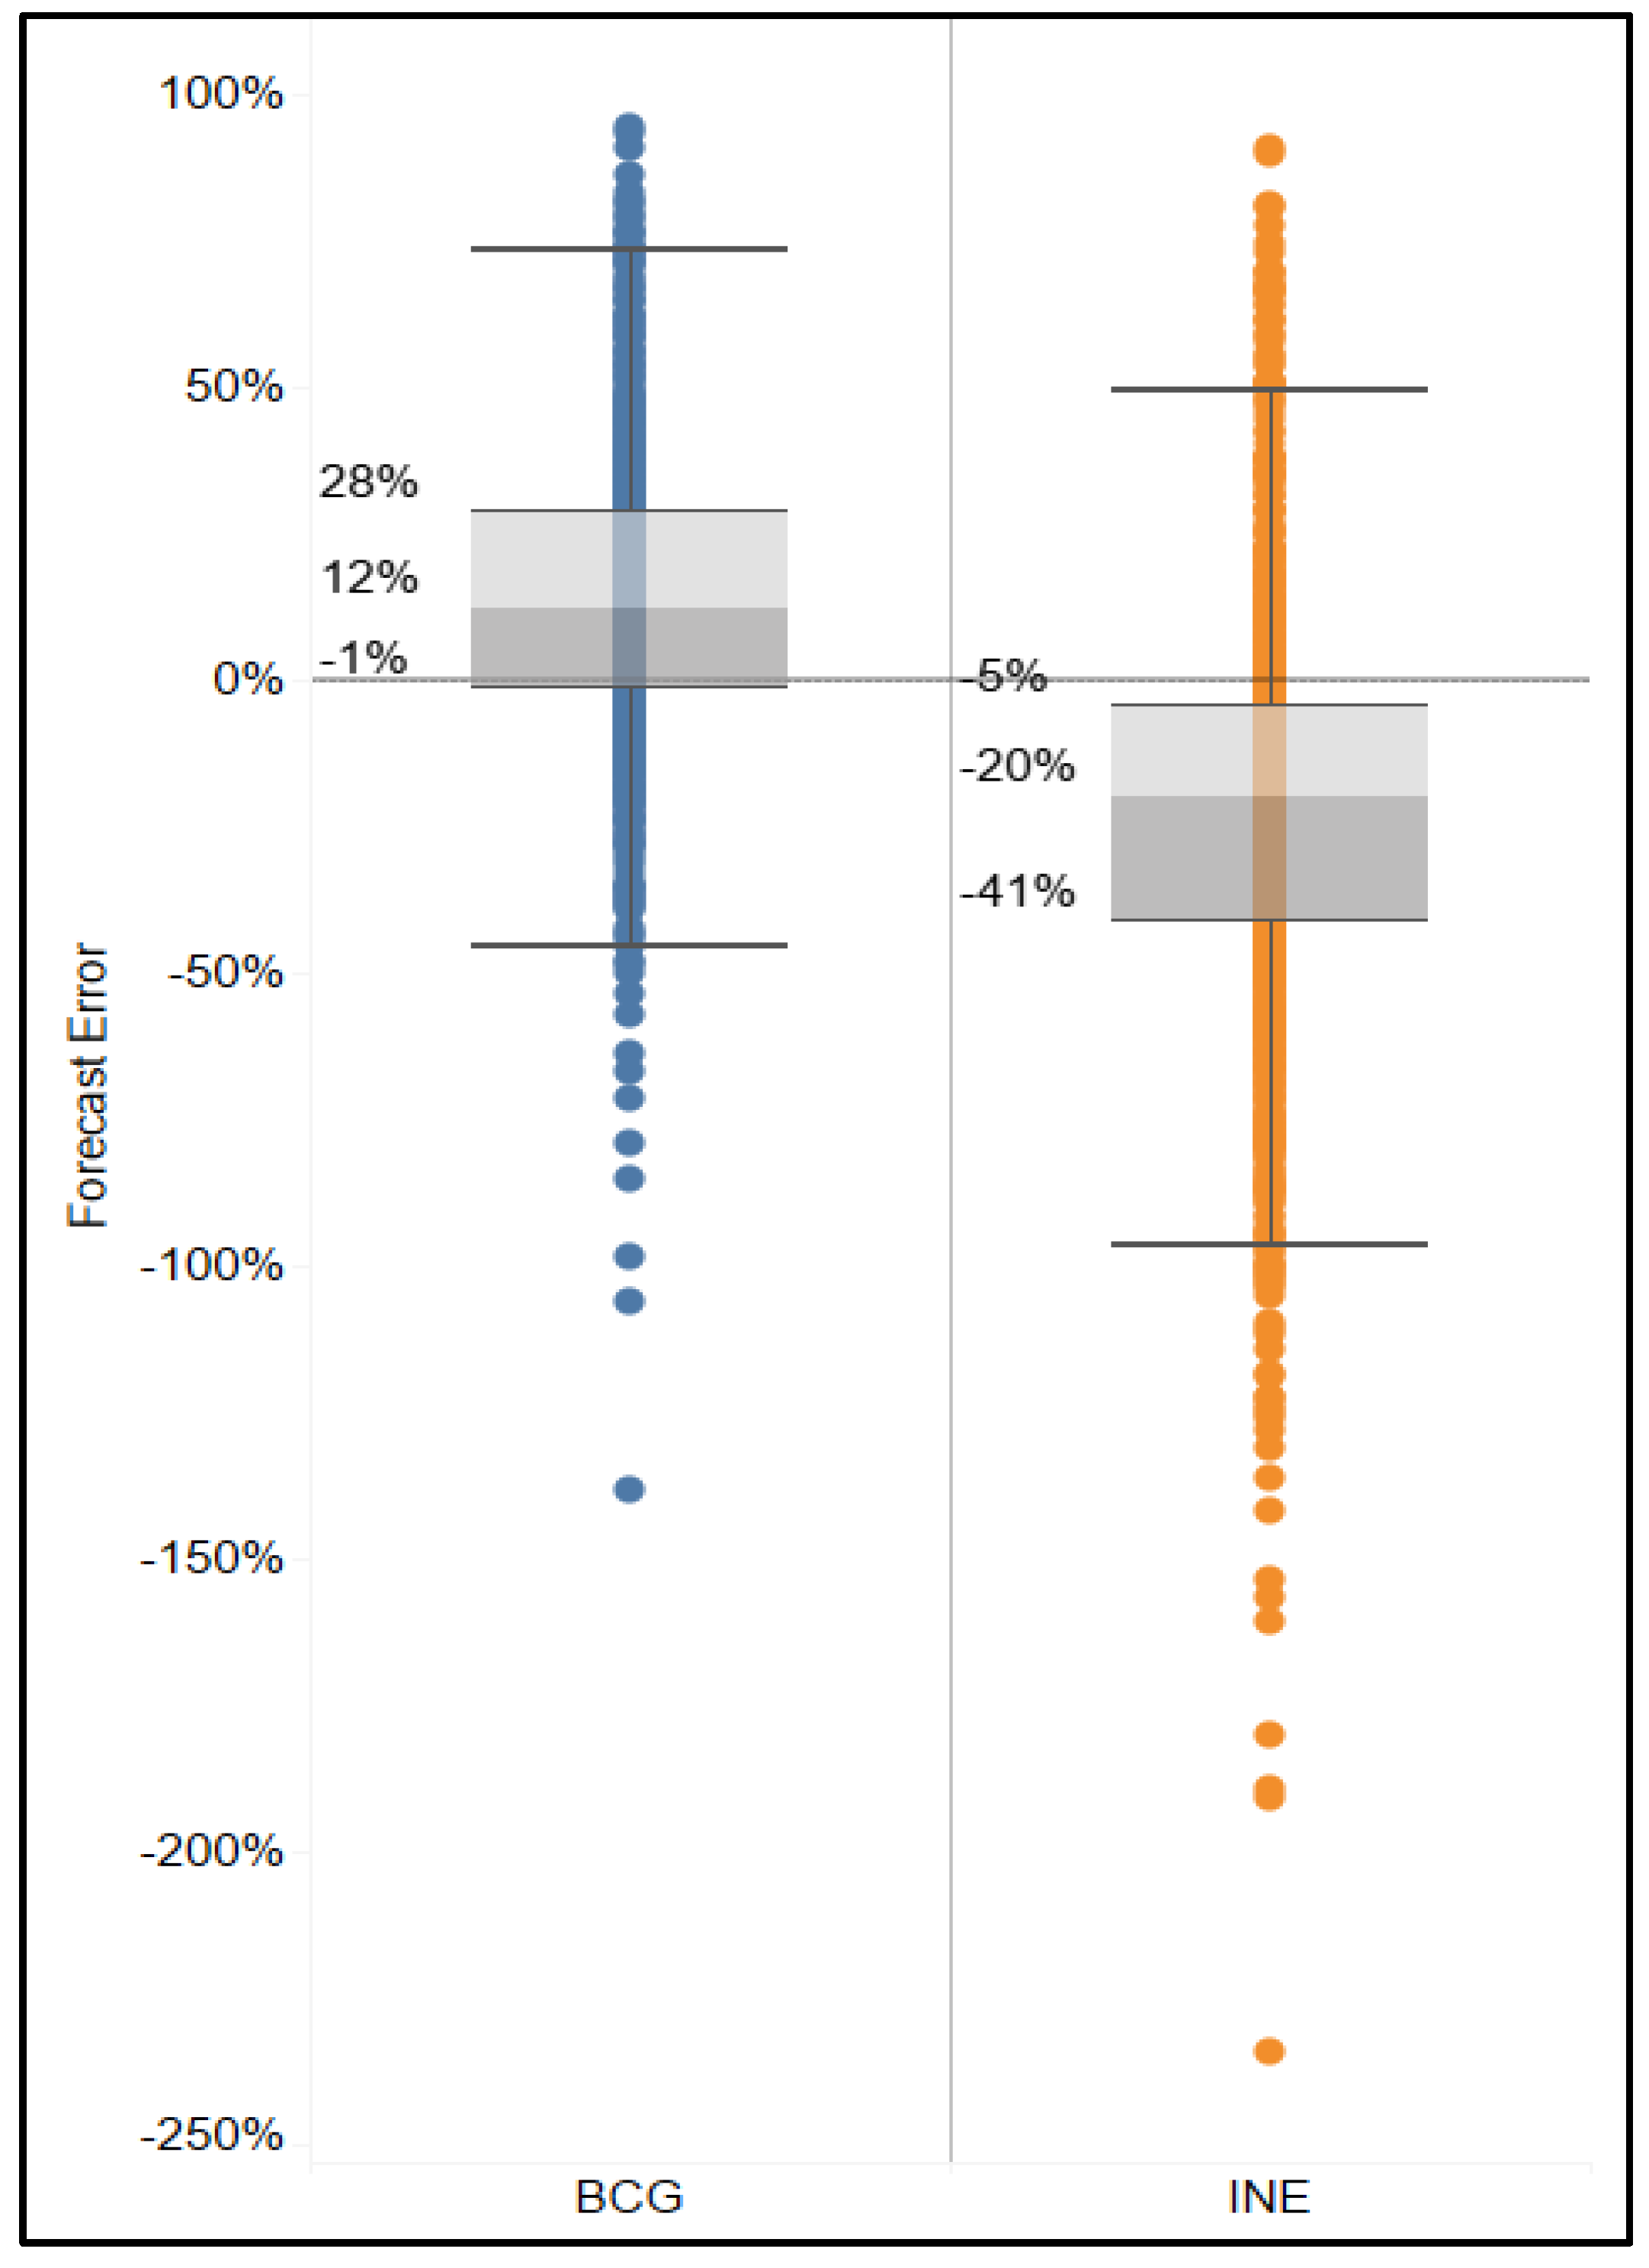
Figure 8.
Range of forecast error percent and their averages for doses administered compared to INE- and BCG-based forecasts by facility.
Figure 8.
Range of forecast error percent and their averages for doses administered compared to INE- and BCG-based forecasts by facility.
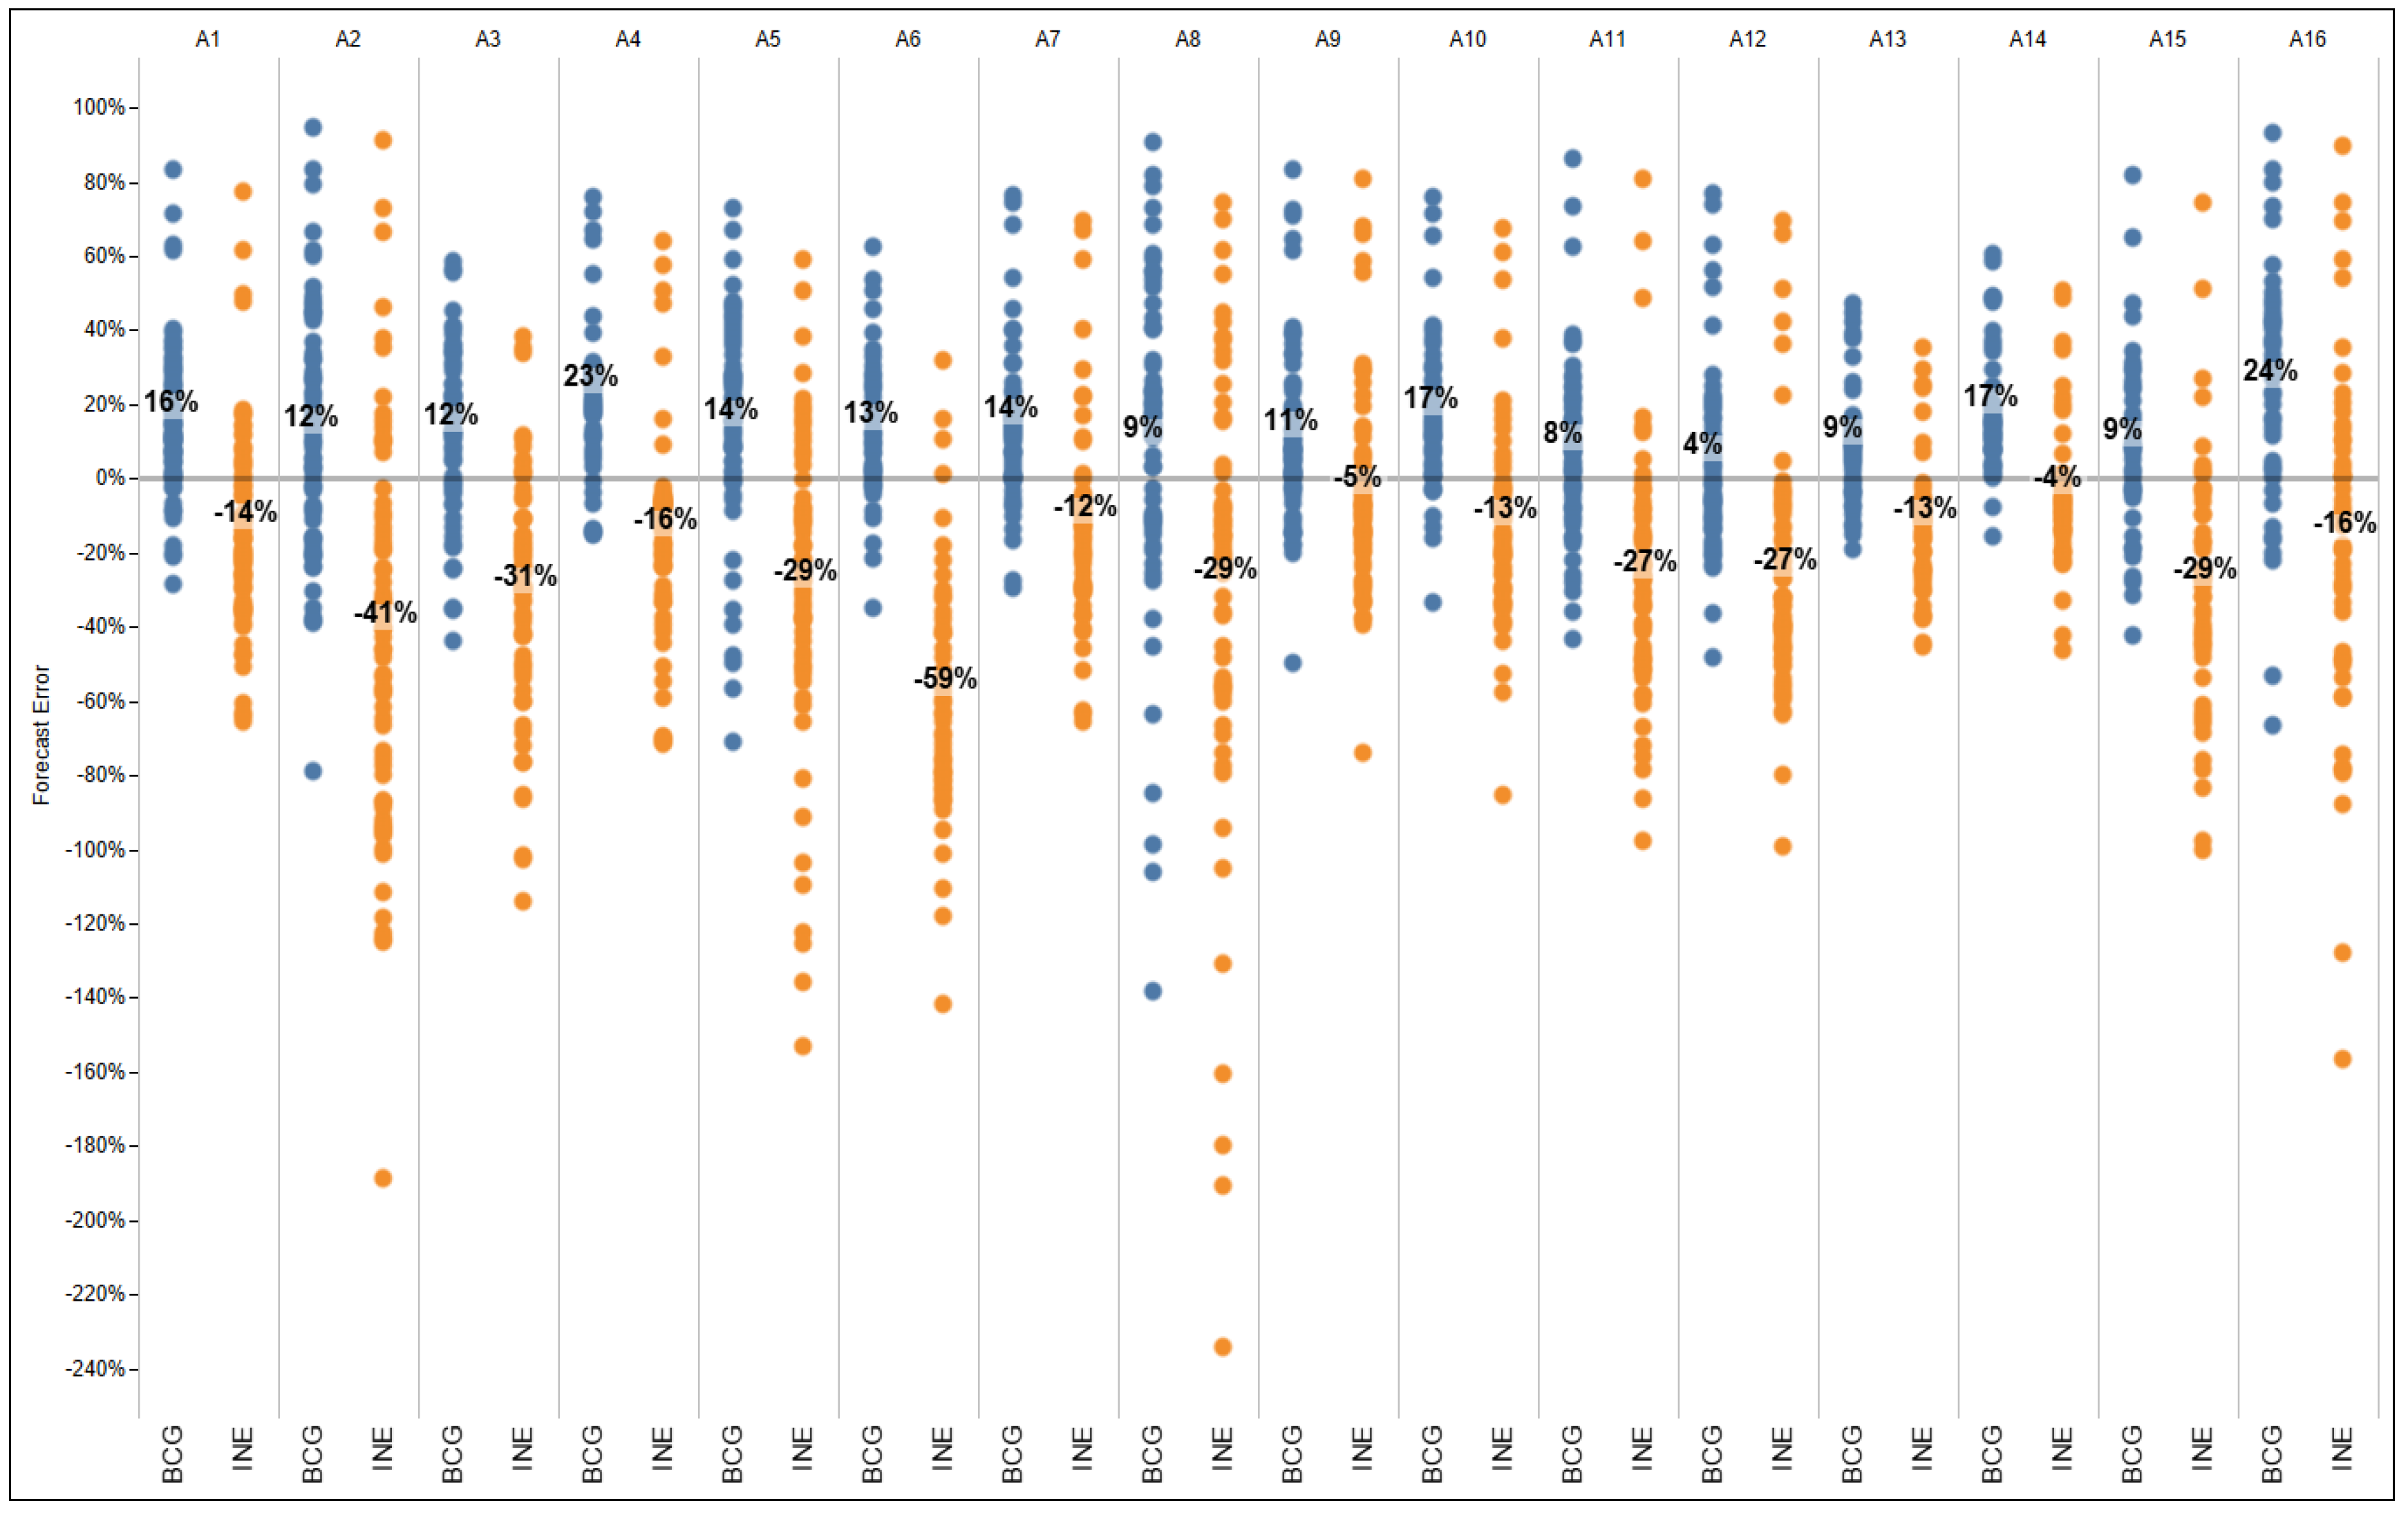
Figure 9.
Range of forecast error percent averages for doses administered compared to INE- and BCG-based forecasts by vaccine.
Figure 9.
Range of forecast error percent averages for doses administered compared to INE- and BCG-based forecasts by vaccine.
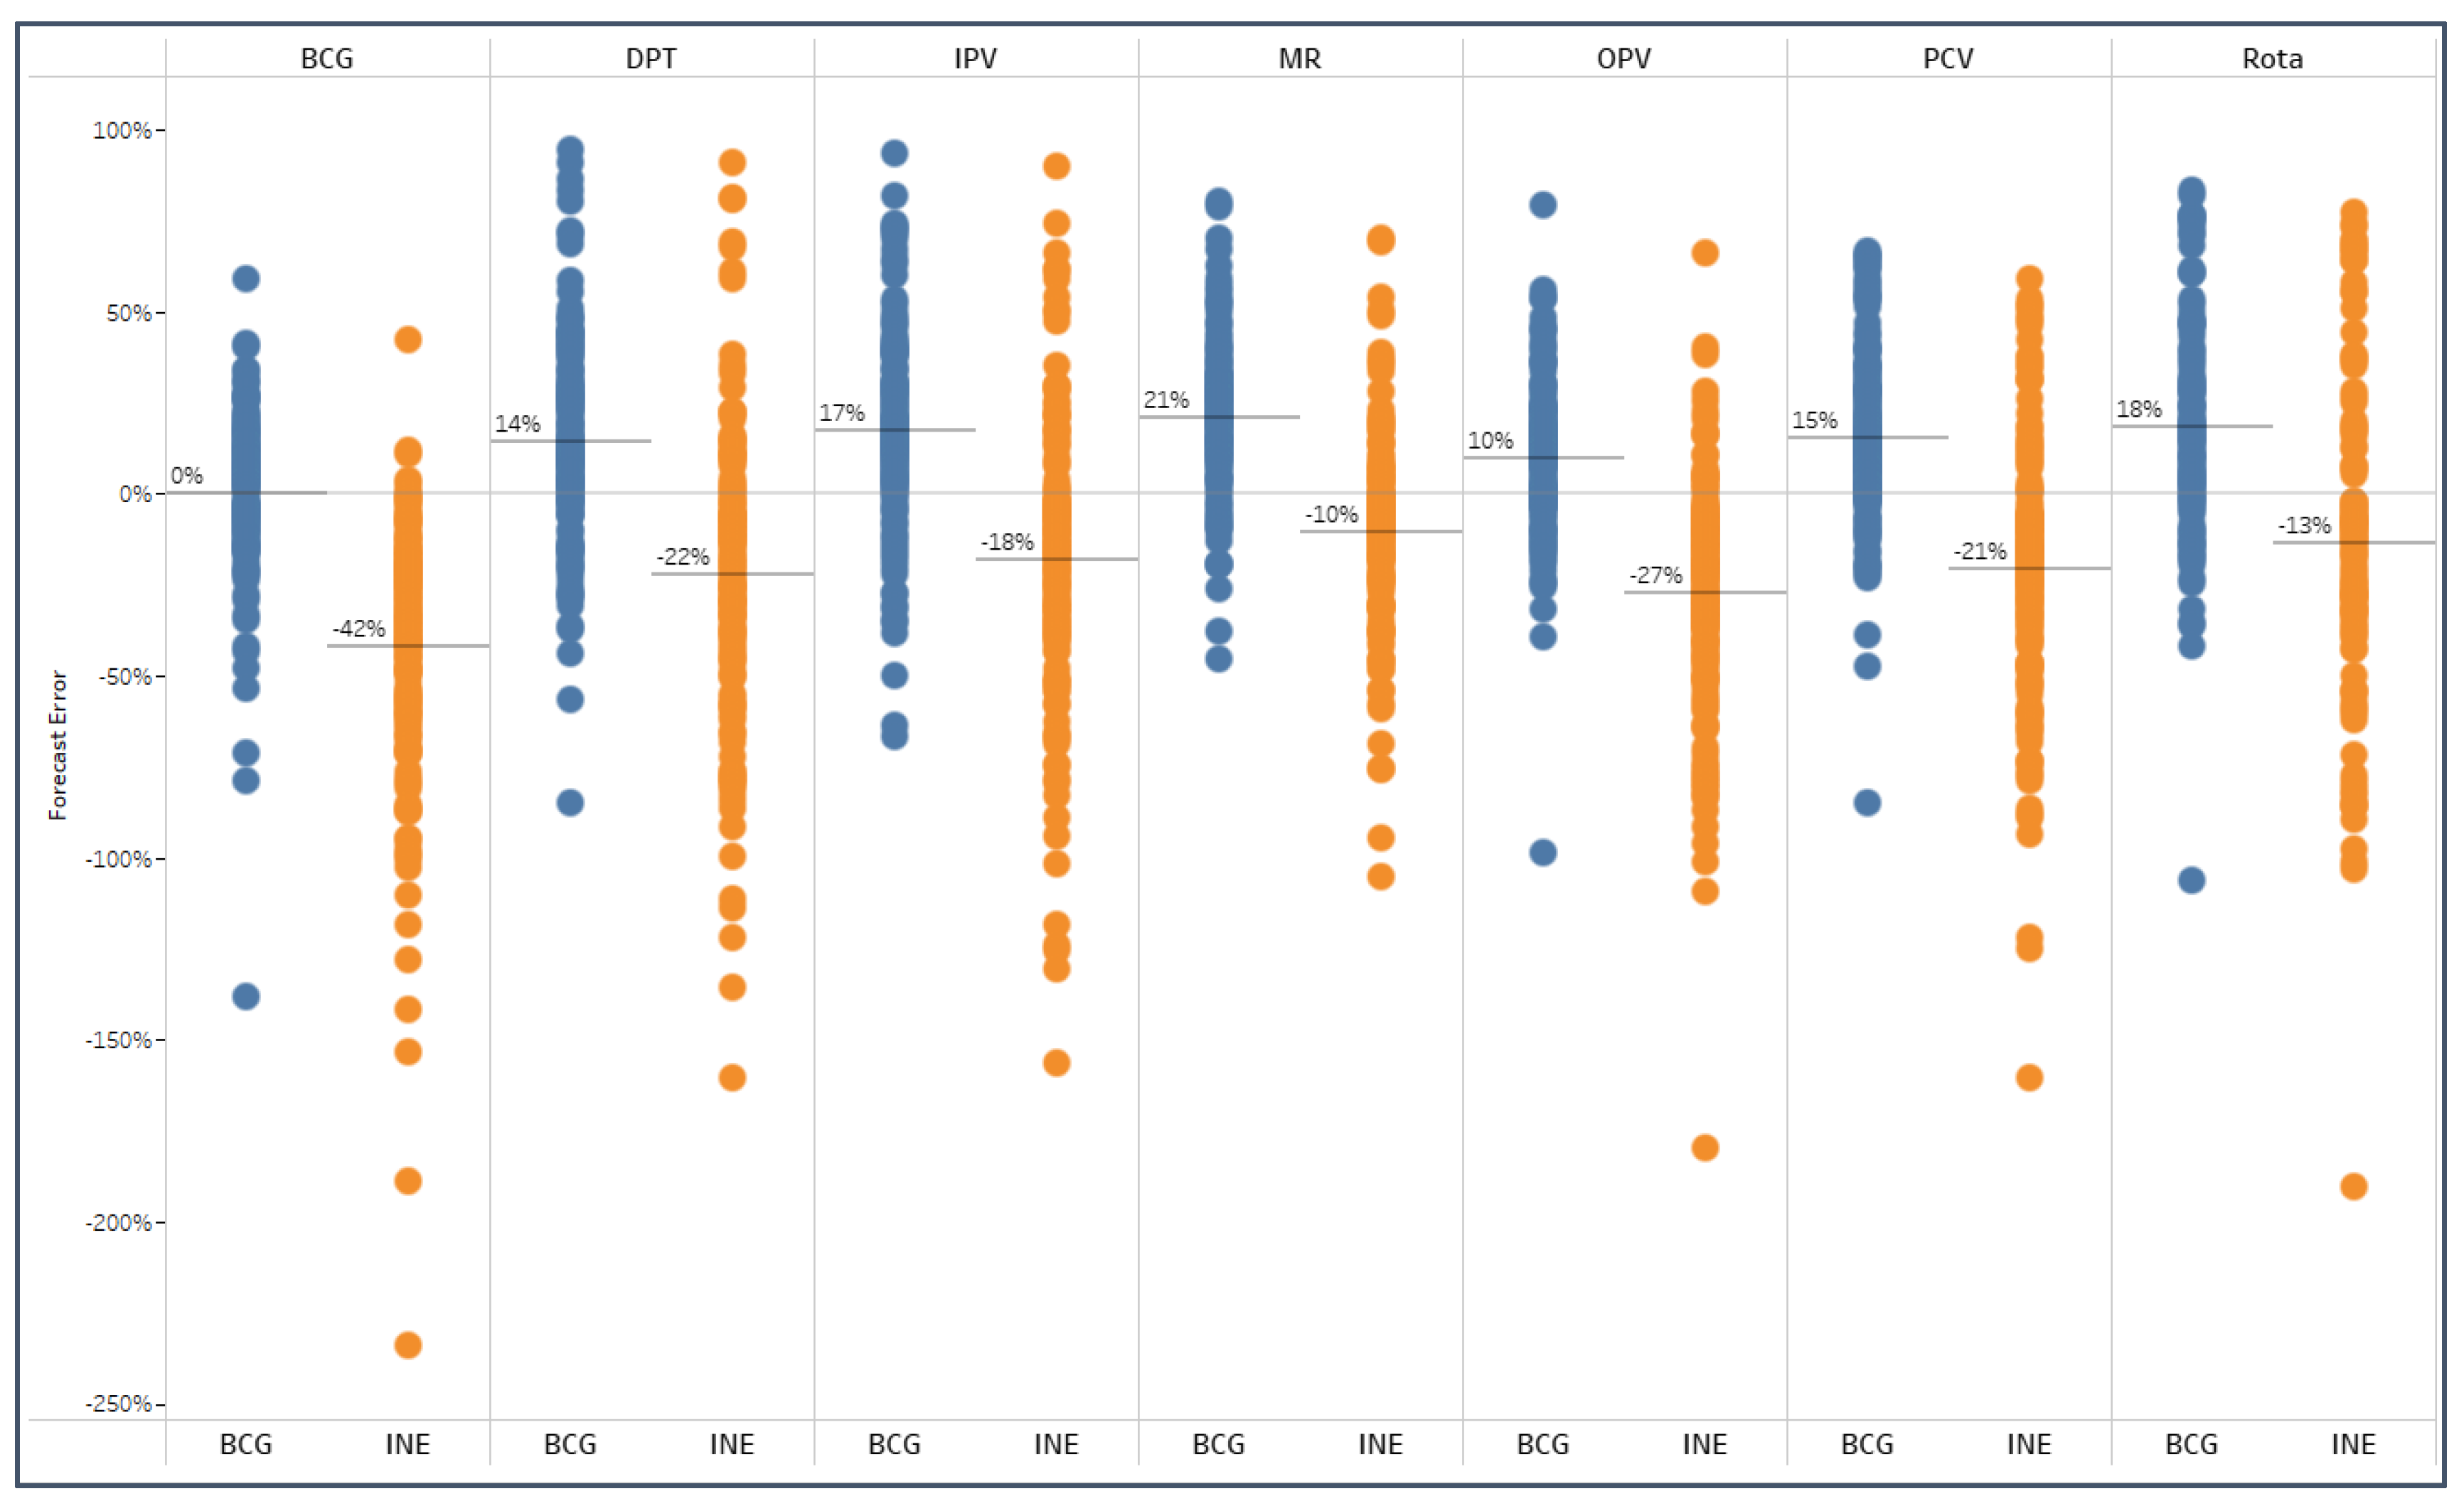

Table 1.
Data sources and data points.
| Source | Data point |
| Stock card, health facility | For visited sites only: Opening balance Vaccines received Doses available Doses opened/used Ending balance (open, unopened vials) |
| Daily summary sheet, health facility | For visited sites only: Doses administered by age and sex Number of vials opened |
| Logistics Management Information System (LMIS) | For all sites: Ending balance Doses issued Doses received Doses available Doses consumed |
| Health Management Information System (HMIS) | For all sites: Doses administered (by EPI schedule) Doses opened |
| National Statistics Institute (INE) | Population estimates by health facility |
Table 2.
Vaccines in the EPI schedule in Mozambique and their characteristics.
| Vaccine | Doses per vial | Formulation | Multi-dose vaccine policy (MDVP) discard time |
| BCG | 20 | Lyophilised | 6 hours |
| MR | 10 | Lyophilised | 6 hours |
| IPV | 5 | Liquid | 28 days |
| OPV | 10 | Liquid | 28 days |
| DPT | 10 | Liquid | 28 days |
| Rota | 1 | Liquid | n/a |
| PCV | 4 | Liquid | 28 days |
Table 3.
EPI schedule and session cohorts based on timing of vaccination.
| Cohort | Age for vaccination | Planned vaccines |
| Session Cohort 1 | Birth | BCG |
| Polio 0 | ||
| Session Cohort 2 | 2 months | DPT 1 |
| Polio 1 | ||
| PCV 1 | ||
| RV 1 | ||
| Session Cohort 3 | 3 months | DPT 2 |
| Polio 2 | ||
| PCV 2 | ||
| RV 2 | ||
| Session Cohort 4 | 4 months | DPT 3 |
| Polio 3 | ||
| IPV | ||
| Session Cohort 5 | 9 months | PCV 3 |
| MR 1 | ||
| Session Cohort 6 | 18 months | MR 2 |
Table 4.
Results of data collection by sources and number of facilities.
| Source | Nhamatanda | Gorongosa | Total |
| Stock card Aug.–Oct. 2023 |
21 facilities |
15 facilities | 36 facilities |
| Daily summary sheets Aug.–Oct. 2023 |
8 facilities | 9 facilities | 17 facilities |
| HMIS Aug.–Oct. 2023 |
22 facilities | 20 facilities | 42 facilities |
| HMIS Jan.–Dec. 2023 |
n/a | 17 facilities | 17 facilities |
| LMIS July–Oct. 2023 |
n/a | 16 facilities | 16 facilities |
| INE target population estimates 2023 |
n/a | 17 facilities | 17 facilities |
Table 5.
Description of data collection of all sources and quality summary.
| Nhamatanda | Gorongosa | |
| Average number of stockouts among facility/vaccine combinations (defined by a reported zero balance at the end of the month in the LMIS) | n/a | 158/576 (27%) |
| Match of consumption reported in LMIS with open vials reported in HMIS | n/a | 354/480 (74%) |
| Among the mismatched figures, the proportion of LMIS consumption reported in HMIS as opened (n=28) | n/a | 342% BCG 92% all others |
| Completeness of stock cards | 64/176 (36%) |
9/120 (8%) |
| Aggregate doses administered of BCG, DPT, IPV, MR, PCV, OPV, and Rota per HMIS | 74,333 (59%) |
51,014 (41%) |
Disclaimer/Publisher’s Note: The statements, opinions and data contained in all publications are solely those of the individual author(s) and contributor(s) and not of MDPI and/or the editor(s). MDPI and/or the editor(s) disclaim responsibility for any injury to people or property resulting from any ideas, methods, instructions or products referred to in the content. |
© 2025 by the authors. Licensee MDPI, Basel, Switzerland. This article is an open access article distributed under the terms and conditions of the Creative Commons Attribution (CC BY) license (http://creativecommons.org/licenses/by/4.0/).
Copyright: This open access article is published under a Creative Commons CC BY 4.0 license, which permit the free download, distribution, and reuse, provided that the author and preprint are cited in any reuse.


