
Submitted:
05 October 2025
Posted:
06 October 2025
You are already at the latest version
Abstract
This study assessed vaccine storage, stock management, and distribution practices in Ethiopia using the EVM 2.0 tool from March to July 2023. It involved 302 health facilities, one central EPSSA hub, and 15 EPSSA sub-national hubs. A mixed-method approach was used, with data collected via the EVM assessment tool and analyzed using STATA 16 and ATLAS.ti software. Findings showed that the EPSS center and four hubs maintained well-organized stock records, but variation existed in vaccine stock arrangement, security of records, and frequency of physical stock counts. Although all sub-central hubs submitted requests electronically, 74.15% of facilities did not. Three-fourths of institutions documented maximum stock levels. Less than 50% of institutions retained stock records for at least three years, except health centers. One-tenth of institutions faced storage emergencies in the past year, and 70.07% of health institutions stored records securely. Distribution and allocation records were updated monthly in 81% of institutions. Challenges included a lack of accurate denominators, poor infrastructure, inadequate storage equipment, and migration. Vehicle unavailability hindered distribution. Despite these issues, stock management knowledge was found to be encouraging at all levels. The government should focus on improving vaccine forecasting, implementing computerized systems, and addressing transportation infrastructure challenges.
Keywords:
vaccine stock management
; vaccine distribution
; EVM
1. Background
Immunization is a vital, cost-effective intervention intended to avert mortality rates among under-5, adolescent girls, and women across the world. The immunization Agenda 2030, outlines goals and suggestions for enhancing health and leaving no one behind, in any situation or at any stage of life that everyone receives the full advantages of immunization [1]. The national key approaches to immunization service delivery are static, outreach, and mobile strategies [2]. Currently, the EPI program delivers its services at all service delivery points at public and private health facilities, including 471 hospitals, 3,848 health centers, and 17,982 health posts. Moreover, the program operates with 14 national and regional laboratories, and one central and 15 Sub-central pharmaceutical supply hubs [2].
A well-functioning immunization system depends on interactions of several components such as careful planning and management of human, financial, and logistics, effective communication strategies, quality service delivery, maintaining high quality vaccine preventable disease surveillance, and program -level monitoring and evaluation (M&E). Vaccines are very important and sensitive health commodities that require a proper supply chain system, which operates in a network of storage facilities and transportation system designed to keep vaccines at a recommended temperature range [3].
Among ten global criteria defined by the WHO-UNICEF Effective Vaccine Store Management (EVSM), effective stock control is one of them. The aim of the EVSM is to encourage countries to procure and maintain equipment and to adopt management and training practices. EVSM assessment process is to be carried on monthly baseses. In addition, good warehousing practices should be adopted and physical stock counts should be carried out on a regular basis to verify stock records. The EVSM requires that a standard recording and reporting of all stock transactions is carried out [4].
There are gaps in immunization coverage, quality, and equity due to barriers that are multifaceted and include inadequate leadership, management, and governance skills among health workers and managers [5]. In Ethiopia, 19.2% of eligible children have not ever been vaccinated for the required vaccines [6]. On the other hand, the immunization service faces challenges from natural and artificial catastrophes such as drought, war, and economic crises [7,8]. From the system side lack of demand generation on the plan of action and budget at all levels of the health system for immunization communication [9]. According to evidence generated at sub-national levels, the quality of vaccination services is being neglected due to poor vaccine storage and handling, poor practice of vaccine administration/delivery, poor waste disposal and management, and inadequate knowledge [10]. Besides, constraints of an unsustainable electricity supply, inadequate and improperly set up storage facilities were important factors for the poor quality and safety of vaccines [11].
Effective management of vaccine stocks and their distributions are key features of any good immunization program. However, the problem persists with ensuring timely availability, proper storage, and efficient distribution of vaccines in Ethiopia. The current vaccine stock management from the Ministry of Health right down to health centers and posts has operational gaps. These gaps affect vaccine quality, accessibility, and coverage. It calls for holistic research to establish the bottlenecks, assess stock management practices, and propose evidence-based solutions. This paper presents key findings from Ethiopia on the accomplishments and challenges in implementation of Ethiopia’s Vaccine storage, stock management, and distribution practices as well as recommended actions for the country.
2. Material and Methods
2.1. Study Setting and Time
This assessment was conducted between March to July 2023, 2023 in Ethiopia. The assessment was conducted by Addis Ababa University using EVM tool. The assessment covered One National hub; 15 Sub-national Level (SN) hubs; 90 Lower Distribution level (LD) District Health Offices; and 196 Service provision level (SP), the health facilities (83 HPs, 101 HCs, and 12 Hospitals). A total of 302 Health facilities that have active cites in the immunization supply chain system were considered for this study.
2.2. Survey Design
A mixed methods study with concurrent quantitative and qualitative approach that used the WHO EPI review giude and EVM tool to evaluate the immunization supply chain management at all levels of the health care system. The study included cross-sectional survey of health facilities, health facility assessments, desk reviews, and key informant interviews.
2.3. Study Populations
The study included a nationally representative sample of health facilities, health administration institutions, and federal and regional agencies (public health institutes, FDA, EPSS). The qualitative study participants were officials at all levels of the health system, partners and stakeholders.
2.4. Sample Size and Sampling Strategies
This study is part of a the larger study aimed at evaluation of EPI in Ethiopia that assumed 95% confidence level, 2% margin of errors, a design effect of 3, and 10% expected non-response rate for the sample size resulting 23, 255 total active isc points using the EVM assessment. The facilities were selected from 505 EAs of which127 EAs from urban, and 378 EAs from rural. EAs was allocated to urban and rural strata based on the proportion of the national population living in urban and rural areas (21.4% urban and 78.6% rural. If the selected EAs has no any facility storing, and/or distributing, and /or providing immunization services a facility in the chain of EPI referral link from neighboring EAs were considered for the assessment. Accordingly, the EPSS center, 15 EPSS hubs and 286 facilities at the lower distribution and service provision level were involved in immunization supply chain.
Sampling for Qualitative study Data Collection, a total of 76 KIIs were conducted among participants from national, regional, zonal, woreda and facility. Purposive sampling method was used to select key informants. In addition, maximum variation (one from each group) was used to recruit regions. The regions were divided into three categories to create maximum variation whereas, to recruit key informants at zonal and woreda levels, we used extreme case/deviant sampling.
2.5. Data Collection Methods and Instruments
For this study, key informant interview guides, and the WHO Effective Vaccine Management (EVM) assessement tool were used for data collection on the vaccine supply chain management system.There are four supply chain levels for assessment used by the system. At the facility level, data were collected through face-to-face interviews with eligible members of each sampled facilities. Health facilities and offices desk review, vaccination session observation, and key informant interview were the other methods.
All data collectors and supervisors were trained for seven days on data collection tools and procedures before deployment. Pre-testing was carried out outside the sampled woredas, where the community had similar characteristics to check clarity of each question, identify ambiguous questions, check skipping patterns and the flow of questions, and check the consistency and cultural sensitivity of questions.
2.6. Data Management and Analysis
For the quantitative approach, data were exported from the data collection sites into the central server on daily basis. Descriptive statistics like frequency and percentage were computed using STATA software version 16. Additionally, maps, graphs, and tables were used to present the findings of the survey. Raw data was imported from EVM WHO system/server into Microsoft excel and exported into Stata for analysis.
Qualitative data were transcribed and translated verbatim from the local languages into English and analyzed using the ATLAS.ti software by using thematic analysi to identify major themes. The first step was reading and re-reading of the transcripts and field notes before the coding and analysis. Then, guided by the objective of the survey, a codebook was prepared after coding two key informant interviews transcripts and reviewed by the qualitative study team before starting the coding.
2.7. Ethical Consideration
Ethical approval was obtained from the Institutional Review Board (IRB) of Hawasa University (Reference number: IRB/288/15). Support letters were obtained from the Ministry of Health and Regional Health Bureaus after they were notified of the purpose of the study. Official letters of support were submitted to zonal health departments, woreda health offices, and local administrators. Survey participants were given adequate information about the survey, including the purpose of the study, benefits, risks, the nature of the confidentiality of the study, and their right not to participate or withdraw at any time from the study. The data were collected via anonymously prepared electronic data collection devices. Furthermore, the team of researchers maintained the principles of the Helsinki declaration.
3. Result
3.1. Stock Management
3.1.1. Stock Management at Central and EPSS Hubs
The central hub and all EPSS hubs had computerized stock records, the maximum levels recorded at the central hub and 14 EPSS hubs. Stock records were well-organized at the central hub and four EPSS hubs. The vaccine stock in all hubs was arranged by vaccine type and expiry lot. Stock records were securely placed at the central and four EPSS hubs. The central hub and two EPSS hubs kept vaccine stock records for at least 3 years. The central-hub and one sub-central hub conducted four physical stock counts in the last 12 months, while others varied. Seven EPSS hubs had the highest number of physical stock counts, with 12 records (Table 1).
Effective vaccine management relies on proper storage, stock control, inventory, and handling. The EPSS system ensures central-level compliance with cold chain standards through inspections and documentation. Stock management includes reporting levels, submitting requests, and using platforms such as Whats App for communication.
“Regarding stock management, we usually set the minimum and maximum plan. We monitor monthly stock, and branches send their report quarterly, but they send their monthly vaccine stock in total too. Then we take stock from the head office and check if that stock is within the range.” KII, EPSS Central level
All EPSS hubs electronically submit vaccine requests to the central hubs, with 14 hubs recording these requests. All the EPSS hubs and the central hub receive vaccine requests and maintain records of vaccine release. In the central hub and 13 EPSS hubs, vaccine stocks are replenished on a regular schedule.
Over the past 12 months, hubs submitted varying quantities of requests: three hubs each made 12, 10, and 7 requests, while 11 hubs made four requests in total. Some hubs made unscheduled emergency requests: one hub made seven, three hubs made two, and one hub made one. Only four hubs included some or all of the following data items in their report: temperature alarm data, functionality of cold chain equipment, vaccine consumption data, vaccine stock data, closed vial wastage data, and vaccination data.
Key informants stress the importance of data management and visibility at all levels of the vaccination supply chain, advocating for automated data visibility to support decision-making. Regional health institutions submit vaccine report forms for timely delivery, essential for managing stock-outs and forecasting. However, data visibility is inconsistent across healthcare systems, with hospitals having better visibility than facilities below the zonal level.
3.2. Vaccine Stock Management at Lowest Distribution and Service Provision Levels
Of 285 institutions, 98 (34.39%), do not refill vaccine stocks regularly. This tendency is more pronounced in HPs. Furthermore, 49 (17.19%) of the institutions do not submit vaccine requests, HPs being less likely to do so, as it is not part of their SOP.
Out of the 236 institutions that submit vaccine requests, 175 (74.15%) do not do so electronically. However, among those that do, 192 (81.36%) keep records of vaccine requests. Hospitals have the highest proportion of records (83.33%), followed by WorHO (93.98%), HCs (94.68%), and HPs (31.91%). Records of vaccine requests are lowest in HPs (31.91%), followed by hospitals (16.67%), WorHO (6.02%), and HCs (5.32%).
Of 285 institutions, 113 (39.65%) lack vaccine stock records, with a significant majority (92.77%) of HPs falling into this category. In addition, 158 of 172 institutions (91.86%) with vaccination stock records reported not having computerized records.
Regarding vaccine receipts, the majority (61.05%) maintain records. HCs lead in this aspect (81.2%), followed by WorHOs (83.15%), hospitals (66.67%), and HPs (12.05%). Physical damage receipts for vaccines are minimal, with 98.84% of institutions reporting zero instances; Only WorHOs reported such receipts.
Concerning documented maximum stock levels for each vaccine, over three-fourths (76.16%) of institutions reported having them. HCs have the highest proportion (78.82%), followed by WorHOs (74.32%), hospitals (71.43%), and HPs (66.67%).
Figure 1.
Vaccine stock record management practice of lower and Service Provision levels by health institution types.
Figure 1.
Vaccine stock record management practice of lower and Service Provision levels by health institution types.
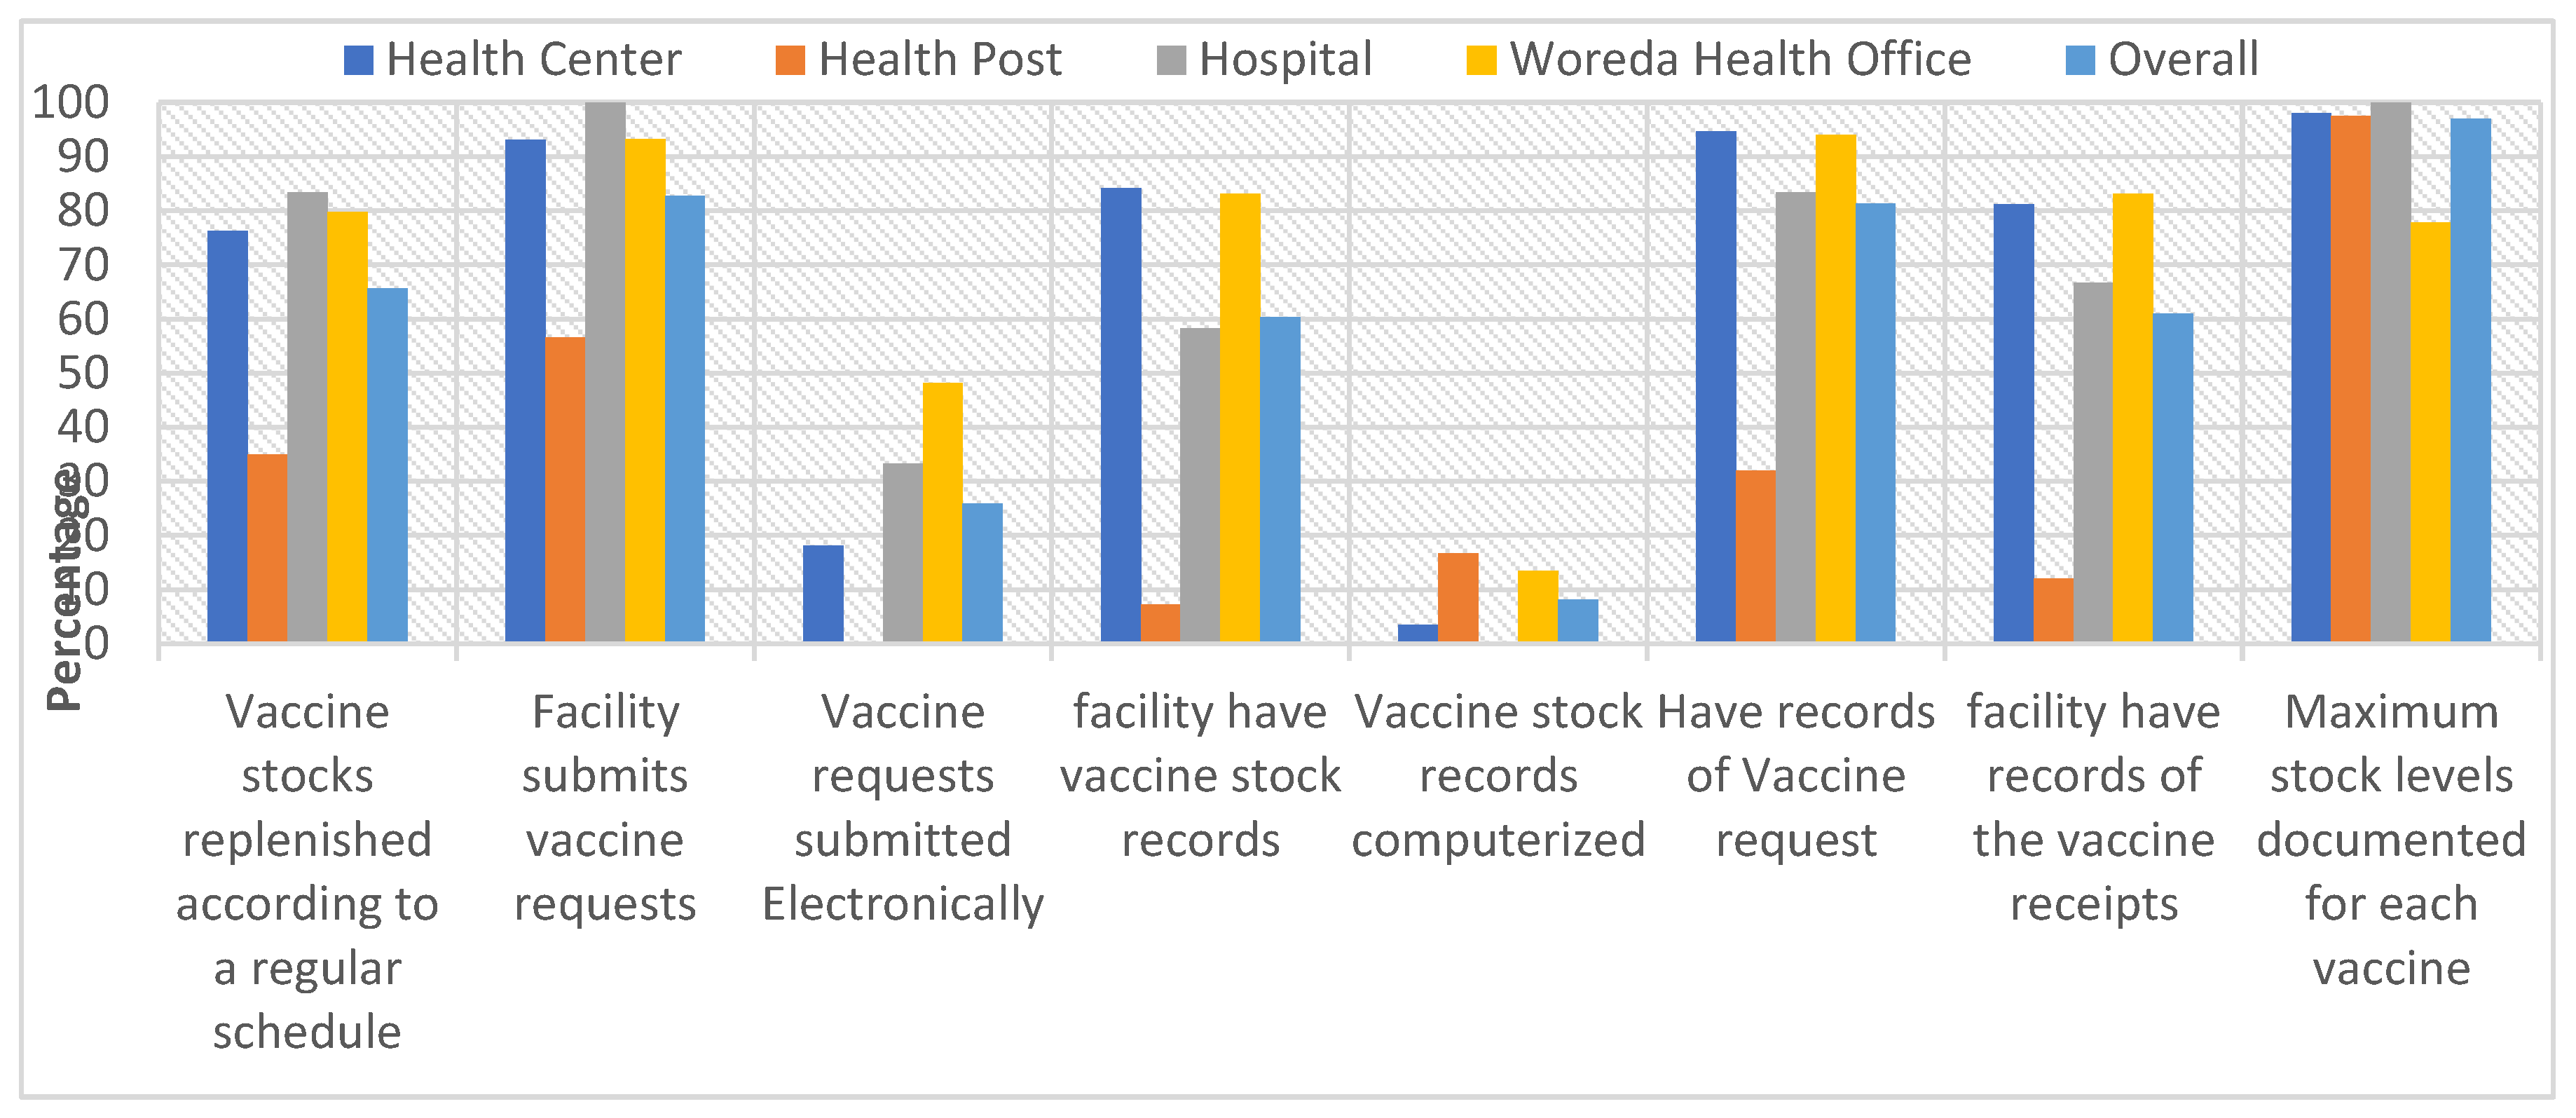
Table 2 displays the vaccine stock management system and distribution by type of health institution. Vaccine stock management for vaccine needs per receiving store was highest among WorHOss (76%), and HPs (70%). Vaccine quantity distribution deviated from allocation in the following order: HCs (95.45%), HPs (95.24%), WorHO (84.21%), and hospitals (75%). The majority of those evaluated health institutions (84.85%) maintain complete distribution and allocation records. Completeness of distribution and allocation records varies from 68.42.00% for WorHo to 95.24% for HPs. The stock management system indicates whether vaccine stock levels fall between the established minimum and maximum, ranging from 57% for hospitals to 73% for health posts.
3.3. Stock Records at Lowest Distribution and Service Provision Levels
Table 3 present stock records at lowest distributions and service provision levels at the facility and regional levels, respectively. All hospitals maintained diluent stock records, with 88.2% of HCs and 75.0% of HPs also having diluent stock records. Dilutant stock records were available in 144 (88.9%) institutions, with regions such as Addis Ababa, Gambela, Harari, Sidama, and Southwest showing 100% availability. Well-organized stock records were observed in 119 (67.23%) institutions, with records securely kept in 103 (70.7%) institutions. HPs and hospitals kept complete stock records, followed by WorHOss (89.83%) and HCs (81.58%). Vaccine stock record availability by regions shows Addis Ababa and Dire Dawa Cities, had fully completed records.
The majority of health institutions (67.23%) reported having well-organized vaccine stock records, which include records filled by vaccine type and transaction type. HPs had the highest proportion (72.0%), followed by HCs (67.21%), WorHOs (67.80%), and hospitals (28.57%).
Retention of vaccination stock records for a minimum of three years was required, with 55% of HCs, 46.0% of HPs, 45.8% of WorHOs, and 28.6% of hospitals meeting this requirements. Over the last 12 months, vaccine storage emergencies occurred in 28 (9.86%) institutions, with records of unopened vial wastage available in 89 (31.23%) institutions. Additionally, 103 (70.07%) of health institutions stored their vaccine stock records securely, such as in a locked filing cabinet or cap board, with a high proportion (76.92%) among health posts. Distribution and allocation records were updated monthly for 54 (81%) of the institutions, with all hospitals adhering to monthly updates (Table 3).
Stock management challenges vary across facility levels, with lower-level institutions and newly established regions experiencing technology shortages causing submission delays. A shortage of ledger books at the woreda level significantly affects documentation and the effectiveness of stock management. Health posts in regions like Afar resort to providing copied versions of ledgers, which are considered inadequate. Stock outs of vaccines such as OPV, Rota, and BCG from EPSS at the country level are also noted, possibly linked to a shortage of cold vans and related issues.
“We register vaccine supplies on stock management ledger book monthly as collected from woreda health office and distribute it to health posts of our catchment even it is currently interrupted due not trained/ experienced new EPI focal.” KII, HC_ EPI focal
Stock out challenges in vaccine distribution is often linked to transportation shortages, such as the inability to transport enough vaccines using motorcycles. Additionally, newly appointed EPI focal persons without prior training can lead to inadequate stock management in some HPs, affecting vaccination service provision. Bordering institutions also face challenges due to mobile populations traveling to neighboring countries, causing sporadic dropouts and artificial stock outs due to fluctuating population flow.
“The other challenge is those of people who are dropout from the program, they are not in the camp. Maybe they are going to South Sudan, or they are going to the border or else they are going to gold mining. This dropout rate is not going to be traced on time. They came after nine months something, something.” KII, GM HF EPI focal
- Utilization of available capacity at lowest distribution and service provision levels
Vaccine storage and supply in health institutions are influenced by factors such as facility type, storage method, transportation mode, and insulated containers, leading to disparities between higher and lower-level institutions both in quantity and quality. Challenges include insufficient active storage devices and reliance on supplying stores, necessitating improvements for vaccine effectiveness and safety. Active storage methods are less common among facilities and WorHOs. Among the 286 health institutions, only 42 (15%) utilize long-term passive storage devices for vaccines. The distribution of long-term passive storage users among HCs, HPs, hospitals, and WorHOs is 16 (15.8%), 8 (9.6%), 2 (16.7%), and 16 (17.9%) respectively. A similar proportion (15.8% to 17.8%) of HCs, hospitals, and WorHOs adopt long-term passive storage, while only 9.6% of HPs do so, possibly explaining the non-significant association test. About 42% of institutions retrieve vaccines from the supplying store.
Transportation and storage capacity challenges disproportionately affect pastoralist regions due to limited transportation options and the nomadic nature of the population. Health workers often trek long distances on foot in harsh weather to reach remote health facilities.
Vaccine storage and management practices are vital for the success of the vaccine supply chain, ensuring availability, potency, and safety, thereby protecting individuals and communities from vaccine-preventable diseases. Out of 240 institutions, 70% arrange vaccine stock by type, while 139 out of 239 institutions (58%) organize stocks by lot and expiry date (EEFO). Variations exist, ranging from 29% for HPs to 83% for hospitals, leading to a significant association between institutions and responses. Very few institutions (9.86%) reported vaccine storage emergencies, with hospitals having none, followed by HPs (9.64%), HCs (13.13%), and WorHOs (7.78%). About 89% of institutions took appropriate actions for vaccine storage emergencies; all WorHo took the right steps, followed by HPs (87.50%) and HCs (84.62%). Only 9.7% of institutions experienced downtime incidents affecting storage conditions in the last 12 months (Table 4).
Proportions of institutions in Somali (86%), Dire Dawa (75%), Harari (66.67%), Sidama (40%), and Benishangul (40%) regions didn’t arrange vaccine stocks by type. Likewise, Harari (100%), Dire Dawa (87.5%), Somalia (85.71%), and Sidama (70%) regions didn’t organize it by lot and expiry date (EEFO). However, 80% of institutions in Addis Ababa and Benishangul were arranged by EEFO (Annex Table 3).
Key informants report that vaccine storage involves categorization by vaccine types, utilizing designated compartments within the refrigerator for separate storage by trained staff. Temperature regulation occurs twice daily throughout the storage process to maintain the cold chain.
“We keep safety of vaccine according to cold chain management systems for example: which antigens are heat /cold sensitive and assigning place accordingly the fridge compartments and fridge tag monitoring systems twice a day and if high arm maintaining, by doing shake test method we can evaluate the antigens in the facility. In our facility there is a selected room for only cold chain and locked to protect untrained professionals.” KII, HCEPI Focal_SD
Some partners offer training on open vial policy, with a focus on high-dose vaccines like measles and BCG. Critical aspects include established policies, guidelines, and temperature monitoring as key performance indicators. Some regions prioritize daily and monthly temperature checks during performance reviews to prevent waste due to inadequate temperature monitoring.
“There is an open vial policy, and we give training on that. For example, there are vaccines that have a high dose, like measles and BCG. For that, there are policies, guides, and temperature monitoring, which are critical issues and key performance indicators. KII, National level partner
The finding shows that annual consumption and administration of various vaccine doses, highlighting variations. For Example, the median annual consumption of BCG doses is 2,255.03, with a maximum of 8,064,000, while the median administered is 1130.438, peaking at 4,032,000. Other vaccines, such as BOPV, DTwP-HepB-Hib, HPV, IPV, Measles, PCV-13, Rota_Liq, and Td, also exhibit considerable differences between consumed and administered doses. The minimum annual number of BCG, bOPV, HPV, dose consumed and administered found to be zero and the median annual of BCG for the National EPSS hub, EPSS hubs, HCs, HPs, Hospitals, Woreda Health office are 8064000, 471,088.72, 2389.404, 362.125, 17593.671, 9499.3 respectively (Annex1).
3.4. Distribution Practice of Vaccines and Dry Goods
3.4.1. Transportation and Distribution of Vaccines and Dry Goods at Central and EPSS Hubs
About ten EPSS hubs collect vaccines from the central hubs, which then distributes to five EPSS hubs. All hubs, including a Central and 15 EPSS hubs, distribute vaccines, with eight allowing other institutions to collect vaccines. Adequate space in the vaccine packing area facilitates timely transportation and distribution.
Of all hub vehicles, 52 vehicles at central and 31 vehicles at EPSS hubs are equipped with geographic location transmitters, while fire extinguishers are present in 52 vehicles at central and 28 vehicles at EPSS hubs, three lacking them. Contingency plans for transportation emergencies exist in the central hub and 10 EPSS hubs, with vaccine transportation logbooks available in the central and nine EPSS hubs.
Various strategies have been attempted to address conflict-related challenges, such as involving faith-based institutions in vaccine delivery in certain areas and implementing hit-and-run practices in conflict zones. Catch-up campaigns are conducted after conflicts end. Limited local humanitarian involvement complicates addressing challenges, potentially increasing zero-dose cases. Suggestions include improving cold chain capacity to enhance last-mile delivery to health institutions.
“…EPSSA should maximize direct supply site and minimize indirect supply approach for vaccine supply distribution.” KII, Regional EPI focal person
3.5. Distribution of Vaccines and Dry Goods at Lower Distribution and Service Provision Levels
In many regions, health institutions receive vaccines directly from EPSS regional hubs or supply stores at woreda rather than collecting themselves. All HCs in Addis Ababa, 91% in Gambella, 83.3% in Sidama, 72.2% in South West, and 71.4% in Harari have vaccines delivered directly to their facilities.
Overall, 56% of HCs receive vaccines from WorHO, while 44% collect vaccines from the supply store themselves. About 20% of institutions use road vehicles for vaccine collection or distribution, with respective percentages of 20%, 25%, and 41% for HCs, hospitals, and WorHOs. HPs, lacking vehicles, can only accept deliveries. Health centers and hospitals may use vehicles to collect from WorHOs, while WorHOs use vehicles for distribution to institutions. Despite the scarcity of road vehicles, 34 (26.2%) institutions reported that roads were either in poor condition or unusable year-round (Table 5).
The challenge of transportation and inadequate infrastructure not only hinders last-mile delivery implementation but also leads to EPI service interruptions, particularly in some districts during the rainy season.
Key informant interviews revealed that the ultimate goal of last-mile delivery remains unfulfilled in many health institutions due to various factors, primarily lack of storage facilities. However, transitioning to last-mile delivery is recognized as a significant improvement in the immunization supply chain. Direct delivery by EPSS to health institutions, achieving 100% effectiveness in certain regions like Sidama and Addis Ababa, enhances vaccine distribution efficiency. Shifting from monthly distribution to on-demand, proximity-based, and scheduled delivery further streamlines the process, reducing the need for intermediaries.
“Ethiopia’s immunization supply chain has undergone a transformation over the years. In the past, it was a vertical system where resources were distributed from health protection to region, from region to zone, and from zone to district. However, according to the Ethiopian pharmaceutical master plan, resources should go through EPSS in a coordinated manner… resources will be delivered to health facilities in two ways from 2018. One is that our EPSS branches will deliver direct resources to certain health facilities as EPSS branches in the districts. After that, the resource is transferred to the district, for example, if a district has four or five health centers. Then the health centers will distribute to health posts. The health institutions that EPSS delivers directly use their own.” KII, Partner National level
In areas where last-mile delivery is not practiced, WorHOs resort to using ambulances and/or motorcycles for supply delivery to health institutions within their catchments. However, issues such as the absence or malfunction of vehicles, coupled with inadequate road infrastructure, especially during the rainy season, pose significant challenges to effective vaccine distribution management.
“As I have said we are bringing vaccines by using motorcycle and we may not bring sufficient number of vaccines to be maintained in the stock. The stock may be maintained for not more than two weeks. Had it been a vehicle we may maintain for longer period of time (for a month or more).” KII, AMH HF EPI focal
Discussion
There were limited studies in the Vaccine storage, Stock Management, and Distribution Practices as a result, comparison could be made for a few indicators when variables are believed to have been collected in a similar manner. Stock management involves various steps such as forecasting, reserving 25% of the stock, making emergency requests, and updating ledger stock balances to minimize wastage. Health institutions submit supply requests to Woreda, sometimes utilizing direct communication technologies. A standardized vaccine request form is necessary for sustainable inventory tracking, procurement, storage, administration, and billing. Monthly requests are based on eligible children or population members in each kebele, ensuring accurate refill amounts with a mandatory ending balance and considering existing or previous month’s stock for effective resource utilization. This is in line with the strategies design and implemented by the Ministry of Health. The result indicated that 70% of vaccine stocks in health institutions arranged by vaccine type. This practice was low (46%) in health post and high (83%) in hospitals. This finding is higher than studies in Cameroon [13].
The study revealed that about 58% of health institutions arrange vaccine by lot and expire date and only 34.39% of the health institutions do not refill vaccine stocks regularly. This tendency is more pronounced in health posts. This finding is lower than Ateudjieu et al. [14] and Garabadu [15].
Effective vaccine stock management is essential for ensuring a smooth vaccine supply chain. Proper management minimizes the risk of stock-outs or wastage. Accordingly WHO guidline by 2025, 100% of vaccine storage sites order/monitor stock status electronically [16] Of the total submitted vaccine requests in lowest distribution sites, 74.15% were done non-electronically. Computerized records of vaccine requests are lowest in HPs. About 67.23% of heath institutions had well-organized vaccine stock records, which were categorized by vaccine type and transaction type. Our finding is higher than study done in Eastern Indian [15]. Our finding implies the disparity in reporting practice, emergency request among hubs indicating skewed distribution of activities among hubs. Challenges related to either not timely sending the request by the lower levels or to a shortage of cold van transportation, where the regional hubs could not deliver the vaccines lead to stock-outs at facility levels. Stock out is also common in Yemen as per Sule study [16]. Lack of automated data access hampers efficiency, and inadequate tools at the branch level contribute to incomplete end-to-end data management.
Accurate vaccine stock records are vital for efficient immunization supply chain management, ensuring availability, preventing stock-outs, optimizing storage and distribution, minimizing wastage, and facilitating monitoring and evaluation of immunization programs. Comprehensive records aid in planning and forecasting vaccine needs. Garabadu study highlights that the importance of storage emergencies, proper management, effective management and planning, coordination in vaccine distribution and seamless supply chain for effective vaccination program that is consistent with our findings [15].
Over the last 12 months, vaccination stock records storage emergencies occurred in 9.86% of health institutions. Additionally, 70.07% of health institutions stored their vaccine stock records securely. Distribution and allocation of records were updated monthly for 81% of the institutions. The finding is consistent with study done by Berhanu etal that shows the current practice are sub-optimal to ensure vaccine availability. (xx)
Ethiopia’s vaccine distribution has shifted towards last-mile delivery, with coordination through the EPSS system transforming the hierarchical ministry system to a district level. Under the current system, EPSS hubs directly deliver vaccines to WorHOs or to health facilities equipped with refrigerators or storage capabilities, bypassing the zonal health offices or regional bureaus. However, travel duration was influenced by road conditions, potentially affecting vaccine quality; and problem of compliance with WHO-recommended temperature ranges during transportation. Vaccines are collected, distributed, or provided to recipients using road vehicles by the central and all EPSS hubs. Despite efforts for last-mile delivery, Ethiopia’s vaccine distribution faces challenges, including poorly managed cold chain vehicles, insufficient staff, challenging terrains, and conflict zones, leading to delays and interruptions in vaccination campaigns. This finding is consistent with study in Nigeria [17].
The findings highlight significant challenges in vaccine management, primarily due to issues with transportation and cold chain management practices. Although insulated containers are widely used by hubs for vaccine distribution, the overall effectiveness is hampered by limited use of road vehicles and poor infrastructure. Only a fraction of health institutions employ road vehicles for immunization services, with substantial regional disparities. Areas with poor road conditions and insufficient functional ambulances, especially in pastoralist regions like Afar, face severe disruptions in vaccine distribution. Furthermore, the lack of proper refrigeration at lower levels exacerbates transportation challenges, complicating last-mile delivery and vaccine stock maintenance [18].
To enhance vaccine management, there is an urgent need to improve transportation infrastructure and increase vehicle availability, particularly in underserved and remote regions. Strengthening cold chain management and expanding last-mile delivery of vaccine are crucial to maintaining vaccine potency and ensuring timely immunization. Addressing these issues holistically can significantly improve the efficiency and reach of immunization programs. About 20% of institutions use road vehicles for vaccine collection or distribution. Despite the scarcity of road vehicles, 26.2% institutions reported that roads were either in poor condition or unusable year-round. Garabadu study shows a vaccine reach in a good condition with proper management of transportation [15]. Overall, 56% of HCs receive vaccines from WorHO, while 44% collect vaccines from the supply store themselves.
Conclusion
Efforts in vaccine procurement based on forecasting and micro-planning face challenges such as lack of denominators, migration/internal displacement, and cross-boundary movement from neighboring countries, impacting forecast effectiveness, stock management, and vaccine wastage. Implementation of computerized stock management systems at central and EPSS hubs has improved organization, yet issues persist, including late requests and shortages of cold van transportation which could lead to delays in vaccine delivery, potentially resulting in vaccine stock-outs and disruptions in immunization services. Although stock records are well-organized and identified by vaccine type, they are mostly insecurely placed at the central hub and four EPSS hubs.
Documentation at lower distribution and service provision levels is encouraging but lacks a computerized management system, hindering effective vaccine stock management. While stock management knowledge among staff is generally good, challenges persist among skilled personnel, particularly in effective warehouse management and calculating unopened vial waste rates.
The transition to last-mile delivery has improved distribution efficiency, but poor transportation infrastructure and inadequate storage equipment hinder effective distribution, especially at lower levels. Vehicle unavailability hampers effective distribution, especially at lower levels. This may affect ensuring timely and efficient vaccine distribution, particularly at lower levels, resulting in potential delays in immunization services and compromised vaccine coverage.
Recommendation
The following actions are suggested to enhance the effectiveness of the immunization storage, stock management and distribution to enhance supply chain management system:
- Implement measures to improve vaccine forecasting at the service provision level based on updated head counts and eligible population at the micro level through the health extension workers and considering migration and cross-boundary movement.
- Cascading implementation of a computerized stock management systems at all levels of the supply chain and use of standardized leisure books at the lower distribution and service provision levels to improve organization, reduce stock-outs, and minimize vaccine wastage.
- To ensure effectiveness of last-mile delivery, address challenges related to vehicle availability and transportation infrastructure to ensure timely and efficient vaccine delivery, especially at lower levels. The counties policy/SOP should address transportation logistics.
Author Contributions
All the authors contributed to the conception or design of the work; the acquisition, and interpretation of data. AKZ, YSY, MGS, MT, and GTA drafted the manuscript. All authors reviewed the work and approved the final version.
Funding
Amref Health Africa
Institutional Review Board Statement
Ethical approval was obtained from the Institutional Review Board (IRB) of Hawasa University (Reference number: IRB/288/15). Support letters were obtained from the Ministry of Health and Regional Health Bureaus after they were notified of the purpose of the study. Official letters of support were submitted to zonal health departments, woreda health offices, and local administrators. Survey participants were given adequate information about the survey, including the purpose of the study, benefits, risks, the nature of the confidentiality of the study, and their right not to participate or withdraw at any time from the study. The data were collected via anonymously prepared electronic data collection devices. Furthermore, the team of researchers maintained the principles of the Helsinki declaration.
Acknowledgments
The authors would like to thank Ministry of Health, AMREF Health Ethiopia for the financial support and Ethiopian statistical service for giving us the selected EAs and their maps. Our acknowledgment also goes to Addis Ababa University for supporting and facilitating the study. We are also grateful to Hospitals and health facilities for providing us all the necessary data and data collectors for their unreserved commitment.
Conflicts of Interest
The authors declared no conflicts of interests.
Appendix A
| Median | Min | Max | ||
|---|---|---|---|---|
| Annual number of BCG dose | Consumed | 2255.03 | 0 | 8064000 |
| administered | 1130.438 | 0 | 4032000 | |
| Annual number of bOPV dose | Consumed | 4976.873 | 0 | 17920000 |
| administered | 4468.292 | 0 | 16128000 | |
| Annual number of DTwP-HepB-Hib dose | Consumed | 3365.999 | 38.12 | 11974737 |
| administered | 3172.876 | 36.214 | 11376000 | |
| Annual number of HPV dose | Consumed | 863.638 | 0 | 2930526 |
| administered | 827.944 | 0 | 2784000 | |
| Annual number of IPV dose | Consumed | 1190.899 | 13.412 | 4213333 |
| administered | 1080.483 | 12.071 | 3792000 | |
| Annual number of Measles dose | Consumed | 3245.692 | 37.142 | 11667692 |
| administered | 2150.412 | 24.142 | 7584000 | |
| Annual number of PCV-13 dose | Consumed | 3534.671 | 40.237 | 12640000 |
| administered | 3172.876 | 17 | 11376000 | |
| Annual number of Rota_Liq dose | Consumed | 2232.424 | 25.413 | 7983158 |
| administered | 2150.412 | 24.142 | 7584000 | |
| Annual number of Td dose | Consumed | 3830.4 | 42.784 | 13440000 |
| administered | 3429.77 | 24 | 12096000 |
References
- WHO. Immunization Agenda 2030: A global strategy to leave no one behind; WHO: Geneva, Switzerland, 2022. [Google Scholar]
- FMOH, Ethiopia National Expanded Programme on Immunization Comprehensive Multi-Year Plan 2016 - 2020 MCH, Editor. 2015: Addis Ababa. p. 104.
- Lindstrand A, Cherian T, Chang-Blanc D, Feikin D, O’Brien KL. The world of immunization: achievements, challenges, and strategic vision for the next decade. The Journal of Infectious Diseases 2021, 224 (Suppl. S4), S452-S467.
- World Health Organization. Vaccine stock management: guidelines on stock records for immunization programme and vaccines store managers. World Health Organization; 2006.
- CSIS. Minding the Gap in Global Immunization Coverage. 2021; Available from: https://www.csis.org/analysis/minding-gap-global-immunization-coverage.
- ICF, E.P.H.I.E.E.a. , Ethiopia Mini Demographic and Health Survey 2019: Final Report., CSA, Editor. 2021, EPHI and ICF.: Rockville, Maryland, USA.
- Bangura, J.B. , et al., Barriers to childhood immunization in sub-Saharan Africa: A systematic review. BMC Public Health 2020, 20, 1108. [Google Scholar] [CrossRef] [PubMed]
- Feyisa, D. , et al., Adherence to WHO vaccine storage codes and vaccine cold chain management practices at primary healthcare facilities in Dalocha District of Silt’e Zone, Ethiopia. Trop Dis Travel Med Vaccines 2022, 8, 10. [Google Scholar] [CrossRef] [PubMed]
- Momose, H. , et al., A new method for the evaluation of vaccine safety based on comprehensive gene expression analysis. J Biomed Biotechnol 2010, 2010, 361841. [Google Scholar] [CrossRef]
- Argaw, M.D. , et al. , Immunization data quality and decision making in pertussis outbreak management in southern Ethiopia: a cross sectional study. Arch Public Health 2022, 80, 49. [Google Scholar]
- Bernardi FA, A.D. , Crepaldi NY, Yamada DB, Lima VC, Lopes Rijo RPC, Data Quality in health research: a systematic literature review. medRxiv 2022. [Internet]. 2022 Jan 1;2022.05.31.22275804.
- WHO, World Health Organization Vaccination Coverage Cluster Surveys: Reference Manual. (WHO/IVB/18.09). Licence: CC BY-NC-SA 3.0 IGO, 2018.
- Akoh W, Ateudjieu J, Nouetchognou J, Yakum M, Nembot F, Sonkeng S, et al. The expanded program on immunization service delivery in the Dschang health district, west region of Cameroon: a cross sectional survey. BMC public health 2016, 16, 801. [Google Scholar] [PubMed]
- Ateudjieu J, Kenfack B, Nkontchou BW, Demanou M. Program on immunization and cold chain monitoring: the status in eight health districts in Cameroon. BMC Res Notes. 2013, 6, 101. [Google Scholar] [CrossRef] [PubMed] [PubMed Central]
- Garabadu S, Panda M, Ranjan S, Nanda S. Assessment of vaccine storage practices in 2 districts of Eastern India -using global assessment tool. Int J Health Clin Res. 2020, 3, 62–66. [Google Scholar]
- Victor Sule, Vaccine Management Knowledge and Practice of Health workers in Yemen, 29 Dec 2022-Texila International Journal of Public Health.
- Adewole et al. Comparative Study on Drivers and Barriers of Vaccine Stock Management Practices Among Healthcare Workers in Northwestern State, Nigeria, 2023).
- FMOH, Ethiopia National Expanded Program On Immunization, Comprehensive Multi-Year Plan (2021-2025).

Table 1.
Vaccine stock record and arrangements of the Central and sub-Central EPSS hubs.
| Variables | Central | Sub-Central | Total | |
|---|---|---|---|---|
| Presence of expired vials in the cold/freezer rooms | 0 | 1 | 1 | |
| Facility has stock records for each vaccine on the vaccination schedule | 1 | 14 | 15 | |
| Stock record completeness | 1 | 14 | 15 | |
| Facility has diluent stock records | 1 | 11 | 12 | |
| Well organized vaccine stock records | 1 | 5 | 6 | |
| Vaccine stock records stored in a secure place | 1 | 4 | 5 | |
| Number of physical stock counts made in last 12 months | 12 Times | 0 | 7 | 7 |
| 11 Times | 0 | 1 | 1 | |
| 9 Times | 0 | 1 | 1 | |
| 4 Times | 1 | 4 | 5 | |
| 3 Times | 0 | 1 | 1 | |
| 1 time | 0 | 1 | 1 |
Table 2.
Stock management system by facility type at the LD and SP level.
| Variable | Health Institution type | |||||
|---|---|---|---|---|---|---|
| Health Center | Health Post | Hospital | WorHO | Total | ||
| Stock management system show vaccine needs per receiving store | Yes | 22 (59) | 21(70) | 4(67) | 19(76) | 66(67) |
| Stock management system show the quantities distributed against those allocated per supply period for each receiving store | Yes | 21(93) | 20(95) | 3(75) | 16(84) | 60(91) |
| Complete distribution and allocation records | Yes | 20(91) | 20(95) | 3(75) | 13(68) | 56(85) |
| Stock management system show vaccine stock levels are between the established minimum and maximum | Yes | 42 (69) | 38(73) | 4(57) | 32(55) | 116(65) |
Table 3.
Stock record arrangements at lower and service provision levels by health institution type at the LD and SP level.
Table 3.
Stock record arrangements at lower and service provision levels by health institution type at the LD and SP level.
| Variable | Health Institution type | |||||
|---|---|---|---|---|---|---|
| Health Center n(%) |
Health Post n(%) |
Hospital n(%) |
WorHO n(%) |
Total n(%) |
||
| Vaccine stock records well organized | Yes | 41(67) | 36(72) | 2(27) | 40(68) | 119(67) |
| Stock management system show if vaccine stock levels are between minimum and maximum | Yes | 42 (69) | 38(73) | 4(57) | 322(55) | 116 (65) |
| Stock records complete | Yes | 62 (81.8) | 4(100) | 5(100) | 53(90) | 124(86) |
| Presence of diluent stock records | Yes | 67 (88.2) | 3(75 | 5(100) | 52(88) | 127(88) |
| Vaccine stock records stored in a secure place | Yes | 33 (68.7) | 30(77) | 3(43) | 37(70) | 103(70) |
| How often are the distribution and allocation records updated? | Annually | 1 (5) | 0 (0) | 0(0) | 0(0) | 1(2) |
| Bi-annual. | 1(5) | 0 (0) | 0(0) | 0(0) | 1(2) | |
| Daily | 3(14) | 1(5) | 0(0) | 0(0) | 4(6) | |
| Monthly | 15(68) | 19(90) | 4(100) | 16(84) | 54(82) | |
| Quarterly | 0 (0) | 0(0) | 0(0) | 1(5) | 1(2) | |
| Weekly | 2(9) | 1(5) | 0(0) | 2(11) | 5(8) | |
| Total | 22 | 21 | 4 | 19 | 66 | |
Table 4.
Vaccine storage management practice by health facility type.
| Health Institution type | ||||||
|---|---|---|---|---|---|---|
| Health centre n(%) |
Health Post n(%) |
Hospital n (%) |
WorHO n(%) |
Total n(%) |
||
| Vaccine stocks arranged by vaccine type | Yes | 73(73) | 25(46) | 10(83) | 60(82) | 168(70) |
| Vaccine stocks arranged by lot and expiry date | Yes | 61(61) | 16(29) | 10(83) | 52(72) | 139(58) |
| Vaccine storage emergencies in the last 12 month | Yes | 13(13) | 8(10) | 0(0) | 7(8) | 28(10) |
| Appropriate actions taken during the most recent vaccine storage emergency | Yes | 11(85) | 7(88) | NA | 7(100) | 25(89) |
| WorHO=Woreda Health Office, NA: Not Applicable | ||||||
Table 5.
Distribution of vaccines at lower distribution and service provision levels by health institutions type in Ethiopia.
Table 5.
Distribution of vaccines at lower distribution and service provision levels by health institutions type in Ethiopia.
| Health Institution type | |||||||
|---|---|---|---|---|---|---|---|
| HC | HP | Hosp. | WorHO | Total | |||
| Collect vaccines from a supplying store | Yes | 44(44) | 31(37) | 4(33) | 40(44) | 119(42) | |
| Road vehicles used to collect, distribute vaccines or to provide | Yes | 20 (20) | 1(1) | 3(25) | 37(41) | 61(21) | |
| Access road in good condition | Yes | 14 (70) | 1(100) | 2(67) | 28(76) | 45(74) | |
| Road can be used year-round | Yes | 13(65) | 1(100) | 3(100) | 26(70) | 43(71) | |
| HC= HP Hosp. WorHO | |||||||
Disclaimer/Publisher’s Note: The statements, opinions and data contained in all publications are solely those of the individual author(s) and contributor(s) and not of MDPI and/or the editor(s). MDPI and/or the editor(s) disclaim responsibility for any injury to people or property resulting from any ideas, methods, instructions or products referred to in the content. |
© 2025 by the authors. Licensee MDPI, Basel, Switzerland. This article is an open access article distributed under the terms and conditions of the Creative Commons Attribution (CC BY) license (http://creativecommons.org/licenses/by/4.0/).
Copyright: This open access article is published under a Creative Commons CC BY 4.0 license, which permit the free download, distribution, and reuse, provided that the author and preprint are cited in any reuse.


