
Submitted:
25 February 2025
Posted:
27 February 2025
You are already at the latest version
Preprints on COVID-19 and SARS-CoV-2
Abstract
Background/Objectives: Routine immunisation (RI) coverage declines during the COVID-19 pandemic, from 2020 to 2022, are well-reported. With the declared end to the Public Health Emergency of International Concern in May 2023, and the end of most non-pharmaceutical interventions that were introduced to prevent or minimise COVID-19 spread, we (I) assess whether routine immunisation coverage has rebounded to pre-pandemic trends, and (II) seek to identify factors that help predict whether country performance has exceeded, maintained, or declined compared to expectations (based on time-series forecasting).
Methods: We quantify global and country-level routine immunisation diphtheria-tetanus-pertussis (DTP) coverage trends post-pandemic (2023) compared to pre-pandemic trends using time-series forecasting across 190 countries. We used Discriminant Analysis of Principal Components and Random Forests to identify relevant predictors of country-level coverage performance, including 28 indicators of health system strength, health workforce, country income, pandemic containment, economic, and health policies, and demographic aspects.
Results: We show that mean global DTP third-dose coverage levels remained on average 2.7% [95% confidence intervals: 1.1% - 4.3%] lower than expected in 2023. However, once accounting for temporal demographic changes, we find that this translates to the total number of immunised children almost reverting to expected levels, owing to decreasing fertility reducing global-level immunisation target populations. At a country-level, notable disruption remaining in over 30 countries (17.6% of countries below expectations, 81.6 within expected ranges, and 1.7% above expectations). Neither predictive method performed well at identifying factors associated with coverage disruptions.
Conclusions: Despite the end of COVID-19 pandemic measures, RI remains below expectations in 20% of countries. No clear drivers of this continued disruption were identified. Further research is required to inform recovery efforts and prevent future epidemic and pandemic disruptions to routine health services.
Keywords:
Routine immunisation
; COVID-19
; pandemic
; disruption
; global
1. Introduction
Routine immunisation (RI) – vaccinations given to infants typically aged 24-hours to 18-months old depending on vaccine schedule – is an essential preventative health intervention, estimated by the World Health Organisation (WHO) to prevent 3.5 to 5 million deaths per year [1]. Declines or disruptions to RI coverage risk vaccine-preventable deaths and disease outbreaks [2]. Such disruptions and declines occurred during the SARS-CoV-2 (COVID-19) pandemic from 2020 to 2022, according to both health worker and parental/ guardian surveys [3,4,5] and quantitative modelling [6,7]. Global trends indicated coverage declines in 2020, reaching an almost twenty years low in 2021, followed by tentative hints of recovery in 2022 [7]. Understanding if disruptions remain, and where, is important to helping target finite resources for catch-up to mitigate risk of vaccine-preventable deaths or outbreaks.
When considering immunity gaps from reduced coverage, understanding the number of missed immunisations is important to help inform catch-up activities, e.g., quantify additional vaccine requirements, or target efforts in areas with the most missed children. WHO and UNICEF Estimates of Immunisation Coverage (WUENIC) report coverage annually in terms of percentage coverage [8,9] – rather than absolute numbers of immunisations. Thus, changes in demography – including dramatic declines in global fertility rates [10] – must be combined with coverage levels to assess immunisation performance in terms of missed populations. Here, we use WUENIC coverage and United Nations World Population Prospects (UNWPP) data [11] to account for demographic changes when exploring country-level and global-level RI performance post-pandemic.
Understanding the drivers of immunisation disruption is crucial to implementing effective countermeasures and preventing such declines in the future. During the COVID-19 pandemic, survey respondents cited increased vaccine hesitancy, the focus of limited immunisation resources on COVID-19 vaccination campaign efforts, health system closures, increased difficulty travelling to health facilities, fear of catching COVID-19, and/or lockdowns as drivers of interruptions as drivers of disruption [12,13,14]. These factors typically ended by 2023: WHO declared an end to the COVID-19 Public Health Emergency of International Concern on May 5th 2023 [15], and most countries ended or had already reduced pandemic response policies and COVID-19 vaccine mandates. However, it remains unclear whether the easing or ending of these restrictions and requirements enabled RI coverage to revert to pre-pandemic trends in the first year after the pandemic.
Here we aimed to:
1) Quantify global and country-level immunisation coverage trends in 2023 compared to during (2020-2022) and pre-pandemic (2000-2019), in terms of percentage coverage and number of immunisations
2) Explore potential predictors that help understand DTP3 country performance compared to expectations, factoring in country demographics, RI programme breadth, health financing, pandemic health system disruption, and COVID-19 policy responses
2. Materials and Methods
2.1. Coverage trends
We use our previously published methodology for forecasting expected coverage in the absence of disruptions in 2020-2023, updated for the most recent WUENIC data (published July 2024, [16]). In brief, we used ARIMA time series forecasting [17] based on coverage trends since 2000 to project 2020-2023 coverage levels per country, and then calculated coverage deltas (defined as reported – modelled coverage, i.e., negative coverage delta indicates coverage lower than expected) for this period. We do this for diphtheria-tetanus-pertussis (DTP) first-dose (DTP1) to understand trends in reaching Zero Dose children – those that receive no vaccinations [18] and are considered essential for reaching Sustainable Development Goals, and third-dose (DTP3) to understand broad immunisation system performance trends [19].
2.2. Global and country-level performance
To assess global coverage trends, we conducted (1) t-tests on coverage deltas per year across all countries, and (2) translated coverage trends into number of immunisations per year (based on UNWPP surviving infant estimates [11]) and calculated the corresponding t-tests on deltas in number of immunisations. For both the hypothesis (H0) was that the delta is zero. To assess country-level performance, countries are classified into three categories based on 2023 performance: either below expectations (reported coverage < expected) and outside 95% ARIMA confidence intervals, within expectations, or above expectations (reported coverage > expected) and outside 95% ARIMA confidence intervals.
2.3. Predicting RI performance
We consolidated 28 descriptors from a range of publicly available nationwide datasets aiming to describe (i) variations in country health systems and service delivery, and (ii) major pandemic factors that may have disrupted health service delivery – see Table 1. The health system and financial variables aim to quantitatively summarise pre-pandemic immunisation and health system quality, performance, financial investment, and pandemic preparedness. The pandemic impact variables aim to synthesise potential key disruptors to routine immunisation delivery. Population size is included in case different sized countries are affected in different routes.
Data cleaning involved summarising pre-pandemic indicators as the mean of 2015 to 2019 values (unless not available, in which case 2019 data utilised); and synthesising annual indicators for during the pandemic into mean values per year (2020-2022; with the mean of this period used for 2023 analyses unless a 2023 value is available).
After excluding line items with one or more missing values, the final dataset for exploration is composed of 28 explanatory variables and 154 countries with 4 years of data per country (i.e., 616 line items).
We hypothesised that different combinations of variables may help explain coverage declines in different contexts, e.g., small countries with large COVID-19 health impact and less health financing available may have maintained coverage declines. Discriminant Analysis would be the designed approach for identifying linear combinations of predictors best predicting country performance classification [31,32], in the absence of correlation between the predictors. The presence of strong correlations between several predictors (Supplementary Material Figure S1) led us to use the Discriminant Analysis of Principal Components (DAPC) [30] instead, as it was designed to address this very issue. Briefly, DAPC first conducts a Principal Component Analysis (PCA [33,34]]) to pre-process (and orthogonalise) input predictors, and then performs a Discriminant Analysis on the resulting Principal Components. Here, the PCA step was achieved on centred and scaled data, to account for the different scales of the predictors. Repeated cross-validation with 100 replicates and a training set including 70% of randomly selected data points was used to assess the validity of group prediction by the DAPC, and to choose the optimal number of retained components in the PCA step. We report the DAPC model fit in terms of accuracy of classification per category on the test dataset, and the findings of the variables identified as key contributors.
To explore the existence of non-linear relationships between predictors and RI performance classification, we conducted a Random Forest analysis [35] on the same dataset (same 70:30 train/test split). We tuned the parameters of the model by exploring a range of tree (0-1000) sizes and number of splits (2-10) at each node and selected the parameter with the highest accuracy – which was a Forest of 150 trees with 10 splits at each node. We report the Random Forest model fit in terms of accuracy of classification per category on the test dataset, and the findings of the variables identified through importance measurements – (i) the Mean Decrease in Accuracy (MDA) when the predictor is excluded, and (ii) the mean decrease in the Gini index which assesses the purity of nodes and splits within the trees (Mean Decrease in Impurity, MDI).
We share code and all datasets on GitHub for full reproducibility [36].
3. Results
3.1. Coverage trends
t-tests find evidence of global DTP3 coverage declines vs. expectations in all years, with greatest decline in 2021 – see Table 2 and Figure 1C,D. However, when translating into number of immunisations and conducting a t-test on these trends, there is primarily strong evidence of coverage declines in 2021, and some evidence of rebounds to expected numbers of immunisations across the global target population of surviving infants in 2023 – see Table 3.
Visual comparison (Figure 1B,D) indicates the contribution of global demographic trends, with the total target population of surviving infants reducing by around 10 million children since 2015. Comparison of mean coverage and number of immunisations indicates the additional contribution of relative population size, i.e., some small states must be experiencing continued coverage reductions.
DTP1 results (Figure 1A,B) are directionally the same and even stronger than DTP3: point estimates of global coverage deltas are smaller, and for both 2022 and 2023 the delta in number of missed immunisations is within expected ranges. DTP1 coverage and missed immunisation t-test results table per year available in Supplementary Materials Tables S1 and S2.
At a country-level there is evidence that 35 countries out of the 190 modelled have coverage different than expected in 2023 for DTP3, and only 3 of these 35 are above expectations (Haiti, Brazil and Mauritania). Plotting 2023 country classification on a map indicates wide geographic dispersion of countries that have not yet recovered to pre-COVID coverage trends – Figure 2.
See Supplementary Materials Table S3 for a list of countries with coverage below expectations in 2023, ranked by delta in number of immunisations.
3.2. Predicting RI performance
DAPC cross-validation indicated that the optimal number of PCA axes to be retained was the maximum (Supplementary Materials Figure S2) and that this provided better-than-random predictions of RI classification 82% of the time. The predictive power was limited: the model tended towards over-classification of most countries as within expected ranges, and particularly struggled to classify countries as below expectations – 98.2% class error, see Supplementary Materials Table S4 for confusion matrix). 55% of countries performing above expectations were classified correctly. Notably, the inclusion of the 9 data points where countries reported higher coverage – and where model fitting may be poor and unrepresentative (e.g., Haiti and Brazil) may have skewed the findings, since the set of explanatory variables differed completely when including or not these 9 countries. When classifying into three categories, the contributing explanatory variables were pre-pandemic health system and immunisation system strength. When removing above expectations category and classifying countries into two categories, the key explanatory factors were government health financing, public transit closure, and mask wearing mandates. The scatterplot of the DAPC (Figure 3) confirms that there is a considerable overlap between countries in different categories – particularly those with lower-than-expected coverage (magenta) or within expectations (gold) – and that only a few data points could be safely predicted.
When classifying into three categories, the variables identified as having explanatory power were: health system strength, pre-pandemic immunisation system performance. When excluding the countries that performed higher than expected, the same classification accuracy challenges were found, but the explanatory predictors were government health financing, public transit closure stringency, and mask wearing mandate stringency. This lack of consistency suggests the DAPC is over-indexing to a few datapoints that swing the results.
Similarly, the Random Forecast analysis classified the majority of countries as within expectations and also struggled to classify countries as below or above expectations (confusion matrices for the train and test datasets in Supplementary Materials Tables S4 and S5). The Random Forest did not identify any standout explanatory variables, with 11/28 variables having a relatively comparable mean decrease in accuracy (%) approximately or over 5% (Supplementary Materials Figure S3). These variables included population size, multiple financial indicators (GDP, all three components of health financing – government, external, and private), and health system descriptors (number of nurses, health system strength, global health security, pre-pandemic immunisation system strength), and pandemic policies (stay-at-home orders, elderly sheltering) and excess mortality.
Together, the low classification accuracy for identifying countries with coverage above or below expectations indicates that the country-level indicators considered here are unable to explain the discrepancies between expected and observed coverage performances.
4. Discussion
We report evidence that RI coverage is trending towards pre-pandemic expected levels, with stronger evidence for DTP1 than DTP3. The rebound is clearer when considering number of missed immunisations, but it is worth highlighting that there remains strong evidence that around 20% (32/190) of countries have coverage below expectations in 2023, even now that pandemic restrictions have been lifted. There are thus growing numbers of missed children to catch-up from during and now post-pandemic in some countries. The Big Catch-Up [37], launched by WHO, UNICEF, and Gavi to close COVID-19 RI gaps, aims to do this in Gavi-eligible countries. However, as Figure 2 helps visualise, of the 32 countries below confidence intervals expected coverage in 2023, only 9 (Kyrgyzstan, Haiti, Benin, Senegal, Democratic People’s Republic of Korea, Mozambique, Uganda, Sudan, and India) remain Gavi-eligible. Further (potentially self-funded) interventions are thus required in non-Gavi countries too (e.g., PAHO countries and high-income countries). Reporting on the number of missed children reached through the Big Catch-Up, and other efforts, will be essential to understanding the residual immunity gap from the pandemic.
Some directional insights are possible from our descriptive analyses. Comparing trends between mean percentage coverage and number of immunisations highlights the influence of declining fertility on target infant populations for immunisation. Similarly, comparing trends between expected and reported coverage for DTP1 and DTP3 is also encouraging with regards to efforts to reduce numbers of Zero Dose children. However, both examples highlight the need for detailed sub-national geospatial analyses (e.g., in Nigeria [38]) in order to understand the potentially heterogeneous impact that may be obscured through these nationwide, annual datasets. Such research could be prioritised in countries with aggregate coverage declines to help provide operational insights in missed populations to guide vaccine programmes implementation.
We were not able to identify descriptive factors with strong evidence of linear or non-linear association with RI coverage performance through DAPC or Random Forest analyses. Our ecological analyses at a population-level may be insufficiently detailed to understand more complex variation within countries. It may be that wide confidence intervals from the ARIMA modelling, or exploration of population averages, obscure some associations. Perhaps none of the factors explored may provide strong explanatory power – this in itself would be interesting, e.g., it could suggest that the number of immunisations offered in an infant RI schedule is not associated with RI disruptions indicating that programmes breadth does not place additional demands. Alternatively, other predictors may be required to understand drivers of continued coverage declines post-pandemic. One potential such driver could be increased vaccine hesitancy [39,40], which we had explored including using a proxy based on COVID-19 vaccine mandate stringency, however the dataset (and alternatives) was insufficiently complete.
Overall, these findings primarily indicate gaps for future research to address. Building resilient health systems that can buffer epidemic and pandemic disruptions will be essential to maintaining progress to global immunisation objectives and minimising the risks of outbreaks from vaccine-preventable diseases. Monitoring and reporting on more specific variables (e.g., health facility opening status), and sub-national data, could help identify drivers of coverage declines. The fact coverage has not rebounded in all countries post-pandemic, also raises the question as to what is driving continued coverage declines and stagnation, since factors reported as driving RI disruption (e.g., public transport restrictions, fear of catching COVID-19, COVID-19 vaccination campaigns [12,13,14]) did not occur in 2023 and yet coverage did not revert to forecast levels. We encourage investigation into the determinants of continued vaccine coverage declines post-pandemic.
Authors should discuss the results and how they can be interpreted from the perspective of previous studies and of the working hypotheses. The findings and their implications should be discussed in the broadest context possible. Future research directions may also be highlighted.
Supplementary Materials
The following supporting information can be downloaded at: www.mdpi.com/xxx/s1, Table S1: DTP1 coverage t-tests; Table S2: DTP1 number of immunisations t-tests; Figure S1: Predictor correlation plot; Table S3: Countries with coverage below expectations in 2023; Figure S2: Cross-validation of Discriminant Analysis of Principal Components; Table S4: Discriminant Analysis of Principal Components confusion matrix; Table S5: Random Forest confusion matrix for the train dataset; Table S6: Random Forest confusion matrix for the test dataset.
Author Contributions
Conceptualization, Beth Evans and Thibaut Jombart; Data curation, Beth Evans; Formal analysis, Beth Evans; Investigation, Beth Evans; Methodology, Beth Evans and Thibaut Jombart; Project administration, Laurent Kaiser; Software, Beth Evans; Supervision, Thibaut Jombart; Validation, Beth Evans and Thibaut Jombart; Visualization, Beth Evans; Writing – original draft, Beth Evans; Writing – review & editing, Beth Evans, Laurent Kaiser, Olivia Keiser and Thibaut Jombart.
Funding
TJ acknowledges funding from the MRC Centre for Global Infectious Disease Analysis (reference MR/R015600/1), jointly funded by the UK Medical Research Council (MRC) and the UK Foreign, Commonwealth & Development Office (FCDO), under the MRC/FCDO Concordat agreement and is also part of the EDCTP2 programme supported by the European Union. OK was funded by the Swiss National Science Foundation (grant number PP00P3_202660).
Institutional Review Board Statement
Not applicable.
Informed Consent Statement
Not applicable.
Data Availability Statement
All data and code for full reproducibility are available on GitHub: https://github.com/bevans249/ri_post_pandemic
Acknowledgments
In this section, you can acknowledge any support given which is not covered by the author contribution or funding sections. This may include administrative and technical support, or donations in kind (e.g., materials used for experiments).
Conflicts of Interest
The authors declare the following financial interests/personal relationships which may be considered as potential competing interests: • BE is currently employed by Gavi, the Vaccine Alliance. All research contained in this manuscript was conducted during a doctorate qualification, outside and independent of employment. Neither facilities, data, nor any other forms of input from Gavi, were used in this study. The research and manuscript are independent of Gavi, and the findings have not been discussed, reviewed, or endorsed by the Gavi Secretariat, or any Alliance members. • TJ acts as a consultant for the World Bank Group, the World Health Organisation, and Geomatys. This work is unrelated to the present paper and none of these organization had any impact on the study presented. The funders referenced in the Funding section had no role in the design and conduct of this study; collection, management, analysis, and interpretation of the data; preparation, review, or approval of the manuscript; and decision to submit the manuscript for publication.
Abbreviations
The following abbreviations are used in this manuscript:
| RI | Routine Immunisation |
| WUENIC | WHO and UNICEF Estimates of Immunisation Coverage |
| DTP | Diphtheria-tetanus-pertussis |
| PPP | Purchasing Power Parity |
| DAPC | Discriminant Analysis of Principal Components |
| PCA | Principal Component Analysis |
| PAHO | Pan-American Health Organisation |
References
- World Health Organisation Vaccines and Immunization. Available online: https://www.who.int/health-topics/vaccines-and-immunization#tab=tab_1 (accessed on 7 August 2023).
- Hartner, A.M.; Li, X.; Echeverria-Londono, S.; Roth, J.; Abbas, K.; Auzenbergs, M.; de Villiers, M.J.; Ferrari, M.J.; Fraser, K.; Fu, H.; et al. Estimating the Health Effects of COVID-19-Related Immunisation Disruptions in 112 Countries during 2020–30: A Modelling Study. Lancet Glob Health 2024, 12, e563–e571. [Google Scholar] [CrossRef] [PubMed]
- World Health Organisation Pulse Survey on Continuity of Essential Health Services during the COVID-19 Pandemic: Interim Report, 27 August 2020; 2020.
- World Health Organisation Second Round of the National Pulse Survey on Continuity of Essential Health Services during the COVID-19 Pandemic; 2021.
- World Health Organisation Third Round of the Global Pulse Survey on Continuity of Essential Health Services during the COVID-19 Pandemic; 2022.
- Causey, K.; Fullman, N.; Sorensen, R.J.D.; Galles, N.C.; Zheng, P.; Aravkin, A.; Danovaro-Holliday, M.C.; Martinez-Piedra, R.; Sodha, S. V.; Velandia-González, M.P.; et al. Estimating Global and Regional Disruptions to Routine Childhood Vaccine Coverage during the COVID-19 Pandemic in 2020: A Modelling Study. Lancet 2021, 398, 522–534. [Google Scholar] [CrossRef]
- Evans, B.; Keiser, O.; Kaiser, L.; Jombart, T. Analysis of Global Routine Immunisation Coverage Shows Disruption and Stagnation during the First Two-Years of the COVID-19 Pandemic with Tentative Recovery in 2022. Vaccine X 2023, 15, 100383. [Google Scholar] [CrossRef] [PubMed]
- Burton, A.; Monasch, R.; Lautenbach, B.; Gacic-Dobo, M.; Neill, M.; Karimov, R.; Wolfson, L.; Jones, G.; Birmingham, M. WHO and UNICEF Estimates of National Infant Immunization Coverage: Methods and Processes. Bull World Health Organ 2009, 87, 535–541. [Google Scholar] [CrossRef]
- Burton, A.; Kowalski, R.; Gacic-Dobo, M.; Karimov, R.; Brown, D. A Formal Representation of the WHO and UNICEF Estimates of National Immunization Coverage: A Computational Logic Approach. PLoS One 2012, 7, e47806. [Google Scholar] [CrossRef]
- Bhattacharjee, N. V.; Schumacher, A.E.; Aali, A.; Abate, Y.H.; Abbasgholizadeh, R.; Abbasian, M.; Abbasi-Kangevari, M.; Abbastabar, H.; ElHafeez, S.A.; Abd-Elsalam, S.; et al. Global Fertility in 204 Countries and Territories, 1950–2021, with Forecasts to 2100: A Comprehensive Demographic Analysis for the Global Burden of Disease Study 2021. The Lancet 2024, 403, 2057–2099. [Google Scholar] [CrossRef] [PubMed]
- United Nations World Population Prospects - Population Division - United Nations. Available online: https://population.un.org/wpp/ (accessed on 25 August 2024).
- Harris, R.C.; Chen, Y.; Côte, P.; Ardillon, A.; Nievera, M.C.; Ong-Lim, A.; Aiyamperumal, S.; Chong, C.P.; Kandasamy, K.V.; Mahenthiran, K.; et al. Impact of COVID-19 on Routine Immunisation in South-East Asia and Western Pacific: Disruptions and Solutions. Lancet Reg Health West Pac 2021, 10, 100140. [Google Scholar] [CrossRef] [PubMed]
- Pinto, A.M.C.; Shariq, S.; Ranasinghe, L.; Budhathoki, S.S.; Skirrow, H.; Whittaker, E.; Seddon, J.A. Reasons for Reductions in Routine Childhood Immunisation Uptake during the COVID-19 Pandemic in Low- and Middle-Income Countries: A Systematic Review. PLOS Global Public Health 2023, 3, e0001415. [Google Scholar] [CrossRef]
- Cardoso, A.M.; Id, P.; Shariq, S.; Ranasinghe Id, L.; Sundar, S.; Id, B.; Id, H.S.; Whittaker, E.; Seddon, J.A. Reasons for Reductions in Routine Childhood Immunisation Uptake during the COVID-19 Pandemic in Low- and Middle-Income Countries: A Systematic Review. PLOS Global Public Health 2023, 3, e0001415. [Google Scholar] [CrossRef]
- World Health Organisation Statement on the Fifteenth Meeting of the IHR (2005) Emergency Committee on the COVID-19 Pandemic. Available online: https://www.who.int/news/item/05-05-2023-statement-on-the-fifteenth-meeting-of-the-international-health-regulations-(2005)-emergency-committee-regarding-the-coronavirus-disease-(covid-19)-pandemic (accessed on 23 January 2025).
- Evans, B.; Jombart, T. Worldwide Routine Immunisation Coverage Regressed during the First Year of the COVID-19 Pandemic. Vaccine 2022, 40, 3531–3535. [Google Scholar] [CrossRef]
- Hyndman, R.J.; Khandakar, Y. Automatic Time Series Forecasting: The Forecast Package for R. J Stat Softw 2008, 27, 1–22. [Google Scholar] [CrossRef]
- Hogan, D.; Gupta, A. Why Reaching Zero-Dose Children Holds the Key to Achieving the Sustainable Development Goals. Vaccines 2023, Vol. 11, Page 781 2023, 11, 781. [Google Scholar] [CrossRef]
- O’brien, K.L.; Lindstrand, A.; Cherian, T.; Chang-Blanc, D.; Feikin, D. The Journal of Infectious Diseases The World of Immunization: Achievements, Challenges, and Strategic Vision for the Next Decade. The Journal of Infectious Diseases ® 2021, 224, 452–467. [Google Scholar] [CrossRef]
- WUENIC WHO UNICEF Immunization Coverage Estimates 2023 Revision. Available online: https://data.unicef.org/resources/dataset/immunization/ (accessed on 15 August 2023).
- WHO Immunization Data Portal - All Data. Available online: https://immunizationdata.who.int/global?topic=&location= (accessed on 27 January 2025).
- World Health Organisation Coverage of Essential Health Services (Index Based on Tracer Interventions That Include Reproductive, Maternal, Newborn and Child Health, Infectious Diseases, Non-Communicable Diseases and Service Capacity and Access) (SDG 3.8.1). Available online: https://platform.who.int/data/maternal-newborn-child-adolescent-ageing/indicator-explorer-new/MCA/coverage-of-essential-health-services-(index-interventions-reproductive-maternal-newborn-and-child-health)-(sdg-3.8.1) (accessed on 5 March 2024).
- World Health Organization The National Health Workforce Accounts Database. Available online: https://www.who.int/data/gho/data/themes/topics/health-workforce (accessed on 7 August 2024).
- Global Health Security Index GHS Index. Available online: https://ghsindex.org/about/ (accessed on 28 February 2024).
- Economist Impact GHS Index Methodology.
- World Health Organisation Global Health Expenditure Database. Available online: https://apps.who.int/nha/database/Select/Indicators/en (accessed on 9 March 2024).
- World Bank GDP per Capita, PPP (Current International $) | Data. Available online: https://data.worldbank.org/indicator/NY.GDP.PCAP.PP.CD (accessed on 9 August 2024).
- The Economist The Pandemic’s True Death Toll. Available online: https://www.economist.com/graphic-detail/coronavirus-excess-deaths-estimates (accessed on 3 May 2024).
- Our World In Data Estimated Cumulative Excess Deaths per 100,000 People during COVID, from The Economist. Available online: https://ourworldindata.org/grapher/excess-deaths-cumulative-per-100k-economist (accessed on 9 September 2024).
- Hale, T.; Angrist, N.; Goldszmidt, R.; Kira, B.; Petherick, A.; Phillips, T.; Webster, S.; Cameron-Blake, E.; Hallas, L.; Majumdar, S.; et al. A Global Panel Database of Pandemic Policies (Oxford COVID-19 Government Response Tracker). Nat Hum Behav 2021, 5, 529–538. [Google Scholar] [CrossRef]
- Lachenbruch, P.A.; Goldstein, M. Discriminant Analysis. Biometrics 1979, 35, 69. [Google Scholar] [CrossRef]
- FISHER, R.A. THE USE OF MULTIPLE MEASUREMENTS IN TAXONOMIC PROBLEMS. Ann Eugen 1936, 7, 179–188. [Google Scholar] [CrossRef]
- Hotelling, H. Analysis of a Complex of Statistical Variables into Principal Components. J Educ Psychol 1933, 24, 417–441. [Google Scholar] [CrossRef]
- Karl Pearson LIII. On Lines and Planes of Closest Fit to Systems of Points in Space. The London, Edinburgh, and Dublin Philosophical Magazine and Journal of Science 1901, 2, 559–572. [Google Scholar] [CrossRef]
- Ho, T.K. Random Decision Forests. Proceedings of the International Conference on Document Analysis and Recognition, ICDAR 1995, 1, 278–282. [Google Scholar] [CrossRef]
- Evans, B. Bevans249/Ri_post_pandemic: Quantification of Post-Pandemic (2023) Routine Immunisation Coverage Trends and Exploration of Variables to Classify Country Performance. Available online: https://github.com/bevans249/ri_post_pandemic (accessed on 3 February 2025).
- Global Partners Announce a New Effort – “The Big Catch-up” – to Vaccinate Millions of Children and Restore Immunization Progress Lost during the Pandemic. Available online: https://www.who.int/news/item/24-04-2023-global-partners-announce-a-new-effort-the-big-catch-up-to-vaccinate-millions-of-children-and-restore-immunization-progress-lost-during-the-pandemic (accessed on 15 August 2023).
- Aheto, J.M.K.; Olowe, I.D.; Chan, H.M.T.; Ekeh, A.; Dieng, B.; Fafunmi, B.; Setayesh, H.; Atuhaire, B.; Crawford, J.; Tatem, A.J.; et al. Geospatial Analyses of Recent Household Surveys to Assess Changes in the Distribution of Zero-Dose Children and Their Associated Factors before and during the COVID-19 Pandemic in Nigeria. Vaccines (Basel) 2023, 11, 1830. [Google Scholar] [CrossRef]
- Troiano, G.; Nardi, A. Vaccine Hesitancy in the Era of COVID-19. Public Health 2021, 194, 245–251. [Google Scholar] [CrossRef] [PubMed]
- He, K.; Mack, W.J.; Neely, M.; Lewis, L.; Anand, V. Parental Perspectives on Immunizations: Impact of the COVID-19 Pandemic on Childhood Vaccine Hesitancy. J Community Health 2022, 47, 39–52. [Google Scholar] [CrossRef] [PubMed]
Figure 1.
DTP1 (Panels A and B) and DTP3 (Panels C and D) trends overtime: Panels A and C show mean global coverage, and Panels B and D show total number of immunised children, per year from 2000 to 2023. Light blue indicates WUENIC-reported coverage in panel A, and derived number of immunisations based on population data in panel B; Dark blue indicates ARIMA-modelled expected coverage from 2020-2023, and associated number of immunisations based on population figures; and red indicates a proxy target coverage of 99% vaccination and associated number of children.
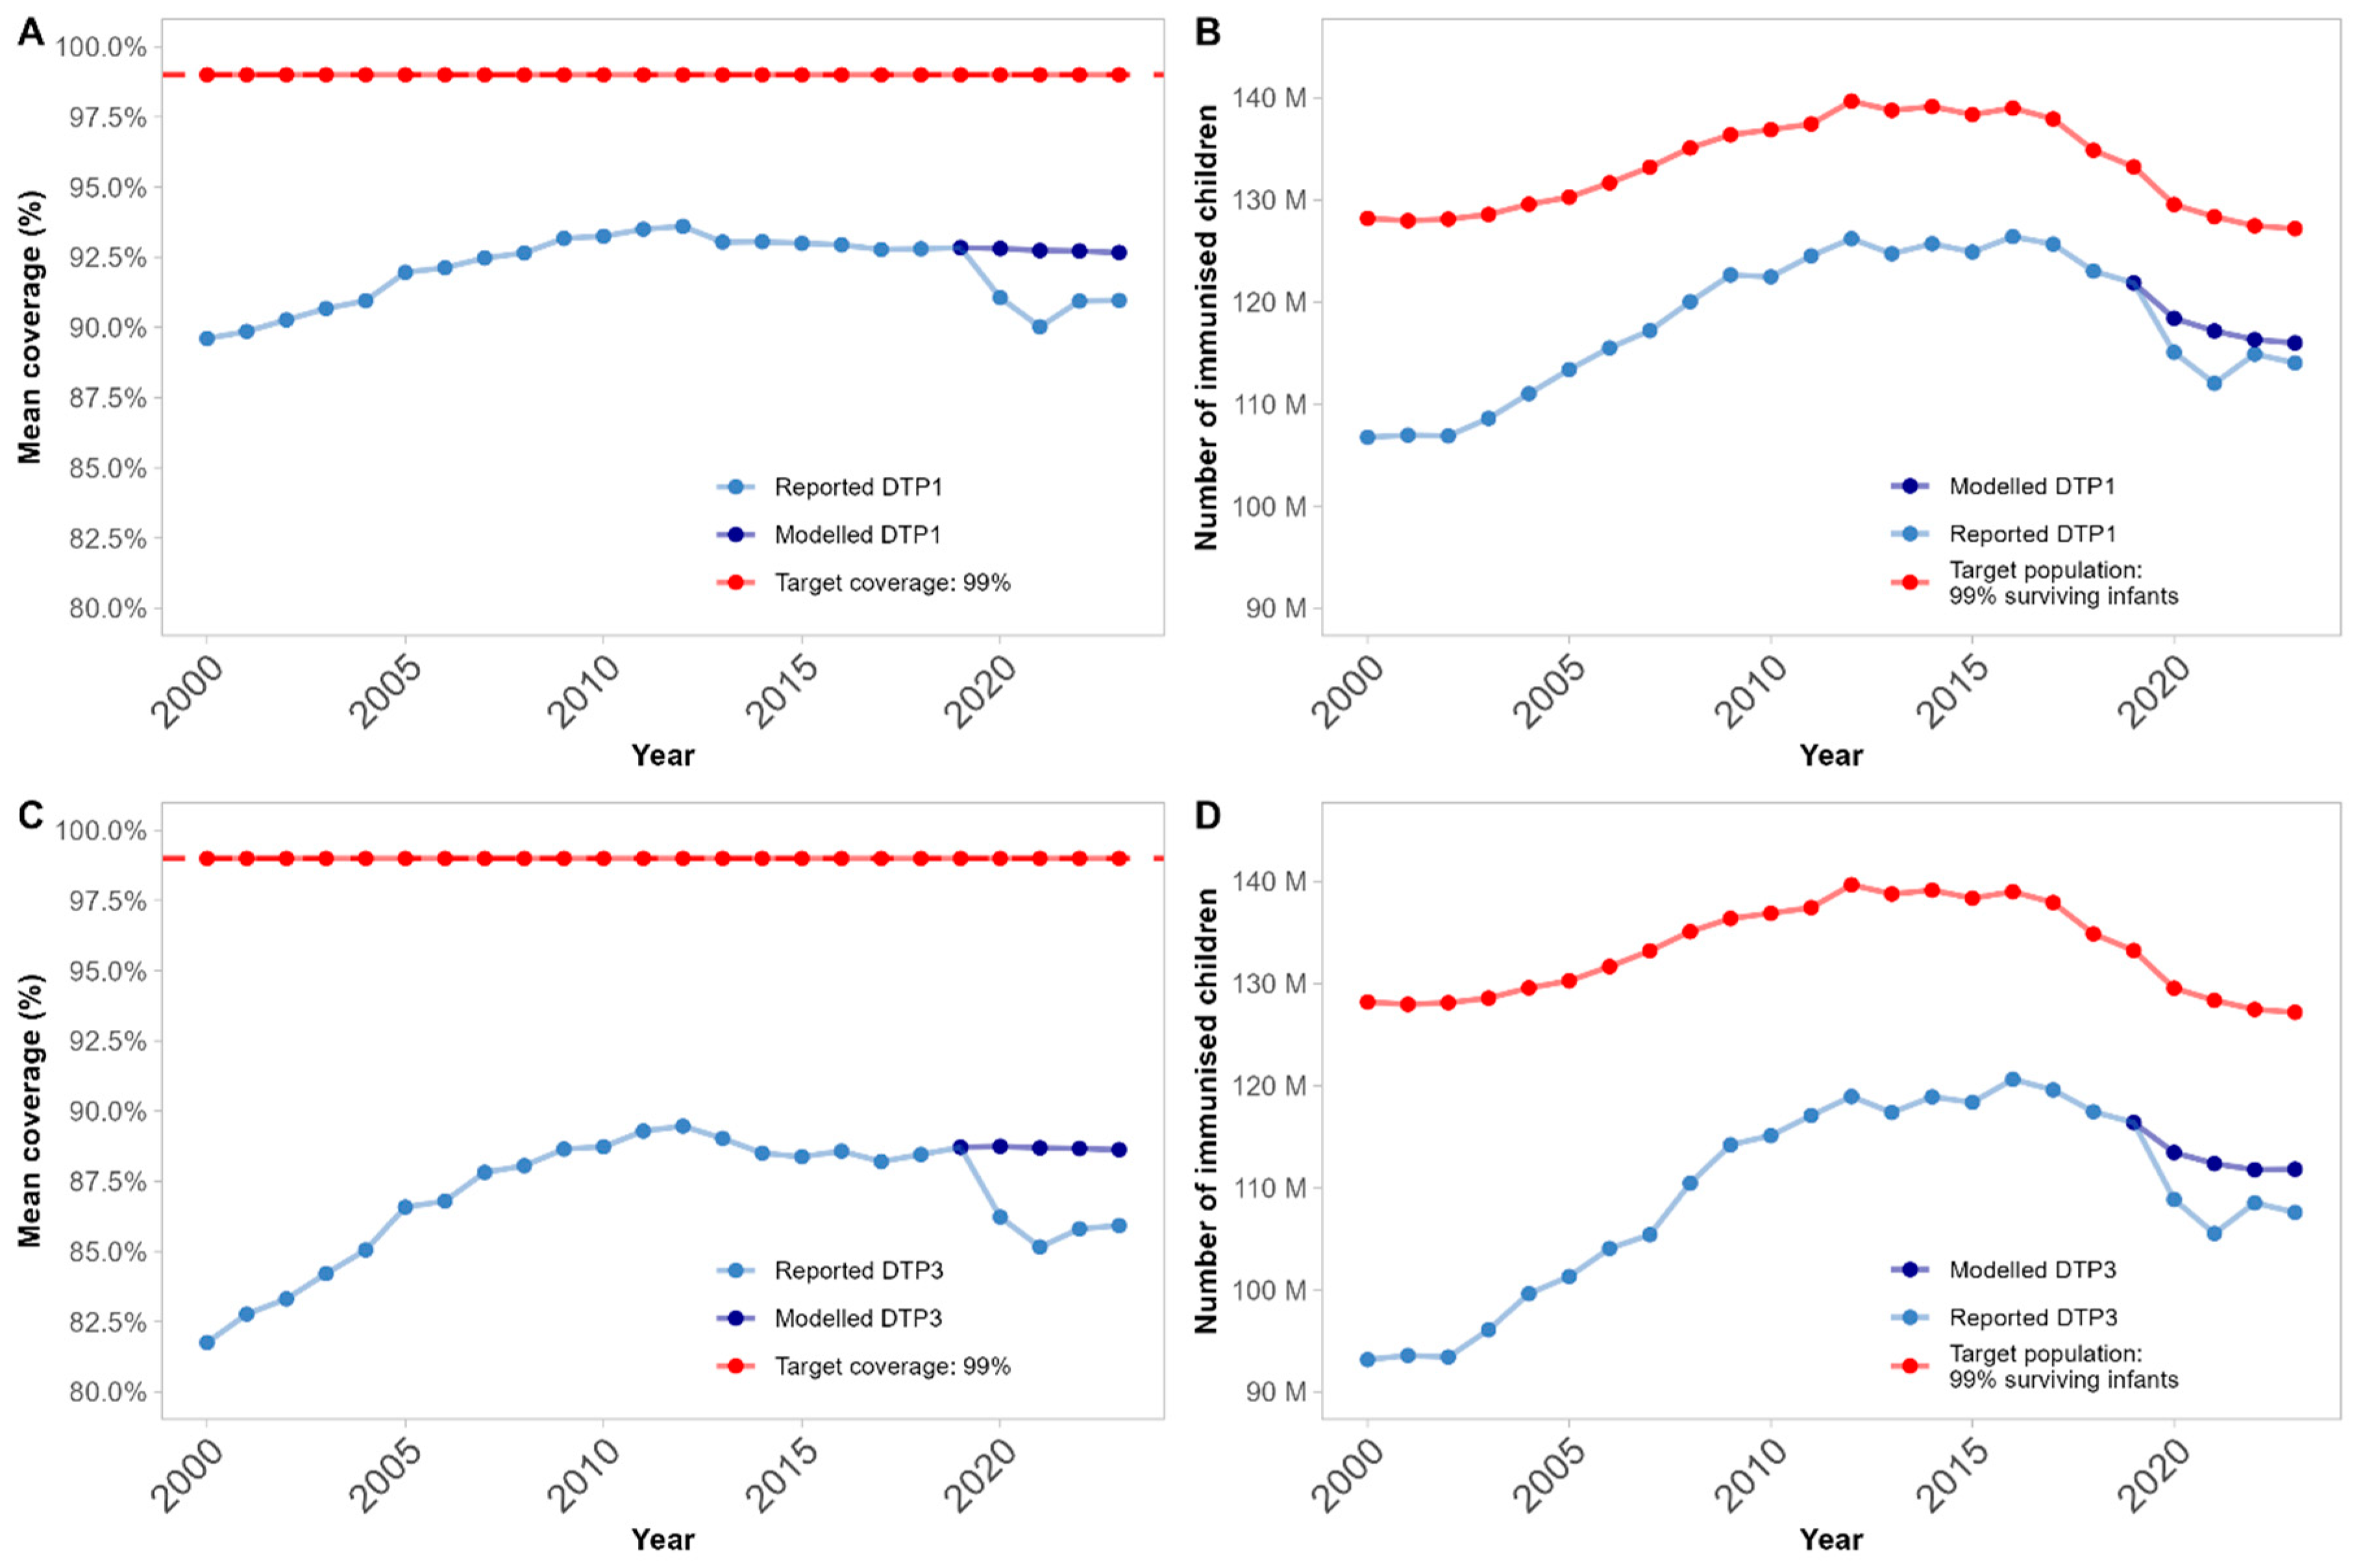
Figure 2.
Global map illustrating DTP3 coverage performance compared to expectations in 2023 per country: light grey countries lack sufficient data for inclusion; gold countries are within expected ranges (155 countries, 81.6%); cyan countries have improved above expectations from pre-pandemic trends (3 countries, 1.6%); and magenta countries are below expectations (32 countries, 16.8%). All classification is based on comparison of WUENIC reported data to 95% confidence intervals from the ARIMA-modelling.
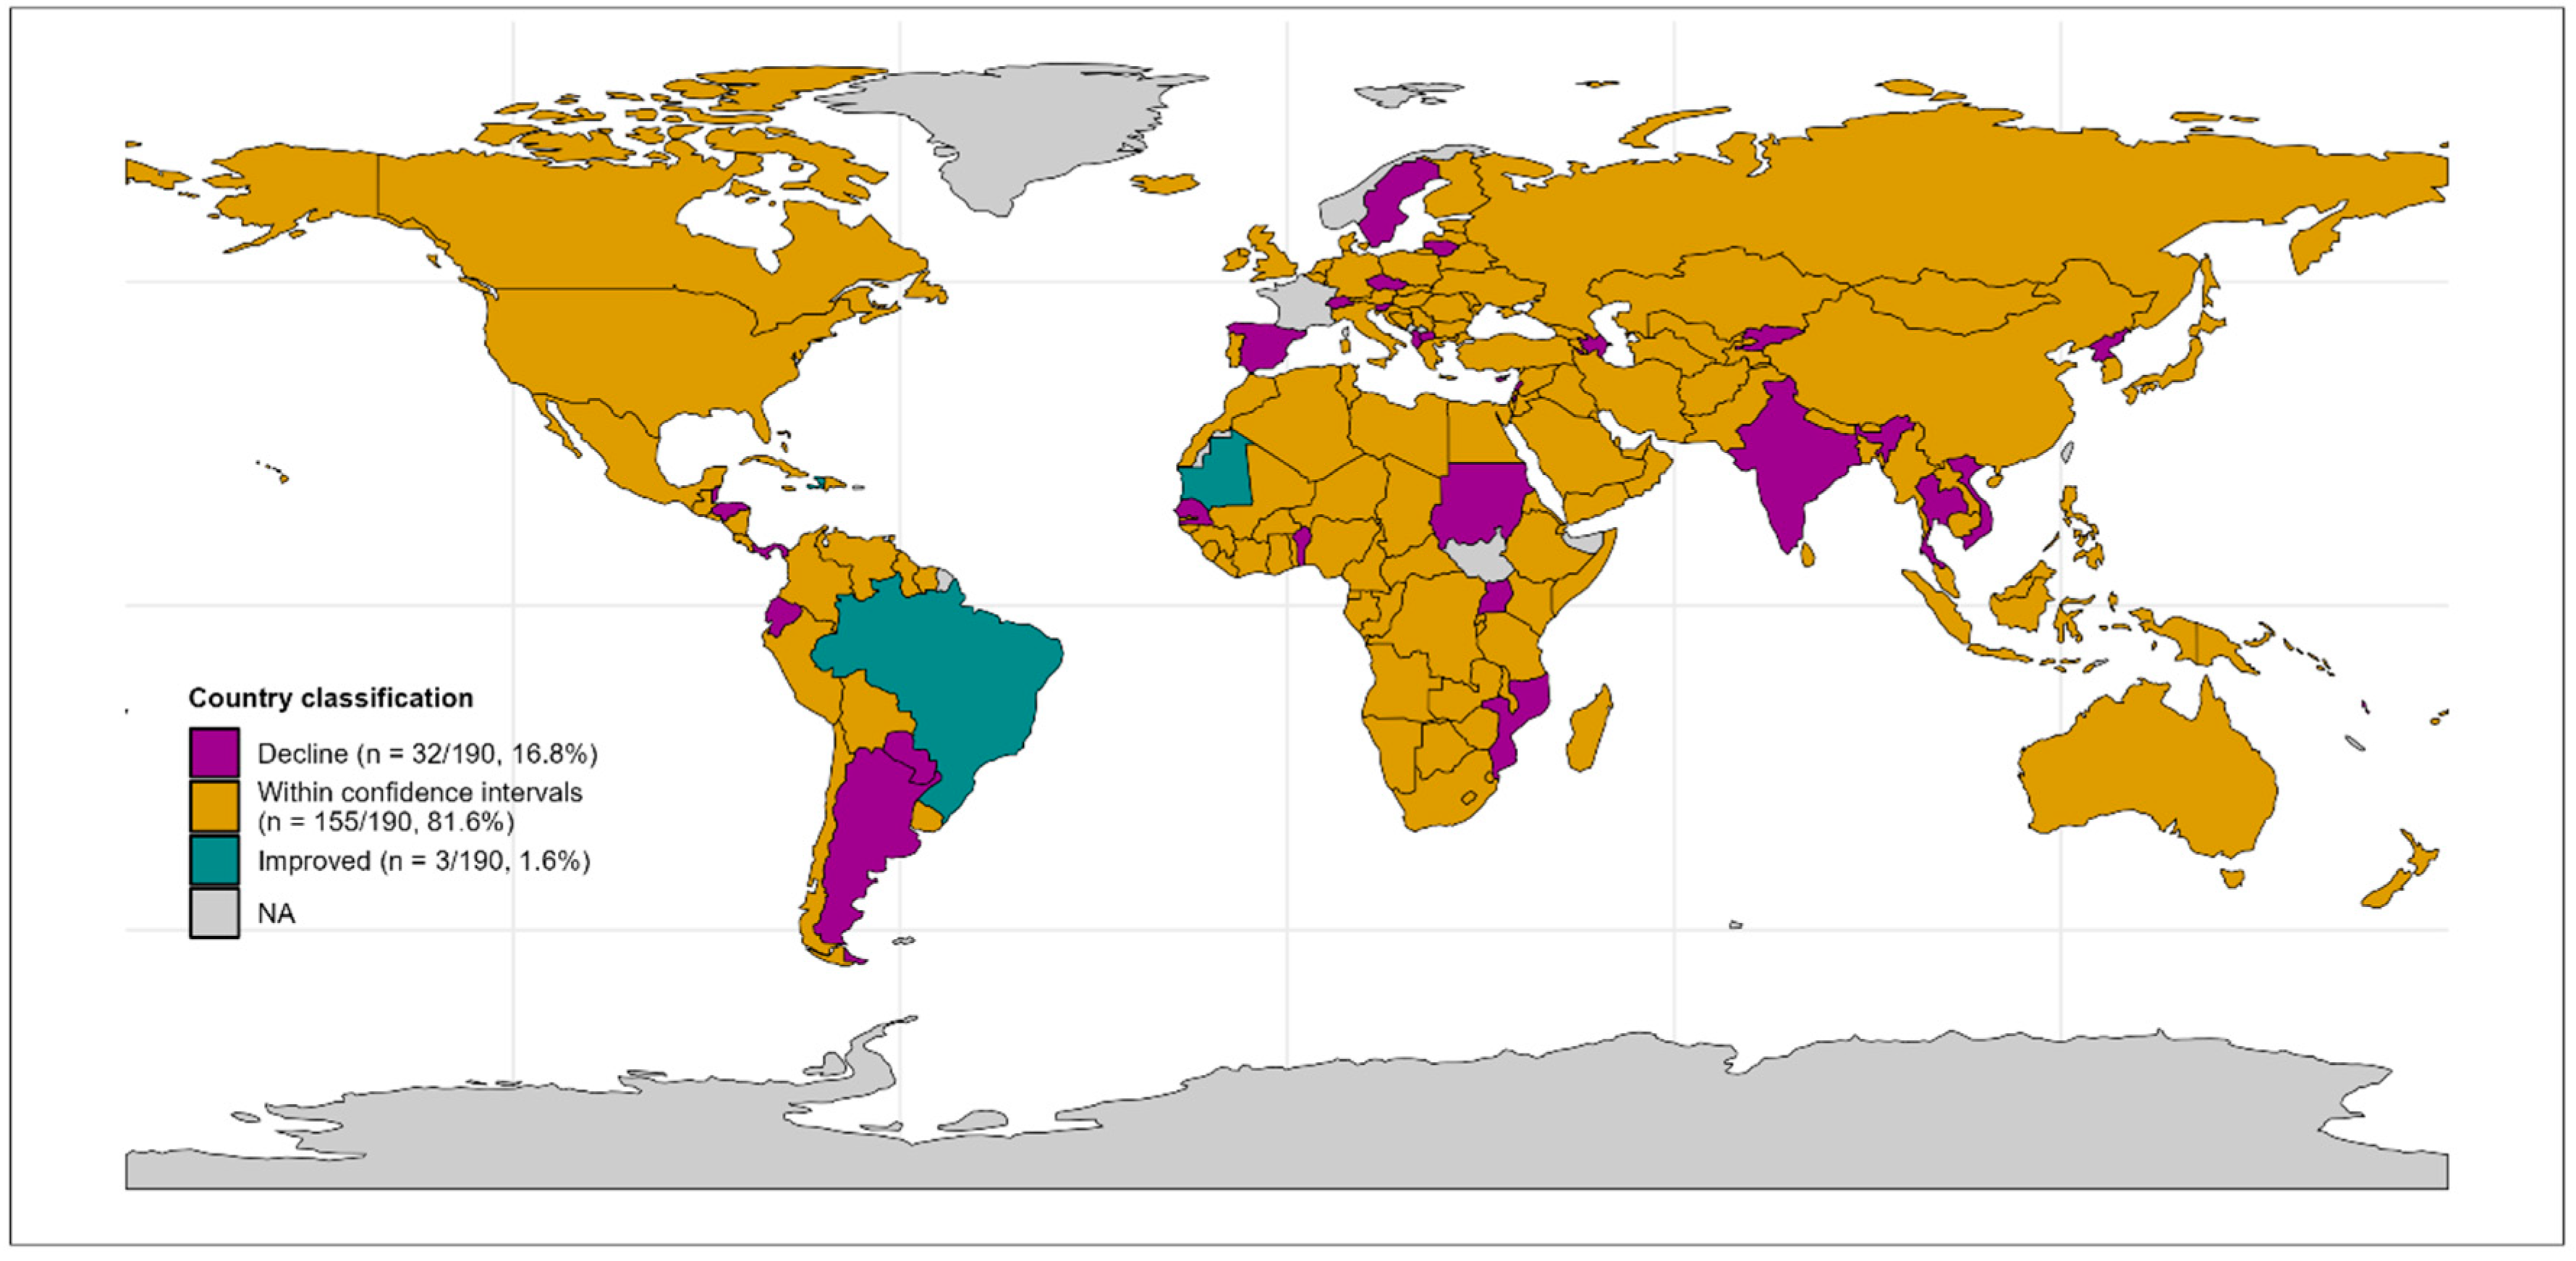
Figure 3.
Scatterplot of Discriminant Analysis of Principal Components: the x-axis and y-axis show the first two Principal Components of predictors. Magenta dots indicate countries where coverage was below expectations; gold dots indicate countries where coverage is within expected ranges; and cyan countries are above expectations. The overlap between the groups indicates the lack of differentiation between classes in underlying predictor variables, as clusters cannot be easily distinguished.
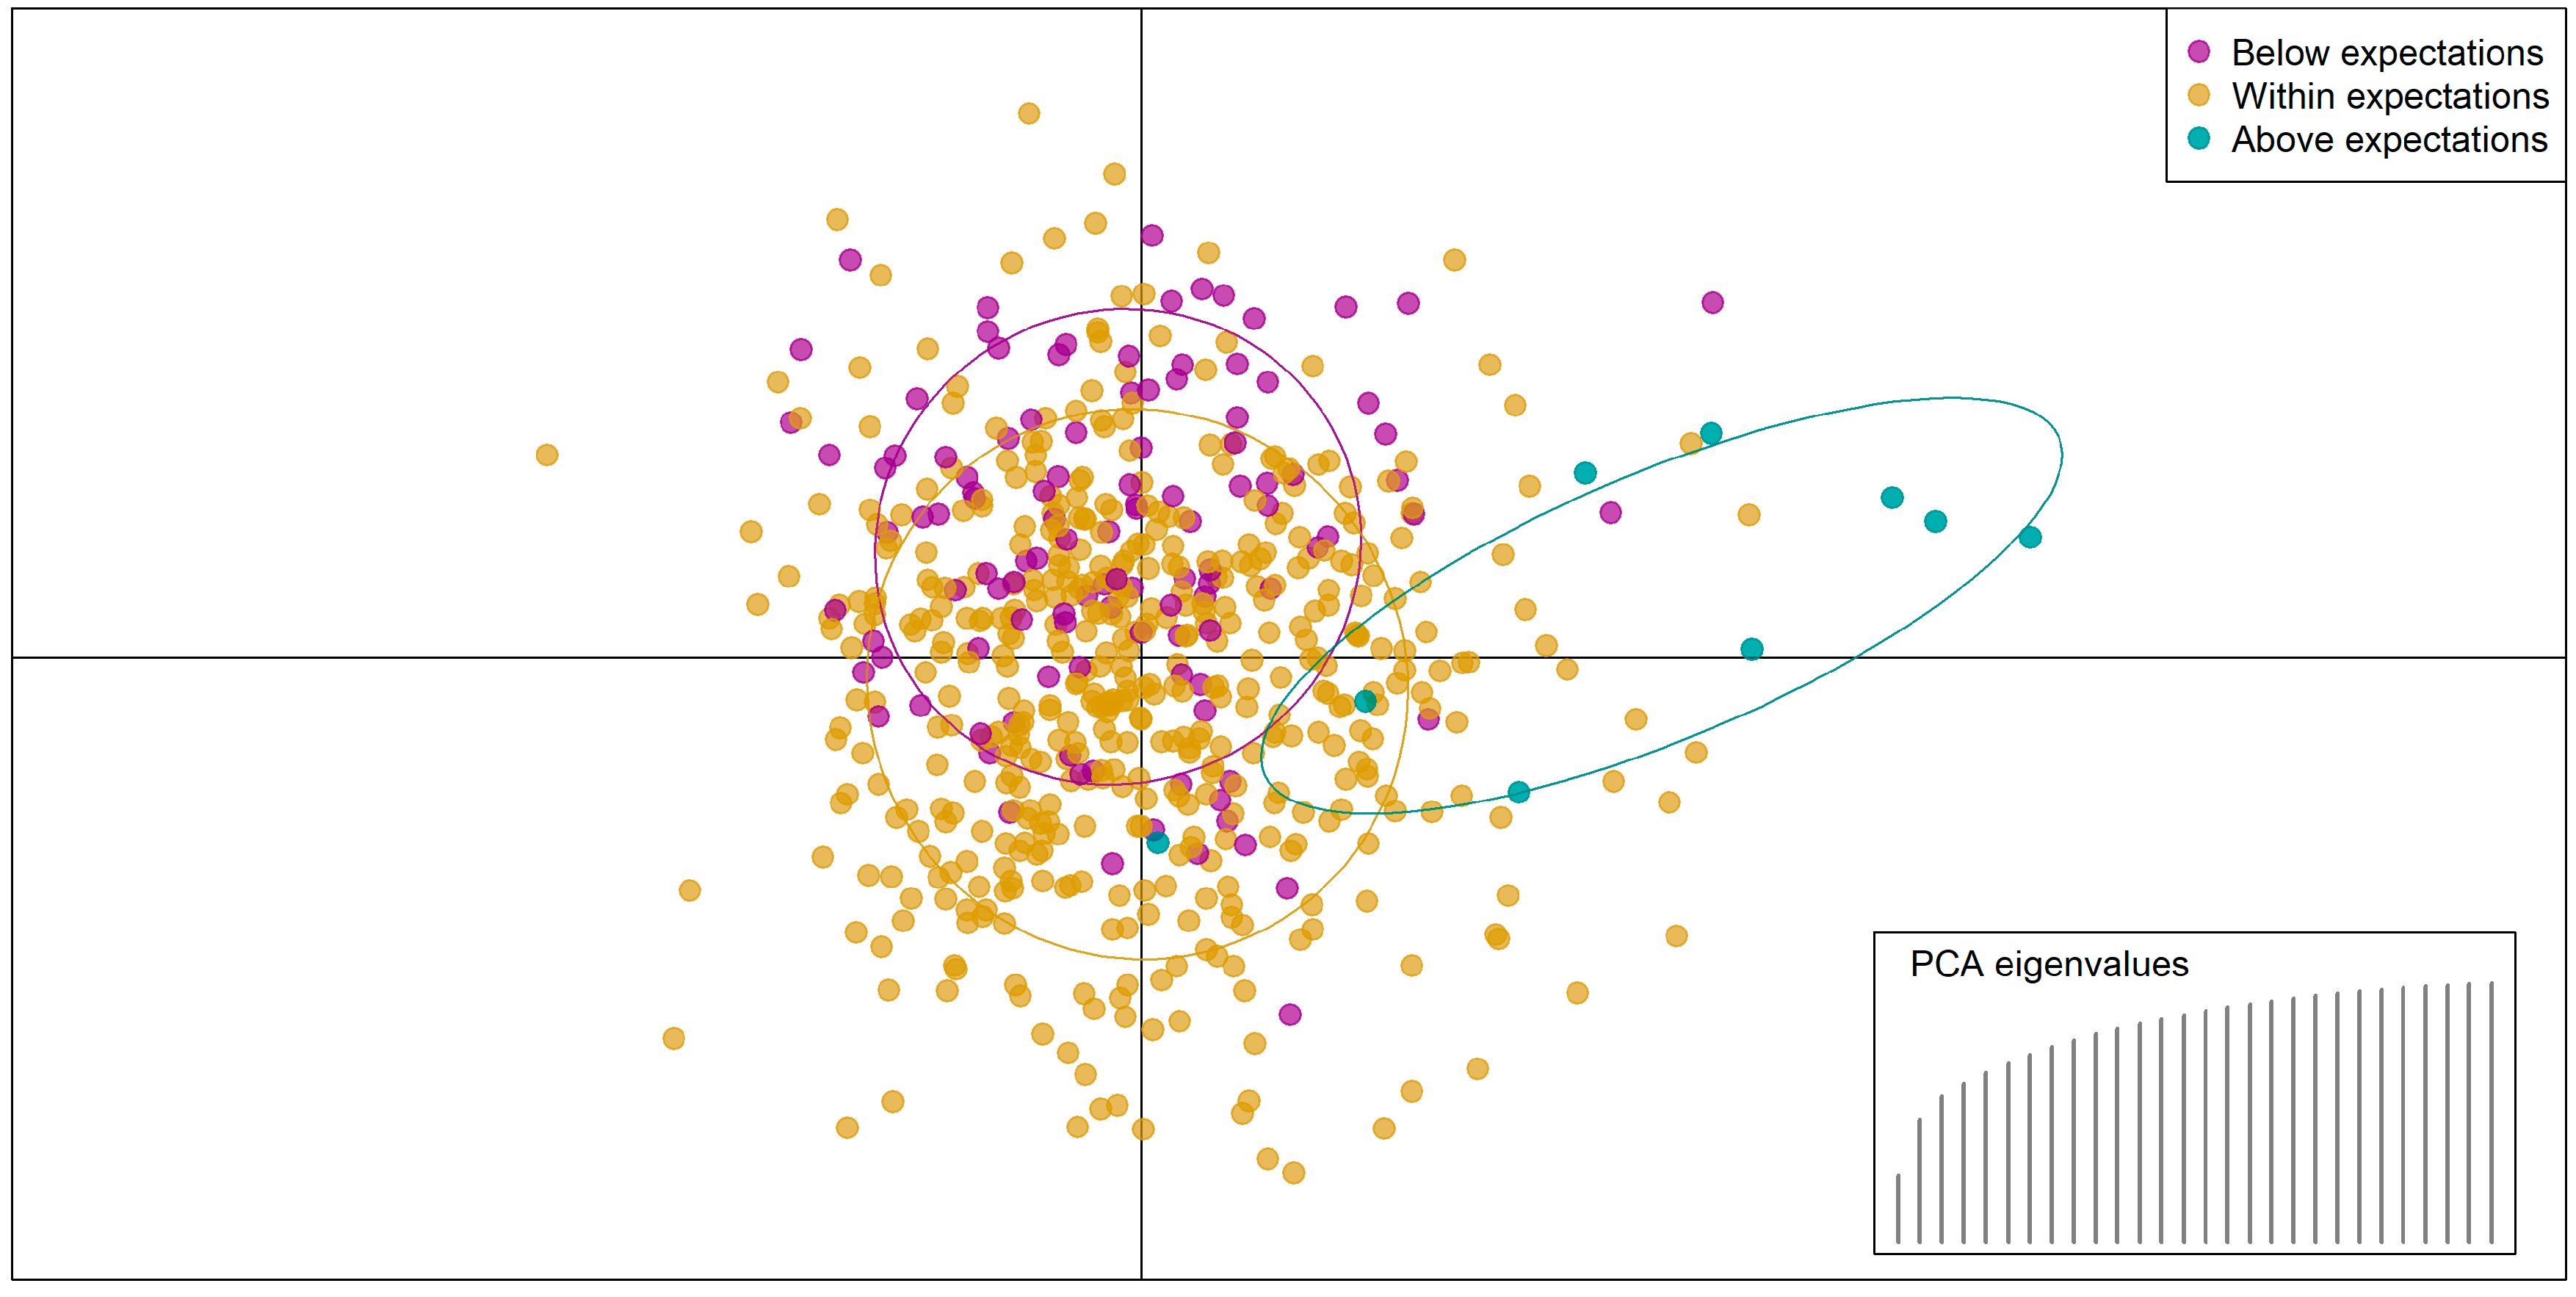

Table 1.
Predictors explored for association with country coverage classification. ‘n’ refers to the number of predictors in a given category.
Table 1.
Predictors explored for association with country coverage classification. ‘n’ refers to the number of predictors in a given category.
| Field | Variables included | Source |
|---|---|---|
|
Health system descriptors (n = 6) |
Pre-pandemic immunisation system strength: mean DTP3 coverage (mean 2015-2019) | WUENIC [20] |
| Immunisation system breadth: Number of vaccines in infant immunisation schedule (latest data) | WHO [21] | |
| Broader health system strength: Universal Health Coverage index (2019) | WHO [22] | |
| Health workforce capacity – including (i) mean number of doctors and (ii) mean number of nurses (mean 2015-2019 per 100,000 population) | WHO [23] | |
| Global health security index (2019) | GHS Index [24,25] | |
|
Financial indicators (n = 4) |
Health financing – broken into (i) government expenditure, (ii) external (donor) investment, and (iii) private financing i.e., out-of-pocket payments and certain insurance (mean 2015-2019 $ USD Purchasing Power Parity, PPP) | WHO [26] |
| Country wealth – Gross Domestic Product (GDP; mean 2015-2019 per capita) | World Bank [27] | |
|
Pandemic impact (n = 17) |
COVID-19 direct health burden: proxy based on number of excess deaths per 100,000 people per year (2020-2022) | The Economist [28,29] |
| Eight containment policies per year (2020-2022): stringency of (i) school closures, (ii) workplace closures, (iii) cancellation of public events, (iv) restrictions on gatherings, (v) public transport closures, (vi) stay-at-home orders, (vii) internal movement restrictions, (viii) international travel controls | Oxford COVID-19 Government Response Tracker [30] | |
| Two economic policies per year (2020-2022): extent of (i) income support and (ii) debt relief during the pandemic | Oxford COVID-19 Government Response Tracker [30] | |
| Six health policies per year (2020-2022): extent of (i) public information campaigns, (ii) COVID-19 lab/diagnostic testing policies, (iii) contact tracing efforts, (iv) mask wearing requirements, (v) availability of COVID-19 vaccines, and (vi) protection of elderly populations. | Oxford COVID-19 Government Response Tracker [30] | |
|
Country descriptors (n = 1) |
Population: total population (mean 2020-2023) | UNWPP [11] |
Table 2.
Global mean expected (ARIMA-modelled) and reported DTP3 coverage from 2020 to 2023, and the calculated difference between the two (delta = expected – reported). 95% confidence intervals (CIs) and associated p value from t-test.
Table 2.
Global mean expected (ARIMA-modelled) and reported DTP3 coverage from 2020 to 2023, and the calculated difference between the two (delta = expected – reported). 95% confidence intervals (CIs) and associated p value from t-test.
| Year | Expected | Reported | Delta [95% CIs] | p-value |
|---|---|---|---|---|
| 2020 | 88.7% | 86.2% | -2.5% [-1.7%; -3.3%] | < 0.0001 |
| 2021 | 88.7% | 85.2% | -3.5% [-2.3%; -4.7%] | < 0.0001 |
| 2022 | 88.7% | 85.8% | -2.9% [-1.4%; -4.3%] | 0.0002 |
| 2023 | 88.6% | 85.9% | -2.7% [-1.1%; -4.3%] | 0.0008 |
Table 3.
Number of expected (ARIMA-modelled) and reported (from WUENIC) DTP3 immunisations per year globally from 2020 to 2023, and the calculated difference between the two (delta = expected – reported). 95% confidence intervals (CIs) and associated p value reported from t-test.
Table 3.
Number of expected (ARIMA-modelled) and reported (from WUENIC) DTP3 immunisations per year globally from 2020 to 2023, and the calculated difference between the two (delta = expected – reported). 95% confidence intervals (CIs) and associated p value reported from t-test.
| Year | Expected | Reported | Delta [95% CIs] | p-value |
|---|---|---|---|---|
| 2020 | 597,036 | 572,857 | -24,180 [-4,755; -43,605] | 0.02 |
| 2021 | 591,324 | 555,302 | -36,022 [-10,597; -61,448] | 0.006 |
| 2022 | 588,180 | 571,111 | -17,069 [-3,366; -30,772] | 0.02 |
| 2023 | 588,432 | 566,191 | -22,240 [-212; -44,269] | 0.05 |
Disclaimer/Publisher’s Note: The statements, opinions and data contained in all publications are solely those of the individual author(s) and contributor(s) and not of MDPI and/or the editor(s). MDPI and/or the editor(s) disclaim responsibility for any injury to people or property resulting from any ideas, methods, instructions or products referred to in the content. |
© 2025 by the authors. Licensee MDPI, Basel, Switzerland. This article is an open access article distributed under the terms and conditions of the Creative Commons Attribution (CC BY) license (http://creativecommons.org/licenses/by/4.0/).
Copyright: This open access article is published under a Creative Commons CC BY 4.0 license, which permit the free download, distribution, and reuse, provided that the author and preprint are cited in any reuse.


