
Submitted:
21 November 2025
Posted:
26 November 2025
You are already at the latest version
Abstract
Anguilla japonica is a catadromous fish widely distributed in coastal areas, rivers, and adjacent water bodies in China, North Korea, Japan, and other regions. The Yangtze River Estuary serves as a crucial passage for A. japonica migrating downstream to the sea. The peak migration period occurs from late September to early November each year, during which a large number of adult A. japonica appear on the market. However, during market supervision and law enforcement, it is difficult to determine their origin and whether they come from prohibited fishing areas. Therefore, there is an urgent need to trace the origin of A. japonica from different water bodies. This study used muscle elemental fingerprint analysis (EFA) to determine the geographical origin of A. japonica from different water bodies. The results showed that A. japonica from different habitats had distinct elemental compositions in their muscles. Specifically, A. japonica from estuary waters (EW) were characterized by significantly higher levels of V and Hg compared to other water bodies. Na was identified as a key discriminant element among different habitats, with its content significantly increasing in river waters (RW), EW, and offshore waters (OW), respectively. Discriminant analysis selected four discriminant elements (V, Hg, Na and Cu) from 21 elemental compositions, among which V, Hg and Na were the three key distinguishing elements. Based on the composition of these four discriminant elements in the muscles of A. japonica from different habitats, hierarchical cluster analysis (HCA), orthogonal partial least squares discriminant analysis (OPLS-DA), and linear discriminant analysis (LDA) were applied and validated, successfully achieving rapid and accurate origin tracing and verification for new samples. Therefore, the application of muscle EFA can achieve geographical traceability of A. japonica from different habitats. The analytical method and verification process for origin tracing established in this study can be successfully applied to market supervision for tracing the origin of samples with unknown sources.
Keywords:
Anguilla japonica
; elemental fingerprint analysis (EFA)
; river waters
; estuary waters
; offshore waters
; geographic traceability
1. Introuduction
Anguilla japonica is widely distributed in coastal countries such as China, North Korea, and Japan. In China, it is found in coastal waters, major rivers, and their affiliated water bodies [1]. A. japonica is known for its tender meat, delicious taste, and high nutritional value, making it highly popular among consumers. The Yangtze River Estuary serves as a critical passage for the species, facilitating the downstream migration of adult A. japonica to the sea and the upstream migration of juvenile glass eels. As the estuary of China’s largest river, it supports abundant resources of A. japonica. Notably, from late September to early November each year, during the peak migration period for adult A. japonica moving seaward through the Yangtze Estuary, a significant number of adult individuals can be observed in these waters. Additionally, A. japonica is also distributed in lakes, rivers, and adjacent coastal waters connected to the Yangtze River. However, long-term pressures such as overfishing, infrastructure development, and environmental pollution have led to a continuous decline in the resources of both adult and juvenile A. japonica in the Yangtze River and its associated waters [2,3,4]. In recent years, to protect the fish resources and their habitats in the Yangtze River, China has implemented the Yangtze River Protection Law, which includes a ten-year fishing ban and initiatives for aquatic environmental restoration. As fishing has been completely prohibited in the Yangtze River and its affiliated waters, the resources of both adult A. japonica migrating downstream to the sea and juvenile A. japonica migrating upstream through the Yangtze Estuary have shown signs of recovery. However, some vendors, seeking excessive profits, illegally set nets in the Yangtze Estuary to capture adult A. japonica during their seaward migration and introduce them into the market. Currently, the lack of an effective method for origin traceability makes it difficult for market supervision and law enforcement to determine whether the adult A. japonica appearing on the market originate from prohibited fishing zones. The inability to effectively identify the source of these individuals, coupled with a lack of solid evidence and effective measures in supervision and enforcement, hinders the effective protection of adult A. japonica population.
Currently, various methods exist for discriminating and tracing the origin of species, such as individual morphology [5], otolith morphology [6], genetic sequences [7], fatty acid composition [8], isotopes [9], and elemental fingerprinting [10]. Elemental fingerprint analysis (EFA) has proven to be a highly useful technique for distinguishing biological species or populations and has been widely applied in studies on geographical origin tracing and safety assessments of aquatic products, animals, and plants [11,12,13,14,15]. EFA further includes otolith elemental fingerprinting [16], whole-fish elemental fingerprinting [17], and tissue-specific elemental fingerprinting of muscle, skin, etc. [18,19,20]. Previously, otolith elemental fingerprinting has often been used in ecological studies of various fish species, particularly research related to fish life history [16,21,22]. However, this method typically requires complex sample pretreatment procedures and advanced instrumentation. Since different discrimination methods vary in their applicability, sample acquisition difficulty, and discrimination sensitivity, the choice of method must be tailored to the specific context. For the adult A. japonica in this study, using the whole body as a sample is impractical due to the large individual size, which leads to significantly large sample volume. However, the small amount taken for analysis leads to significant sampling and analytical errors. As for otoliths, their small size, thinness, and fragility make them difficult to extract, and subsequent processing steps such as grinding and observation involve high technical demands and time costs. Therefore, considering the differences in the living environments and dietary compositions of A. japonica from different origins, variations in elemental profiles from habitats and diets can be effectively reflected in the fish’s muscle tissue. Consequently, this study selected muscle tissue samples from A. japonica of different origins and utilized elemental fingerprint analysis to trace and determine their geographical sources.
In recent years, EFA has been widely applied in the identification and geographical traceability of illegally sourced aquatic products in the market [23,24,25]. Therefore, this study focuses on tracing the origin of A. japonica samples found in the market by selecting muscle tissue as the experimental material. Based on elemental fingerprint analysis, we aim to distinguish the geographical origins of A. japonica from river waters (RW), estuary waters (EW), and offshore waters (OW), thereby achieving traceability of samples from freshwater, brackish water, and marine habitats. By adopting a more convenient, cost-effective, and sample-efficient method, and through a series of multivariate analytical techniques to screen discriminant elements, this study enables the traceability of samples from different origins. The research results can be applied to market supervision, where small muscle samples from specimens of unknown origin can be used for geographical origin determination. This provides an effective technical method for the traceability of aquatic products in market regulation, supporting the management of traceability for illegally caught aquatic products and facilitating evidence-based law enforcement.
2. Materials and Methods
2.1. Sampling Sites, Sample Collection, and Processing
In July 2025, a total of 12 A. japonica samples were collected from three distinct aquatic habitats, i.e. inland rivers waters (RW), the Yangtze River Estuary waters (EW), and offshore waters (OW) of the East China Sea (Figure 1), for origin traceability research. To validate the traceability method for newly sourced samples, one additional individual was randomly selected from the Yangtze River Estuary waters as a positive control (EW-PC) for traceability verification analysis. All A. japonica individuals were captured by angling. After collection, the samples were placed in labeled plastic bags and stored at -20°C for subsequent analysis.
In the laboratory, all samples were thawed, and biological data such as body length and body weight of the A. japonica were measured. Standard length was measured in centimeters (cm), and wet weight was measured in grams (g) (Table 1). To minimize sample processing errors, all samples were first rinsed six times with Milli-Q water (Millipore Corp., USA). Subsequently, using a ceramic scalpel, dorsal muscle tissue was collected from the anterior, middle, and posterior regions of the eel’s back, cut into small pieces, and thoroughly mixed. After freeze-drying for 24 hours, the samples were ground into a fine powder using a tissue grinder and immediately stored in a desiccator for subsequent analysis [26].
The dried sample (0.5±0.005g) was placed into a digestion tube, to which 10 ml of purified HNO3 (MOS Reagent, Sinopharm Chemical Reagent Co., Ltd., Shanghai, China) was added. The mixture was allowed to stand for 3 hours. Then, 2 ml of purified HClO4 was added to each tube. Finally, all samples were digested using an electric heating plate. The completely digested samples were quantitatively transferred into 100 ml calibrated flasks and diluted to volume with Milli-Q water.
2.2. Elemental Analysis
The content of 21 elements in the samples was determined using the instruments and methods of ICP-OES (Agilent, 720ES) for the elements of potassium (K), sodium (Na) and calcium (Ca), and ICP-MS (Agilent, 7700) for the elements of aluminum (Al), titanium (Ti), vanadium (V), chromium (Cr), manganese (Mn), iron (Fe), cobalt (Co), nickel (Ni), copper (Cu), zinc (Zn), arsenic (As), strontium (Sr), molybdenum (Mo), cadmium (Cd), barium (Ba), mercury (Hg), lead (Pb) and magnesium (Mg) [27,28]. The calibration standards included mixed-element substances, such as Al, Ti, V, Cr, Mn, Fe, Co, Ni, Cu, Zn, As, Sr, Cd, Ba, Cu, Mg (GSB 04-1767-2004), and single-element materials: Hg (GSB 04-1729-2004), Na (GSB 04-1738-2004), K (GSB 04-1733-2004), Ca (GSB 04-1720-2004), and Mo (GSB 04-1737-2004) (National Nonferrous Metals and Electronic Materials Analysis and Testing Center, National Standard (Beijing) Inspection and Certification Co., Ltd, China). All analyses were performed in triplicate.
2.3. Data Analysis
Non-parametric tests were conducted on the elemental contents in the muscle tissues of A. japonica from different origins. The results overall revealed differences in the elemental composition of muscle tissues among the different groups. This was followed by one-way analysis of variance (ANOVA) to examine the differences among these groups, with a significance level set at 0.05. Subsequently, multivariate analysis models were employed to analyze the spatial patterns of A. japonica from the three habitat origins [29]. First, principal component analysis (PCA) was applied to detect the overall compositional characteristics of the elements and the correlation between the muscle elemental composition of the three groups and the principal components. Second, stepwise linear discriminant analysis (LDA) was used to establish a set of discriminant functions and screen for discriminant elements, which were then used to determine the origin of newly sourced samples [30]. Next, based on the screened discriminant elements, hierarchical cluster analysis (HCA) and orthogonal partial least squares-discriminant analysis (OPLS-DA) were sequentially utilized to conduct traceability analysis on the positive control group [31]. Finally, LDA was used to discriminatively validate the traceability results of the positive control samples, testing the validity of the traceability outcomes. Statistical analyses were performed using IBM SPSS Statistics 26.0 and Origin 2021 software.
3. Results
3.1. Elemental Fingerprints Composition
A non-parametric test was conducted on the contents of 21 elements in the muscle tissues of A. japonica from three different habitat waters to analyze the differences in muscle elemental composition among the various sources. The results showed that four elements (V, Hg, Mg and Na) exhibited significant differences (P< 0.05) in the muscles among the three groups of A. japonica, while the remaining 17 elements showed no significant differences (P> 0.05). A one-way analysis of variance (ANOVA) was performed on the composition of 21 elements in the muscles of A. japonica from three different origins to compare the differences in elemental composition. The results revealed significant differences (P < 0.05) in three elements (V, Hg and Na) between A. japonica from RW and EW, two elements (Mg and Na) between A. japonica from RW and OW, and four elements (V, Hg, Mg and Na) between A. japonica from EW and OW. Specifically, V and Hg levels were significantly higher in A. japonica from EW compared to that from EW and OW, while Mg and Na levels were significantly higher in A. japonica from OW compared to that from RW and EW (Table 2).
Regarding the four key discriminant elements (V, Hg, Mg and Na) across the three habitats (Figure 2), significant differences were observed, i.e. V and Hg levels showed significant variations between EW and RW groups and between EW and OW groups; Mg levels differed significantly between OW and RW groups and between OW and EW groups (P < 0.05); and Na levels exhibited significant differences among all three habitat groups (P<0.05). A comparison of the content levels of these discriminant elements in the muscles from different origins further demonstrated that V and Hg levels were significantly higher in EW group compared to RW and OW groups, with no significant difference between the other two groups. Mg levels were significantly higher in OW group compared to RW and EW groups, and Na levels showed substantial variation across all three groups. Therefore, V and Hg can serve as characteristic elemental indicators for EW group, Mg can serve as characteristic elemental indicators for OW group, and Na can be used as a typical element to indicate the differences among different habitats.
3.2. Principal Component Analysis (PCA)
To identify the key characteristic elemental indicators for distinguishing A. japonica from different habitats, principal component analysis (PCA) was performed on the composition of 21 elements. A total of 5 principal components (PC1 to PC5) were extracted (Table 3).
As shown in Table 3, the three elements with the highest contributions in principal component 1 (PC1) were Sr, Al and Mg; in PC2, they were Pb, Ti and Ni; and in PC3, they were Ca, Cr and Mo. Based on the results in Table 2, among these 9 major contributing elements across the three principal components, only Mg showed significant differences between OW and EW groups. The other eight major contributing elements exhibited no significant differences among these three groups, indicating minimal variation in the overall elemental composition of muscle tissues across the three habitats.
The three main contributing elements in PC1 were present at the lowest levels in RW, reflecting a low-content elemental profile characteristic of this group. Similarly, the three main contributing elements in PC2 were lowest in EW, representing a low-content profile for this group. Consequently, in the scatter plot formed by PC1 and PC2 (Figure 3a), RW and EW were relatively separated. The three main contributing elements in PC3 were lowest in OW, indicating a low-content profile for this group. However, the contribution rate of these three elements in PC3 was relatively low, and their concentrations did not differ significantly among the A. japonica from different origins. As a result, in the scatter plots formed by PC1 and PC3 (Figure 3b) and PC2 and PC3 (Figure 3c), the A. japonica from the three habitats overlapped and were difficult to distinguish. These findings demonstrate that the scatter plots generated from PC1 and PC2, PC1 and PC3, and PC2 and PC3 could not effectively separate A. japonica from the three habitats, indicating a high overall similarity in the muscle elemental composition of A. japonica from different waters.
3.3. Discriminant Element Screening
Linear discriminant analysis (LDA) was performed on the composition of 21 elements in the muscle tissues of A. japonica from three distinct habitats. The analysis gained discriminant equations with four elemental indicators (V, Hg, Na and Cu) as independent variables (Table 4). A comparison of the discriminant coefficients of these elements across the three aquatic habitats revealed that V had the highest discriminant coefficient, followed by Hg and Na, while Cu had the smallest discriminant coefficient. Among these, the first two discriminant elements (V and Hg) showed significant differences between the EW and the others. The third discriminant element of Na, exhibited significant differences across all three habitats. These results indicate that V, Hg, and Na serve as the primary discriminant elements for distinguishing among the three aquatic habitats.
Based on the stepwise discriminant results, the overall discriminant success rate for the 12 individuals from the three habitat origins reached 100.00%. The cross-validation results were consistent with the stepwise discriminant outcomes (Table S1). As visually evident from the discriminant analysis scatter plot (Figure S1), the muscle elemental compositions of A. japonica from the three habitat origins can be clearly distinguished. This demonstrates that the discriminant equations, formed using the four elemental indicators screened from the 21 elements, exhibit excellent performance in discriminating among A. japonica from the three origins.
3.4. Traceability and Verification Analysis
To validate the effectiveness of using the four screened discriminant elements for tracing the origin of newly sourced samples, a random new sample from EW was selected as a positive control (EW-PC) for traceability analysis. First, hierarchical cluster analysis (HCA) was performed by grouping the samples from the three habitat origins separately and treating the newly sourced sample as an additional group. This analysis aimed to assess the similarity between the newly sourced sample and the other groups. The results showed that EW-PC clustered with EW (Figure S2). Thus, using the four discriminant elements for HCA of A. japonica samples from different origins can preliminarily trace the origin of newly sourced samples.
To further evaluate the traceability relationship between EW-PC and the individuals from the three habitat groups, orthogonal partial least squares-discriminant analysis (OPLS-DA) was performed on the composition of the four discriminant elements in the muscle tissues of the EW-PC and the three habitat groups. EW-PC exhibited clear clustering and separation from the EW and the other two groups (Figure 4). The model fit parameters indicated a dependent variable fit index of R²X = 0.995, R²Y = 0.916, and a model prediction rate of Q² = 0.815. All three values exceeded 0.8, demonstrating the model’s ability to explain differences and its reliability in prediction.
The permutation test was conducted on the OPLS-DA model with 200 permutations to prevent potential overfitting of the Q² value. The results revealed permutation model R² and Q² values for the RW, EW, and OW groups as 0.0988 and -0.677, 0.0911 and -0.743, and 0.0663 and -0.782, respectively (Figure S3). The R² values for all three groups were greater than 0, while the Q² values were all below 0.05, indicating that the OPLS-DA model possesses good generalization and fitting capabilities. These results demonstrate that the four screened discriminant elements can effectively determine the origin of newly sourced samples.
In order to validate the traceability effectiveness for newly sourced samples, the LDA of the four discriminant elements of three habitat-originated A. japonica and the EW-PC were performed. Figure S2 and Figure 4 clearly shows that the EW-PC and EW group are fused into one group, so the EW-PC group were included into the EW group for further verification in the subsequent discriminant analysis, and the overall discriminant success rate of the total samples of EW and EW-PC was obtained to be 100.00% (Table 5). The results showed that, with the addition of the EW-PC group, the overall discrimination success rate for all individuals from the three habitat waters was still 100.00%. The results of cross verification were consistent with the results of stepwise discrimination (Table 5). It can be seen that the new samples can be effectively traced by these four discriminant elements that have been screened.
4. Discussion
This study demonstrates that using muscle elemental fingerprint analysis (EFA) for the geographical traceability of A. japonica from different habitats is scientific, practical, and effective. Currently, numerous methods exist for tracing the geographical origin of biological species, such as analyses based on individual morphology, otolith morphology, otolith microchemistry, isotopes, elemental profiles, fatty acid composition, and genetic sequence [6,7,8,9,10]. For tracing A. japonica from different aquatic habitats, where the distributed A. japonica belong to the same species with similar genetic structures, traceability based on genetic sequence differences is ineffective [32]. Additionally, A. japonica has an elongated, cylindrical body with few measurable and countable external morphological characteristics, making it difficult to distinguish their origins based on individual morphology and requiring a high sample size [33]. Traditional otolith morphology and otolith microchemistry methods can distinguish different fish populations with relatively stable indicator parameters and high discriminant accuracy. However, due to the small size and fragility of the otoliths, the extraction of otoliths, acquisition of morphological indicators, and microchemical analysis are challenging and also require a large sample size [34]. This study comprehensively evaluated the limitations of the external morphology, otolith extraction and analysis, fully considered the accumulation differences of elemental composition from habitats and diets in A. japonica from different waters, and established EFA as the method for tracing the origin of A. japonica from different habitats.
Given the varying accumulation effects of different elements in the whole body and different parts of fish, this study analyzed the differences in ease of acquisition and elemental accumulation effects among whole body, muscle, otoliths, bones, skin, and other samples to select the most suitable sample for elemental analysis [18,19,20]. For adult A. japonica in this study, using the whole body as a sample involves a large sample volume, difficulty in achieving homogeneity during processing, which directly affects the representativeness of subsamples taken for subsequent analysis. Skin tissue is thin, exposed, has relatively low element accumulation, and is easily interfered with by externally distributed elements [35]. Bone tissue, while having strong element accumulation capacity, responds poorly to short-term changes in environmental elements [36]. In contrast, muscle tissue constitutes a large proportion of the whole body, is easy to obtain, and can rapidly reflect changes in elemental composition from the habitat and diet over a period of time [37]. In this study, based on the stability of elemental accumulation in muscle and the unique advantages of EFA in sample processing and analysis [38], the application of muscle EFA for origin determination of A. japonica from different habitats is scientific, practical and effective.
This study employed discriminant analysis to screen four discriminant elements from the 21 elements measured in the muscles of A. japonica from different habitats. Among these, three discriminant elements with high coefficient values (V, Hg, and Na) showed significant differences among A. japonica from different habitats. The concentrations of V and Hg were highest in the muscle of EW, identifying them as characteristic elements for EW. Na concentration was highest in OW, followed by EW, and lowest in RW, directly corresponding to the salinity gradients of the different habitats, thus establishing Na as a characteristic element for distinguishing these three habitats.
The differences in muscle elemental composition among A. japonica from different habitats are closely related to their respective ecological environments. It is found that the composition of different characteristic elements in different waters has its own characteristics. Firstly, studies indicate that V is relatively abundant in the Yangtze River Estuary [39], and Hg was historically a common potential risk element in the Yangtze River Estuary. Although industrial and agricultural activities have decreased in recent years, Hg distribution in the Yangtze River Estuary remains relatively higher compared to other waters [40,41]. The highest distributions of both V and Hg in the Yangtze River Estuary correlate with the relatively higher environmental concentrations of these two elements in the estuarine waters. Na showed significant differences among A. japonica from the three habitats, attributable to the distinct salinity environments of freshwater (river), brackish water (estuary), and seawater (offshore). The pronounced increase in salinity from river to offshore waters corresponds to the sequentially and significantly increasing Na concentrations found in the muscle of A. japonica inhabiting these respective areas.
In summary, the successful application of muscle EFA in this study for origin traceability of A. japonica is closely linked to the habitat characteristics of the three distribution waters, the ecological habits of the A. japonica, and the accumulation patterns of different elements in the muscle tissue. Based on the differences in muscle elemental composition of A. japonica from different habitats, multivariate analysis, including non-parametric tests, one-way ANOVA, PCA, and LDA, were sequentially applied to screen a small number of typical discriminant elements from multiple elements. Utilizing these screened discriminant elements, subsequent analyses including HCA, OPLS-DA and discriminant verification successfully achieved and verified the origin traceability of newly sourced A. japonica sample. This confirms that origin traceability can be accomplished using a limited set of screened discriminant elements, effectively reducing the number of elements required for determination, saving costs, and improving efficiency. The established traceability pathway ensures the simplicity of subsequent verification methods and their practical applicability in market regulation, holding significant practical value.
5. Conclusion
This study utilized multivariate statistical analysis to examine the composition of 21 elements in the muscles of A. japonica from different habitats. The primary differential elemental profiles in the muscles of A. japonica distributed across distinct water bodies were identified, leading to the screening of characteristic discriminant elements for tracing their origin. The successful application of this method for origin traceability of newly sourced A. japonica was demonstrated, and validation analyses confirmed that muscle elemental fingerprint analysis is a feasible and effective approach for distinguishing the geographic origin of A. japonica. The study identified four discriminant elements in the muscles of A. japonica from different habitats, among which V, Hg and Na served as characteristic indicators for distinguishing samples from various origins. This research provides theoretical guidance and technical support for the origin traceability of A. japonica, demonstrating strong practical value and potential for application in market regulation and species origin verification.
Supplementary Materials
The following supporting information can be downloaded at the website of this paper posted on Preprints.org. Table S1: Results of discriminant analysis by 21 elements in the muscles of three habitat-originated A. japonica. Figure S1: Scatter plot of scores based on the first two canonical discriminant functions for the 21 elements in the muscles of three habitat-originated A. japonica; Figure S2: Clustering dendrogram for 4 discriminant elements in the muscles of three habitat-originated A. japonica and the EW-PC; Figure S3: Results of the 200-permutation test for the OPLS-DA model of discriminant element composition in the muscles of A. japonica from different habitats (a-RW, b-EW, c-OW).
Author Contributions
Conceptualization and writing—original draft, C.S. and C.Y.; writing—review and editing, C.S., C.Y., X.H. and S.W.; investigation and methodology, Y.L. and D.S.; resources and funding acquisition, C.S. and F.Z.; validation and supervision, F.Z. and H. T. All authors have read and agreed to the published version of the manuscript.
Funding
This research was supported by the National Key R&D Program Key Special Project (2024YFD2401000) and Central Public-interest Scientific Institution Basal Research Fund, CAFS (2023TD14).
Institutional Review Board Statement
The experiments comply with current laws of China. All the samples in this study were obtained from legal sample collection, and the samples were dead when they were obtained.
Data Availability Statement
The data presented in this study are available in the article. Further information is available upon request from the corresponding author.
Conflicts of Interest
The authors declare no conflict of interest.
References
- Zhuang, P. Native and Exotic Fishes of the Middle and Lower Yangtze River; Shanghai Scientific & Technical Publishers: Shanghai, 2014. [Google Scholar]
- Wang, M.; Hu, W.; Feng, G.; Zhuang, P.; Zhao, F.; Zhang, T.; Wang, S.; Yang, G. Study on the Conservation and Sustainable Utilization Management of Auguilla Japonica Fry Resources in the Yangtze River Estuary. Modern Fisheries Information 2024, 39, 165–173. [Google Scholar]
- Choi, H.; Park, J.S.; Hwang, J.-A.; Kim, S.-K.; Cha, Y.; Oh, S.-Y. Influence of Biofloc Technology and Continuous Flow Systems on Aquatic Microbiota and Water Quality in Japanese Eel Aquaculture. Diversity 2024, 16, 601. [Google Scholar] [CrossRef]
- Huang, T.; Zang, X.; Kondyukov, G.; Hou, Z.; Peng, G.; Pander, J.; Knott, J.; Geist, J.; Melesse, M.B.; Jacobson, P.; et al. Towards Automated and Real-Time Multi-Object Detection of Anguilliform Fishes from Sonar Data Using YOLOv8 Deep Learning Algorithm. Ecological Informatics 2025, 91, 103381. [Google Scholar] [CrossRef]
- Yin, X.; Hua, C.; Zhu, Q. Analysis of morphological differences and discrimination between female and male Cololabis saira based on geometric morphometrics. South China Fisheries Science 2024, 20, 104–111. [Google Scholar]
- Zhou, J.; Peng, Y.; Zhu, G. Identification of Geographical Populations of Nototheniops Larseni Based on Geometric Shape of Otoliths. Marine Fisheries 2025, 47, 263–272. [Google Scholar]
- Chen, W.; Shao, B.; Miao, T.; Peng, J.; Chen, B.; Zhang, Z.; Jiang, S. Identification of Six Eel Species Using Polygenic DNA Barcoding. Food Science 2018, 39, 163–169. [Google Scholar]
- Zhou, L.; Li, X. Salmon Origin Traceability Based on Fatty Acid Fingerprints. Food Research and Development 2025, 46, 177–183. [Google Scholar]
- Fan, Z.; Wang, H.; Feng, J.; Feng, Z.; Li, W.; Tang, Z. Origin Traceability of “Jinwan Huangliyu” Based on Stable Isotope Ratio Signature. Modern Agricultural Science and Technology 136-140+144. 2025. [Google Scholar]
- Li, M.; Zhang, Q.; Han, G.; Liang, T.; Liu, J.; Wang, D.; Zhong, Q. Multivariate Discrimination of Chinese Vinegars Using Multi-Element: Implications for Origin Traceability and Dietary Safety. Journal of Food Composition and Analysis 2025, 145, 107807. [Google Scholar] [CrossRef]
- Chilaka, C.A.; Aparicio-Muriana, M. del M.; Petchkongkaew, A.; Quinn, B.; Birse, N.; Elliott, C.T. A Combined Elementomics, Metabolomics, and Chemometrics Approach as Tools to Identify the Geographic Origins of Black Pepper. Food Chemistry 2025, 492, 145420. [Google Scholar] [CrossRef]
- Ji, X. Multielemental Analysis Using Inductively Coupled Plasma Mass Spectrometry and Optical Emission Spectroscopy for Tracing the Geographical Origin of Food. Journal of Analytical Chemistry 2025, 80, 1140–1151. [Google Scholar] [CrossRef]
- Santos, A.; Ricardo, F.; Mamede, R.; Díaz, S.; Patinha, C.; Calado, R. Spatio-Temporal Variation of Elemental Fingerprints of Ruditapes Philippinarum Shells and Its Influence on the Confirmation of Harvesting Location and Time. Estuarine, Coastal and Shelf Science 2025, 324, 109444. [Google Scholar] [CrossRef]
- Mamede, R.; Duarte, I.A.; Tanner, S.E.; Fonseca, V.F.; Duarte, B. Multi-Elemental Fingerprints of Edible Tissues of Common Cockles (Cerastoderma Edule) to Promote Geographic Origin Authentication, Valorization, and Food Safety. Journal of Food Composition and Analysis 2025, 140, 107291. [Google Scholar] [CrossRef]
- Bai, Y.; Wang, X.; Ha, L.; Ao, Q.; Dong, X.; Guo, J.; Zhao, Y. Application of Stable Isotopes and Mineral Elements Fingerprinting for Beef Traceability and Authenticity in Inner Mongolia of China. Food Chemistry 2025, 465, 141911. [Google Scholar] [CrossRef]
- Chen, L.; Xuan, Z.; Ma, F.; Yang, Y.; Liu, K. Otolith microchemistry provides evidence for the existence of migratory Coilia nasus in Chaohu Lake and traces their natal origins. Journal of Fishery Sciences of China 2025, 32, 742–752. [Google Scholar]
- Lai, J.; Zhao, L.; Fan, Y.; Qu, X.; Liu, D.; Guo, Z.; Wang, Y.; Liu, Q.; Chen, Y. Using Whole Body Elemental Fingerprint Analysis to Distinguish Different Populations of Coilia Nasus in a Large River Basin. Biochemical Systematics and Ecology 2015, 60, 249–257. [Google Scholar] [CrossRef]
- Kunito, T.; Watanabe, I.; Yasunaga, G.; Fujise, Y.; Tanabe, S. Using Trace Elements in Skin to Discriminate the Populations of Minke Whales in Southern Hemisphere. Marine Environmental Research 2002, 53, 175–197. [Google Scholar] [CrossRef]
- El Deghel, N.; Vieira, H.C.; Bordalo, M.D.; Peuble, S.; Gallice, F.; Bedell, J.-P. Metallic Trace Elements in Wild and Farmed Fish from the Aveiro Region (Portugal). Marine Pollution Bulletin 2025, 222, 118774. [Google Scholar] [CrossRef]
- Carretero, J.; García-Cegarra, A.M.; Martínez-López, E. Heavy Metals and Trace Elements in a Threatened Population of Guanay Cormorants (Leucocarbo Bougainvilliorum) from an Industrialized Bay in the Humboldt Current System, Chile. Journal of Trace Elements in Medicine and Biology 2025, 92, 127749. [Google Scholar] [CrossRef]
- Boussinet, E.; Daverat, F.; Bareille, G.; Scharbert, A.; Stoll, S. Determining the Natal Origin of the Reintroduced Allis Shad (Alosa Alosa) in the Rhine River Using Otolith Microchemistry. Environmental Biology of Fishes 2025, 108, 1307–1323. [Google Scholar] [CrossRef]
- Xiao, Z.; Liu, M.; Shan, X.; Jiang, R.; Yin, R. Habitat use history of Coilia nusus in Oujiang River Estuary based on otolith microchemistry. Journal of Fisheries of China 2025, 49, 079308–079308. [Google Scholar]
- Bai, S.; Du, N.; Wu, S.; Tang, S.; Li, C.; Chen, Z.; Wang, P.; Gao, L.; Qin, D. Multi-Element Fingerprints of Muscle Tissues of Eriocheir Sinensis from 8 Major Production Areas in China to Promote Geographical Origin and Food Safety Authentication. Food Chemistry: X 2025, 31, 103088. [Google Scholar] [CrossRef]
- Rahman, M.M.; Sultana, S.; Kabiraj, M.; Das, M. Role of Micro and Macronutrients Enrich Fertilizers on the Growth Performance of Prawn (Macrobrachium Rosenbergii), Rohu (Labeo Rohita) and Mola (Amblypharyngodon Mola) in a Polyculture System. International Journal of Agricultural Research, Innovation and Technology 2018, 8, 47–53. [Google Scholar] [CrossRef]
- Zhang, Q.; Li, M.; Dou, C.; Yan, X.; Wang, B.; Zhang, H.; Lin, Y.; Zhao, D. Exploring the Feasibility of Multi-Element Fingerprinting with Chemometrics for Discriminating the Geographical Origins of Asparagus and Its Risk Assessment. Food Chemistry 2025, 495, 146395. [Google Scholar] [CrossRef]
- Cabral, A.E.; Ricardo, F.; Patinha, C.; Silva, E.F.D.; Correia, M.; Palma, J.; Planas, M.; Calado, R. Successful Use of Geochemical Tools to Trace the Geographic Origin of Long-Snouted Seahorse Hippocampus Guttulatus Raised in Captivity. Animals 2021, 11, 1534. [Google Scholar] [CrossRef] [PubMed]
- de Jesus, R.C.; de Souza, T.L.; Latif, A.L.O.; Souza e Souza, L.B.; de Freitas Santos Júnior, A.; dos Santos Lobo, L.; Junior, J.B.P.; Araujo, R.G.O.; Souza, L.A.; Santos, D.C.M.B. Quantification of Essential and Potentially Toxic Elements in Paprika (Capsicum Annuum L.) Varieties by ICP OES and Application of PCA and HCA. Food Chemistry 2025, 482, 144152. [Google Scholar] [CrossRef] [PubMed]
- Costa, G.C.; dos Santos, A.S.; Araujo, R.G.O.; Korn, M.G.A.; Santana, R.M.M. Multivariate Optimization of the Infrared Radiation-Assisted Digestion of Bivalve Mollusk Samples from Brazil for Arsenic and Trace Metals Determination Using ICP OES. Food Chemistry 2025, 477, 143460. [Google Scholar] [CrossRef]
- Alharbi, H.; Kahfi, J.; Dutta, A.; Jaremko, M.; Emwas, A.-H. The Detection of Adulteration of Olive Oil with Various Vegetable Oils – A Case Study Using High-Resolution 700 MHz NMR Spectroscopy Coupled with Multivariate Data Analysis. Food Control 2024, 166, 110679. [Google Scholar] [CrossRef]
- Cuthill, I.C. Vital Statistics: Experimental Design for the Life Sciences by G.D. Ruxton and N. Colegrave. Oxford University Press, 2003. £14.99 Pbk (132 Pages) ISBN 0 19 925232 7. Modern Statistics for the Life Sciences by A. Grafen and R. Hails. Oxford University Press, 2002. £22.99 Pbk (384 Pages) ISBN 0 19 925231 9. Experimental Design and Data Analysis for Biologists by G.P. Quinn and M.J. Keough. Cambridge University Press, 2002. £75.00 Hbk (556 Pages) ISBN 0 521 00976 6. Trends in Ecology & Evolution 2003, 18, 559–560. [Google Scholar]
- Wang, J.; Xiao, Q.; Huang, H.; Wu, D.; Zeng, G.; Chen, W.; Tao, Y.; Ding, B. Non-Target Screening and Identification of the Significant Quality Markers in the Wild and Cultivated Cordyceps Sinensis Using OPLS-DA and Feature-Based Molecular Networking. Chinese Journal of Analytical Chemistry 2023, 51, 100302. [Google Scholar] [CrossRef]
- Rosabal, M.; Pierron, F.; Couture, P.; Baudrimont, M.; Hare, L.; Campbell, P.G.C. Subcellular Partitioning of Non-Essential Trace Metals (Ag, As, Cd, Ni, Pb, and Tl) in Livers of American (Anguilla Rostrata) and European (Anguilla Anguilla) Yellow Eels. Aquatic Toxicology 2015, 160, 128–141. [Google Scholar] [CrossRef]
- Sakai, K.; Mochioka, N. Morphological and Genetic Identification of Bathyuroconger Parvibranchialis (Anguilliformes: Congridae) Leptocephali from Kuroshio Extension. Ichthyological Research 2025, 72, 365–371. [Google Scholar] [CrossRef]
- Windom, H.L.; Savidge, W.B. Sources and Transport Pathways of Trace Metals to the Outer Continental Shelf off South Carolina and Georgia, USA Revealed from the Otoliths of Moray Eels. Continental Shelf Research 2024, 282, 105331. [Google Scholar] [CrossRef]
- Turkoglu, S.; Kaya, G. Biomonitoring of Toxic and Essential Trace Elements in Different Tissues of Fish Species in Turkiye. Food Additives & Contaminants Part B-Surveillance 2023, 16, 332–339. [Google Scholar]
- Kalantzi, I.; Pergantis, S.A.; Black, K.D.; Shimmield, T.M.; Papageorgiou, N.; Tsapakis, M.; Karakassis, I. Metals in Tissues of Seabass and Seabream Reared in Sites with Oxic and Anoxic Substrata and Risk Assessment for Consumers. Food Chemistry 2016, 194, 659–670. [Google Scholar] [CrossRef]
- Wu, D.; Feng, H.; Zou, Y.; Xiao, J.; Zhang, P.; Ji, Y.; Lek, S.; Guo, Z.; Fu, Q. Feeding Habit-Specific Heavy Metal Bioaccumulation and Health Risk Assessment of Fish in a Tropical Reservoir in Southern China. Fishes 2023, 8, 211. [Google Scholar] [CrossRef]
- Lehel, J.; Plachy, M.; Palotás, P.; Bartha, A.; Budai, P. Possible Metal Burden of Potentially Toxic Elements in Rainbow Trout (Oncorhynchus Mykiss) on Aquaculture Farm. Fishes 2024, 9, 252. [Google Scholar] [CrossRef]
- Bai, Y.; Zhang, H.; Zheng, L.; Ji, W.; Ruan, W.; Xu, Y. Different Fractions and Potential Ecological Riskassessment of V, Cr, Co, Ni in Sediments of the Yangtze River Estuary. Marine Fisheries 2023, 45, 490–499. [Google Scholar]
- Cao, F.; Yang, S.; Yin, D.; Wang, R. Geochemical Controls on the Distribution of Total Mercury and Methylmercury in Sediments and Porewater from the Yangtze River Estuary to the East China Sea. Science of The Total Environment 2023, 892, 164737. [Google Scholar] [CrossRef]
- Hu, Y.; He, N.; Wu, M.; Wu, P.; He, P.; Yang, Y.; Wang, Q.; Wang, M.; Fang, S. Sources and Ecological Risk Assessment of the Seawater Potentially Toxic Elements in Yangtze River Estuary during 2009–2018. Environ Monit Assess 2021, 193, 44. [Google Scholar] [CrossRef]
Figure 1.
A. japonica sampling waters.
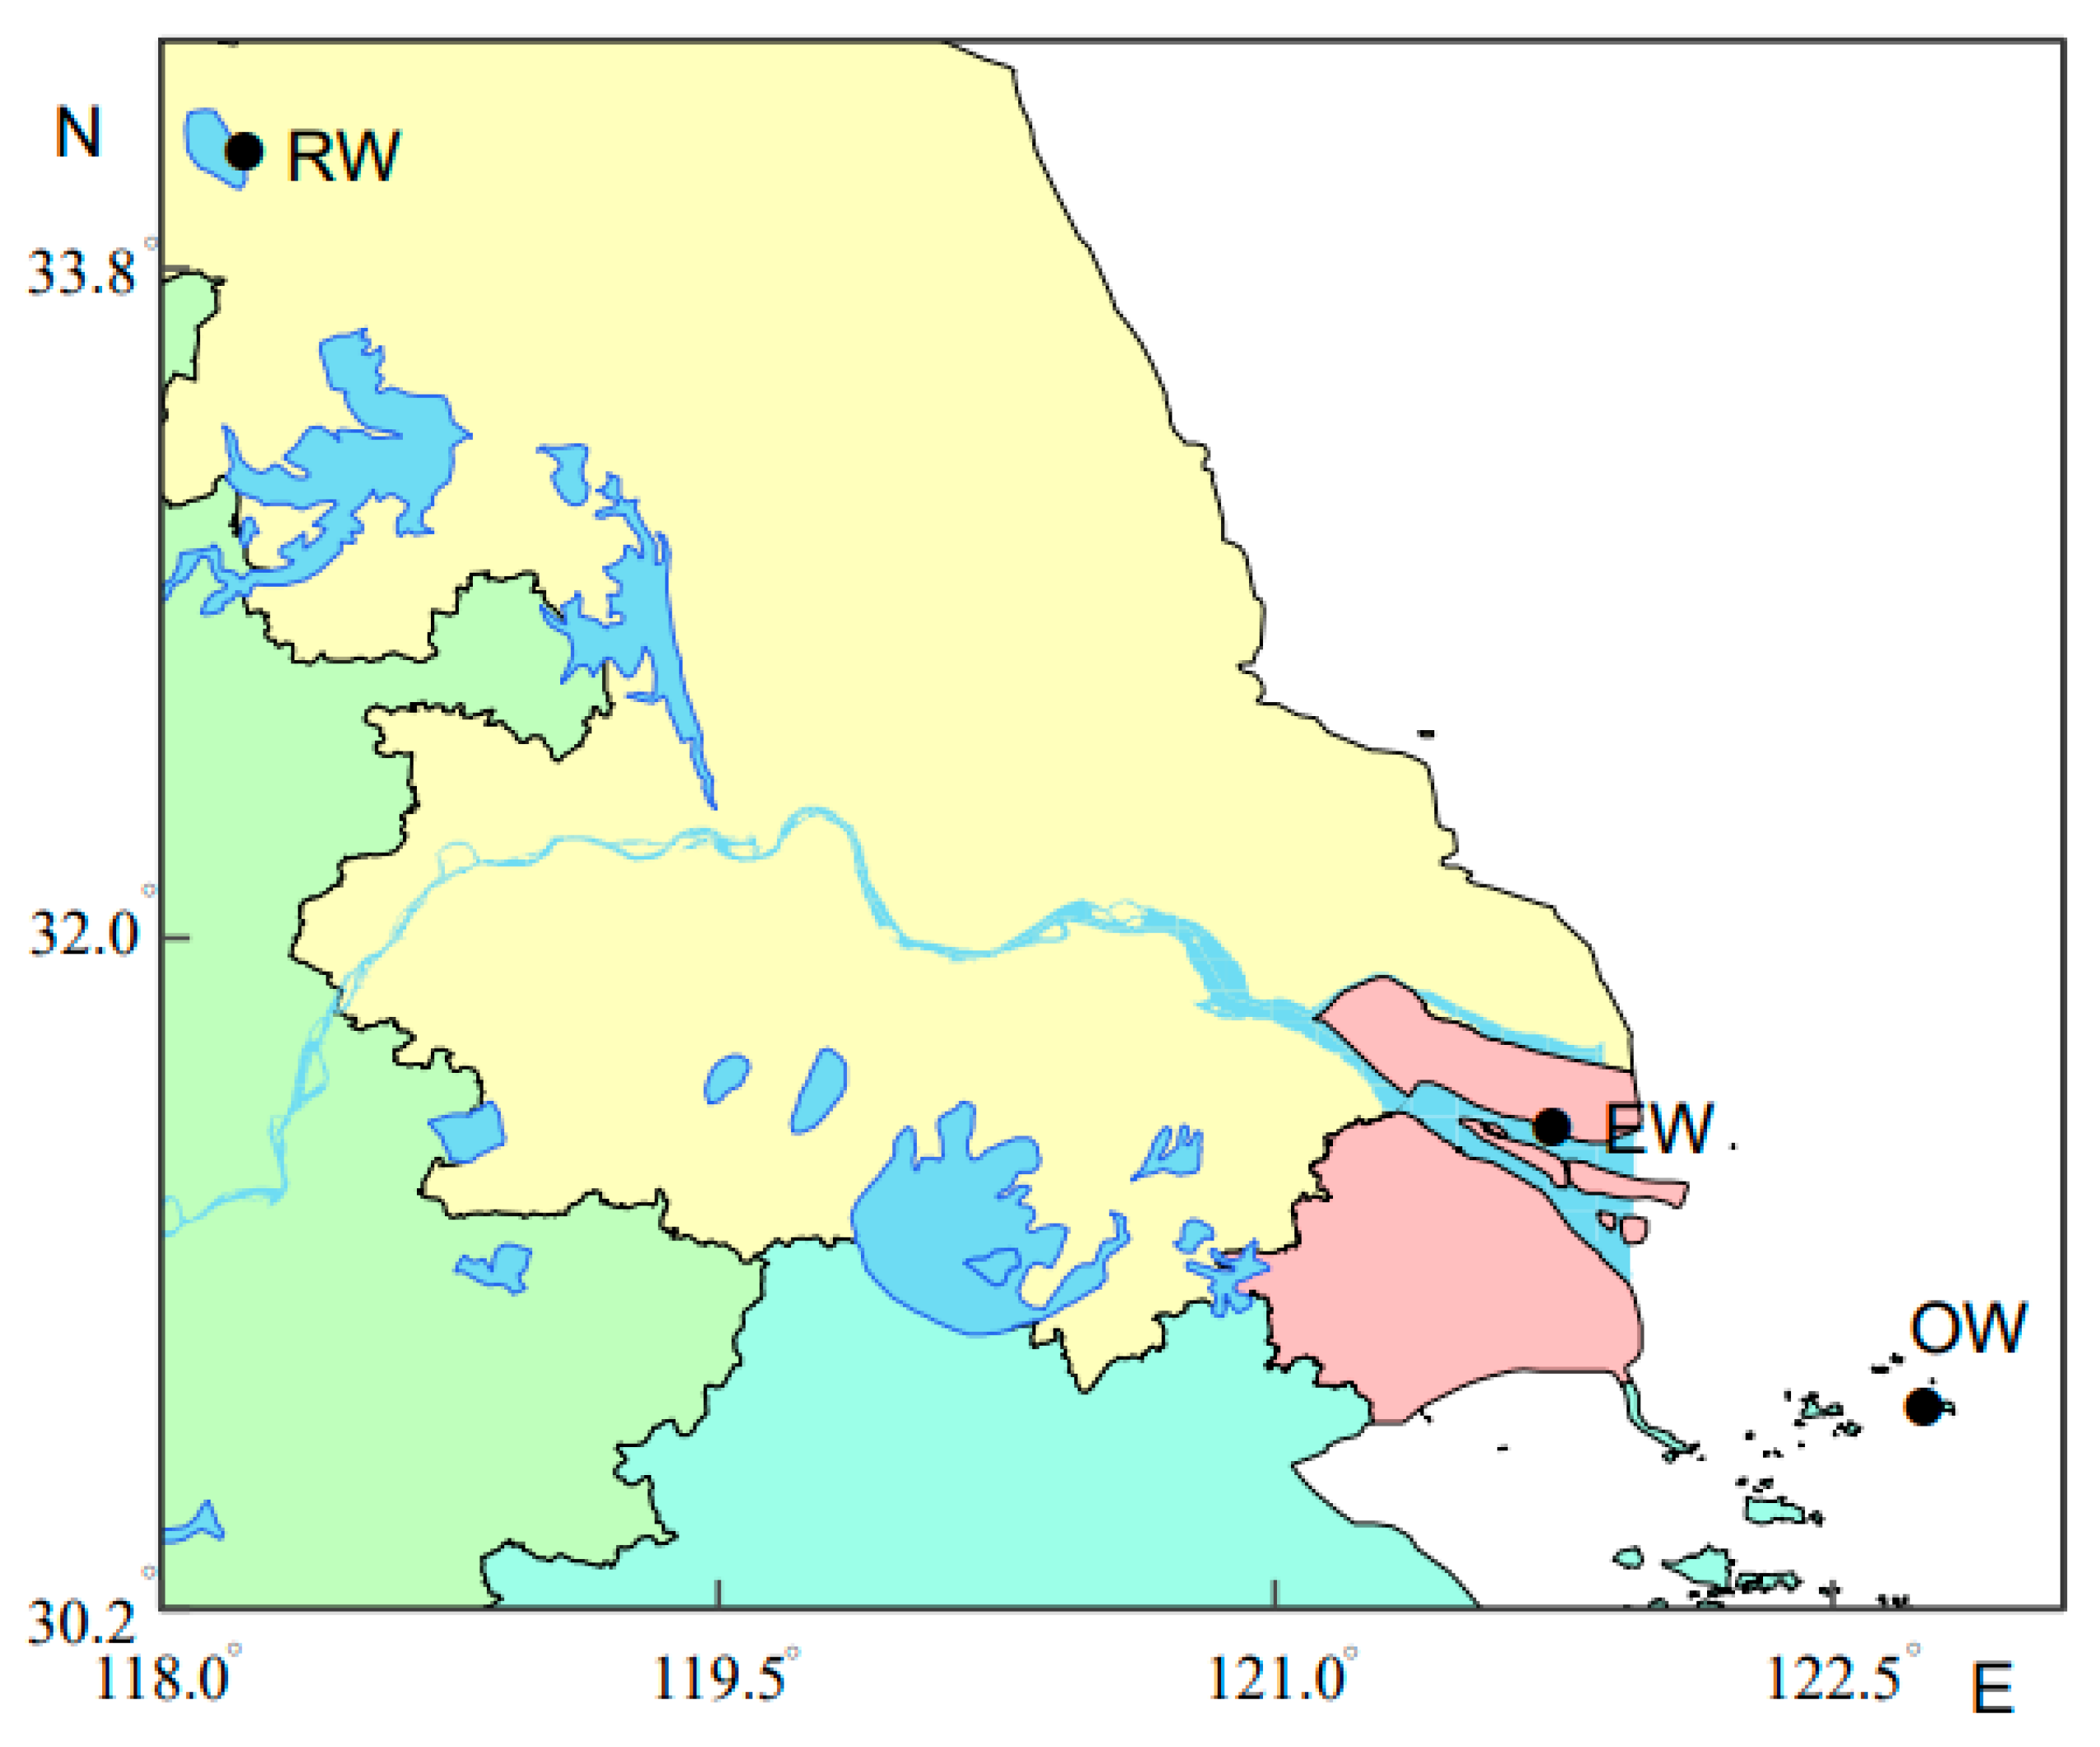
Figure 2.
Comparison of the different element content of A. japonica from three habitat-originated (RW, EW and OW). RW: rive waters; EW: estuary waters; OW: offshore waters. Different letters (a, b, c) denote significant differences between groups of samples. Red, blue, and yellow colors represent RW, EW and OW respectively, which correspond to river-origin, estuary-origin, and offshore-origin eels. The horizontal line inside each box indicates the median. The two ends of the vertical line segments above and below the box represent the maximum and minimum values respectively. The empty square (□) denotes the mean value, and the solid diamond (♦) represents the extreme value.
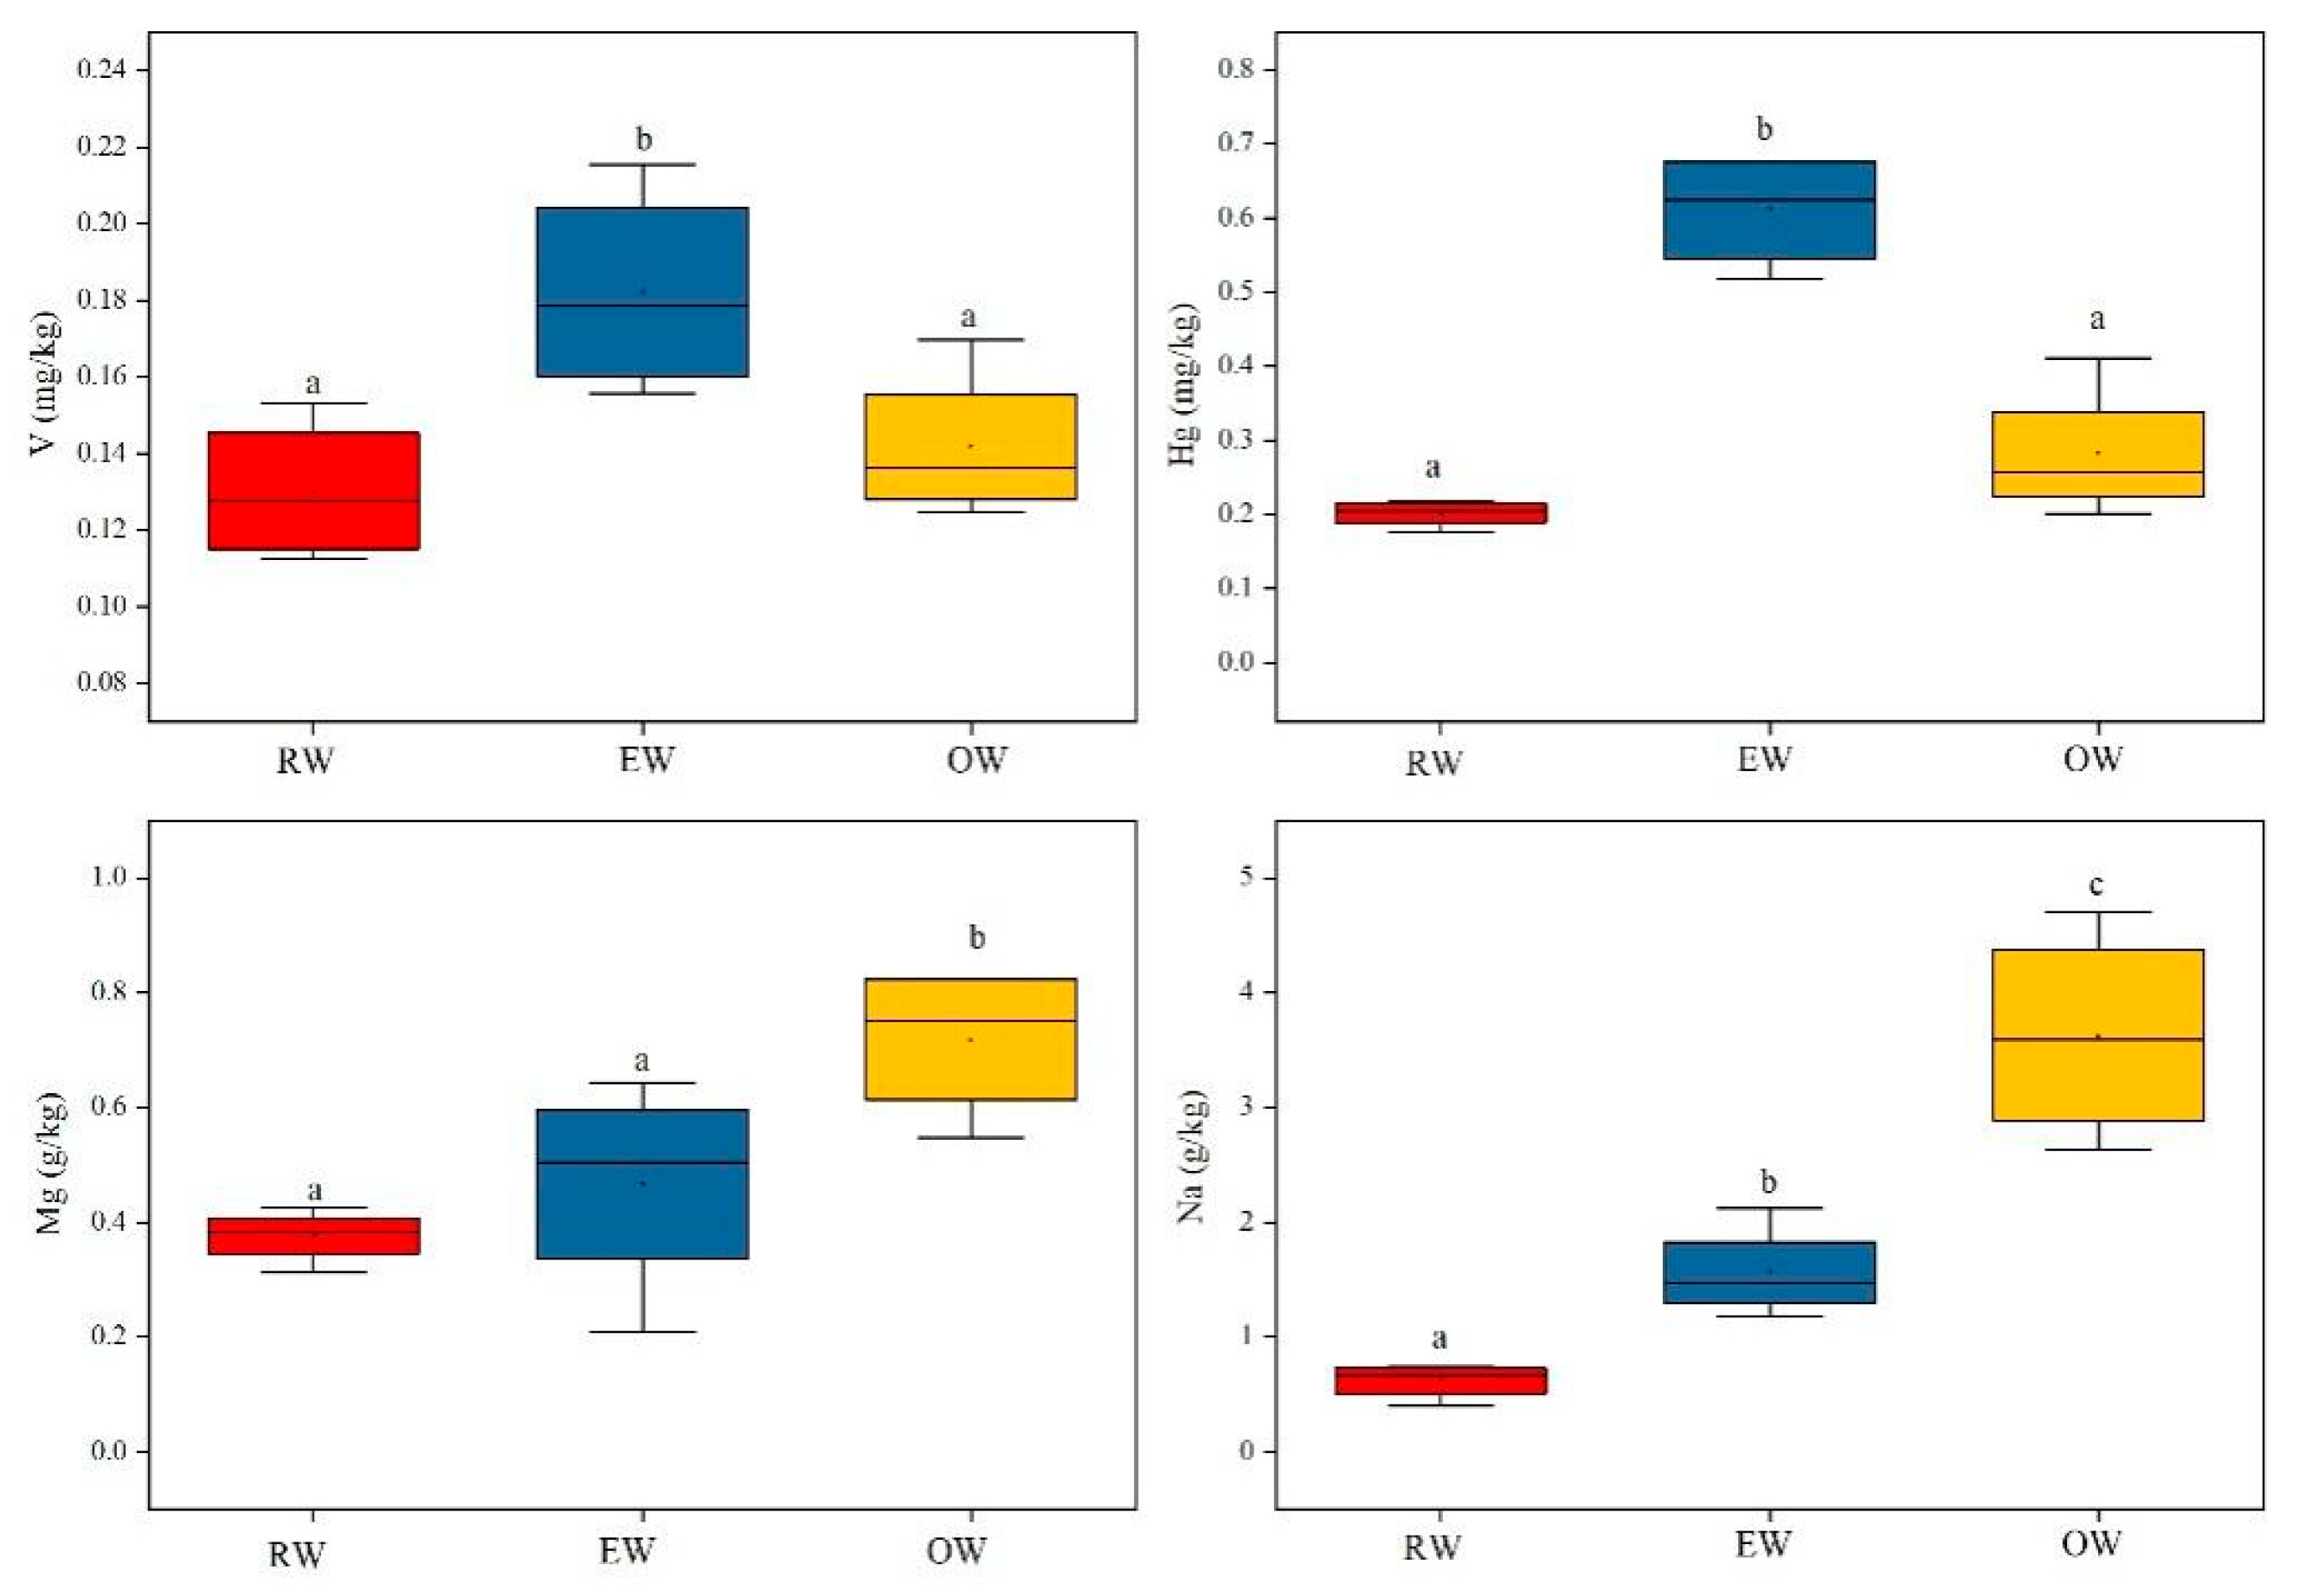
Figure 3.
Scatter diagram of PC1 and PC2 (a), PC1 and PC3 (b), PC2 and PC3 (c) of 21 elements in the muscles of three habitat-originated A. japonica.
Figure 3.
Scatter diagram of PC1 and PC2 (a), PC1 and PC3 (b), PC2 and PC3 (c) of 21 elements in the muscles of three habitat-originated A. japonica.
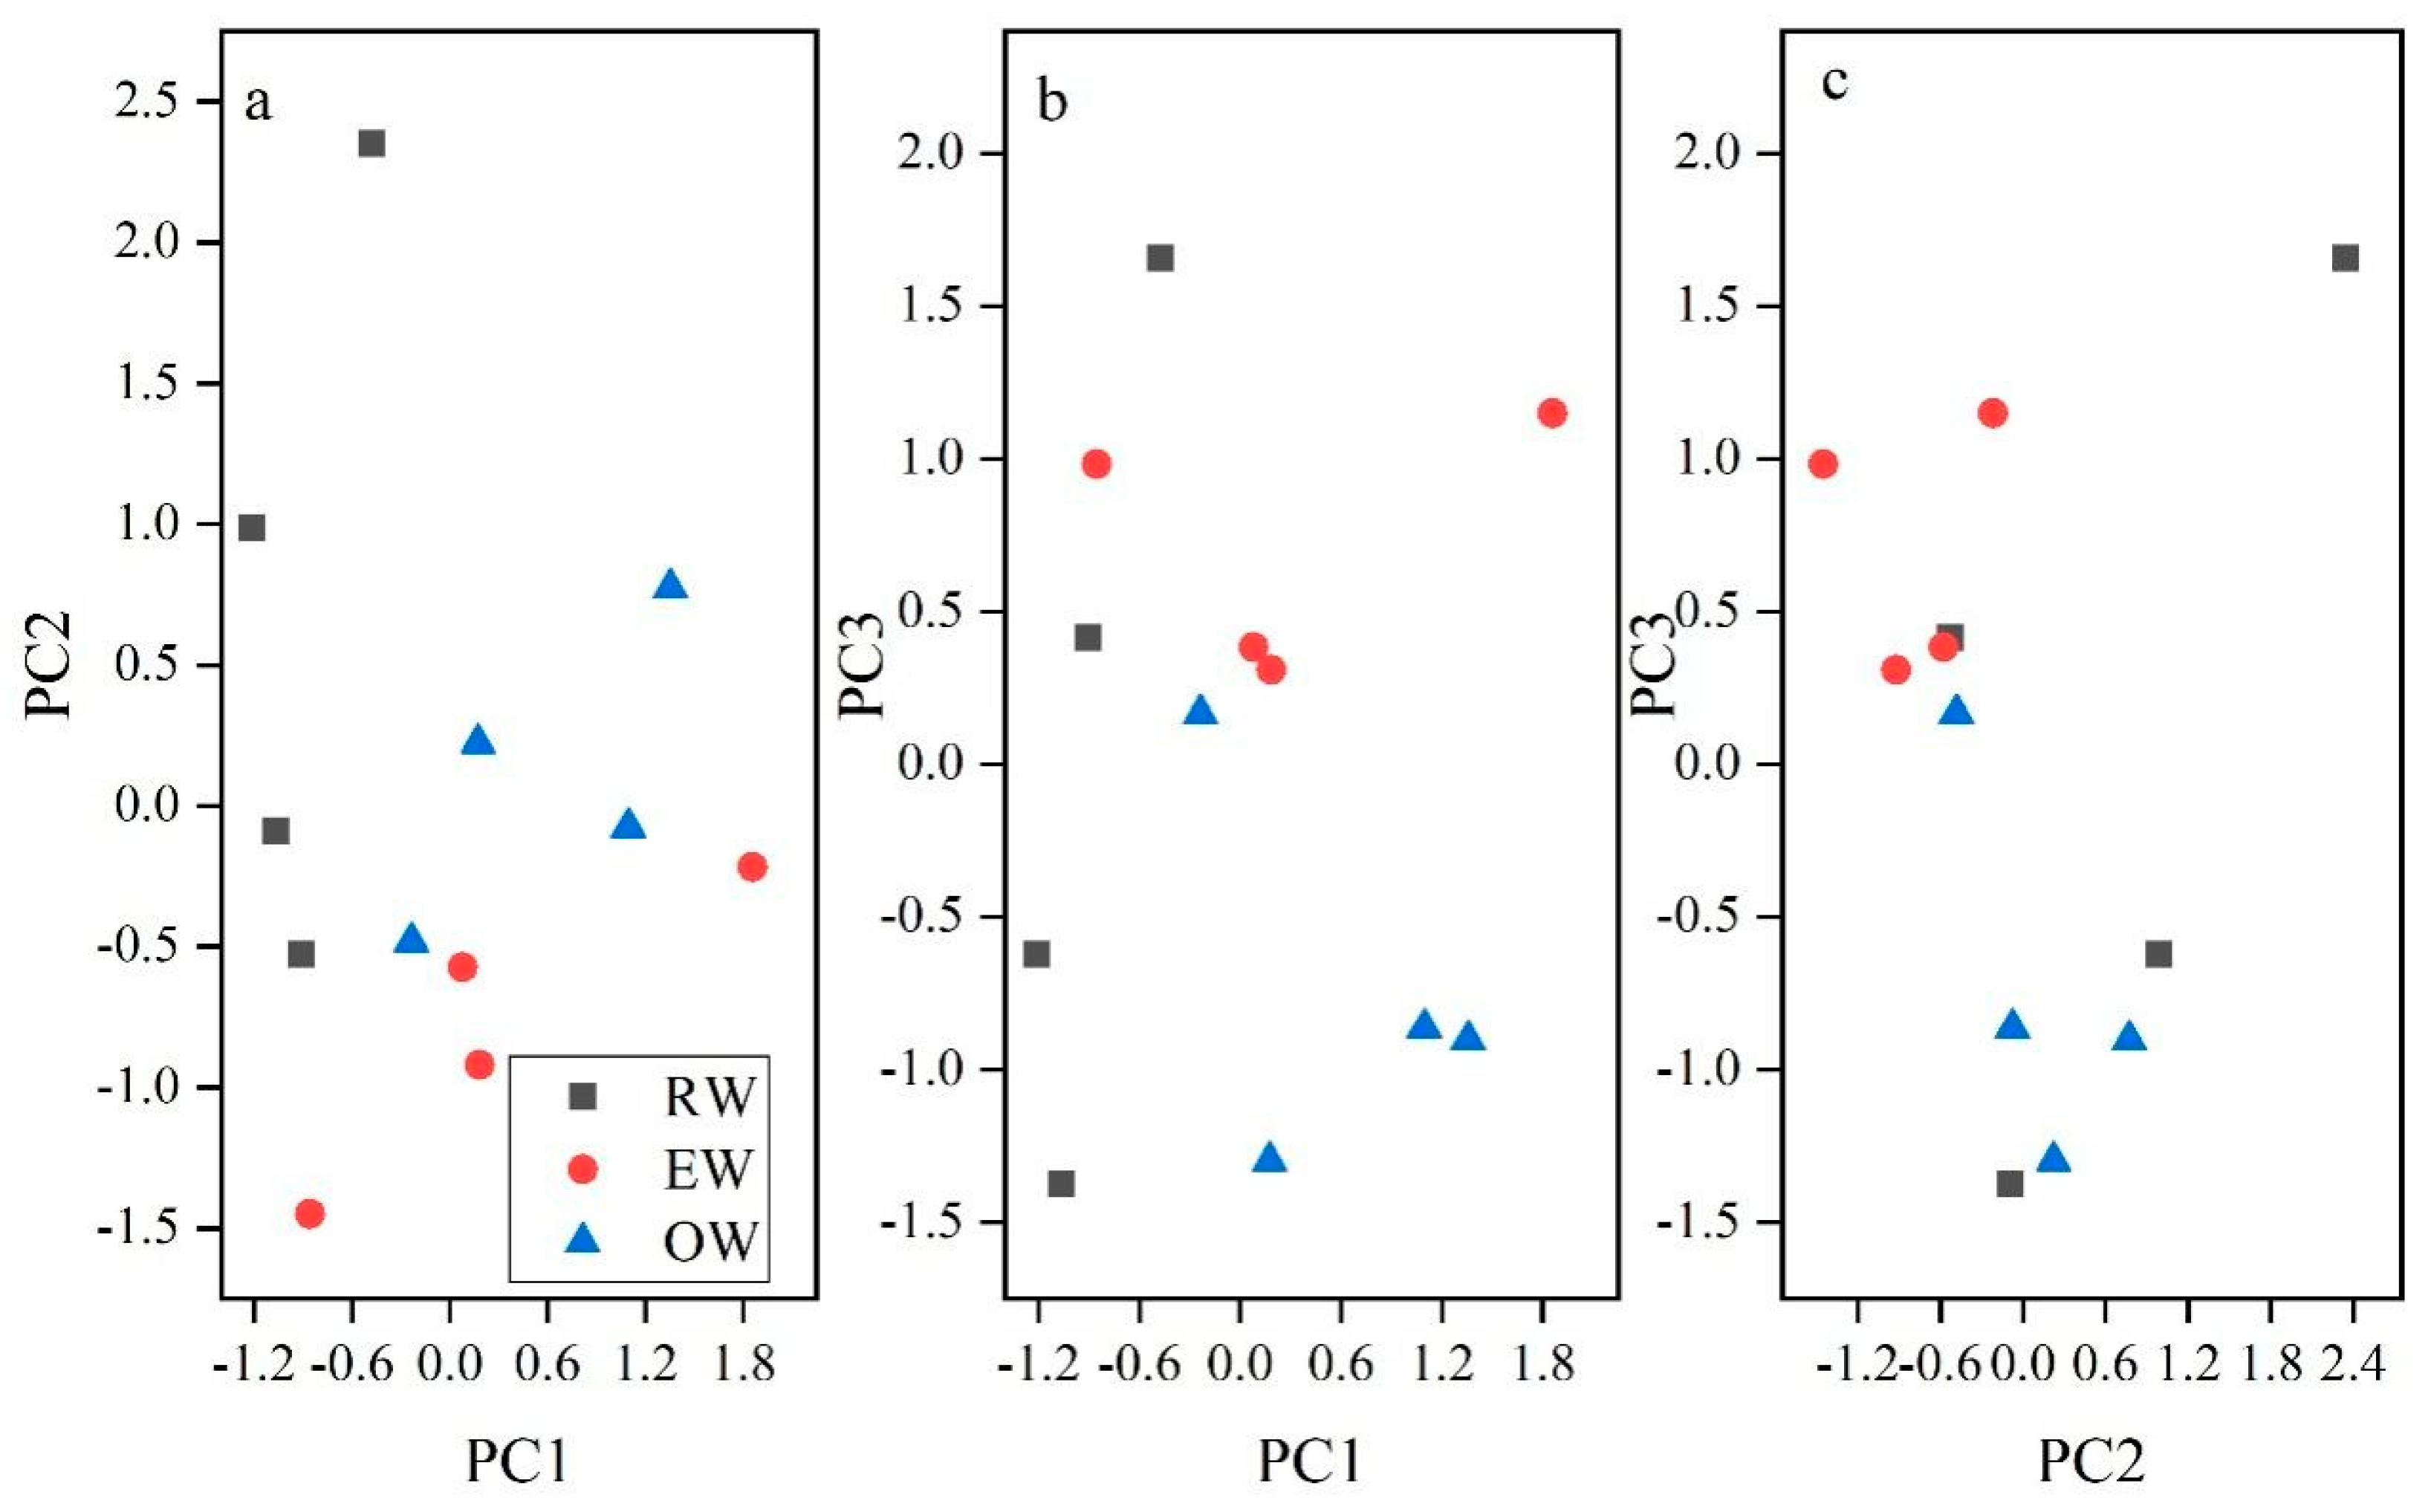
Figure 4.
OPLS-DA score plot of discriminant element composition in the muscle tissue of A. japonica from different habitats.
Figure 4.
OPLS-DA score plot of discriminant element composition in the muscle tissue of A. japonica from different habitats.
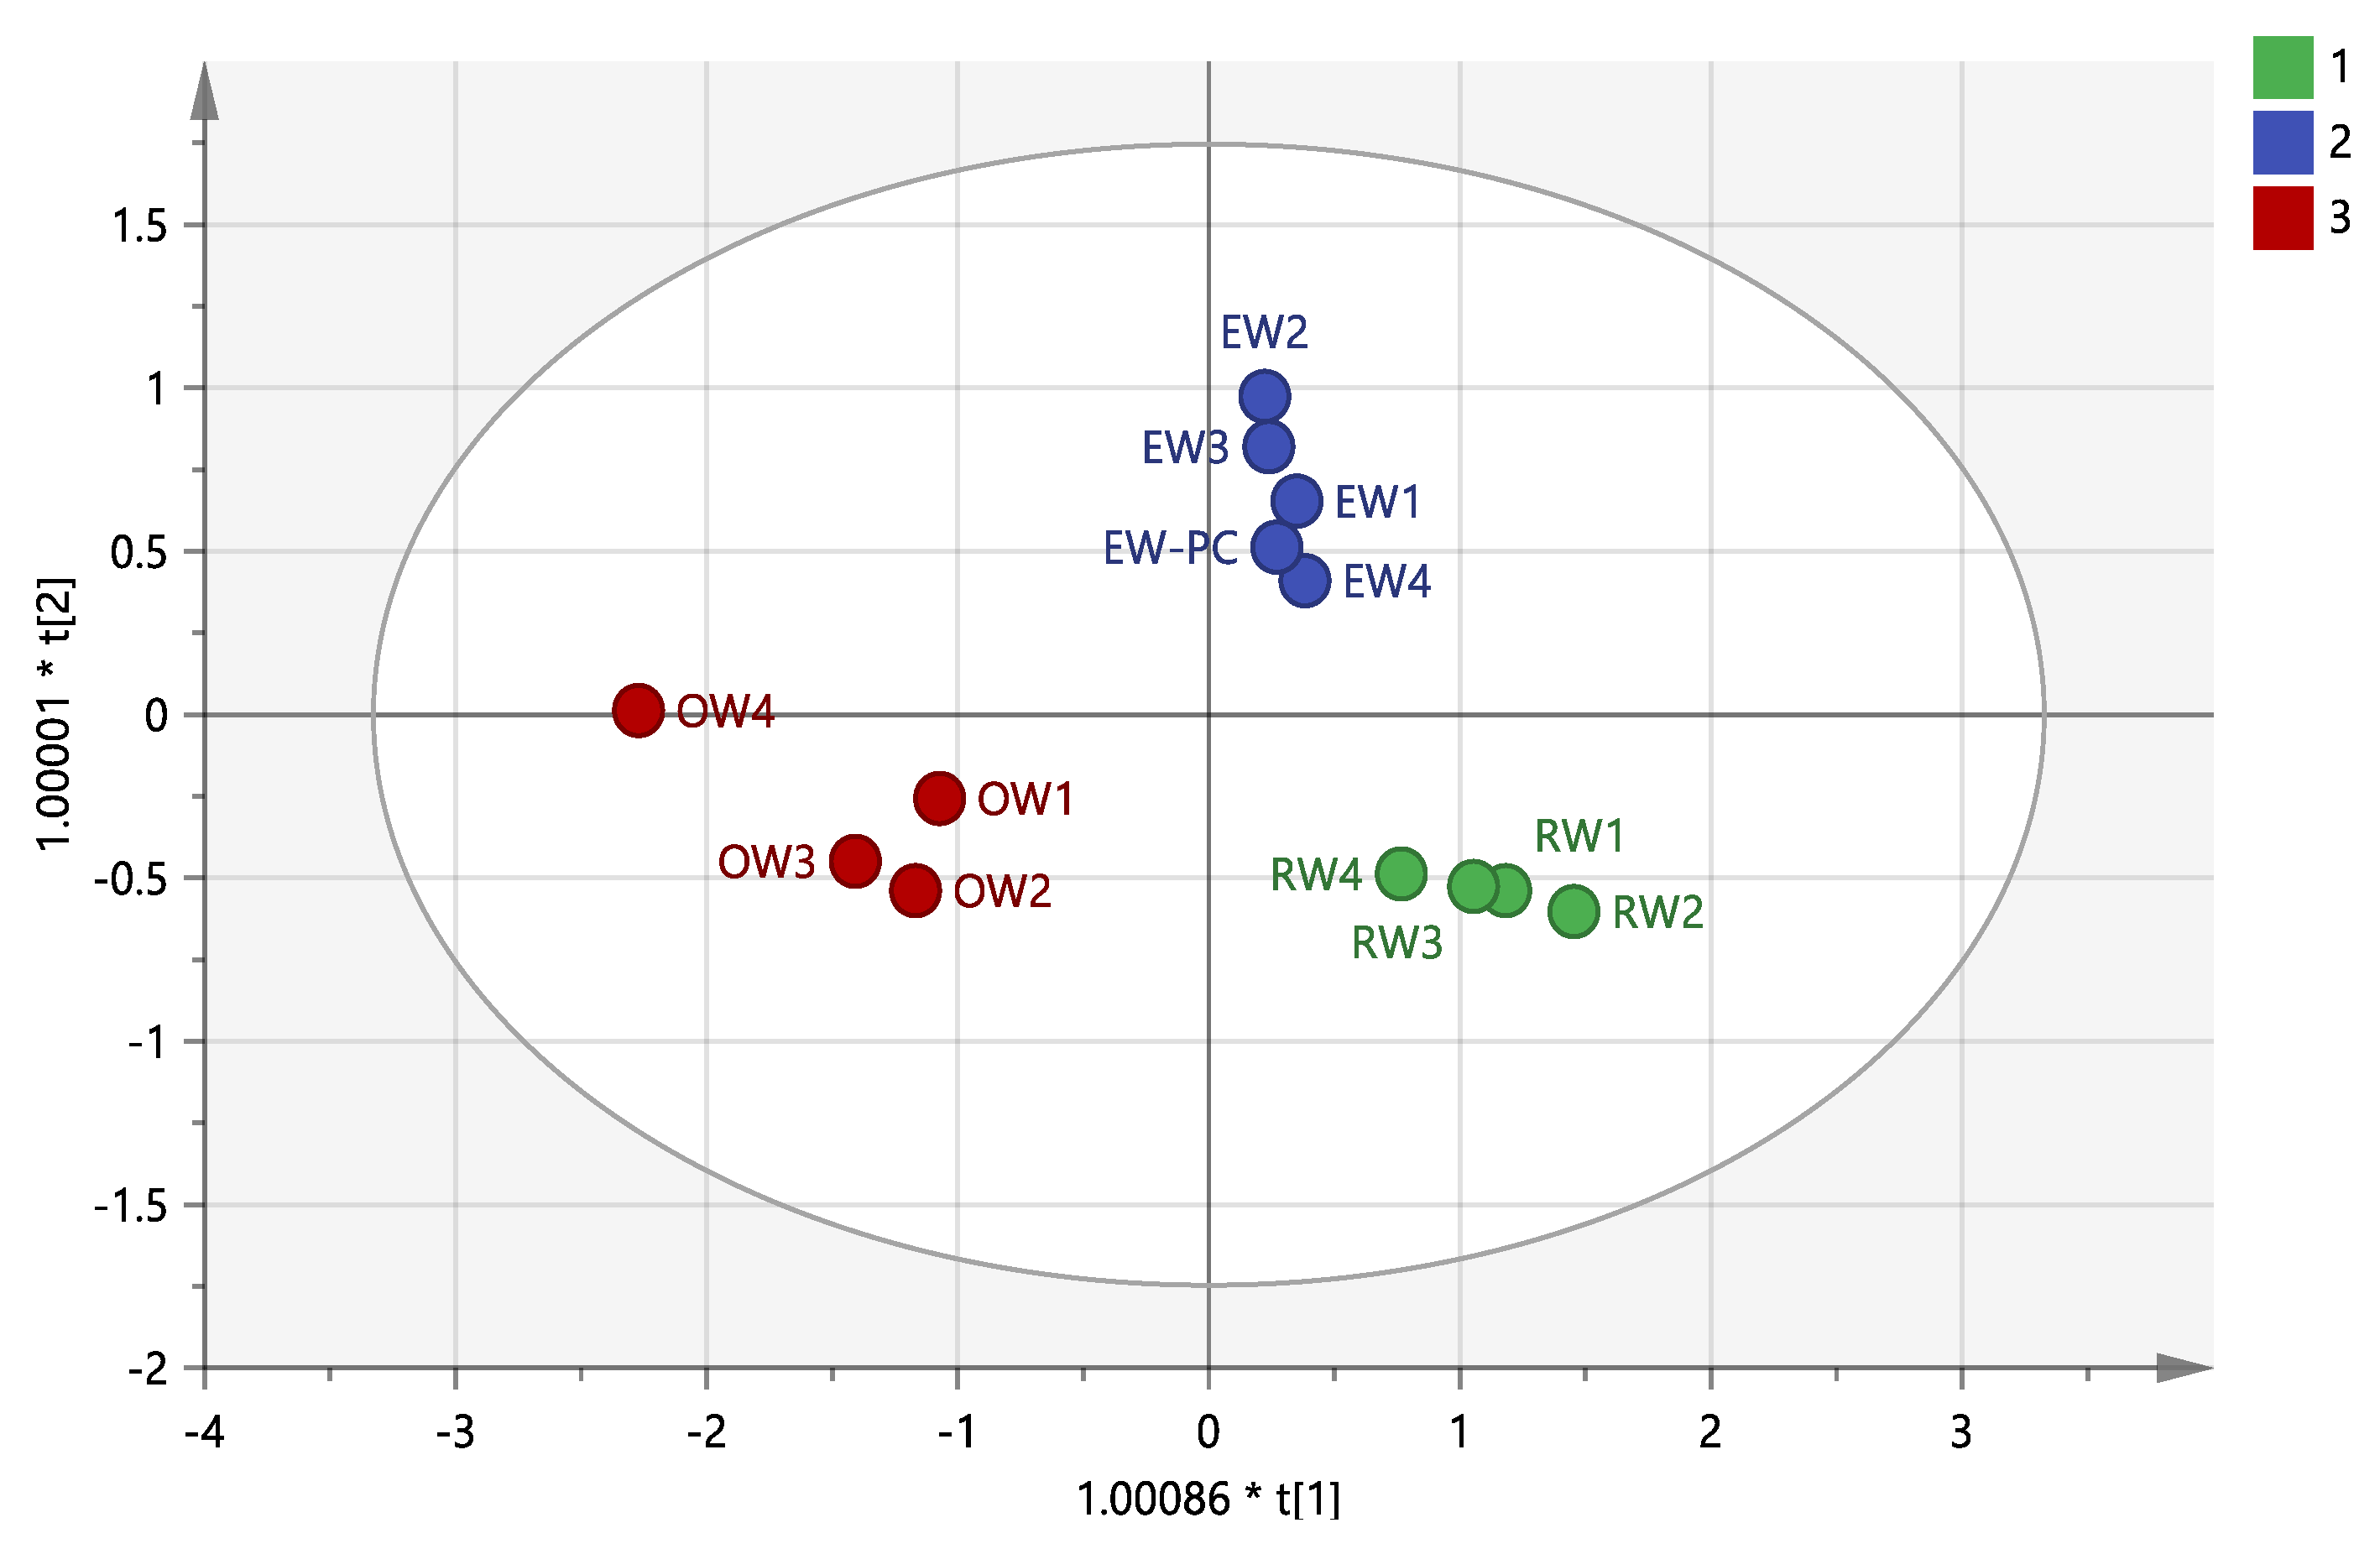

Table 1.
Basic parameters of A. japonica samples from three aquatic habitats.
| Groups | Sampling Waters | Collection Month | Number | Standard Length (cm) | Wet weight (g) |
|---|---|---|---|---|---|
| RW | River waters | July | 4 | 68.65±5.36a | 580.34±154.12a |
| EW | Estuary waters | July | 4 | 71.30±22.53a | 759.63±636.30a |
| OW | Offshore waters | July | 4 | 72.40±6.11a | 666.30±96.89a |
Note: The same letters after the standard deviation of the same column means that the difference is not significant (P>0.05).
Table 2.
The 21 elements content in the muscle of three habitat-originated A. japonica (mean ± SD).
| Index | RW | EW | OW | P |
|---|---|---|---|---|
| Al | 2.150±1.035a | 4.653±2.067a | 4.165±1.623a | 0.077 |
| Ti | 1.895±0.965a | 1.517±0.425a | 1.613±0.092a | 0.874 |
| V | 0.131±0.018a | 0.183±0.027b | 0.142±0.020a | 0.044 |
| Cr | 5.579±0.413a | 5.985±0.342a | 5.097±0.848a | 0.174 |
| Mn | 0.833±0.556a | 1.406±0.696a | 0.845±0.110a | 0.298 |
| Fe | 74.093±135.460a | 18.160±8.556a | 14.298±3.852a | 0.551 |
| Co | 0.147±0.132a | 0.061±0.034a | 0.044±0.005a | 0.694 |
| Ni | 0.843±0.669a | 0.476±0.093a | 0.717±0.344a | 0.491 |
| Cu | 1.513±0.955a | 0.795±0.655a | 1.205±0.847a | 0.551 |
| Zn | 42.306±7.280a | 63.862±18.447a | 57.310±14.201a | 0.167 |
| As | 0.409±0.092a | 0.733±0.443a | 0.896±0.703a | 0.390 |
| Sr | 1.571±0.668a | 3.661±3.156a | 3.668±1.894a | 0.155 |
| Mo | 0.131±0.106a | 0.075±0.020a | 0.062±0.008a | 0.292 |
| Cd | 0.031±0.024a | 0.030±0.023a | 0.040±0.014a | 0.758 |
| Ba | 0.627±0.164a | 0.969±0.373a | 0.895±0.279a | 0.123 |
| Hg | 0.201±0.018a | 0.611±0.078b | 0.281±0.091a | 0.012 |
| Pb | 0.598±0.569a | 0.302±0.125a | 0.400±0.029a | 0.735 |
| Ca | 1.311±0.808a | 1.583±0.834a | 0.840±0.452a | 0.397 |
| K | 4.930±1.120a | 6.200±1.880a | 6.820±0.508a | 0.116 |
| Mg | 0.375±0.047a | 0.465±0.186a | 0.718±0.132b | 0.031 |
| Na | 0.617±0.156a | 1.561±0.401b | 3.628±0.920c | 0.007 |
Note: The same letters after the standard deviation of the same line means that the difference is not significant (P>0.05) and including the different letters means that the difference is significant (P<0.05). The unit for K, Ca, Mg and Na is g/kg, the unit of other 17 elements is mg/kg.
Table 3.
Principal component matrix and contribution rates of 21 elements in the muscles of three habitat-originated A. japonica.
Table 3.
Principal component matrix and contribution rates of 21 elements in the muscles of three habitat-originated A. japonica.
| Variable | Principal Component | ||||
|---|---|---|---|---|---|
| 1 | 2 | 3 | 4 | 5 | |
| Al | 0.852 | -0.292 | 0.238 | 0.122 | -0.196 |
| Ti | 0.112 | 0.859 | 0.298 | 0.191 | 0.162 |
| V | 0.036 | -0.634 | 0.236 | 0.216 | 0.479 |
| Cr | -0.31 | -0.481 | 0.641 | 0.13 | 0.166 |
| Mn | -0.053 | -0.426 | 0.398 | 0.644 | -0.365 |
| Fe | -0.346 | 0.275 | -0.194 | 0.798 | 0.157 |
| Co | -0.392 | 0.187 | -0.373 | 0.666 | 0.352 |
| Ni | 0.072 | 0.815 | 0.34 | -0.329 | 0.016 |
| Cu | 0.213 | 0.707 | -0.337 | 0.484 | 0.136 |
| Zn | 0.809 | -0.234 | -0.009 | 0.175 | -0.06 |
| As | 0.756 | 0.137 | -0.22 | -0.089 | 0.085 |
| Sr | 0.914 | 0.09 | 0.073 | 0.203 | 0.004 |
| Mo | -0.241 | 0.623 | 0.639 | -0.066 | -0.286 |
| Cd | 0.147 | 0.029 | -0.366 | 0.775 | -0.435 |
| Ba | 0.7 | -0.103 | 0.476 | 0.072 | -0.001 |
| Hg | 0.451 | -0.585 | 0.472 | 0.181 | 0.249 |
| Pb | -0.016 | 0.87 | 0.402 | 0.007 | 0.054 |
| Ca | 0.407 | 0.341 | 0.656 | 0.382 | -0.066 |
| K | 0.764 | 0.198 | -0.024 | -0.064 | 0.473 |
| Mg | 0.844 | 0.205 | -0.412 | -0.141 | 0.023 |
| Na | 0.748 | 0 | -0.425 | -0.147 | -0.218 |
| Characteristic Value | 6.02 | 4.69 | 3.165 | 2.867 | 1.246 |
| Contribution Rate | 28.668 | 22.331 | 15.071 | 13.653 | 5.934 |
| Cumulative Contribution | 28.668 | 50.999 | 66.07 | 79.724 | 85.658 |
Table 4.
Linear discriminated functions coefficient of 21 elements in the muscles of three habitat-originated Anguilla japonica.
Table 4.
Linear discriminated functions coefficient of 21 elements in the muscles of three habitat-originated Anguilla japonica.
| Discriminative Elements | RW | EW | OW |
|---|---|---|---|
| V | 324.172 | 277.182 | 1105.952 |
| Hg | 11.313 | 176.282 | -416.413 |
| Na | 4.846 | -10.191 | 86.957 |
| Cu | 1.414 | 6.211 | -30.246 |
| Constant | -25.954 | -74.715 | -160.480 |
Table 5.
Results of the discriminant verification analysis for three habitat-originated A. japonica using the four discriminant elements in the muscles.
Table 5.
Results of the discriminant verification analysis for three habitat-originated A. japonica using the four discriminant elements in the muscles.
| Method | Groups | Prediction Category | Discriminant Accuracy (%) | Comprehensive Discrimination Rate (%) | ||
|---|---|---|---|---|---|---|
| RW | EW+PC | OW | ||||
| Stepwise Discrimination | RW | 4 | 0 | 0 | 100.0 | 100.0 |
| EW+PC | 0 | 5 | 0 | 100.0 | ||
| OW | 0 | 0 | 4 | 100.0 | ||
| Cross Verification | RW | 4 | 0 | 0 | 100.0 | 100.0 |
| EW+PC | 0 | 5 | 0 | 100.0 | ||
| OW | 0 | 0 | 4 | 100.0 | ||
Disclaimer/Publisher’s Note: The statements, opinions and data contained in all publications are solely those of the individual author(s) and contributor(s) and not of MDPI and/or the editor(s). MDPI and/or the editor(s) disclaim responsibility for any injury to people or property resulting from any ideas, methods, instructions or products referred to in the content. |
© 2025 by the authors. Licensee MDPI, Basel, Switzerland. This article is an open access article distributed under the terms and conditions of the Creative Commons Attribution (CC BY) license (http://creativecommons.org/licenses/by/4.0/).
Copyright: This open access article is published under a Creative Commons CC BY 4.0 license, which permit the free download, distribution, and reuse, provided that the author and preprint are cited in any reuse.


