
Submitted:
20 November 2025
Posted:
21 November 2025
You are already at the latest version
Abstract
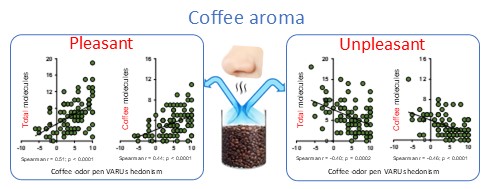
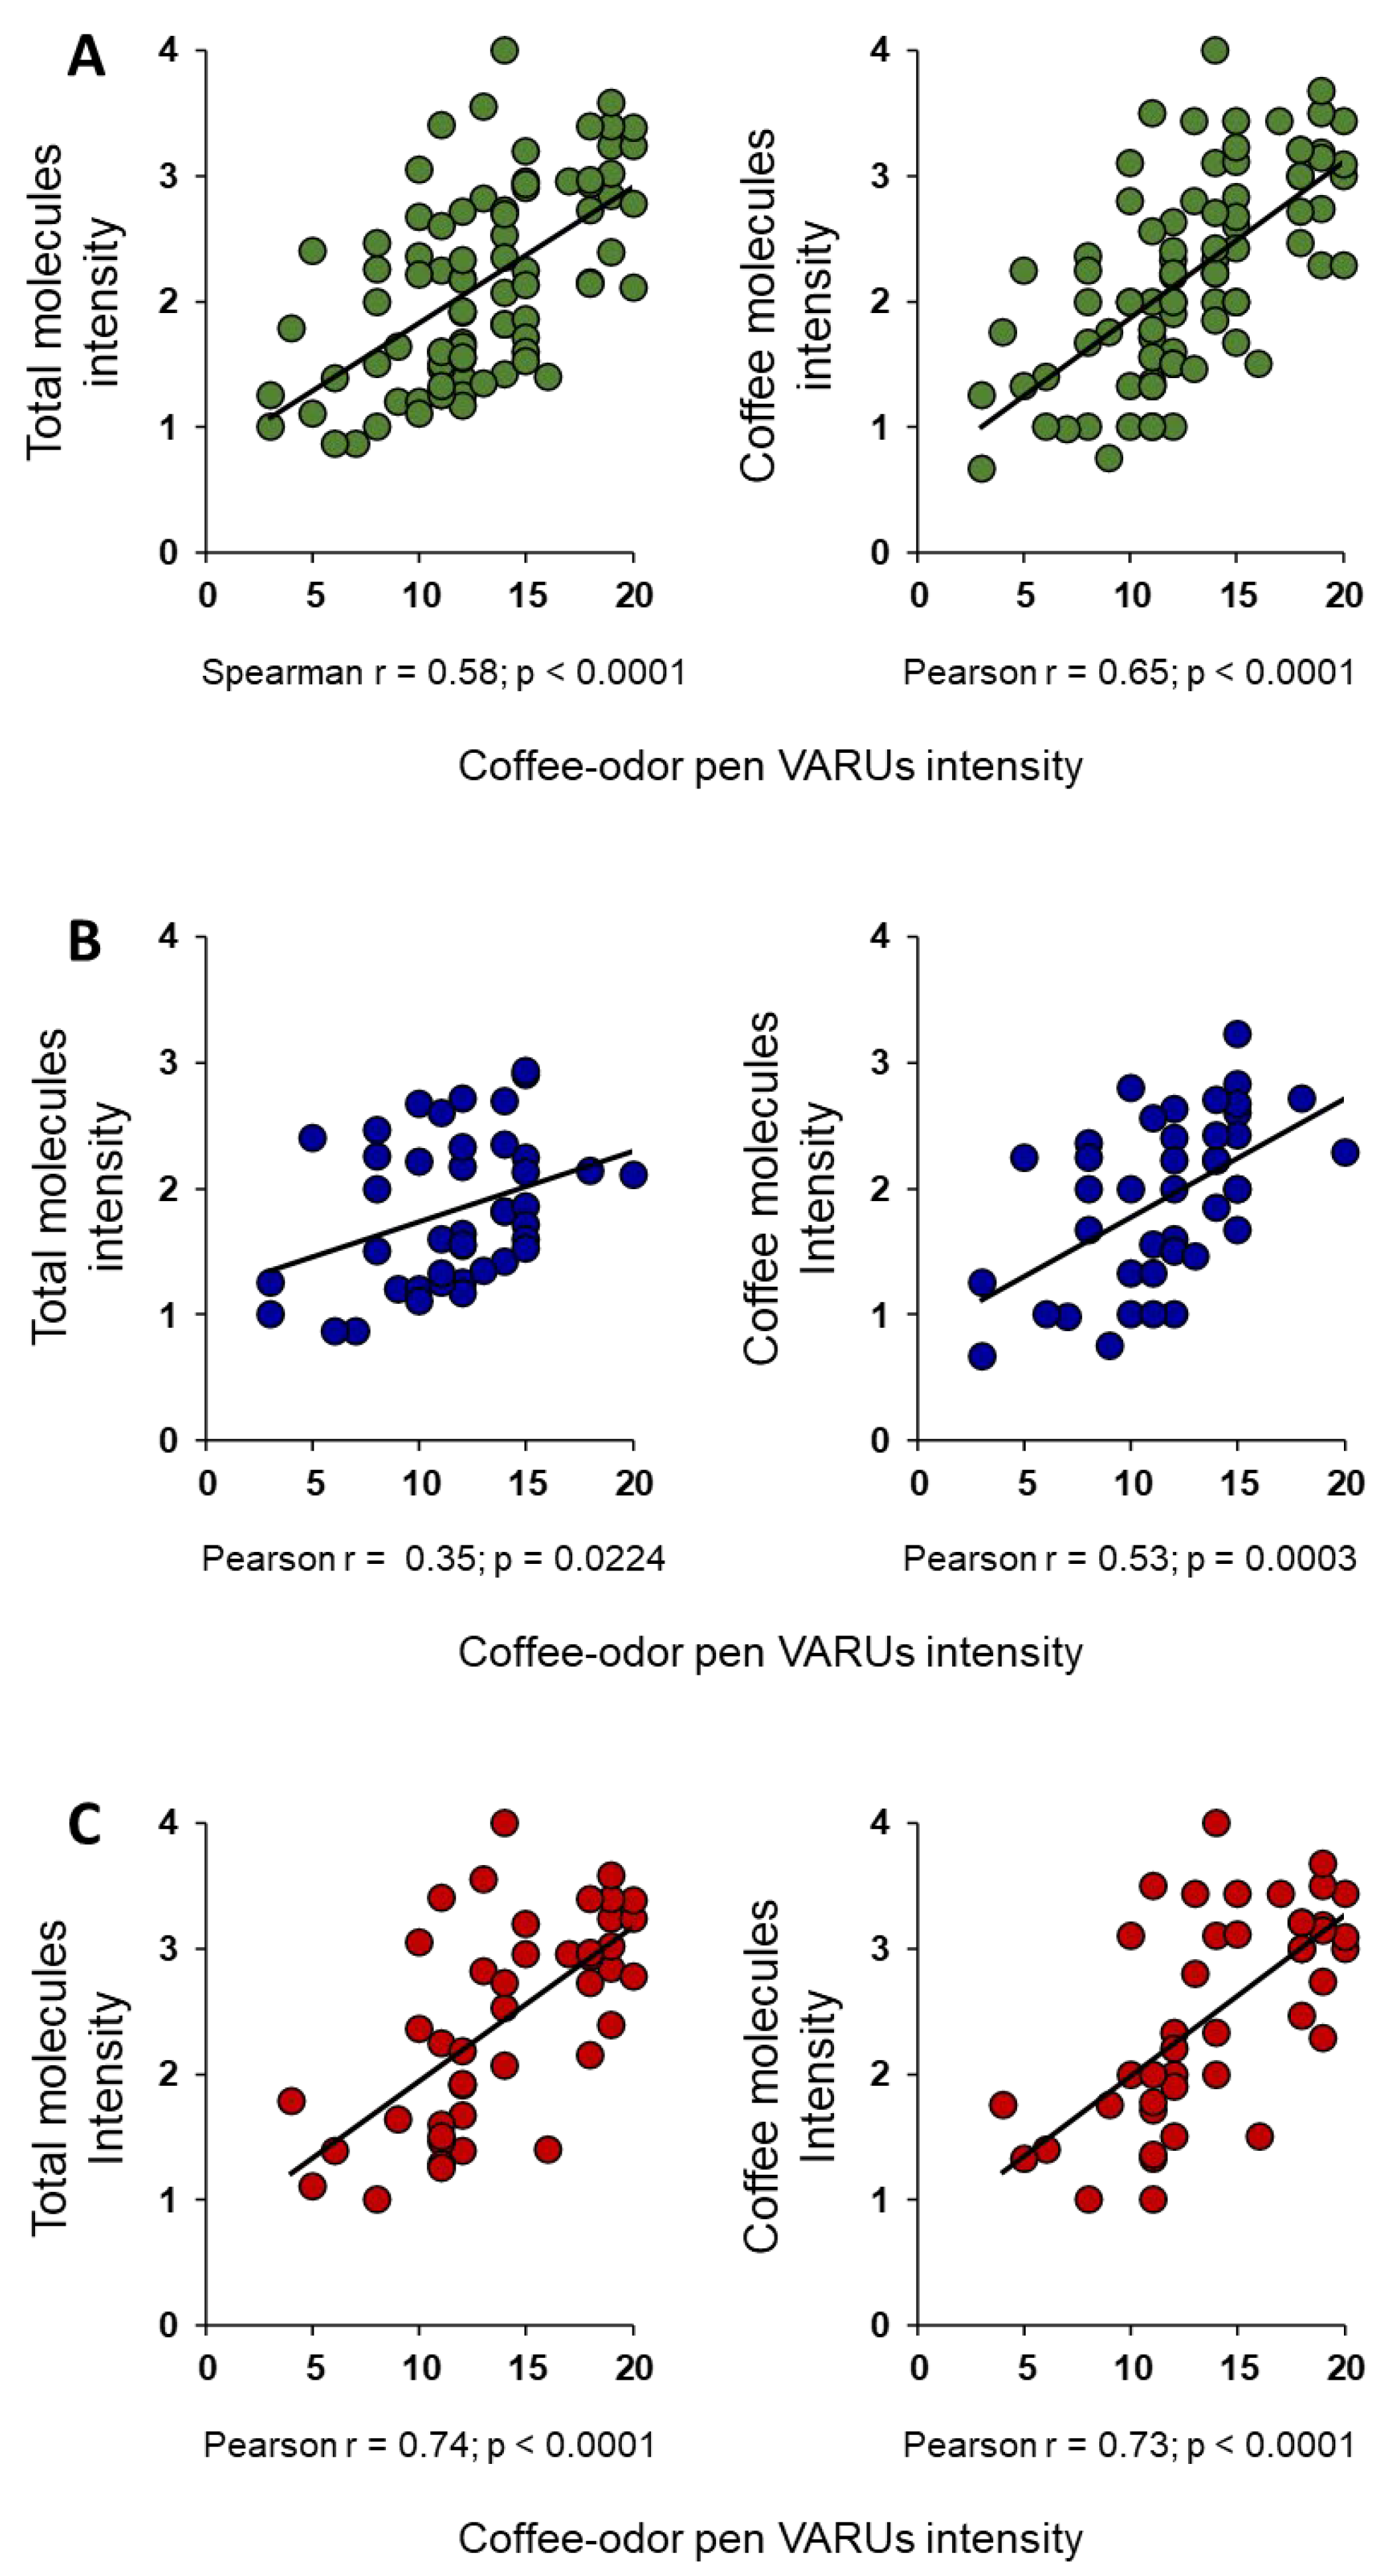
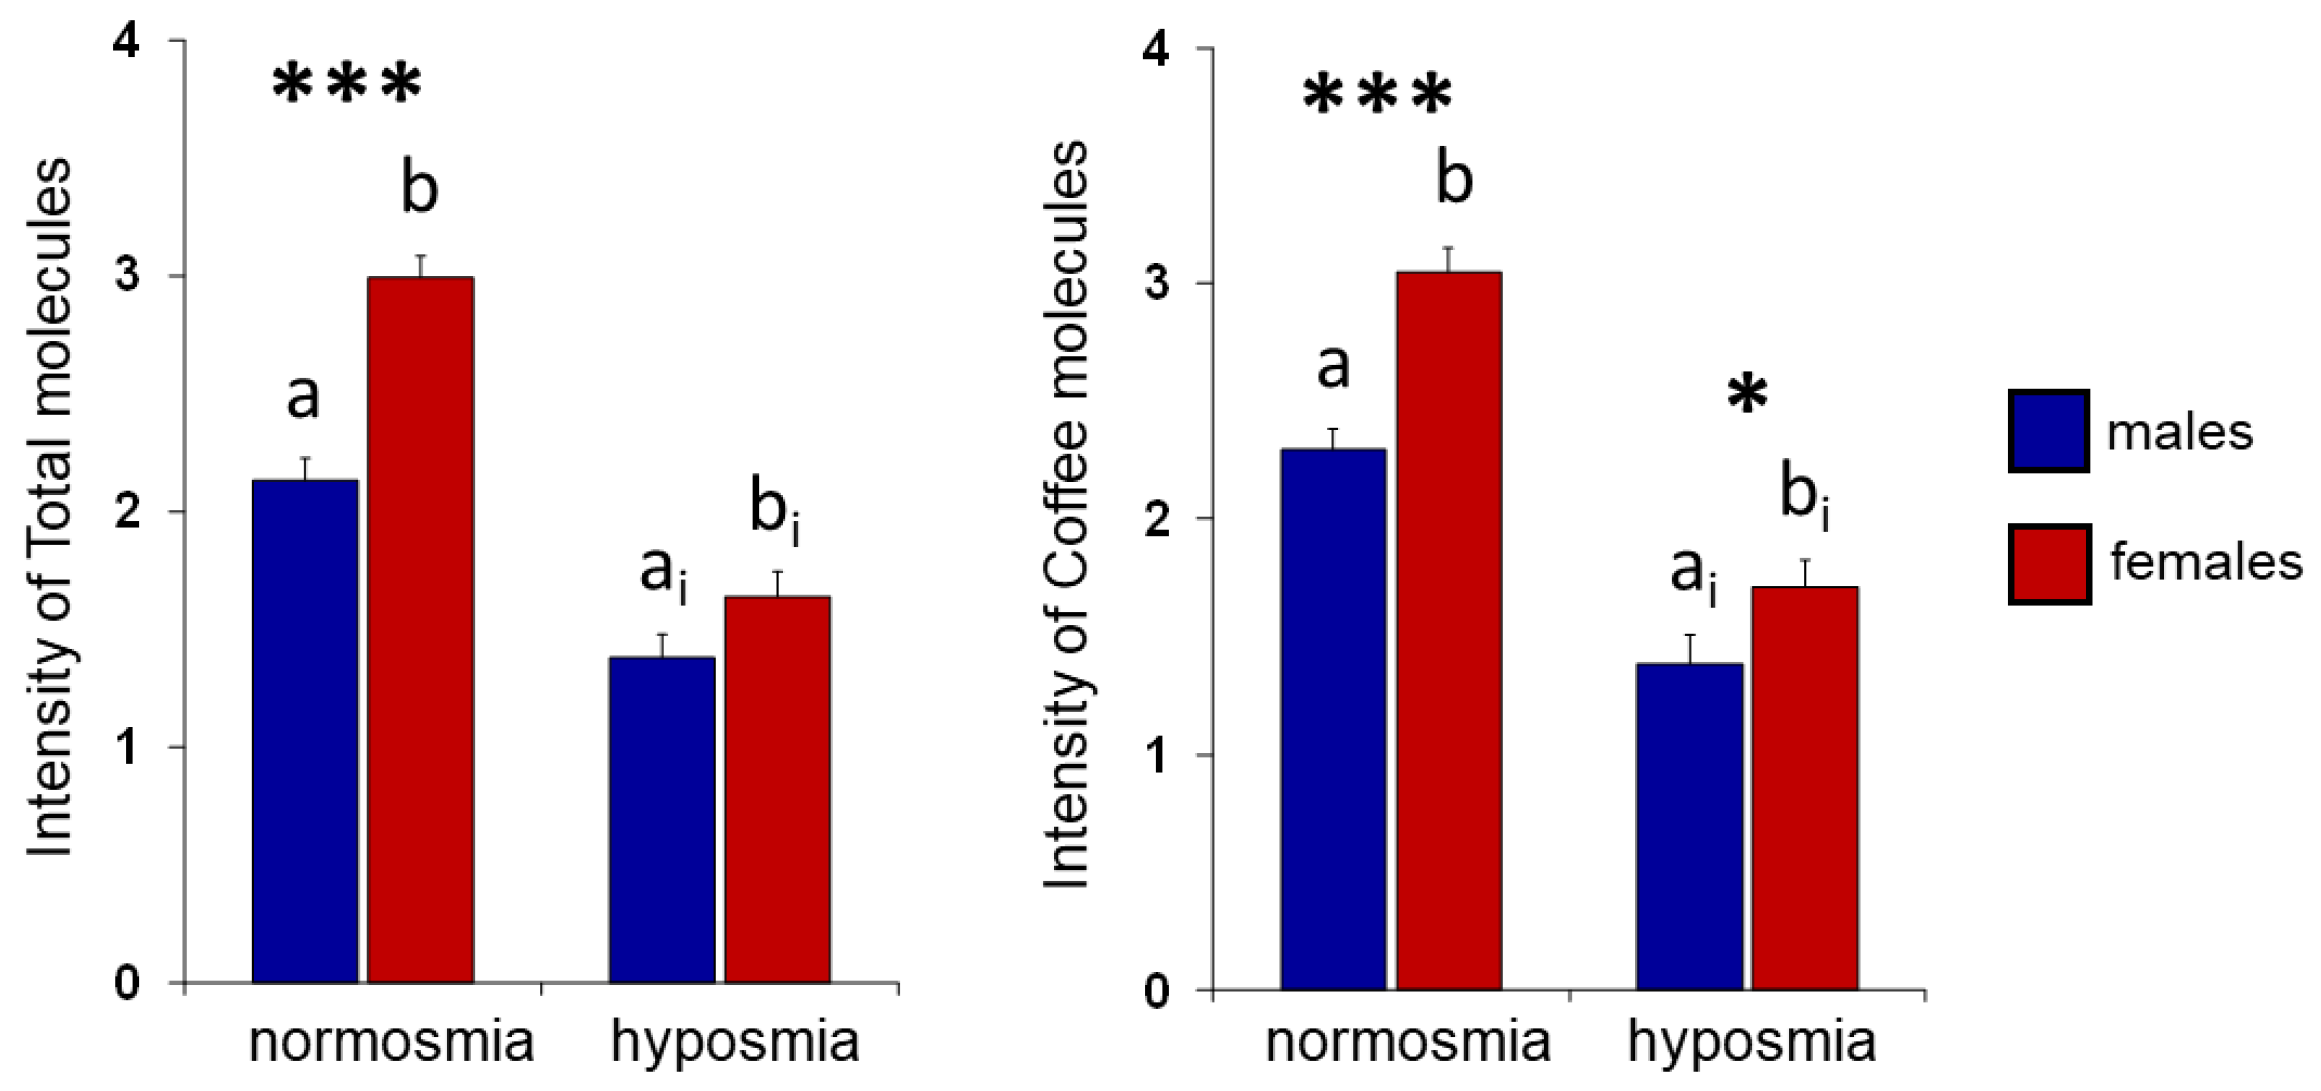
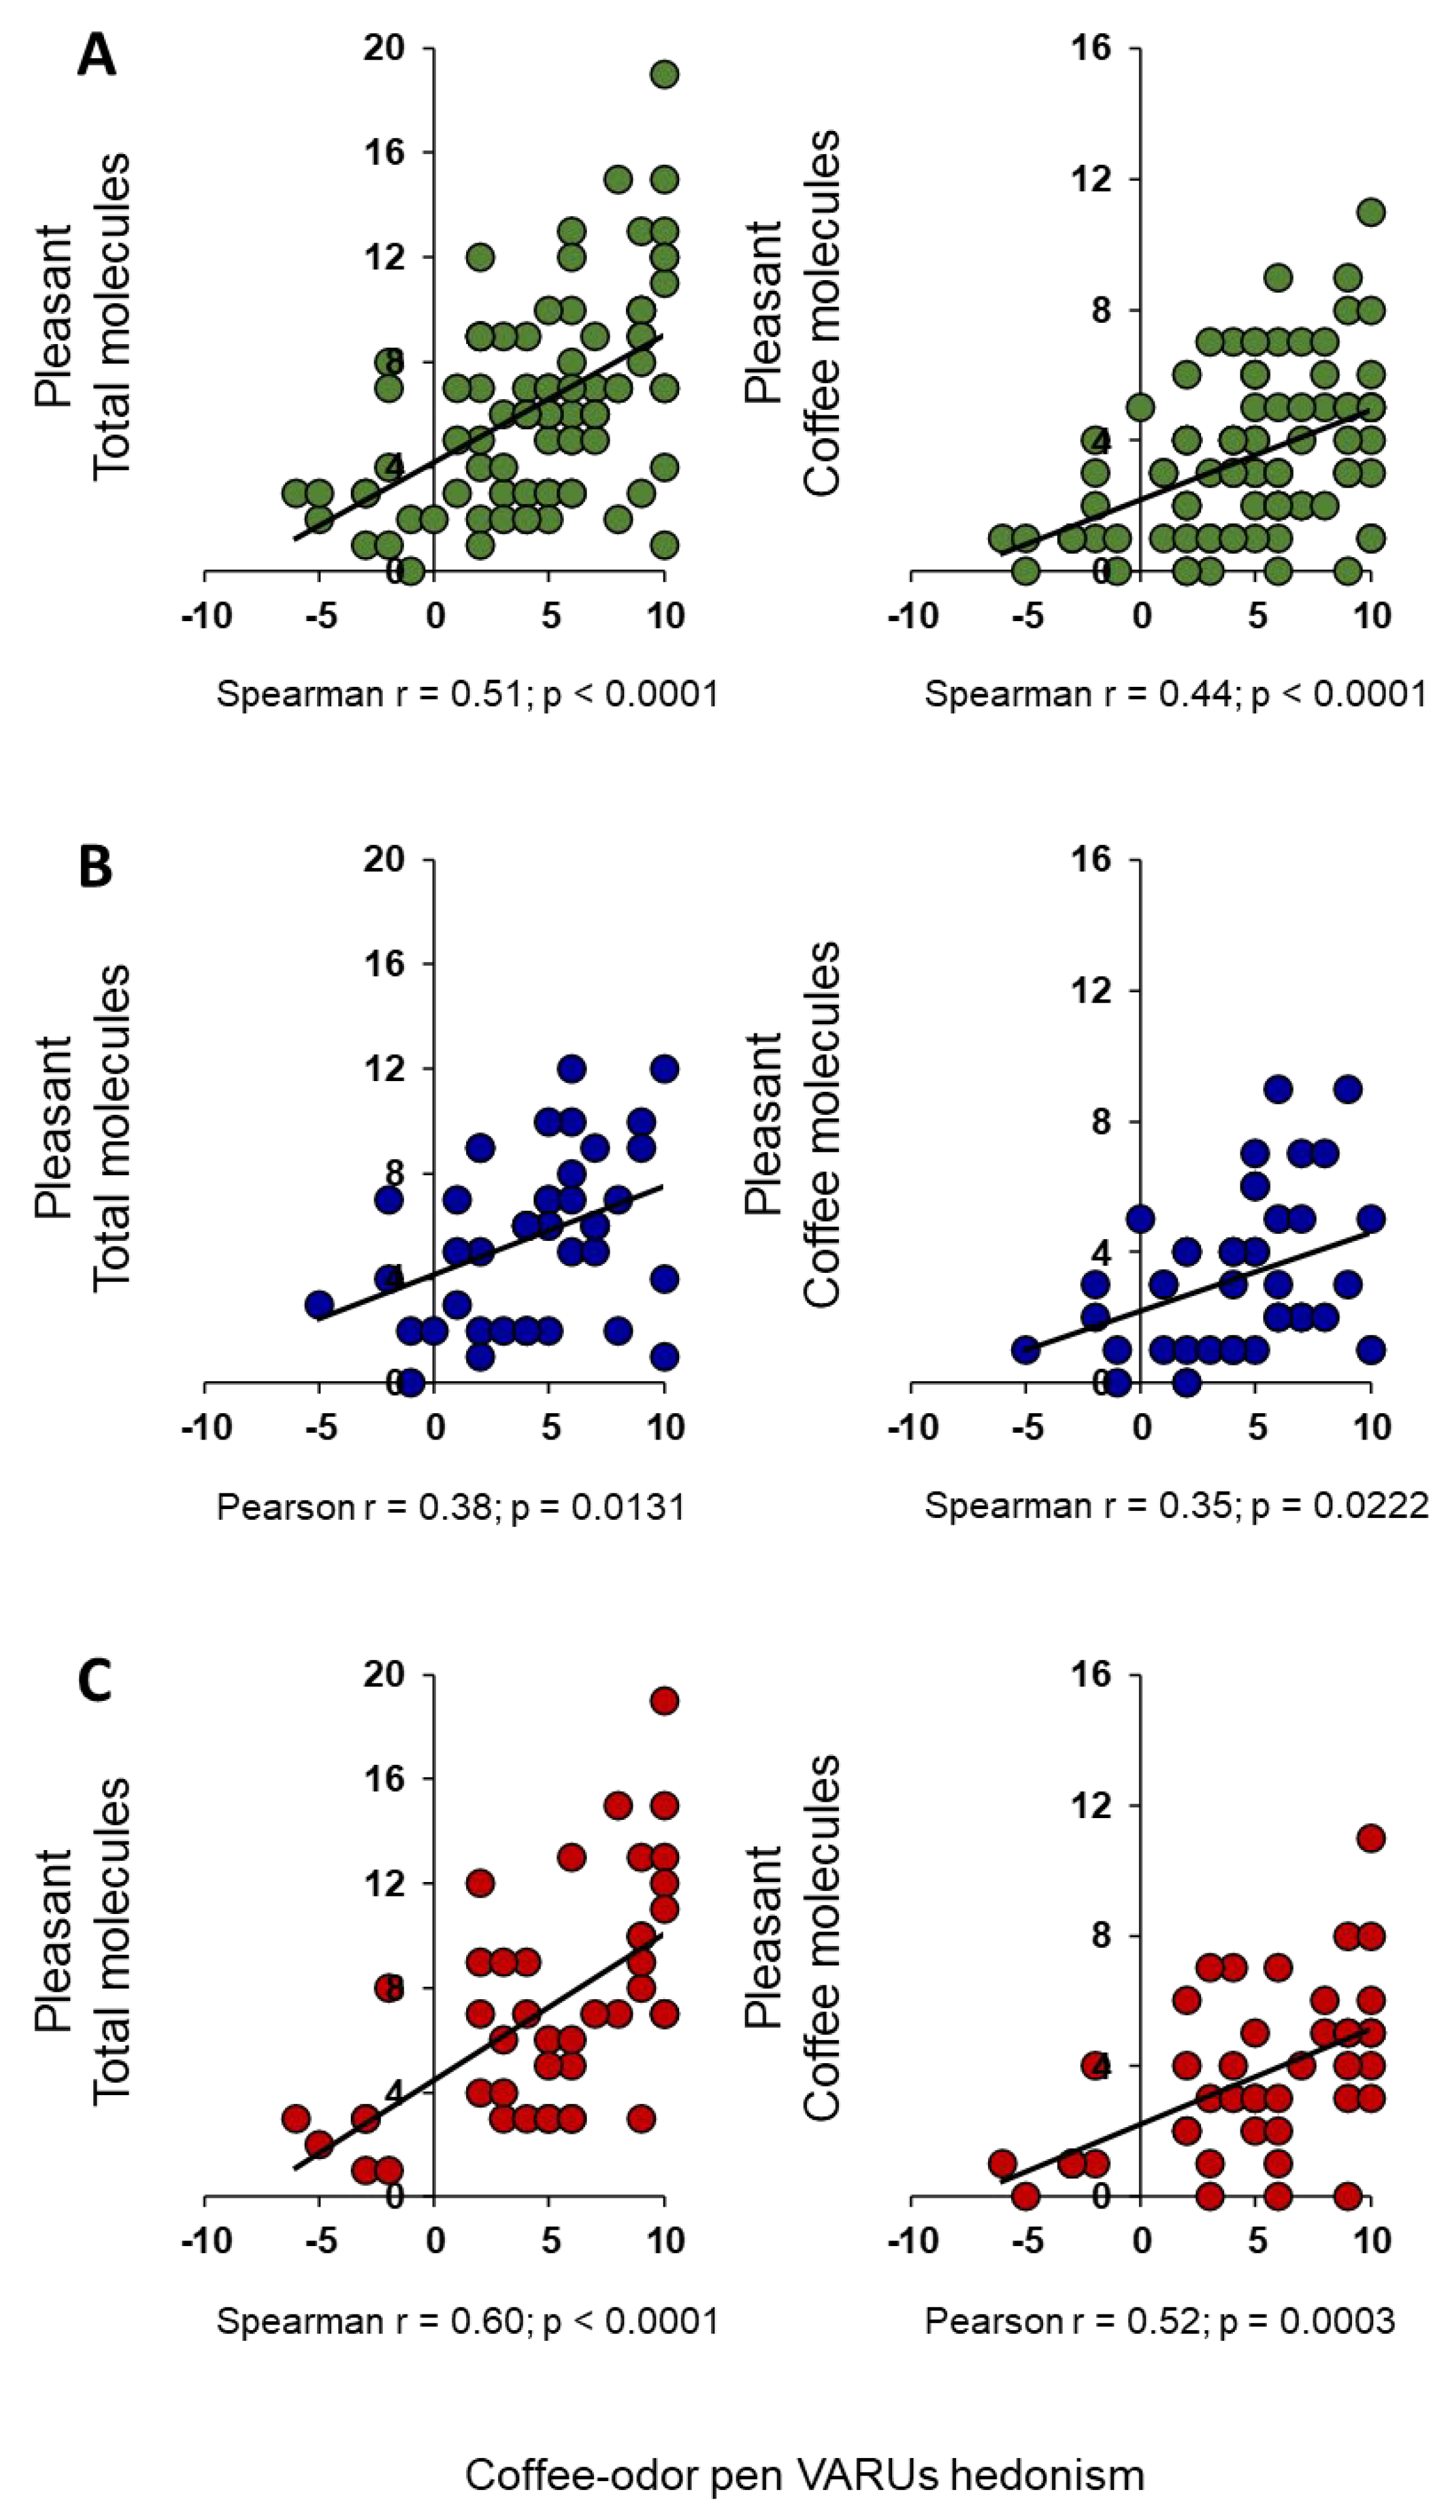
Coffee is the most popular non-alcoholic beverage in the world, and its consumption has increased over the last decades. Recent studies have identified the social and environmental factors that determine whether an individual is a coffee drinker or non-drinker. Knowing the key aroma compounds of coffee and identifying inter-individual differences in the number and type of odor-active compounds could be important to understand what guides consumers towards the choice of drinking or not drinking coffee. In this study, using the coupled Gas Chromatography-Olfactometry technique, the components of the headspace of roasted coffee beans were separated and evaluated by volunteers. Each participant had to identify and provide a personal evaluation of the pleasantness and intensity perceived for each odor molecule. The results show that individuals with normosmia perceive single molecules with a greater intensity than those with hyposmia, and that females report perceiving the odor of single molecules with a higher intensity than males. The reported pleasantness for the coffee aroma is determined by the hedonic valence attributed to each molecule in terms of pleasantness/unpleasantness. These results could be of great interest to the coffee industry, providing useful information for the development of new blends.
Keywords:
1. Introduction
2. Results
3. Discussion
4. Materials and Methods
4.1. Subjects
4.2. Olfactory Sensitivity Screening
4.3. Dynamic Headspace Sampling
4.4. Mass Spectrometry/Gas Chromatography–Olfactometry (MS/GC-O) Analysis
4.5. Statistical Analysis
5. Conclusions
Author Contributions
Funding
Institutional Review Board Statement
Informed Consent Statement
Data Availability Statement
Acknowledgments
Conflicts of Interest
References
- Stevenson, R.J. An initial evaluation of the functions of human olfaction. Chem Senses 2010, 35, 3–20. [Google Scholar] [CrossRef]
- Croy, I.; Mohr, T.; Weidner, K.; Hummel, T.; Junge-Hoffmeister, J. Mother-child bonding is associated with the maternal perception of the child's body odor. Physiology & behavior 2019, 198, 151–157. [Google Scholar]
- Bolhuis, D.P.; Lakemond, C.M.; de Wijk, R.A.; Luning, P.A.; de Graaf, C. Effect of salt intensity in soup on ad libitum intake and on subsequent food choice. Appetite 2012, 58, 48–55. [Google Scholar] [CrossRef] [PubMed]
- Ramaekers, M.G.; Boesveldt, S.; Lakemond, C.M.; van Boekel, M.A.; Luning, P.A. Odors: appetizing or satiating? Development of appetite during odor exposure over time. International journal of obesity (2005) 2014, 38, 650–656. [Google Scholar] [CrossRef]
- Ruijschop, R.M.; Boelrijk, A.E.; de Ru, J.A.; de Graaf, C.; Westerterp-Plantenga, M.S. Effects of retro-nasal aroma release on satiation. The British journal of nutrition 2008, 99, 1140–1148. [Google Scholar] [CrossRef] [PubMed]
- Yin, W.; Hewson, L.; Linforth, R.; Taylor, M.; Fisk, I.D. Effects of aroma and taste, independently or in combination, on appetite sensation and subsequent food intake. Appetite 2017, 114, 265–274. [Google Scholar] [CrossRef]
- Aschenbrenner, K.; Hummel, C.; Teszmer, K.; Krone, F.; Ishimaru, T.; Seo, H.S.; Hummel, T. The influence of olfactory loss on dietary behaviors. The Laryngoscope 2008, 118, 135–144. [Google Scholar] [CrossRef]
- Connor, E.E.; Zhou, Y.; Liu, G.E. The essence of appetite: does olfactory receptor variation play a role? Journal of animal science 2018, 96, 1551–1558. [Google Scholar] [CrossRef]
- Duffy, V.B.; Backstrand, J.R.; Ferris, A.M. Olfactory dysfunction and related nutritional risk in free-living, elderly women. Journal of the American Dietetic Association 1995, 95, 879–884. [Google Scholar] [CrossRef]
- Gaillet-Torrent, M.; Sulmont-Rossé, C.; Issanchou, S.; Chabanet, C.; Chambaron, S. Impact of a non-attentively perceived odour on subsequent food choices. Appetite 2014, 76, 17–22. [Google Scholar] [CrossRef]
- Islam, M.A.; Fagundo, A.B.; Arcelus, J.; Agüera, Z.; Jiménez-Murcia, S.; Fernández-Real, J.M.; Tinahones, F.J.; de la Torre, R.; Botella, C.; Frühbeck, G.; et al. Olfaction in eating disorders and abnormal eating behavior: a systematic review. Front Psychol 2015, 6, 1431. [Google Scholar] [CrossRef]
- Manesse, C.; Ferdenzi, C.; Sabri, M.; Bessy, M.; Rouby, C.; Faure, F.; Bellil, D.; Jomain, S.; Landis, B.N.; Hugentobler, M.; et al. Dysosmia-Associated Changes in Eating Behavior. Chemosensory Perception 2017, 10, 104–113. [Google Scholar] [CrossRef]
- Postma, E.; Graaf, C.; Boesveldt, S. Food preferences and intake in a population of Dutch individuals with self-reported smell loss: An online survey. Food Quality and Preference 2019, 79, 103771. [Google Scholar] [CrossRef]
- Velluzzi, F.; Deledda, A.; Lombardo, M.; Fosci, M.; Crnjar, R.; Grossi, E.; Sollai, G. Application of Artificial Neural Networks (ANN) to Elucidate the Connections among Smell, Obesity with Related Metabolic Alterations, and Eating Habit in Patients with Weight Excess. Metabolites 2023, 13, 206. [Google Scholar] [CrossRef] [PubMed]
- Ferreira, V. Revisiting psychophysical work on the quantitative and qualitative odour properties of simple odour mixtures: a flavour chemistry view. Part 2: qualitative aspects. A review. Flavour and Fragrance Journal 2012, 27, 201–215. [Google Scholar] [CrossRef]
- Ferreira, V. Revisiting psychophysical work on the quantitative and qualitative odour properties of simple odour mixtures: a flavour chemistry view. Part 1: intensity and detectability. A review. Flavour and Fragrance Journal 2012, 27, 124–140. [Google Scholar] [CrossRef]
- Esquivel, P.; Jiménez, V.M. Functional properties of coffee and coffee by-products. Food Research International 2012, 46, 488–495. [Google Scholar] [CrossRef]
- Samoggia, A.; Del Prete, M.; Argenti, C. Functional Needs, Emotions, and Perceptions of Coffee Consumers and Non-Consumers. Sustainability 2020, 12, 5694. [Google Scholar] [CrossRef]
- Shen, X.; Nie, F.; Fang, H.; Liu, K.; Li, Z.; Li, X.; Chen, Y.; Chen, R.; Zheng, T.; Fan, J. Comparison of chemical compositions, antioxidant activities, and acetylcholinesterase inhibitory activities between coffee flowers and leaves as potential novel foods. Food science & nutrition 2023, 11, 917–929. [Google Scholar]
- Angeloni, S.; Mustafa, A.M.; Abouelenein, D.; Alessandroni, L.; Acquaticci, L.; Nzekoue, F.K.; Petrelli, R.; Sagratini, G.; Vittori, S.; Torregiani, E.; et al. Characterization of the Aroma Profile and Main Key Odorants of Espresso Coffee. Molecules (Basel, Switzerland) 2021, 26. [Google Scholar] [CrossRef]
- Carvalho, N.B.; Minim, V.P.R.; Nascimento, M.; Vidigal, M.C.T.R.; Ferreira, M.A.M.; Gonçalves, A.C.A.; Minim, L.A. A discriminant function for validation of the cluster analysis and behavioral prediction of the coffee market. Food Research International 2015, 77, 400–407. [Google Scholar] [CrossRef]
- Dórea, J.G.; da Costa, T.H. Is coffee a functional food? The British journal of nutrition 2005, 93, 773–782. [Google Scholar] [CrossRef] [PubMed]
- Mundel, J.; Huddleston, P.; Vodermeier, M. An exploratory study of consumers’ perceptions: What are affordable luxuries? Journal of Retailing and Consumer Services 2017, 35, 68–75. [Google Scholar] [CrossRef]
- Samoggia, A.; Riedel, B. Coffee consumption and purchasing behavior review: Insights for further research. Appetite 2018, 129, 70–81. [Google Scholar] [CrossRef]
- Hu, G.L.; Wang, X.; Zhang, L.; Qiu, M.H. The sources and mechanisms of bioactive ingredients in coffee. Food & Function 2019, 10, 3113–3126. [Google Scholar] [CrossRef]
- Kusumah, J.; Gonzalez de Mejia, E. Coffee constituents with antiadipogenic and antidiabetic potentials: A narrative review. Food and Chemical Toxicology 2022, 161, 112821. [Google Scholar] [CrossRef]
- Ludwig, I.A.; Clifford, M.N.; Lean, M.E.J.; Ashihara, H.; Crozier, A. Coffee: biochemistry and potential impact on health. Food & Function 2014, 5, 1695–1717. [Google Scholar] [CrossRef]
- Silva, C.W.; Zanardi, K.R.; Grancieri, M.; Costa, N.M.B.; Trivillin, L.O.; Viana, M.L.; Silva, P.I.; Costa, A.G.V. Green coffee extract (Coffea canephora) improved the intestinal barrier and slowed colorectal cancer progression and its associated inflammation in rats. PharmaNutrition 2022, 22, 100314. [Google Scholar] [CrossRef]
- Socała, K.; Szopa, A.; Serefko, A.; Poleszak, E.; Wlaź, P. Neuroprotective Effects of Coffee Bioactive Compounds: A Review. International Journal of Molecular Sciences 2021, 22, 107. [Google Scholar] [CrossRef]
- Yao, L.; Zhao, M.-M.; Luo, Q.-W.; Zhang, Y.-C.; Liu, T.-T.; Yang, Z.; Liao, M.; Tu, P.; Zeng, K.-W. Carbon Quantum Dots-Based Nanozyme from Coffee Induces Cancer Cell Ferroptosis to Activate Antitumor Immunity. ACS nano 2022, 16, 9228–9239. [Google Scholar] [CrossRef]
- Kanjanakorn, A.; Lee, J. Examining emotions and comparing the EsSense Profile® and the Coffee Drinking Experience in coffee drinkers in the natural environment. Food Quality and Preference 2017, 56, 69–79. [Google Scholar] [CrossRef]
- Angeloni, S.; Navarini, L.; Sagratini, G.; Torregiani, E.; Vittori, S.; Caprioli, G. Development of an extraction method for the quantification of lignans in espresso coffee by using HPLC-MS/MS triple quadrupole. Journal of Mass Spectrometry 2018, 53, 842–848. [Google Scholar] [CrossRef] [PubMed]
- Buratti, S.; Benedetti, S.; Giovanelli, G. Application of electronic senses to characterize espresso coffees brewed with different thermal profiles. European Food Research and Technology 2017, 243, 511–520. [Google Scholar] [CrossRef]
- Brattoli, M.; Cisternino, E.; Dambruoso, P.R.; de Gennaro, G.; Giungato, P.; Mazzone, A.; Palmisani, J.; Tutino, M. Gas chromatography analysis with olfactometric detection (GC-O) as a useful methodology for chemical characterization of odorous compounds. Sensors (Basel, Switzerland) 2013, 13, 16759–16800. [Google Scholar] [CrossRef] [PubMed]
- Delahunty, C.M.; Eyres, G.; Dufour, J.P. Gas chromatography-olfactometry. Journal of separation science 2006, 29, 2107–2125. [Google Scholar] [CrossRef]
- Schilling, B.; Kaiser, R.; Natsch, A.; Gautschi, M. Investigation of odors in the fragrance industry. Chemoecology 2010, 20, 135–147. [Google Scholar] [CrossRef]
- Crnjar, R.; Solari, P.; Sollai, G. The Human Nose as a Chemical Sensor in the Perception of Coffee Aroma: Individual Variability. Chemosensors 2023, 11, 248. [Google Scholar] [CrossRef]
- Nuzzi, M.; Lo Scalzo, R.; Testoni, A.; Rizzolo, A. Evaluation of Fruit Aroma Quality: Comparison Between Gas Chromatography–Olfactometry (GC–O) and Odour Activity Value (OAV) Aroma Patterns of Strawberries. Food Analytical Methods 2008, 1, 270–282. [Google Scholar] [CrossRef]
- Sollai, G.; Tomassini Barbarossa, I.; Usai, P.; Hummel, T.; Crnjar, R. Association between human olfactory performance and ability to detect single compounds in complex chemical mixtures. Physiology & behavior 2020, 217, 112820. [Google Scholar]
- Croy, I.; Angelo, S.D.; Olausson, H. Reduced pleasant touch appraisal in the presence of a disgusting odor. PloS one 2014, 9, e92975. [Google Scholar] [CrossRef]
- Blank, I.; Devaud, S.; Fay, L.B.; Cerny, C.; Steiner, M.; Zurbriggen, B. Odor-Active Compounds of Dry-Cured Meat: Italian-Type Salami and Parma Ham. 2001.
- Iannario, M.; Manisera, M.; Piccolo, D.; Zuccolotto, P. Sensory analysis in the food industry as a tool for marketing decisions. Advances in Data Analysis and Classification 2012, 6, 303–321. [Google Scholar] [CrossRef]
- Jordán, M.J.; Tandon, K.; Shaw, P.E.; Goodner, K.L. Aromatic profile of aqueous banana essence and banana fruit by gas chromatography-mass spectrometry (GC-MS) and gas chromatography-olfactometry (GC-O). Journal of agricultural and food chemistry 2001, 49, 4813–4817. [Google Scholar] [CrossRef] [PubMed]
- Albrecht, J.; Schreder, T.; Kleemann, A.M.; Schöpf, V.; Kopietz, R.; Anzinger, A.; Demmel, M.; Linn, J.; Kettenmann, B.; Wiesmann, M. Olfactory detection thresholds and pleasantness of a food-related and a non-food odour in hunger and satiety. Rhinology 2009, 47, 160–165. [Google Scholar] [PubMed]
- Egecioglu, E.; Skibicka, K.P.; Hansson, C.; Alvarez-Crespo, M.; Friberg, P.A.; Jerlhag, E.; Engel, J.A.; Dickson, S.L. Hedonic and incentive signals for body weight control. Reviews in endocrine & metabolic disorders 2011, 12, 141–151. [Google Scholar]
- Power, M.L.; Schulkin, J. Anticipatory physiological regulation in feeding biology: cephalic phase responses. Appetite 2008, 50, 194–206. [Google Scholar] [CrossRef]
- Stroebele, N.; De Castro, J.M. Effect of ambience on food intake and food choice. Nutrition 2004, 20, 821–838. [Google Scholar] [CrossRef]
- Velluzzi, F.; Deledda, A.; Onida, M.; Loviselli, A.; Crnjar, R.; Sollai, G. Relationship between Olfactory Function and BMI in Normal Weight Healthy Subjects and Patients with Overweight or Obesity. Nutrients 2022, 14, 1262. [Google Scholar] [CrossRef]
- Keller, A.; Zhuang, H.; Chi, Q.; Vosshall, L.B.; Matsunami, H. Genetic variation in a human odorant receptor alters odour perception. Nature 2007, 449, 468–472. [Google Scholar] [CrossRef]
- Melis, M.; Mastinu, M.; Sollai, G. Effect of the rs2821557 Polymorphism of the Human Kv1.3 Gene on Olfactory Function and BMI in Different Age Groups. Nutrients 2024, 16, 821. [Google Scholar] [CrossRef]
- Melis, M.; Tomassini Barbarossa, I.; Crnjar, R.; Sollai, G. Olfactory Sensitivity Is Associated with Body Mass Index and Polymorphism in the Voltage-Gated Potassium Channels Kv1.3. Nutrients 2022, 14, 4986. [Google Scholar] [CrossRef]
- Melis, M.; Tomassini Barbarossa, I.; Hummel, T.; Crnjar, R.; Sollai, G. Effect of the rs2890498 polymorphism of the OBPIIa gene on the human ability to smell single molecules. Behavioural brain research 2021, 402, 113127. [Google Scholar] [CrossRef]
- Silva Teixeira, C.S.; Cerqueira, N.M.; Silva Ferreira, A.C. Unravelling the Olfactory Sense: From the Gene to Odor Perception. Chem Senses 2016, 41, 105–121. [Google Scholar] [CrossRef] [PubMed]
- Sollai, G.; Melis, M.; Magri, S.; Usai, P.; Hummel, T.; Tomassini Barbarossa, I.; Crnjar, R. Association between the rs2590498 polymorphism of Odorant Binding Protein (OBPIIa) gene and olfactory performance in healthy subjects. Behavioural brain research 2019, 372, 112030. [Google Scholar] [CrossRef] [PubMed]
- Sollai, G.; Melis, M.; Tomassini Barbarossa, I.; Crnjar, R. A polymorphism in the human gene encoding OBPIIa affects the perceived intensity of smelled odors. Behavioural brain research 2022, 427, 113860. [Google Scholar] [CrossRef] [PubMed]
- Calderón-Garcidueñas, L.; Franco-Lira, M.; Henríquez-Roldán, C.; Osnaya, N.; González-Maciel, A.; Reynoso-Robles, R.; Villarreal-Calderon, R.; Herritt, L.; Brooks, D.; Keefe, S.; et al. Urban air pollution: influences on olfactory function and pathology in exposed children and young adults. Experimental and toxicologic pathology : official journal of the Gesellschaft fur Toxikologische Pathologie 2010, 62, 91–102. [Google Scholar] [CrossRef]
- Sollai, G.; Crnjar, R. Age-Related Olfactory Decline Is Associated With Levels of Exercise and Non-exercise Physical Activities. Frontiers in aging neuroscience 2021, 13, 695115. [Google Scholar] [CrossRef]
- Sollai, G.; Crnjar, R. Association among Olfactory Function, Lifestyle and BMI in Female and Male Elderly Subjects: A Cross-Sectional Study. Nutrients 2023, 15. [Google Scholar] [CrossRef]
- Sorokowska, A.; Sorokowski, P.; Hummel, T. Cross-Cultural Administration of an Odor Discrimination Test. Chemosens Percept 2014, 7, 85–90. [Google Scholar] [CrossRef]
- Attems, J.; Walker, L.; Jellinger, K.A. Olfaction and Aging: A Mini-Review. Gerontology 2015, 61, 485–490. [Google Scholar] [CrossRef]
- Doty, R.L.; Shaman, P.; Applebaum, S.L.; Giberson, R.; Siksorski, L.; Rosenberg, L. Smell identification ability: changes with age. Science (New York, N.Y.) 1984, 226, 1441–1443. [Google Scholar] [CrossRef]
- Min, H.J.; Kim, S.M.; Han, D.H.; Kim, K.S. The sniffing bead system, an olfactory dysfunction screening tool for geriatric subjects: a cross-sectional study. BMC geriatrics 2021, 21, 54. [Google Scholar] [CrossRef]
- Öberg, C.; Larsson, M.; Bäckman, L. Differential sex effects in olfactory functioning: The role of verbal processing. Journal of the International Neuropsychological Society 2002, 8, 691–698. [Google Scholar] [CrossRef] [PubMed]
- Schubert, C.R.; Cruickshanks, K.J.; Nondahl, D.M.; Klein, B.E.; Klein, R.; Fischer, M.E. Association of exercise with lower long-term risk of olfactory impairment in older adults. JAMA otolaryngology-- head & neck surgery 2013, 139, 1061–1066. [Google Scholar]
- Sorokowska, A.; Schriever, V.A.; Gudziol, V.; Hummel, C.; Hähner, A.; Iannilli, E.; Sinding, C.; Aziz, M.; Seo, H.S.; Negoias, S.; et al. Changes of olfactory abilities in relation to age: odor identification in more than 1400 people aged 4 to 80 years. European Archives of Oto-Rhino-Laryngology 2015, 272, 1937–1944. [Google Scholar] [CrossRef] [PubMed]
- Sorokowski, P.; Karwowski, M.; Misiak, M.; Marczak, M.K.; Dziekan, M.; Hummel, T.; Sorokowska, A. Sex Differences in Human Olfaction: A Meta-Analysis. Frontiers in Psychology, 2019. [Google Scholar]
- Aydın, E.; Tekeli, H.; Karabacak, E.; Altunay İ, K.; Aydın, Ç.; Çerman, A.A.; Altundağ, A.; Salihoğlu, M.; Çayönü, M. Olfactory functions in patients with psoriasis vulgaris: correlations with the severity of the disease. Archives of dermatological research 2016, 308, 409–414. [Google Scholar] [CrossRef]
- Besser, G.; Erlacher, B.; Aydinkoc-Tuzcu, K.; Liu, D.T.; Pablik, E.; Niebauer, V.; Koenighofer, M.; Renner, B.; Mueller, C.A. Body-Mass-Index Associated Differences in Ortho- and Retronasal Olfactory Function and the Individual Significance of Olfaction in Health and Disease. Journal of clinical medicine 2020, 9. [Google Scholar] [CrossRef]
- Croy, I.; Symmank, A.; Schellong, J.; Hummel, C.; Gerber, J.; Joraschky, P.; Hummel, T. Olfaction as a marker for depression in humans. Journal of affective disorders 2014, 160, 80–86. [Google Scholar] [CrossRef]
- Graves, A.B.; Bowen, J.D.; Rajaram, L.; McCormick, W.C.; McCurry, S.M.; Schellenberg, G.D.; Larson, E.B. Impaired olfaction as a marker for cognitive decline: interaction with apolipoprotein E epsilon4 status. Neurology 1999, 53, 1480–1487. [Google Scholar] [CrossRef]
- Palouzier-Paulignan, B.; Lacroix, M.C.; Aimé, P.; Baly, C.; Caillol, M.; Congar, P.; Julliard, A.K.; Tucker, K.; Fadool, D.A. Olfaction under metabolic influences. Chem Senses 2012, 37, 769–797. [Google Scholar] [CrossRef]
- Pastor, A.; Fernández-Aranda, F.; Fitó, M.; Jiménez-Murcia, S.; Botella, C.; Fernández-Real, J.M.; Frühbeck, G.; Tinahones, F.J.; Fagundo, A.B.; Rodriguez, J.; et al. A Lower Olfactory Capacity Is Related to Higher Circulating Concentrations of Endocannabinoid 2-Arachidonoylglycerol and Higher Body Mass Index in Women. PloS one 2016, 11, e0148734. [Google Scholar] [CrossRef]
- Patel, Z.M.; DelGaudio, J.M.; Wise, S.K. Higher Body Mass Index Is Associated with Subjective Olfactory Dysfunction. Behavioural neurology 2015, 2015, 675635. [Google Scholar] [CrossRef]
- Perricone, C.; Shoenfeld, N.; Agmon-Levin, N.; de Carolis, C.; Perricone, R.; Shoenfeld, Y. Smell and autoimmunity: a comprehensive review. Clinical reviews in allergy & immunology 2013, 45, 87–96. [Google Scholar]
- Poessel, M.; Morys, F.; Breuer, N.; Villringer, A.; Hummel, T.; Horstmann, A. Brain response to food odors is not associated with body mass index and obesity-related metabolic health measures. Appetite 2021, 105774. [Google Scholar] [CrossRef] [PubMed]
- Ross, G.W.; Petrovitch, H.; Abbott, R.D.; Tanner, C.M.; Popper, J.; Masaki, K.; Launer, L.; White, L.R. Association of olfactory dysfunction with risk for future Parkinson's disease. Annals of neurology 2008, 63, 167–173. [Google Scholar] [CrossRef] [PubMed]
- Sollai, G.; Melis, M.; Mastinu, M.; Paduano, D.; Chicco, F.; Magri, S.; Usai, P.; Hummel, T.; Barbarossa, I.T.; Crnjar, R. Olfactory Function in Patients with Inflammatory Bowel Disease (IBD) Is Associated with Their Body Mass Index and Polymorphism in the Odor Binding-Protein (OBPIIa) Gene. Nutrients 2021, 13. [Google Scholar] [CrossRef]
- Steinbach, S.; Proft, F.; Schulze-Koops, H.; Hundt, W.; Heinrich, P.; Schulz, S.; Gruenke, M. Gustatory and olfactory function in rheumatoid arthritis. Scandinavian journal of rheumatology 2011, 40, 169–177. [Google Scholar] [CrossRef]
- Steinbach, S.; Reindl, W.; Dempfle, A.; Schuster, A.; Wolf, P.; Hundt, W.; Huber, W. Smell and taste in inflammatory bowel disease. PloS one 2013, 8, e73454. [Google Scholar] [CrossRef]
- Tekeli, H.; Senol, M.G.; Altundag, A.; Yalcınkaya, E.; Kendirli, M.T.; Yaşar, H.; Salihoglu, M.; Saglam, O.; Cayonu, M.; Cesmeci, E.; et al. Olfactory and gustatory dysfunction in Myasthenia gravis: A study in Turkish patients. Journal of the neurological sciences 2015, 356, 188–192. [Google Scholar] [CrossRef]
- Walliczek-Dworschak, U.; Wendler, J.; Khan, T.; Aringer, M.; Hähner, A.; Hummel, T. Chemosensory function is decreased in rheumatoid arthritis. Eur Arch Otorhinolaryngol 2020, 277, 1675–1680. [Google Scholar] [CrossRef]
- Wilson, R.S.; Arnold, S.E.; Schneider, J.A.; Boyle, P.A.; Buchman, A.S.; Bennett, D.A. Olfactory impairment in presymptomatic Alzheimer's disease. Annals of the New York Academy of Sciences 2009, 1170, 730–735. [Google Scholar] [CrossRef]
- Amoore, J.E. Specific anosmia: a clue to the olfactory code. Nature 1967, 214, 1095–1098. [Google Scholar] [CrossRef] [PubMed]
- Cain, W.S.; Gent, J.F. Olfactory sensitivity: reliability, generality, and association with aging. Journal of experimental psychology. Human perception and performance 1991, 17, 382–391. [Google Scholar] [CrossRef] [PubMed]
- Feldmesser, E.; Bercovich, D.; Avidan, N.; Halbertal, S.; Haim, L.; Gross-Isseroff, R.; Goshen, S.; Lancet, D. Mutations in olfactory signal transduction genes are not a major cause of human congenital general anosmia. Chem Senses 2007, 32, 21–30. [Google Scholar] [CrossRef] [PubMed]
- Jafek, B.W.; Gordon, A.S.; Moran, D.T.; Eller, P.M. Congenital anosmia. Ear, nose, & throat journal 1990, 69, 331–337. [Google Scholar]
- O'Connell, R.J.; Stevens, D.A.; Akers, R.P.; Coppola, D.M.; Grant, A.J. Individual differences in the quantitative and qualitative responses of human subjects to various odors. Chemical Senses 1989, 14, 293–302. [Google Scholar] [CrossRef]
- Seo, H.S.; Guarneros, M.; Hudson, R.; Distel, H.; Min, B.C.; Kang, J.K.; Croy, I.; Vodicka, J.; Hummel, T. Attitudes toward Olfaction: A Cross-regional Study. Chem Senses 2011, 36, 177–187. [Google Scholar] [CrossRef]
- Caruso, S.; Grillo, C.; Agnello, C.; Maiolino, L.; Intelisano, G.; Serra, A. A prospective study evidencing rhinomanometric and olfactometric outcomes in women taking oral contraceptives. Human Reproduction 2001, 16, 2288–2294. [Google Scholar] [CrossRef]
- Cornell Kärnekull, S.; Jönsson, F.U.; Willander, J.; Sikström, S.; Larsson, M. Long-Term Memory for Odors: Influences of Familiarity and Identification Across 64 Days. Chemical Senses 2015, 40, 259–267. [Google Scholar] [CrossRef]
- Good, P.R.; Geary, N.; Engen, T. The effect of estrogen on odor detection. Chemical Senses 1976, 2, 45–50. [Google Scholar] [CrossRef]
- Larsson, M.; Finkel, D.; Pedersen, N.L. Odor identification: influences of age, gender, cognition, and personality. The journals of gerontology. Series B, Psychological sciences and social sciences 2000, 55, P304–310. [Google Scholar] [CrossRef]
- Nováková, L.M.; Mrzílková, R.V. Temperamental influences on children’s olfactory performance: The role of self-regulation. Chemosensory Perception 2016, 9, 153–173. [Google Scholar] [CrossRef]
- Schaal, B.; Marlier, L.; Soussignan, R. Olfactory function in the human fetus: evidence from selective neonatal responsiveness to the odor of amniotic fluid. Behavioral neuroscience 1998, 112, 1438–1449. [Google Scholar] [CrossRef] [PubMed]
- Schneider, R.A.; Costiloe, J.P.; Howard, R.P.; Wolf, S. Olfactory perception thresholds in hypogonadal women: changes accompanying administration of androgen and estrogen. The Journal of Clinical Endocrinology & Metabolism 1958, 18, 379–390. [Google Scholar]
- Sollai, G.; Solari, P.; Crnjar, R. Qualitative and Quantitative Sex-Related Differences in the Perception of Single Molecules from Coffee Headspace. Foods 2024, 13, 3239. [Google Scholar] [CrossRef]
- Aydin, N.; Ramazanoglu, L.; Onen, M.R.; Yilmaz, I.; Aydin, M.D.; Altinkaynak, K.; Calik, M.; Kanat, A. Rationalization of the Irrational Neuropathologic Basis of Hypothyroidism-Olfaction Disorders Paradox: Experimental Study. World Neurosurgery 2017, 107, 400–408. [Google Scholar] [CrossRef]
- Chamberlin, K.W.; Yuan, Y.; Li, C.; Luo, Z.; Reeves, M.; Kucharska-Newton, A.; Pinto, J.M.; Ma, J.; Simonsick, E.M.; Chen, H. Olfactory Impairment and the Risk of Major Adverse Cardiovascular Outcomes in Older Adults. Journal of the American Heart Association 2024, 13, e033320. [Google Scholar] [CrossRef]
- Jacobson, P.T.; Vilarello, B.J.; Tervo, J.P.; Waring, N.A.; Gudis, D.A.; Goldberg, T.E.; Devanand, D.P.; Overdevest, J.B. Associations between olfactory dysfunction and cognition: a scoping review. Journal of neurology 2024. [Google Scholar] [CrossRef]
- Kouzuki, M.; Suzuki, T.; Nagano, M.; Nakamura, S.; Katsumata, Y.; Takamura, A.; Urakami, K. Comparison of olfactory and gustatory disorders in Alzheimer's disease. Neurological sciences : official journal of the Italian Neurological Society and of the Italian Society of Clinical Neurophysiology 2018, 39, 321–328. [Google Scholar] [CrossRef]
- Potter, M.R.; Chen, J.H.; Lobban, N.S.; Doty, R.L. Olfactory dysfunction from acute upper respiratory infections: relationship to season of onset. International forum of allergy & rhinology 2020, 10, 706–712. [Google Scholar]
- Sasaki, H.; Tamura, K.; Naito, Y.; Ogata, K.; Mogi, A.; Tanaka, T.; Ikari, Y.; Masaki, M.; Nakashima, Y.; Takamatsu, Y. Patient perceptions of symptoms and concerns during cancer chemotherapy: 'affects my family' is the most important. International journal of clinical oncology 2017, 22, 793–800. [Google Scholar] [CrossRef]
- Wang, W.; Li, Z.; Zhang, X.; Li, Y.; Kong, S.; Zou, B.; Wang, M.; Cheng, N.; Zhang, H.M.; Sun, J. Investigating factors influencing subjective taste and smell alterations in colorectal cancer patients. Supportive care in cancer : official journal of the Multinational Association of Supportive Care in Cancer 2025, 33, 205. [Google Scholar] [CrossRef]
- Hummel, T.; Sekinger, B.; Wolf, S.R.; Pauli, E.; Kobal, G. 'Sniffin' sticks': olfactory performance assessed by the combined testing of odor identification, odor discrimination and olfactory threshold. Chem Senses 1997, 22, 39–52. [Google Scholar] [CrossRef]
- Hummel, T.; Kobal, G.; Gudziol, H.; Mackay-Sim, A. Normative data for the "Sniffin' Sticks" including tests of odor identification, odor discrimination, and olfactory thresholds: an upgrade based on a group of more than 3,000 subjects. Eur Arch Otorhinolaryngol 2007, 264, 237–243. [Google Scholar] [CrossRef]
- Fischer, M.; Zopf, Y.; Elm, C.; Pechmann, G.; Hahn, E.G.; Schwab, D.; Kornhuber, J.; Thuerauf, N.J. Subjective and objective olfactory abnormalities in Crohn's disease. Chem Senses 2014, 39, 529–538. [Google Scholar] [CrossRef] [PubMed]
- Rizzolo, A.; Polesello, A.; Polesello, S. Use of headspace capillary GC to study the development of volatile compounds in fresh fruit. Journal of High Resolution Chromatography 1992, 15, 472–477. [Google Scholar] [CrossRef]
- van Den Dool, H.; Dec. Kratz, P. A generalization of the retention index system including linear temperature programmed gas—liquid partition chromatography. Journal of Chromatography A 1963, 11, 463–471. [Google Scholar] [CrossRef] [PubMed]
- Akiyama, M.; Murakami, K.; Ohtani, N.; Iwatsuki, K.; Sotoyama, K.; Wada, A.; Tokuno, K.; Iwabuchi, H.; Tanaka, K. Analysis of volatile compounds released during the grinding of roasted coffee beans using solid-phase microextraction. Journal of agricultural and food chemistry 2003, 51, 1961–1969. [Google Scholar] [CrossRef]
- Caporaso, N.; Whitworth, M.B.; Cui, C.; Fisk, I.D. Variability of single bean coffee volatile compounds of Arabica and robusta roasted coffees analysed by SPME-GC-MS. Food research international (Ottawa, Ont.) 2018, 108, 628–640. [Google Scholar] [CrossRef]
- Gloess, A.N.; Yeretzian, C.; Knochenmuss, R.; Groessl, M. On-line analysis of coffee roasting with ion mobility spectrometry–mass spectrometry (IMS–MS). International Journal of Mass Spectrometry 2018, 424, 49–57. [Google Scholar] [CrossRef]
- Lee, S.; Kim, M.; Lee, K.-G. Effect of reversed coffee grinding and roasting process on physicochemical properties including volatile compound profiles. Innovative Food Science & Emerging Technologies 2017, 44. [Google Scholar] [CrossRef]
- López-Galilea, I.; Fournier, N.; Cid, C.; Guichard, E. Changes in headspace volatile concentrations of coffee brews caused by the roasting process and the brewing procedure. Journal of agricultural and food chemistry 2006, 54, 8560–8566. [Google Scholar] [CrossRef] [PubMed]
- Majcher, M.A.; Klensporf-Pawlik, D.; Dziadas, M.; Jeleń, H.H. Identification of aroma active compounds of cereal coffee brew and its roasted ingredients. Journal of agricultural and food chemistry 2013, 61, 2648–2654. [Google Scholar] [CrossRef] [PubMed]
- Sunarharum, W.B.; Williams, D.J.; Smyth, H.E. Complexity of coffee flavor: A compositional and sensory perspective. Food Research International 2014, 62, 315–325. [Google Scholar] [CrossRef]
- Yang, N.; Liu, C.; Liu, X.; Degn, T.K.; Munchow, M.; Fisk, I. Determination of volatile marker compounds of common coffee roast defects. Food Chemistry 2016, 211, 206–214. [Google Scholar] [CrossRef]
- Zapata, J.; Londoño, V.; Naranjo, M.; Osorio, J.; Lopez, C.; Quintero, M. Characterization of aroma compounds present in an industrial recovery concentrate of coffee flavour. CyTA - Journal of Food 2018, 16, 367–372. [Google Scholar] [CrossRef]
- van Ruth, S.M. Methods for gas chromatography-olfactometry: a review. Biomolecular engineering 2001, 17, 121–128. [Google Scholar] [CrossRef]
- Gonzalez-Kristeller, D.C.; do Nascimento, J.B.; Galante, P.A.; Malnic, B. Identification of agonists for a group of human odorant receptors. Frontiers in pharmacology 2015, 6, 35. [Google Scholar] [CrossRef]
- d'Acampora Zellner, B.; Dugo, P.; Dugo, G.; Mondello, L. Gas chromatography-olfactometry in food flavour analysis. J Chromatogr A 2008, 1186, 123–143. [Google Scholar] [CrossRef]
- Dussort, P.; Depretre, N.; Bou-Maroun, E.; Fant, C.; GUICHARD, E.; Brunerie, P.; Le Fur, Y., Y.; Le Quéré, J.-L. An original approach for gas chromatography-olfactometry detection frequency analysis: Application to gin. Food Research International 2012, 49, 253–262. [Google Scholar] [CrossRef]
- Plutowska, B.; Wardencki, W. Application of gas chromatography–olfactometry (GC–O) in analysis and quality assessment of alcoholic beverages – A review. Food Chemistry 2008, 107, 449–463. [Google Scholar] [CrossRef]
- Pollien, P.; Ott, A.; Montigon, F.; Baumgartner, M.; Muñoz-Box, R.; Chaintreau, A. Hyphenated Headspace-Gas Chromatography-Sniffing Technique: Screening of Impact Odorants and Quantitative Aromagram Comparisons. Journal of agricultural and food chemistry 1997, 45, 2630–2637. [Google Scholar] [CrossRef]

| N. | Odor-active molecule | Odor description |
Df (M-F) |
| 1 2 3 4 5 6 7 8 9 10 11 12 13 14 15 16 17 18 19 20 21 22 23 24 25 26 27 28 29 30 31 32 33 34 35 36 37 38 39 40 41 42 43 44 45 46 47 48 |
Octane, 3,5-dimethyl- Oxalic acid, isobutyl nonyl ester Toluene β-Pinene p-Xylene Oxalic acid, isobutyl pentyl ester Pyridine* D-Limonene* Furan,2-pentyl-* Pyrazine, methyl-* Acetoin 2-Propanone, 1-hydroxy- Pyrazine, 2,5-dimethyl-* Pyrazine, ethyl-* Pyrazine, 2,3-dimethyl-* DL-2,3-Butanediol* Vinyl butyrate Hex-4-yn-3-one, 2,2-dimethyl- Pyrazine, 2-ethyl-6-methyl-* Pyrazine, 2-ethyl-3-methyl-* Pyrazine, 2-(n-propyl)-* Pyrazine, 2,6-diethyl-* Pyrazine, 3-ethyl-2,5-dimethyl-* 2-Propanone, 1-(acetyloxy)- Pyrazine, 2-ethyl-3,5-dimethyl-* Furfural* Pyrazine, tetramethyl- Pyrazine, 3,5-diethyl-2-methyl-* Pyrazine, 2-ethenyl-5-methyl- Furan, 2-acetyl-* 2,3-Pentanedione* 2-Furanmethanol, acetate* Pyrazine, 2-methyl-6-(2-propenyl)- 2-Cyclopenten-1-one, 2,3-dimethyl- Acetic acid, diethyl-* Pentanoic acid, 4-oxo-, methyl ester 2-Furancarboxaldehyde, 5-methyl-* 2-Furanmethanol, propanoate* Furan, 2,2'-methylenebis-* 2-Furanmethanol* Butanoic acid, 3-methyl-* Furan, 2-(2-furanylmethyl)-5-methyl-* Pyrazine, 2-acetyl-6-methyl 4(H)-Pyridine, N-acetyl-* Octaethylene glycol monododecyl ether 2-Hexadecanol N-Furfurylpyrrole* 2-Acetylpyrrole* |
Woody, burnt, unknown Burnt, unknown Coffee, smoked, solvent, roasted, fruit Sweet, floral, vanilla, herbs, incense, sulfur, pungent Vanilla, medicinal, floral, gas, pungent, plastic Floral, fruity, vanilla, sweet Coffee, smoked, roasted, cheese, plastic, woody Sweet, sour, citrus, caramellic Smoked, sweet, solvent, plastic, cocoa, herbs Coffee, nutty, roasted, smoke, floral, caramellic, alcohol Coffee, sweet, roasted, parfum, fruit, woody, caramellic Sweet, pungent, fish, solvent, wet, medicinal, feet, burnt Coffee, citrus, medicinal, sweet, cocoa, burnt, shoes Coffee, nutty, egg, sweet, vinegar, pungent, shoes Coffee, burnt, caramellic, fruity, citrus Sweet, caramellic, rose, wet, smoke Floral, parfum, bitter, solvent, pungent, fresh, plastic Sweet, solvent, acidic, pungent Coffee, sweet, smoked, medicinal, solvent, parfum, roasted, ammonia, balsamic, fruit Coffee, cocoa, solvent, bitter, nutty, roasted, burnt, musty, medicinal, solvent, herbs Green, musty, woody, earthy, wet, herbs, floral, fruit Coffee, roasted, earthy, musty, burnt, mushrooms, vegetable, tobacco Coffee, nutty, roasted, floral, bitter, woody, solvent, wet Pungent, parfum, musty, saltiness Coffee, musty, roasted, wet, cocoa, herbs Coffee, sweet, solvent, floral, pungent, cocoa, wet Coffee, roasted, burnt, vanilla, parfum, solvent. bitter Floral, musty, wet, solvent, fresh Coffee, nutty, bitter, plastic, musty, earthy, wet Coffee, parfum Floral, herbs, earthy, sweat, musk, cheese, pungent, citrus, musty, burnt, stinky feet, legumes, woody Coffee, roasted, fruit, earthy, herbs, woody, bitter, fish Pungent, sour, bitter, wet grass, plastic, herbs, spicy Coffee, sweet, floral, lavender Coffee, roasted, solvent, rotten, musty, herbs, wet earth Sweet, cocoa, herbs, nutty Coffee, sweet, parfum, fruity, solvent Coffee, pungent, floral, musty, herb, sweet, burnt, rubber Coffee, nutty, popcorn, roasted, fish, sour, biscuit, smoke Coffee, smoke, popcorn, nutty, roasted, cheese, sweet Cheese, smoke, stinky feet, acidic, fruity, putrid Roasted, biscuit, saltiness, nutty, plastic Putrid, musty, cheese, medicinal Shoes, wet, sweat, pungent, legumes, plastic, cheese Sweat, acidic Cheese, musty, putrid, plastic, chicken, shoes, burnt Coffee, solvent, cheese, musty, smoke, feet, caramellic Coffee, roasted, almond, sweet, burnt, parfum, fresh, cocoa |
3-3 1-2 9-21 8-10 7-8 3-5 3-18 10-2 10-6 7-7 15-18 25-13 13-15 4-5 5-4 4-4 5-9 3-4 31-29 31-33 28-19 32-32 24-24 3-6 22-22 11-25 17-14 29-16 11-22 2-3 31-33 16-29 3-11 2-3 18-26 4-5 4-7 15-29 22-40 14-24 25-20 4-5 6-15 10-9 2-2 31-28 29-27 16-26 |
| Molecule |
Perception ability |
M n |
F n |
p-Value |
| Toluene | Yes | 9 | 21 | 0.008 |
| No | 33 | 22 | ||
| Pyridine | Yes No |
3 39 |
18 25 |
< 0.001 |
| D-limonene | Yes No |
10 32 |
2 41 |
0.011 |
| 2-Propanone, 1-hydroxy- | Yes No |
25 17 |
13 30 |
0.007 |
| Pyrazine, 2-(n-propyl)- | Yes No |
28 14 |
19 24 |
0.037 |
| Furfural | Yes No |
11 31 |
25 18 |
0.003 |
| Pyrazine, 3,5-diethyl-2-methyl- | Yes No |
29 13 |
16 27 |
0.003 |
| Pyrazyne, 2-ethenyl-5-methyl- | Yes No |
11 31 |
22 21 |
0.018 |
| 2-Furanmethanol, acetate | Yes No |
16 26 |
29 14 |
0.007 |
| Pyrazine, 2-methyl-6-(2-propenyl)- | Yes No |
3 39 |
11 32 |
0.022 |
| 2-Furanmethanol, propanoate | Yes No |
15 27 |
29 14 |
0.003 |
| Furan, 2,2-methylenebis- | Yes No |
22 20 |
40 3 |
<0.001 |
| 2-Furanmethanol | Yes No |
14 28 |
24 19 |
0.037 |
| Pyrazine, 2-acetyl-6-methyl | Yes No |
6 36 |
15 28 |
0.028 |
| 2-Acetylpyrrole | Yes No |
16 26 |
26 17 |
0.039 |
Disclaimer/Publisher’s Note: The statements, opinions and data contained in all publications are solely those of the individual author(s) and contributor(s) and not of MDPI and/or the editor(s). MDPI and/or the editor(s) disclaim responsibility for any injury to people or property resulting from any ideas, methods, instructions or products referred to in the content. |
© 2025 by the authors. Licensee MDPI, Basel, Switzerland. This article is an open access article distributed under the terms and conditions of the Creative Commons Attribution (CC BY) license (http://creativecommons.org/licenses/by/4.0/).


