
Submitted:
10 July 2025
Posted:
11 July 2025
You are already at the latest version
Abstract
In humans, food choice, nutrient intake and meal size are strongly influenced by their sense of smell. Recent studies have shown that humans can perceive the odor of free fatty acids (FFAs), which provide information about the nutritional content of foods. Other studies suggest that the odor perceived is that of secondary oxidation products. The aim of this research was to study the orthonasal perception of palmitic (PA), oleic (OA) and linoleic (LA) fatty acids (FAs) as they elute from the chromatographic column, to correlate the perceived intensity to the olfactory threshold for FAs, and to explore differences related to sex and the general olfactory function of individuals. The ability to perceive the odor of FAs was assessed in 70 healthy subjects, previously classified as normosmic or hyposmic. The number of participants who smelled PA was significantly lower than that of OA and LA. Normosmic participants and females reported perceiving the FA odor with a higher intensity than hyposmic ones and males, respectively. The perception intensity of FA odor reported by participants showed a decreasing order: LA=OA>PA for males, normosmic and hyposmic individuals and LA>OA>PA for females. The olfactory threshold for FA odor reported by the participants was in decreasing order: PA>OA=LA for males, normosmic and hyposmic individuals and PA>OA>LA for females. The results confirm the human ability, with females and normosmic individuals performing better than males and hyposmic ones respectively, to perceive the FA odor and show that the intensity of perception increases with decreasing FA lipophilicity; consequently, the olfactory threshold also decreases.
Keywords:
palmitic acid
; oleic acid
; linoleic acid
; gas chromatography-olfactometry (GC-O) technique
; olfactory function
; Sniffin’ Sticks
; females and males
; smell
; orthonasal pathway
1. Introduction
Fatty acids are common in foods and occur mainly in the ester form of a triglyceride, also known as a triacylglyceride; the 3 fatty acids of a triglyceride, attached to a glycerol molecule, can all be the same or 2 or 3 different fatty acids [1,2]. In addition to triglycerides, various foods also contain low concentrations of free fatty acids [2,3]. Fatty acids of dietary interest such as linoleic, oleic and palmitic acids are specifically described as long-chain, 18-carbon carboxylic acids, either unsaturated (linoleic and oleic) or saturated (palmitic). Fatty acids perform various functions within biological systems, contributing in energetic terms (reserve of calories available and mobilizable when needed from adipose tissue), structural (formation of myelin, composition of the plasma membrane) and functional (synthesis and secretion of adipokines, thermogenesis, synthesis of sexual hormones, adrenal hormones, vitamin D and bile acids). Besides, polyunsaturated fats act as precursors of biologically active molecules involved in the regulation of inflammatory processes, blood pressure, platelet aggregation, coagulation and renal function [4,5,6,7,8,9,10]. Dietary fats also contribute to the absorption of fat-soluble vitamins and carotenoids [11]. Excessive consumption of fats, particularly widespread in the Western world, represents a health risk: although they are not directly responsible, fats contribute to the onset of overweight, obesity, diabetes, cardiovascular diseases and tumors [12,13,14,15,16,17,18].
Olfaction plays a significant role in food selection and meal size determination, leading to long-term implications, influencing body weight, energy balance, maintenance and promotion of human well-being, contributing to both nutritional aspects and social relationships [19,20,21,22,23]. Most people who experience olfactory disorders report that food is less tasty and less pleasant and that these conditions change their eating and cooking habits [24,25]. People with a low sense of smell (hyposmia) tend to prefer highly palatable, salty and spicy foods, rich in simple sugars or fats, over fruits, vegetables and acidic and bitter foods [25,26,27,28,29]. These foods, often highly processed and high in calories, contribute significantly to the palatability of foods and influence the reward system in the brain [30,31,32]. A diet based on the abundant consumption of high-calorie-density foods, especially when associated with a sedentary lifestyle, is one of the main causes of obesity [33], defined as an epidemic in 1997 by the WHO, and of metabolic diseases [34]. In particular, highly processed foods, especially those with added sugar, play a key role in the development of non-communicable diseases [35]. Furthermore, the possible presence of olfactory dysfunction can lead to this caloric food and weight gain and, therefore, a high-fat diet can worsen the olfactory deficit due to the pro-inflammatory state it causes [36,37,38,39].
Despite the importance of fats and fatty acids in human nutrition and food choices, the ability to perceive their odor remains a topic of debate [40]. Some studies suggest that humans, through their sense of smell, can both detect the fat (and therefore caloric) content of foods and distinguish between different long-chain fatty acids in the gaseous phase [2,30]. Other studies, on the contrary, suggest that the perceived odor of fatty acids is actually that of their oxidation products, and that their perception and discrimination within foods may occur mainly via the retronasal route [2,30,41,42,43].
Although it is commonly accepted that females have better olfactory performance than males, some studies report that there are no sex-related differences in the olfactory function of individuals, leaving the topic still a matter of debate [44,45,46,47]. Elements considered to be potentially responsible for the generation of sex-related differences in olfactory abilities include: neuroendocrine fac-tors (e.g., fluctuations associated with the menstrual cycle or estrogen levels) [48,49], social factors [50,51] (females appear to be more interested in olfactory stimuli and are more familiar with odors), cognitive factors (females perform better than males in episodic olfactory memory) [52,53] and genetic factors (the expression and functionality of Kv1.3 channels influence the olfactory function of both sexes, making females better performers) [54,55].
Based on these considerations, the main aim of this study was to evaluate the ability of individuals to perceive the odor of palmitic (saturated), oleic (mono-unsaturated) and linoleic (poly-unsaturated) fatty acids, as they were eluted from the chromatographic column, to establish the olfactory threshold for the same fatty acids and to correlate this threshold to the intensity with which the fatty acids were perceived during the gas chromatography-olfactometry experiments. The second aim of this research was to investigate the presence of differences in the threshold and intensity of perception of fatty acids in relation to sex (males vs. females) and olfactory function (normosmia vs. hyposmia) of the individuals.
2. Materials and Methods
2.1. Subjects
The search for volunteers who wanted to join the study panel was carried out through public announcements at the University of Cagliari: 70 healthy subjects (38 females and 32 males; age 27.1 ± 1.1 years; BMI 18.5-24.99 Kg/m2), non-smokers and with a COVID-19 infection occurred at least 12 months before, were selected. During the recruitment phase, it was necessary to explain to the candidates the aim of the study, the required duration and the experimental procedure. The volunteers were selected on the basis on information collected through questionnaires or interviews to ensure that none of them had evident olfactory dysfunctions, did not suffer from a cold or any other disorder that could interfere with their perceptive abilities. For all participants, exclusion criteria were the presence of metabolic, inflammatory/autoimmune, neurodegenerative, cognitive, tumoral, respiratory and cardiovascular diseases [37,56,57,58,59,60,61,62,63,64,65,66,67].
All volunteers were strictly prohibited from eating, drinking (except water), chewing gum and/or smoking for 2 hours before the experiment. Each volunteer had to come to the laboratory at least 15 minutes before the start of the measurements to read the experimental protocol approved by the local ethics committee (Prot. PG/2021/14278, 09.22.2021) and sign the informed consent).
2.2. Evaluation of Olfactory Sensitivity
The orthonasal olfactory function of each subject was assessed by means of the “Sniffin’ Sticks Extended Test” (SSET); (Burghart Instruments, Wedel, Germany), widely used for olfactory screening and internationally recognized for its validity also in the health field [68]. The SSET is based on sniffing pens containing a felt soaked in an odor and includes three subtests: Threshold (Thre-test), Discrimination (Dis-test) and Identification (Id-test) test. The olfactory threshold (score 0-16) is assigned using a scale of increasing concentrations of the same odor, with a forced choice mechanism. The experimenter has 16 triplets of pens available (16 increasing concentrations). Each triplet consists of two pens containing a solvent, while the third (target pen, which must be identified by the participant) is filled with the test odor (n-butanol). The starting triplet (first reversal) is represented by the one in which the participant identifies the target pen for the first time twice in a row. Subsequently, the triplet goes down until the participant makes a mistake, at which point it goes up again (second reversal) and so on for seven reversals: the olfactory threshold is defined as the average of the dilution steps of the last 4 reversals. Olfactory discrimination (score 0-16) is assigned using 16 triplets of pens: each consists of two pens containing the same odor and a third filled with a different odor (target pen, which must be identified by the participant). During the identification test (score 0-16), consisting of 16 pens containing everyday odors familiar to the participants, they must choose between four possibilities that are presented to him. During the test, the experimenter fills out a protocol in which the scores obtained for each sub-test are reported. The sum of the scores obtained with Thre-test, Dis-test and Id-test allows to obtain the total TDI, through which the subjects are classified for their olfactory performance as normosmic or hyposmic [69].
2.3. Mass Spectrometry-Gas Chromatography-Olfactometry (MS-GC-O) Technique
The experiments were conducted using a gas chromatograph (Agilent 6890N; Santa Clara, CA, USA) simultaneously coupled to an olfactometer (Gerstel ODP3; Mülheim an der Ruhr, Germany) and a mass spectrometer (Agilent model 5973; Santa Clara, CA, USA) [70,71]. The carrier gas was ultrapure helium at a constant flow rate of 1.2 mL/min. 1 µL of a fatty acid mixture composed of 20 mg/mL of palmitic acid (PA), oleic acid (OA) and linoleic acid (LA) was injected into the GC: at the outlet of the GC column, the flow was split in a 1:1 ratio between the olfactometer and the mass spectrometer. The volatile compounds were compared with the mass spectrum present in the NIST2014 library (US National Institute of Standards and Technology; Gaithersburg, MD, USA), in order to confirm their purity and the absence of oxidation products.
The chromatographic column used is an HP-INNOWax (30 m x 0.25 mm x 0.50 µm) (Agilent 19091N-233; Agilent technologies, USA). The injector temperature is 250 °C, while the MS interface temperature is 260 °C. The oven temperature is set as follows: 40 °C (0.2 min), 40°C/min up to 100°C (2 min), 10°C/min up to 200°C (2 min), 10°C/min up to 250°C (39 min). The total analysis time is 58 minutes.
During the GC-O experiments, each time an odor was perceived, the participant had to provide information on the perceived intensity, the quality of the odor (if able to provide it), the duration and evoked hedonic value [72,73,74], having at his disposal a voice recording system and a keypad digitally connected to the PC (GERSTEL ODP recorder 3 for Windows 7). The keypad has 4 buttons that represent an intensity scale. Based on the button pressed, a rating of the perceived odor intensity is recorded: 1 = weak, 2 = distinct, 3 = intense, 4 = very in-tense. While the button was pressed, the participant could speak into a microphone and give a subjective evaluation of the perceived odor. The PC automatically recorded the retention time and the subjective rating of the perceived odor. In this way, an aromagram (participant’s evaluation) was obtained that was perfectly aligned with the chromatogram (Figure 1). The samples were presented blindly to avoid the participant being influenced during the experiment.
2.4. Determination of the Olfactory Threshold to Fatty Acids
For each of the fatty acids, the following 7 solutions were prepared: palmitic acid (PA) 0.75, 1.5, 3, 4.5, 6, 9 and 12 mM; oleic acid (OA) 6, 12, 24, 48, 95, 190, 380 mM; linoleic acid (LA) 0.75, 1.5, 3, 6, 12, 24, 48 mM. To neutralize the differences in concentration due to different solubility, the 7 concentrations were marked as dilution steps with a decreasing number from 1 (for the highest concentration) to 7 (for the lowest concentration), like the Sniffin’ Sticks Thre-test. A known amount of fatty acid (20 µL) was dispensed onto a strip of absorbent paper (1 x 6 cm), just before starting the experiment. The fatty acid threshold test was performed following the same protocol as the standardized Thre-test of the Sniffin’ Sticks test. The experimenter had 7 triplets of blotting paper strips, each consisting of one paper containing the fatty acid solution and two papers filled with an equal amount of liquid paraffin oil. The participant's goal was to identify the paper containing the fatty acid (target paper). The test started at the lowest concentration and increased until the participant identifies the target paper twice in a row. This was the starting point and represented the first reversal. The test then goes down by a triplet until the participant makes an error, at which point it goes up again (second reversal) and so on for seven reversals: the olfactory threshold is defined as the average of the dilution steps of the last 4 reversals. Each triplet was presented at an interval of approximately 20 seconds. The score assigned to each participant was between 1 and 7.
2.5. Statistical Analysis
Fisher’s method was used to evaluate differences in the distribution of subjects based on their ability to perceive or not to perceive the odors of fatty acids during elution from the chromatographic column, also separately between females and males.
One-way MANOVA was used to analyze the effect of TDI status and sex on the in-tensity with which individuals perceived the odors of fatty acids (during elution from the gas chromatographic column) and on the olfactory threshold.
Repeated measures ANOVA was used to verify the presence of differences in the in-tensity with which individuals perceived the odors of fatty acids (during elution from the gas chromatographic column) and in the olfactory threshold, based on TDI olfactory status and sex.
Post-hoc analyses were performed with Fisher’s LSD test; p values <0.05 were considered significant. Statistical analysis was performed using STATISTICA for WINDOWS (version 7.0; StatSoft Inc, Tulsa, OK, USA).
Pearson's correlation test was used to evaluate the relationship between the intensity with which each participant, also separately for females and males, perceived the odor of fatty acids (while they were eluted from the gas chromatographic column) and their olfactory threshold for each AG. Statistical analyses were performed using GraphPad Prism 6 software (GraphPad Software, San Diego, CA, USA); p < 0.05 values were considered significant.
3. Results
The distribution of subjects according to their ability to perceive or not the odor of palmitic, oleic and linoleic fatty acids as eluted from the chromatographic column, is shown in Table 1.
Table 2 shows the distribution of females and males who perceived or not the odor of palmitic, oleic and linoleic fatty acids, as they were eluted from the chromatographic column. The results indicate that there is a different ability to perceive palmitic acid (saturated) and oleic and linoleic fatty acids (unsaturated) in the case of females (χ2 = 12.88, p = 0.0016; Fisher method), but not in the case of males (χ2 = 2.67, p = 0.26; Fisher method).
The mean values ± SE of the intensity with which the odors of palmitic (PA), oleic (OA) and linoleic (LA) acids were perceived by each individual during the GC-O experiments are shown in Figure 2. Repeated measures ANOVA revealed the presence of a significant increasing order in the perceived intensity (F 2,138 = 46.264; p < 0.0001). In particular, post-hoc analyses showed that PA was perceived with the lowest intensity, followed by OA with the intermediate intensity and finally LA with the highest intensity (PA-OA: p < 0.0001; OA-LA: p < 0.021; Fisher's LSD test).
Repeated measures ANOVA showed that, both among normosmic and hyposmic individuals for their TDI olfactory status, there is an increasing order of perceived intensity for the three fatty acids (FA) considered (F 2,136 = 0.60; p = 0.55; Figure 3). For both olfactory conditions, subsequent post-hoc tests showed the following order of intensity: palmitic < oleic = linoleic (Normosmia: PA-OA p < 0.0005, PA-LA p < 0.0001, OA-LA p = 0.27; Hyposmia: PA-OA p < 0.0005, PA-LA p < 0.0001, OA-LA p = 0.27; Fisher’s LSD test). Furthermore, one-way MANOVA revealed a significant effect of TDI olfactory status on perceived intensity (F 3,66 = 2.95; p = 0.039). Normosmic individuals perceived the odors of OA (p = 0.008; Fisher's LSD test) and LA (p = 0.013; Fisher's LSD test) with a higher intensity than hyposmic individuals, while no difference in relation to TDI olfactory status was found for the odor of PA (p = 0.085; Fisher's LSD test).
Repeated measures ANOVA showed that there is an increasing order of perceived intensity for the three fatty acids considered even when individuals are considered separately as females and males (F 2,136 = 5.15; p = 0.007; Figure 4). In particular, subsequent post-hoc tests showed the following increasing order of perceived intensity: PA < OA < LA and PA < OA = LA, for females and males, respectively (Females: PA-OA p < 0.0001, OA-LA p = 0.003; Males: PA-OA p < 0.0001, PA-LA p < 0.0001, OA-LA p = 0.79; Fisher’s LSD test). Furthermore, one-way MANOVA revealed a significant effect of sex on perceived intensity (F 3,66 = 3.31; p = 0.026). Besides, females showed a greater perception for the odor of LA (p = 0.029; Fisher's LSD test), while no sex-related difference was found for the odors of PA and OA (p > 0.05; Fisher's LSD test).
The mean values ± SE of the olfactory threshold presented by each individual for the odors of palmitic, oleic and linoleic acids are shown in figure 5. Repeated measures ANOVA revealed the presence of a significant decreasing order of threshold (F 2,138 = 49.152; p < 0.0001). In particular, post-hoc analyses showed that PA presents a higher threshold than OA and LA odors, according to the following order: PA > OA = LA (PA-OA: p < 0.0001; OA-LA: p > 0.05; Fisher's LSD test).
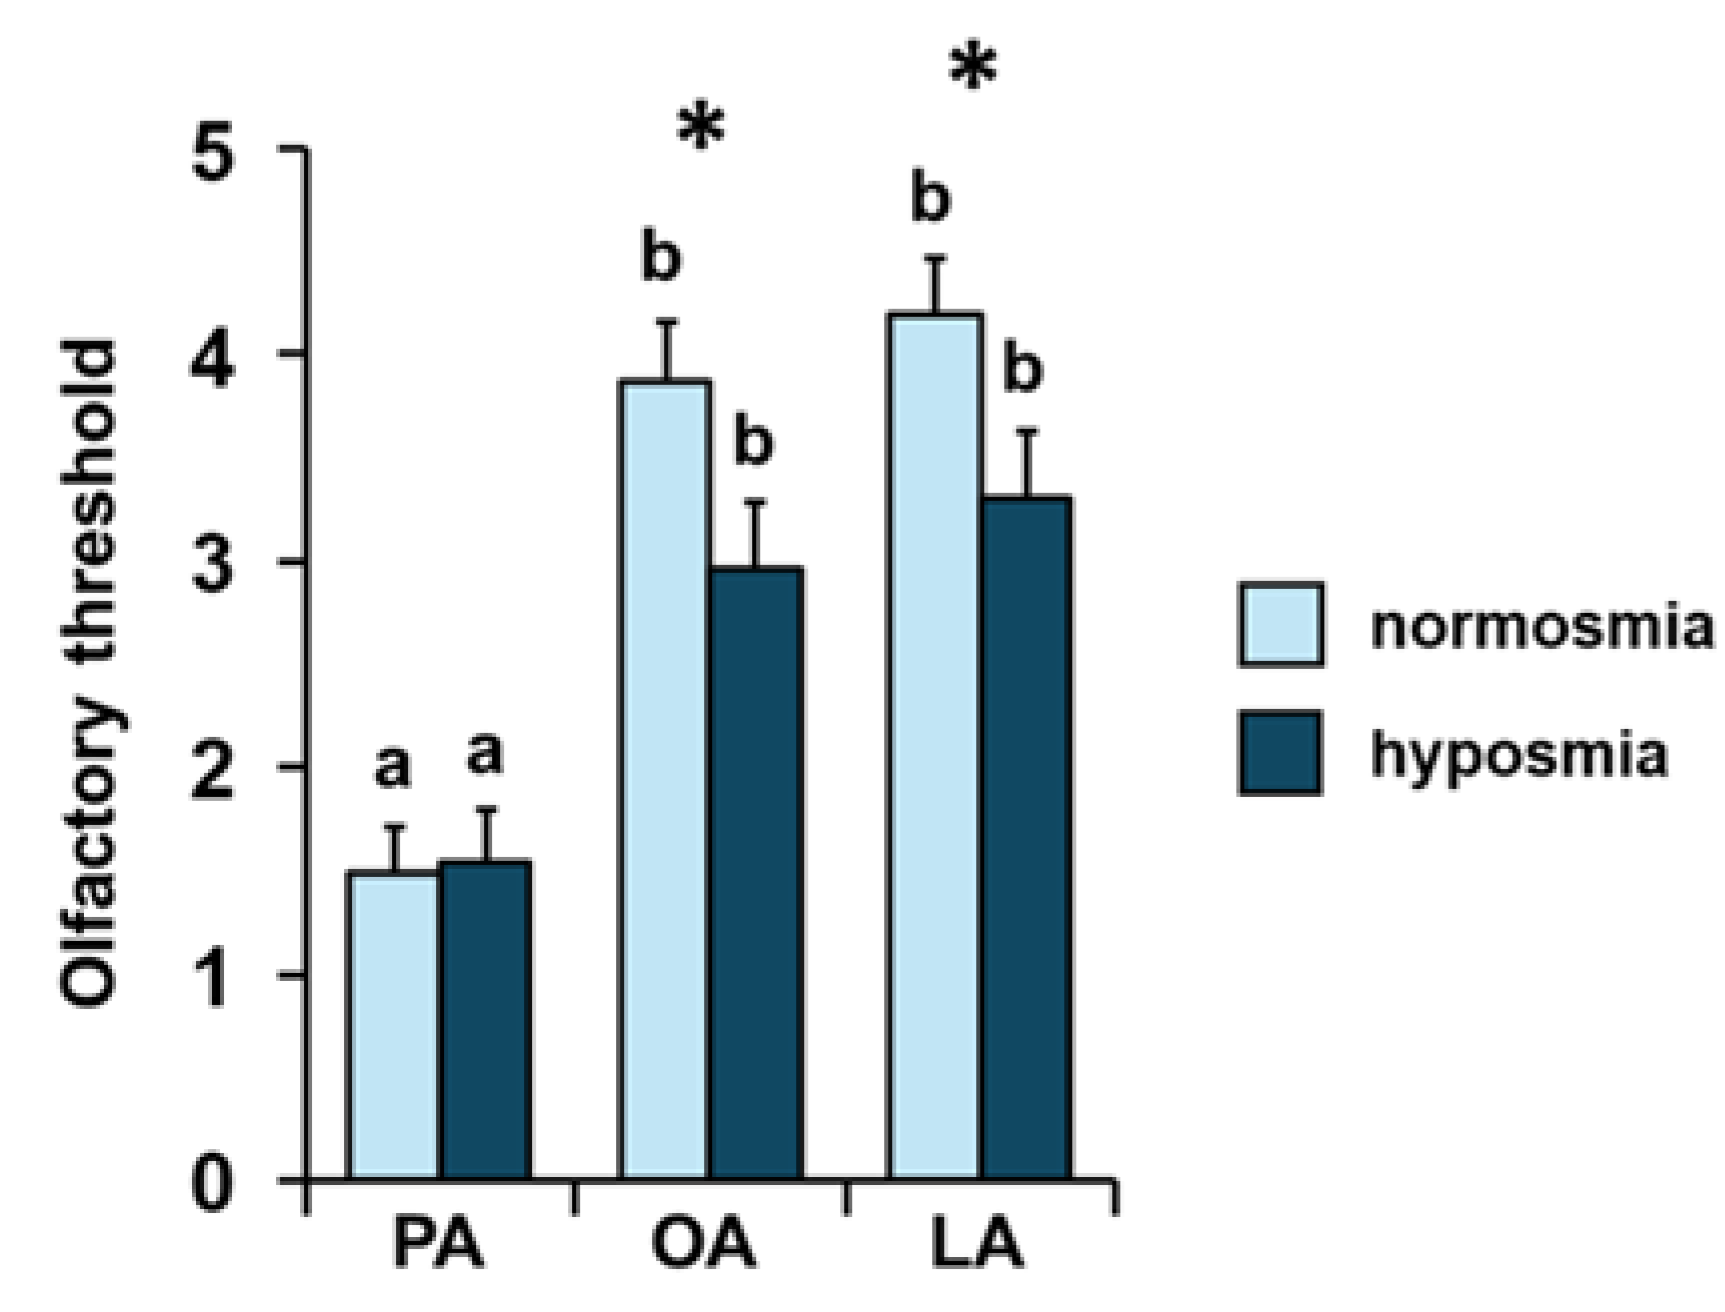
The mean values ± SE of the olfactory threshold score for the odors of PA, OA and LA obtained by the individuals according to their TDI olfactory status, are shown in figure 6. Post-hoc analyses subsequent to one-way MANOVA (F 3,66 = 2.08; p = 0.11) showed that normosmic individuals presented a lower olfactory threshold than hyposmic ones for the odors of OA (p < 0.05; Fisher's LSD test) and LA (p < 0.05; Fisher's LSD test), while no difference was found for PA between normosmic and hyposmic individuals (p > 0.05; Fisher's LSD test). Furthermore, post-hoc tests following repeated measures ANOVA (F 2,136 = 2.42; p = 0.093) showed, for both normosmic and hyposmic individuals, the following decreasing order of olfactory threshold: PA > OA = LA (p < 0.0005; Fisher’s LSD test).
Figure 6.
Effect of the TDI olfactory status on the olfactory threshold of fatty acids. Mean value ± SE of the olfactory threshold of individuals for the odor of palmitic (PA), oleic (OA) and linoleic (LA) acids, according to their TDI status. * indicates significant differences between individuals with normosmia or hyposmia for the same FA (p < 0.05; Fisher’s LSD test following one-way MANOVA). Different letters indicate significant differences in the olfactory threshold for the different FAs, within the same olfactory status (p < 0.001; Fisher’s LSD test following repeated-measures ANOVA).
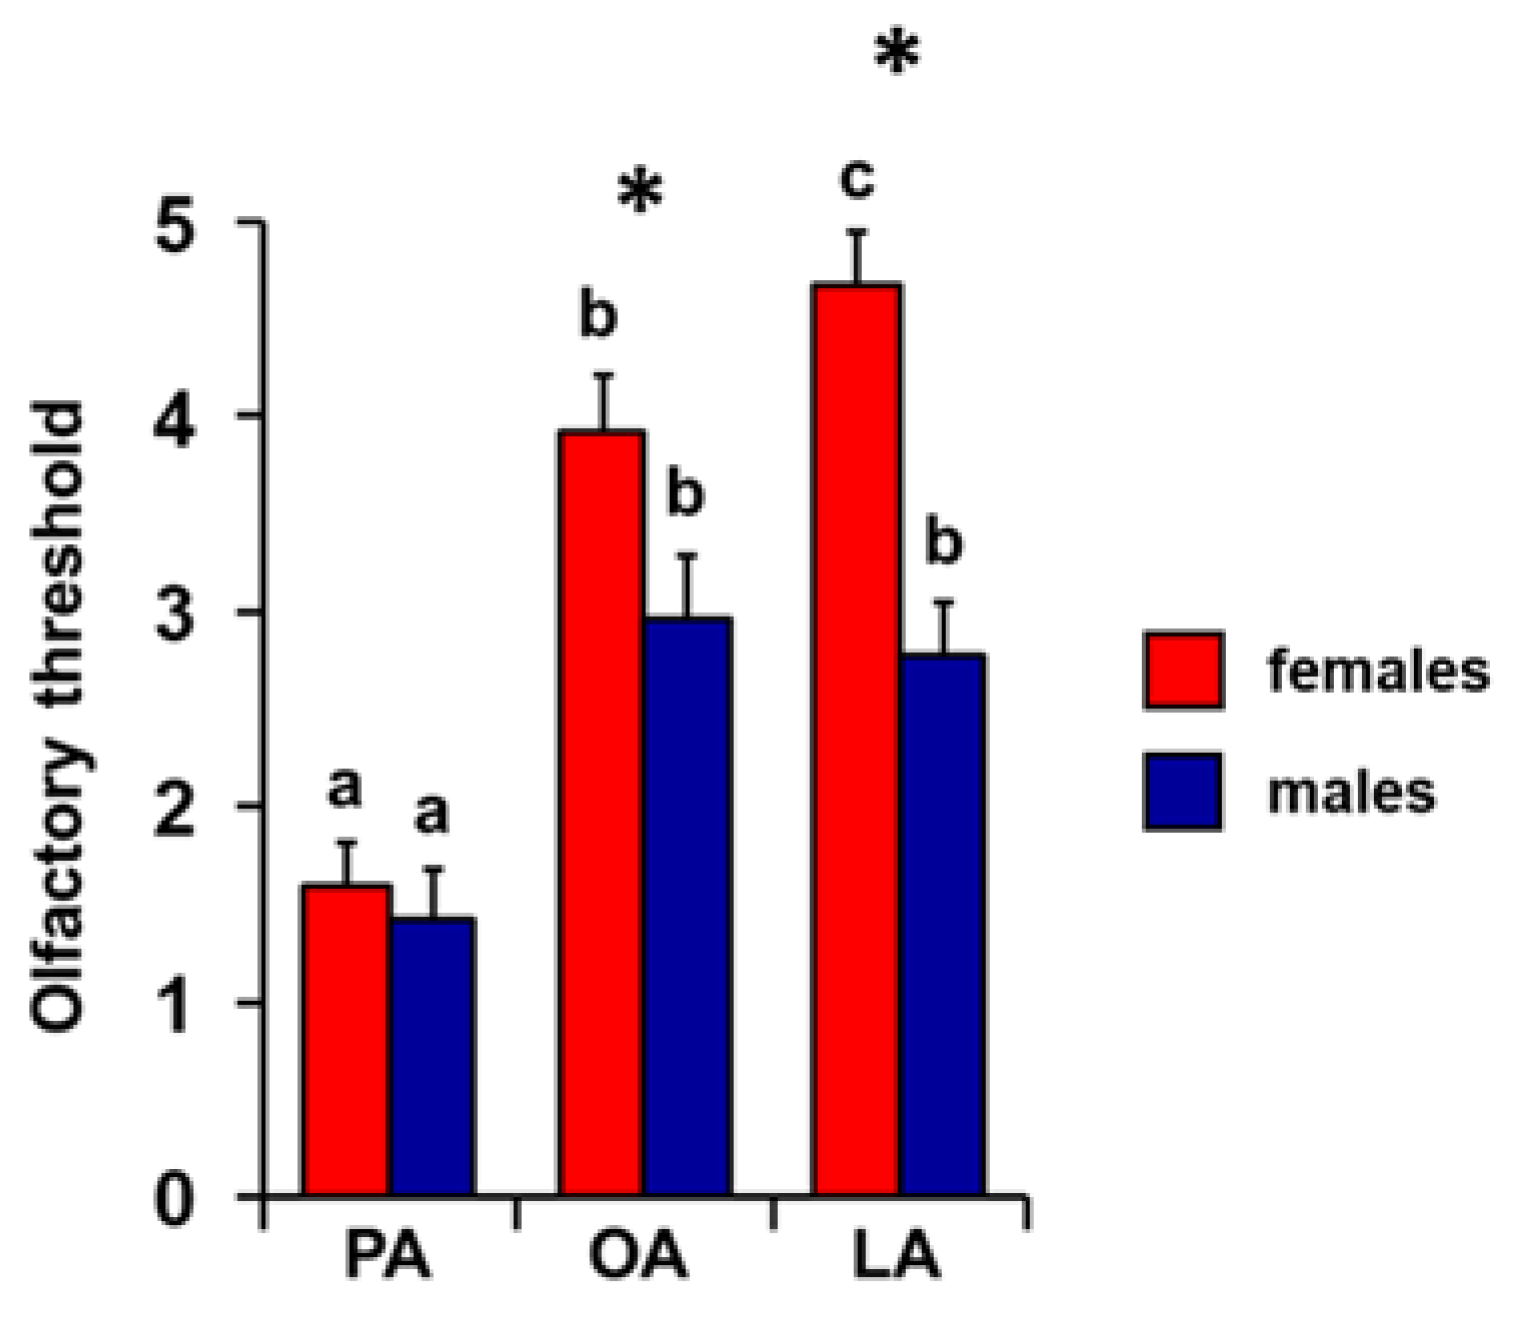
The mean values ± SEM of the olfactory threshold score for the odors of PA, OA and LA obtained by both female and male individuals are shown in figure 7. One-way MANOVA revealed a significant effect of sex on the olfactory threshold (F 3,66 = 8.06; p = 0.0001). Post-hoc analyses showed that females presented a lower olfactory threshold than males for the odors of OA (p < 0.05; Fisher's LSD test) and LA (p < 0.001; Fisher's LSD test), while no difference was found for PA between females and males (p > 0.05; Fisher's LSD test). Repeated-measures ANOVA revealed the presence of a significant effect of sex on the olfactory threshold (F 2,136 = 6.63; p = 0.002). Post-hoc analyses showed that, for both sexes, there is a significant decreasing order of olfactory threshold: PA > OA > LA for females (PA-OA p < 0.0001; OA-LA p < 0.02; Fisher’s LSD test) and PA > OA = LA for males (PA-OA p < 0.0001; PA-LA p < 0.0005; OA-LA p = 0.59; Fisher’s LSD test).
Figure 7.
Effect of the sex on the olfactory threshold of fatty acids. Mean value ± SE of the olfactory threshold of individuals for the odor of palmitic (PA), oleic (OA) and linoleic (LA) acids, according to their sex. * indicates significant differences between females and males for the same FA (p < 0.04; Fisher’s LSD test following one-way MANOVA). Different letters indicate significant differences in the olfactory threshold for the different FAs, within the same sex (Females: p < 0.05; Males: p < 0.001; Fisher’s LSD test following repeated-measures ANOVA).
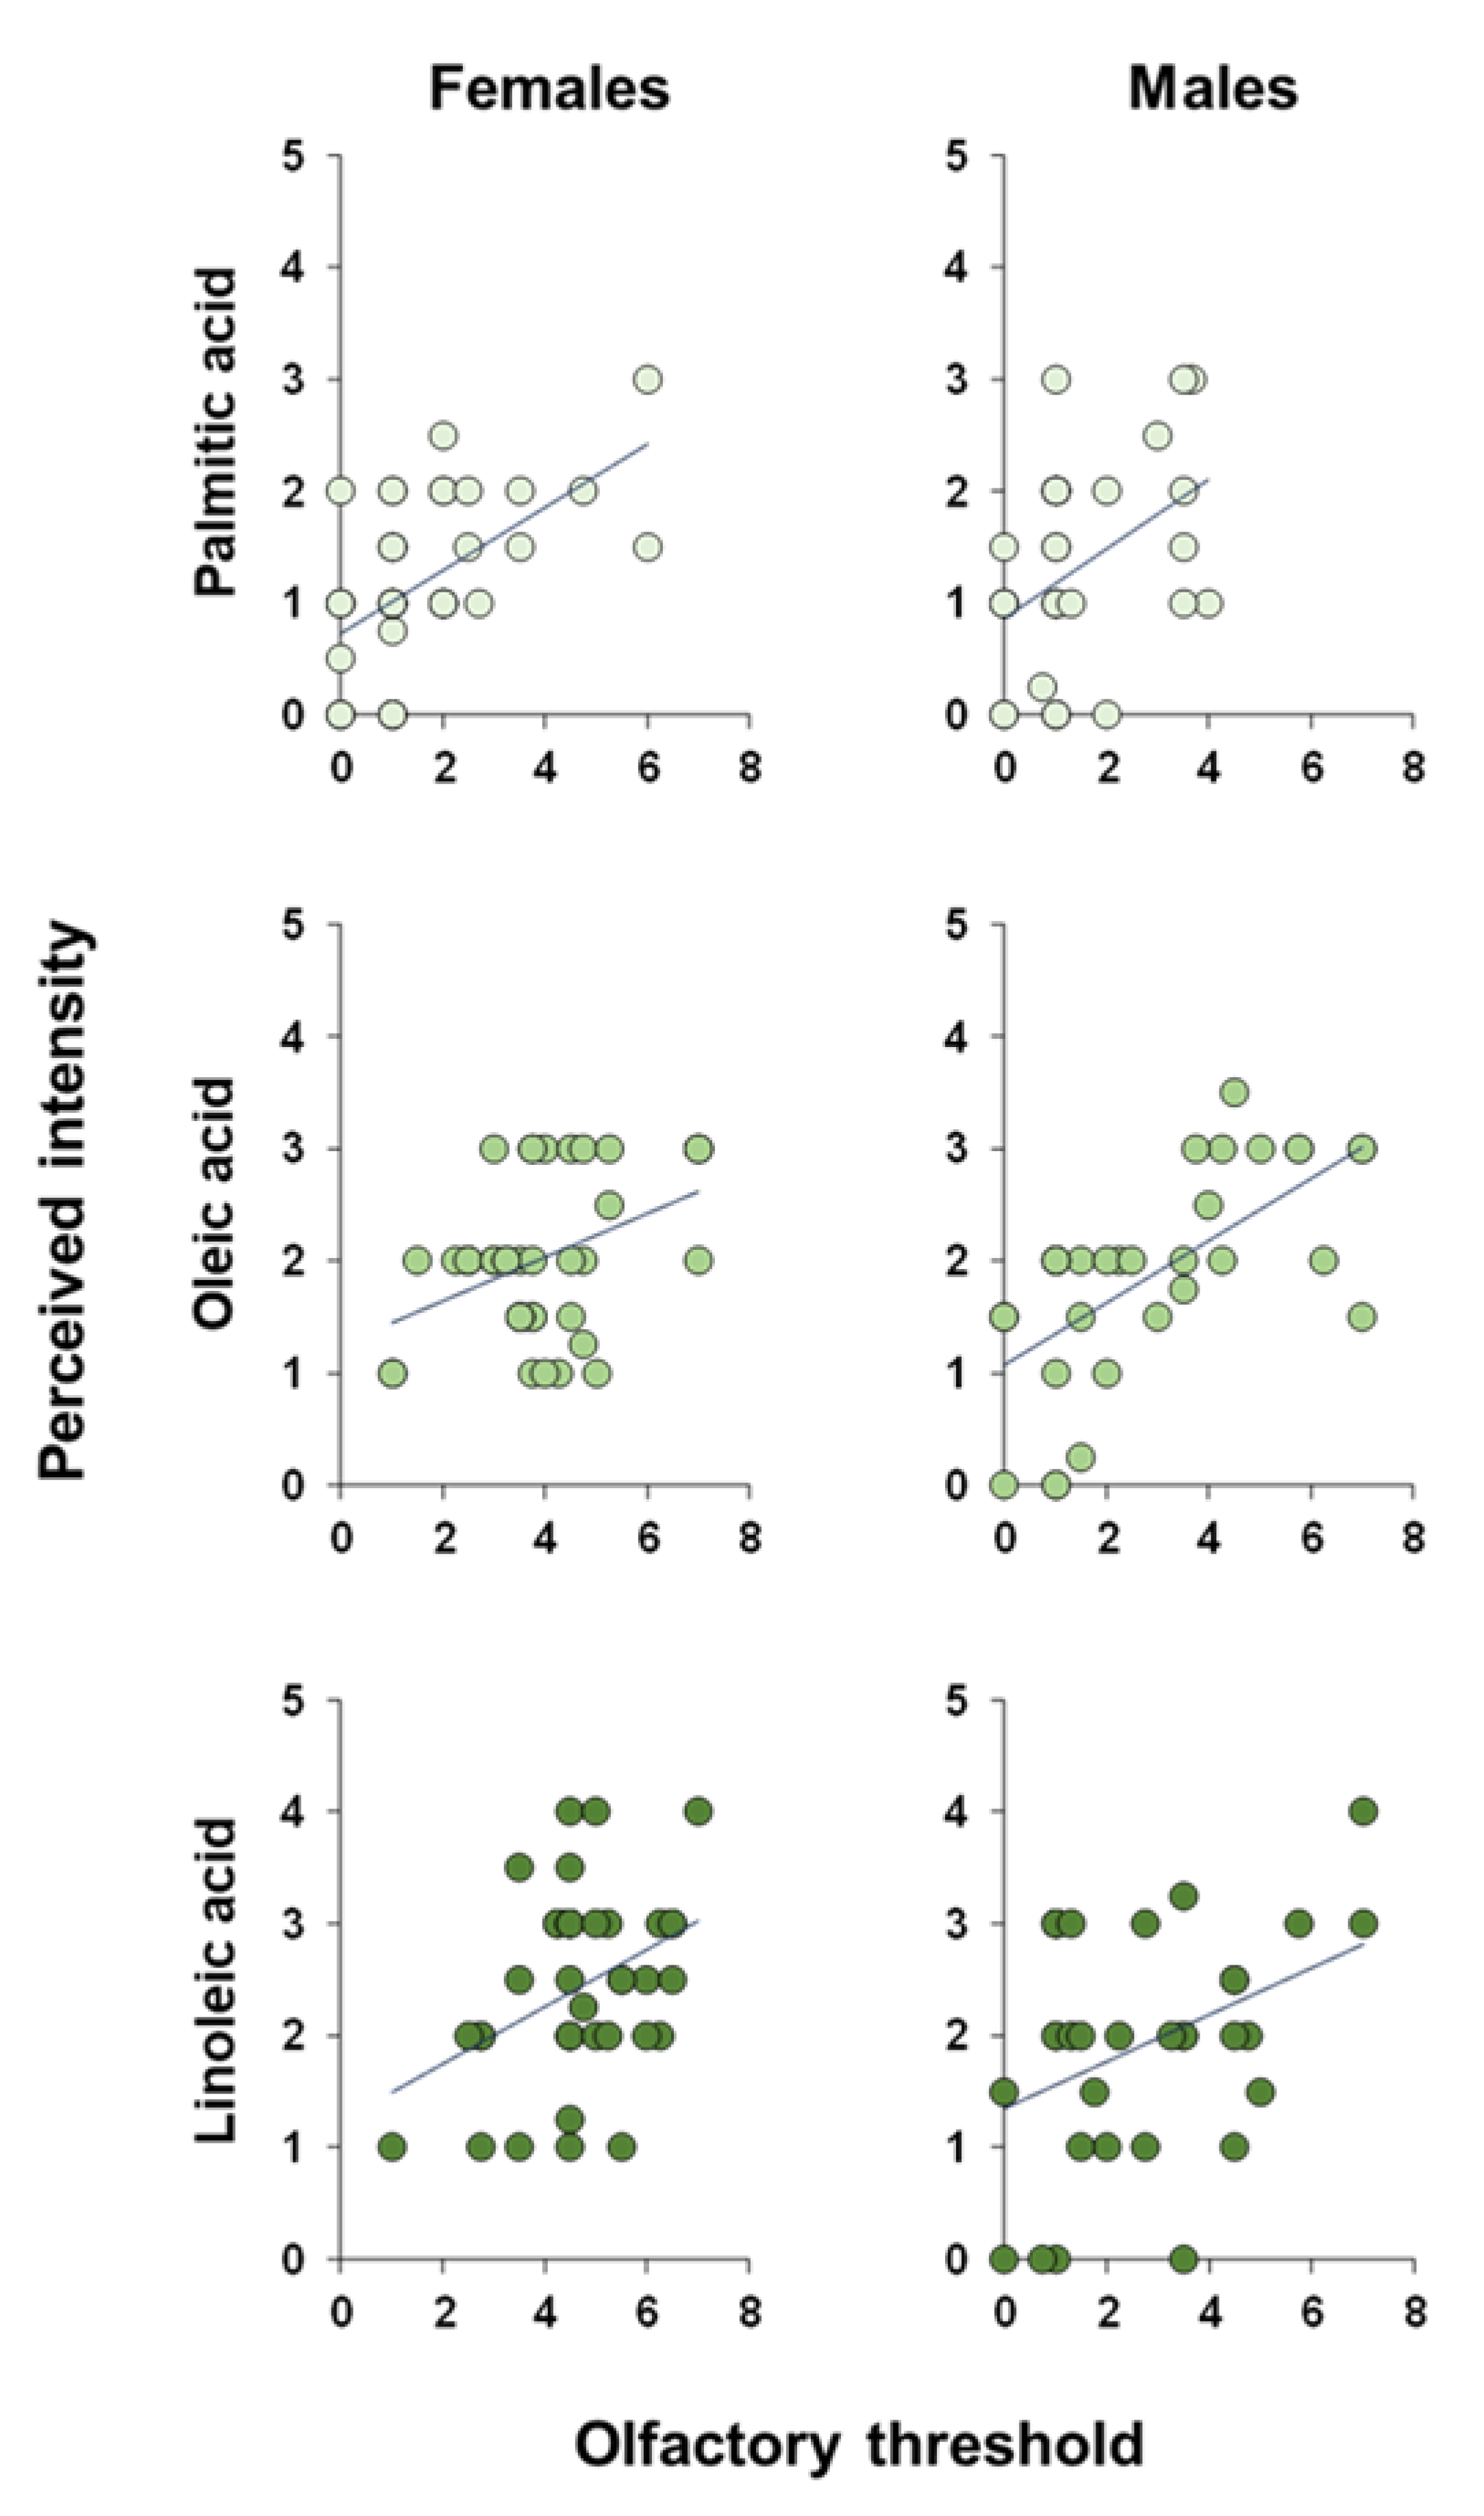
Pearson's correlation test was used to test the correlation between the olfactory threshold and the intensity with which the odors of PA, OA and LA were perceived during the GC-O experiments. The results shown in figure 8 indicate a significant positive correlation between the perceived intensity during the GC-O experiments and the olfactory threshold for each of the fatty acids considered, both when the individuals are considered as a whole (PA: Pearson r = 0.48, p < 0.0001; OA: Pearson r = 0.56, p < 0.0001; LA: Pearson r = 0.64, p < 0.0001) and separately in females (PA: Pearson r = 0.56, p = 0.0003; OA: Pearson r = 0.41, p = 0.0106; LA: Pearson r = 0.39, p = 0.0167) and males (PA: Pearson r = 0.42, p = 0.0176; OA: Pearson r = 0.65, p < 0.0001; LA: Pearson r = 0.39, p = 0.0276).
Figure 8.
Correlation analysis. Correlation analysis between the intensity with which each individual perceived the odor of palmitic, oleic and linoleic fatty acids while they were eluted from the chromatographic column and his/her olfactory perception threshold towards the odor of the same FAs.
Figure 8.
Correlation analysis. Correlation analysis between the intensity with which each individual perceived the odor of palmitic, oleic and linoleic fatty acids while they were eluted from the chromatographic column and his/her olfactory perception threshold towards the odor of the same FAs.
4. Discussion
One of the most debated topics in literature in relation to the perception of the odor of fatty acids (FAs) is the olfactory pathway of perception and whether the odor is that of the actual free fatty acid molecule or its oxidation products. Most FAs in foods are found in the form of triglycerides and, at room temperature, they quickly undergo oxidation processes leading to the formation of volatile compounds such as alcohols, aldehydes and ketones [11,43,75]. However, in some foods, low concentrations of free fatty acids (FFAs) are also present [2,3]. The first aim of our study was to evaluate the ability to perceive the odor of FAs and measure its olfactory threshold, through the orthonasal pathway. The results obtained with the GC-O experiments show that individuals are able to perceive the odor of palmitic, oleic and linoleic acid as they are eluted from the chromatographic column, even if the number of individuals perceiving the odor of OA and LA was significantly higher than those perceiving the odor of PA. The different ability shown by individuals in the perception of FAs has an important functional implication: PA, for which individual perception is lower, has been associated with hypercholesterolemia, inflammatory processes, insulin resistance, high cardiovascular risk and diabetes; OA has been associated with the reduction of blood cholesterol content, oxidative stress, inflammatory state and blood pressure; LA has been seen to reduce blood cholesterol levels, especially LDL, promote the formation of bile acids, increase insulin sensitivity, reduce blood pressure and the incidence of cardiovascular diseases [5]. Smelling the odor of PA from a distance could allow these individuals to avoid foods high in this fatty acid and therefore represents a defense mechanism against health risk factors. The greater ability of individuals to perceive the odor of OA and LA would allow individuals to identify and choose foods that contain these FAs with beneficial effects on health, especially for what concerns LA, a polyunsaturated fatty acid defined as essential that cannot be synthesized de-novo by the body and that must necessarily be introduced with the diet [5].
Our data also show that the perceived intensity was inversely proportional to the number of double bonds present in the molecule, highest for LA, intermediate for OA and lowest for PA, and that the olfactory threshold was lowest for LA, intermediate for OA and highest for PA. These results, taken together, highlight that both the ability to perceive odors and the intensity with which FAs are perceived are inversely proportional to their lipophilicity. As the number of double bonds increases, the water solubility of the molecules increases and this facilitates, for the fatty acid, the reaching of the dendritic terminal and the binding to its olfactory receptor [76]. Remembering that the ability and intensity of an odor perception depend on the activation of the olfactory sensory neurons, a greater number of receptor-odor bonds determines a more intense depolarization, therefore a greater number of action potentials will reach the central nervous system and the odor perception will be more intense. This is of particular importance if we consider that the olfactory receptors are immersed in the perireceptor space, a thin layer of mucus rich in water and glycoproteins [77,78,79]. We can hypothesize that oleic and linoleic FAs, more water-soluble due to their double bonds, are able to cross the mucus layer more easily and therefore reach the olfactory receptors. We can also hypothesize that oleic and linoleic FAs are able to bind more easily to OBPs, reaching the olfactory receptors (ORs) more easily. In this regard, future studies will be directed to evaluate the binding affinity between OBPs and FAs, as well as the expression and functionality of OBPs, which is known to be genetically determined and influence the intensity of odor perception [80,81].
In agreement, correlation analyses show that the intensity with which FAs are perceived is directly proportional to their olfactory threshold: the higher the score obtained during the olfactory threshold determination test, the lower the olfactory threshold and greater the intensity with which the odors of palmitic, oleic and linoleic acids are perceived. These results are in agreement and confirm previous studies in which it was demonstrated that the ability to perceive the molecules that make up the complex aroma of foods such as coffee and banana, and the intensity with which these molecules are perceived is directly correlated with the olfactory function of individuals [46,71].
The ability to perceive the odor of fats by an orthonasal pathway, and therefore from a distance, is seen as an advantageous adaptation as it would allow to identify the caloric content of food even before ingesting it, thus facilitating the recognition and choice of food sources rich in calories, easily accumulated and for long periods of time [30]. Based on these considerations, the second aim of our study was to evaluate the differences in the perception of FAs in relation to the olfactory function of individuals. The results we obtained highlight that, compared to individuals with hyposmia, normosmic individuals show a higher sensitivity and a lower olfactory threshold for OA and LA. This aspect is very important if we consider that the decline of the sense of smell induces individuals to choose less healthy foods [24,25]. Individuals with hyposmia have a higher threshold for palmitic acid, a saturated and important energy source and a precursor of other fatty acids, and a lower threshold for oleic and linoleic acids, unsaturated and polyunsaturated, which modulate the permeability of plasma membranes, are precursors of prostaglandins and have a hypocholesterolemic action [4,5,6,7,8,9,10]. Evolution may have favored the orthonasal perception of FAs both because they represent an important energy source and because of the beneficial effects presented by FAs such as OA and LA. In this regard, individuals with a higher sensitivity could benefit more, choosing healthier foods compared to individuals with hyposmia.
Previous studies have shown that females perform better than males both in their general olfactory function and in their ability to perceive single molecules that compose a complex mixture [46,66], so the final aim of the present study was to evaluate sex-related differences in FA odor perception. The results we obtained show that females perceive the LA odor more intensely during GC-O experiments and present a lower olfactory threshold for OA and LA than males. Females, therefore, show a better olfactory performance than males also in the perception of molecules of food interest and with health benefits such as unsaturated and polyunsaturated fatty acids. We can hypothesize that this ability may allow females to identify foods with nutritional con-tent beneficial to health more easily than males: this could partially justify a greater adherence of females to the Mediterranean diet [23] which, being characterized by a high consumption of plant-based foods, such as olive oil rich in OA, and blue fish, rich in polyunsaturated fatty acids, such as LA, is known for its protective effects against cardiovascular and neurodegenerative diseases, diabetes, cancer and obesity [82,83,84,85].
5. Conclusions
In conclusion, the results of this study confirm the orthonasal perception of FAs and show that it is directly related to the number of double bonds present in the molecule and inversely related to its lipophilicity. In this regard, given the importance of OBPs in binding and transporting odorant molecules, mainly lipophilic, across the perireceptor space to the olfactory receptors [78,86,87,88,89,90,91,92,93,94,95], it would be interesting to study the polymorphism of the gene encoding OBPs, whose expression and functionality have been associated with variations in the olfactory function of both healthy and pathological individuals, in their ability to perceive single molecules and the intensity with which they are perceived [65,72,80,81,96]. Furthermore, a direct relationship between olfactory threshold and perceived intensity has been highlighted: a lower threshold means a higher perception. These aspects seem to be related to the olfactory status of individuals and their sex: normosmic people and females show a lower olfactory threshold and a higher intensity of perception, explaining at least in part, why these people show a higher adherence to the Mediterranean diet, compared to males and individuals with hyposmia [23]. Given the contribution of the polymorphism of the gene encoding the Kv1.3 channels to interindividual variability and sex-related differences in olfactory function [54,55,97], it would be interesting, in the future, to study its role in fatty acid perception.
Author Contributions
Conceptualization, G.S.; methodology, D.D. and G.S.; statistical analysis, G.S.; investigation, D.D. and G.S.; data curation, D.D. and G.S.; writing—original draft preparation, G.S.; writing—review and editing, D.D. and G.S.; supervision, G.S.; project administration, G.S.; funding acquisition, G.S.
Institutional Review Board Statement
The study was conducted according to the guidelines of the Declaration of Helsinki and approved by the Ethical Committee of the University Hospital of Cagliari (Prot. PG/2021/14278, 09.22.2021).
Informed Consent Statement
Informed consent was obtained from all subjects involved in the study.
Data Availability Statement
The data presented in this study are available on request from the corresponding author. The data are not publicly available due to restrictions (e.g. privacy or ethical).
Funding
This research was partially supported by a grant from the University of Cagliari (Progetti biennali FdS - Bando 2021).
Acknowledgments
The authors thank the volunteers, without whose contribution this study would not have been possible.
Conflicts of Interest
The authors declare no conflict of interest. The funders had no role in the design of the study; in the collection, analyses, or interpretation of data; in the writing of the manuscript, or in the decision to publish the results.
References
- Lobb, K.; Chow, C. Fatty Acid Classification and Nomenclature. 2007; pp. 1-15.
- Bolton, B.; Halpern, B.P. Orthonasal and retronasal but not oral-cavity-only discrimination of vapor-phase fatty acids. Chem Senses 2010, 35, 229–238. [Google Scholar] [CrossRef] [PubMed]
- Chow, C.K. Fatty acids in foods and their health implications, third edition; 2007; pp. 1-1283.
- Bazinet, R.P.; Layé, S. Polyunsaturated fatty acids and their metabolites in brain function and disease. Nature Reviews Neuroscience 2014, 15, 771–785. [Google Scholar] [CrossRef] [PubMed]
- Calder, P.C. Functional Roles of Fatty Acids and Their Effects on Human Health. Journal of Parenteral and Enteral Nutrition 2015, 39, 18S–32S. [Google Scholar] [CrossRef] [PubMed]
- Dyall, S.C.; Balas, L.; Bazan, N.G.; Brenna, J.T.; Chiang, N.; da Costa Souza, F.; Dalli, J.; Durand, T.; Galano, J.-M.; Lein, P.J.; et al. Polyunsaturated fatty acids and fatty acid-derived lipid mediators: Recent advances in the understanding of their biosynthesis, structures, and functions. Progress in Lipid Research 2022, 86, 101165. [Google Scholar] [CrossRef]
- Harayama, T.; Shimizu, T. Roles of polyunsaturated fatty acids, from mediators to membranes. Journal of Lipid Research 2020, 61, 1150–1160. [Google Scholar] [CrossRef]
- Kapoor, B.; Kapoor, D.; Gautam, S.; Singh, R.; Bhardwaj, S. Dietary Polyunsaturated Fatty Acids (PUFAs): Uses and Potential Health Benefits. Current Nutrition Reports 2021, 10, 232–242. [Google Scholar] [CrossRef]
- Mititelu, M.; Lupuliasa, D.; Neacșu, S.M.; Olteanu, G.; Busnatu, Ș.S.; Mihai, A.; Popovici, V.; Măru, N.; Boroghină, S.C.; Mihai, S.; et al. Polyunsaturated Fatty Acids and Human Health: A Key to Modern Nutritional Balance in Association with Polyphenolic Compounds from Food Sources. Foods 2025, 14, 46. [Google Scholar] [CrossRef]
- Sioen, I.; van Lieshout, L.; Eilander, A.; Fleith, M.; Lohner, S.; Szommer, A.; Petisca, C.; Eussen, S.; Forsyth, S.; Calder, P.C.; et al. Systematic Review on N-3 and N-6 Polyunsaturated Fatty Acid Intake in European Countries in Light of the Current Recommendations - Focus on Specific Population Groups. Annals of Nutrition and Metabolism 2017, 70, 39–50. [Google Scholar] [CrossRef]
- Heinze, J.M.; Costanzo, A.; Baselier, I.; Fritsche, A.; Lidolt, M.; Hinrichs, J.; Frank-Podlech, S.; Keast, R. Oil Perception-Detection Thresholds for Varying Fatty Stimuli and Inter-individual Differences. Chem Senses 2017, 42, 585–592. [Google Scholar] [CrossRef]
- Bi, X.; Yeo, P.L.Q.; Loo, Y.T.; Henry, C.J. Associations between circulating fatty acid levels and metabolic risk factors. Journal of Nutrition & Intermediary Metabolism 2019, 15, 65–69. [Google Scholar]
- Boden, G. Obesity and Free Fatty Acids. Endocrinology and metabolism clinics of North America 2008, 37, 635–646. [Google Scholar] [CrossRef]
- Jerab, D.; Blangero, F.; da Costa, P.C.T.; de Brito Alves, J.L.; Kefi, R.; Jamoussi, H.; Morio, B.; Eljaafari, A. Beneficial Effects of Omega-3 Fatty Acids on Obesity and Related Metabolic and Chronic Inflammatory Diseases. Nutrients 2025, 17, 1253. [Google Scholar] [CrossRef] [PubMed]
- Lorente-Cebrián, S.; Costa, A.G.; Navas-Carretero, S.; Zabala, M.; Martínez, J.A.; Moreno-Aliaga, M.J. Role of omega-3 fatty acids in obesity, metabolic syndrome, and cardiovascular diseases: a review of the evidence. J Physiol Biochem 2013, 69, 633–651. [Google Scholar] [CrossRef] [PubMed]
- Ravaut, G.; Légiot, A.; Bergeron, K.-F.; Mounier, C. Monounsaturated Fatty Acids in Obesity-Related Inflammation. International Journal of Molecular Sciences 2021, 22, 330. [Google Scholar] [CrossRef] [PubMed]
- Subošić, B.; Kotur-Stevuljević, J.; Bogavac-Stanojević, N.; Zdravković, V.; Ješić, M.; Kovačević, S.; Đuričić, I. Circulating Fatty Acids Associate with Metabolic Changes in Adolescents Living with Obesity. Biomedicines 2024, 12, 883. [Google Scholar] [CrossRef]
- Wrzosek, M.; Zawadzka, Z.; Sawicka, A.; Bobrowska-Korczak, B.; Białek, A. Impact of Fatty Acids on Obesity-Associated Diseases and Radical Weight Reduction. Obesity surgery 2022, 32, 428–440. [Google Scholar] [CrossRef]
- Boesveldt, S.; de Graaf, K. The Differential Role of Smell and Taste For Eating Behavior. Perception 2017, 46, 307–319. [Google Scholar] [CrossRef]
- Boesveldt, S.; Parma, V. The importance of the olfactory system in human well-being, through nutrition and social behavior. Cell and tissue research 2021, 383, 559–567. [Google Scholar] [CrossRef]
- Sollai, G.; Crnjar, R. Age-Related Olfactory Decline Is Associated With Levels of Exercise and Non-exercise Physical Activities. Frontiers in aging neuroscience 2021, 13, 695115. [Google Scholar] [CrossRef]
- Stevenson, R.J. An initial evaluation of the functions of human olfaction. Chem Senses 2010, 35, 3–20. [Google Scholar] [CrossRef]
- Velluzzi, F.; Deledda, A.; Lombardo, M.; Fosci, M.; Crnjar, R.; Grossi, E.; Sollai, G. Application of Artificial Neural Networks (ANN) to Elucidate the Connections among Smell, Obesity with Related Metabolic Alterations, and Eating Habit in Patients with Weight Excess. Metabolites 2023, 13, 206. [Google Scholar] [CrossRef] [PubMed]
- Aschenbrenner, K.; Hummel, C.; Teszmer, K.; Krone, F.; Ishimaru, T.; Seo, H.S.; Hummel, T. The influence of olfactory loss on dietary behaviors. The Laryngoscope 2008, 118, 135–144. [Google Scholar] [CrossRef]
- Duffy, V.B.; Backstrand, J.R.; Ferris, A.M. Olfactory dysfunction and related nutritional risk in free-living, elderly women. Journal of the American Dietetic Association 1995, 95, 879–884. [Google Scholar] [CrossRef]
- Fazzino, T.L.; Rohde, K.; Sullivan, D.K. Hyper-Palatable Foods: Development of a Quantitative Definition and Application to the US Food System Database. Obesity (Silver Spring, Md.) 2019, 27, 1761–1768. [Google Scholar] [CrossRef] [PubMed]
- Henkin, R.I. Effects of smell loss (hyposmia) on salt usage. Nutrition 2014, 30, 690–695. [Google Scholar] [CrossRef]
- Mattes, R.D. Nutritional implications of the cephalic-phase salivary response. Appetite 2000, 34, 177–183. [Google Scholar] [CrossRef]
- Postma, E.; Graaf, C.; Boesveldt, S. Food preferences and intake in a population of Dutch individuals with self-reported smell loss: An online survey. Food Quality and Preference 2019, 79, 103771. [Google Scholar] [CrossRef]
- Boesveldt, S.; Lundström, J.N. Detecting fat content of food from a distance: olfactory-based fat discrimination in humans. PloS one 2014, 9, e85977. [Google Scholar] [CrossRef]
- Drewnowski, A. Why do we like fat? Journal of the American Dietetic Association 1997, 97, S58–62. [Google Scholar] [CrossRef]
- Lalanza, J.F.; Snoeren, E.M.S. The cafeteria diet: A standardized protocol and its effects on behavior. Neuroscience and biobehavioral reviews 2021, 122, 92–119. [Google Scholar] [CrossRef]
- Ludwig, D.S.; Aronne, L.J.; Astrup, A.; de Cabo, R.; Cantley, L.C.; Friedman, M.I.; Heymsfield, S.B.; Johnson, J.D.; King, J.C.; Krauss, R.M.; et al. The carbohydrate-insulin model: a physiological perspective on the obesity pandemic. The American journal of clinical nutrition 2021, 114, 1873–1885. [Google Scholar] [CrossRef] [PubMed]
- García-Montero, C.; Fraile-Martínez, O.; Gómez-Lahoz, A.M.; Pekarek, L.; Castellanos, A.J.; Noguerales-Fraguas, F.; Coca, S.; Guijarro, L.G.; García-Honduvilla, N.; Asúnsolo, A.; et al. Nutritional Components in Western Diet Versus Mediterranean Diet at the Gut Microbiota-Immune System Interplay. Implications for Health and Disease. Nutrients 2021, 13. [Google Scholar] [CrossRef]
- Lustig, R.H. Ultraprocessed Food: Addictive, Toxic, and Ready for Regulation. Nutrients 2020, 12. [Google Scholar] [CrossRef]
- Alarcon, G.; Roco, J.; Medina, M.; Medina, A.; Peral, M.; Jerez, S. High fat diet-induced metabolically obese and normal weight rabbit model shows early vascular dysfunction: mechanisms involved. International Journal of Obesity 2018, 42, 1535–1543. [Google Scholar] [CrossRef] [PubMed]
- Palouzier-Paulignan, B.; Lacroix, M.C.; Aimé, P.; Baly, C.; Caillol, M.; Congar, P.; Julliard, A.K.; Tucker, K.; Fadool, D.A. Olfaction under metabolic influences. Chem Senses 2012, 37, 769–797. [Google Scholar] [CrossRef]
- Pastor, A.; Fernández-Aranda, F.; Fitó, M.; Jiménez-Murcia, S.; Botella, C.; Fernández-Real, J.M.; Frühbeck, G.; Tinahones, F.J.; Fagundo, A.B.; Rodriguez, J.; et al. A Lower Olfactory Capacity Is Related to Higher Circulating Concentrations of Endocannabinoid 2-Arachidonoylglycerol and Higher Body Mass Index in Women. PloS one 2016, 11, e0148734. [Google Scholar] [CrossRef] [PubMed]
- Patel, Z.M.; DelGaudio, J.M.; Wise, S.K. Higher Body Mass Index Is Associated with Subjective Olfactory Dysfunction. Behavioural neurology 2015, 2015, 675635. [Google Scholar] [CrossRef]
- Stipanuk, M. Biochemical and Physiological Aspects of Human Nutrition. 2000.
- Kallas, O.; Halpern, B.P. Retronasal Discrimination Between Vapor-Phase Long-Chain, Aliphatic Fatty Acids. Chemosensory Perception 2011, 4, 16–24. [Google Scholar] [CrossRef]
- Pirc, M.; Maas, P.; De Graaf, K.; Lee, H.-S.; Boesveldt, S. Humans possess the ability to discriminate food fat content solely based on retronasal olfaction. Food Quality and Preference 2022, 96, 104449. [Google Scholar] [CrossRef]
- Wen, Y.-Q.; Xue, C.-H.; Zhang, H.-W.; Xu, L.-L.; Wang, X.-H.; Bi, S.-J.; Xue, Q.-Q.; Xue, Y.; Li, Z.-J.; Velasco, J.; et al. Concomitant oxidation of fatty acids other than DHA and EPA plays a role in the characteristic off-odor of fish oil. Food Chemistry 2023, 404, 134724. [Google Scholar] [CrossRef]
- Kern, D.W.; Wroblewski, K.E.; Schumm, L.P.; Pinto, J.M.; Chen, R.C.; McClintock, M.K. Olfactory Function in Wave 2 of the National Social Life, Health, and Aging Project. The Journals of Gerontology: Series B 2014, 69, S134–S143. [Google Scholar] [CrossRef] [PubMed]
- Sollai, G.; Crnjar, R. Association among Olfactory Function, Lifestyle and BMI in Female and Male Elderly Subjects: A Cross-Sectional Study. Nutrients 2023, 15. [Google Scholar] [CrossRef]
- Sollai, G.; Solari, P.; Crnjar, R. Qualitative and Quantitative Sex-Related Differences in the Perception of Single Molecules from Coffee Headspace. Foods 2024, 13, 3239. [Google Scholar] [CrossRef] [PubMed]
- Sorokowski, P.; Karwowski, M.; Misiak, M.; Marczak, M.K.; Dziekan, M.; Hummel, T.; Sorokowska, A. Sex Differences in Human Olfaction: A Meta-Analysis. Front Psychol 2019, 10, 242. [Google Scholar] [CrossRef]
- Caruso, S.; Grillo, C.; Agnello, C.; Maiolino, L.; Intelisano, G.; Serra, A. A prospective study evidencing rhinomanometric and olfactometric outcomes in women taking oral contraceptives. Human Reproduction 2001, 16, 2288–2294. [Google Scholar] [CrossRef]
- SCHNEIDER, R.A.; COSTILOE, J.P.; HOWARD, R.P.; WOLF, S. OLFACTORY PERCEPTION THRESHOLDS IN HYPOGONADAL WOMEN: CHANGES ACCOMPANYING ADMINISTRATION OF ANDROGEN AND ESTROGEN*†. The Journal of Clinical Endocrinology & Metabolism 1958, 18, 379–390. [Google Scholar]
- Cornell Kärnekull, S.; Jönsson, F.U.; Willander, J.; Sikström, S.; Larsson, M. Long-Term Memory for Odors: Influences of Familiarity and Identification Across 64 Days. Chemical Senses 2015, 40, 259–267. [Google Scholar] [CrossRef] [PubMed]
- Schaal, B.; Marlier, L.; Soussignan, R. Olfactory function in the human fetus: evidence from selective neonatal responsiveness to the odor of amniotic fluid. Behavioral neuroscience 1998, 112, 1438–1449. [Google Scholar] [CrossRef]
- Larsson, M.; Finkel, D.; Pedersen, N.L. Odor identification: influences of age, gender, cognition, and personality. The journals of gerontology. Series B, Psychological sciences and social sciences 2000, 55, P304–310. [Google Scholar] [CrossRef]
- Öberg, C.; Larsson, M.; Bäckman, L. Differential sex effects in olfactory functioning: The role of verbal processing. Journal of the International Neuropsychological Society 2002, 8, 691–698. [Google Scholar] [CrossRef]
- Guthoff, M.; Tschritter, O.; Berg, D.; Liepelt, I.; Schulte, C.; Machicao, F.; Haering, H.U.; Fritsche, A. Effect of genetic variation in Kv1.3 on olfactory function. Diabetes/metabolism research and reviews 2009, 25, 523–527. [Google Scholar] [CrossRef]
- Melis, M.; Tomassini Barbarossa, I.; Crnjar, R.; Sollai, G. Olfactory Sensitivity Is Associated with Body Mass Index and Polymorphism in the Voltage-Gated Potassium Channels Kv1.3. Nutrients 2022, 14, 4986. [Google Scholar] [CrossRef]
- Aydin, N.; Ramazanoglu, L.; Onen, M.R.; Yilmaz, I.; Aydin, M.D.; Altinkaynak, K.; Calik, M.; Kanat, A. Rationalization of the Irrational Neuropathologic Basis of Hypothyroidism-Olfaction Disorders Paradox: Experimental Study. World Neurosurgery 2017, 107, 400–408. [Google Scholar] [CrossRef] [PubMed]
- Besser, G.; Erlacher, B.; Aydinkoc-Tuzcu, K.; Liu, D.T.; Pablik, E.; Niebauer, V.; Koenighofer, M.; Renner, B.; Mueller, C.A. Body-Mass-Index Associated Differences in Ortho- and Retronasal Olfactory Function and the Individual Significance of Olfaction in Health and Disease. Journal of clinical medicine 2020, 9. [Google Scholar] [CrossRef]
- Chamberlin, K.W.; Yuan, Y.; Li, C.; Luo, Z.; Reeves, M.; Kucharska-Newton, A.; Pinto, J.M.; Ma, J.; Simonsick, E.M.; Chen, H. Olfactory Impairment and the Risk of Major Adverse Cardiovascular Outcomes in Older Adults. Journal of the American Heart Association 2024, 13, e033320. [Google Scholar] [CrossRef]
- Croy, I.; Nordin, S.; Hummel, T. Olfactory Disorders and Quality of Life—An Updated Review. Chemical Senses 2014, 39, 185–194. [Google Scholar] [CrossRef] [PubMed]
- Jacobson, P.T.; Vilarello, B.J.; Tervo, J.P.; Waring, N.A.; Gudis, D.A.; Goldberg, T.E.; Devanand, D.P.; Overdevest, J.B. Associations between olfactory dysfunction and cognition: a scoping review. Journal of neurology 2024. [Google Scholar] [CrossRef]
- Kouzuki, M.; Suzuki, T.; Nagano, M.; Nakamura, S.; Katsumata, Y.; Takamura, A.; Urakami, K. Comparison of olfactory and gustatory disorders in Alzheimer's disease. Neurological sciences : official journal of the Italian Neurological Society and of the Italian Society of Clinical Neurophysiology 2018, 39, 321–328. [Google Scholar] [CrossRef] [PubMed]
- Potter, M.R.; Chen, J.H.; Lobban, N.S.; Doty, R.L. Olfactory dysfunction from acute upper respiratory infections: relationship to season of onset. International forum of allergy & rhinology 2020, 10, 706–712. [Google Scholar]
- Ross, G.W.; Petrovitch, H.; Abbott, R.D.; Tanner, C.M.; Popper, J.; Masaki, K.; Launer, L.; White, L.R. Association of olfactory dysfunction with risk for future Parkinson's disease. Annals of neurology 2008, 63, 167–173. [Google Scholar] [CrossRef]
- Sasaki, H.; Tamura, K.; Naito, Y.; Ogata, K.; Mogi, A.; Tanaka, T.; Ikari, Y.; Masaki, M.; Nakashima, Y.; Takamatsu, Y. Patient perceptions of symptoms and concerns during cancer chemotherapy: 'affects my family' is the most important. International journal of clinical oncology 2017, 22, 793–800. [Google Scholar] [CrossRef]
- Sollai, G.; Melis, M.; Mastinu, M.; Paduano, D.; Chicco, F.; Magri, S.; Usai, P.; Hummel, T.; Barbarossa, I.T.; Crnjar, R. Olfactory Function in Patients with Inflammatory Bowel Disease (IBD) Is Associated with Their Body Mass Index and Polymorphism in the Odor Binding-Protein (OBPIIa) Gene. Nutrients 2021, 13. [Google Scholar] [CrossRef]
- Velluzzi, F.; Deledda, A.; Onida, M.; Loviselli, A.; Crnjar, R.; Sollai, G. Relationship between Olfactory Function and BMI in Normal Weight Healthy Subjects and Patients with Overweight or Obesity. Nutrients 2022, 14, 1262. [Google Scholar] [CrossRef] [PubMed]
- Wang, W.; Li, Z.; Zhang, X.; Li, Y.; Kong, S.; Zou, B.; Wang, M.; Cheng, N.; Zhang, H.M.; Sun, J. Investigating factors influencing subjective taste and smell alterations in colorectal cancer patients. Supportive care in cancer : official journal of the Multinational Association of Supportive Care in Cancer 2025, 33, 205. [Google Scholar] [CrossRef] [PubMed]
- Hummel, T.; Sekinger, B.; Wolf, S.R.; Pauli, E.; Kobal, G. 'Sniffin' sticks': olfactory performance assessed by the combined testing of odor identification, odor discrimination and olfactory threshold. Chem Senses 1997, 22, 39–52. [Google Scholar] [CrossRef]
- Hummel, T.; Kobal, G.; Gudziol, H.; Mackay-Sim, A. Normative data for the "Sniffin' Sticks" including tests of odor identification, odor discrimination, and olfactory thresholds: an upgrade based on a group of more than 3,000 subjects. Eur Arch Otorhinolaryngol 2007, 264, 237–243. [Google Scholar] [CrossRef]
- Crnjar, R.; Solari, P.; Sollai, G. The Human Nose as a Chemical Sensor in the Perception of Coffee Aroma: Individual Variability. Chemosensors 2023, 11, 248. [Google Scholar] [CrossRef]
- Sollai, G.; Tomassini Barbarossa, I.; Usai, P.; Hummel, T.; Crnjar, R. Association between human olfactory performance and ability to detect single compounds in complex chemical mixtures. Physiology & behavior 2020, 217, 112820. [Google Scholar]
- Melis, M.; Tomassini Barbarossa, I.; Hummel, T.; Crnjar, R.; Sollai, G. Effect of the rs2890498 polymorphism of the OBPIIa gene on the human ability to smell single molecules. Behavioural brain research 2021, 402, 113127. [Google Scholar] [CrossRef]
- Nuzzi, M.; Lo Scalzo, R.; Testoni, A.; Rizzolo, A. Evaluation of Fruit Aroma Quality: Comparison Between Gas Chromatography–Olfactometry (GC–O) and Odour Activity Value (OAV) Aroma Patterns of Strawberries. Food Analytical Methods 2008, 1, 270–282. [Google Scholar] [CrossRef]
- van Ruth, S.M.; O'Connor, C.H. Evaluation of three gas chromatography-olfactometry methods: comparison of odour intensity-concentration relationships of eight volatile compounds with sensory headspace data. Food Chemistry 2001, 74, 341–347. [Google Scholar] [CrossRef]
- Mu, S.; Stieger, M.; Boesveldt, S. Can humans smell tastants? Chem Senses 2024, 49. [Google Scholar] [CrossRef]
- Cooper, G.M. The Cell: A Molecular Approach. 2nd edition; Sinauer Associates 2000: 2000.
- Getchell, T.V.; Margolis, F.L.; Getchell, M.L. Perireceptor and receptor events in vertebrate olfaction. Progress in neurobiology 1984, 23, 317–345. [Google Scholar] [CrossRef]
- Pace, U.; Hanski, E.; Salomon, Y.; Lancet, D. Odorant-sensitive adenylate cyclase may mediate olfactory reception. Nature 1985, 316, 255–258. [Google Scholar] [CrossRef] [PubMed]
- Pelosi, P. Perireceptor events in olfaction. Journal of neurobiology 1996, 30, 3–19. [Google Scholar] [CrossRef]
- Sollai, G.; Melis, M.; Magri, S.; Usai, P.; Hummel, T.; Tomassini Barbarossa, I.; Crnjar, R. Association between the rs2590498 polymorphism of Odorant Binding Protein (OBPIIa) gene and olfactory performance in healthy subjects. Behavioural brain research 2019, 372, 112030. [Google Scholar] [CrossRef]
- Sollai, G.; Melis, M.; Tomassini Barbarossa, I.; Crnjar, R. A polymorphism in the human gene encoding OBPIIa affects the perceived intensity of smelled odors. Behavioural brain research 2022, 427, 113860. [Google Scholar] [CrossRef]
- D'Innocenzo, S.; Biagi, C.; Lanari, M. Obesity and the Mediterranean Diet: A Review of Evidence of the Role and Sustainability of the Mediterranean Diet. Nutrients 2019, 11. [Google Scholar] [CrossRef]
- Martínez-González, M.A.; Gea, A.; Ruiz-Canela, M. The Mediterranean Diet and Cardiovascular Health. Circulation research 2019, 124, 779–798. [Google Scholar] [CrossRef]
- Martínez-González, M.A.; Salas-Salvadó, J.; Estruch, R.; Corella, D.; Fitó, M.; Ros, E. Benefits of the Mediterranean Diet: Insights From the PREDIMED Study. Progress in cardiovascular diseases 2015, 58, 50–60. [Google Scholar] [CrossRef]
- Schwingshackl, L.; Schwedhelm, C.; Galbete, C.; Hoffmann, G. Adherence to Mediterranean Diet and Risk of Cancer: An Updated Systematic Review and Meta-Analysis. Nutrients 2017, 9. [Google Scholar] [CrossRef] [PubMed]
- Archunan, G. Odorant Binding Proteins: a key player in the sense of smell. Bioinformation 2018, 14, 36–37. [Google Scholar] [CrossRef] [PubMed]
- Briand, L. Odorant-Binding Proteins. 2009; pp. 2953-2957.
- Briand, L.; Eloit, C.; Nespoulous, C.; Bézirard, V.; Huet, J.C.; Henry, C.; Blon, F.; Trotier, D.; Pernollet, J.C. Evidence of an odorant-binding protein in the human olfactory mucus: location, structural characterization, and odorant-binding properties. Biochemistry 2002, 41, 7241–7252. [Google Scholar] [CrossRef]
- Chen, Y.; Getchell, M.L.; Ding, X.; Getchell, T.V. Immunolocalization of two cytochrome P450 isozymes in rat nasal chemosensory tissue. Neuroreport 1992, 3, 749–752. [Google Scholar] [CrossRef]
- Getchell, T.V.; Margolis, F.L.; Getchell, M.L. Perireceptor and receptor events in vertebrate olfaction. Progress in neurobiology 1984, 23, 317–345. [Google Scholar] [CrossRef]
- Matarazzo, V.; Zsürger, N.; Guillemot, J.C.; Clot-Faybesse, O.; Botto, J.M.; Dal Farra, C.; Crowe, M.; Demaille, J.; Vincent, J.P.; Mazella, J.; et al. Porcine odorant-binding protein selectively binds to a human olfactory receptor. Chem Senses 2002, 27, 691–701. [Google Scholar] [CrossRef] [PubMed]
- Nagashima, A.; Touhara, K. Enzymatic conversion of odorants in nasal mucus affects olfactory glomerular activation patterns and odor perception. The Journal of neuroscience : the official journal of the Society for Neuroscience 2010, 30, 16391–16398. [Google Scholar] [CrossRef]
- Pelosi, P. Odorant-binding proteins. Critical reviews in biochemistry and molecular biology 1994, 29, 199–228. [Google Scholar] [CrossRef]
- Pelosi, P. Odorant-binding proteins: structural aspects. Annals of the New York Academy of Sciences 1998, 855, 281–293. [Google Scholar] [CrossRef]
- Pevsner, J.; Hwang, P.M.; Sklar, P.B.; Venable, J.C.; Snyder, S.H. Odorant-binding protein and its mRNA are localized to lateral nasal gland implying a carrier function. Proceedings of the National Academy of Sciences of the United States of America 1988, 85, 2383–2387. [Google Scholar] [CrossRef]
- Melis, M.; Sollai, G.; Masala, C.; Pisanu, C.; Cossu, G.; Melis, M.; Sarchioto, M.; Oppo, V.; Morelli, M.; Crnjar, R.; et al. Odor Identification Performance in Idiopathic Parkinson's Disease Is Associated With Gender and the Genetic Variability of the Olfactory Binding Protein. Chem Senses 2019, 44, 311–318. [Google Scholar] [CrossRef] [PubMed]
- Melis, M.; Mastinu, M.; Sollai, G. Effect of the rs2821557 Polymorphism of the Human Kv1.3 Gene on Olfactory Function and BMI in Different Age Groups. Nutrients 2024, 16, 821. [Google Scholar] [CrossRef] [PubMed]
Figure 1.
Example of a chromatogram (A) and an aromagram (B) of palmitic (PA), oleic (OA) and linoleic (LA) fatty acids.
Figure 1.
Example of a chromatogram (A) and an aromagram (B) of palmitic (PA), oleic (OA) and linoleic (LA) fatty acids.
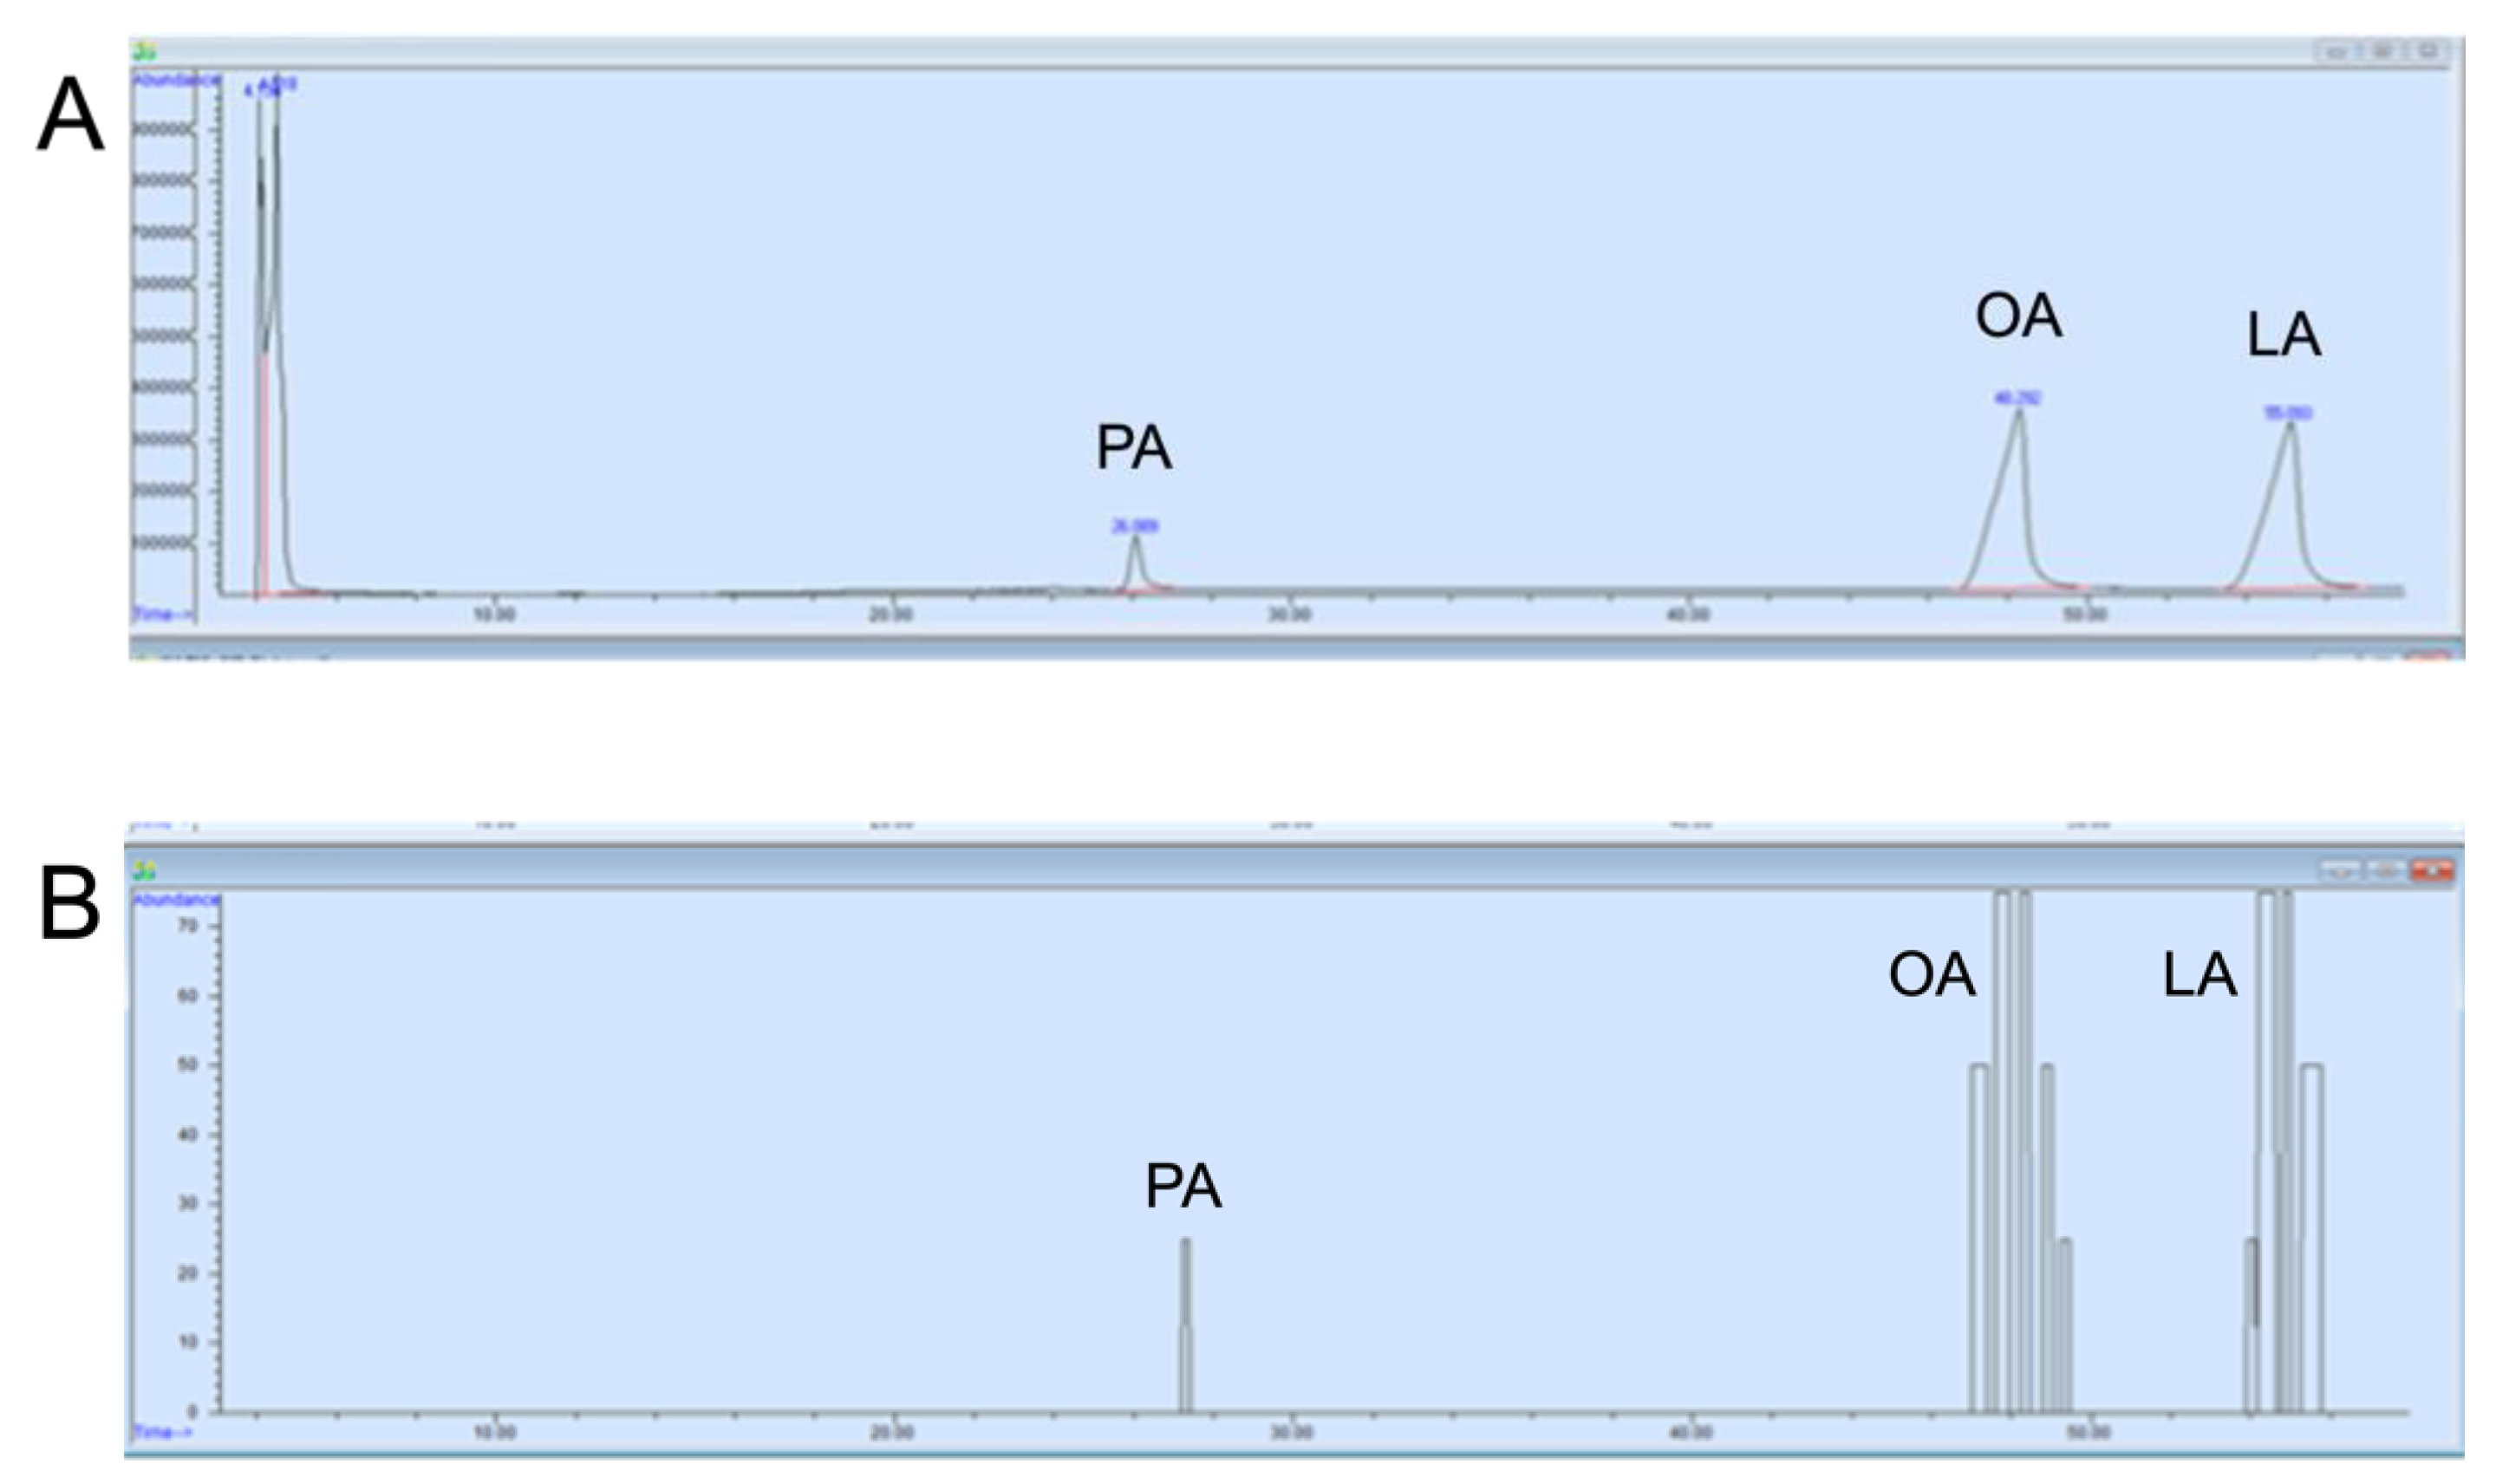
Figure 2.
Perceived intensity of fatty acids during GC-O experiments. Mean value ± SE of the intensity with which each individual perceived the odor of palmitic (PA), oleic (OA) and linoleic (LA) acids during the GC-O experiments. Different letters indicate significant differences in perceived intensity for the different FAs (p < 0.001; Fisher’s LSD test following repeated-measures ANOVA).
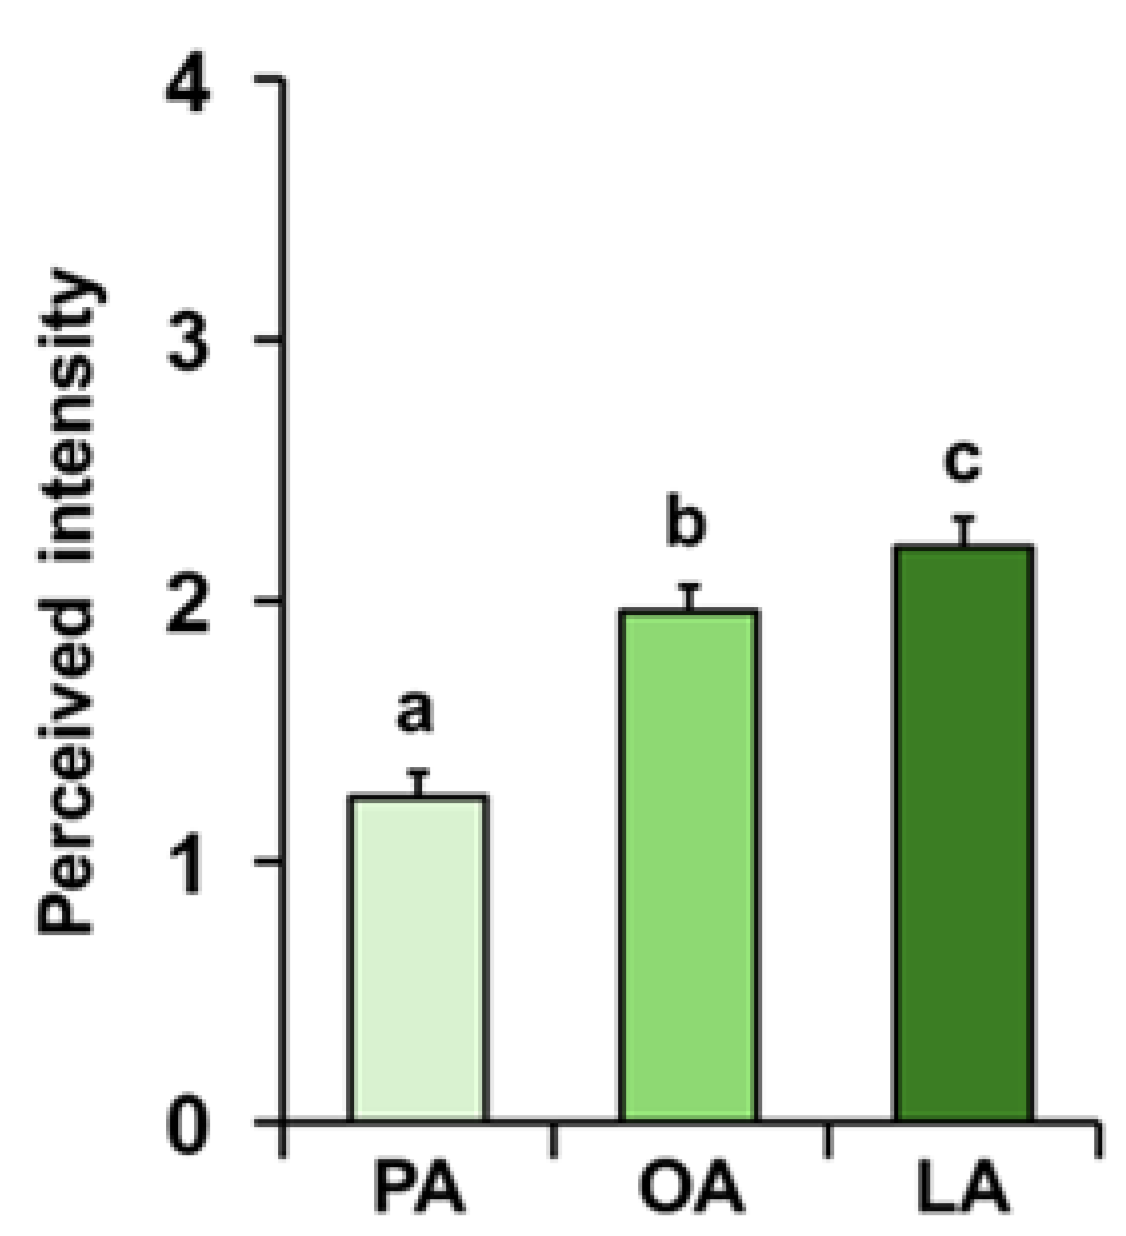
Figure 3.
Effect of the TDI olfactory status on perceived intensity of fatty acids. Mean value ± SE of the intensity with which each individual perceived the odor of palmitic (PA), oleic (OA) and linoleic (LA) acids during GC-O experiments, according to their TDI status. * indicates significant differences between individuals with normosmia or hyposmia for the same FA (p < 0.02; Fisher’s LSD test following one-way MANOVA). Different letters indicate significant differences in perceived intensity for the different FAs, within the same olfactory status (p < 0.001; Fisher’s LSD test following repeated-measures ANOVA).
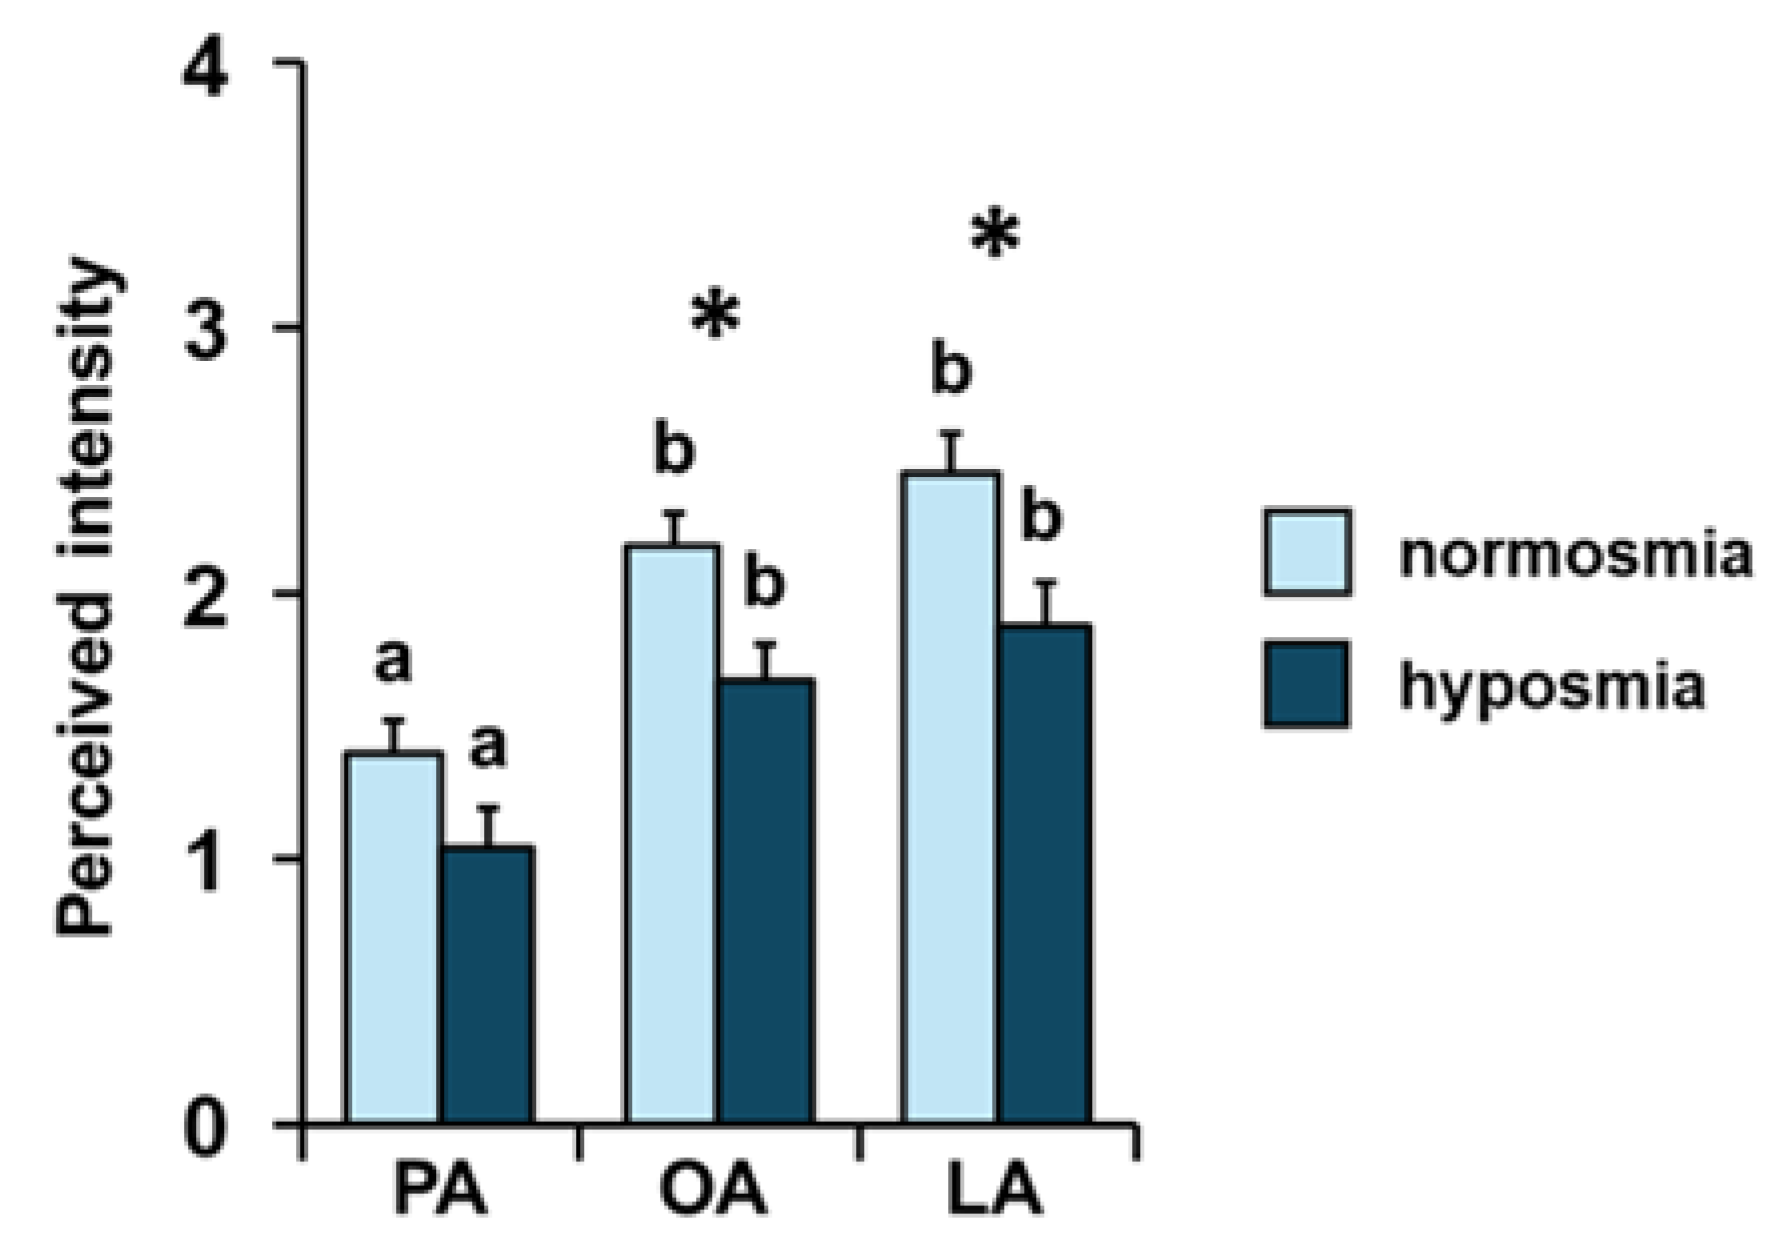
Figure 4.
Effect of the sex on perceived intensity of fatty acids. Mean value ± SE of the intensity with which each individual perceived the odor of palmitic (PA), oleic (OA) and linoleic (LA) acids during the GC-O experiments, separately in females and males. * indicates significant differences between females and males for the same FA (p = 0.029; Fisher’s LSD test following one-way MANOVA). Different letters indicate significant differences in perceived intensity for the different FAs, within the same sex (p = 0.005; Fisher’s LSD test following repeated-measures ANOVA).
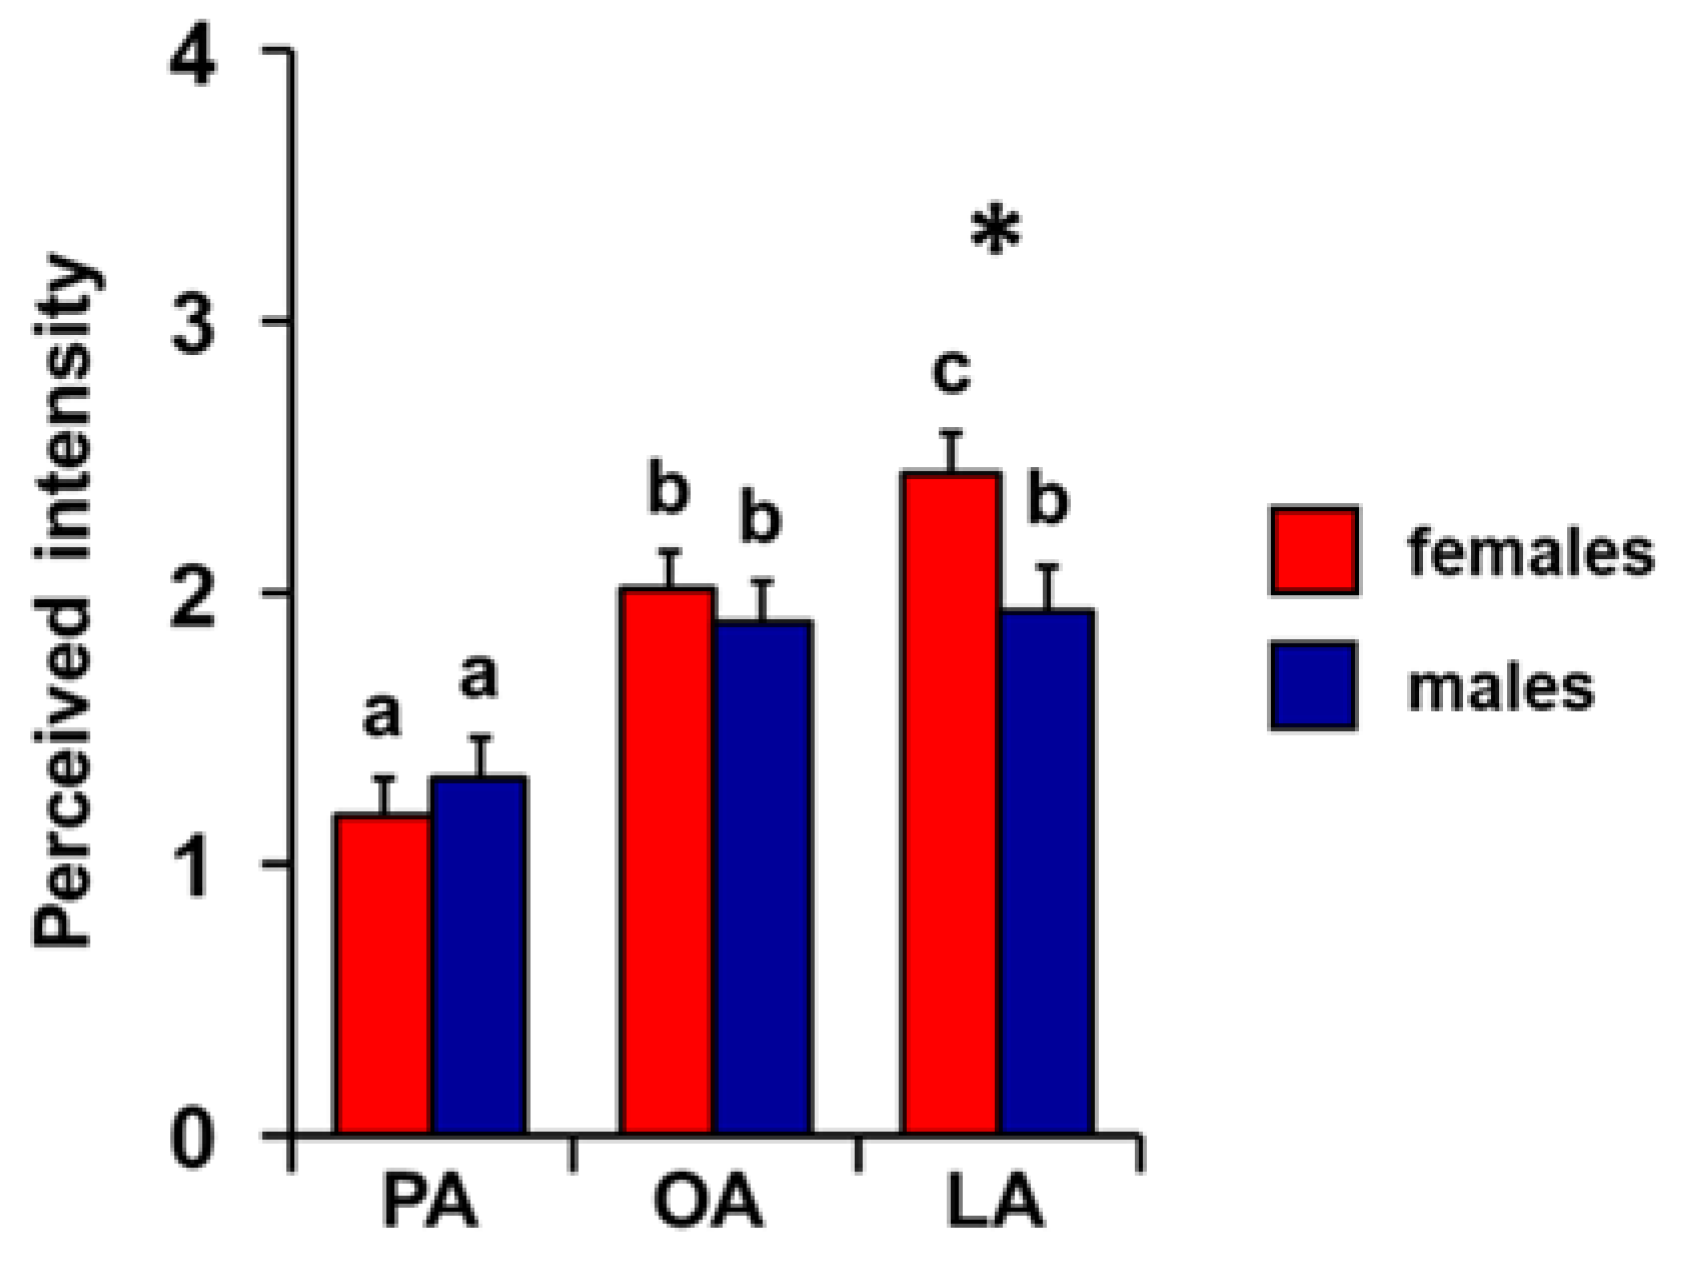
Figure 5.
Olfactory threshold of fatty acids. Mean value ± SE of the olfactory threshold of individuals towards the odor of palmitic (PA), oleic (OA) and linoleic (LA) acids. Different letters indicate significant differences for the different FAs (p < 0.0001; Fisher’s LSD test following repeated-measures ANOVA.
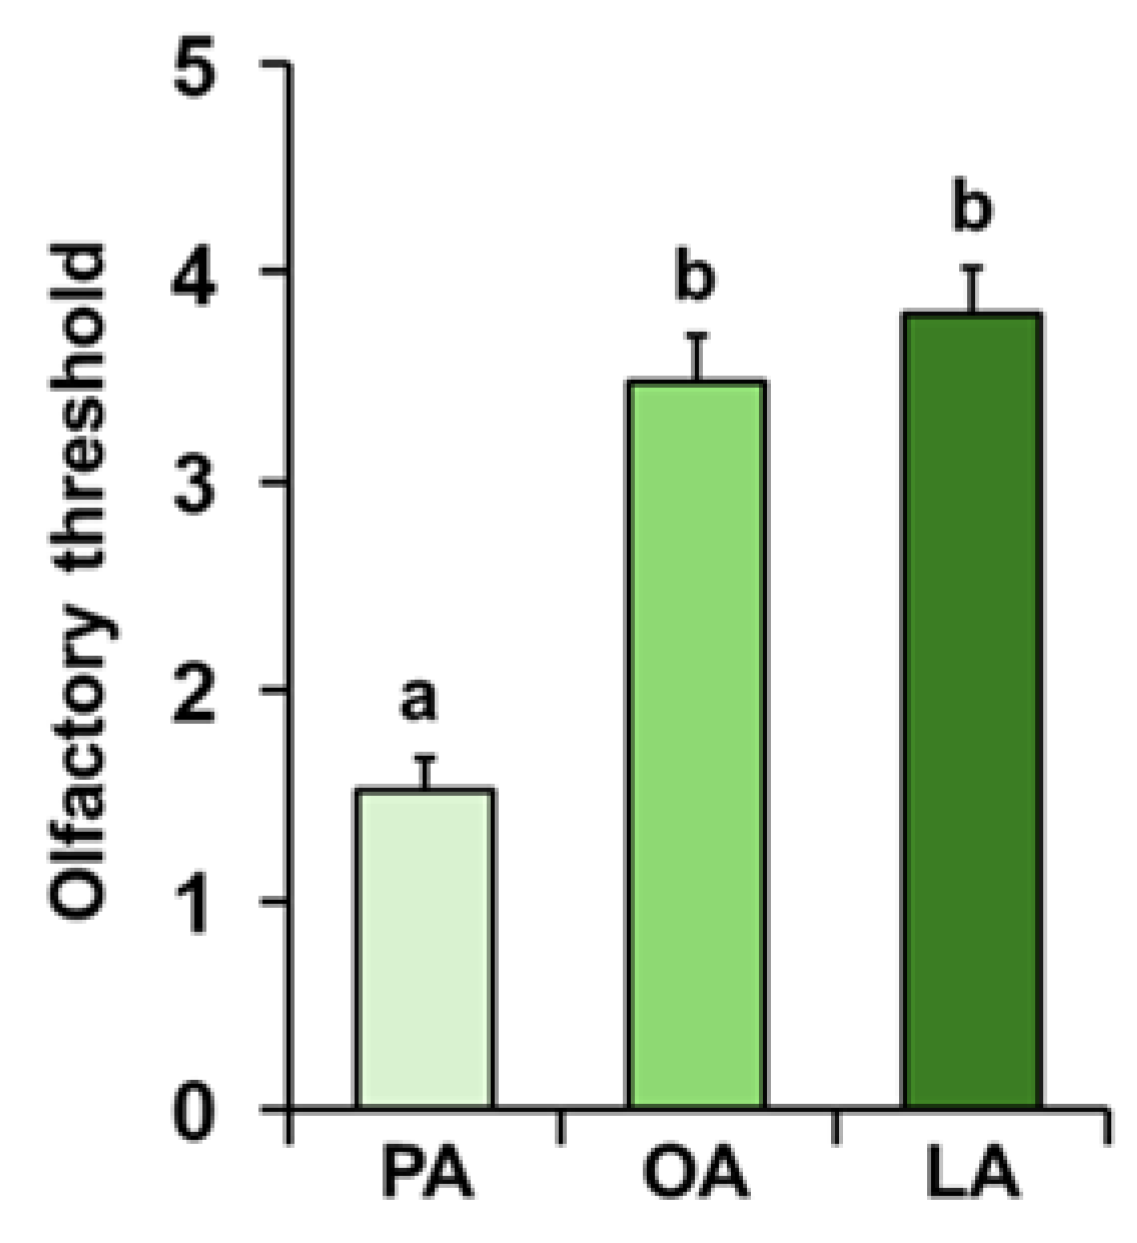

Table 1.
Distribution of subjects who perceived or not the odor of palmitic, oleic and linoleic fatty acids.
Table 1.
Distribution of subjects who perceived or not the odor of palmitic, oleic and linoleic fatty acids.
| YES | NO | p-Value | |
|---|---|---|---|
| Variable | n (%) | n (%) | |
| Palmitic acid | 55 (78.57) | 15 (21.43) | 0.001 |
| Oleic acid#break# Linoleic acid |
67 (95.71) | 3 (4.29) | |
| 66 (94.29) | 4 (5.71) |
p-Value derived by means of Fisher’s test. N = 70.
Table 2.
Distribution of females and males who perceived or not the odor of palmitic, oleic and linoleic fatty acids.
Table 2.
Distribution of females and males who perceived or not the odor of palmitic, oleic and linoleic fatty acids.
| Group | YES | NO | p-Value | |
|---|---|---|---|---|
| Variable | n (%) | n (%) | ||
| Females | Palmitic acid | 29 (76.32) | 9 (23.68) | 0.002 |
| Oleic acid | 37 (97.37) | 1 (2.63) | ||
| Linoleic acid | 37 (97.37) | 1 (2.63) | ||
| Males | Palmitic acid | 26 (81.25) | 6 (18.75) | 0.263 |
| Oleic acid | 30 (93.75) | 2 (6.25) | ||
| Linoleic acid | 29 (90.63) | 3 (9.37) |
p-Value derived by means of Fisher’s test. N = 38 females; N = 32 males.
Disclaimer/Publisher’s Note: The statements, opinions and data contained in all publications are solely those of the individual author(s) and contributor(s) and not of MDPI and/or the editor(s). MDPI and/or the editor(s) disclaim responsibility for any injury to people or property resulting from any ideas, methods, instructions or products referred to in the content. |
© 2025 by the authors. Licensee MDPI, Basel, Switzerland. This article is an open access article distributed under the terms and conditions of the Creative Commons Attribution (CC BY) license (http://creativecommons.org/licenses/by/4.0/).
Copyright: This open access article is published under a Creative Commons CC BY 4.0 license, which permit the free download, distribution, and reuse, provided that the author and preprint are cited in any reuse.


