Submitted:
19 November 2025
Posted:
20 November 2025
You are already at the latest version
Abstract
Understanding and mapping community vulnerability to hydroclimatic risks are critical prerequisites for effective flood disaster management and resilience planning. This study applies the IPCC AR5 framework to assess and map flood risk across 86 villages in the Lower Ouémé Valley (BVO), Benin, with the goal of spatializing risk levels to better inform local adaptation and decision-making. An integrated approach combining participatory diagnosis and spatial modeling was adopted. Data were collected at the community level using KoboCollect, and a set of indicators representing the three components of risk—hazard, exposure, and vulnerability were developed, normalized, and weighted according to the AR5 framework. Thematic maps were then generated in QGIS to visualize spatial variations in risk. The results indicate that approximately 72% of the villages face medium to very high levels of flood risk, reflecting significant disparities associated with flood duration, water depth, population density, and poverty index. The most affected zones require priority attention for the implementation of early warning systems and adaptive response strategies. Only 10% of the surveyed villages currently possess hydrological monitoring devices, while local risk perception remains predominantly based on indigenous knowledge. These findings emphasize the need for territorialized climate risk governance grounded in participatory and scientifically validated mapping approaches. The study proposes a replicable methodology for spatial flood risk assessment that operationalizes the IPCC AR5 conceptual framework at the local scale. Future work could enhance this approach through dynamic risk modeling and the integration of high-resolution satellite data to improve the spatial and temporal accuracy of flood risk prediction.
Keywords:
flood mapping
; AR5
; flood risk
; vulnerability
; Oueme valley
1. Introduction
Floods rank among the most devastating natural hazards, particularly in developing nations, where their impacts are both social and economic. They lead to loss of life, forced displacement of populations, and the destruction of infrastructure, homes, and agricultural land [1]. Climate change driven by global warming has altered the occurrence and magnitude of extreme hydrological events in many parts of the globe. As a consequence of climate change, both the intensity and frequency of rainfall events have increased [2]. When coupled with the rising river discharges observed across West Africa, this trend has led to more frequent occurrences of river flooding. In recent years, floods have become more common in the region. Benin has faced devastating flood incidents that caused deaths, destroyed properties, and left thousands of people homeless [1,3].
In the Lower Valley of Oueme River Basin, flooding is a recurrent phenomenon, as the area is regularly exposed to such events. Each year, floods occur with varying magnitudes and impacts. The most notable episode remains the 2010 flood, which caused a sudden and widespread rise in the water levels of major rivers and their tributaries throughout the country. This disaster severely affected approximately 680,000 people across 55 villages, leading to the displacement of about 150,000 individuals. It also destroyed more than 55,000 houses, 450 schools, and 90 health centers, while triggering outbreaks of waterborne diseases such as cholera, malaria, and diarrheal infections. The economic toll was substantial, with estimated losses of around 160 million USD, nearly 200,000 hectares of cropland devastated, and approximately 80,000 livestock lost [4].
In addition to these large-scale events, the Lower Valley of Oueme River Basin like the whole region also experiences seasonal floods caused by intense and extreme rainfall. Although these are generally less severe, they occur on a recurrent basis. Moreover, if current trends in climate change persist, combined with the growing population settling in flood-prone areas, ongoing deforestation, the disappearance of wetlands, and the rising mean sea level, catastrophic floods are expected to become more frequent in the coming decades [4].
Considering the substantial social, economic, and environmental impacts of flooding, accurately identifying villages exposed to high flood risk is essential for the design and implementation of well-targeted interventions during flood crises. In recent years, flood risk assessments within the Oueme catchment have increasingly utilized Geographic Information Systems (GIS) and multi-criteria analysis to improve the spatial delineation and prioritization of flood-prone areas [4,5,6,7]. These integrative approaches combine hydrological parameters, socio-economic vulnerability indicators, and exposure factors to generate comprehensive flood risk maps. Findings from recent studies within the Oueme floodplain reveal that approximately 21.5% of the lower valley is classified as being at high or very high flood risk, with the southern parts of the basin most severely affected [4,6]. However, despite these advances, a significant research gap persists: most existing studies have concentrated on flood risk mapping at the municipal scale, often neglecting detailed assessments of flood vulnerability and composite flood risk at the village level across the entire Oueme River Basin.
A combination of factors including inadequate infrastructure, limited resources for disaster preparedness and response, and high population density in flood-prone areas, often amplifies the destructive potential of floods across various localities leading to severe human, economic, and environmental losses [8]. Previous studies suggest that effective adaptation to flood hazards requires the identification of vulnerable communities, an understanding of the factors contributing to their susceptibility, and an assessment of their resilience capacities to mitigate adverse outcomes. Furthermore, the analysis of vulnerability and resilience has been instrumental in advancing hazard research and has played a pivotal role in shaping more effective disaster management and risk reduction strategies [8,9].
In response, successive Beninese governments, together with their development partners (Deutsche Gesellschaft für Internationale Zusammenarbeit(GIZ)), have in recent decades progressively integrated the concepts of vulnerability, risk, and resilience [10,11] into policy frameworks and intervention programs aimed at strengthening preparedness and enhancing the adaptive capacity of rural communities facing escalating flood risks [3]. In this context, assessing the vulnerability and resilience of Beninese households to flooding is essential for designing context-specific disaster management strategies and improving preparedness within flood-prone rural areas.
As studies on flood vulnerability and risk assessment have evolved, hazard researchers have increasingly advocated for the integration of social vulnerability parameters into comprehensive frameworks for flood risk assessment and management. Most of these studies have relied on traditional index-based approaches, in which vulnerability factors are assigned weights and subsequently aggregated according to criteria derived from existing literature or expert judgment. In some cases, researchers have employed more advanced data aggregation techniques to compute composite risk indices, integrating feedback from stakeholders to refine the weighting of variables. Despite these methodological advances, there remains a notable gap in the literature regarding the use of IPPC AR5 methodology in vulnerability and risk assessment.
To date, no detailed study has been conducted to assess integrated flood risk at the village scale within the Ouémé River Basin. In light of this gap, the present study aims to evaluate the integrated flood risk in the Lower Ouémé River Valley by applying the IPCC AR5 risk framework. The main objective is to develop a robust and credible approach for assessing flood vulnerability and risk at the village level, thereby enabling more precise and context-specific intervention strategies.
2. Materials and Methods
2.1. Study Area
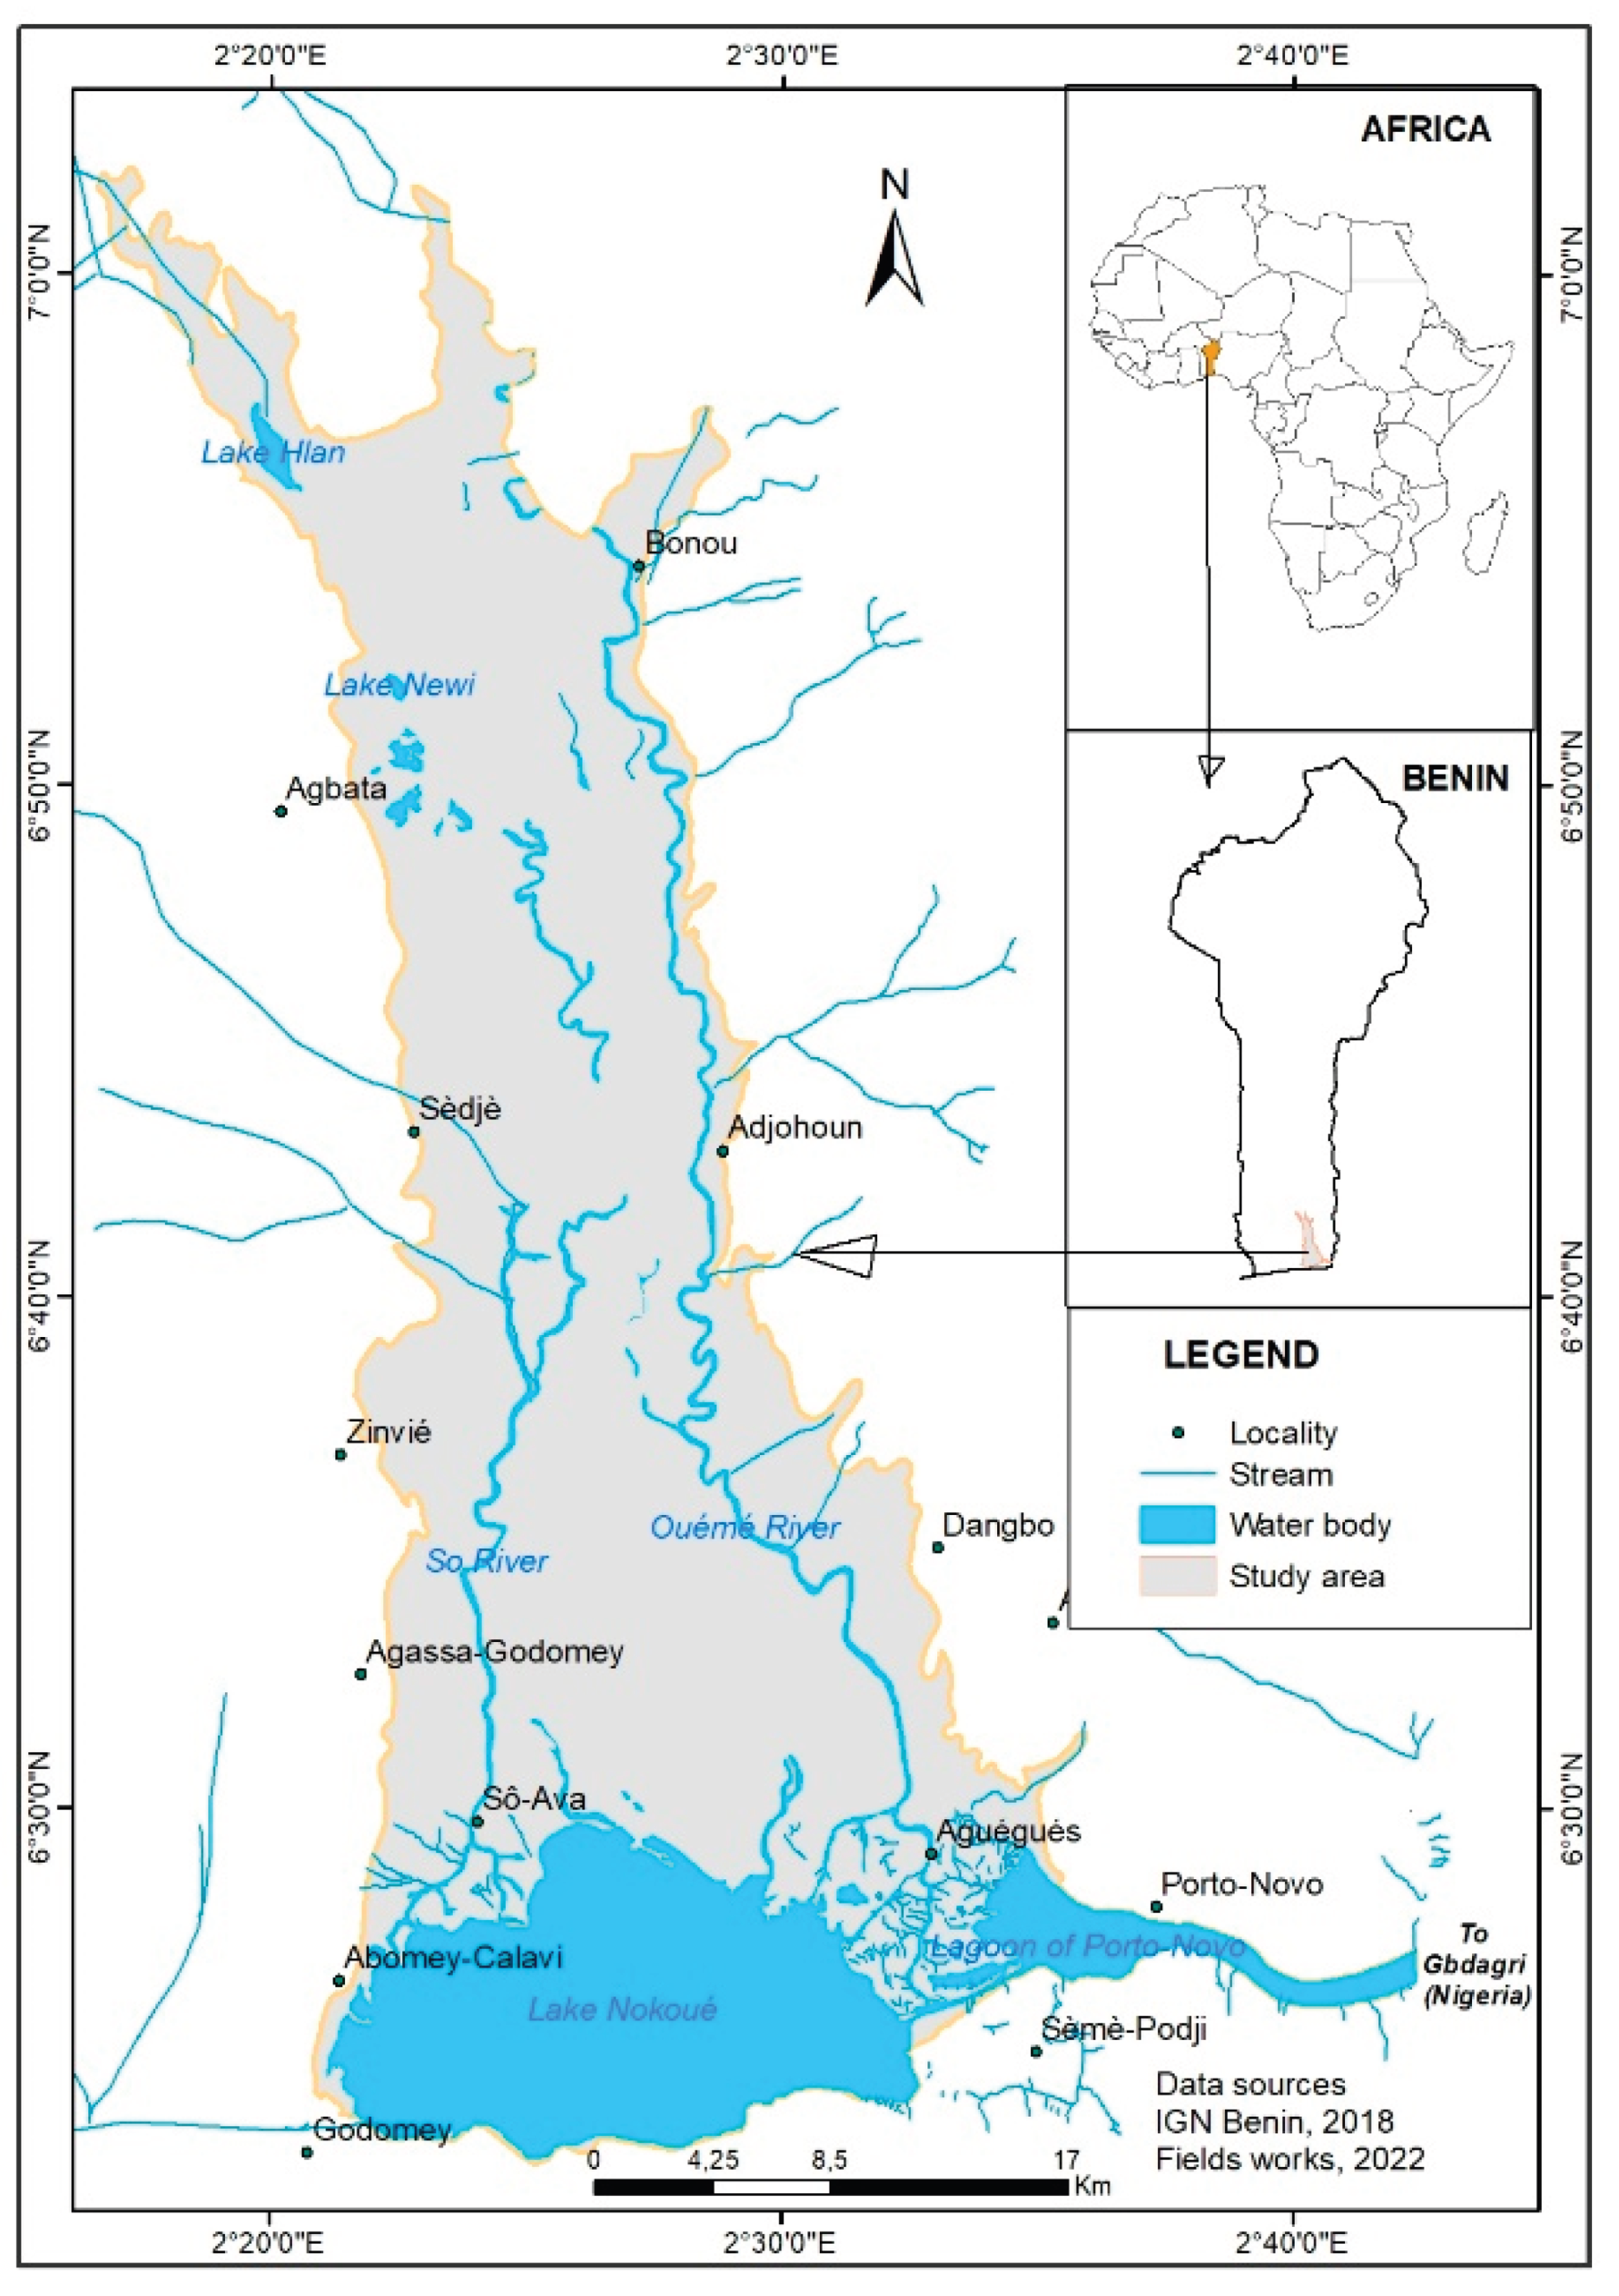
The present study was carried out in the lower Ouémé valley in Benin, West Africa. The Ouémé River basin is located between latitudes of - and longitudes - (1) and is relatively flat [3,12]. It spans from the source of the Ouémé River in the Tanéka mountains in northern Benin to the Atlantic Ocean (South Benin). With a drainage area of almost 50,000 , it covers 41.14% of Benin’s total area [12]. In the southern part of the basin, the Oueme River expands into a vast floodplain covering approximately 1,200 , forming what is known as the Oueme Delta. This delta is made up of two main rivers: the Oueme and the Sô which both serve as major tributaries to Lake Nokoué, the largest water body in Benin, with an area of about 150 km² during low-water periods[13]. The delta system is hydrologically connected to the Atlantic Ocean through the Cotonou and Porto-Novo lagoons.
The Oueme Delta is characterized by a relatively flat topography, with an elevation difference of approximately 20 meters from south to north, which facilitates the lateral spreading of watercourses, as well as processes of erosion and siltation[4]. The Ouémé River itself exhibits a very gentle slope—only about 5 meters of elevation change over 85 kilometers within the floodplain from north to south [13] and in certain sections, the gradient decreases to just a few centimeters per kilometer. This low lying terrain is highly favorable for agricultural activities; however, it also poses significant challenges for drainage during the rainy season, thereby increasing the vulnerability of local communities to flooding.
The seasonal migration of the Intertropical Convergence Zone (ITCZ) governs the rainfall pattern across Benin. In the southern part of the country, this dynamic results in two distinct rainy seasons: a major one from April to July, linked to the northward movement of the ITCZ, and a shorter one from September to November, associated with its southward retreat. Conversely, northern Benin, where the ITCZ remains quasi-stationary around August, experiences a single, continuous rainy season[4]. These rainfall regimes are vital for recharging the aquifers that sustain the Ouémé River at its source [4,14]. Mean annual precipitation is estimated at about 1,300 mm in the headwaters and increases to approximately 1,500 mm across the floodplain [13]. The spatio-temporal variability of rainfall induces high river discharges between August and November, often triggering floods around Lake Nokoué and its surrounding watersheds. During this period, the Ouémé River experiences substantial rises in water levels, with flow rates ranging from a few tens of cubic meters per second during low-flow periods to over 1,000 m³/s during peak floods [4,14,15].
Figure 1.
Geographical position of Lower Valley of Oueme River Basin [16].
Figure 1.
Geographical position of Lower Valley of Oueme River Basin [16].
The Ouémé Delta encompasses 18 communes, including three urban and fifteen rural ones. Its total population is estimated at approximately 3,560,089 inhabitants, comprising 1,730,164 men and 1,829,925 women [17]. The region hosts cosmopolitan communities, particularly in urban centers. The principal indigenous ethnic groups are the Aïzo and the Toffinnu - literally translated as “people of the water” — who are mainly settled around the Sô River and Lake Nokoué. In contrast, the Xémè are predominantly concentrated along the Oueme River and around the Porto-Novo Lagoon [17].
Agriculture constitutes the primary livelihood activity in the Oueme Delta, engaging over 90% of the population and representing more than one-third of Benin’s farming households [17]. Rainfall plays a decisive role in the success of agricultural production in the delta, where only about 4.36% of arable land is irrigated. Nevertheless, off-season cultivation remains significant in irrigated zones, particularly given the occurrence of annual floods lasting approximately two to four months. In addition to crop farming, about 11% of the delta’s inhabitants engage in traditional fishing, while livestock rearing is generally practiced on a small domestic scale [17]. The spatial distribution of economic activities follows a clear pattern: populations living near rivers predominantly depend on fishing, whereas those in the plains focus mainly on agricultural production.
Each year, communities in the Oueme Delta are exposed to seasonal flooding that typically occurs between August and October. While this annual flow provides significant benefits derived from the wetlands such as fertile soils, fishing opportunities, and water availability; the recurrent nature of floods increasingly limits the sustainable enjoyment of these advantages. This study, therefore, aims to assess integrated flood risk at the village scale within the Oueme Delta, with particular attention to the implications of these recurring flood events.
2.2. Methods
2.2.1. Data Collection
In this study, Community-level data were collected through field surveys using the KoboCollect mobile platform, enabling the systematic capture of socio-economic, demographic, and environmental information from local households.
First, a list of 89 regularly flooded villages within the Ouémé Delta was obtained from the Benin Agency of Civil Protection. In each selected village, focus group discussions (FGDs) were organized to gather qualitative insights on community experiences with flooding and local coping mechanisms. To ensure the representativeness of different socio-professional groups within the community, participants were purposefully selected to include two representatives each from key stakeholder categories namely farmers, fishers, livestock breeders, women engaged in agricultural processing, elders, merchants, artisans, youth, local non-governmental organizations (NGOs), and local authorities. This participatory approach allowed for the collection of diverse perspectives on flood impacts, vulnerability factors, and community-based adaptation practices.
Secondly, following each focus group discussion, field visits were conducted within the respective villages to collect the geographical coordinates of flood impact zones and to document visible evidence of flood damage, such as debris deposits, erosion marks, and damaged infrastructure. These observations were georeferenced using handheld Global Positioning System (GPS Garmin 62s) devices to support the spatial analysis of flood extent and intensity across the Oueme Delta.
Finally, individual interviews were conducted using the snowball sampling technique [18] to capture personal experiences related to flood impacts and the indigenous adaptation strategies developed by community members. These interviews also served to triangulate and validate the information gathered during the focus group discussions. In addition, respondents were invited to share their perceptions of the effectiveness of the National Flood Early Warning System and to evaluate the forms of governmental assistance they had received during past flood events. This complementary qualitative approach enriched the understanding of local adaptive responses and institutional support mechanisms in the Oueme Delta. The sample size was determined using Cochran’s formula, which accounts for factors such as population size, margin of error, and confidence level. This equation, widely applied in social and environmental research, is used to estimate the required sample size (N) for a desired level of precision when dealing with proportions [19]. It is expressed as follows:
where N is the sample size for an infinite population, Z represents the standard normal deviation corresponding to the desired confidence level (e.g., for ), P is the estimated proportion of the population possessing the attribute of interest (), and E denotes the acceptable margin of error ().
By applying this formula, the theoretical sample size was estimated at 385 individuals to be interviewed. In social science research, a sample size within the range of 384 to 400 respondents is generally considered adequate for large populations when using a 95% confidence level and a 5% margin of error. This range ensures a statistically reliable representation of the target population while maintaining practical feasibility in field data collection [19]. The final sample size was determined by applying proportionality coefficients () to the theoretical sample size previously estimated at 384 individuals. These coefficients were obtained using the Equation 2.
where is the number of villages in each commune and V represents the total number of villages (89) concerned by this study.
This adjustment ensured that the number of respondents selected from each village reflected its relative population size within the total population of the 89 regularly flooded villages. The proportionality-based allocation is expressed as follows:
where is the number of respondents selected from each village; represents the proportionality coefficient of each commune; N is the theoretical sample size estimated at 385 and the number of villages in each commune.
After applying Equations (1), (2) and (3), the minimum number of respondents per village was estimated at 4.32, which was rounded up to 5 respondents per village. Accordingly, the final sample size consisted of 445 respondents across all 89 villages included in the study. Table 1 presents the distribution of respondents by commune, along with the corresponding number of villages surveyed and participants interviewed in each.
In summary, the data used in this study were collected through 89 focus group discussions and 445 individual interviews conducted across the study area. The field survey took place between July and August 2024, encompassing both the qualitative and quantitative components of data collection.
2.2.2. Description of the Impact Chain
To analyze the level of flood risk faced by villages affected by the overflow of the Ouémé River, the impact chain was first defined, followed by the identification of the factors considered in the risk assessment. Relevant factors were selected to represent each component of the impact chain. For instance, adaptation and survival strategies during flood crises and access to information were identified as key factors for assessing the adaptive capacity component. These factors were subsequently operationalized through measurable indicators. In the above example, the number of survival and adaptation strategies reported in each village was used as an indicator to evaluate the adaptive capacity of that village.
The concept of risk difined in IPCC AR5, refers to the set of potential consequences related to climate (i.e., climate impacts or effects) on elements of value such as resources, human populations, ecosystems, and cultural assets [11]. In this study, a flood risk refers to the set of potential consequences associated with flooding on elements of value such as human lives, infrastructure, ecosystems, and economic or cultural assets. It represents the likelihood and magnitude of adverse impacts resulting from the interaction between flood hazards and the exposure and vulnerability of affected systems. Typically, any given area or community is subject to multiple types of flood risks, depending on the intensity, frequency, and spatial extent of flood events. Thus, flood risk is conceptualized as a function of three interrelated components hazard (Danger), exposure and vulnerability (Equation 4) which together determine the potential magnitude and likelihood of adverse flood impacts.
According to the IPCC AR5 methodology ([11]), a Hazard (Danger) refers to a specific threat to a given socio-ecological system or its components (i.e., the exposed elements). A hazard may take the form of a climatic event, such as heavy rainfall, or a direct physical impact, such as flooding. Whenever possible, the probability of occurrence of a specific hazardous event or trend should be estimated. In this context, hazards can be defined as critical climatic events or physical impacts—for example, extreme rainfall, extreme temperatures, or severe flooding. In this study, three main elements were considered as flood hazards. These include the maximum water levels observed in the villages during flood events caused by the overflow of the Ouémé River, the average duration of flooding in each village, and the number of flood occurrences recorded over the past ten years (Table 2).
In the IPCC AR5, the term "Exposure" refers to specific elements (or elements at risk) that are subject to potential harm such as people, infrastructure, or ecosystems [11]. The degree of exposure can be expressed in absolute numbers, densities, or proportions of these elements at risk; for instance, the population density within an area affected by flooding. In this study, the exposure component included several elements such as the population density of the village, the extent of flooded farmlands, the number of houses destroyed, and the roads, health centers, and schools rendered inaccessible during flood events (Table 3).
Also in the IPCC AR5, "Vulnerability" refers to the inherent characteristics of exposed elements and the systems in which they are embedded (e.g., the vulnerability of populations and their immediate environment in a village located within a flood-prone area) that can increase or, in some cases, reduce the potential consequences of a specific climatic hazard. Vulnerability comprises two key dimensions: Sensitivity and Capacity.
- Sensitivity is determined by factors that directly influence the consequences of a hazard. It may include the physical attributes of a system (e.g., the construction materials of houses or the type of soil used for agriculture) as well as its social, economic, and cultural attributes (e.g., income structure, age distribution, or education level). In this study, the sensitivity indicator was developed based on both natural and socioeconomic parameters, including: (i) the distance from the village center to the main river, (ii) the Strahler stream order, (iii) population density, (iv) the number of water entry points into the village, and (v) the poverty index. Based on expert judgment, these parameters were assigned weights of 30%, 30%, 15%, 15%, and 10%, respectively, to compute a composite indicator used to assess the degree of sensitivity of each village.. (Table 4).
-
Capacity, in the context of climate risk assessment, refers to the ability of societies and communities to prepare for and respond to current and future climate impacts. It consists of two interrelated components:
- -
- Coping capacity: the ability of individuals, institutions, organizations, and systems to respond effectively to and recover from adverse situations in the short to medium term, drawing upon their skills, values, beliefs, resources, and available opportunities (e.g., the establishment of early warning systems). In the present study, the existence and effective implementation of a contingency plan during flood crises, as well as the presence or absence of water level monitoring markers, were considered as key adaptive capacity indicators (Table 5).
- -
- Adaptive capacity: the ability of systems, institutions, humans, and other organisms to adjust to potential damage, take advantage of opportunities, or respond to consequences. In this study, the actions undertaken before and during flood periods, as reported during the interviews, were used to assess the adaptive capacity of the populations in the surveyed villages (Table 6).
2.2.3. Flood Risk Assessment
- Normalization of Indicators
The normalization of indicators was carried out using the following formula (Equation5), in which a maximum weight of 1 is assigned to the highest raw value of the indicator (), while a minimum weight of 0 is assigned to the lowest raw value of the indicator ().
where represents the normalized value of indicator . This transformation scales all indicator values between 0 and 1, facilitating their comparison and integration into the composite risk index.
- Weighting and Aggregation of Indicators
The weighting of indicators was performed using the budget allocation method, also known as the “pebble method.” This approach is considered semi-objective, as it relies on expert judgment to assign relative importance to each indicator. In practice, a total of ten pebbles was distributed among the indicators according to their perceived significance, with a higher number of pebbles representing greater importance. The aggregation of indicators followed the Weighted Arithmetic Aggregation method, as recommended in the Vulnerability Assessment Reference Guide [10]. This method is widely used due to its simplicity, transparency, and ease of interpretation. To calculate the composite indicator () for each component of risk, the individual indicators were multiplied by their respective weights, summed, and then divided by the total sum of all weights, as expressed in the following formula (Equation 6):
In this formula, represents the composite indicator, such as sensitivity; I denotes an individual indicator of a risk component, for example, the distance of the village from the river; and W corresponds to the weight assigned to that indicator.
The maximum normalized values of the hazard indicators for each village particularly those related to maximum observed water levels and flood duration were considered representative of the hazard (or danger) component for the respective village. The average of these indicators was used, reflecting the nature of these variables, which capture the peak intensity of flooding within each locality.
- Computation of Vulnerability Indicators
For the vulnerability component, a weighted average of the corresponding indicators was calculated and taken as representative of the sensitivity subcomponent. Indeed, the two quantified sensitivity indicators namely, the distance of the village from the main river and the number of water entry points contribute to vulnerability at different degrees of influence.
The average of the indicators representing the subcomponents coping capacity and adaptive capacity was calculated and considered as representative of the overall adaptive capacity component.
Vulnerability indicator was then derived by combining sensitivity and adaptive capacity (Equation 7). It is important to note that these two components exert opposite effects on vulnerability: an increase in sensitivity leads to higher vulnerability, whereas an increase in adaptive capacity contributes to reducing it.
- Computation of Risk Indicators
The flood risk indicator was carried out using the weighted arithmetic mean to combine the three components of risk. Accordingly, the following formula was applied:
where W is the weighting coefficient assigned to each risk component. The risk levels were then categorized based on their metric values ranging from 0 to 1, which were subsequently transformed into categorical values on a five-level scale (1 to 5) to facilitate interpretation and description of the different levels of flood risk (Table 7).
3. Results
3.1. Characteristics of the Interviewed Population
This section presents the socio-demographic characteristics of the interviewed population, including variables such as age, gender, occupation, education level, and household size. Table 8 presents the indicator dictionary used for the village-level flood risk survey. It lists and defines all parameters measured during data collection, including demographic, socioeconomic, and flood-impact variables. Each indicator describes a specific aspect of household vulnerability, exposure, preparedness, and response ranging from basic characteristics (e.g., household size, literacy rate) to flood related factors (e.g., flood depth, duration, damage, assistance received). This table ensures clarity and consistency in interpreting the survey data. Table 10 summarizes the key findings of the village-level social survey on flood risk across communes. The results show significant variability in socioeconomic conditions and exposure to floods. Most households rely on agriculture and experience high poverty and illiteracy rates, particularly in Aguégués, Sô-Ava, and Adjohoun. The average household size ranges from four to six members, reflecting the relatively large family structures typical of rural communities. The average age of respondents varies between 33 and 55 years, indicating a predominantly active working population. The median distance to the nearest river ranges from 50 to 500 meters, while flood depths (100–250 cm) and durations (up to 90 days) differ across communes, often resulting in recurrent damage to houses, crops, and livestock. Access to early warning systems and protective measures remains limited in many villages, although some households reported receiving assistance and community support. Overall, the socioeconomic survey highlights significant disparities in vulnerability and adaptive capacity among villages and communes within the study area.
3.2. Level of Flood Hazard and Sensitivity Across Villages
The Figure 2a–c show the spatial distribution of villages according to the degree of flood hazard resulting from the overflow of the Ouémé River and its tributaries. The hazard indicators were calculated after normalizing the maximum water levels observed during flood periods and the duration of inundation in each village. The results indicate that 21 villages have a very high degree of exposure to floods, 22 villages are highly exposed, 24 villages are moderately exposed, and 19 villages are slightly exposed. It should be noted that more than 75.3% of the surveyed villages have an exposure level ranging from moderate to very high. (Table 9).

Table 9.
Categorization of Risk Levels.
| Hazard level | Indicator | Number of villages |
|---|---|---|
| Very Low | 0.0 - 0.40 | 3 |
| Low | 0.41 – 0.56 | 19 |
| Moderate | 0.57 – 0.70 | 24 |
| High | 0.71 – 0.80 | 22 |
| Very High | 0.81 – 1.00 | 21 |
| Total | – | 89 |
Table 10.
Village-level social survey summary on flood risk by commune.
| Paramètres | Abomey -Calavi |
Adjo -houn |
Agué -gués |
Bonou | Dangbo | Ouinhi | S`emè -Kpodji |
Sô -Ava |
Toffo | Zagna -nado |
Zê | Zogbo -domey |
Total |
|---|---|---|---|---|---|---|---|---|---|---|---|---|---|
| Villages (N) | 1 | 7 | 10 | 6 | 8 | 6 | 3 | 17 | 5 | 12 | 5 | 9 | 89 |
| Respondents (N) | 5 | 35 | 50 | 30 | 40 | 30 | 15 | 85 | 25 | 60 | 25 | 45 | 445 |
| Women (%) | 20 | 35.6 | 48.3 | 36.4 | 26 | 36.8 | 44.0 | 38.0 | 41.0 | 32.0 | 38.0 | 46.0 | - |
| Average Age (years) | 32.6 | 45.7 | 46.5 | 33.8 | 35.6 | 41.5 | 39.3 | 55.2 | 46.3 | 52.1 | 48.2 | 46.1 | - |
| Median HH Size | 4 | 6.2 | 5.3 | 5.6 | 5.2 | 5.5 | 6.2 | 5.3 | 4.8 | 6.2 | 5.8 | 6.4 | - |
| Poverty Index (%) | 43 | 57 | 50 | 50 | 50 | 96 | 50 | 43 | 43 | 96 | 96 | 96 | - |
| Illiteracy Rate (%) | 80 | 85 | 75.1 | 83.7 | 5 | 70.50 | 85.0 | 73.0 | 84.0 | 82.0 | 88.0 | 86.0 | - |
| Farming HH (%) | 100 | 100 | 100 | 100 | 100 | 100 | 100 | 100 | 100 | 100 | 100 | 100 | - |
| Distance to River (m) | 150 | 120 | 30 | 100 | 150 | 150 | 100 | 50 | 500 | 200 | 300 | 400 | - |
| Flood Depth 2024 (cm) | 250 | 200 | 200 | 150 | 6 | 150 | 200 | 150 | 50 | 200 | 200 | 150 | - |
| Flood Duration (days) | 120 | 90 | 90 | 90 | 90 | 90 | 90 | 90 | 30 | 90 | 90 | 90 | - |
| Access to EWS (%) | 20 | 37.1 | 36.0 | 26.7 | 17.5 | 13.3 | 24 | 22.35 | 0.0 | 11.1 | 24 | 15.5 | - |
| Warned Before Last Flood (%) | 20 | 22.8 | 28.0 | 36.0 | 30.0 | 40.0 | 20.0 | 41.2 | 16.0 | 33.3 | 20.0 | 22.2 | - |
| Houses Damaged (%) | 60.0 | 42.8 | 40.0 | 37 | 37.5 | 33.3 | 46.7 | 41.2 | 0.0 | 46.7 | 20.0 | 11.1 | - |
| Crops Lost (%) | 100 | 100 | 100 | 100 | 100 | 100 | 100 | 100 | 100 | 100 | 100 | 100 | - |
| Livestock Lost (%) | 100 | 85.7 | 80.0 | 83.3 | 75.5 | 83.3 | 33.3 | 100 | 0.0 | 50.0 | 40.0 | 11.1 | - |
| Water Contamination (%) | 80.0 | 80.0 | 76.0 | 67.0 | 70.0 | 100 | 53.3 | 82.3 | 40.0 | 50.0 | 48.0 | 55.5 | - |
| HH Protection Measures (%) | 100 | 85.7 | 100 | 93.3 | 100 | 100 | 80.0 | 100 | 60.0 | 83.3 | 80.0 | 77.8 | - |
| Assistance received (%) | 60 | 28.6 | 50.0 | 20.0 | 25.0 | 17.0 | 33.3 | 41.2 | 0.0 | 50.0 | 20.0 | 27.0 | - |
In addition, after computing the composite indicator used to of the degree of sensitivity of each village, it has been found out that 20 villages fall within the very high sensitivity class and 17 within the high sensitivity class, indicating that a large proportion of villages are highly susceptible to flood impacts. In contrast, only 14 villages are classified as very low sensitivity, while 19 are low and another 19 moderate, reflecting spatial disparities in vulnerability linked to proximity to rivers, topography, and socioeconomic conditions (Table 11). The Figure 2d–f show the spatial distribution of villages according to the degree of their sensitivity to flooding by the overflow of the Ouémé River and its tributaries.
3.3. Level of Adaptation and Vulnerability to Flooding
The average level of adaptation was calculated as the simple mean of two key indicators: the index of mechanisms and the actions undertaken before and during flood periods. This adaptive capacity reflects the degree of preparedness of residents in each village to cope with the adverse effects of flooding. In this regard, the village of Tohouès stands out as the most capable of managing and responding effectively to flood impacts. Conversely, 60 villages were identified as having low to very low adaptive mechanisms, indicating limited preparedness and a higher susceptibility to flood-related damages (Table 12). The Figure 3a–c illustrate the spatial distribution of villages according to their degree of adaptive capacity to flooding caused by the overflow of the Ouémé River and its tributaries.
In addition, the vulnerability indices of the villages were determined by calculating the complementary average of the adaptation capacity indices (1 – adaptive capacity) and the potential impact indices. These vulnerability indices provide a quantitative measure that characterizes the susceptibility of each village to flood hazards. The analysis reveals that 25 villages are highly predisposed to experience severe flood-related damage due to their high vulnerability scores. In contrast, only 10 villages show lower levels of vulnerability, suggesting relatively greater resilience to flood impacts compared to the others (Table 13). This variation highlights the uneven spatial distribution of vulnerability within the study area, reflecting differences in exposure, adaptive capacity, and socioeconomic conditions among the villages.
In summary, the analysis of village adaptation and vulnerability levels to flooding shows significant disparities in preparedness and exposure. The vulnerability index, reveals that 28% of the villages are highly vulnerable to severe flood damage, whereas 11.2% relatively low vulnerability. Overall, these results highlight the uneven spatial distribution of vulnerability across the study area and the urgent need to strengthen adaptive capacities in the most flood-prone communities. The Figure 3d–f illustrate the spatial distribution of villages according to their level of vulnerability to flooding caused by the overflow of the Ouémé River and its tributaries.
3.4. Level of Risk to Flooding
The flood risk indices of the villages were computed by averaging the hazard, vulnerability, and exposure indices. These composite indices provide a quantitative representation of the overall flood risk profile of each village. Table 14 presents the classification of villages according to their flood risk levels based on the calculated indicators. The results reveal that the majority of villages fall within the high and moderate risk categories, comprising 40 and 25 villages respectively, which indicates that a substantial portion of the study area is highly exposed to flood hazards. In contrast, only about 15% of the villages (5 classified as very low and 9 as low) show reduced flood risk levels, while 10 villages fall into the very high risk category, representing the most critical zones where flood impacts are likely to be most severe. Overall, the spatial distribution demonstrates a predominance of elevated flood risk across the region, primarily driven by variations in exposure, vulnerability, and adaptive capacity among villages. This highlights the urgent need for targeted adaptation and mitigation measures to enhance the resilience of the most vulnerable communities. The Figure 4a–c illustrate the spatial distribution of villages according to their level of Flood risk caused by the overflow of the Ouémé River and its tributaries.
In summary, the application of the proposed methodology for assessing flood risk levels in the Lower Ouémé River Basin revealed that both social vulnerability and overall flood risk are extremely high across the surveyed area. Among the 89 villages analyzed, several recorded risk index values approaching the maximum threshold of 1, indicating a critical level of exposure and limited adaptive capacity. This implies that approximately 57% of the population affected by floodwaters is likely to experience severe damage in the event of a dam failure or major overflow. These findings underscore the high susceptibility of communities in the Lower Ouémé Valley and the urgent need for proactive risk management and adaptation strategies to reduce potential flood impacts.
4. Discussion
Promoting a culture of prevention is fundamental to reducing the impacts of disasters, safeguarding livelihoods, and, above all, protecting human lives [20,21]. Achieving this objective requires a comprehensive and systematic assessment of the multiple dimensions of risk within a given territory. In this study, particular attention is given to the social dimension of flood risk at the community level. The proposed methodology integrates the components of hazard, sensitivity, adaptive capacity, and vulnerability in line with the AR5 IPCC framework for risk analysis. Flood risk was assessed not only by considering the physical aspects of flooding—such as water-level rise and inundation extent, but also by evaluating the potential impacts on populations and critical infrastructure [21]. This integrated approach, based on composite risk indices, provides standardized and comparable results that support all stages of the disaster risk management cycle, including prevention, preparedness, response, and recovery. Ultimately, it enables a more objective evaluation of spatial and temporal flood risk patterns, thereby informing targeted adaptation and mitigation strategies.
According to the results, the hazard indicators with the greatest influence on increasing community exposure are flood depth and flood duration. These parameters represent a novel contribution to this type of analysis, as very few previous studies have incorporated them into the assessment of social exposure levels to flood risk.
The spatial distribution of villages according to their degree of flood hazard, as indicated in Figure 2a to Figure 2c, reveals a critical pattern of vulnerability in the study area. The normalization of maximum water levels and inundation duration as hazard indicators is a well established approach for quantifying flood exposure, capturing both intensity and persistence dimensions of flood events [22]. The classification results 21 villages with very high exposure, 22 highly exposed, 24 moderately exposed, and 19 slightly exposed—demonstrate that over 75% of surveyed villages face moderate to very high flood hazard. Such a predominance of elevated exposure is consistent with findings in other riverine floodplain studies that highlight the clustering of vulnerable settlements along major water bodies and tributaries due to socio-economic factors and geographical constraints [6,23]. The repercussions of living in high flood hazard zones are profound, impacting livelihoods, health, and local development. Studies in similar rural contexts reveal that flood exposure significantly reduces household income, especially farming income, while increasing expenditures on health and food due to flood-induced damages and disruptions [24]. This underscores the importance of integrating flood hazard assessments with socio-economic vulnerability analysis for comprehensive risk management. The spatial distribution maps provide critical information for targeted interventions, as prioritizing villages with very high and high exposure can optimize resource allocation for flood mitigation, early warning, and resilience-building measures [25]. Then, the spatial analysis of flood hazard exposure in this study aligns with broader research emphasizing the value of normalized water level and inundation duration metrics, the concentration of vulnerability in floodplain villages, and the socio-economic impacts of such exposure. These insights form a vital basis for planning flood risk reduction strategies tailored to the most affected communities.
The analysis of village sensitivity to flooding in the study area reveals notable spatial disparities in vulnerability. The finding that 20 villages fall within the very high sensitivity class and 17 within the high sensitivity class indicates a substantial proportion of villages are highly susceptible to flood impacts. This aligns with flood vulnerability studies in the Ouémé Basin, where proximity to rivers, topography, and socio-economic conditions significantly shape flood sensitivity [6]. Such factors consistently explain heightened vulnerability to flooding in riverine communities across West Africa [26,27].
Conversely, the classification of some villages within very low to moderate sensitivity levels reflects heterogeneity in flood resilience and adaptive capacity. This pattern is observed globally, where spatial variability in elevation, river distance, and socio-economic assets create diverse sensitivity landscapes [28,29,30]. Studies emphasize that socio-economic dimensions are key to understanding sensitivity beyond physical exposure alone, as poverty, education levels, and infrastructure influence community flood impacts . The spatial distribution maps (Figures ??.d to ??.f) facilitate focused flood risk management by pinpointing highly sensitive villages requiring prioritized intervention. This approach aligns with current best practices that integrate GIS-based hazard mapping with socio-economic data to optimize disaster resilience strategies [31,32]. In conclusion, the village sensitivity analysis highlights the need for integrated flood risk assessments combining natural hazard data and socio-economic factors to tailor effective risk reduction in flood-prone river basins like Ouémé.
The assessment of adaptive capacity among villages along the Ouémé River provides critical insight into their preparedness to manage and respond to flood impacts. Calculating the average adaptation level using both pre-flood mechanisms and actions during flooding offers a comprehensive measure of village readiness, aligning with established frameworks for evaluating community adaptive capacity to hydrological hazards [33,34]. The standout example of Tohouès village as the most capable in flood response highlights the role that localized knowledge, social organization, and resource availability play in effective adaptation [35]. The finding that 60 villages display low to very low adaptive capacity is consistent with numerous studies in flood-prone regions, which demonstrate that limited adaptive mechanisms greatly increase susceptibility to flood damage and loss [36,37]. Such limited preparedness is often associated with economic constraints, insufficient infrastructure, and lack of early warning and disaster education programs, factors commonly reported in rural West African contexts including Benin [6].
Moreover, the calculation of vulnerability indices as a complement of adaptive capacity and potential impact indices follows best practices in flood vulnerability modeling, effectively integrating both exposure and resilience dimensions [38]. The identification of 25 highly vulnerable villages versus 10 with lower vulnerability underscores the critical spatial heterogeneity in flood risk, a characteristic frequently observed in river basin flood studies due to natural, social, and economic variability [36]. The spatial distribution of vulnerability illustrated in Figure 3a to Figure 3c emphasizes the need for differentiated flood risk management strategies that address specific local conditions and capacity levels. Targeted interventions in the most vulnerable villages could include infrastructure improvements, community-based early warning systems, and capacity-building programs aimed at enhancing adaptive capacity [39]
In sum, this study’s integration of adaptive capacity and impact assessments to derive vulnerability indices provides a robust framework for guiding flood risk reduction efforts in the Ouémé floodplain, reinforcing the importance of enhancing adaptive capacities to reduce community vulnerability to flooding.
The computation of flood risk indices by averaging hazard, vulnerability, and exposure indices offers a holistic quantitative measure of overall flood risk in each village, consistent with established flood risk assessment methodologies [6]. This integrated approach aligns with multi-criteria analysis frameworks widely used in the field, such as the Analytical Hierarchy Process (AHP) combined with GIS, which facilitate precise weighting and spatial mapping of different flood risk components [40,41,42].
The results identifying 40 villages in the high-risk category and 25 in moderate risk reflect a significant spatial concentration of flood susceptibility, which corresponds to patterns observed in similar river basins where flooding is driven by natural and socio-economic factors like topography, land use, and population density [43,44]. The presence of 10 villages in the very high risk zone emphasizes areas where flood impacts may be most severe and where immediate mitigation and adaptation efforts should be prioritized.
The spatial distribution of flood risk as revealed emphasizes the need for differentiated flood management strategies that address variations in exposure, vulnerability, and adaptive capacity across communities. Targeted interventions can include structural measures such as improved flood defenses, alongside community-based preparedness and socio-economic resilience building, which together reduce the overall burden of flood disasters. Overall, this comprehensive risk profiling approach highlights the urgency for tailored flood adaptation and mitigation policies that enhance resilience of the most vulnerable villages in the Ouémé River Basin, confirming the utility of integrated multi-dimensional flood risk assessments in guiding effective disaster risk reduction.
The spatial distribution of social risk through mapping has proven to be an effective approach for identifying villages most susceptible to flood hazards, thereby enabling a more accurate assessment and diagnosis of risk. For instance, combining a flood exposure map with a vulnerability map helps to pinpoint villages classified from high to very high risk, guiding the implementation of urgent and targeted interventions. Conducting such analyses at a detailed spatial scale is valuable not only for strengthening emergency response but also for enhancing preventive planning and community resilience. Furthermore, the increasing availability of open-access datasets provides a valuable resource for this type of research, although certain limitations persist, particularly regarding the subjectivity inherent in survey-based data.
5. Conclusion
The present study assessed flood hazard, exposure, vulnerability, and risk levels in the Lower Ouémé River Basin using an integrated approach consistent with the IPCC AR5 framework. This methodology combined biophysical and socioeconomic parameters to provide a comprehensive understanding of how communities in the basin are affected by recurring floods. By incorporating indicators such as flood depth, flood duration, distance to rivers, water entry points, poverty index, and population density, the analysis captured both the natural and social dimensions of flood risk. The resulting indices were normalized and aggregated to derive spatially explicit maps of hazard, sensitivity, adaptive capacity, and vulnerability for 89 villages across the study area.
The results revealed considerable spatial disparities in exposure and vulnerability levels among villages. More than 72% of the surveyed villages exhibited exposure levels ranging from moderate to very high, mainly due to their proximity to the Ouémé River and its tributaries, as well as the persistence of floods lasting over 90 days with depths reaching up to 250 cm. The sensitivity analysis showed that factors such as distance to the river and the number of water entry points into villages play a crucial role in determining flood susceptibility. The integration of socioeconomic parameters, including poverty and population density, further highlighted the unequal distribution of risk across the basin.
Adaptive capacity varied significantly from one community to another. The village of Tohouès demonstrated the strongest ability to cope with flood impacts, while approximately sixty villages exhibited weak to very weak adaptive mechanisms, reflecting limited preparedness and a high dependency on external support. The vulnerability index, derived from the combination of adaptive capacity and potential impacts, indicated that 25 villages are highly predisposed to severe flood damage, whereas only 10 showed relatively low vulnerability levels. The final composite risk index—calculated from hazard, exposure, and vulnerability components—confirmed that the majority of the study area falls under high to very high risk categories.
Mapping the spatial distribution of these indices has proven to be an effective tool for identifying priority zones and supporting decision-making in disaster risk management. The combination of flood exposure and vulnerability maps provides a clear visual diagnosis of villages most in need of urgent interventions. Detailed-scale analyses enable better emergency planning, prevention strategies, and community-based adaptation actions. The inclusion of innovative indicators such as evacuation time also enhances the accuracy of vulnerability assessments and underscores the importance of human behavioral factors in flood risk reduction.
Overall, this study highlights the urgent need to strengthen local adaptation strategies, improve early warning systems, and promote a culture of prevention within flood-prone communities. The use of open-access datasets and participatory surveys demonstrates the feasibility of replicating this approach in other regions, though attention should be given to data quality and subjectivity. By integrating scientific analysis with local realities, the methodology developed here provides a valuable framework for policymakers and practitioners to design targeted interventions that enhance resilience and reduce the devastating impacts of floods in the Lower Ouémé Valley and similar riverine environments.
Author Contributions
Conceptualization, R.G. Assogba-Ballè. and D.M.M. Ahouansou.; methodology, R.G. Assogba-Ballè and D.M.M. Aouansou ; data and GIS analysis, C.Linsoussi. and D.M.M. Ahouansou ; IPCC AR5 approach operationalization, D.M.M. Ahouansou ; writing—original draft preparation, R.G. Assogba-Ballè. and D.M.M. Ahouansou; writing—review and editing, all authors. All authors have read and agreed to the published version of the manuscript.
Funding
This research was funded by the DURAGIRE Integrated Water Management Program for the Ouémé Delta, implemented by VNG International Benin in collaboration with the National Water Institute (INE) of the University of Abomey-Calavi (UAC), Benin.
Acknowledgments
The authors would like to express their sincere gratitude to the DURAGIRE Program for its collaboration, provision of documentation, and financial support. Special thanks are extended to the local authorities and civil servants for their invaluable assistance in gathering field data, as well as to the team of experts who contributed to the application of the IPCC AR5 methodology. The authors also acknowledge the anonymous reviewers for their constructive comments and insightful suggestions, which greatly improved the quality of this paper.
Conflicts of Interest
The authors declare no conflicts of interest
References
- Koubodana Houteta, D.; Tall, M.; Nonki, R.M.; Patel, N.; Sylla, M.B.; Djaman, K.; Atchonouglo, K.; Hewitson, B. Flood frequency and amplitude analysis under changing climate scenarios in the Mono River Basin, West Africa. Sustainable Water Resources Management 2025, 11, 1–12.
- Ranasinghe, R.; Ruane, A.C.; Vautard, R.; Arnell, N.; Coppola, E.; Cruz, F.A.; Dessai, S.; Saiful Islam, A.; Rahimi, M.; Carrascal, D.R.; et al. Climate change information for regional impact and for risk assessment 2021.
- Hounkpè, J.; Badou, D.F.; Ahouansou, D.M.; Totin, E.; Sintondji, L.O. Assessing observed and projected flood vulnerability under climate change using multi-modeling statistical approaches in the Ouémé River Basin, Benin (West Africa). Regional Environmental Change 2022, 22, 112.
- Ferdinand, N.; Chaigneau, A.; Kouraev, A.; Morel, Y.; Okpeitcha, O.V.; Biancamaria, S.; Ferrant, S. Spatio-Temporal Variability of Flooded Areas in the Ouémé Floodplain (Benin, West Africa) from 2015 to 2023. Preprint 2025.
- Amoussou, E.; Amoussou, F.T.; Bossa, A.Y.; Kodja, D.J.; Totin Vodounon, H.S.; Houndénou, C.; Borrell Estupina, V.; Paturel, J.E.; Mahé, G.; Cudennec, C.; et al. Use of the HEC RAS model for the analysis of exceptional floods in the Ouémé basin. Proceedings of IAHS 2024, 385, 141–146.
- Bossa, Y.A.; Djangni, O.; Yira, Y.; Hounkpè, J.; Sintondji, L.O.; et al. Flood Risk Assessment in the Lower Valley of Ouémé, Benin. Open Journal of Modern Hydrology 2024, 14, 130–151.
- Quenum, G.M.L.D.; Arnault, J.; Klutse, N.A.B.; Zhang, Z.; Kunstmann, H.; Oguntunde, P.G. Potential of the coupled WRF/WRF-hydro modeling system for flood forecasting in the Ouémé River (West Africa). Water 2022, 14, 1192.
- Raza, M.; Hatab, A.A. Assessment of vulnerability and resilience of smallholder farming households to flood risks: Insights from the Southern Punjab region of Pakistan. International Journal of Disaster Risk Reduction 2025, p. 105600.
- on Climate Change (IPCC), I.P., Climate Change Information for Regional Impact and for Risk Assessment. In Climate Change 2021 – The Physical Science Basis: Working Group I Contribution to the Sixth Assessment Report of the Intergovernmental Panel on Climate Change; Cambridge University Press, 2023; p. 1767–1926.
- GIZ.; EURAC. Guide de référence sur la vulnérabilité : le Concept et lignes directrices pour la conduite d’analyses de vulnérabilité standardisées. Bonn et Eschborn, Allemagne, 2015.
- GIZ.; EURAC. Guide complémentaire sur la vulnérabilité : le concept de risque. Lignes directrices sur l’utilisation de l’approche du Guide de référence sur la vulnérabilité en intégrant le nouveau concept de risque climatique de l’AR5 du GIEC. Bonn, 2017.
- Bodjrènou, M.; Peng, K.; Afféwé, D.J.; Hounkpè, J.; Donnou, H.E.; Adounkpè, J.; Akpo, A.B. Assessment of Satellite-Based Rainfall Products for Flood Modeling in the Ouémé River Basin in Benin (West Africa). Hydrology 2025, 12, 71.
- Le Barbé, L.; Alé, G.; Millet, B.; Texier, H.; Borel, Y.; Gualde, R. Les ressources en eaux superficielles de la République du Bénin. Technical report, IRD, 1993.
- Okpeitcha, O.V.; Chaigneau, A.; Morel, Y.; Stieglitz, T.; Pomalegni, Y.; Sohou, Z.; Mama, D. Seasonal and interannual variability of salinity in a large West-African lagoon (Nokoué Lagoon, Benin). Estuarine, Coastal and Shelf Science 2022, 264, 107689.
- Lawin, A.E.; Hounguè, R.; N’Tcha M’Po, Y.; Hounguè, N.R.; Attogouinon, A.; Afouda, A.A. Mid-century climate change impacts on Ouémé River discharge at Bonou Outlet (Benin). Hydrology 2019, 6, 72.
- Osseni, A.A.; Dossou-Yovo, H.O.; Gbesso, G.H.F.; Lougbegnon, T.O.; Sinsin, B. Spatial dynamics and predictive analysis of vegetation cover in the Ouémé River Delta in Benin (West Africa). Remote Sensing 2022, 14, 6165.
- Sossa, F.; Djihouessi, M.B.; Tasso, F.B.; Kouaro, M.O. Integration of social and cultural dimensions in the assessment of environmental flows: case of the Ouémé delta in West Africa. Humanities and Social Sciences Communications 2024, 11, 1–15.
- Parker, C.; Scott, S.; Geddes, A. Snowball sampling. SAGE research methods foundations 2019.
- Sathyanarayana, S.; Mohanasundaram, T.; Pushpa, B.; Harsha, H. Snowball sampling. International Journal of Business and Management Invention 2024, 13, 152–167.
- Armenakis, C.; Du, E.X.; Natesan, S.; Persad, R.A.; Zhang, Y. Flood risk assessment in urban areas based on spatial analytics and social factors. Geosciences 2017, 7, 123.
- Tascón-González, L.; Ferrer-Julià, M.; Ruiz, M.; García-Meléndez, E. Social vulnerability assessment for flood risk analysis. Water 2020, 12, 558.
- Mostafiz, R.B.; Rahim, M.A.; Friedland, C.J.; Rohli, R.V.; Bushra, N.; Orooji, F. A data-driven spatial approach to characterize the flood hazard. Frontiers in big Data 2022, 5, 1022900.
- Handyastono, B.; Alghoul, M.A.; Rizki, A.; Djambek, N.P.; Kusuma, M.; Kuntoro, A.A.; Harlan, D.; Nugroho, E.O.; Munthe, H.M.; Hazmi, M.; et al. Flood hazard assessment in Pemaluan Village due to land use change in IKN (Ibu Kota Nusantara) as the New Capital City of Indonesia. Case Studies in Chemical and Environmental Engineering 2025, 11, 101211.
- Ashikbayeva, Z.; Fürstenberg, M.; Kapelari, T.; Pierres, A.; Thies, S. Household level effects of flooding: Evidence from Thailand. Technical report, TVSEP Working Paper, 2020.
- Chen, Y. Flood hazard zone mapping incorporating geographic information system (GIS) and multi-criteria analysis (MCA) techniques. Journal of Hydrology 2022, 612, 128268.
- Tiepolo, M.; Rosso, M.; Massazza, G.; Belcore, E.; Issa, S.; Braccio, S. Flood assessment for risk-informed planning along the Sirba river, Niger. Sustainability 2019, 11, 4003.
- Owusu, A.B.; Agbozo, M. Application of geographic information systems for flood risk analysis: a case study from Accra Metropolitan Area. Present Environment and Sustainable Development 2019, pp. 81–98.
- Aznar-Crespo, P.; Aledo, A.; Melgarejo-Moreno, J.; Vallejos-Romero, A. Adapting social impact assessment to flood risk management. Sustainability 2021, 13, 3410.
- Luu, C.; Von Meding, J.; Kanjanabootra, S. Flood risk management activities in Vietnam: A study of local practice in Quang Nam province. International journal of disaster risk reduction 2018, 28, 776–787.
- Jabeen, H.; Johnson, C.; Allen, A. Built-in resilience: learning from grassroots coping strategies for climate variability. Environment and Urbanization 2010, 22, 415–431.
- Skilodimou, H.D.; Bathrellos, G.D.; Alexakis, D.E. Flood hazard assessment mapping in burned and urban areas. Sustainability 2021, 13, 4455.
- Tomar, P.; Singh, S.K.; Kanga, S.; Meraj, G.; Kranjčić, N.; Đurin, B.; Pattanaik, A. GIS-based urban flood risk assessment and management—a case study of Delhi National Capital Territory (NCT), India. Sustainability 2021, 13, 12850.
- Cutter, S.L.; Barnes, L.; Berry, M.; Burton, C.; Evans, E.; Tate, E.; Webb, J. A place-based model for understanding community resilience to natural disasters. Global environmental change 2008, 18, 598–606.
- Few, R. Flooding, vulnerability and coping strategies: local responses to a global threat. Progress in development studies 2003, 3, 43–58.
- Birkmann, J. Measuring vulnerability to promote disaster-resilient societies: Conceptual frameworks and definitions. Measuring vulnerability to natural hazards: Towards disaster resilient societies 2006, 1, 3–7.
- Haque, M.M.; Islam, S.; Sikder, M.B.; Islam, M.S.; Tabassum, A. Assessment of flood vulnerability in Jamuna floodplain: a case study in Jamalpur district, Bangladesh. Natural Hazards 2023, 116, 341–363.
- Tingsanchali, T. Urban flood disaster management. Procedia engineering 2012, 32, 25–37.
- Fekete, A. Validation of a social vulnerability index in context to river-floods in Germany. Natural Hazards and Earth System Sciences 2009, 9, 393–403.
- Ahern, M.; Kovats, R.S.; Wilkinson, P.; Few, R.; Matthies, F. Global health impacts of floods: epidemiologic evidence. Epidemiologic reviews 2005, 27, 36–46.
- Al-Omari, A.A.; Shatnawi, N.N.; Shbeeb, N.I.; Istrati, D.; Lagaros, N.D.; Abdalla, K.M. Utilizing remote sensing and GIS techniques for flood hazard mapping and risk assessment. Civil Engineering Journal 2024, 10, 1423–1436.
- Rincón, D.; Khan, U.T.; Armenakis, C. Flood risk mapping using GIS and multi-criteria analysis: A greater Toronto area case study. Geosciences 2018, 8, 275.
- Aydin, M.C.; Sevgi Birincioğlu, E. Flood risk analysis using gis-based analytical hierarchy process: a case study of Bitlis Province. Applied Water Science 2022, 12, 122.
- Kohno, M.; Higuchi, Y. Landslide susceptibility assessment in the Japanese archipelago based on a landslide distribution map. ISPRS International Journal of Geo-Information 2023, 12, 37.
- Roccati, A.; Paliaga, G.; Luino, F.; Faccini, F.; Turconi, L. GIS-based landslide susceptibility mapping for land use planning and risk assessment. Land 2021, 10, 162.
Figure 2.
Mapping of village exposure levels to flooding (a–c) and distribution of villages according to their degree of sensitivity to flooding (d–f): (a,d) Villages located in the southern part of the study.(b,e) Villages located in the central part of the study area. (c,f) Villages located in the northern part of the study area.
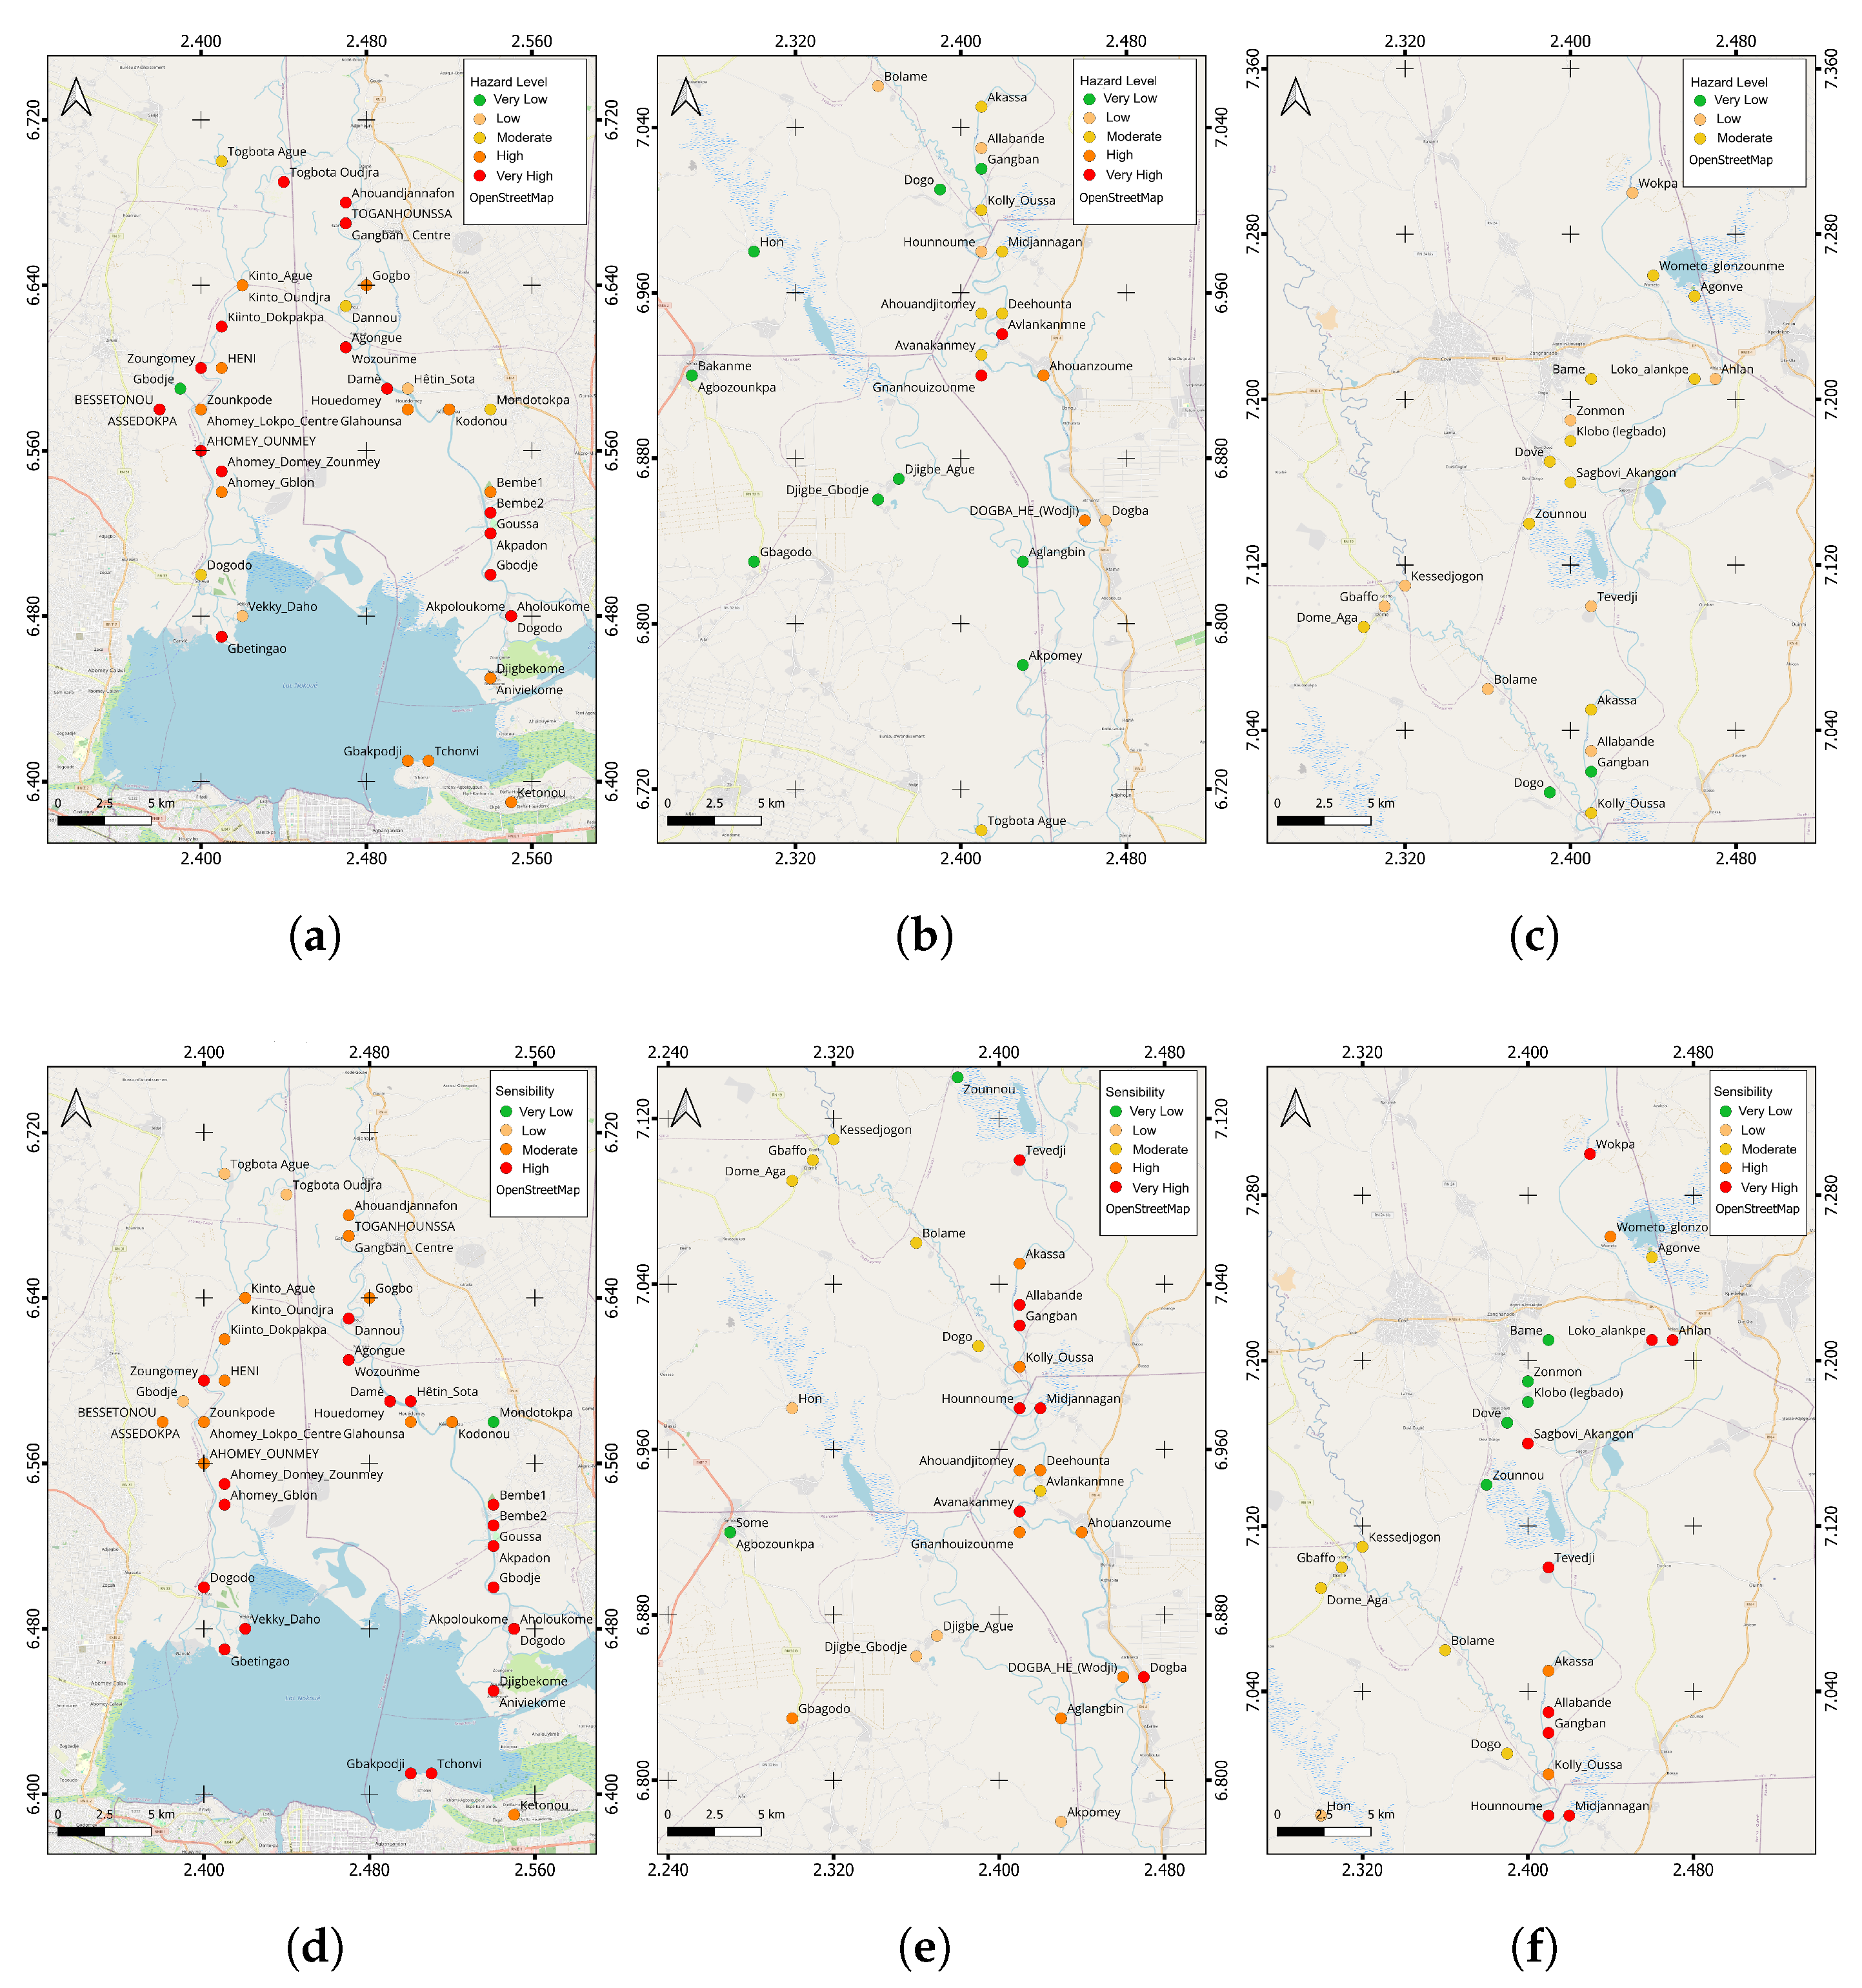
Figure 3.
Spatial mapping of village adaptation levels to flooding (a–c) and distribution of villages according to their degree of vulnerability to flooding (d–f): (a,d) Villages located in the southern part of the study.(b,e) Villages located in the central part of the study area. (c,f) Villages located in the northern part of the study area.
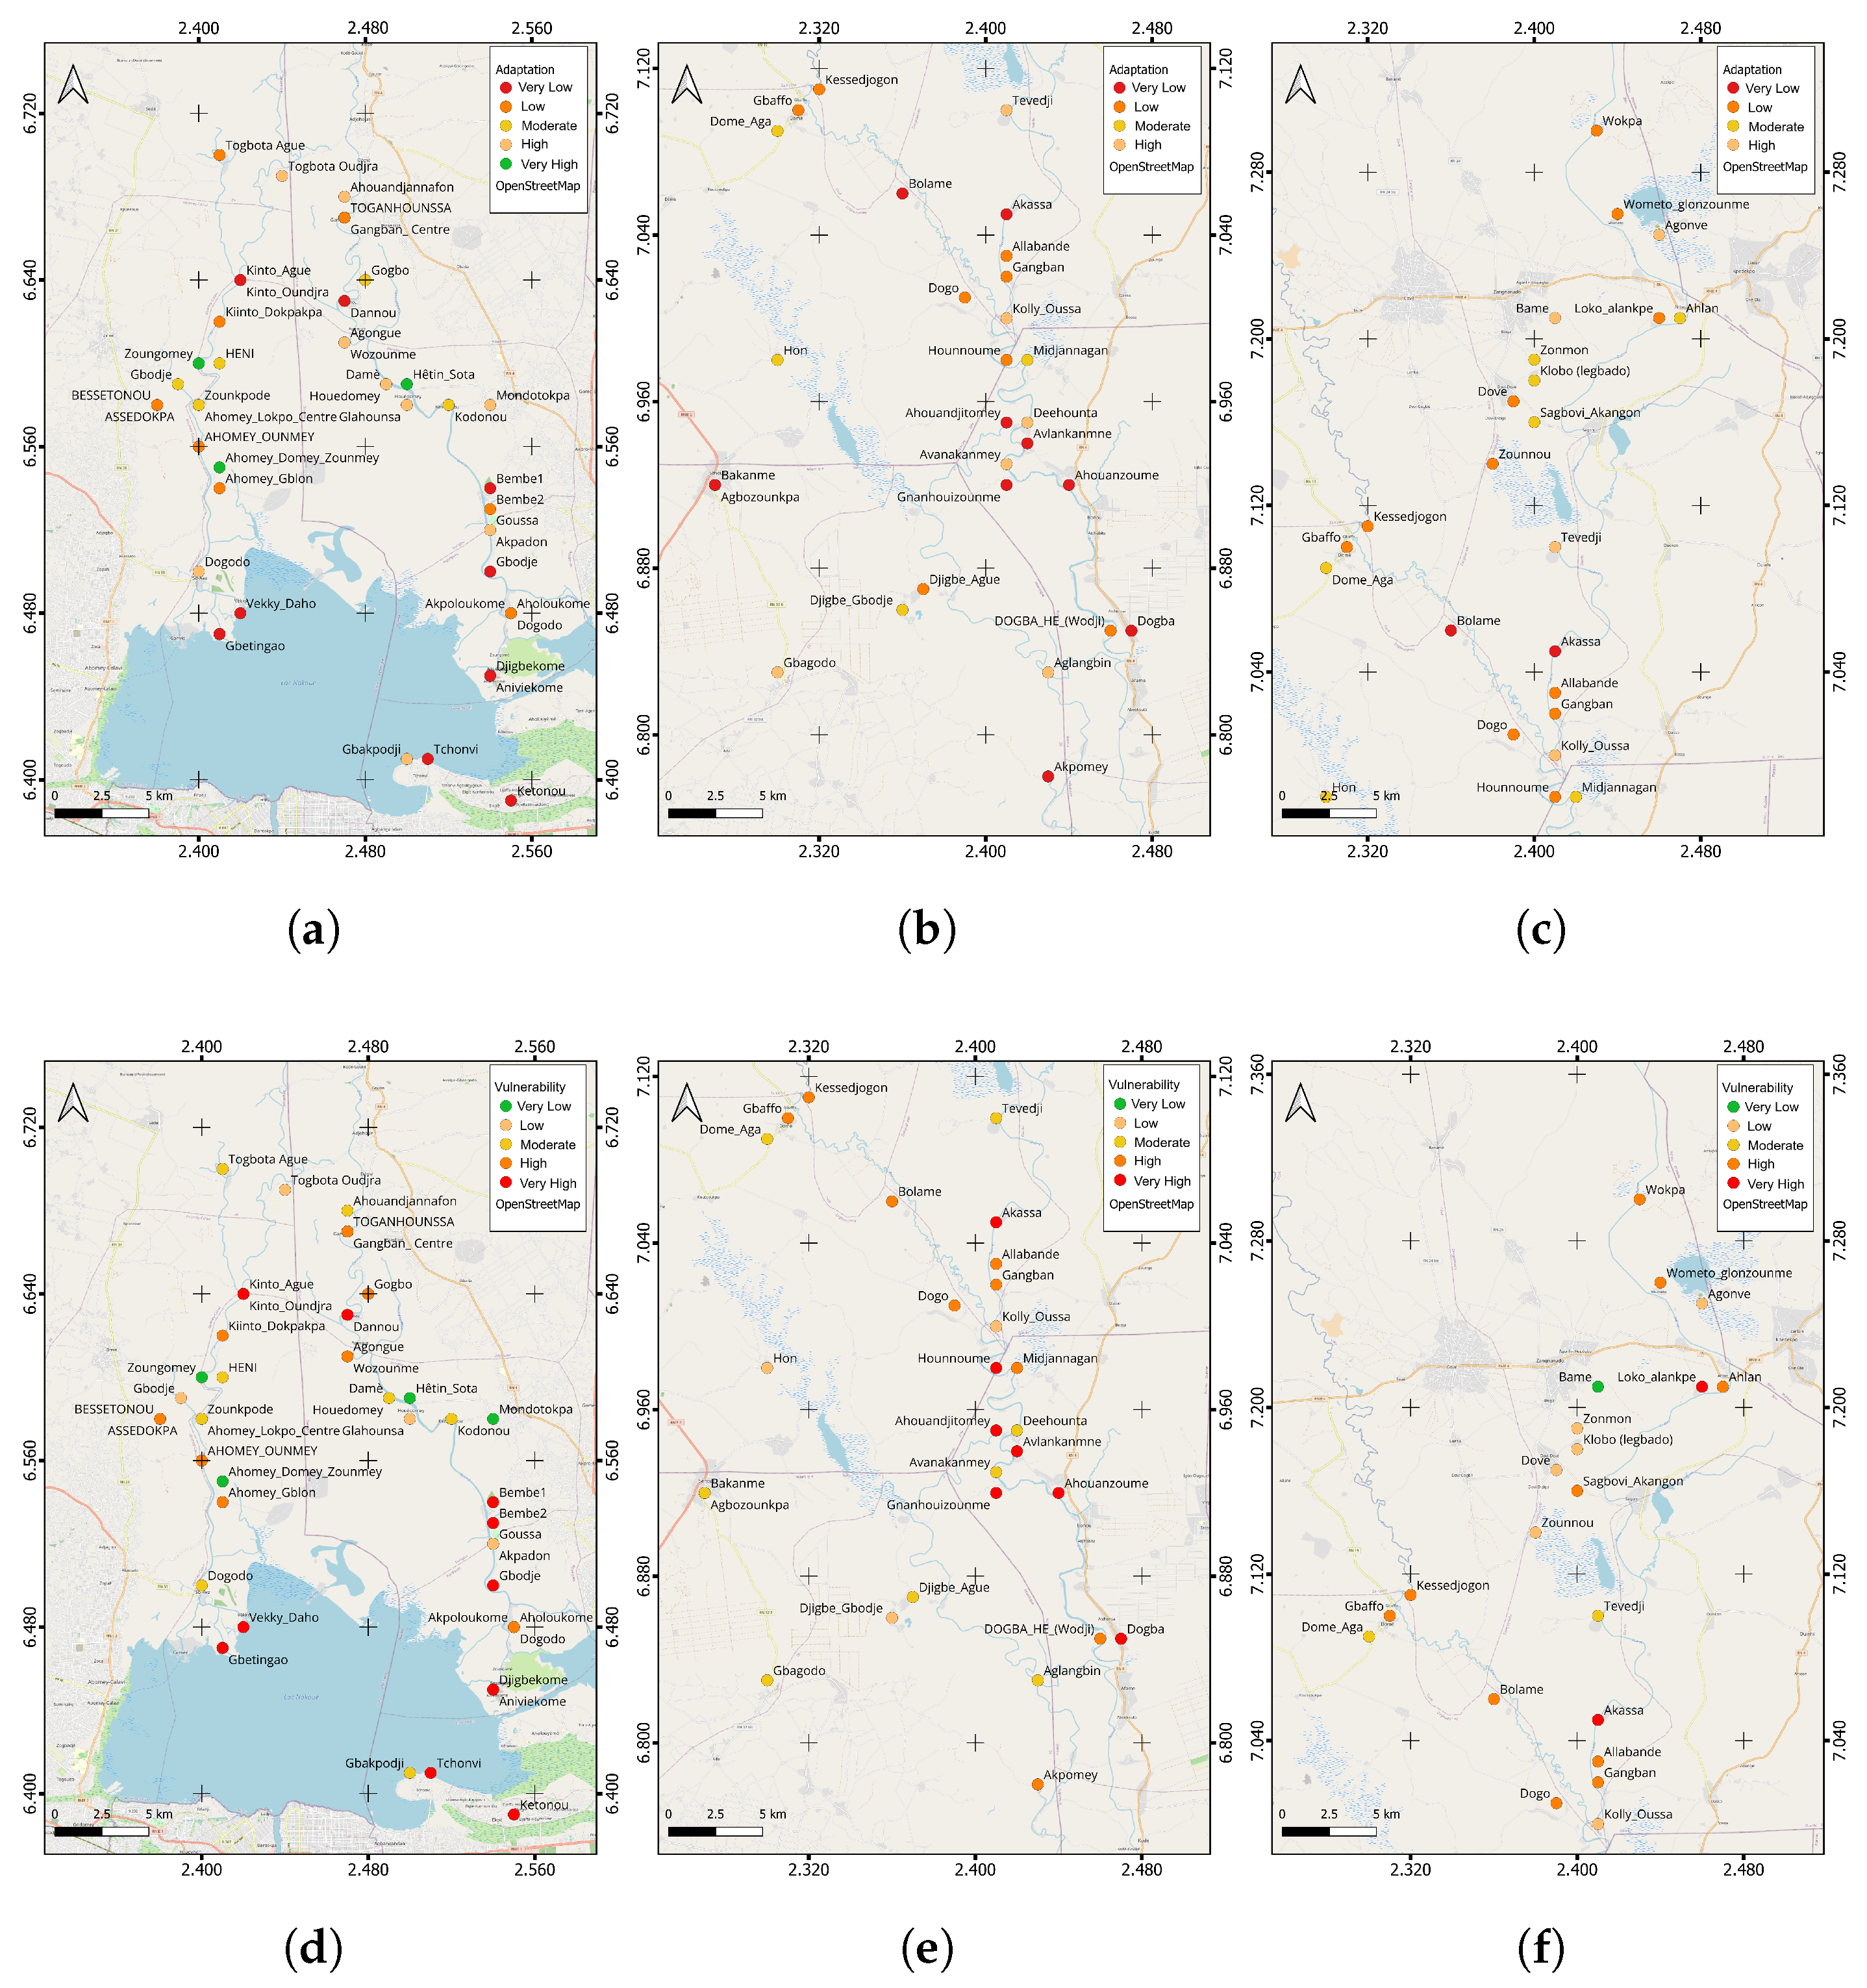
Figure 4.
Mapping of village Flood Risk levels : (a) Villages located in the southern part of the study.(b) Villages located in the central part of the study area. (c) Villages located in the northern part of the study area.
Figure 4.
Mapping of village Flood Risk levels : (a) Villages located in the southern part of the study.(b) Villages located in the central part of the study area. (c) Villages located in the northern part of the study area.
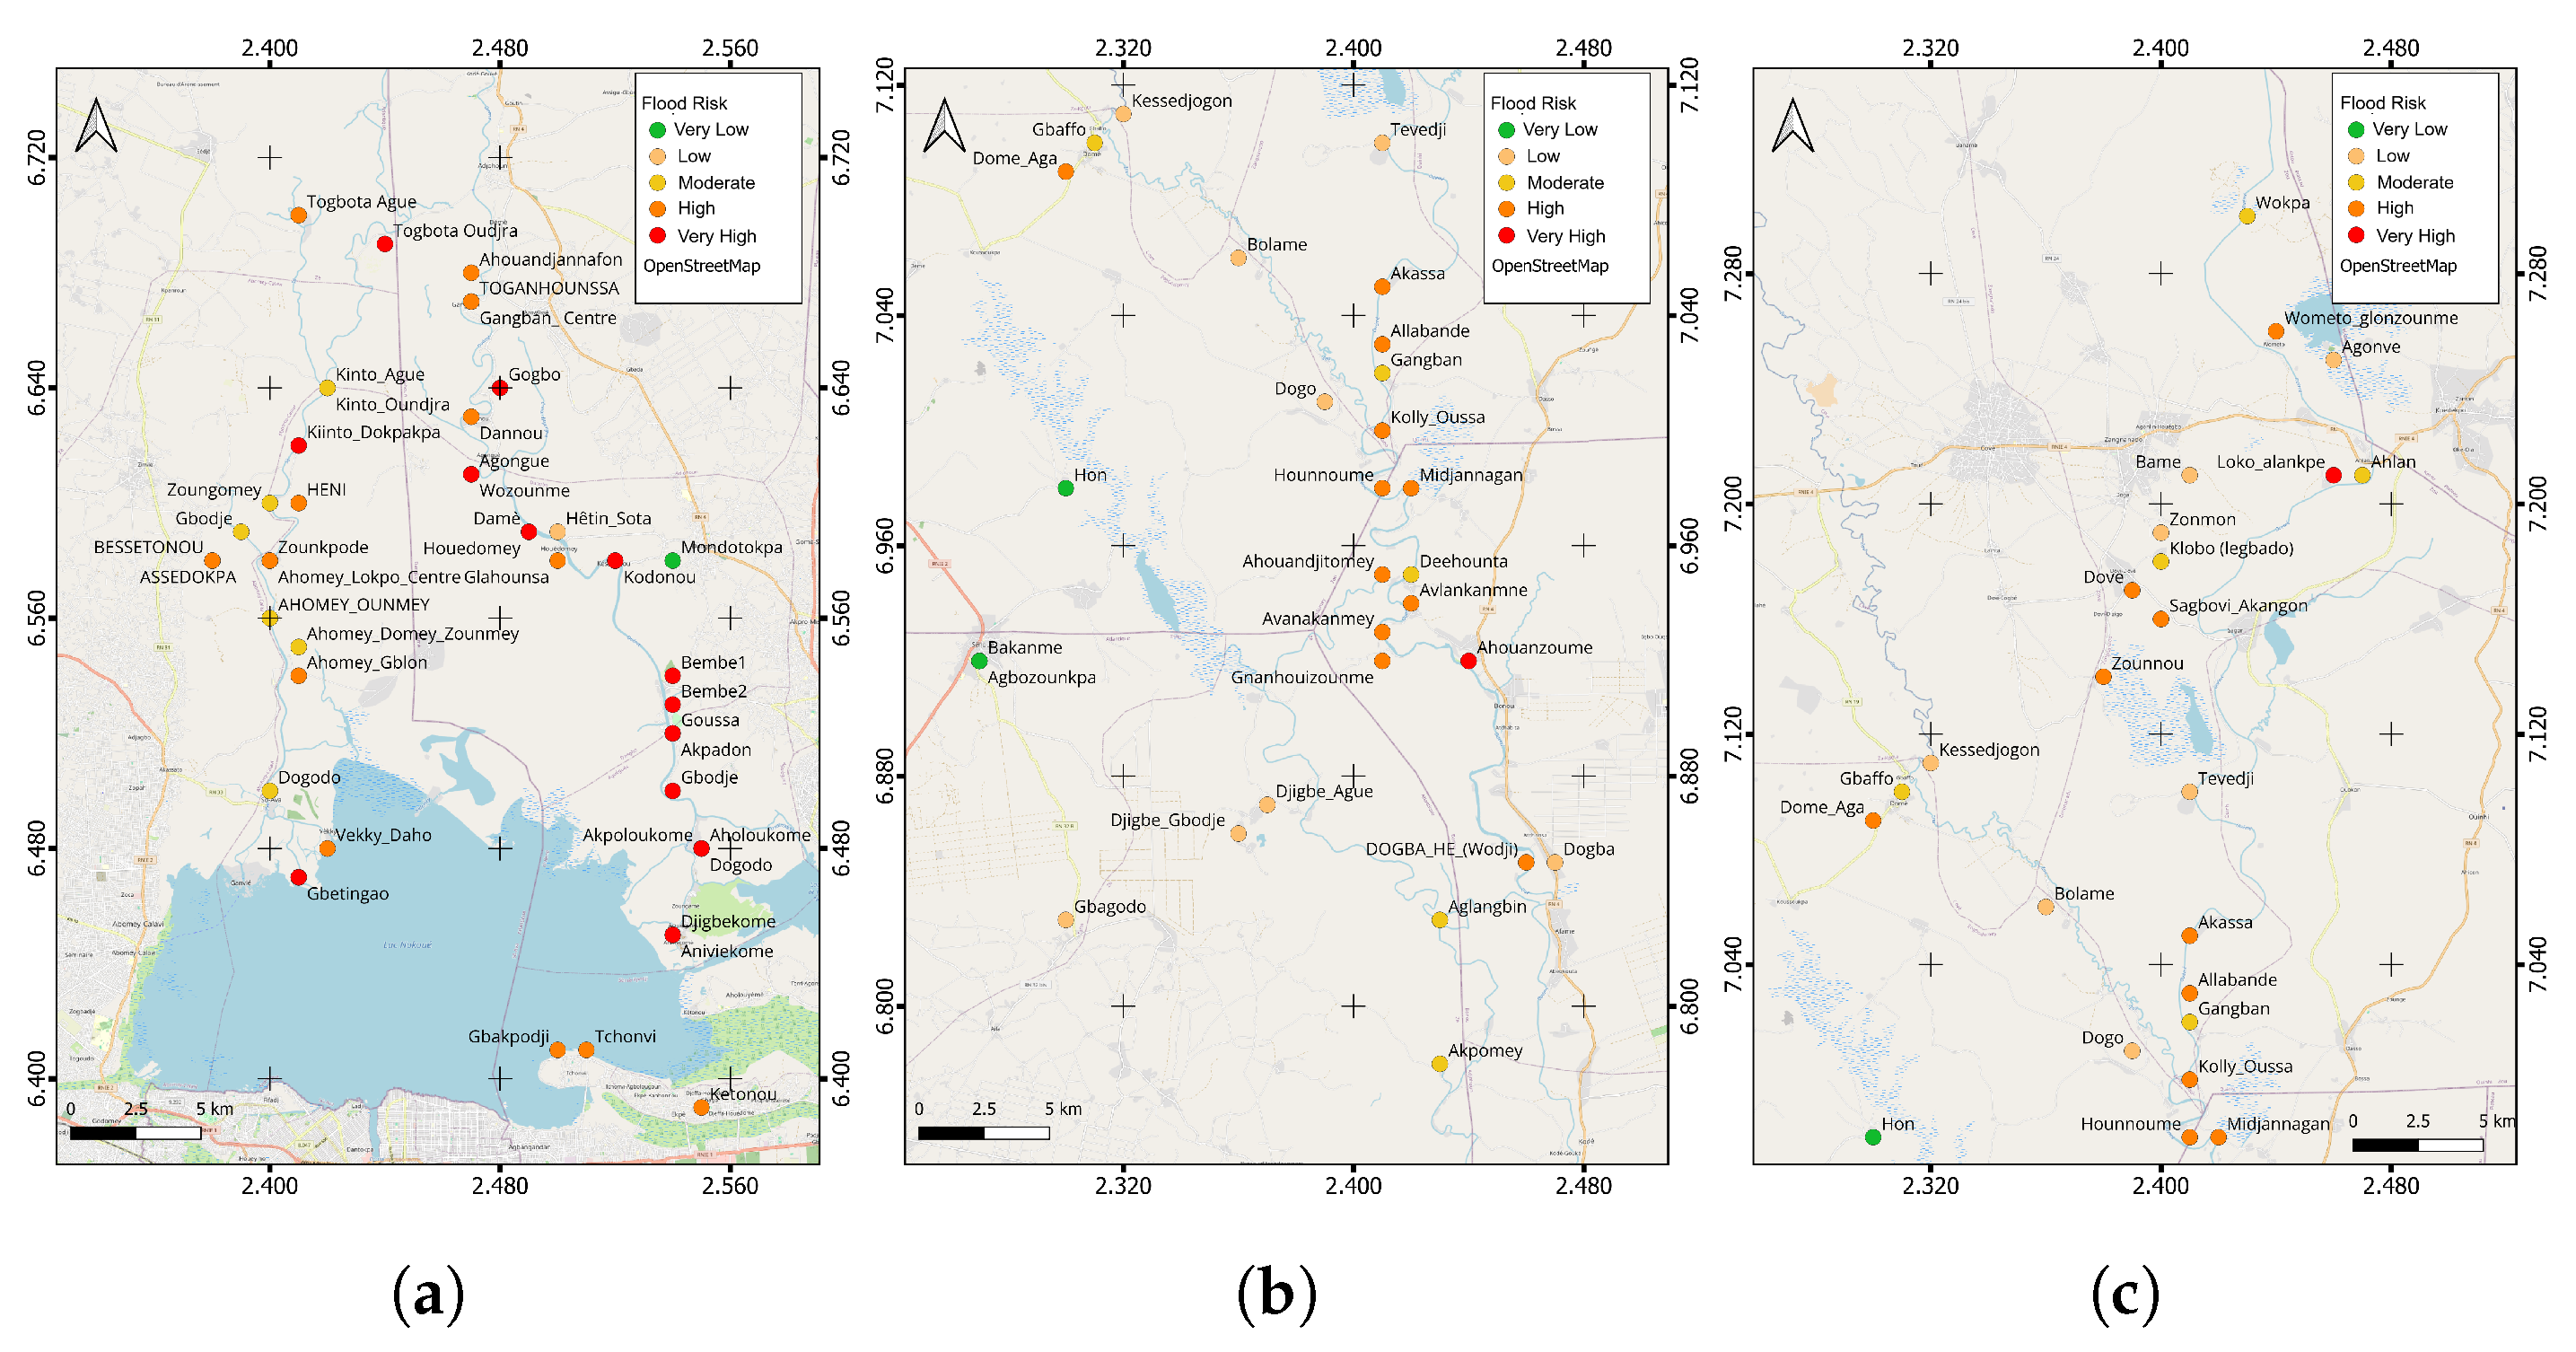
Table 1.
Number of villages and number of respondents per commune.
| Commune | Number of villages | Number of respondents |
|---|---|---|
| Abomey-Calavi | 1 | 5 |
| Adjohoun | 7 | 35 |
| Aguégués | 10 | 50 |
| Bonou | 6 | 30 |
| Dangbo | 8 | 40 |
| Ouinhi | 6 | 30 |
| Sèmè-Kpodji | 3 | 15 |
| Sô-Ava | 17 | 85 |
| Toffo | 5 | 25 |
| Zagnanado | 12 | 60 |
| Zê | 5 | 25 |
| Zogbodomey | 9 | 45 |
| Total | 89 | 445 |
Table 2.
Hazard index parameters.
| Parameters | Description | Units |
|---|---|---|
| Flood depth | Maximum water levels during flood event | m |
| Flood duration | Average duration of flooding | month |
| Flood frequency | Flood occurrences recorded over the past ten years | - |
Table 3.
Exposure index parameters.
| Parameters | Description | Units |
|---|---|---|
| Density | Population density in a flooded village | Persons/ |
| Flooded farmland | Extent of flooded farmlands | % |
| Houses destroyed | Number of houses destroyed by flooding | - |
| Inacessibility | Number of roads, health centers, and schools flooded | - |
Table 4.
Sensitivity index parameters.
| Parameters | Description | Units |
|---|---|---|
| Distance | Distance from the village center to the main river | m |
| Water entry points | Number of water entry points into the village | - |
| Stream Order | Strahler stream order | - |
| Poverty index | Commune poverty index in which the village is located | - |
| Density | Population density of the subdistrict of the village | - |
Table 5.
Coping capacity index parameters.
| Parameters | Description | Units |
|---|---|---|
| Contingency plan | Existence and implementation of contingency plan | - |
| Water level monitoring | Existence of water level monitoring markers | - |
Table 6.
Adaptive capacity index parameters.
| Parameters | Description | Units |
|---|---|---|
| Early harvesting | Practice of early harvesting to reduce flood losses | - |
| Water drainage | Indigenous techniques for floodwater removal | - |
| Relocation | Relocation to safe areas during flood events | - |
Table 7.
Categorization of Risk Levels.
| Indicators range of values | Category | Description |
|---|---|---|
| 0 – 0.2 | 1 | Very Low |
| > 0.2 – 0.4 | 2 | Low |
| > 0.4 – 0.6 | 3 | Moderate |
| > 0.6 – 0.8 | 4 | High |
| > 0.8 – 1 | 5 | Very High |
Adapted from GIZ Risk assessment guide [11].
Table 8.
Indicator dictionary for the village-level survey.
| Parameters | Description |
|---|---|
| Villages (N) | Total number of interviewed villages per commune |
| Respondents (N) | Total number of valid questionnaires per village |
| Women (%) | Share of female respondents |
| Average Age (years) | Mean age of respondents |
| Median HH Size | Median number of people per household |
| Poverty Index (%) | Poverty Index |
| Illiteracy Rate (%) | Share of respondents who cannot read and write |
| Farming HH (%) | Share of households relying mainly on agriculture |
| Distance to River (m) | Median distance from the household to the nearest water body |
| Flood Depth 2024 (cm) | Median water depth inside houses during the 2024 flood |
| Flood Duration (days) | Median number of days households were flooded |
| Access to EWS (%) | Share of households receiving flood alerts (SMS, radio, town crier) |
| Warned Before Last Flood (%) | Share of households warned before the last flood event |
| Houses Damaged (%) | Share of households reporting damage to their head of village |
| Crops Lost (%) | Share of households reporting crop losses |
| Livestock Lost (%) | Share of households reporting livestock losses |
| Water Contamination (%) | Share of households reporting contaminated water sources |
| HH Protection Measures (%) | Share of households taking at least one protective action 1 |
| Assistance received (%) | Share of households that received any form of support2 |
1 Protective actions: elevating assets, moving livestock, early harvesting, household relocation to safe areas, etc. 2 Support (financial, material, or technical) from government, NGOs, or community groups in response to flood events.
Table 11.
Categorization of Sensitivity Levels.
| Hazard level | Indicator | Number of villages |
|---|---|---|
| Very Low | 0.0 – 0.10 | 14 |
| Low | 0.10 – 0.25 | 19 |
| Moderate | 0.25 – 0.50 | 19 |
| High | 0.50 – 0.75 | 17 |
| Very High | 0.75 – 1.0 | 20 |
| Total | – | 89 |
Table 12.
Categorization of adaptation Levels.
| Adaptation level | Indicator | Number of villages |
|---|---|---|
| Very High | 0.0 – 0.13 | 1 |
| High | 0.13 – 0.33 | 6 |
| Moderate | 0.33 – 0.57 | 22 |
| Low | 0.57– 0.67 | 34 |
| Very Low | 0.67 – 1.0 | 26 |
| Total | – | 89 |
Table 13.
Categorization of Vulnerability Levels.
| Vulnerability level | Indicator | Number of villages |
|---|---|---|
| Very Low | 0.0 – 0.13 | 10 |
| Low | 0.13 – 0.28 | 12 |
| Moderate | 0.28 – 0.44 | 22 |
| High | 0.44– 0.65 | 20 |
| Very High | 0.65 – 0.86 | 25 |
| Total | – | 89 |
Table 14.
Categorization of Flood Risk Levels.
| Flood Risk level | Indicator | Number of villages |
|---|---|---|
| Very Low | 0.3 – 0.39 | 5 |
| Low | 0.40 – 0.56 | 9 |
| Moderate | 0.57 – 0.64 | 25 |
| High | 0.65– 0.72 | 40 |
| Very High | 0.73 – 0.86 | 10 |
| Total | – | 89 |
Disclaimer/Publisher’s Note: The statements, opinions and data contained in all publications are solely those of the individual author(s) and contributor(s) and not of MDPI and/or the editor(s). MDPI and/or the editor(s) disclaim responsibility for any injury to people or property resulting from any ideas, methods, instructions or products referred to in the content. |
© 2025 by the authors. Licensee MDPI, Basel, Switzerland. This article is an open access article distributed under the terms and conditions of the Creative Commons Attribution (CC BY) license (http://creativecommons.org/licenses/by/4.0/).
Copyright: This open access article is published under a Creative Commons CC BY 4.0 license, which permit the free download, distribution, and reuse, provided that the author and preprint are cited in any reuse.


