
Submitted:
03 February 2025
Posted:
04 February 2025
You are already at the latest version
Abstract
Urbanization and climate change are increasing the risks of natural hazards, particularly in cities with significant socio-economic disparities. Existing hazard risk assessment frameworks often neglect socio-economic dimensions, limiting their utility in addressing community-level vulnerabilities. This study proposes an integrated machine learning and indicator-based framework for assessing flood susceptibility and socio-economic vulnerability, with a focus on data-scarce settings, using a case study of the City of Kigali. Socio-economic vulnerability was quantified through a composite index incorporating sensitivity and adaptive capacity. Multisource data were integrated and modeled using machine learning models, which included Multilayer Perceptron, Random Forest, Support Vector Machine, and XGBoost. In terms of model performance, the MLP has achieved high performance with an AUC score of 0.902 and F1-Score of 0.86. The results indicate intensified vulnerability in central and southern Kigali, with noticeable socio-economic disadvantages and high flood susceptibility. The resulting maps were validated using historical flood data, other socio-economic studies in the area, and local knowledge. The scalability of the framework was evaluated in Kampala, Uganda, and Dar es Salaam, Tanzania, demonstrating scalability with context-specific adaptations. This approach offers a robust methodology for integrating flood susceptibility and socio-economic vulnerability, enabling data-driven prioritization of interventions. The findings contribute to advancing urban resilience strategies, particularly in regions constrained by limited data availability.
Keywords:
socio-economic vulnerability
; susceptibility
; flood hazard
; machine learning
; framework
1. Introduction
Urbanization and climate change are significantly impacting human health, socio-economic stability, and sustainability. Urbanization, the process resulting from the increase in urban residents and expansion of the built-up areas, is often driven by economic opportunities and improved living standards, including access to employment, education, and healthcare [1]. However, many urban residents, particularly in the Global South, face critical challenges, such as inadequate housing, contaminated water, insufficient sanitation, and poor waste management [2]. The rapid urbanization has outpaced the capacity of urban planning processes to effectively address these challenges, exacerbating risks faced by urban residents [3]. With the frequent occurrence of natural hazards induced by climate change, rapid urbanization exacerbates various risks, which lead to adverse outcomes from exposure to natural hazards plus the vulnerabilities inherent in the affected urban population [4]. In this context, risk is understood as an outcome of the interaction between natural hazard, exposure, and vulnerability [5]. Therefore, extreme natural physical events that result in loss of lives, injuries, or other health effects, as well as harm to property, infrastructure, livelihoods, and ecosystems, are referred to as natural hazards [6]. For instance, because of their physical positions and the concentration of human activity, urban areas are vulnerable to hazards like storms, floods, and cyclones. The consequences of such hazards can be devastating, leading to loss of lives and economic disruptions in essential services. Exposure to hazards describes the degree to which urban residents are subjected to these hazardous events [5]. In rapidly growing cities, factors such as high population density associated with inadequate infrastructure and informal settlements often make their residents vulnerable, particularly during extreme weather events [7].
Vulnerability in this study is defined as the predisposition to suffer adverse effects from exposure to natural hazards, as expressed by the Intergovernmental Panel on Climate Change (IPCC) [8]. Vulnerability encompasses several dimensions, including physical, social, economic, and attitudinal vulnerability [9]. Physical vulnerability refers to the direct harm, like injuries or fatalities, caused by hazards such as extreme weather [9]. Social vulnerability refers to the increased risk from natural hazards due to factors like demographic characteristics (age, gender, level of education), community cohesion, and resource access [10]. The economic vulnerability involves the financial losses from hazards and the resources available for recovery, while attitudinal vulnerability highlights how attitudes and behaviors can affect preparedness and response [11,12]. In this study, the primary focus is on social and economic vulnerability, as these dimensions are critical for understanding how different individuals or groups experience and cope with natural hazards. The choice of these dimensions is influenced by the fact that vulnerability is also understood further through three interrelated components: sensitivity, susceptibility, and adaptive capacity [5,13]. Sensitivity reflects how severely a community or individual is affected by changes brought about by hazards [8]. For instance, populations with limited access to healthcare facilities and services may suffer more profoundly during health crises or natural disasters [14,15]. Susceptibility denotes inherent weaknesses that predispose communities or individuals to adverse effects; for example, low-income groups or poorest communities may lack resources or social support systems that could mitigate harm during emergencies [8]. Adaptive capacity is a critical aspect of vulnerability that describes the ability of communities or individuals to adjust in response to harmful events or mitigate potential damage [8,16]. This capacity is influenced by various factors, including socio-economic status [7]. In this regard, urban areas with strong socio-economic status are frequently better able to respond to and adapt to hazards.
Urban socio-economically deprived individuals and communities often reside in areas prone to natural hazards, which significantly heightens their exposure to various risks [7]. This exposure is especially hazardous because these populations often possess limited capacity for mitigation or adaptation, rendering them highly vulnerable to natural hazards [16]. Natural hazards occurrence is becoming more frequent and more severe as urbanization and climate change continue to grow. This occurrence poses a severe threat to public health, particularly in Global South areas with high socio-economic sensitivity and poor adaptive capacity [17]. Understanding socio-economic vulnerability associated with the climate change related hazards is crucial for developing effective strategies aimed at preventing risks and mitigating damages caused by natural hazards toward enhanced socio-economic conditions and public health outcomes [7,10]. However, this understanding is missing due to the high reliance on extensive data that is often unavailable in many cities of the Global South. Consequently, the assessment of socio-economic vulnerability to natural hazards is frequently ignored despite its importance to identify how natural hazards affect the urban population [7,18].
Countries in the Global South lack the required data for assessing socio-economic vulnerability to natural hazards, which complicates their ability to implement effective disaster risk reduction strategies [19]. One of the primary issues is the lack of comprehensive and reliable data, which is critical for understanding the socio-economic conditions of vulnerable populations [20]. Many areas do not have systematic data collection mechanisms, leading to gaps in information regarding population demographics, income levels, health outcomes, and access to basic services [19]. This absence of data hinders the development of accurate vulnerability assessments and makes it difficult for policymakers to identify the most at-risk communities and tailor interventions accordingly [21]. Moreover, the quality of available data is often questionable. In many cases, existing data are outdated or incomplete, failing to capture the changing socio-economic conditions. For instance, socio-economic data of informal settlement dwellers are often not included in national statistics, leading to an underestimation of the risks faced by their residents [21]. In this regard, reliance on national-level data obscures local vulnerabilities, as small spatial scale disparities in socio-economic conditions and exposure to hazards are not adequately represented at large spatial scales. Additionally, socio-political factors further complicate the data collection efforts. In many Global South countries, political instability, corruption, and inadequate governance can impede effective data gathering and sharing [22]. Furthermore, the data challenge results from a lack of political will to prioritize socio-economic vulnerability in risk assessment and management or a lack of budget for data collection initiatives [22]. As natural hazards become more prevalent in urban areas, reliable data is needed to support risk assessments and adaptation strategies.
Recent advancements in technology offer potential solutions to data challenges. Remote sensing and machine learning techniques have shown a promising capacity to obtain and process large-scale datasets for hazard modeling. Several studies have applied these technologies to address various urban challenges such as flooding, landslides, and gullies development in urban areas. For instance, [7,23,24] have use remote sensing-based satellite imagery in combination with machine learning for measuring flood susceptibility. Refs. [25,26,27,28] applied machine learning to evaluate multi-hazards including flooding and landslides. Despite these advancements, most of the studies utilizing remote sensing and machine learning have primarily focused on hazard assessment rather than integrating socio-economic vulnerability into their risk frameworks. While few studies have attempted this integration ([12,13,29,30]), they often develop approaches and frameworks tailored to specific input data sets and localized areas, which limits their broader applicability in both data-rich and data-scarce regions. This underscores the need for new approaches that can bridge the gap between hazard modeling and socio-economic vulnerability assessment.
Therefore, this study proposed a flexible and scalable framework for mapping socio-economic vulnerability to natural hazards in urban areas, specifically designed to support more effective and equitable public health interventions in data-scarce urban environments. The significance of this research lies in its potential to address gaps in understanding how socio-economic factors influence vulnerability to natural hazards, particularly in rapidly urbanizing regions of the Global South. By focusing on the City of Kigali, the proposed framework was applied to map flood susceptibility and socio-economic vulnerability to flooding. The obtained maps were locally validated through a combination of historical flood data comparison, comparative analysis with existing socio-economic studies, adherence to established methodologies, and qualitative assessments using local knowledge. In order to evaluate the scalability of the proposed framework and enable comparative analysis across several urban contexts, it was applied to the cities of Dar es Salaam, and Kampala, in Tanzania and Uganda, respectively. The results derived from this study contribute to a deeper understanding of socio-economic vulnerabilities in urban areas prone to natural hazards, ultimately informing policy decisions and resource allocation for targeted interventions for enhanced resilience and improved public health outcomes.
This paper is structured in the following manner: materials and methods for this study are presented in the next part, which also gives a summary of the proposed framework and how it was utilized to map Kigali's socioeconomic susceptibility to floods. This is followed by a section on the scalability and transferability of the proposed framework, which highlights its relevance in different urban settings. The results and discussion section present key findings and their implications, and limitations of the study. Finally, a concluding section summarizes the results and emphasizes the importance of the study and integration of socio-economic vulnerability assessments into urban planning and disaster risk management strategies.
2. Materials and Methods
2.1. Description of the Proposed Framework
The proposed framework is a result of a review of recent research on hazard risk modeling and mapping and socio-economic vulnerability assessment [7,12,18,24,28,30–34]. As seen in Figure 1, the framework is composed of three primary components. The first component, which is shown in blue on the left side of Figure 1, consists of measuring hazard susceptibility by combining machine learning models with data from remote sensing. This component enables users to model susceptibility for one or multiple hazards by leveraging data that is readily available for the area of interest. The flexibility inherent in this component allows practitioners to select the most suitable machine learning algorithms depending on the specific characteristics of geographical area, the hazards being modeled, and available data. Various machine learning methods, including Random Forest (RF), Gradient-Boosted Decision Trees (XGBoost), Support Vector Machines (SVM), and Artificial Neural Networks (ANN), have demonstrated good performance in hazard susceptibility assessments in various studies [23,24,35–38]. The application of these models facilitates an understanding of hazard dynamics.
The second component, presented in green on the Figure 1’s right side, involves analyzing socio-economic data to evaluate socio-economic vulnerability. This component emphasizes the use of diverse socio-economic indicators and multivariate analysis techniques, such as regression models, Principal Component Analysis (PCA), Analytic Hierarchy Process (AHP), and Composite Indicator (CI) approaches [10,33,39]. These methodologies enable to quantify sensitivity and adaptive capacity effectively. The final component, represented at the bottom in orange, creates a socio-economic vulnerability index by combining hazard susceptibility with quantified sensitivity and adaptive capacity. This combination is crucial for assessing and mapping socio-economic vulnerability associated with natural hazards, as demonstrated by various studies [7,9,13,40]. Therefore, the proposed framework would support the development of effective hazard management strategies and inform policy decisions aimed at enhancing community resilience.
2.2. Application of the Proposed Framework to Mapping Socio-Economic Vulnerability to Flooding in the City of Kigali
The case study of the City of Kigali, Rwanda, where flooding is a frequent natural hazard, was used to evaluate the proposed framework. The following sections present the case study area, a description of the data used and their sources, historical flooding data, data about factors influencing floods, and socio-economic data. These are followed by the estimation of flood susceptibility by training and testing various machine learning models. The best-performing model was used to obtain the flood susceptibility index. Additionally, the study applied Indicator-based approaches to compute Sensitivity and Adaptive Capacity using socio-economic data. The obtained result was finally used to compute and map socio-economic vulnerability to flooding by integrating flood susceptibility. Details on each step are presented in the following sections.
2.2.1. Description of City of Kigali
The City of Kigali is the largest city of Rwanda, and serves as the capital and focal point of economic activities. In terms of administration, the City of Kigali is comprised of three districts (Figure 1), which are further subdivided into 35 sectors, which account for 161 cells and 1,176 villages. The village represents the lowest and smallest administrative unit, which is referred to neighborhood in this study [41]. Located near the geographic center of the country, Kigali is a city that is exhibiting rapid urban growth and economic transformation. Spanning over 730 square kilometers, it is home to more than 1.7 million people and is pivotal to Rwanda's socio-economic landscape [41]. The city exhibits a diverse array of land-use types, including commercial, residential, industrial, agricultural, and public facilities, alongside wetlands and water bodies [42]. Over the past two decades, Kigali has undergone significant urban expansion and development. The city has seen a rapid increase in built-up areas whereby the urban landscape is a mosaic of modern high-rise buildings, residential neighborhoods, commercial zones, and informal settlements [43,44]. This is particularly true in the urban central core, where continuous modernization is observed through the presence of modern buildings and upgraded road networks. This rapid urbanization has often outpaced the development of adequate infrastructure [45]. Consequently, majority of informal settlements are frequently found in the most vulnerable areas, which are highlighted by Kigali’s urban fabric and include steep hillsides and flood-prone valleys [42]. These areas lack proper sanitation, drainage, and other basic services, exacerbating the vulnerability of their residents to natural hazards [46]. Despite significant economic progress, substantial socio-economic inequalities persist, with large segments of the population living in poverty [43,47]. Many residents, particularly those living in informal settlements, do not have access to essential services including sanitation facilities, clean water, and healthcare [46,48]. These socio-economic disparities mean that the poorest and most vulnerable populations are disproportionately affected by natural hazards. They often reside in the most at-risk areas and have the least capacity to recover from adverse events, creating a cycle of vulnerability and poor health outcomes.
Kigali's geography is characterized by its hills and valleys, with elevations ranging from approximately 1,300 meters to over 1,600 meters above sea level, which influences the city's drainage patterns [42]. The steep slopes accelerate water flows, resulting in a higher volume of water that accumulates in valleys, which, when combined with seasonal severe rainfalls, frequently leads to flooding [49]. Flooding in Kigali, like in other areas, is a complex natural hazard characterized by the overflow of water beyond its normal limits, often resulting from heavy and prolonged rainfall [50]. Flooding is particularly noticeable in urban areas due to rapid urban growth, which has reduced vegetation cover and increased impervious surfaces and runoff, and hence exacerbating the risk of flooding in places with lower elevation. Furthermore, the combination of increased surface runoff due to urbanization and inadequate drainage systems hinders groundwater recharge and leads to the accumulation of excess water during rain events [51].
The consequences of flooding in Kigali, like in other urban areas, are severe and multifaceted. Immediate impacts include loss of life and destruction of buildings, utilities, roads, bridges, and other infrastructure. Additionally, flooding can compromise water supply systems, increasing exposure to contaminated water and facilitating the spread of infectious diseases such as dengue, malaria, measles, meningitis, and typhoid [52]. Furthermore, flooding impacts individuals with chronic health conditions by damaging critical infrastructure and creating barriers to accessing essential health services [14,15].
2.2.2. Overview of Data
The study used a data-driven approach following the proposed framework to map socio-economic vulnerability to flooding for public health interventions in Kigali. In the City of Kigali, historical flood data has not been recorded as geospatial data, making it challenging to extract geospatial flood information directly from reports. To overcome this, data on previous floods was extracted using Synthetic Aperture Radar (SAR) imagery from Sentinel-1 using the same methods as studies for flood modeling [53,54]. Based on flood incidents reported by the Rwandan Ministry in Charge of Emergency Management, two SAR images were selected: one acquired prior to a period of heavy rainfall on December 22, 2019, and the other taken following a flood event on December 25, 2019. Image ratioing and Otsu's thresholding methods [55] were applied to detected and delineate floodwater, from which 456 flood points and 484 non-flood points were randomly generated (A figure illustrating their distribution is a presented in Figure A1 in Appendix A). These were divided into 80% training and 20% testing datasets. Non-flooded points were assigned a value of 0, whereas the target class value points were given a value of 1. In addition, nine flood-influencing factors were identified after a review of various studies on flood susceptibility assessment and considering the geographic appearances of the study area. Table 1 describes the factors that influence floods and the associated data sources used in this study.
The min-max approach was used to normalize all factors to the range [0,1] after they were transformed to raster with a spatial resolution of 10m (Equation 1).
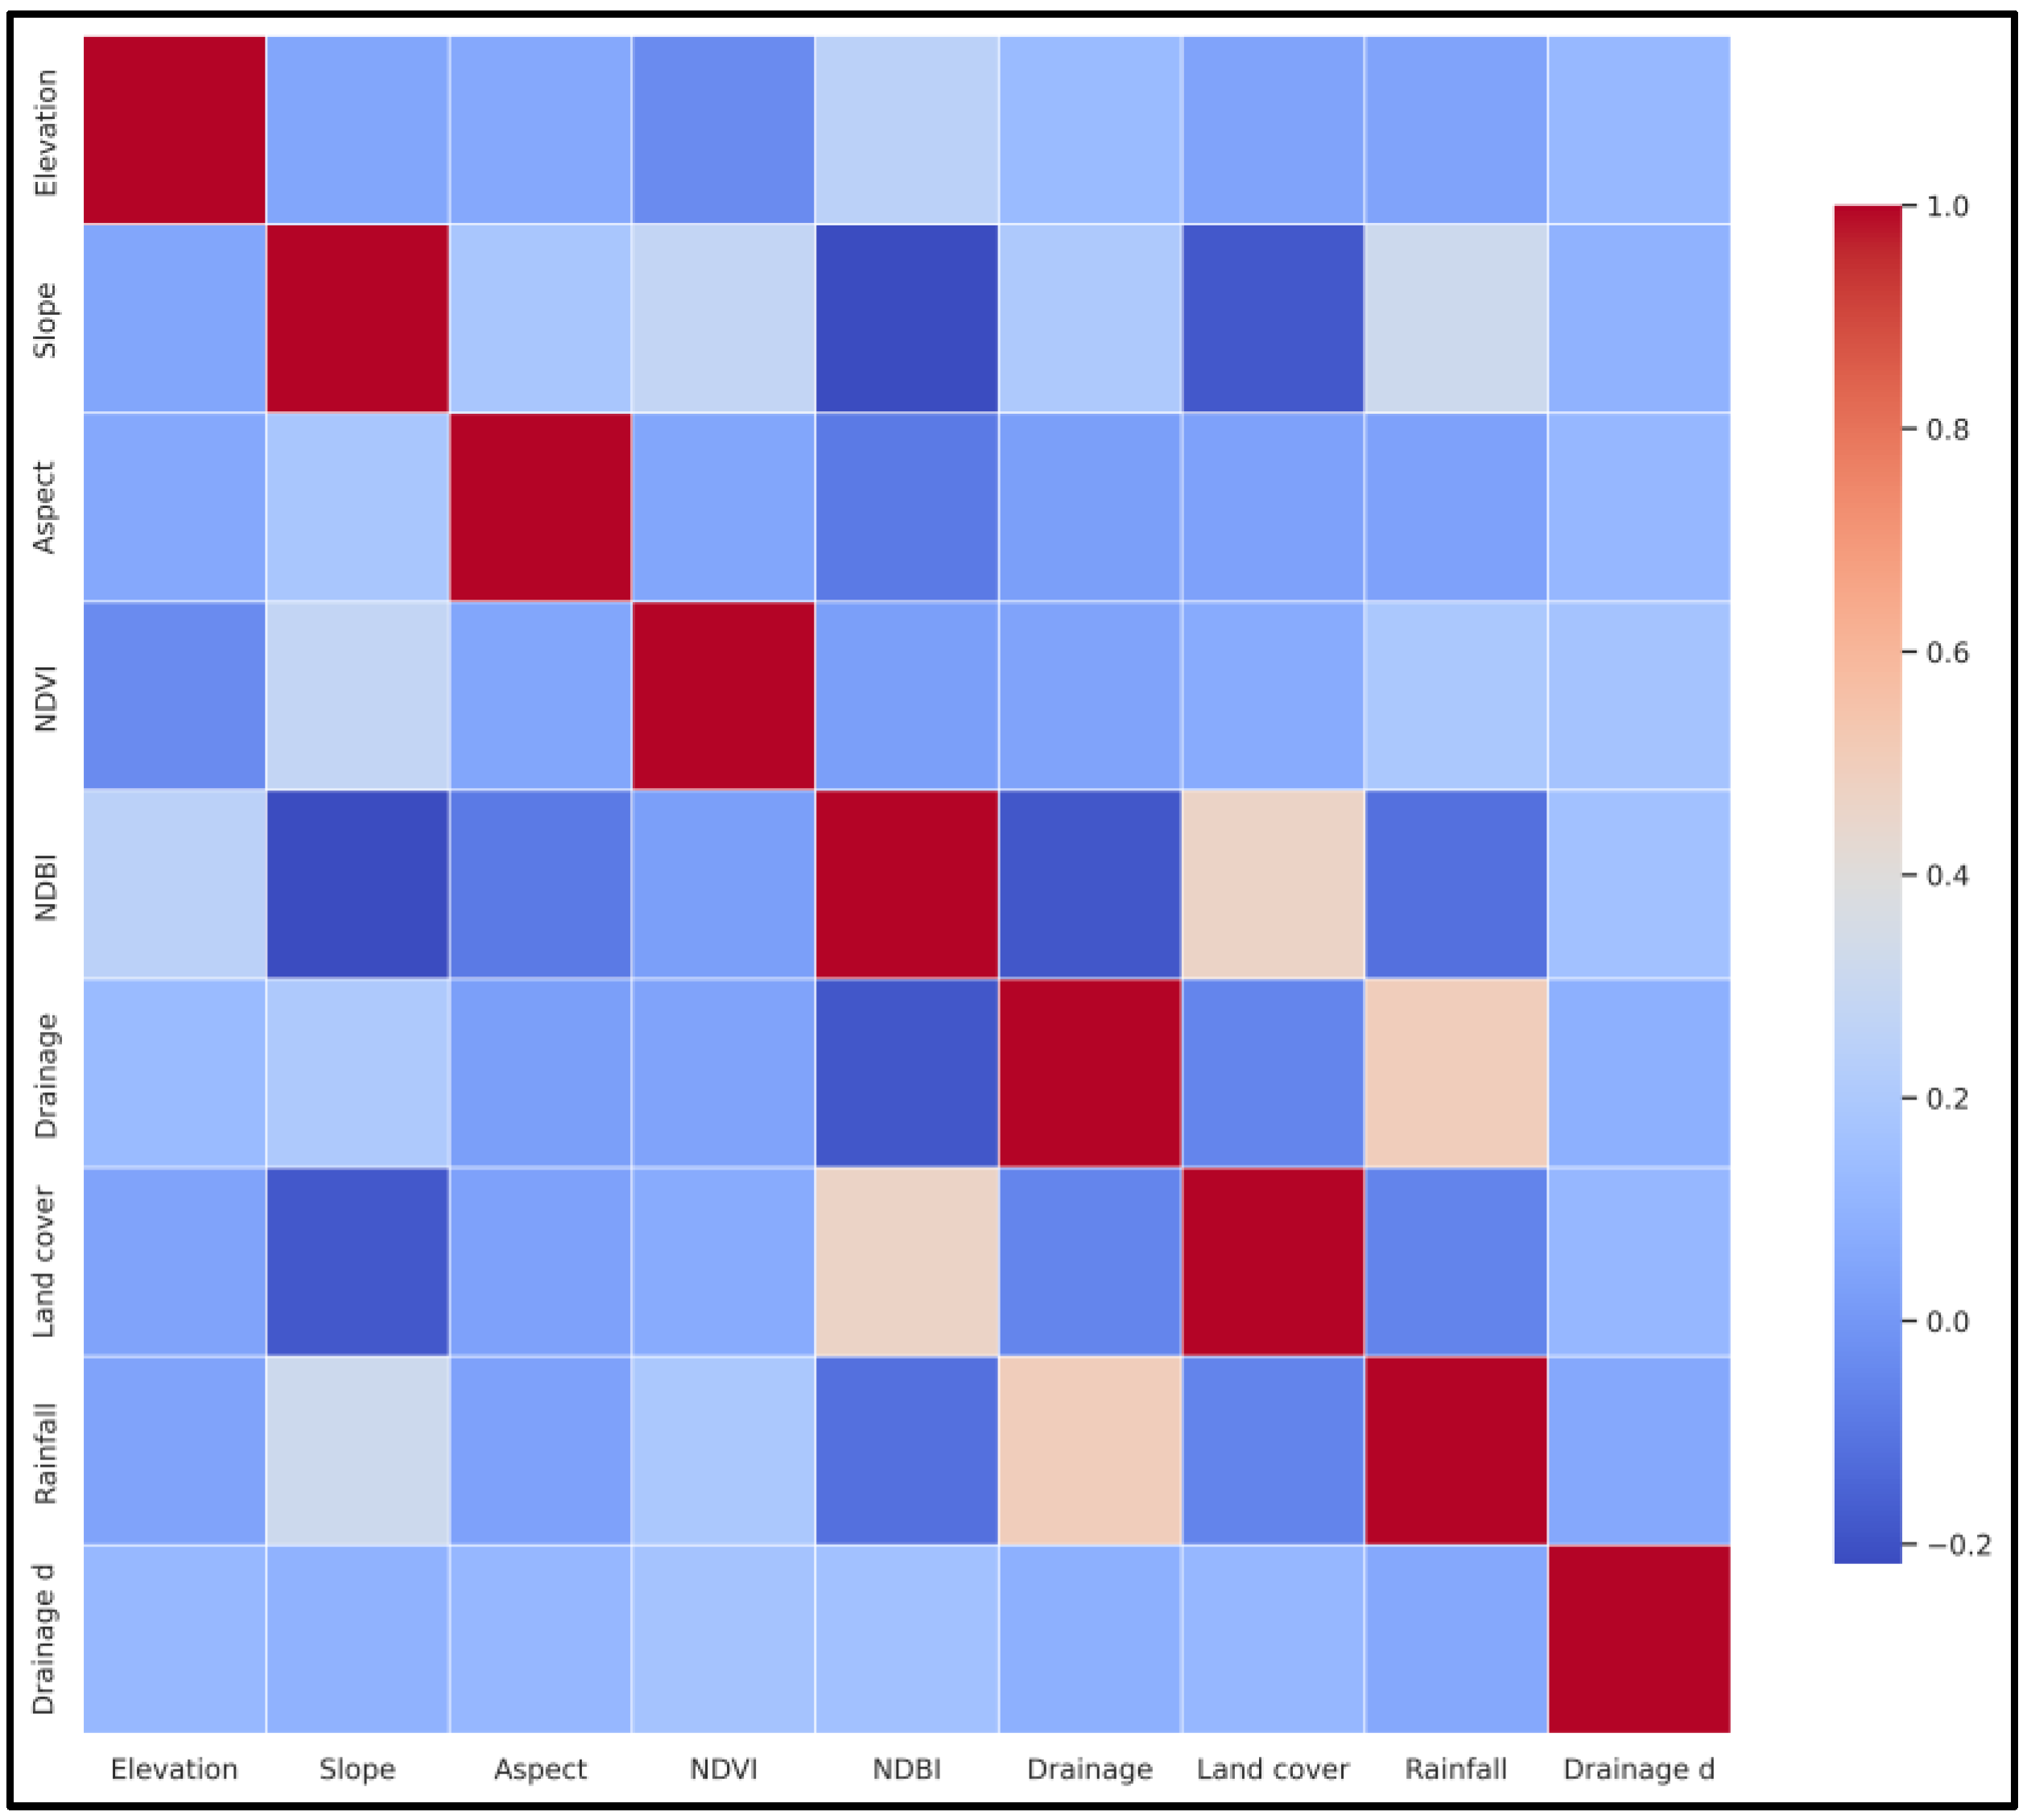
Where X is the original value, Xnorm is the normalized value, Xmin is the dataset's minimal value, and Xmax is its highest value. This provides data ranging from 0 as low value and 1 as maximum value for all factors except for land cover, whereby low values represent class water class followed by forest, green spaces, and agricultural land toward built-up and bare land classes. Normalization is used in data analysis as a critical preprocessing step because the study used various datasets containing variables that were measured on different scales. Therefore, by applying normalization, all variables in datasets were transformed to a common scale to ensure that no single variable disproportionately influences the results due to its scale [67]. In addition, a correlation analysis was used to detect multicollinearity among these factors (Figure B2 in the Appendix B illustrates the correlation matrix for all factors). The goal of this correlation analysis was to identify and remove highly correlated factors that could adversely affect model performance and interpretation, leading to unreliable predictions [68]. Multicollinearity was quantified by correlation coefficient, which provides insight into the relationships between input factors. A correlation coefficient greater than 0.7 typically indicates a strong correlation, suggesting potential multicollinearity issues. Thus, any factor exceeding a correlation coefficient of 0.7 was not included. Figure 3 presents factors that were included in susceptibility modeling. The results on the correlation analysis are presented in Appendix B.
2.2.3. Flood Susceptibility Estimation with Machine Learning Models
Machine Learning models like Naïve Bayes (NB), K-Nearest Neighbors (KNN), Logistic Regression (LR), RF, SVM and XGBoost and ANN, have been widely used for analyzing and assessing natural hazards risks [25–28,30,69]. All models present advantages as well as disadvantages, and no single model is known to be the best generalized model for the assessment and analysis of hazard risks. Four machine learning models—RF, SVM, XGBoost, and Multilayer Perceptron (MLP)—were employed in this study. The choice of these models was guided by existing literature on modeling hazard risks, and which highlighted their ability to combine the raster images of environmental factors influencing flood occurrence [24]. These models are suitable for mapping flood susceptibility because they are able to learn complex and non-linear associations between various input data spatial data. Additionally, these models were selected based on the datasets that were locally available for the study. Accuracy, Precision, Recall, F1-Score, and the area under the receiver operating characteristic curve (AUC) were used to assess the performance of models. These metrics are widely used in machine learning to assess the performance of models, especially in classification tasks [24,25,30,35,68]. Each model was optimized using k-fold cross-validation and hyperparameter tuning. Consequently, flood susceptibility indices were obtained using the model that performed the best based on the evaluation metrics on the testing dataset. The obtained indices were used to create a map of flood susceptibility index, whereby for comprehensive visualization, indices obtained were grouped in intervals for ease based on the natural breaks classifying method. In addition, flood susceptibility was aggregated at neighborhood-level. This aggregation facilitates understanding of susceptibility at small administrative level, which help the framework to provide more actionable information required for local authorities and stakeholders to formulate targeted interventions [70].
2.2.4. Mapping Socio-Economic Vulnerability to Flood
Mapping of socio-economic vulnerability to natural hazards consisted of the selection of socio-economic factors, data collection, data analysis/construction socio-economic vulnerability index/score, and socio-economic vulnerability mapping. Socio-economic indicators employed in this study were selected after a review of literature and available data sets. The indicators included are described in Table 2.
Following the selection of indicators and the collection of data for each indicator, the values were normalized using the Min-Max method (see equation 1), which results in values between 0 and 1, with 0 denoting the lowest value and high denoting the highest value for each indicator. This allowed for the generation of comparable datasets. Figure 4 illustrates these normalized values and their geographic implications, providing a clear depiction of how various socio-economic factors contribute to overall vulnerability levels.
To construct a socio-economic vulnerability score, the study initially tried PCA, which is known as the best for avoiding expert bias while speeding up the process of the assessment [13]. To ensure that the available datasets were suitable for PCA, the study conducted the Kaiser-Meyer-Olkin (KMO) test. The results indicated that the datasets were not suitable for PCA whereby KMO was below 0.8, a threshold for which the PCA is considered reliable [78]. Benefitting from the flexibility of the proposed framework, the study employed an indicator-based approach to compute the socio-economic vulnerability index as an alternative. The overall socio-economic vulnerability (SEVi) was calculated by combining flood susceptibility (FSi), sensitivity (Si), and adaptive capacity (ACi) into a unified index, following equation (2) adopted from [12]:
SEVi = FSi + Si - ACi
Whereby sensitivity Si for each area i was calculated as the sum of the proportions of Popd, Pop<5, and Pop>65 represent the normalized proportions of the population density, population under 5 years and over 65 years in each area, respectively, given by equation (3) adopted from [10]:
Si = Popd + Pop<5 + Pop>65
Adaptive capacity ACi was determined by access to key infrastructure and services that support community resilience to environmental hazards. Therefore, the adaptive capacity index was calculated by following equation (4):
ACi = PHFi + POIi + RNi
Where PHFi, POIi, and RNi are the normalized values representing access to healthcare, the density of POIs, and road network infrastructure in area i. Obtained SEVi was normalized using equation (1). Since flood susceptibility was aggregated at neighborhood level, socio-economic vulnerability was also aggregated at the same scale to keep spatial consistency, allow understanding of spatial distribution of vulnerability at small administrative unity for facilitating communication of information.
2.2.5. Validation of Flood Susceptibility and Socio-Economic Vulnerability Maps
The flood susceptibility map was validated against historical flood data by assessing the correspondence between identified susceptible areas and actual past flood events, as illustrated in Figure C1 of Appendix C. Additionally, the socio-economic vulnerability map was validated through comparative analysis with existing studies that have mapped socio-economic inequalities and poverty within the same study area. This validation process was further strengthened by referencing methodologies from other successful flood susceptibility modeling and socio-economic vulnerability assessments, ensuring adherence to established standards. Furthermore, qualitative validation was achieved through visual inspections and local knowledge, which helped confirm that the outputs were consistent with the area's social, economic, geographic, and environmental conditions.
2.3. Scalability and Transferability of the Framework
To evaluate whether the proposed framework is transferable, the study focused on historical flooding data from Kampala and Dar es Salaam, which were extracted from Sentinel-1 imagery, specifically targeting flood events that occurred between May 2019 and September 2020 in Kampala and October 2020 in Dar es Salaam (https://floodlist.com/africa, accessed on July 2024). To facilitate this analysis, Digital DEMs from the Shuttle Radar Topography Mission (SRTM) were utilized to derive essential topographic features, including slope, elevation, aspect, and drainage density. Furthermore, cumulative rainfall data were sourced from CHIRP, while land cover information was obtained from ESRI. The NDVI and NDBI were calculated using Sentinel-2 images. The scalability and transferability were limited to testing machine learning models and tuning and validation to ensure accurate predictions.
Initially, the MLP model trained on data from Kigali was applied to predict flooding in both Kampala and Dar es Salaam. This step aimed to evaluate how the model can adapt to different geographical contexts. Following this initial application, the model trained on Kigali was fine-tuned by using subsets of data specific to Kampala and Dar es Salaam. This iterative process was aimed at learning how model capability improves while being exposed to local conditions through data variation for flood susceptibility mapping. Furthermore, the scalability of the proposed framework was evaluated by training MLP, SVM, RF, and XGBoost models in both cities, systematically splitting the available data into training (80%) and testing (20%) sets. This methodological approach allows for a comprehensive analysis of how effectively the framework can be adapted and applied across different urban contexts, even when the transferability is not well-suitable.
4. Results and Discussion
4.1. Flood Susceptibility Map
The results presented in Table 3 indicate the performance of the model based on AUC, Accuracy, Precision, Recall, and F1-Score metrics. Figure 5 presents variation of AUC on test data for all models. The results show that the MLP model exhibits the best performance with an AUC of 0.902, indicating it has the highest ability to distinguish between positive and negative cases. This performance is complemented by its Accuracy of 0.85, meaning it accurately predicts 85% of cases. MLP also excels with a Precision score of 0.83. MLP also presents a high Recall of 0.90, indicating they are equally effective at capturing true positive cases. Finally, the MLP again outperforms others with an F1 Score of 0.86, reflecting its overall effectiveness in balancing precision and recall. Following closely, the SVM model demonstrates nearly equivalent performance to MLP, though it has slightly higher prediction errors. The RF model performs slightly behind SVM in terms of AUC but still shows excellent classification ability, as witnessed by its metrics. Finally, the XGBoost model is marginally less effective than the other models, though its performance is still commendable. While all models show strong performance with minimal differences, making them all viable candidates for classification tasks, MLP stood out slightly in all metrics. Thus, it was selected as the best model and was applied to the entire study area to compute flood susceptibility.
While MLP and SVM demonstrate high performance, they are less interpretable and require additional methods to understand the factors that significantly contribute to their predictive capabilities. MLPs, like other artificial neural networks, are often regarded as black box models due to their complex architectures, which offer minimal inherent interpretability [79]. Similarly, the non-linear kernel SVM model used in this study also lacks transparency and interpretability [80]. This makes their adoption to the domain application for decision makers very hard. In contrast, RF and XGBoost emerge as more interpretable models. Both models have a straightforward analysis of feature importance, allowing users to easily identify which features most significantly influence predictions. Figure 6(a) and 6(b) illustrate the feature importance for RF and XGBoost, respectively. The results shown in these figures indicate that slope and elevation play crucial roles in predicting flood susceptibility across the City of Kigali.
Figure 7 also indicates partial dependence plots for slope and elevation for RF model. The results in the figure illustrates that for the slope, the predicted probability of the flooding is high for lower slope values but decreases sharply as the slope exceeds approximately 0.1, eventually stabilizing at higher values. While for Elevation, the figure indicates a strong negative relationship with the predicted outcome, where the probability is high at very low elevations but decreases substantially as elevation increases, remaining constant at higher elevation levels.
The result presented in Figure 8 (a) and (b) present flood susceptibility map generated using MLP model, and its respective aggregation at the neighborhood level. These results highlight part of the city with darker brown shades, which represent higher susceptibility to flooding, while lighter shades indicate lower susceptibility. The central and southern parts of the region show the highest susceptibility, which makes them more prone to flooding. On the contrary, the northern and northeastern parts show lower flood susceptibility. This result illustrates that the MLP model was able to identify areas with high flood susceptibility, which closely aligns with historically flooded locations. This model's strong predictive capabilities are rooted in its ability to map complex non-linear relationships between environmental factors such as topography, land use, and hydrological conditions, as highlighted by [25,27,28]. By integrating diverse data inputs such as topography, land use, and hydrological conditions, the model generates a comprehensive susceptibility map, which not only identifies high-risk zones but also provides critical insights for developing further actions targeted to protect the public against health risks associated with flood exposure. This ability of the model to predict flood susceptibility would allow decision-makers to enhance disaster preparedness, mitigate health risks, and implement community-level responses. Thus, the result emphasizes the need for targeted public health actions, as floods can significantly impact both physical infrastructure and public health by increasing the risk of waterborne diseases, injuries, and disruptions to healthcare access, as shown by malaria [14,81]. The resulting map would serve as a valuable tool for planners and public health officials, helping them prioritize flood prevention measures such as enhanced drainage systems, flood barriers, and land use regulations in high-risk areas while also guiding emergency preparedness and healthcare resource allocation.
4.2. Socio-Economic Vulnerability Map
The result presented in Figure 9 (a) and (b) present socio-economic vulnerability to flooding across the City of Kigali. They reveal how flood susceptibility, a prevalent environmental hazard in Kigali due to its hilly terrain and frequent heavy rainfall, disproportionately affects socio-economically vulnerable populations. The darker shaded areas on the map represent higher socio-economic vulnerability resulting from high flood susceptibility and sensitivity and with relatively low adaptive capacity. These areas are characterized by informal settlements, lower income levels, inadequate infrastructure, and limited access to essential services such as access to healthcare facilities, as highlighted [46,48]. In contrast, the central parts of Kigali, which exhibit lower vulnerability, benefit from improved urban planning, robust infrastructure, and more resilient housing, as shown by [43,47,49]. The spatial variation of socio-economic vulnerability across the city indicates that the presence a higher concentration of the population, especially young and elderly residents, reside in high-socio-economic vulnerable areas prone to flooding, such as next to wetlands or in informal settlements with poor drainage systems. These locations amplify the risks associated with heavy rainfall and flooding, potentially leading to catastrophic outcomes like property loss, displacement, and increased exposure to health hazards.
Socio-economic vulnerability to flooding highlights the limited capacity to respond and recover from flooding and often leads to widespread health problems, including outbreaks of waterborne diseases such as cholera, typhoid, and dysentery [7,13]. Floodwaters can contaminate drinking water supplies and overwhelm already fragile sanitation systems, creating a favorable environment for disease transmission [51]. Moreover, stagnant water resulting from poor drainage systems can become a breeding ground for mosquitoes, increasing the incidence of vector-borne diseases like malaria [52]. Thus, in urban populations with less adaptive capacity, such as residents with limited socio-economic means and limited access to healthcare access, these health issues can escalate rapidly, with a lack of timely medical intervention exacerbating the situation [14,15]. To address these issues, public health and urban planning policy can benefit from highlighting socio-economic vulnerability to flood hazard. The solutions can be achieved by focusing on targeted interventions that combine socio-economic upliftment with flood mitigation. Public health strategies should aim to improve access to healthcare in vulnerable areas, particularly by equipping health facilities to respond to flood-related health crises. Urban planning policy should ensure more equitable urban development initiatives that integrate socio-economic and environmental data to reduce vulnerability to flooding across the city. This includes ensuring that infrastructure investments are distributed more evenly, focusing particularly on informal settlements and other highly vulnerable areas. By addressing the root causes of socio-economic vulnerability to flooding, such as poverty and lack of access to services, the city can mitigate the public health impacts of flood hazards like flooding, which not only enhances the city's resilience to climate change but also contributes to long-term improvements in public health outcomes.
4.3. Scalability and Transferability
First, the study applied models trained on Kigali data to make predictions in Kampala and Dar es Salaam; the AUC and MAE obtained are presented in Table 4. In Kampala, the XGBoost model achieved the highest AUC of 0.519 and a relatively low MAE of 0.484, whereas in Dar es Salaam, the MLP model had the highest AUC at 0.402 and an MAE of 0.523. This indicates that the models trained on the Kigali dataset struggled to generalize across different urban settings, highlighting the need for continuous refinement of machine learning algorithms by incorporating local data and expert knowledge into model training processes. As urban environments evolve and data becomes more accessible, leveraging this information can lead to improved predictive Accuracy for flood events, ultimately contributing to better urban planning and flood disaster management strategies.
Then we fine-tuned network weights of MLP, which performed well on Kigali using small sub-sets of data from target cities (using 10%, 20%, 30%, 40%, and 50% of all available data for each city), performances reduced slightly to AUC of 0.491 and MAE of 0.520 for Kampala but improved slightly to AUC of 0.590 and MAE of 0.491 for Dar es Salaam. This lower performance of the employed models highlights potential limitations in their transferability, which can be due to the fact that cities are different in morphology and do not exhibit similar geographic/topographic characteristics. However, environmental conditions and urban dynamics differ significantly between cities [20,82]. For instance, all the cities used in this study to test the proposed framework exhibit different topographic/geographic patterns, socio-economic conditions, and climate. Thus, differences in the spatial distribution of flood hazard, infrastructure, or population density could affect model performance. Thus, the success of transferring models across cities may be constrained by variations in data availability, quality, or granularity.
However, despite the difficulties of transferability of the machine learning model trained on Kigali to Kampala and Dar es Salaam, the framework itself demonstrated scalability whereby when we trained the machine learning models using data from each respective city, the results on the test set revealed better performance of the models as shown in figure 10 (a and b). Additionally, the framework is designed to incorporate various data sources and machine learning models, enabling it to be applied in diverse urban environments. Its architecture allows for the integration of city-specific data, which shows its adaptability to different urban contexts.
4.4. Limitations of the Study
The study assessed and mapped social-economic vulnerability related to flood hazards using an assessment framework that leverages machine learning and indicator-based approaches. The study used different spatial data that depict different spatial aspects of flood susceptibility and urban socio-economic features. The results provide more targeted and accurate reference information for flood hazard adaptation and mitigation strategies. However, it should be noted that there are still limitations to its application: some additional variables associated with socio-economic vulnerability, such as education and income, were not included in this study since they were not available at a small scale in the study area. Although the above limitation exists in the current work, the proposed framework is designed to be flexible to allow application to areas with limited data. However, the availability of more data would provide more valuable outputs for supporting decision-making for planners and managers to positively deal with hazardous urban environments.
5. Conclusions
The effect of environmental hazards in urban areas has posed highly vulnerable situations for urban dwellers, especially dwellers with deprived socio-economic conditions. The vulnerability is highly accelerated by climate change, resulting in frequent extreme environmental hazards such as flooding, urban heat stress, and pollution. In this study, we proposed a scalable and transferable framework for mapping socio-economic vulnerability to urban environmental hazards in a data scarce urban environment. The framework integrates demographic and socio-economic factors, which are linked to remote sensing based urban environmental hazard factors using machine learning and spatial analysis. The framework was tested to map socio-economic vulnerability to flooding in the City of Kigali. Moreover, the scalability and transferability of the proposed framework were tested in Kampala, Uganda, and Dar es Salaam, Tanzania.
The results of this study indicated that the central, south, and west parts of Kigali are highly susceptible to flooding events. However, the central part is subject to the less socio-economic vulnerability associated with flooding hazards based on their enhanced socio-economic conditions, which enable dwellers of this area to adapt to the hazard event. However, areas with less socio-economic conditions are highly affected by flooding hazards. The results also indicate that the framework can be used to feature several hazards, allowing the assessment of socio-economic vulnerability related to multi-hazards in urban areas. Though the model trained in Kigali did not demonstrate efficient results when transferred to Kampala and Dar es Salaam, tuning the model with data portions from these respective cities improved efficiency, demonstrating the possibility of fine-tuning models toward transferability. The results of this study demonstrated the potential of employing multi-sourced, freely accessible data for mapping socio-economic vulnerability to environmental hazards in urban settings, which is essential to control vulnerable populations and establish strategic planning toward having more livable cities. Moreover, strengthening the ability of medical service supply and reducing inequality is also an effective vulnerability reduction strategy.
Author Contributions
Conceptualization: Esaie Dufitimana and Paterne Gahungu and Ernest Uwayezu and Emmy Mugisha and Jean Pierre Bizimana; Methodology: Esaie Dufitimana; data curation, Esaie Dufitimana; Analysis, Esaie Dufitimana; Writing—original draft preparation: Esaie Dufitimana and Paterne Gahungu and Ernest Uwayezu and Emmy Mugisha and Jean Pierre Bizimana; Writing, Review and editing: Esaie Dufitimana and Paterne Gahungu and Ernest Uwayezu and Emmy Mugisha and Jean Pierre Bizimana; Supervision: Paterne Gahungu and Ernest Uwayezu and Emmy Mugisha and Jean Pierre Bizimana. All authors have read and agreed to the published version of the manuscript.
Funding
This research was funded by the United States National Institutes of Health (NIH), grant number 5U2RTW012122-03 to the partnership of Washington University in St. Louis (WUSTL), the African Institute for Mathematical Sciences (AIMS) and the University of Rwanda (UR) and the APC was waived by the journal.
Data Availability Statement
The DEM is available on request from the National Land Authority of Rwanda, land cover is available on request at the City of Kigali, Sentinel -1 and 2 images are available from the European Space Agency (ESA) at https://dataspace.copernicus.eu/explore-data/data-collections/sentinel-data (accessed on 19 June 2024), Rainfall data are available from CHIRPS at https://www.chc.ucsb.edu/data/chirps (accessed on 22 June 2024), drainage networks data available on request at City of Kigali, Population data available from Worldpop at https://www.worldpop.org/datacatalog/ (accessed on 7 June 2024), road network and POIs available from OSM at https://www.openstreetmap.org (accessed on 5 May 2024), primary healthcare facilities are available from the Ministry of Health of Rwanda at https://geodata.rw/portal/home/ (accessed on 19 January 2024).
Conflicts of Interest
The authors declare no conflicts of interest.
Appendix A
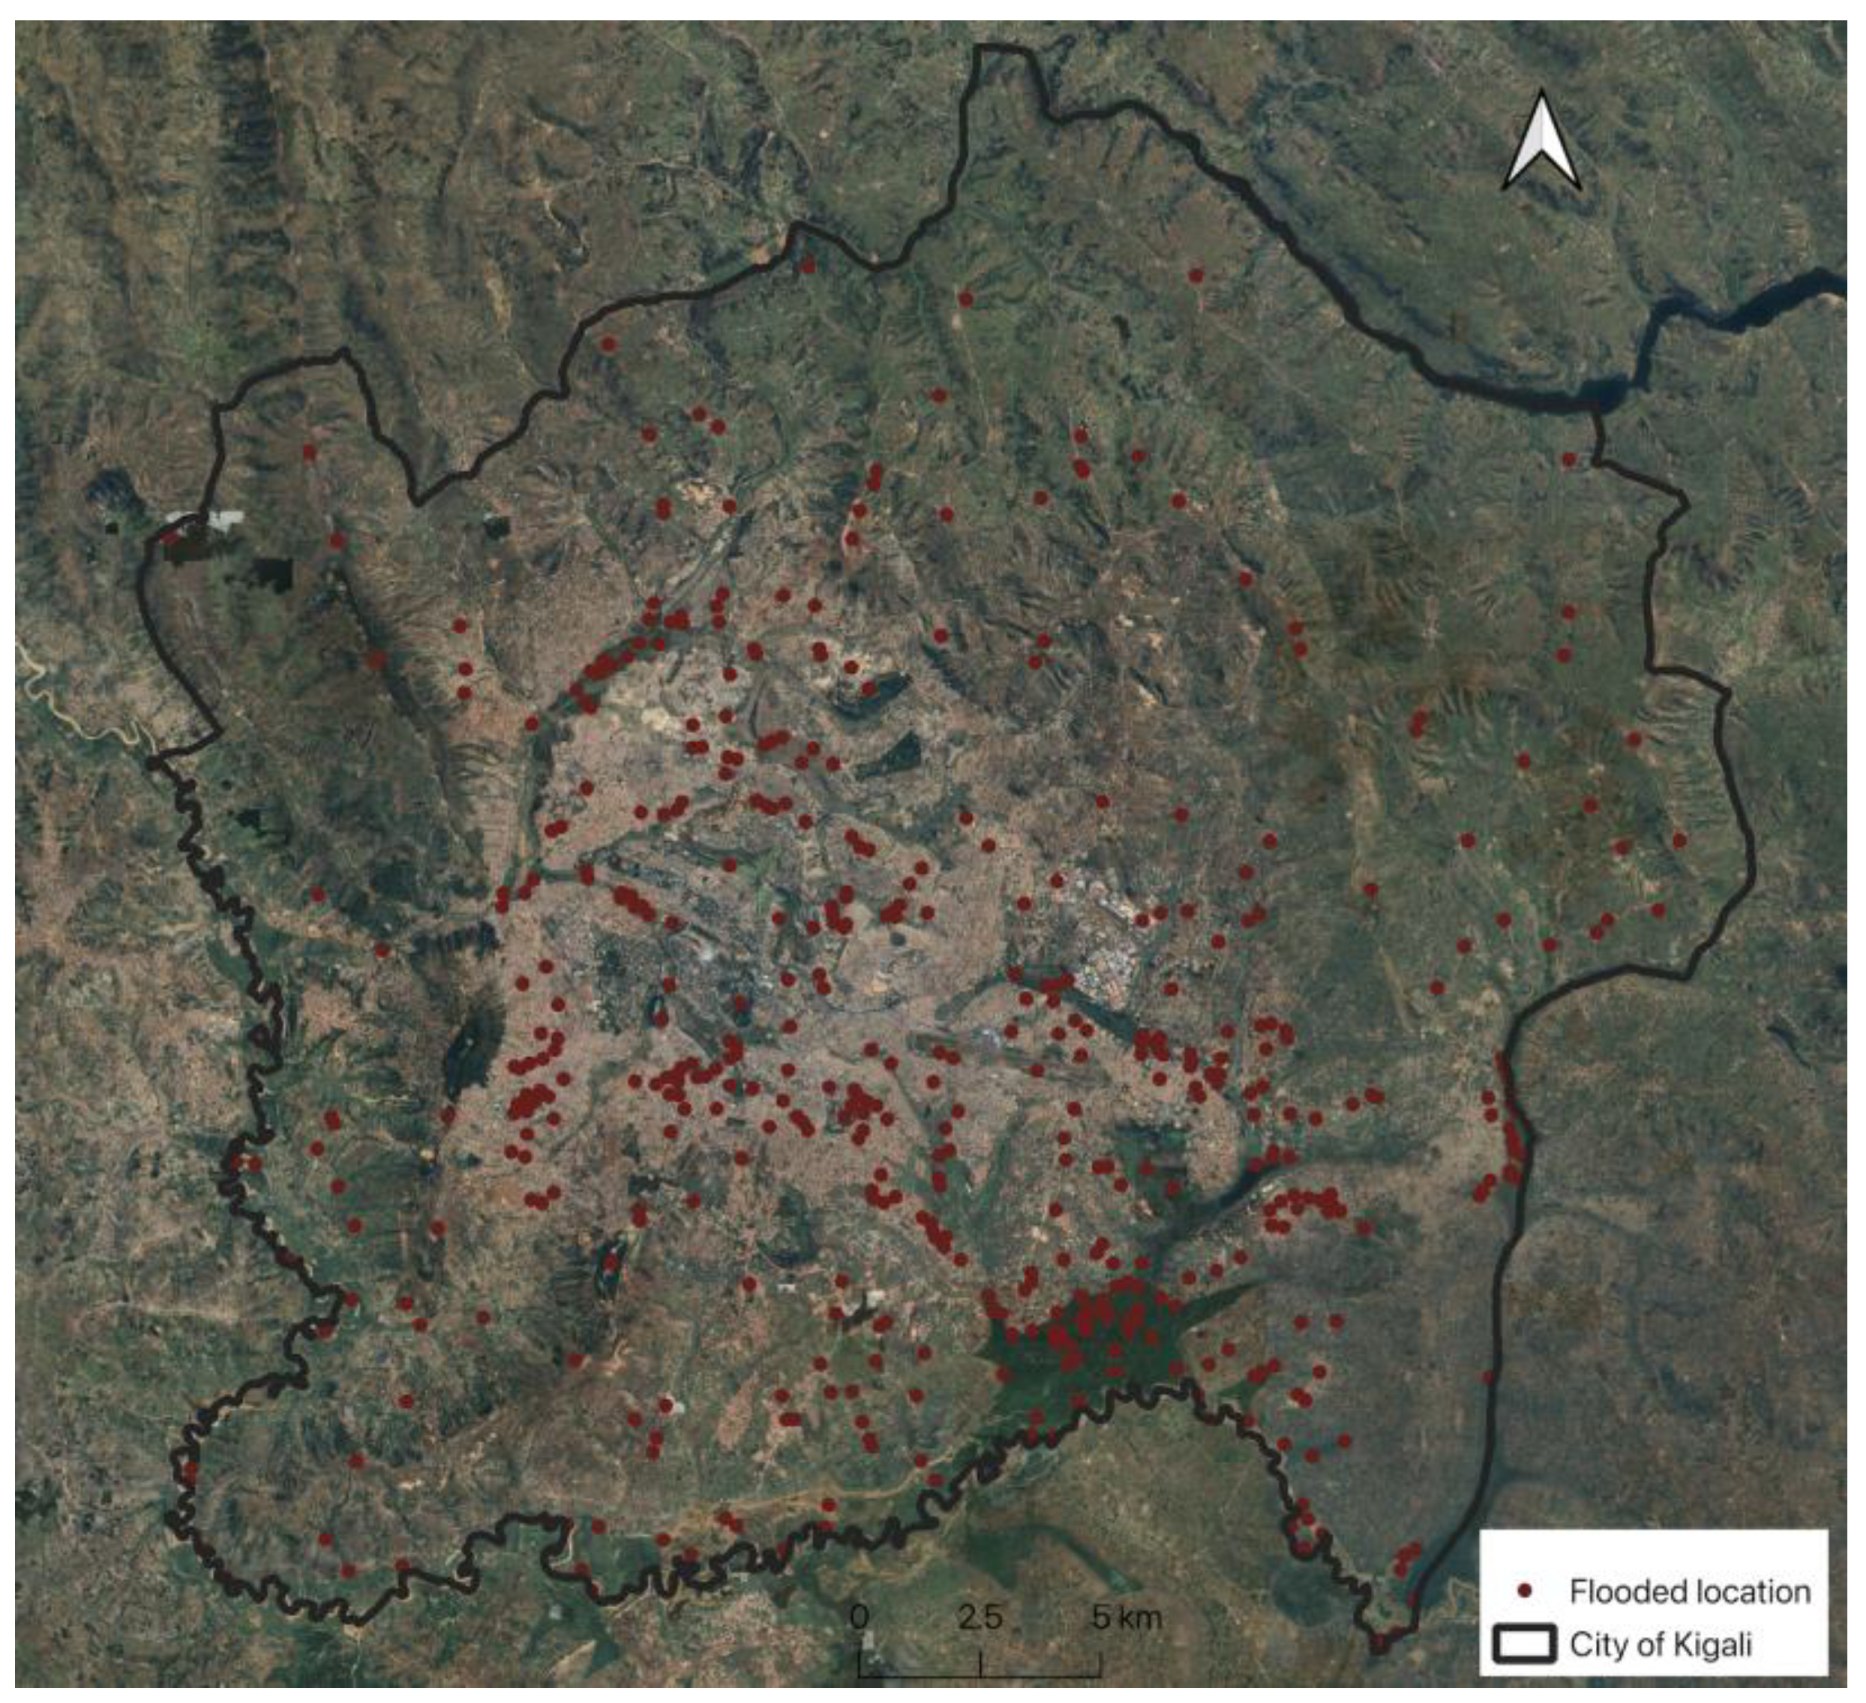
Figure A1.
Spatial distribution of 456 flood events recorded between December 22, 2019, and December 25, 2019, across the City of Kigali.
Figure A1.
Spatial distribution of 456 flood events recorded between December 22, 2019, and December 25, 2019, across the City of Kigali.
Appendix B
Figure B1 illustrates the correlation matrix among environmental factors. The strength and direction of the correlations are represented by the color gradient, with red indicating strong positive correlations, blue for strong negative correlations, and lighter shades for weaker correlations.
Figure A2.
Heatmap depicting the correlation matrix among environmental factors. (Note: Drainage d is distance to drainage).
Figure A2.
Heatmap depicting the correlation matrix among environmental factors. (Note: Drainage d is distance to drainage).
Appendix C
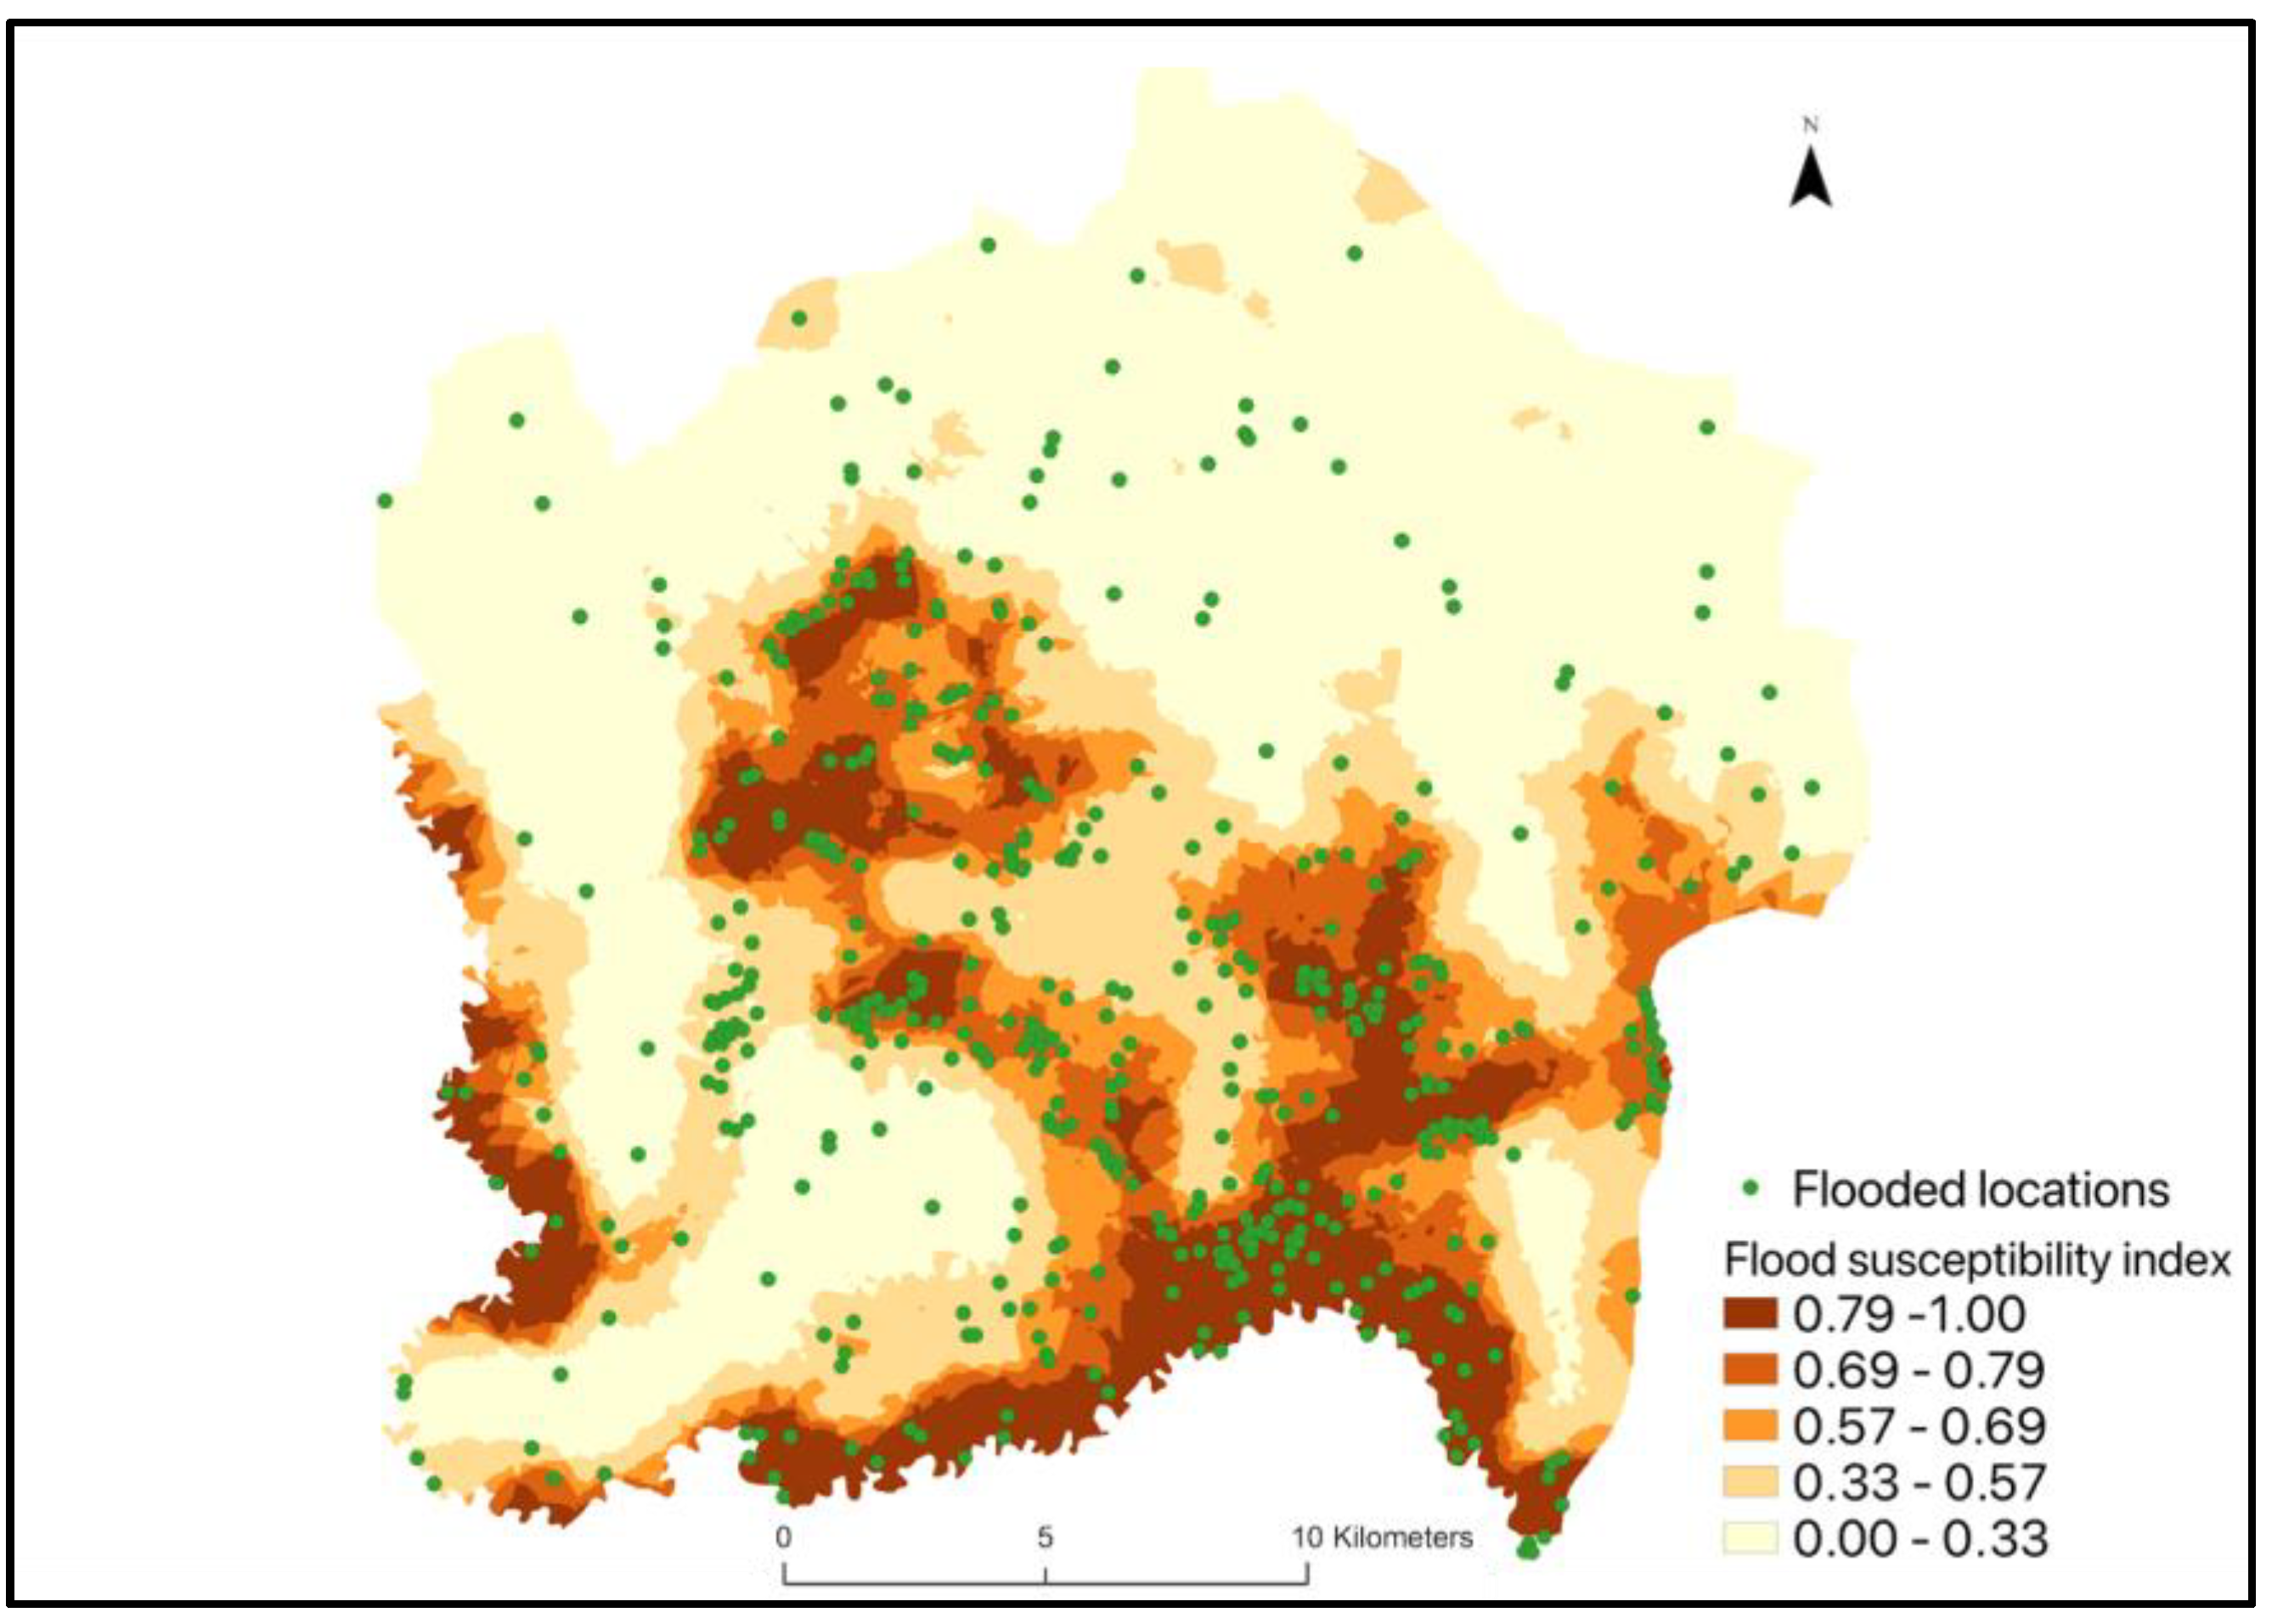
Figure C1 presents the validation of flood susceptibility map generated in this study against historical flood data.
Figure A3.
Spatial distribution of flood events overlayed on flood susceptibility map.
References
- United Nations, World Social Report 2020: Inequality in a Rapidly Changing World. 2020. Available online: http://www.un.org/development/desa/dspd/wp-content/uploads/sites/22/2020/02/World-Social-Report2020-FullReport.pdf (accessed on 12 June 2023).
- UN-Habitat, Urbanization and Development: Emerging Futures. Nairobi, 2016. Available online: https://unhabitat.org/sites/default/ files/download-manager-files/WCR-2016-WEB.pdf (accessed on 22 May 2020).
- R. Mahabir, A. R. Mahabir, A. Crooks, A. Croitoru, and P. Agouris, “The study of slums as social and physical constructs: challenges and emerging research opportunities,” Reg Stud Reg Sci, vol. 3, no. 1, pp. 399–419, Jan. 2016. [CrossRef]
- B. Alves, D. B. B. Alves, D. B. Angnuureng, P. Morand, and R. Almar, “A review on coastal erosion and flooding risks and best management practices in West Africa: what has been done and should be done,” J Coast Conserv, vol. 24, no. 3, pp. 1–22, Jun. 2020. [CrossRef]
- Intergovernmental Panel on Climate Change (IPCC), Climate Change 2022 – Impacts, Adaptation and Vulnerability. Cambridge University Press, 2023. [CrossRef]
- Galderisi and, G. Limongi, “A Comprehensive Assessment of Exposure and Vulnerabilities in Multi-Hazard Urban Environments: A Key Tool for Risk-Informed Planning Strategies,” Sustainability 2021, Vol. 13, Page 9055, vol. 13, no. 16, p. 9055, Aug. 2021. [CrossRef]
- P. Deroliya, M. P. Deroliya, M. Ghosh, M. P. Mohanty, S. Ghosh, K. H. V. D. Rao, and S. Karmakar, “A novel flood risk mapping approach with machine learning considering geomorphic and socio-economic vulnerability dimensions,” Science of The Total Environment, vol. 851, p. 158002, Dec. 2022. [CrossRef]
- IPCC, “Climate Change 2022: Impacts, Adaptation and Vulnerability,” in Climate Change 2022 – Impacts, Adaptation and Vulnerability, H.-O. Pörtner, D.C. Roberts, M. Tignor, E.S. Poloczanska, K. Mintenbeck, A. Alegría, M.K. Craig, S. Langsdorf, S. Löschke, V. Möller, A. Okem, and B. Rama, Eds., Cambridge, UK and New York, NY, USA: Cambridge University Press, 2022. [CrossRef]
- Peter Terna, “Vulnerability: Types, Causes, and Coping Mechanisms,” International Journal of Science and Management Studies (IJSMS), pp. 187–194, Jun. 2021. [CrossRef]
- E. Aroca-Jiménez, J. M. E. Aroca-Jiménez, J. M. Bodoque, and J. A. García, “How to construct and validate an Integrated Socio-Economic Vulnerability Index: Implementation at regional scale in urban areas prone to flash flooding,” Science of The Total Environment, vol. 746, p. 140905, Dec. 2020. [CrossRef]
- P. B. Julià and T. M. Ferreira, “From single- to multi-hazard vulnerability and risk in Historic Urban Areas: a literature review,” Natural Hazards, vol. 108, no. 1, pp. 93–128, Aug. 2021. [CrossRef]
- Y. Sun, Y. Y. Sun, Y. Li, R. Ma, C. Gao, and Y. Wu, “Mapping urban socio-economic vulnerability related to heat risk: A grid-based assessment framework by combing the geospatial big data,” Urban Clim, vol. 43, p. 101169. May 2022. [CrossRef]
- Ajtai, *!!! REPLACE !!!*; et al. , “Mapping social vulnerability to floods. A comprehensive framework using a vulnerability index approach and PCA analysis,” Ecol Indic, vol. 154, p. 110838, Oct. 2023. [CrossRef]
- D. L. Paterson, H. D. L. Paterson, H. Wright, and P. N. A. Harris, “Health Risks of Flood Disasters,” Clinical Infectious Diseases, vol. 67, no. 9, pp. 1450–1454, Oct. 2018. [CrossRef]
- H. Nagendra, X. H. Nagendra, X. Bai, E. S. Brondizio, and S. Lwasa, “The urban south and the predicament of global sustainability,” Nat Sustain, vol. 1, no. 7, pp. 341–349, Jul. 2018. [CrossRef]
- M. Hagenlocher et al., “Climate Risk Assessment for Ecosystem-based Adaptation A guidebook for planners and practitioners,” 2018. Available online: https://www.adaptationcommunity.net/wp-content/uploads/2018/06/giz-eurac-unu-2018-en-guidebook-climate-risk-asessment-eba.pdf (accessed on 21 September 2024)).
- United Nations, Revision of World Urbanization Prospects. United Nations Department of Economic and Social Affairs. 2018. Available online: https://population.un.org/wup/Publications/Files/WUP2018-Highlights.pdf (accessed on 4 March 2023).
- S. Biswas and S. Nautiyal, “A review of socio-economic vulnerability: The emergence of its theoretical concepts, models and methodologies,” Natural Hazards Research, vol. 3, no. 3, pp. 563–571, Sep. 2023. [CrossRef]
- McCallum, *!!! REPLACE !!!*; et al. , “Estimating global economic well-being with unlit settlements,” Nature Communications 2022 13:1, vol. 13, no. 1, pp. 1–8, 22. May 2022. [CrossRef]
- Yeh, *!!! REPLACE !!!*; et al. , “Using publicly available satellite imagery and deep learning to understand economic well-being in Africa,” Nat Commun, vol. 11, no. 1, p. 2583, 20. May 2020. [CrossRef]
- M. Kuffer et al., “The role of earth observation in an integrated deprived area mapping ‘system’ for low-to-middle income countries,” Remote Sens (Basel), vol. 12, no. 6, p. 982, Mar. 2020. [CrossRef]
- Skinner, “Issues and Challenges in Census Taking,” Annu Rev Stat Appl, vol. 5, pp. 49–63, Mar. 2018. [CrossRef]
- M. Kazemi, F. M. Kazemi, F. Mohammadi, M. H. Nafooti, K. Behvar, and N. Kariminejad, “Flood susceptibility mapping using machine learning and remote sensing data in the Southern Karun Basin, Iran,” Applied Geomatics, vol. 16, no. 3, pp. 731–750, Sep. 2024. [CrossRef]
- Seleem, G. Ayzel, A. C. T. de Souza, A. Bronstert, and M. Heistermann, “Towards urban flood susceptibility mapping using data-driven models in Berlin, Germany,” Geomatics, Natural Hazards and Risk, vol. 13, no. 1, pp. 1640–1662, Dec. 2022. [CrossRef]
- N. Javidan, A. N. Javidan, A. Kavian, H. R. Pourghasemi, C. Conoscenti, Z. Jafarian, and J. Rodrigo-Comino, “Evaluation of multi-hazard map produced using MaxEnt machine learning technique,” Sci Rep, vol. 11, no. 1, p. 6496, Mar. 2021. [CrossRef]
- H. R. Pourghasemi et al., “Assessing and mapping multi-hazard risk susceptibility using a machine learning technique,” Sci Rep, vol. 10, no. 1, p. 3203, Feb. 2020. [CrossRef]
- D. Sakti et al., “Machine learning based urban sprawl assessment using integrated multi-hazard and environmental-economic impact,” Sci Rep, vol. 14, no. 1, p. 13385, Jun. 2024. [CrossRef]
- S. Yousefi, H. R. S. Yousefi, H. R. Pourghasemi, S. N. Emami, S. Pouyan, S. Eskandari, and J. P. Tiefenbacher, “A machine learning framework for multi-hazards modeling and mapping in a mountainous area,” Sci Rep, vol. 10, no. 1, p. 12144, Jul. 2020. [CrossRef]
- Alabbad and, I. Demir, “Comprehensive flood vulnerability analysis in urban communities: Iowa case study,” International Journal of Disaster Risk Reduction, vol. 74, 22. May 2022. [CrossRef]
- T. Zhang, D. T. Zhang, D. Wang, and Y. Lu, “Machine learning-enabled regional multi-hazards risk assessment considering social vulnerability,” Sci Rep, vol. 13, no. 1, p. 13405, Aug. 2023. [CrossRef]
- E. Brower et al., “Augmenting the Social Vulnerability Index using an agent-based simulation of Hurricane Harvey,” Comput Environ Urban Syst, vol. 105, p. 102020, Oct. 2023. [CrossRef]
- Davino, M. Gherghi, S. Sorana, and D. Vistocco, “Measuring Social Vulnerability in an Urban Space Through Multivariate Methods and Models,” Soc Indic Res, vol. 157, no. 3, pp. 1179–1201, Oct. 2021. [CrossRef]
- V. Hadipour, F. V. Hadipour, F. Vafaie, and N. Kerle, “An indicator-based approach to assess social vulnerability of coastal areas to sea-level rise and flooding: A case study of Bandar Abbas city, Iran,” Ocean Coast Manag, vol. 188, p. 105077, Apr. 2020. [CrossRef]
- V. Streifeneder, S. V. Streifeneder, S. Kienberger, S. Reichel, and D. Hölbling, “Socio-Economic Vulnerability Assessment for Supporting a Sustainable Pandemic Management in Austria,” sustainability, vol. 16, no. 1, p. 78, Dec. 2023. [CrossRef]
- K. Zhu, Z. K. Zhu, Z. Wang, C. Lai, S. Li, Z. Zeng, and X. Chen, “Evaluating Factors Affecting Flood Susceptibility in the Yangtze River Delta Using Machine Learning Methods,” International Journal of Disaster Risk Science, Oct. 2024. [CrossRef]
- K. M. Al-Kindi and Z. Alabri, “Investigating the Role of the Key Conditioning Factors in Flood Susceptibility Mapping Through Machine Learning Approaches,” Earth Systems and Environment, Jan. 2024. [CrossRef]
- K. Khosravi et al., “A comparative assessment of decision trees algorithms for flash flood susceptibility modeling at Haraz watershed, northern Iran,” Science of The Total Environment, vol. 627, pp. 744–755, Jun. 2018. [CrossRef]
- K. Zhu, Z. K. Zhu, Z. Wang, C. Lai, S. Li, Z. Zeng, and X. Chen, “Evaluating Factors Affecting Flood Susceptibility in the Yangtze River Delta Using Machine Learning Methods,” International Journal of Disaster Risk Science, Oct. 2024. [CrossRef]
- Y. Sun, Y. Y. Sun, Y. Li, R. Ma, C. Gao, and Y. Wu, “Mapping urban socio-economic vulnerability related to heat risk: A grid-based assessment framework by combing the geospatial big data,” Urban Clim, vol. 43, p. 101169, 22. May 2022. [CrossRef]
- L. Chakraborty, H. L. Chakraborty, H. Rus, D. Henstra, J. Thistlethwaite, and D. Scott, “A place-based socioeconomic status index: Measuring social vulnerability to flood hazards in the context of environmental justice,” International Journal of Disaster Risk Reduction, vol. 43, p. 101394, Feb. 2020. [CrossRef]
- National Institute of Statistics of Rwanda, “Fifth Rwanda Population and Housing Census, 2022” 2022. Available online: https://statistics.gov.rw/file/13787/download?token=gjjLyRXT.
- City of Kigali, “Zoning regulations: Kigali Master Plan 2050” 2019. Available online: https://masterplan2020.kigalicity.gov.rw/portal/apps/webappviewer/index.html?id=218a2e3088064fc6b13198b4304f3d35/#:~:text=be%20found%20here%3A-,Zoning%20Regulations,-Transport%20Plan (accessed on 19 June 2023).
- G. Baffoe, J. G. Baffoe, J. Malonza, V. Manirakiza, and L. Mugabe, “Understanding the concept of neighbourhood in Kigali City, Rwanda,” Sustainability (Switzerland), vol. 12, no. 4, pp. 1–22, 2020. [CrossRef]
- S. Hafner, S. S. Hafner, S. Georganos, T. Mugiraneza, and Y. Ban, “Mapping Urban Population Growth from Sentinel-2 MSI and Census Data Using Deep Learning: A Case Study in Kigali, Rwanda” 2023, In 2023 Joint Urban Remote Sensing Event (JURSE) (pp. 1-4). IEEE. [CrossRef]
- Nikuze, R. Sliuzas, and J. Flacke, “Towards Equitable Urban Residential Resettlement in Kigali, Rwanda,” in GIS in Sustainable Urban Planning and Management, CRC Press, 2018, pp. 325–344. [CrossRef]
- Uwizeye, A. Irambeshya, S. Wiehler, and F. Niragire, “Poverty profile and efforts to access basic household needs in an emerging city: a mixed-method study in Kigali’s informal urban settlements, Rwanda,” Cities Health, vol. 6, no. 1, pp. 98–112, Jan. 2022. [CrossRef]
- Dufitimana, P. Gahungu, E. Uwayezu, E. Mugisha, A. Poorthuis, and J. P. Bizimana, “Measuring urban socio-economic disparities in the global south from space using convolutional neural network: the case of the City of Kigali, Rwanda,” GeoJournal, vol. 89, no. 3, p. 107, 24. May 2024. [CrossRef]
- Nduwayezu, E. Ingabire, and J. P. Bizimana, “Measuring disparities in access to district and referral hospitals in the city of Kigali, Rwanda,” Rwanda Journal of Engineering, Science, Technology and Environment, vol. 5, no. 1, pp. 2617–2321, Jun. 2023. [CrossRef]
- V. Manirakiza, L. V. Manirakiza, L. Mugabe, A. Nsabimana, and M. Nzayirambaho, “City Profile: Kigali, Rwanda,” Environment and Urbanization ASIA, vol. 10, no. 2, pp. 290–307, Sep. 2019. [CrossRef]
- Naeem, Z. Zaheer, S. Tabassum, A. Nazir, and F. Naeem, “Diseases caused by floods with a spotlight on the present situation of unprecedented floods in Pakistan: a short communication,” Annals of Medicine & Surgery, vol. 85, no. 6, pp. 3209–3212, Jun. 2023. [CrossRef]
- N. Haque, “Climate risk responses and the urban poor in the global South: the case of Dhaka’s flood risk in the low-income settlements,” International Journal of Disaster Risk Reduction, vol. 64, Oct. 2021. [CrossRef]
- Q. Liu, J. Q. Liu, J. Yuan, W. Yan, W. Liang, M. Liu, and J. Liu, “Association of natural flood disasters with infectious diseases in 168 countries and territories from 1990 to 2019: A worldwide observational study,” Glob Transit, vol. 5, pp. 149–159, 2023. [CrossRef]
- Singh, · Kishan, and S. Rawat, “Mapping flooded areas utilizing Google Earth Engine and open SAR data: a comprehensive approach for disaster response,” Discover Geoscience 2024 2:1, vol. 2, no. 1, pp. 1–12, Apr. 2024. [CrossRef]
- M. R. Rahman and P. K. Thakur, “Detecting, mapping and analysing of flood water propagation using synthetic aperture radar (SAR) satellite data and GIS: A case study from the Kendrapara District of Orissa State of India,” The Egyptian Journal of Remote Sensing and Space Science, vol. 21, pp. S37–S41, Jul. 2018. [CrossRef]
- S. P. Dhanabalan, S. A. S. P. Dhanabalan, S. A. Rahaman, and R. Jegankumar, “Flood monitoring using Sentinel-1 SAR data: A case study based on an event of 2018 and 2019 Southern part of Kerala,” in The International Archives of the Photogrammetry, Remote Sensing and Spatial Information Sciences, Volume XLIV-M-3-2021 ASPRS 2021 Annual Conference, 29 March–, virtual, 2021. 2 April. [CrossRef]
- Kalisch, F. Lagona, and V. Roeber, “Sudden wave flooding on steep rock shores: a clear but hidden danger,” Natural Hazards, vol. 120, no. 3, pp. 3105–3125, Feb. 2024. [CrossRef]
- E. Dodangeh et al., “Novel hybrid intelligence models for flood-susceptibility prediction: Meta optimization of the GMDH and SVR models with the genetic algorithm and harmony search,” J Hydrol (Amst), vol. 590, p. 125423, Nov. 2020. [CrossRef]
- Liu, *!!! REPLACE !!!*; et al. , “Hybrid Models Incorporating Bivariate Statistics and Machine Learning Methods for Flash Flood Susceptibility Assessment Based on Remote Sensing Datasets,” Remote Sens (Basel), vol. 13, no. 23, p. 4945, Dec. 2021. [CrossRef]
- S. Siahkamari, A. S. Siahkamari, A. Haghizadeh, H. Zeinivand, N. Tahmasebipour, and O. Rahmati, “Spatial prediction of flood-susceptible areas using frequency ratio and maximum entropy models,” Geocarto Int, vol. 33, no. 9, pp. 927–941, Sep. 2018. [CrossRef]
- S. Lee and F. Rezaie, “Data used for GIS-based Flood Susceptibility Mapping,” GEO DATA, vol. 4, no. 1, pp. 1–15, Mar. 2022. [CrossRef]
- H. Darabi, B. H. Darabi, B. Choubin, O. Rahmati, A. Torabi Haghighi, B. Pradhan, and B. Kløve, “Urban flood risk mapping using the GARP and QUEST models: A comparative study of machine learning techniques,” J Hydrol (Amst), vol. 569, pp. 142–154, Feb. 2019. [CrossRef]
- P. Yariyan et al., “Flood susceptibility mapping using an improved analytic network process with statistical models,” Geomatics, Natural Hazards and Risk, vol. 11, no. 1, pp. 2282–2314, Jan. 2020. [CrossRef]
- Y. Li, F. B. Y. Li, F. B. Osei, T. Hu, and A. Stein, “Urban flood susceptibility mapping based on social media data in Chengdu city, China,” Sustain Cities Soc, vol. 88, p. 104307, Jan. 2023. [CrossRef]
- Q. B. Pham et al., “Current and future projections of flood risk dynamics under seasonal precipitation regimes in the Hyrcanian Forest region,” Geocarto Int, vol. 37, no. 25, pp. 9047–9070, Dec. 2022. [CrossRef]
- Breinl, D. Lun, H. Müller-Thomy, and G. Blöschl, “Understanding the relationship between rainfall and flood probabilities through combined intensity-duration-frequency analysis,” J Hydrol (Amst), vol. 602, p. 126759, Nov. 2021. [CrossRef]
- Government of Rwanda, Law n°48/2018 of 13/08/2018 on environment. Kigali: Government of Rwanda, 2018. Available online: https://rema.gov.rw/fileadmin/templates/Documents/Law_on_environment.pdf (accessed on 2 December 2024).
- Izonin, R. Tkachenko, N. Shakhovska, B. Ilchyshyn, and K. K. Singh, “A Two-Step Data Normalization Approach for Improving Classification Accuracy in the Medical Diagnosis Domain,” Mathematics, vol. 10, no. 11, p. 1942, Jun. 2022. [CrossRef]
- Y. Chen, X. Y. Chen, X. Zhang, K. Yang, S. Zeng, and A. Hong, “Modeling rules of regional flash flood susceptibility prediction using different machine learning models,” Front Earth Sci (Lausanne), vol. 11, Jan. 2023. [CrossRef]
- S. Abu El-Magd, G. S. Abu El-Magd, G. Soliman, M. Morsy, and S. Kharbish, “Environmental hazard assessment and monitoring for air pollution using machine learning and remote sensing,” International Journal of Environmental Science and Technology, vol. 20, no. 6, pp. 6103–6116, Jun. 2023. [CrossRef]
- D. Henry, D. D. Henry, D. Gorman-Smith, M. Schoeny, and P. Tolan, “‘Neighborhood Matters’: Assessment of Neighborhood Social Processes,” Am J Community Psychol, vol. 54, no. 3–4, pp. 187–204, Dec. 2014. [CrossRef]
- T.-B. Jiang, Z.-W. T.-B. Jiang, Z.-W. Deng, Y.-P. Zhi, H. Cheng, and Q. Gao, “The Effect of Urbanization on Population Health: Evidence from China,” Front Public Health, vol. 9, p. 706982, Jun. 2021. [CrossRef]
- Warembourg, *!!! REPLACE !!!*; et al. , “Urban environment during early-life and blood pressure in young children,” Environ Int, vol. 146, p. 106174, Jan. 2021. [CrossRef]
- Xue, X. Xiao, and J. Li, “Identification method and empirical study of urban industrial spatial relationship based on POI big data: a case of Shenyang City, China,” Geography and Sustainability, vol. 1, no. 2, pp. 152–162, Jun. 2020. [CrossRef]
- M. Tariverdi, M. M. Tariverdi, M. Nunez-del-Prado, N. Leonova, and J. Rentschler, “Measuring accessibility to public services and infrastructure criticality for disasters risk management,” Scientific Reports 2023 13:1, vol. 13, no. 1, pp. 1–16, Jan. 2023. [CrossRef]
- W. Yap and F. Biljecki, “A Global Feature-Rich Network Dataset of Cities and Dashboard for Comprehensive Urban Analyses,” Sci Data, vol. 10, no. 1, Dec. 2023. [CrossRef]
- P. Ndayishimiye et al., “Availability, accessibility, and quality of adolescent Sexual and Reproductive Health (SRH) services in urban health facilities of Rwanda: a survey among social and healthcare providers,” BMC Health Serv Res, vol. 20, no. 1, p. 697, Dec. 2020. [CrossRef]
- M. Ganter, M. M. Ganter, M. Toetzke, and S. Feuerriegel, “Mining Points-of-Interest Data to Predict Urban Inequality: Evidence from Germany and France,” 2022. Proceedings of the International AAAI Conference on Web and Social Media. [CrossRef]
- N. Shrestha, “Factor Analysis as a Tool for Survey Analysis,” Am J Appl Math Stat, vol. 9, no. 1, pp. 4–11, Jan. 2021. [CrossRef]
- M. A. Gulum, C. M. M. A. Gulum, C. M. Trombley, and M. Kantardzic, “A Review of Explainable Deep Learning Cancer Detection Models in Medical Imaging,” Applied Sciences 2021, Vol. 11, Page 4573, vol. 11, no. 10, p. 4573, 21. 20 May. [CrossRef]
- Hall, M. Ohlsson, and T. Rögnvaldsson, “A review of explainable AI in the satellite data, deep machine learning, and human poverty domain,” Patterns, vol. 3, no. 10, p. 100600, Oct. 2022. [CrossRef]
- Fazeli, S. Zeynab, S. M. Khatami, and E. Ranjbar, “The Associations Between Urban Form and Major Non-communicable Diseases: A Systematic Review,” J Urban Health, vol. 99, no. 5, pp. 941–958, Oct. 2022. [CrossRef]
- C. Persello and M. Kuffer, “Towards Uncovering Socio-Economic Inequalities Using VHR Satellite Images and Deep Learning,” in IGARSS 2020 - 2020 IEEE International Geoscience and Remote Sensing Symposium, IEEE, Sep. 2020, pp. 3747–3750. [CrossRef]
Figure 1.
Proposed framework for mapping urban socio-economic vulnerability to natural hazards.
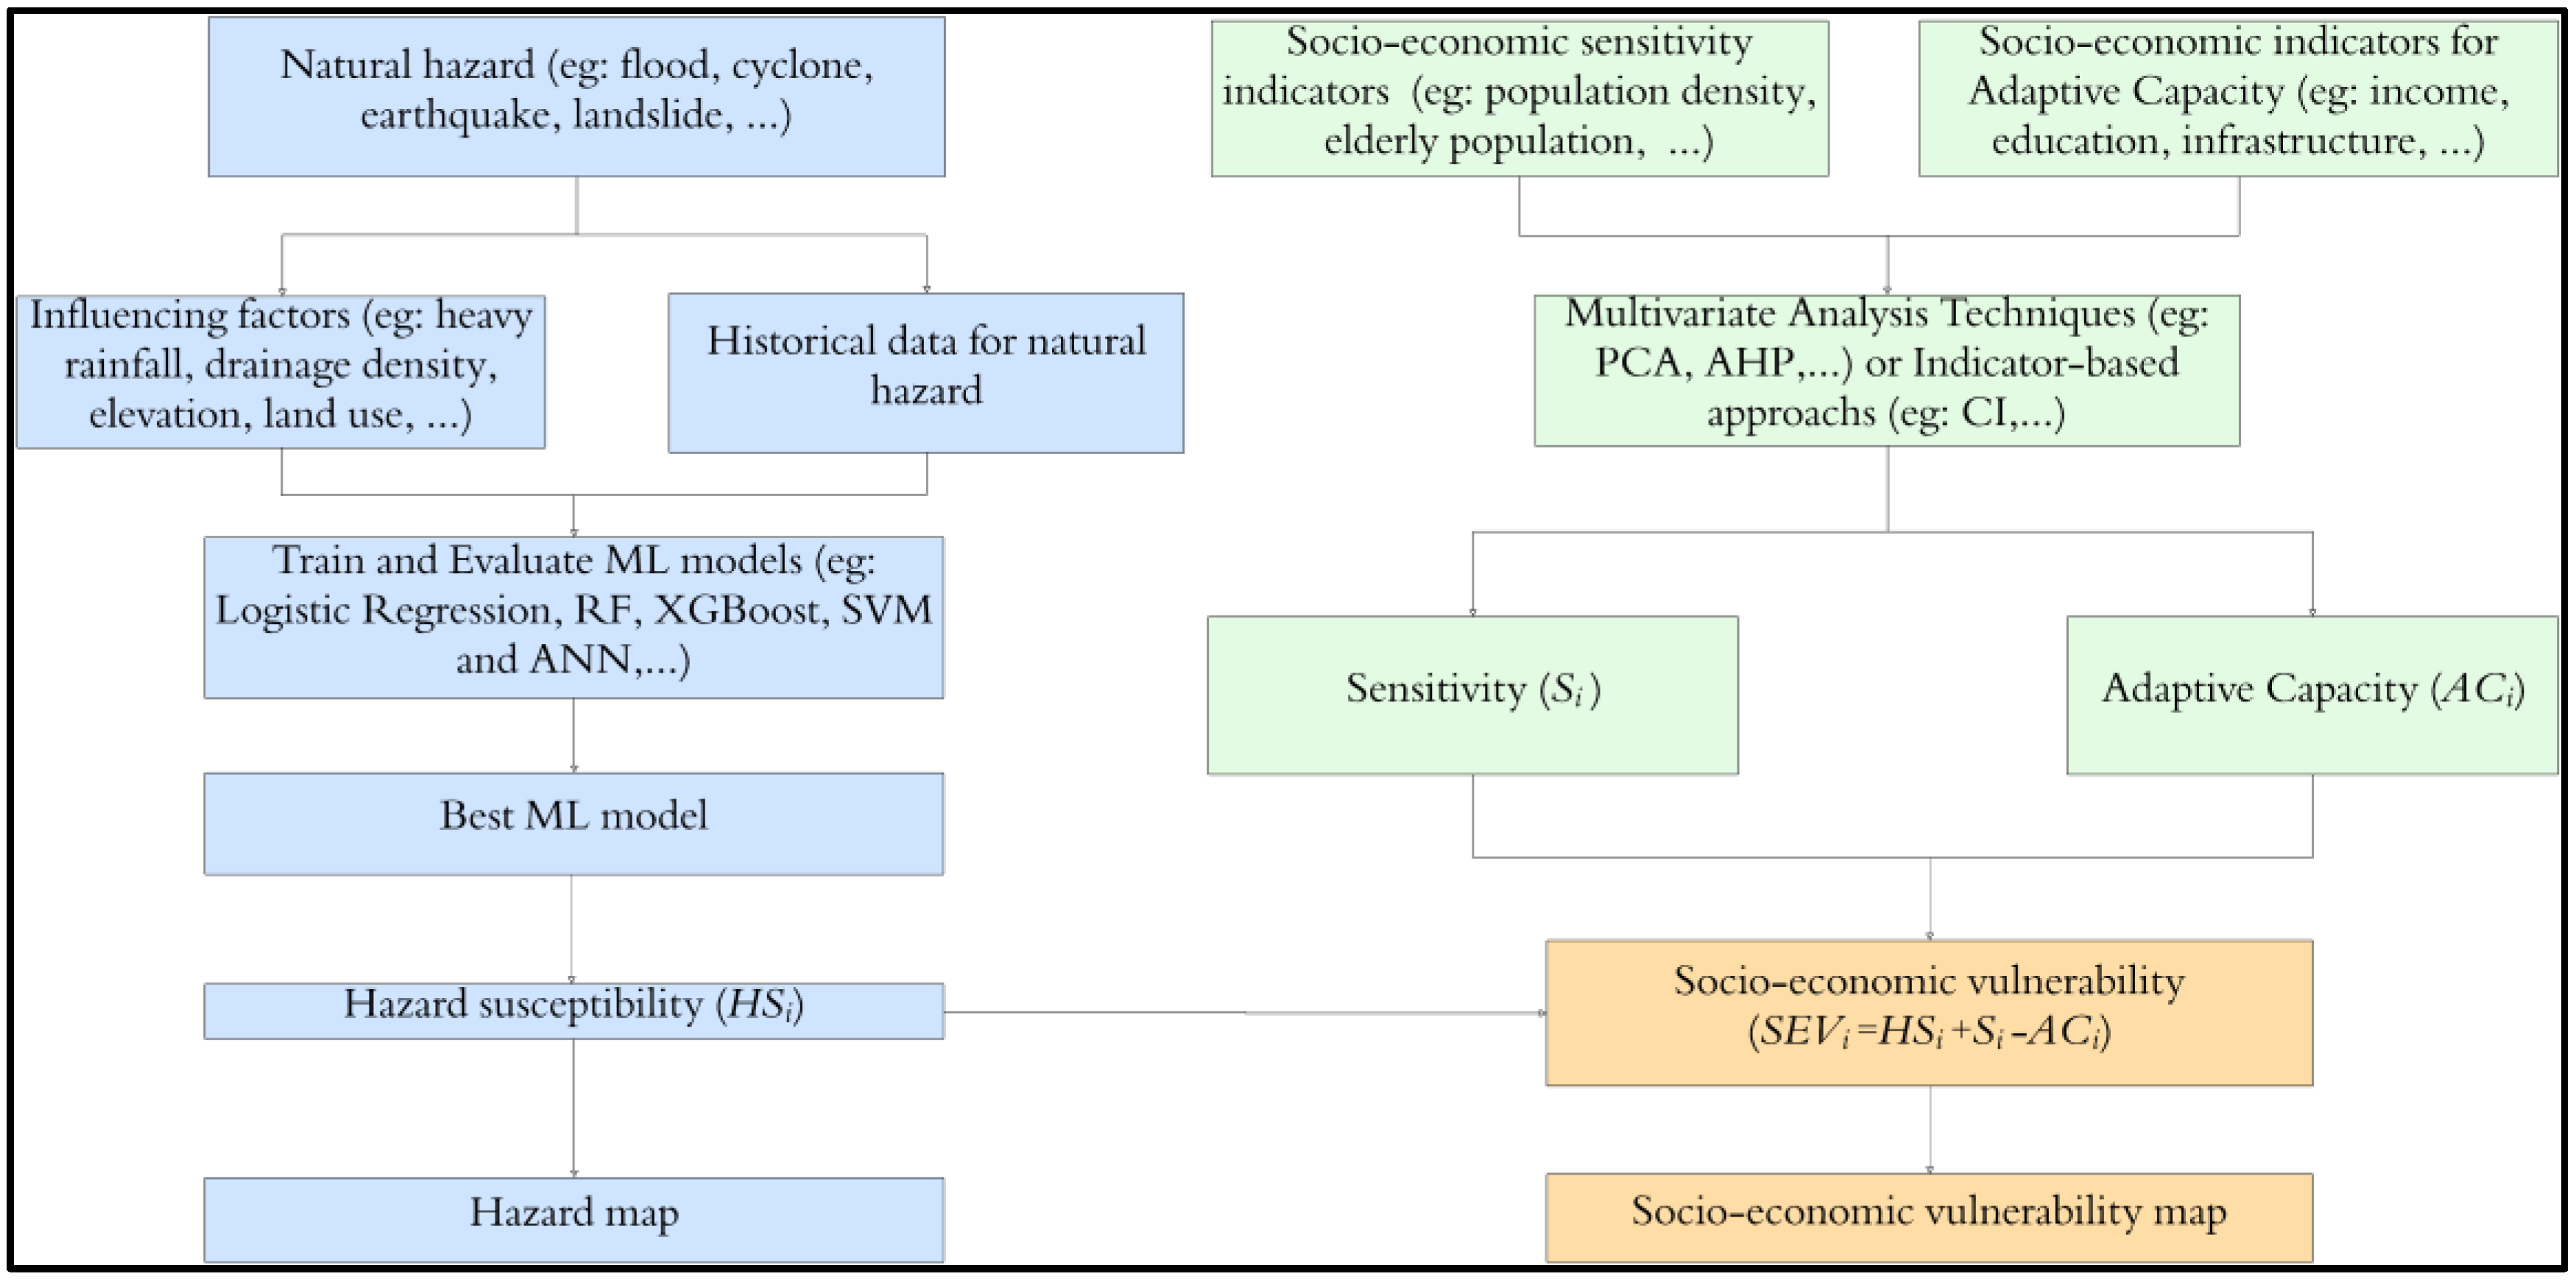
Figure 2.
Location map of the City of Kigali. Data source: National Land Authority, National Institute of Statistics of Rwanda, and Ministry of Infrastructure
Figure 2.
Location map of the City of Kigali. Data source: National Land Authority, National Institute of Statistics of Rwanda, and Ministry of Infrastructure
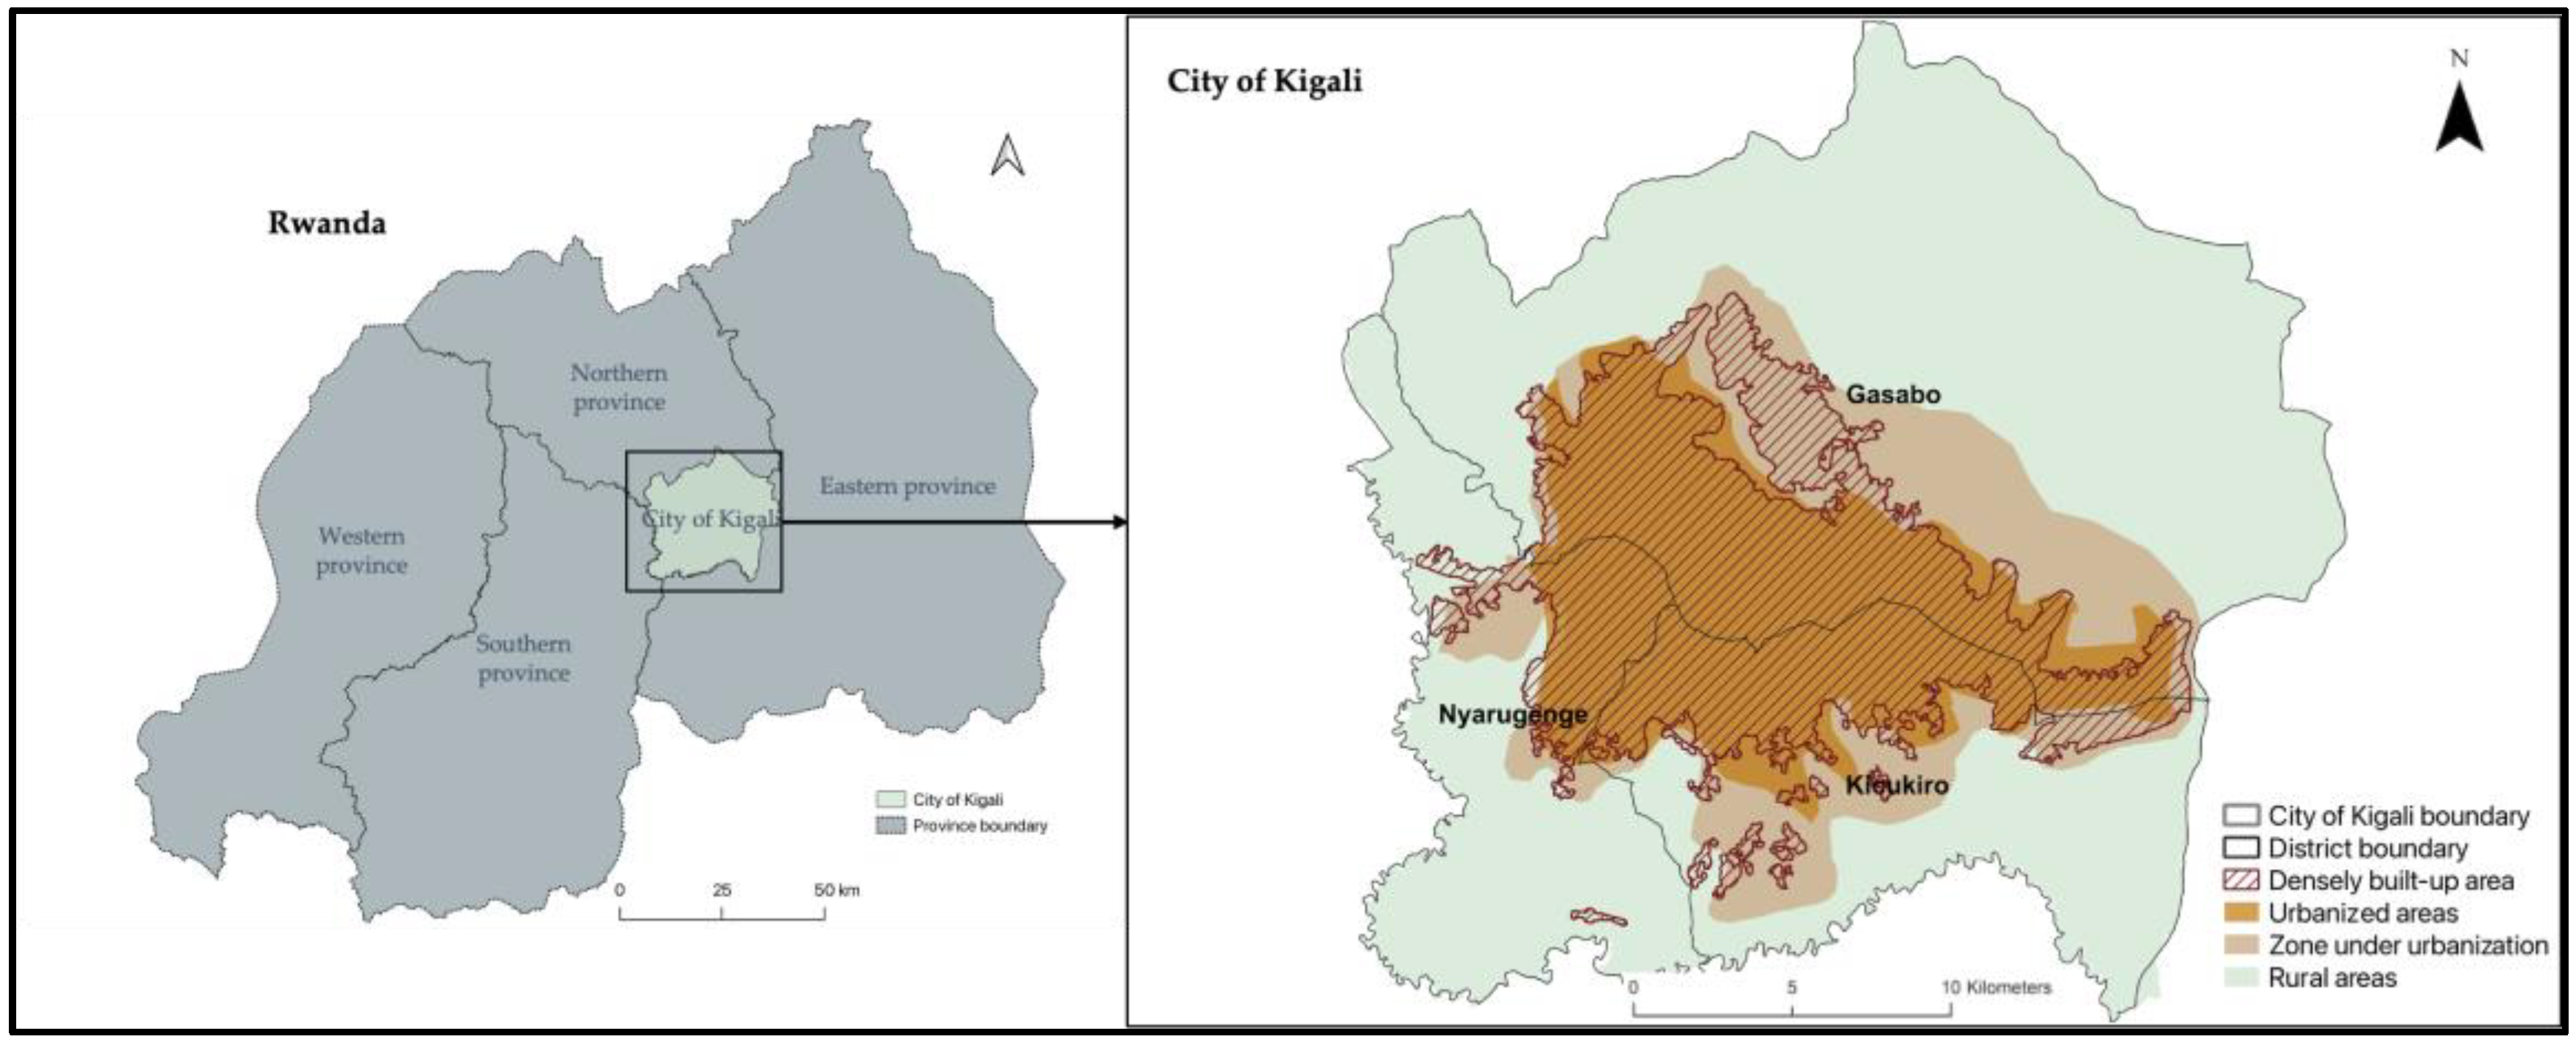
Figure 3.
Visualization of flood influencing factors: (a) Slope, (b) Elevation, (c) Aspect, (d) Drainage density, (e) Land cover, (f) NDVI, (g) NDBI, (h) Rainfall, (i) Distance to drainage.
Figure 3.
Visualization of flood influencing factors: (a) Slope, (b) Elevation, (c) Aspect, (d) Drainage density, (e) Land cover, (f) NDVI, (g) NDBI, (h) Rainfall, (i) Distance to drainage.
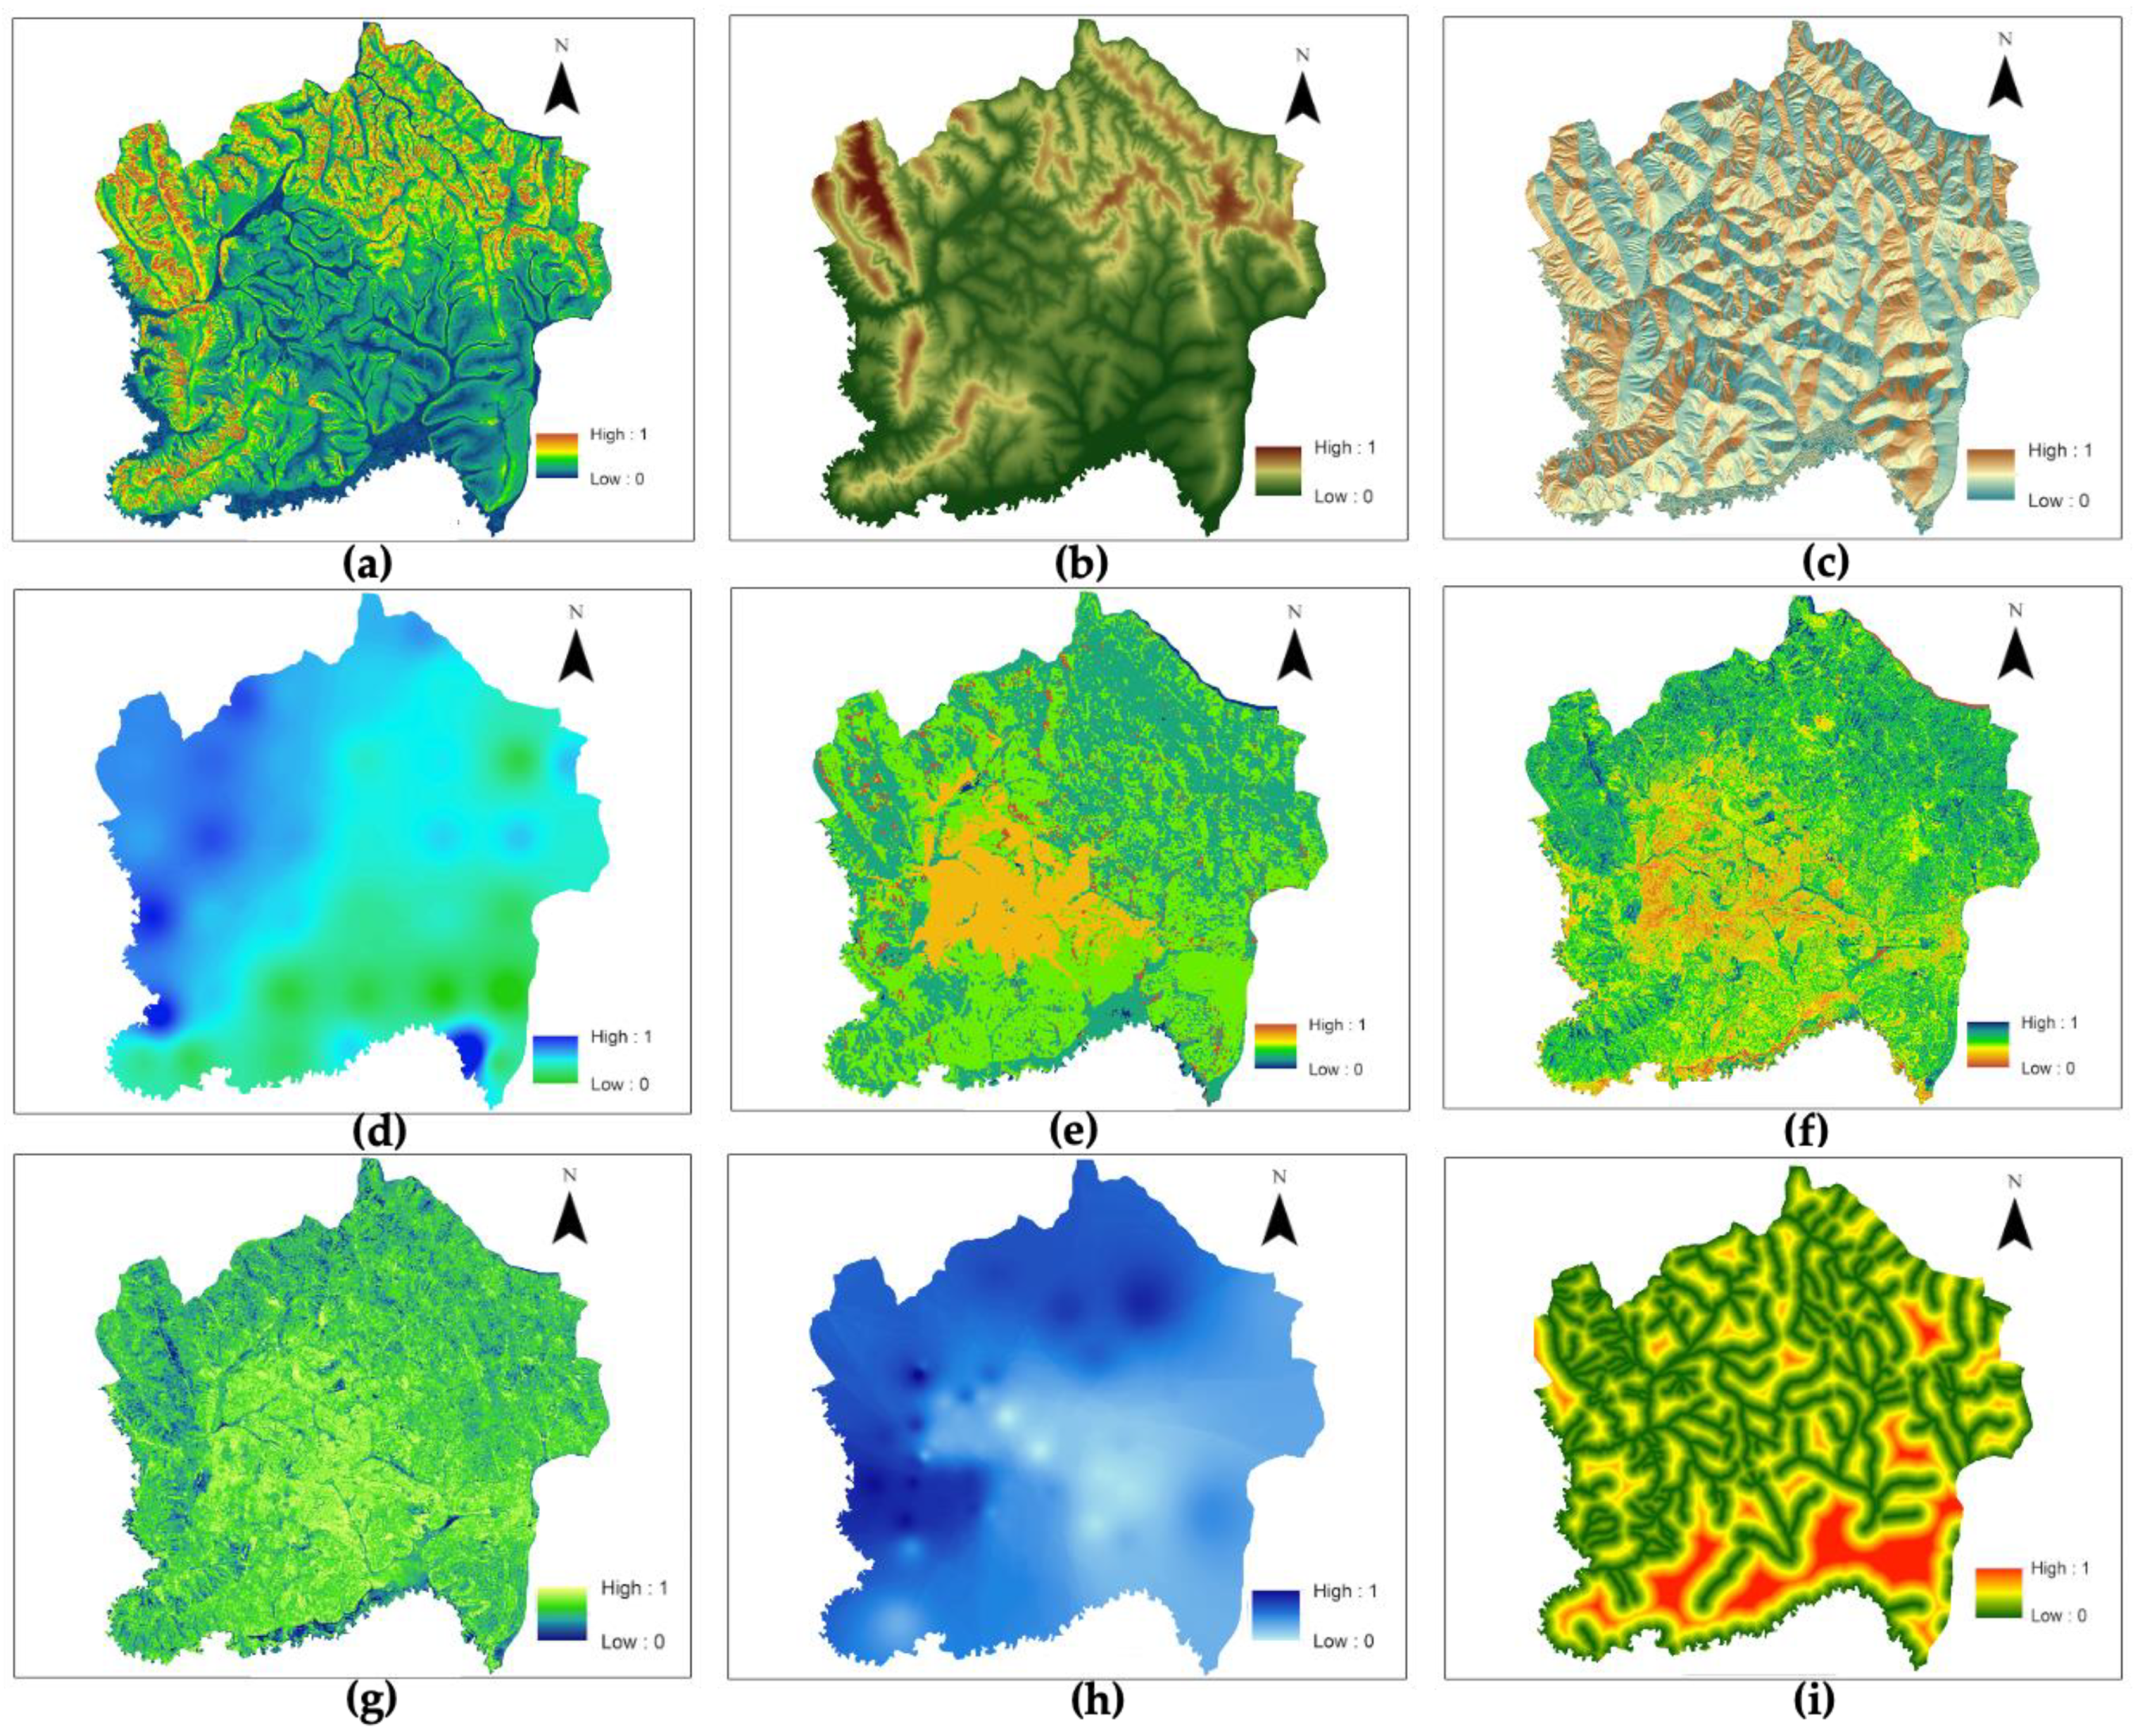
Figure 4.
Socio-economic factors/indicators: (a) population below 5 years, (b) population above 65 years, (c) Population density, (d) Point of interests, (e) Road network density, (f) Access to primary healthcare facilities.
Figure 4.
Socio-economic factors/indicators: (a) population below 5 years, (b) population above 65 years, (c) Population density, (d) Point of interests, (e) Road network density, (f) Access to primary healthcare facilities.
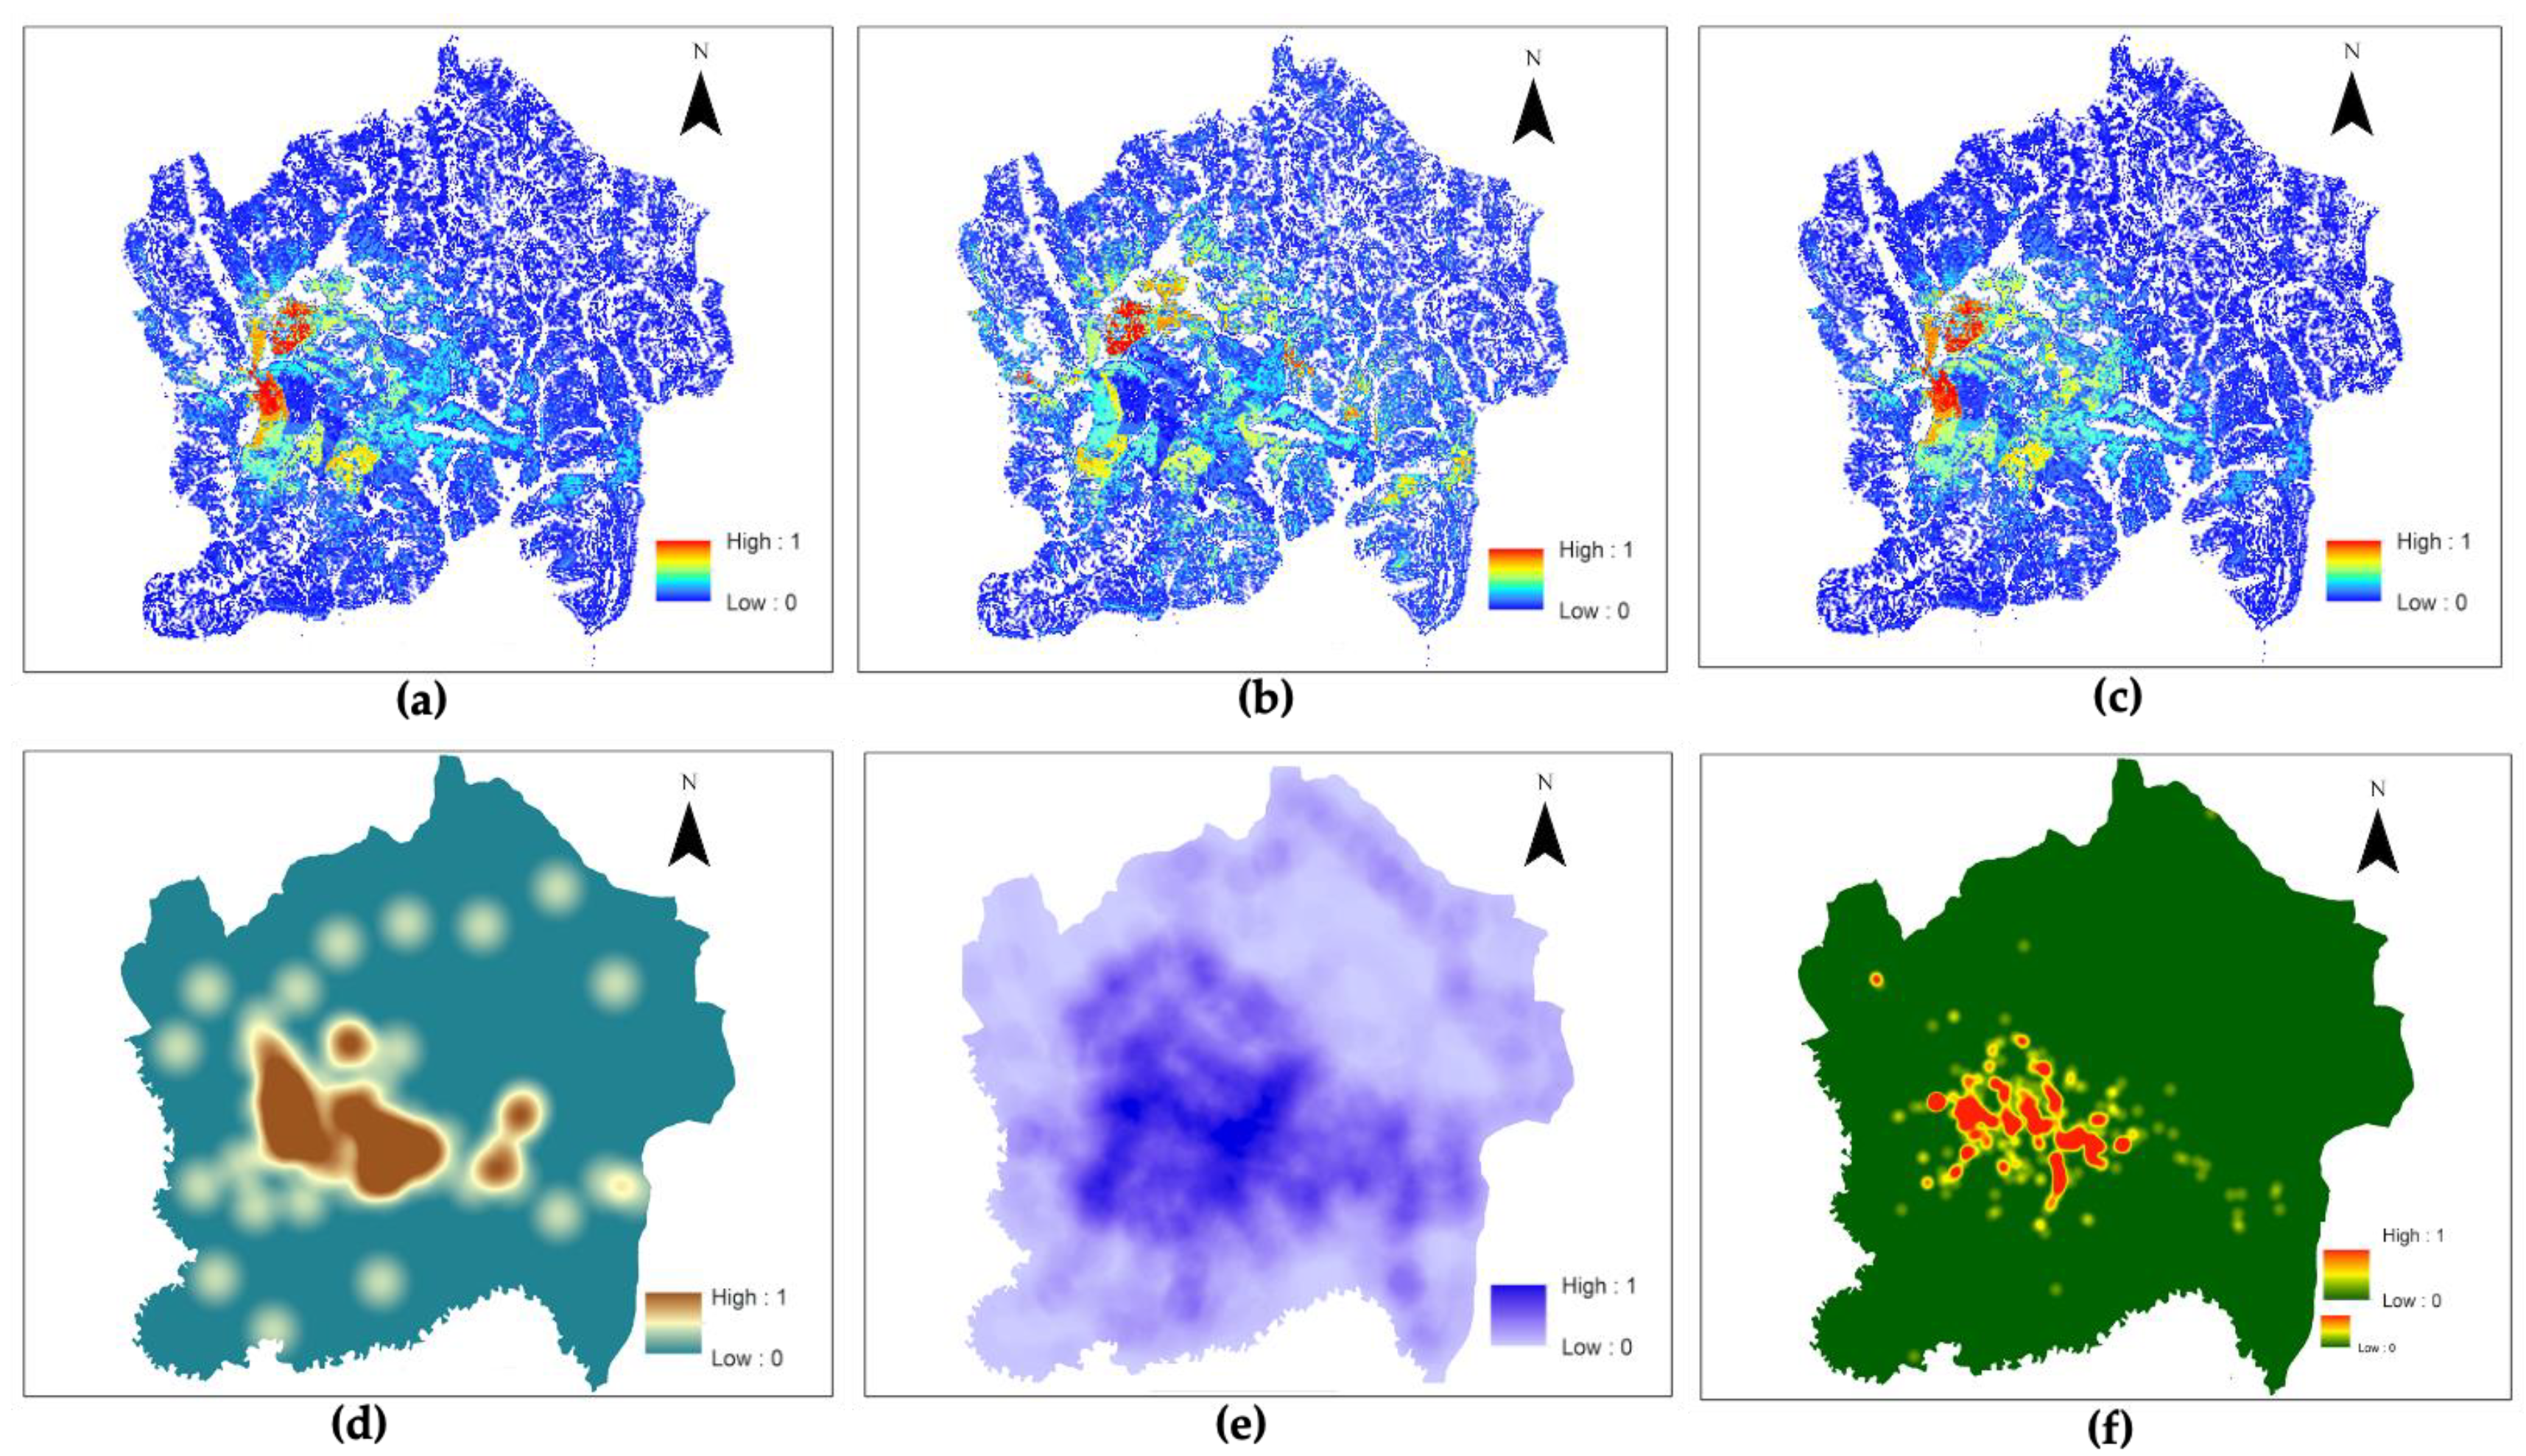
Figure 5.
The receiver operating characteristic curves (AUC) on the testing dataset for the models.
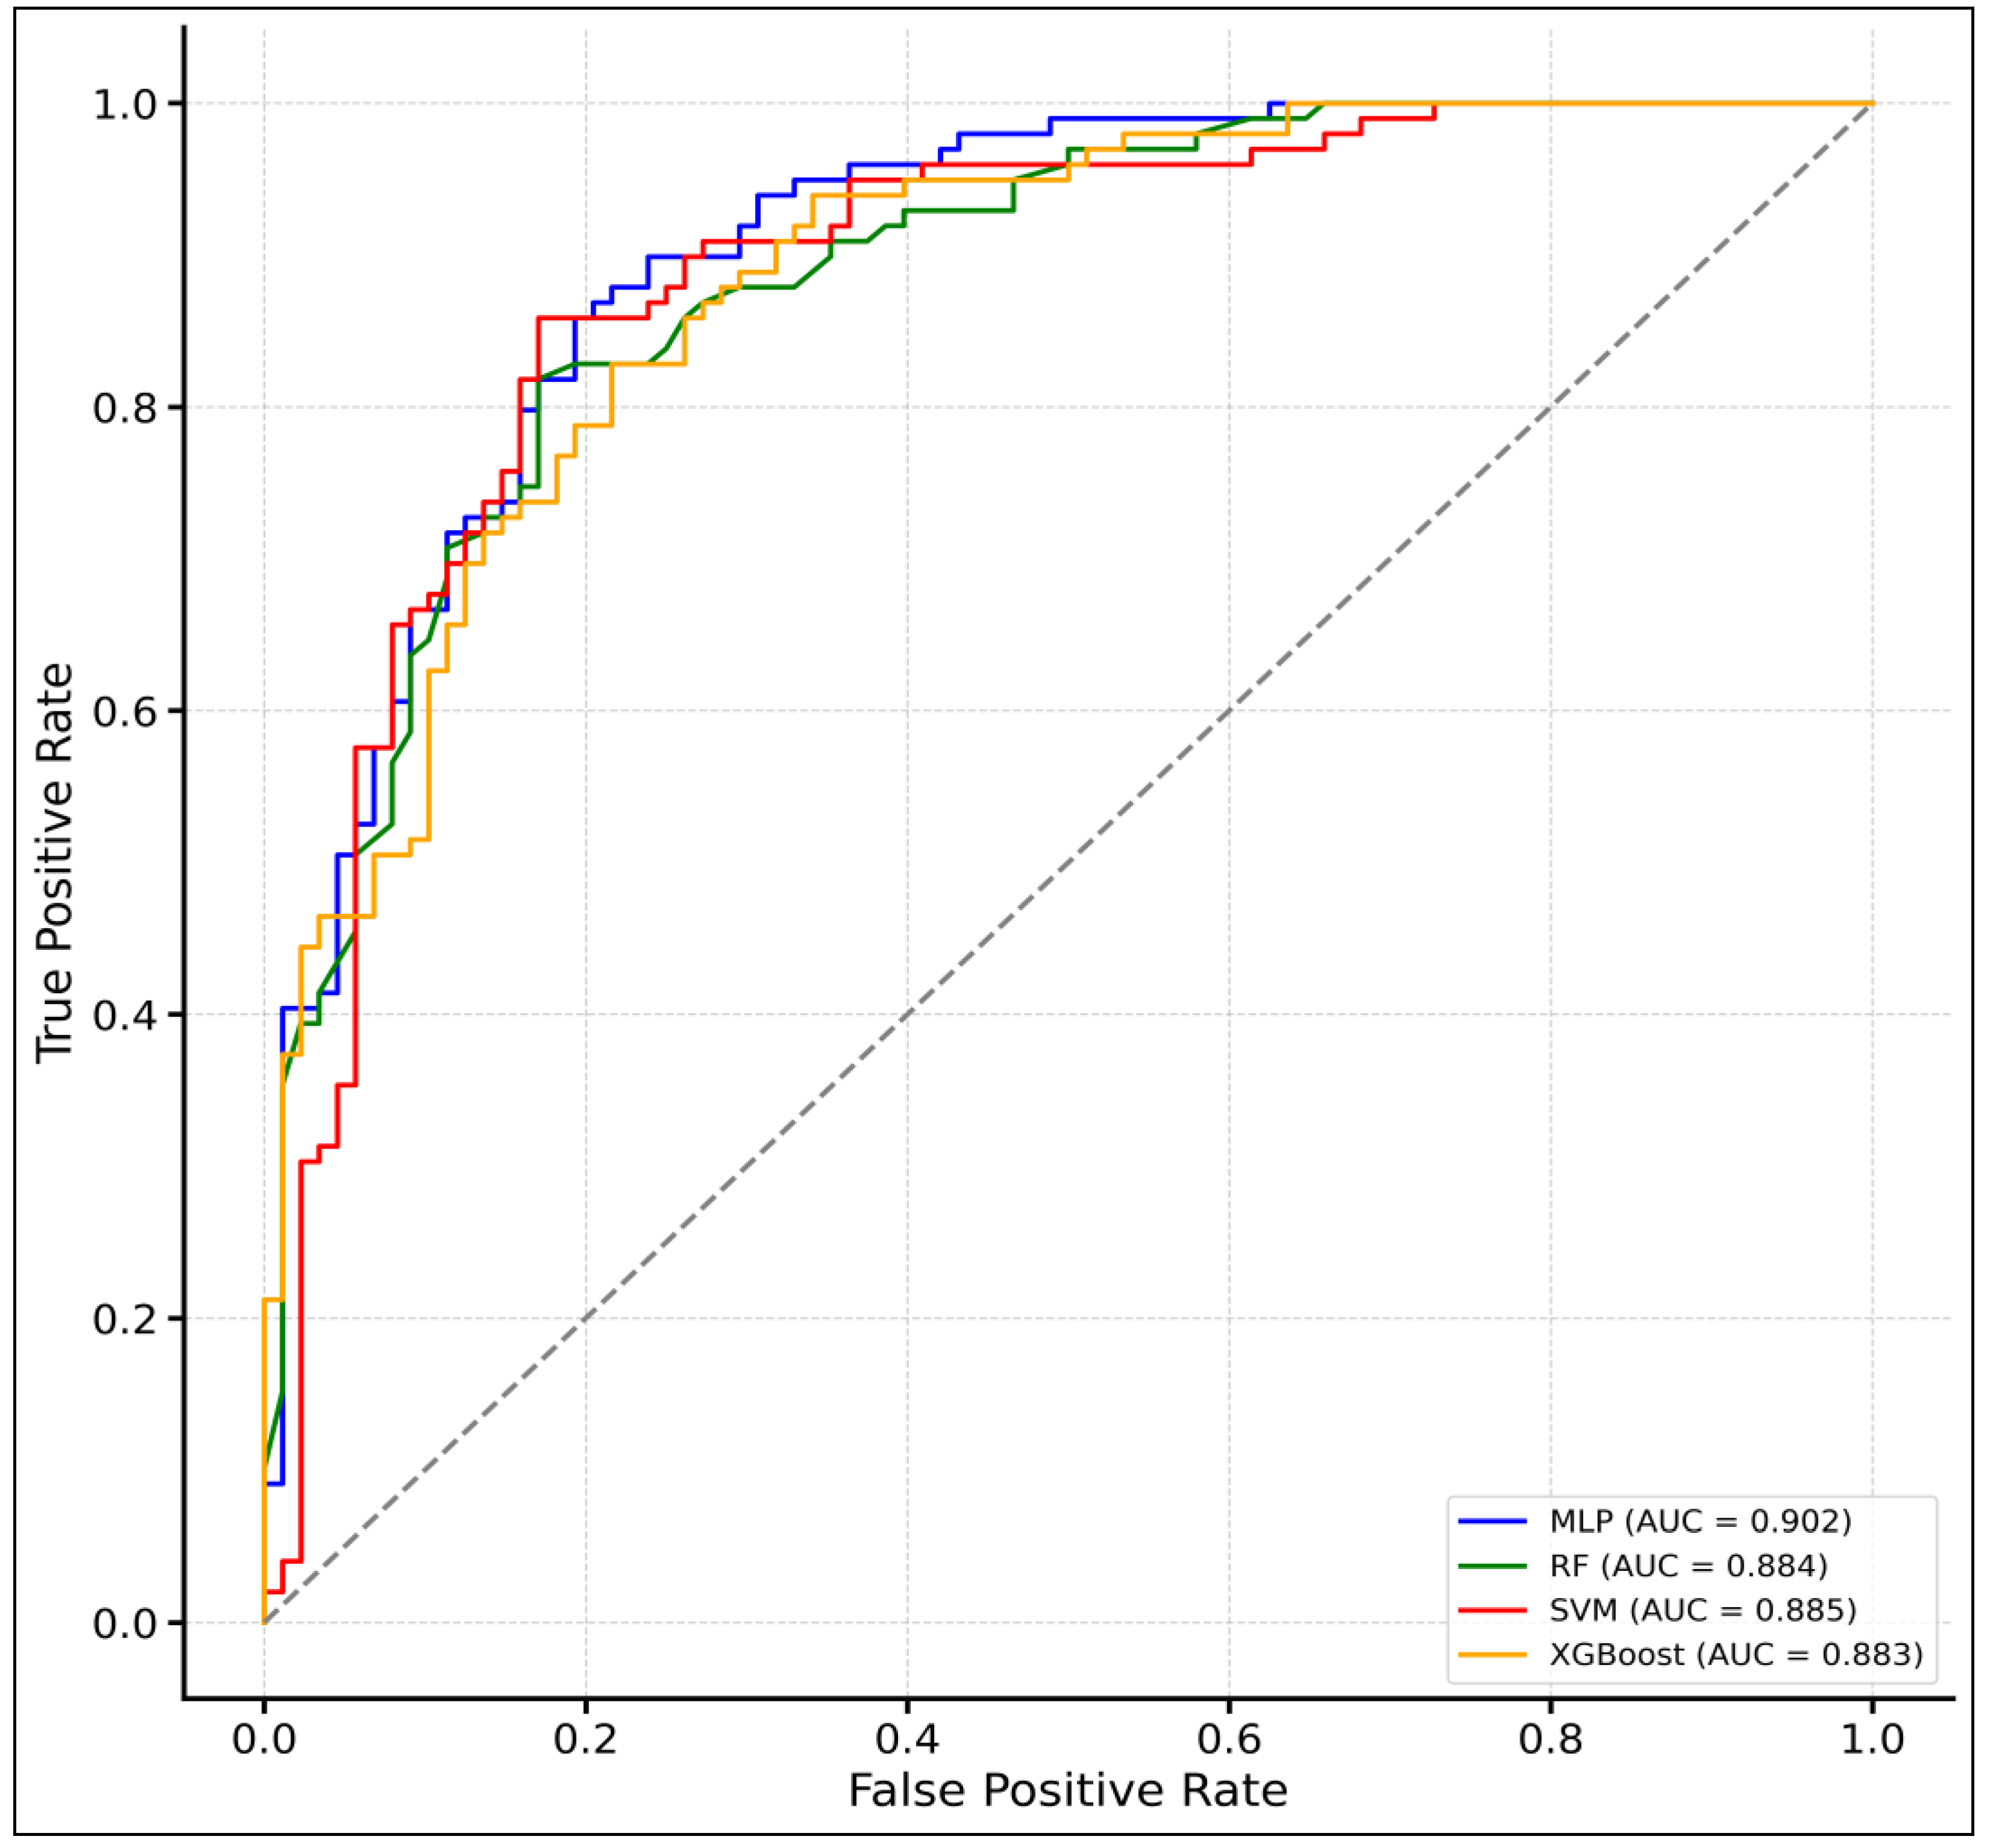
Figure 6.
Features/factors importance score for (a) RF model, and (b) XGBoost model.
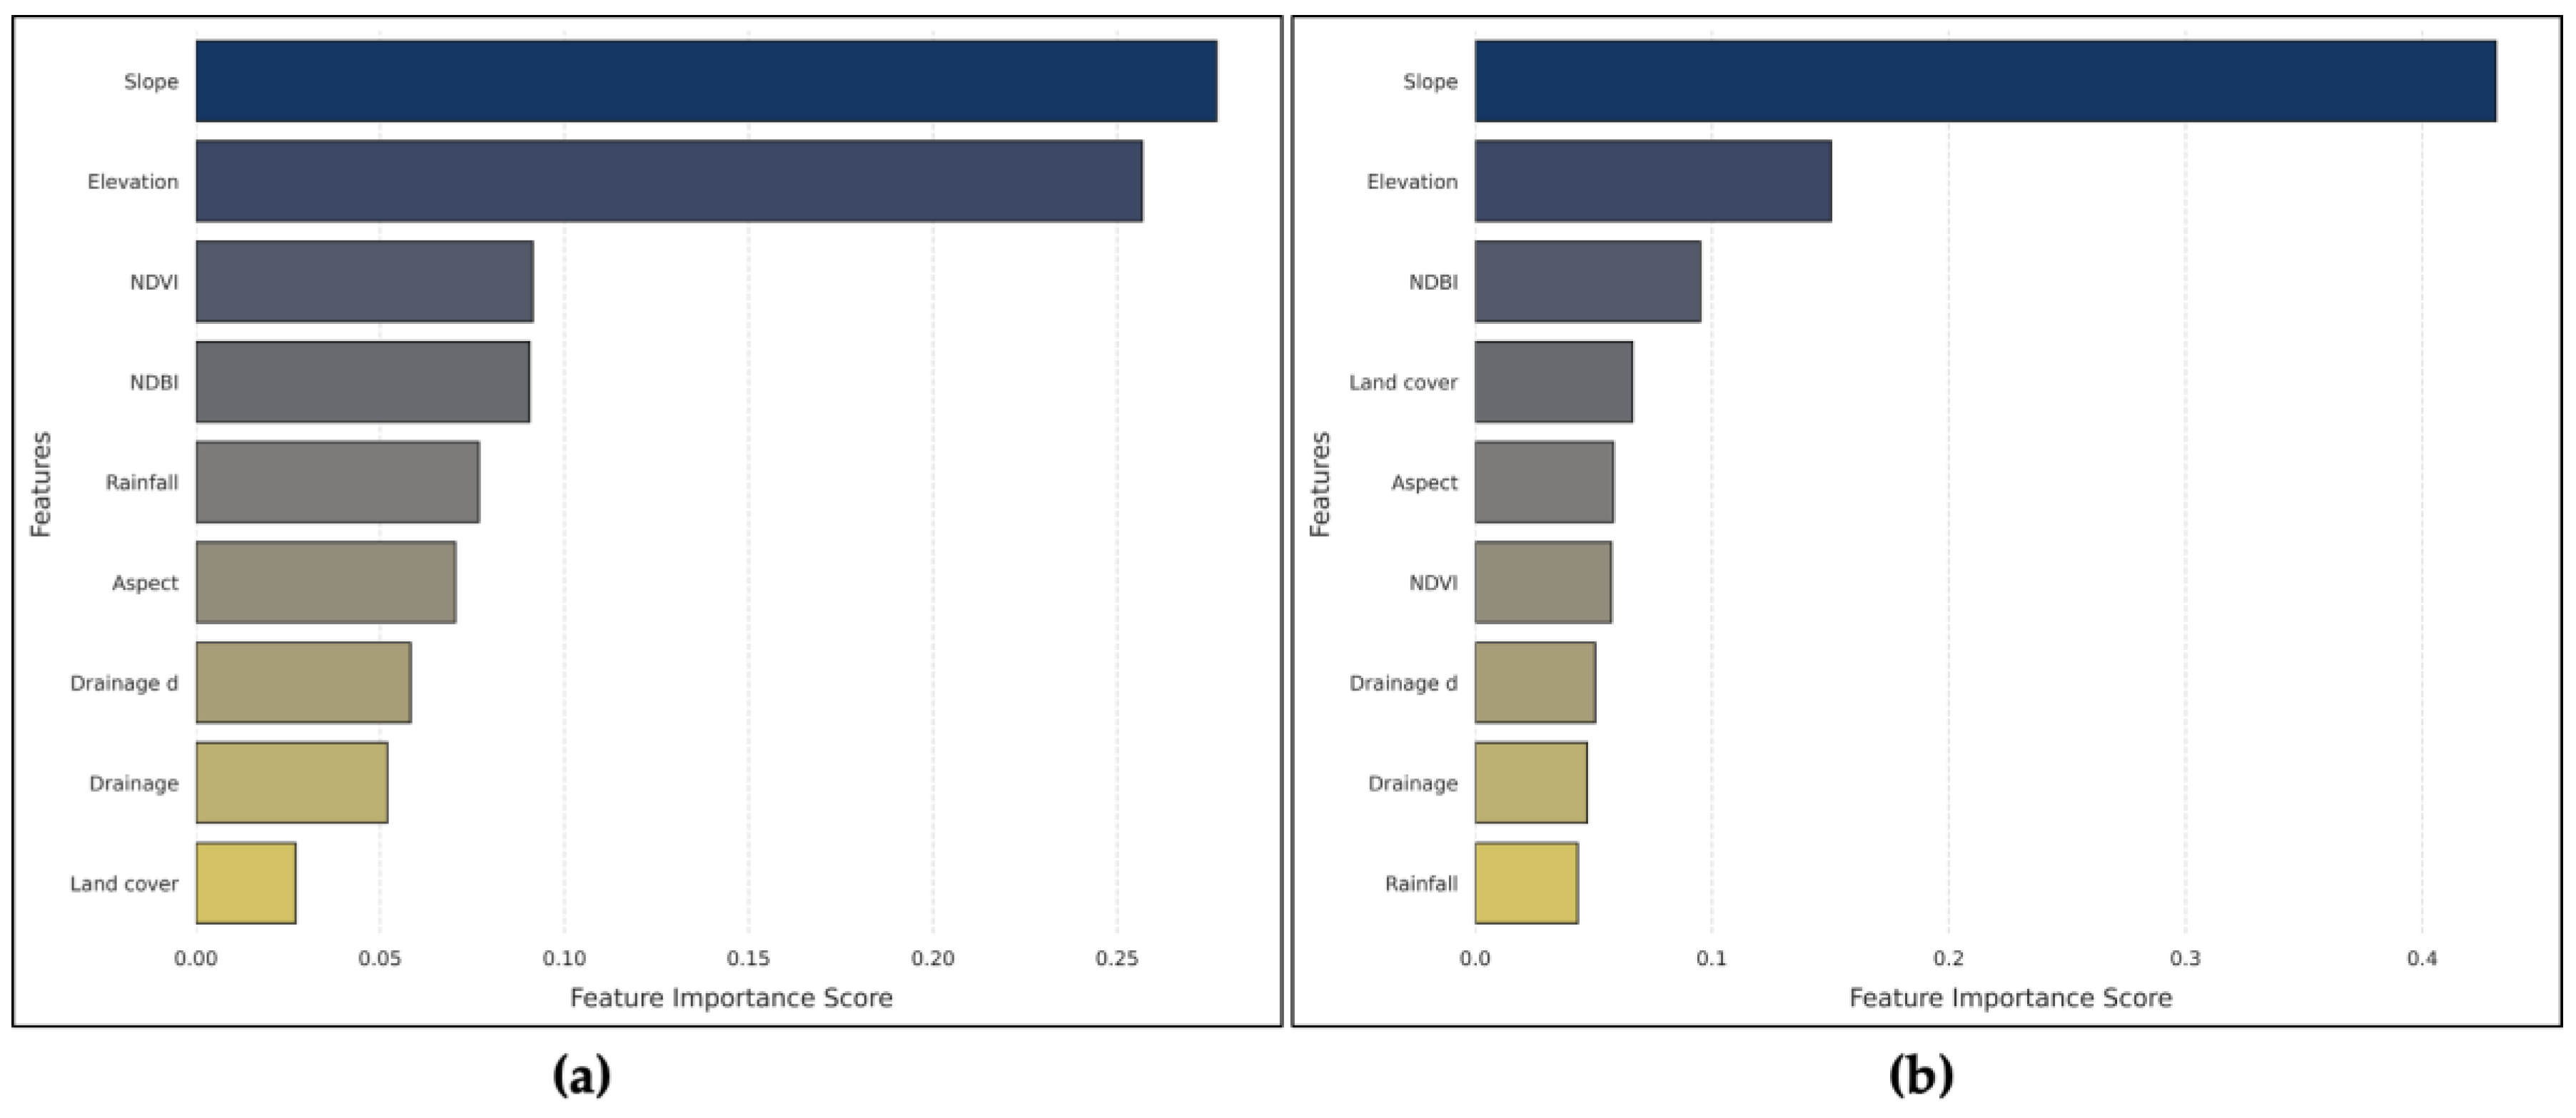
Figure 7.
partial dependence plots for slope and elevation (RF model).
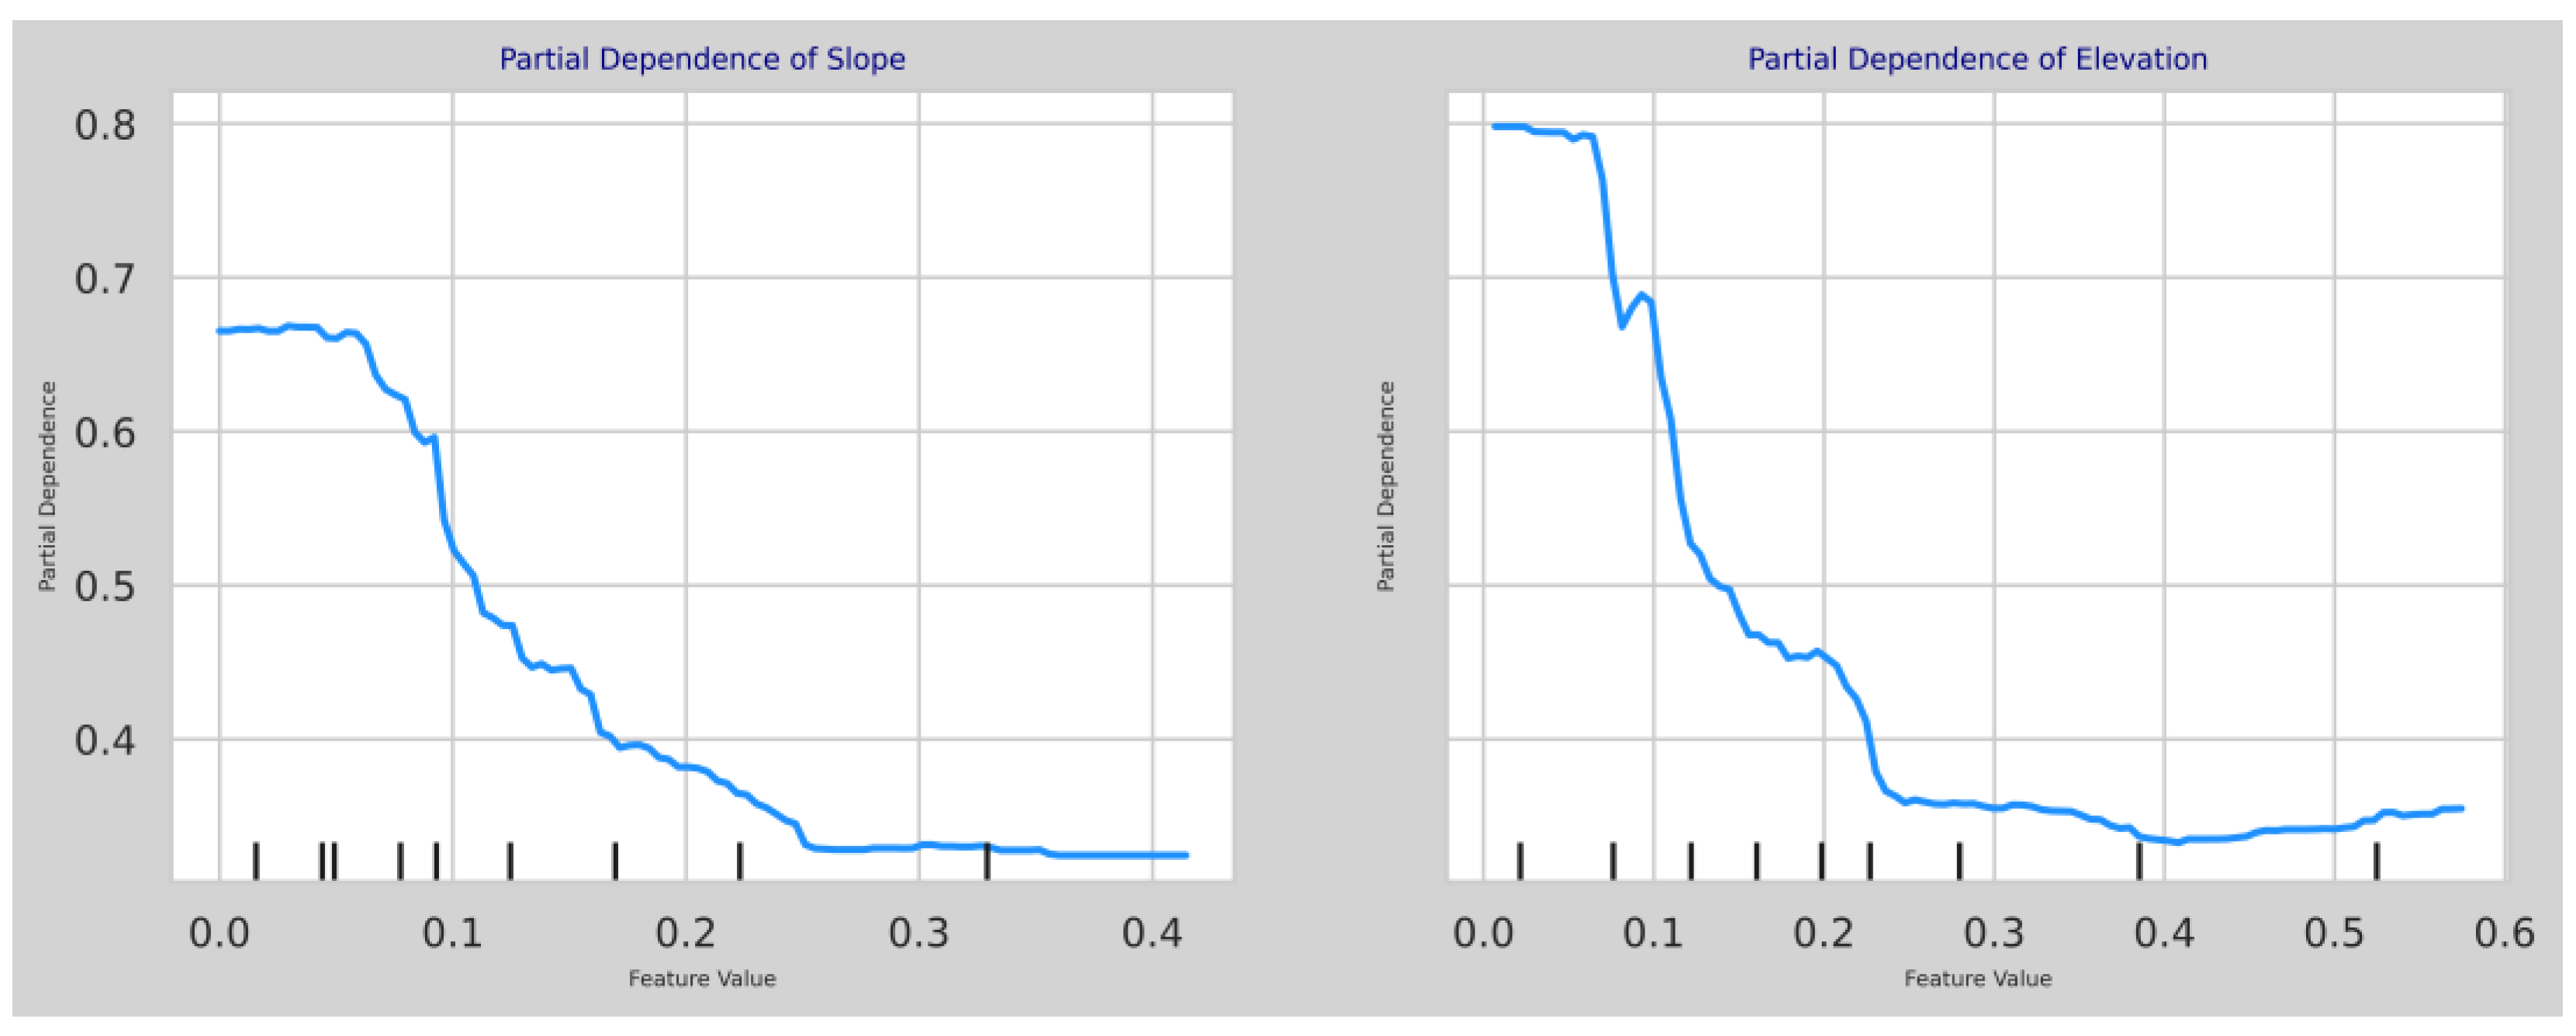
Figure 8.
(a) Flood susceptibility map generated using MLP model. (b) Flood susceptibility aggregated at the neighborhood level.
Figure 8.
(a) Flood susceptibility map generated using MLP model. (b) Flood susceptibility aggregated at the neighborhood level.
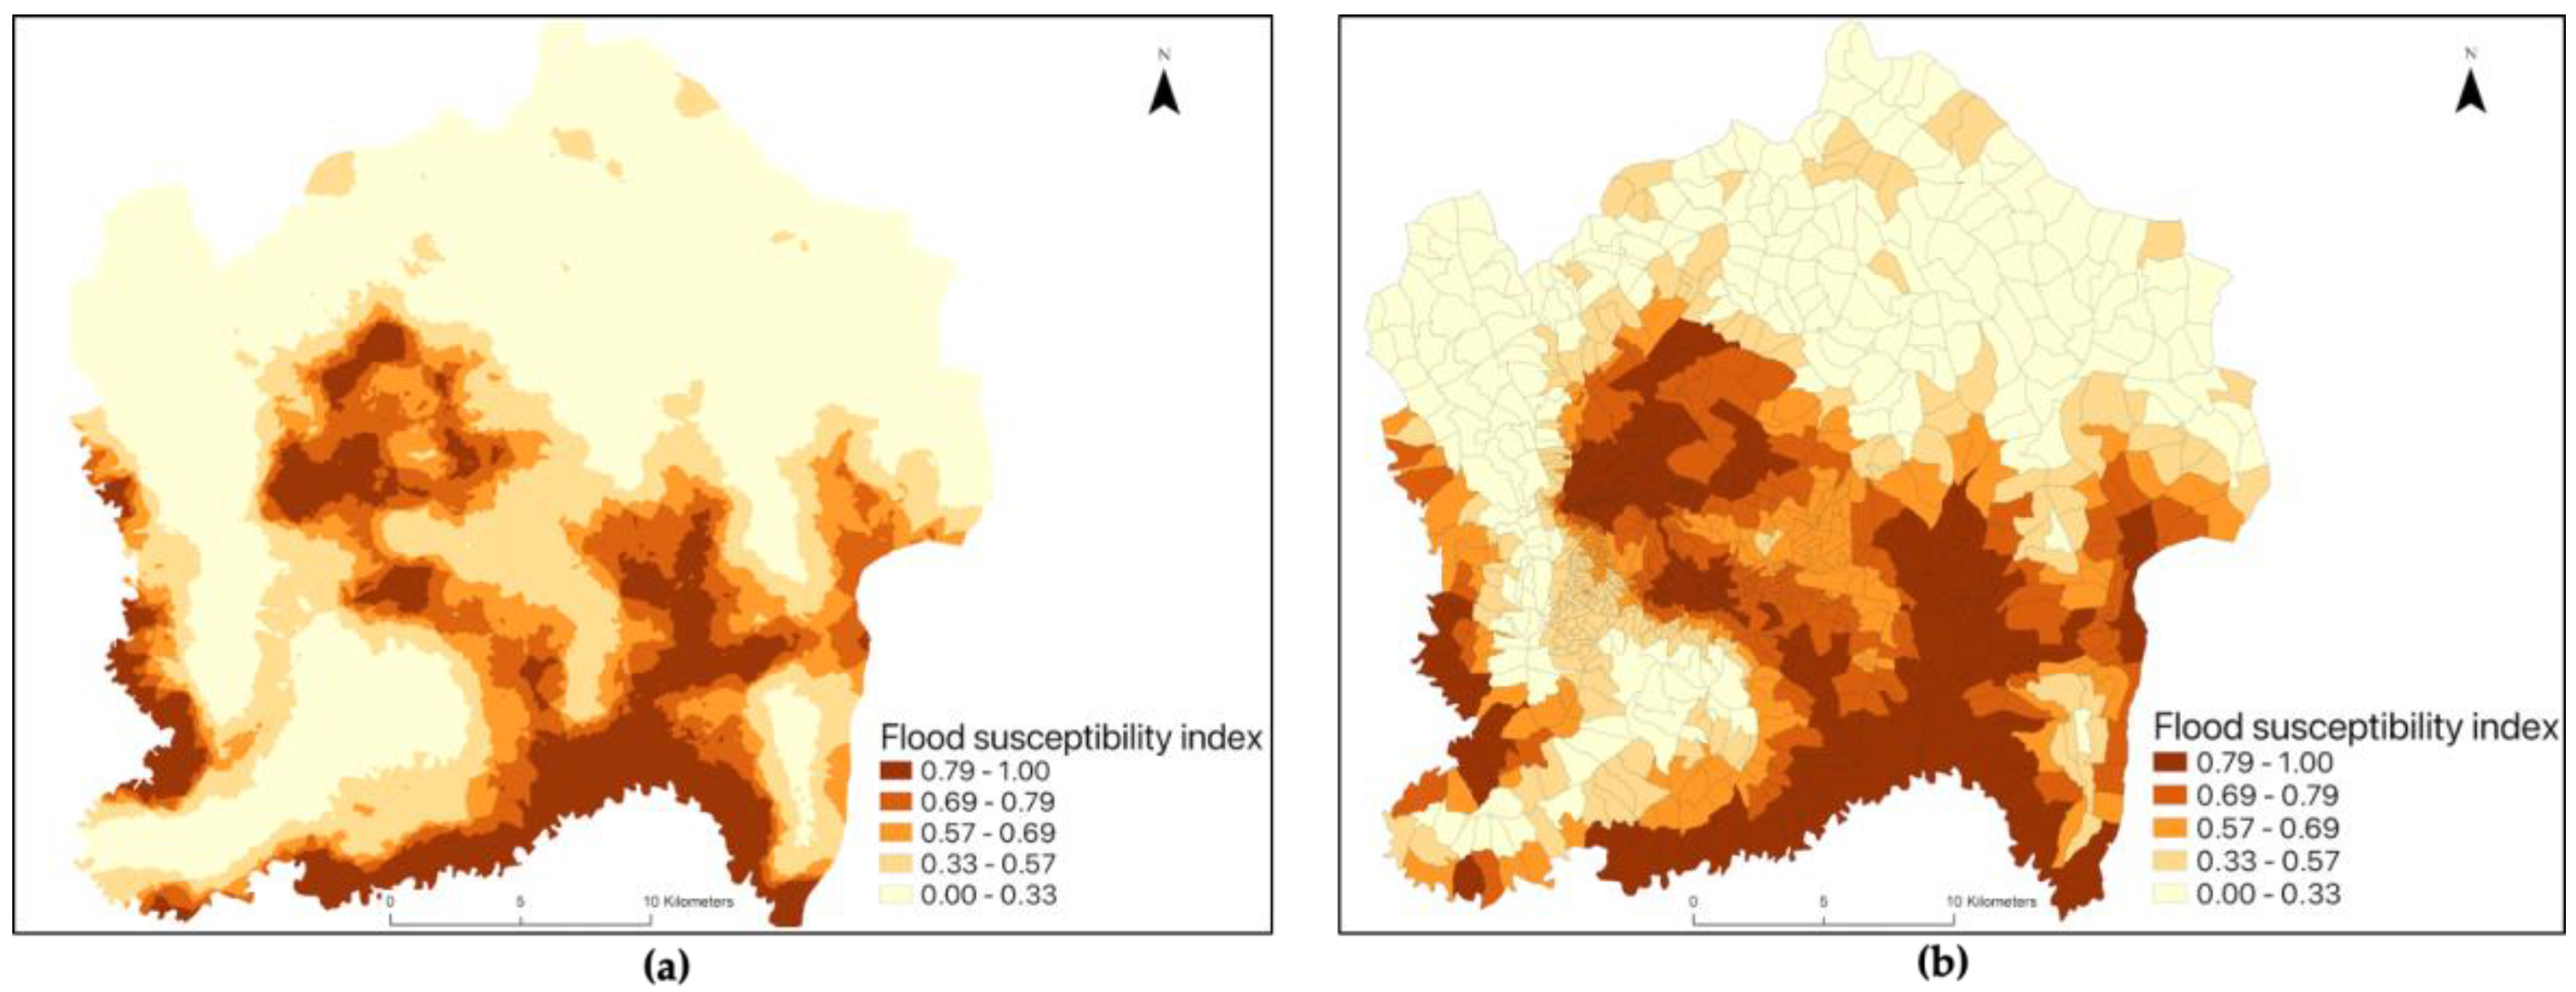
Figure 9.
(a) Socio-economic vulnerability map generated using the Composite Index approach. (b) Socio-economic vulnerability aggregated at the neighborhood level.
Figure 9.
(a) Socio-economic vulnerability map generated using the Composite Index approach. (b) Socio-economic vulnerability aggregated at the neighborhood level.
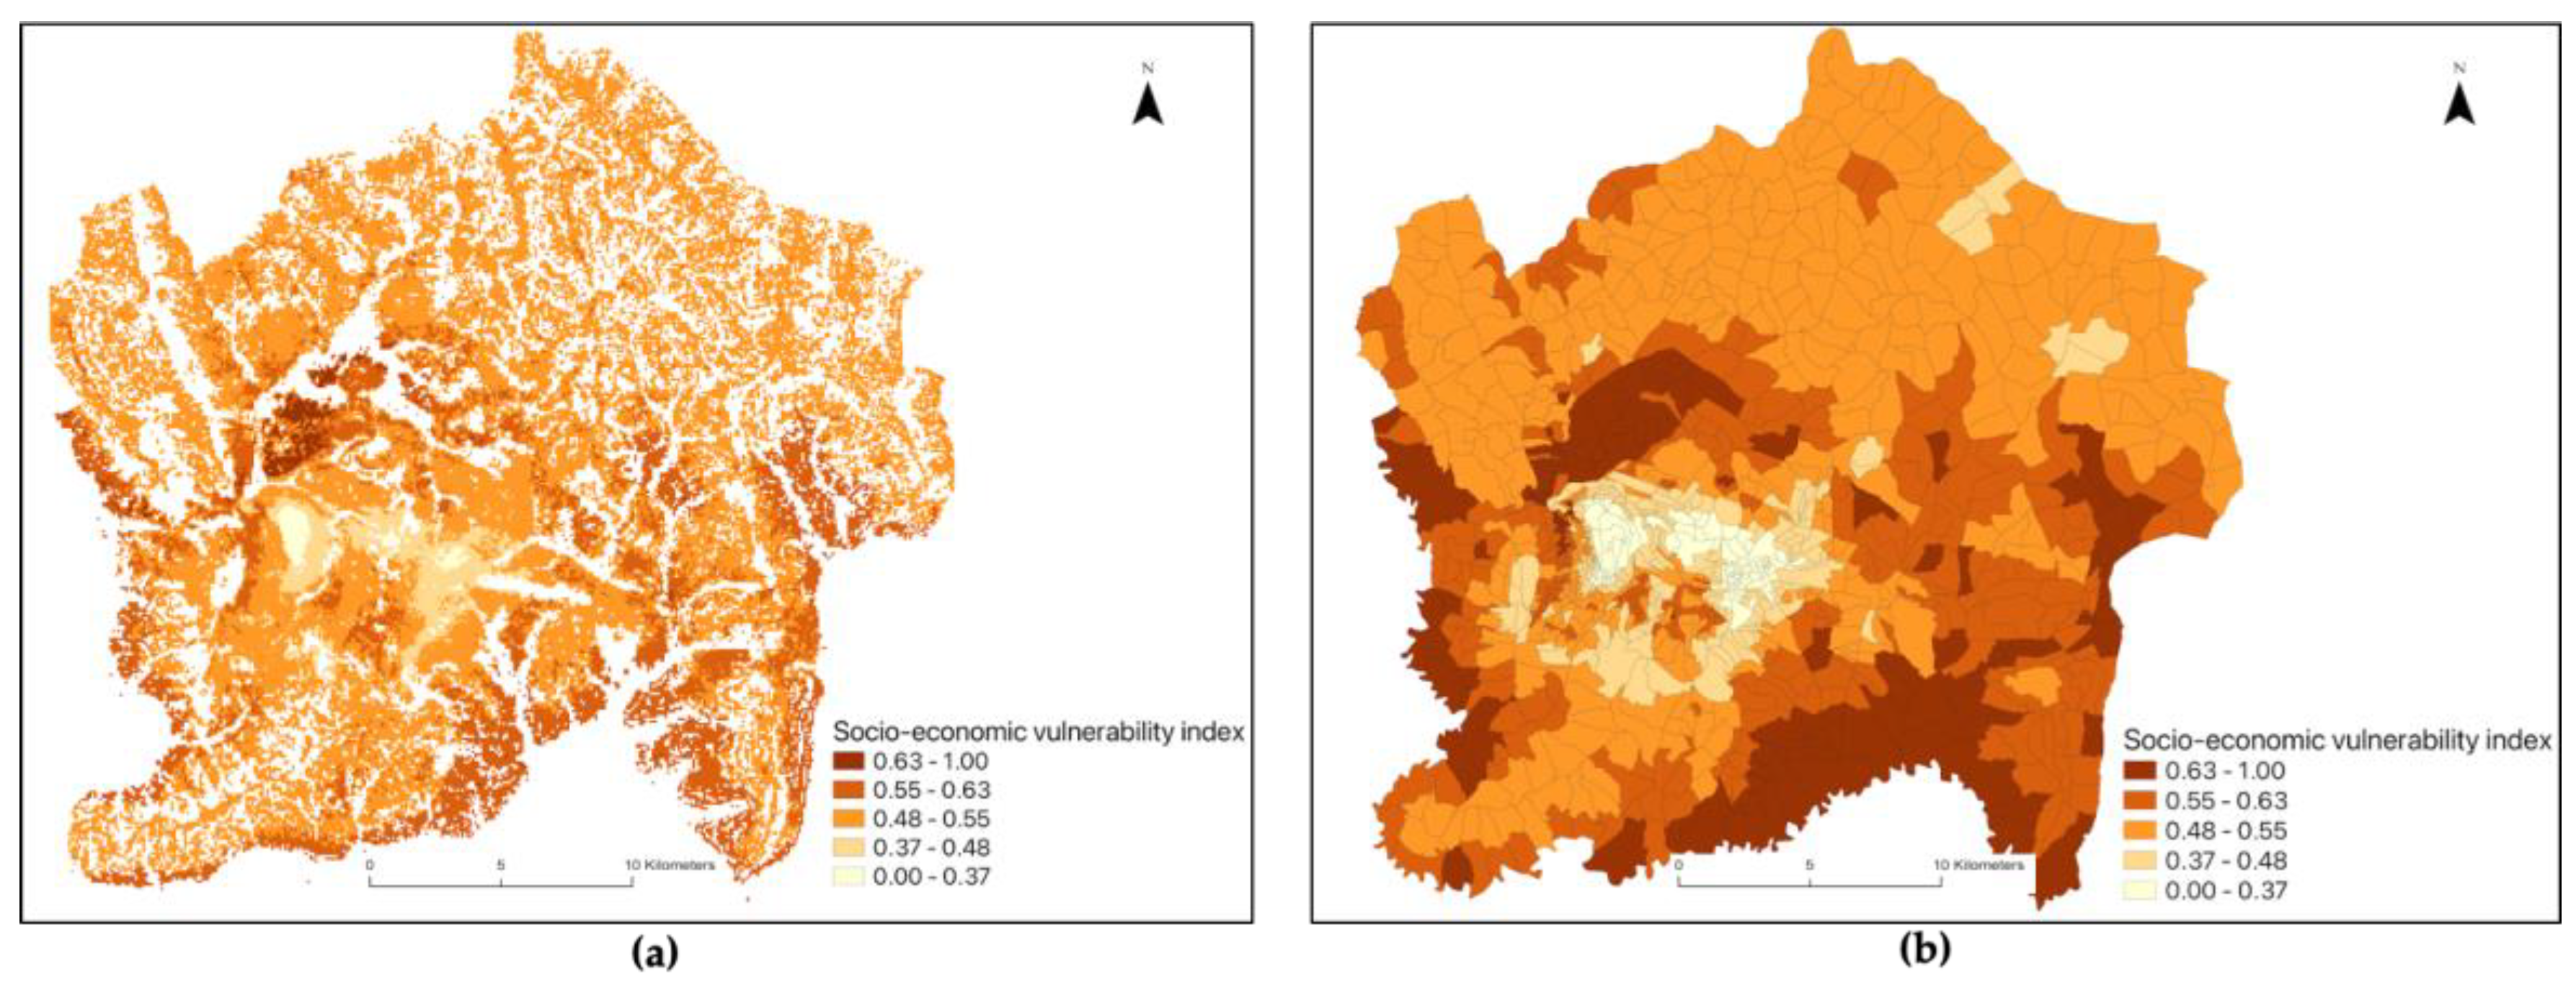
Figure 10.
The receiver operating characteristic curve (AUC) curves on the testing dataset for the models (a) Kampala and (b) Dar es Salaam (Source: Data analysis).
Figure 10.
The receiver operating characteristic curve (AUC) curves on the testing dataset for the models (a) Kampala and (b) Dar es Salaam (Source: Data analysis).
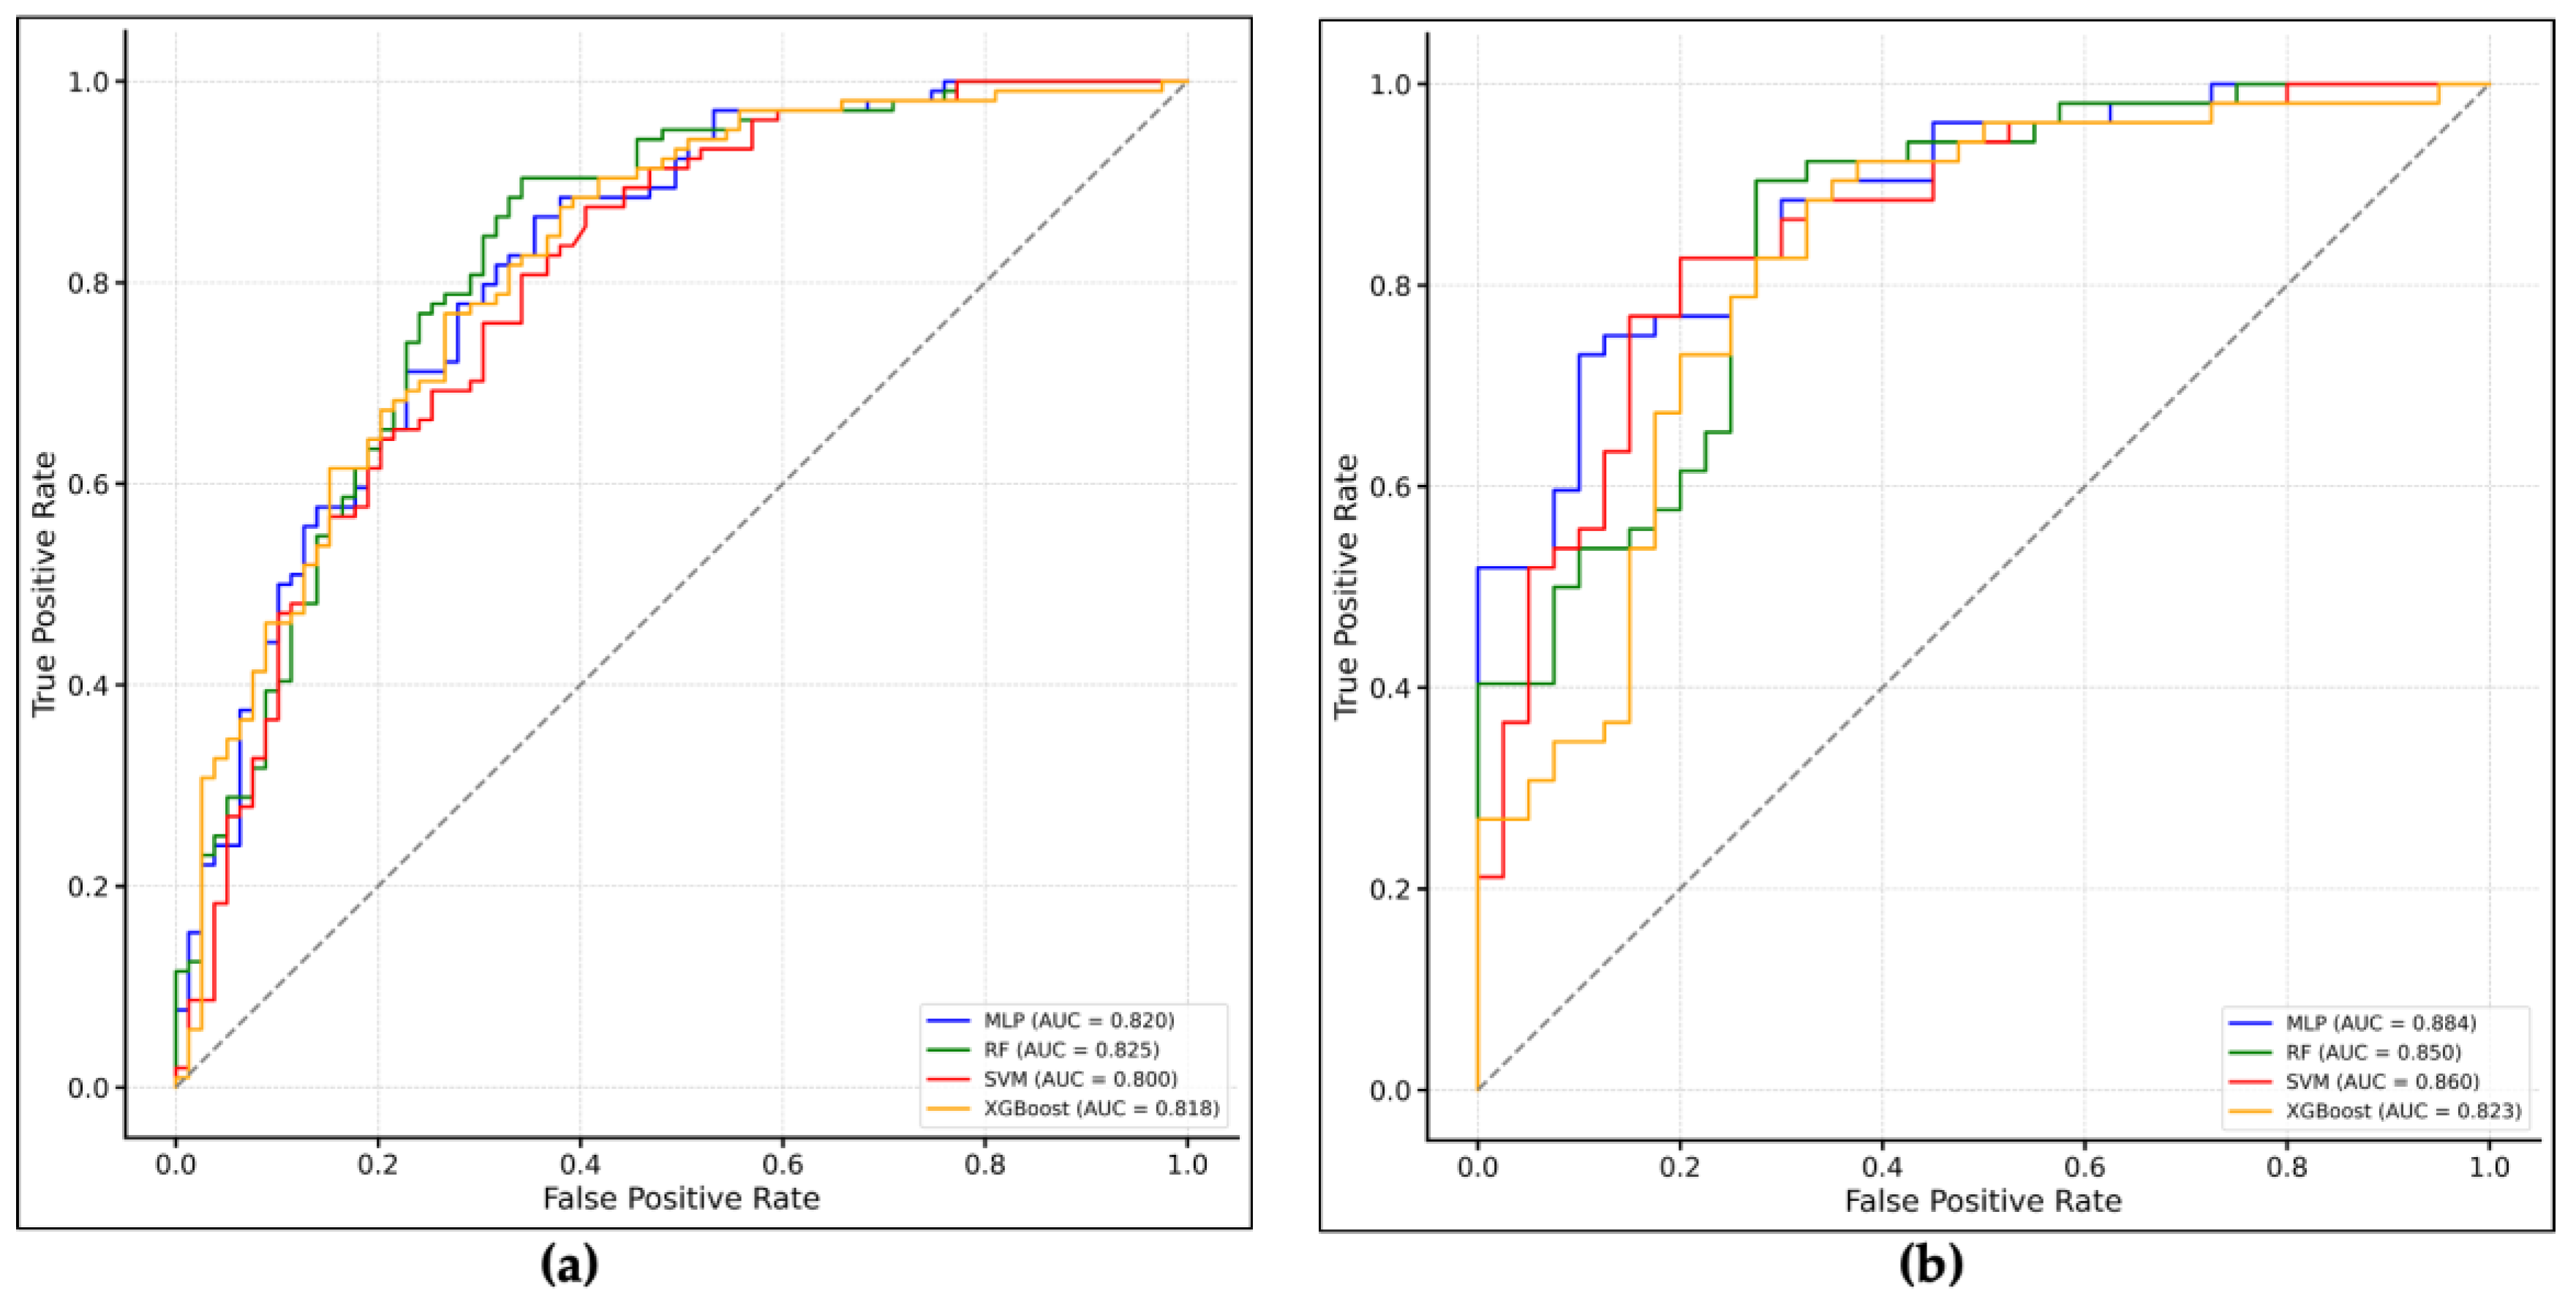

Table 1.
Flood influencing factors.
| Flood-Influencing Factor | Description | Data source |
|---|---|---|
| Elevation | Lower elevation areas are more prone to water accumulation, which increases the likelihood of flooding, while higher elevations typically experience less flooding as water drains downhill [56]. | Extracted from DEM (10 m resolution) obtained from the National Land Authority (NLA) of Rwanda. |
| Slope | Moderate slopes may lead to water accumulation, increasing flood risk, while steep slopes promote rapid runoff, potentially resulting in flash floods [56]. | Extracted from DEM (10 m resolution) obtained from the National Land Authority (NLA) of Rwanda. |
| Aspect | Different aspects can influence vegetation growth and soil moisture levels, impacting flood dynamics; for example, south-facing slopes may dry out faster than north-facing ones [36,57,58,59]. | Extracted from DEM (10 m resolution) obtained from the National Land Authority (NLA) of Rwanda. |
| Land cover | Land cover influences the flow and accumulation of water. For instance, vegetation is important in reducing water runoff and enhancing soil infiltration, which helps mitigate flooding [60]. In contrast, impervious surfaces and barren or open land exacerbate flooding by accelerating water runoff and decreasing water infiltration [61]. | Data were obtained from land cover map of the City of Kigali |
| Normalized Difference Vegetation Index (NDVI) | High NDVI values indicate dense vegetation that can absorb and slow water movement and mitigate flooding effects; low NDVI values suggest sparse vegetation cover correlating with higher flood susceptibility [62]. | Extracted from Sentinel-2 satellite images. |
| Normalized Difference Built-up Index (NDBI) | High NDBI values indicate extensive urban development with impermeable surfaces that exacerbate flooding by increasing surface runoff during heavy rains [63]. | Extracted from Sentinel-2 satellite images. |
| Cumulative Rainfall | Excessive cumulative rainfall can overwhelm drainage systems, particularly in areas with low drainage density or poor soil permeability, leading to increased flooding risks [64]. | Computed from Climate Hazards Group Infrared Precipitation with Station (CHIRPS) data. |
| Drainage Density | Low drainage density can hinder effective water channeling during floods, increasing the likelihood of flooding in those areas [65]. | Computed from drainage networks data obtained from the City of Kigali. |
| Distance from drainage | Areas that are close to drainage systems, including rivers and streams, are more prone to experience flooding in the event that the drainage system is overloaded with water [62]. | Computed based on drainage network data obtained from the City of Kigali. We considered a distance of 10 m from each river and stream based on Law n°48/2018 of 13/08/2018 on the environment in Rwanda [66]. |
Table 2.
Socio-economic indicators.
| Categories | Socio-economic Factors/indicators | Description | Data source |
|---|---|---|---|
| Exposure sensitivity | Population density | Higher population density often leads to increased exposure to hazards such as flooding [6]. In densely populated regions, the concentration of individuals exacerbates the effects of these hazards, as more people are simultaneously affected by limited resources and emergency services during disasters [71]. | Obtained from Worldpop a database for global population and their characteristics at high resolution. |
| Population below 5 years | Young children are not physically able to resist during the flood event since their bodies adapt less efficiently than adults, increasing their risk during flood event [72]. | Obtained from Worldpop. | |
| Population above 65 years | Older people are particularly sensitive to natural hazards people are not physically able to resist during the flood event and are likely suffering from pre-existing health conditions that can be exacerbated by environmental factors, making them a high-risk group during disasters [40]. | Obtained from Worldpop. | |
| Adaptive capacity | Road network | The road network is crucial for understanding human and socio-economic interactions, particularly in accessing essential services [73]. Access to road networks facilitates quicker responses during emergencies and enhances the overall adaptive capacity of communities [74]. | Extracted from OpenStreetMap (OSM), a global open-source database where volunteers map geographic elements [75]. |
| Access to primary healthcare facilities, | Access to healthcare facilities enables quicker medical responses during disasters. When facilities are within reach, individuals can receive timely treatment for injuries or health issues that arise during emergencies [76]. Primary healthcare facilities serve as the initial point of entry for individuals seeking healthcare services. | Computed from the spatial distribution of primary healthcare facilities available from the Ministry of Health of Rwanda and downloaded from the national spatial data geoportal. | |
| Points of interest (POIs) | Socio-economic related POIs, including economic and social activities, were used to describe the availability of socio-economic activities across the city of Kigali [77]. In total, 804 POIs were extracted and grouped into eight categories, namely hospitality services, education, amenities, shopping centers, financial services, culture and recreation, auto services, and health. | POIs were obtained from OSM. |
Table 3.
Performance of Models Based on AUC, Accuracy, Precision, Recall, and F1-Score.
| Model | AUC | Accuracy | Precision | Recall | F1-Score |
|---|---|---|---|---|---|
| MLP | 0.902 | 0.85 | 0.83 | 0.90 | 0.86 |
| SVM | 0.885 | 0.82 | 0.79 | 0.90 | 0.84 |
| RF | 0.884 | 0.80 | 0.78 | 0.87 | 0.82 |
| XGBoost | 0.883 | 0.80 | 0.77 | 0.88 | 0.82 |
Table 4.
AUC and MAE values for Kampala and Dar es Salam.
| City | Model | AUC | MAE |
|---|---|---|---|
| Kampala | MLP | 0.475 | 0.511 |
| RF | 0.473 | 0.530 | |
| SVM | 0.455 | 0.547 | |
| XGBoost | 0.519 | 0.484 | |
| Dar es Salaam | MLP | 0.402 | 0.523 |
| RF | 0.403 | 0.590 | |
| SVM | 0.447 | 0.535 | |
| XGBoost | 0.387 | 0.605 |
Disclaimer/Publisher’s Note: The statements, opinions and data contained in all publications are solely those of the individual author(s) and contributor(s) and not of MDPI and/or the editor(s). MDPI and/or the editor(s) disclaim responsibility for any injury to people or property resulting from any ideas, methods, instructions or products referred to in the content. |
© 2025 by the authors. Licensee MDPI, Basel, Switzerland. This article is an open access article distributed under the terms and conditions of the Creative Commons Attribution (CC BY) license (http://creativecommons.org/licenses/by/4.0/).
Copyright: This open access article is published under a Creative Commons CC BY 4.0 license, which permit the free download, distribution, and reuse, provided that the author and preprint are cited in any reuse.


