Submitted:
21 August 2025
Posted:
22 August 2025
You are already at the latest version
Abstract
Many places in Southern Africa experience seasonal flooding, but the intensity and predictability of these events have changed significantly over the past few decades. These increasingly severe and unpredictable floods affect rivers and low-lying areas the most. The Okavango Delta, the fifth largest Ramsar site in the world and UNESCO World Heritage site, has experienced a series of large floods since 2007, with particularly high inundation between 2009 and 2012. This study assesses the technical accuracy of flood forecasts and evaluates their relevance and integration into Community-based Risk Management (CBRM) strategies, particularly in flood-prone areas of Ngamiland District. Through geospatial analysis, soil physical and chemical analysis, literature review, and key stakeholder interviews, this research aims to bridge the gap between scientific flood prediction and community-level preparedness, ultimately contributing to more inclusive and effective early warning systems.
Keywords:
community-based risk management
; flood forecast accuracy
; okavango delta
; soil physics
; soil chemistry
1. Introduction
1.1. Introduction
Flooding is defined as a temporary condition of partial or complete inundation of normally dry land areas from the overflow of inland or tidal waters or from the unusual and rapid accumulation or runoff of surface waters from any source (UNISDR,2009). Floods are the most frequent types of natural disasters in the world. They pose a threat to both rural and urban areas, especially now that the climate and land use patterns are changing quickly. According to the Centre for Research on the Epidemiology of Disasters [CRED] & United Nations Office for Disaster Risk Reduction [UNDRR], (2015), from 1994 to 2013, flooding was the most frequent natural disaster, accounting for 43% of all recorded natural events and impacting almost 2.5 billion individuals worldwide. Low-income communities and developing countries are the most affected because they adapt slowly and have no or too few early warning systems (UNDRR, 2020). In sub-Saharan Africa, this problem is made worse by weak institutions and unequal access to technology.
Many places in southern Africa receive seasonal floods, but the size and effects of these floods have become less predictable and more severe over the last few decades, affecting rivers and lowlands the most (NASA Earth Observatory, 2008). The 2018-2019 Cyclone Idai that caused devastating floods in Mozambique and Zimbabwe (Tevera, Musasa, & Simelane, 2021) and the 2024 unprecedented flooding in West and Central Africa asserts this. Botswana is mostly a semi-arid country and could be perceived as not prone to flooding. However, the Okavango Delta, both a RAMSAR and UNESCO World Heritage site, experiences flooding.
Flooding in the Delta, driven by the rainy season in the highlands of Angola, is both a normal physical process and a disaster for the people who live within its constantly changing extent. The annual floods are a regular occurrence, with some people even practicing flood recession agriculture (Molapo farming) close to or in the floodplains of river channels where soils are moistened by the seasonal floods or the draining of water into low-lying ground (King, Shinn, Crews, & Young, 2016). The flooding event that occurred in the Okavango Delta from 2009 to 2011, however, showed how the local government was unprepared, resource allocation and community coping mechanisms were overstretched. Although regional meteorological and hydrological patterns and above-average rainfall events in the catchment areas of Angola were known, the translation of this data into timely and actionable flood forecasts “tended to be generic, with little hydrological data usage, and flood plans were rarely updated,” as pointed out by Motsholapheko et al. (2013). During the flooding, thousands of people were forced to leave their homes, their crops failed and some fell sick due to drinking dirty water (Mmopelwa, Kgathi, & Molefhe, 2011).
Satellite images and geospatial techniques and tools are now being used increasingly to map, monitor and predict floods in most countries (Garcia-Pintado & Neal, 2023) such as the United States, India, Bangladesh, Namibia and Botswana although Botswana is still somewhat emerging in this regard. In Botswana geospatial techniques and tools are still underdeveloped and underutilized. In addition, most flood risk reduction efforts have used centralized models, which often disregard the knowledge of people who have been and are most likely to be affected. This research champions a shift toward community-based risk management (CBRM), as an integral part of disaster risk management that needs to be integrated with remote sensing acquired data and GIS-based flood-extent mapping. “Community-based disaster risk management arrangements (CBDRMAs) have the potential to fill the gap between household-level and national-level strategies for risk management” (Bhattamishra & Barrett, 2010). By centering the voices and insights of those most at risk, while leveraging the precision of geospatial data, the study seeks to explore how people-centered methods can enhance both community preparedness and resilience. The 2009-2011 Okavango flooding events serve as a recent historical unprecedented incident and additionally provides a lens through which to explore the possibilities of merging traditional knowledge, environmental and hydro-meteorological reality with the common people at the center. Therein lies the opportunity to connect scientific modelling with grassroots community engagement to develop more resilient, locally-anchored, actionable and efficient flood risk management systems.
1.2. Statement of The Problem
Flooding in the Okavango Delta, Botswana, particularly the Ngamiland District, is a recurring challenge, causing significant disruptions to people’s livelihoods, essential infrastructure, and the stability of ecosystems. The severe flooding in 2009, 2010 and 2011, among the most extreme recordedin the region, have highlighted the area’s vulnerability to hydrological extremes (Thito, Wolski, and Murray-Hudson, 2016).
Despite advancements in flood forecasting and prediction through the application of remote sensing, Geographic Information Systems (GIS), and hydrological models, a prominent disconnect persists between technical flood predictions and community-level risk preparedness. Thakadu, Kolawole, & Sommer (2017) observed that although communities generally trust flood risk messaging, the timing and applicability of such information are often inadequate for facilitating effective responses. Furthermore, while flood inundation maps derived from remote sensing show high accuracy (Thito et al., 2016), their practical utility in guiding local actions remains insufficiently explored.
Hybrid reservoir-GIS models have effectively captured broad-scale flood dynamics in the Delta (Wolski, Savenije, Murray-Hudson & Gumbricht, 2006), and remote sensing imageries such as MODIS and Landsat, produce relatively high accuracy and reliable flood extent mapping (Thito et al., 2016). However, the integration of these technological methods, combining flood modelling and inundation mapping, into community-based risk management frameworks remains limited. Many local communities lack access to timely, comprehensible flood forecasts and existing response systems are often informal and poorly linked with institutional early warning systems (Thakadu, Kolawole & Sommer 2017). This disconnect restricts the capacity of predictive tools to effectively support proactive risk reduction strategies.
Consequently, there exists an urgent need to assess not only the technical accuracy of flood forecasts but also their accessibility and integration within community-based risk management strategies, particularly in the flood-prone areas of Ngamiland District.
1.3. Research Questions
- i.
-
General Research QuestionTo what extent have existing flood forecasting methods, techniques and tools been effective in predicting flood events in Ngamiland, and how are these predictions integrated into community-based risk management strategies?
- ii.
-
Specific Research Questions
- 1.
- What are the spatial characteristics of flood-prone areas in relation to soil physical properties?
- 2.
- How do local communities perceive and respond to flood forecasts and early warning systems?
- 3.
- What community-based risk management strategies exist and how are they aligned with scientific predictions/forecasts
- 4.
- How does the limited integration of local knowledge and scientific hydrological data affect flood predictability and community preparedness in the delta and what opportunities exist for improvement?
1.4. Research Objectives
- i.
-
General Research ObjectiveTo evaluate the disconnect between scientific flood forecasts and their integration in community-based risk management.
- ii.
-
Specific Research Objectives
- 1.
- To assess the predictive accuracy of remote sensing data and existing hydrological models in estimating flood extent through literature review.
- 2.
- To analyze the influence of soil-hydrological and topographic features on flood extent in floodplains and/or flood prone-areas.
- 3.
- To examine the level of community awareness, trust, and response to early warning systems during the 2009-2011 flood event and identify the existing community-based risk management strategies.
- 4.
- To explore the potential for integrating local knowledge and scientific data to create or improve existing community-based early warning systems.
1.5. Hypotheses
| Research Objective | Hypothesis |
| General Objective: To evaluate the disconnect between scientific flood forecasts and their integration in community-based risk management. | There is a significant disconnect between scientific forecasts and their integration into community-based risk management in Ngamiland. |
| Specific Objective 2: to analyze the influence of soil-hydrological and topographic features on flood extent in floodplains and/or flood prone-areas. | Soil properties, especially the physical, have a significant influence on flood-prone areas. |
| Objective 3: to examine the level of community awareness, trust, and response to early warning systems during the 2009-2011 flood event and identify the existing community-based risk management strategies. | Communities with higher awareness and trust in early warning systems are more likely to respond proactively and use local risk management strategies. |
| Objective 4: To explore the potential for integrating local knowledge and scientific data to create or improve existing community-based early warning systems. | There is a high potential for improving flood-preparedness outcomes by integrating local knowledge and scientific flood-forecasting tools. |
1.6. Justification for the Study
This study is necessary in light of the recurrent floods in the Okavango delta and the surrounding Ngamiland district, more especially the 2009-2011 period, which revealed significant weaknesses in Botswana’s community preparedness and forecasting accuracy. Despite the growing availability of hydrological and geospatial data, communities remain overly vulnerable due to weak early warning systems, underutilization of predictive tools and a disconnect between scientific outputs and local-level risk management strategies.
By evaluating the reliability of past flood forecasts and the extent to which local communities integrated that information into risk management planning, this study will help to identify practical gaps in existing systems. The research will also contribute to national resilience strategies by suggesting ways to improve local acceptance of forecasts or hazard warnings through community-based risk reduction approaches.
1.7. Scope of the Study
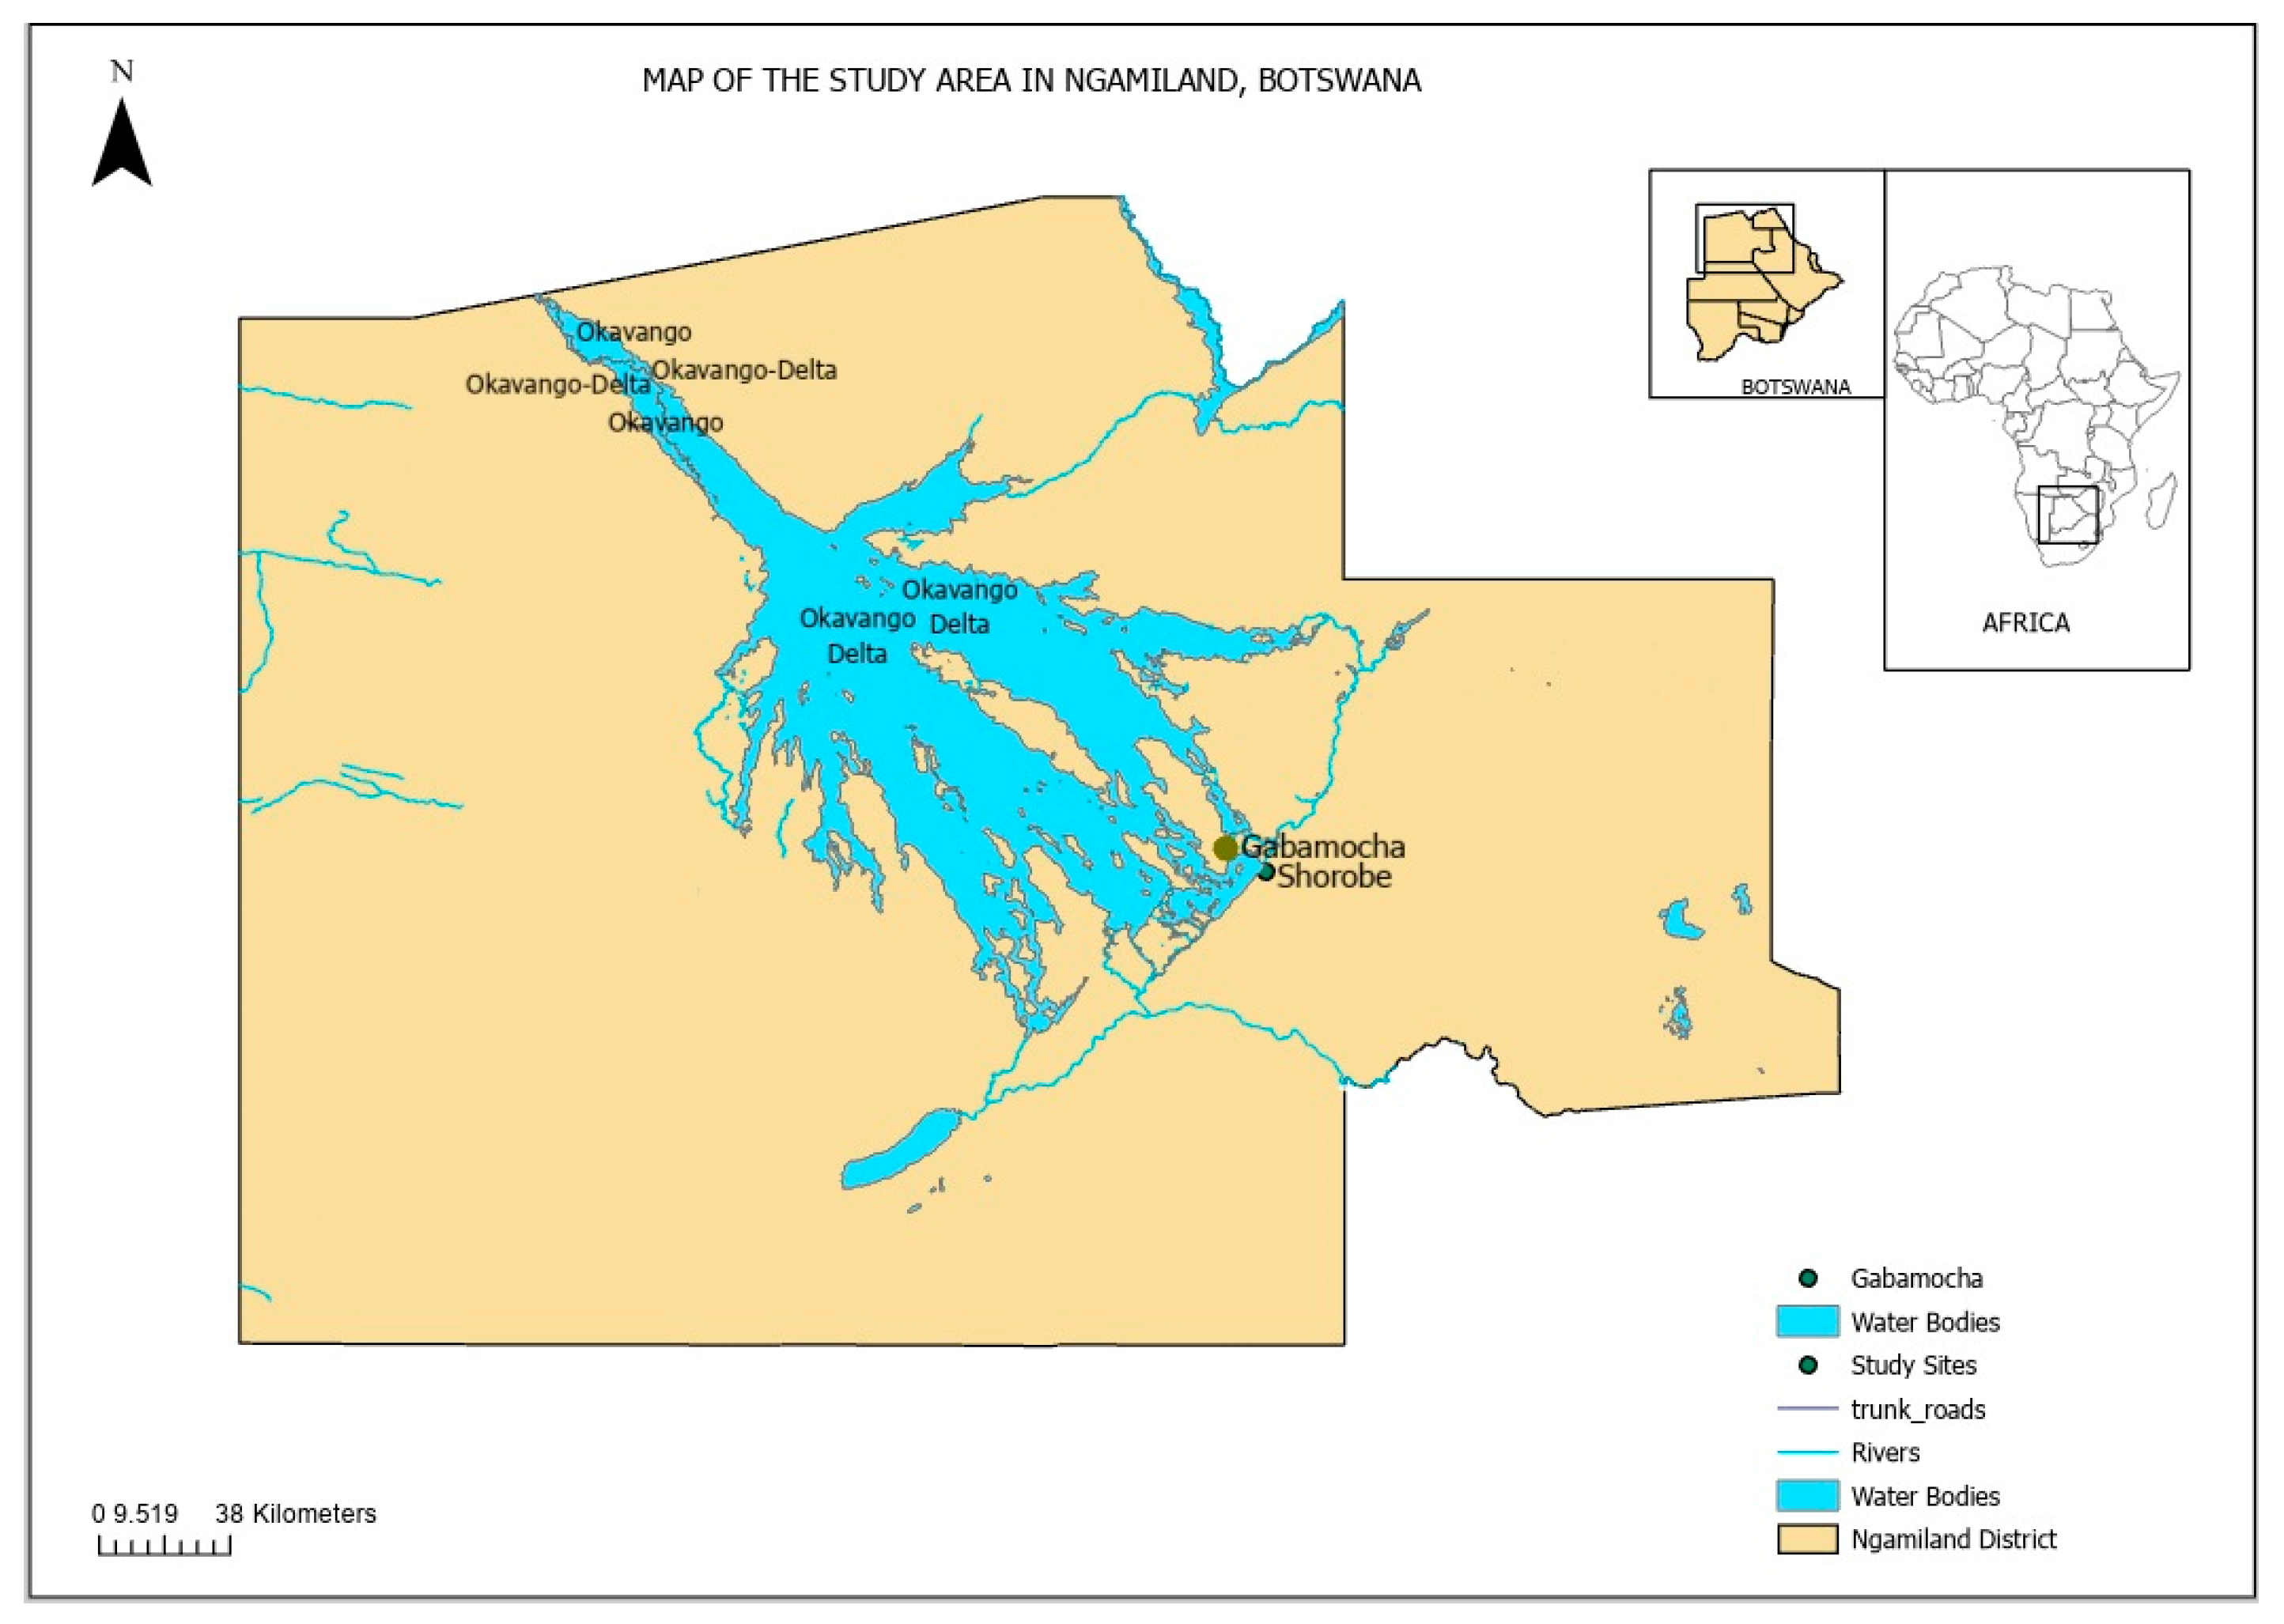
This study focuses on the Ngamiland district in north-west Botswana, particularly areas within and adjacent to the Okavango delta floodplain, particularly the settlements of Shorobe and Gabamocha. These locations were selected due to their distance from the Delta channels, past exposure to flooding, and their ecological and socio-economic dependence on flood cycles such as Molapo farming.
1.8. Operational definition of Concepts
- Flood Forecast Accuracy: refers to how closely the forecasted values of flood parameters (such as peak discharge, timing, or inundation extent) match the observed flood outcomes, as defined by the World Meteorological Organization (2011). It comprises of precision and reliability of predicting the occurrence, magnitude, timing, and duration of floods. Accurate flood forecasts enable timely and effective response measures to mitigate the impact of flooding. In this study, it refers to how well forecasts issued during the 2009-2011 period matched actual flood events.
- Community-Based Disaster Risk Management (CBDRM) is an approach and process of disaster risk management in which communities at risk are actively engaged in the identification, analysis, treatment, monitoring and evaluation of disaster risks in order to reduce their vulnerabilities and enhance their capacities to prevent and withstand damaging effects of hazards (the Maldives National Disaster Management Authority (NDMA).
- Early Warning Systems: defined by the UNDRR (2017) as an integrated system of hazard monitoring, forecasting and prediction, disaster risk assessment, communication and preparedness activities systems and processes that enables individuals, communities, governments, businesses and others to take timely action to reduce disaster risks in advance of hazardous events.
- Hydrological Modelling: involves the use of digital tools, techniques and methodologies to analyze data and create simulations of water movement, distribution, and quality through the components of the hydrological cycle. These models are essential for managing water resources, predicting flood events, maintaining ecosystem health, designing hydraulic structures, and in climate change studies (World Meteorological Organization, 2008).
- Geospatial Techniques and Tools: the technologies, applications, and methods used to gather, analyze, visualize and interpret spatial or geographical data, examples being Remote Sensing (RS) and Global Positioning Systems (GPS) and Geographic Information Systems (GIS). These are widely applied in flood mapping, environmental monitoring and disaster risk management (Goodchild, 2007; Lillesand, Kiefer, & Chipman, 2015).
Abbreviations and Acronyms
- EO: Earth Observation
- GIS: Geographic Information System
- SMI: Soil Moisture Index
- SWIR: Short Wave Infrared (band)
- MODIS: Moderate Resolution Imaging Spectroradiometer (Imagery)
2. Literature Review
2.1. Introduction
Tiwari, Deo, and Adamowski (2021) define flood forecasting as the estimation of future water levels or flows at a single or multiple sites of a river system for different lead times. The United Nations (2006), in turn, defines early warning systems as “an integrated system of hazard monitoring, forecasting and prediction, disaster risk assessment, communication and preparedness activities, systems and processes that enable individuals, communities, governments, businesses and others to take timely action to reduce disaster risks in advance of hazardous events.” The UNDRR (2009) similarly defines early warning as “the provision of timely and effective information through identified institutions, that allows individuals that may be exposed to a hazard to take action to avoid or reduce their risk and prepare for effective response.” Flood forecasting, thereby, is a necessary part of flood management, given that no preventative or defense measures can be completely effective. This literature review critically explores global, regional and local perspectives on flood risk prediction, soil-based flood vulnerability, and community-based disaster risk reduction. The review highlights theoretical contributions, empirical findings and metrological approaches while identifying key gaps that this study addresses.
2.2. Empirical and Theoretical Perspectives
- I.
-
Global and Regional Perspectives on Flood Prediction and VulnerabilityFlood risk prediction has evolved with advances in hydrological modelling, remote sensing and machine learning techniques (Sharma & Machiwal, 2017). Globally, systems integrating soil hydrology, rainfall intensity and terrain analysis have improved short-term forecasts (Rahman, Ahmed & Haque, 2021). At regional level, sub-Saharan Africa has seen an increasing use of geospatial tools in modelling flood extent and vulnerability (CRED & UNDRR, 2015).Hillel (2004) showed that soil characteristics such as texture, porosity and moisture retention play a critical role in determining flood susceptibility. Additionally, Mercer, et al. (2012), showed that high bulk density and low infiltration rates increase surface runoff, particularly in flood-prone areas.
- II.
-
Flooding in the Okavango Delta: Local Experiences and StudiesThe Okavango Delta experiences seasonal flooding shaped by upstream rainfall in the Republic of Angola and the distributary dynamics of the delta’s channels. Flood events between the years 2009 and 2011 had significant socio-economic impacts, especially in Ngamiland district (Mmolawa et al., 2011, Motsholapheko et al., 2013). These studies found that community resilience was often restricted by limited access to early warnings and inadequate preparedness.Modeling efforts such as those by Wolski et al. (2006, 2007) and Tuito e al. (2016) demonstrated how integrating hydrodynamic models with satellite data can improve inundation mapping and prediction. However, their models often overlooked local soil characteristics, which significantly influence flood dynamics at micro level.
- III.
-
Community Based Flood Risk ReductionCommunity engagement in flood preparedness has proven effective in regions with high uncertainty in hydrological forecasting. Mercer et al. (2012) advocates for integrating local knowledge with scientific data for robust risk communication. In Botswana, Shinn (2018) and Takadzwa et al. (2017) emphasized the value of participatory methods for social-ecological adaptation, though the translation of forecasts into community-level action remains inexistent.Rahman et al. (2021) demonstrated in South Asia that community-based early warning systems (CBEWS) are only effective when communities understand, trust and respond to warnings. This reinforces Brown et al.’s (2019) observation in the Zambezi Basin that strong institutional frameworks are needed for early warning systems (EWS) to succeed in Africa.
- IV.
-
Flood Modeling and Inundation MappingGlobally, flood modeling has evolved in response to increasing flood frequency and severity. Models such as LISFLOOD-FP, HEC-RAS and SWAT have been widely applied to simulate flood inundation dynamics and support early warning systems. Earth observation (EO) data, particularly from MODIS, Sentinel-1 and Landsat satellites, has become central in these efforts, offering both cost effective and regularly updated data on flood extent, depth and duration (Schumann & Bates, 2018, Tarpanelli et al., 2017).However, in many low and middle-income regions, including sub Saharan Africa, flood models often suffer from coarse resolution, sparse ground calibration data, and weak institutional links with local disaster preparedness systems (Ward et al., 2015). This gap reveals the need for context-specific, smaller-scale modeling approaches that balance scientific accuracy with practical applicability for local stakeholders.In Botswana, the Okavango Delta more specifically, early work by Wolski et al. (2006,2007) laid the groundwork for flood modelling using a hybrid reservoir-GIS approach that considered river inflow, local rainfall, evapotranspiration and topography. These models were instrumental in demonstrating the non-linear hydrological behavior of the delta. More recently, Marthews et al. (2022) applied the global JULES-CaMa-Flood framework to simulate flooding across major tropical wetlands. Their findings revealed that while such models could represent broad seasonal trends, they struggled to reflect local-scale dynamics such as channel overflow and distribution shifting. The authors emphasized the need for locally calibrated models to improve flood predictability in Botswana’s wetland regions.While these developments in technology offer valuable insights into flood mapping and prediction, a persistent gap exists between EO-derived flood intelligence and the risk communication systems available to local communities. This study aims to address that gap by grounding flood analysis in both high-resolution EO data and local field-based knowledge, including community interviews and soil assessments. This integrated approach supports more accurate, equitable and usable flood forecasting in complex, data-scarce environments.
- V.
-
Soil Properties and Flood VulnerabilitySoil plays an important role in flood infiltration and runoff. Studies, such as Hillel (2004) and Wolski et al.’s (2006) work in modeling, point to the importance of analyzing physical soil parameters. While flood extent is often mapped using hydrological and remote sensing tools, the underlying soil physical properties play a foundational role in determining the flood vulnerability of an area, yet they remain under-represented in most models (Hess et al., 2022, Marthews et al., 2022). Parameters such as texture, soil structure, and moisture retention capacity among others, critically influence how water interacts with the land surface (Hillel, 2004, Brady & Weil, 2016).Soils in the Okavango delta range from sandy and well-drained dunes to clay-dominated and water-retaining soils in the low-lying alluvial plains (Murray-Hudson et al., 2016). These physical differences directly affect flood retention and runoff behavior. Clay soils, for instance, tend to impede infiltration and promote water pooling, increasing the risk of prolonged surface flooding (Rawls et al., 1993, Mikkelsen et al., 2013). Conversely, sandy soils allow rapid percolation but may worsen subsurface water loss, reducing the soil moisture available for vegetation and farming (Brady & Weil, 2016). Understanding soil data can help refine both flood risk assessments and adaptation strategies such as drainage interventions and placement of emergency infrastructure (Hillel, 2004, Mikkelsen et al., 2013).This study seeks to bridge the gap between hydrological modeling and the ground vulnerability assessment by combining soil sample analysis with flood maps generated from satellite imagery and remote sensing tools and community perspectives to assess flood vulnerability.
- VI.
-
Methodological Approaches in Similar StudiesNumerous studies have made important contributions to flood modeling, EO-based mapping and vulnerability assessments, however, only a few have effectively combined all three approaches. For instance, Wolski et al. (2017) integrated MODIS imagery with runoff simulations to estimate Okavango flood extent but did not engage the community. Meanwhile, Budhathoki et al. (2020) and Mufute et al. (2008) demonstrated the power of combining geospatial mapping with participatory risk communication. Masocha et al.’s (2021) is one of the very few studies that include soil physical characteristics to explain spatial variations in flood impacts.This study aims to bridge these gaps by combining EO-derived flood mapping, soil property field analysis and community-based interviews into a multi-scalar vulnerability framework for Ngamiland, Botswana.
2.3. Theoretical and Conceptual Framework
Flood vulnerability and community disaster preparedness are shaped by a combination of environmental, infrastructural and social factors. This study is grounded in the Disaster Risk Reduction (DRR) framework and the Disaster Pressure and Release (PAR) model, which conceptualize disasters not just as natural disasters but as outcomes of societal vulnerability and environmental hazards (Wisner et al., 2004). The framework illustrates how limited infiltration capacity, weak forecasting integration, and poor risk-communication create a pressure that eventually leads to significant community impact during flood events like those recorded in Ngamiland, Botswana from 2009 to 2011.
Past empirical studies highlight the role of hydrological and remote sensing models in early flood detection. Wolski, et al. (2017) for instance, demonstrated the effectiveness of MODIS and SWAT models in predicting Okavango Delta flooding. However, these technologies are rarely translated into formats that can be used by rural communities. This gap points out the weak interface between science-based prediction and community based early warning systems as observed by Brown et al. (2019) in the Zambezi basin.
The conceptual framework for this study (Figure 1) shows the interplay between the natural environmental vulnerability (such as soil bulk density, prevalent soil type) and institutional limitations such as inadequate warning dissemination. At the core is the lack of fully-operational community based early warning systems, driven by the mismatch between flood prediction systems and community-level preparedness, which increases people’s chances to being exposed and harmed by the flood and limits risk reduction.
Additionally, soil physical properties, such as bulk density and moisture content, play a critical role in influencing local flood vulnerability. High bulk density and moisture content can intensify flood impact (Hillel, 2004). By integrating soil analysis, remote sensing and community interviews, this research adopts a mixed methods approach. It will provide a holistic view of flood susceptibility and preparedness gaps in the Okavango delta.
Despite growing literature on Community-based Early Warning Systems, there are gaps that remain in translating hydrological model predictions into actionable local knowledge. There is also limited empirical data comparing soil characteristics with historical flood impacts in Botswana. This study aims to fill these gaps by combining technical soil analysis with community narratives, thereby contributing to both applied flood science and community-centered adaptation planning.
3. Methodology
3.1. Research Design
This study adopted a mixed method approach involving both qualitative data; review of past research reports, official reports, face-to-face interviews, and quantitative data; remote sensing, GIS and an analysis of soil samples. This design was suitable as it allowed for a comprehensive understanding of flood predictability, the limitations of the flood forecasting models currently being used in Botswana and community risk management practices in the Ngamiland region.
3.2. Population
The study population comprised of the residents of flood-affected areas in Ngamiland, including key stakeholders such as the local leaders, and households that experienced direct impacts from the 2009-2011 flooding event. Additionally, this study considered the natural environment of flood-prone settlements in Ngamiland, specifically focusing on the villages of Shorobe, and Gabamocha. Institutions responsible for flood forecasting or disaster response within the country were also included, given their critical role in flood prediction and management. This population was purposefully selected due to their firsthand knowledge and experience regarding flood impacts, access to flood prediction information and preparedness or response measures.
Figure 2.
Showing the study areas in Ngamiland, Botswana.
3.3. Sampling Frame
The sampling frame for this study encompassed directly affected households (from community records), local leaders and responsible institutional representatives (Kgosi, Kgosana and VDC members). This approach ensured that the sample captured a broad and informed perspective on flood impacts, prediction and management practices in the region.
3.4. Sampling and Sampling Techniques
Soil samples:
Soil samples were collected to assess variations in soil quality across different land uses and ecological zones. Systematic transect sampling with point intercepts was the sampling design used to capture spatial and environmental variability within the study area (sample points shown in Table 1). Using augers, thirty samples from the villages were collected at low-lying (flood-prone) zones, slightly elevated (moderate risk) zones and upland areas (low risk). Global Positioning System (GPS) coordinates and photographs were recorded for each sampling point.
Spatial Data (Shape-files and Raster Files)
Remote sensing and GIS data was used to complement field data, support spatial analysis, and allow for temporal comparisons. Data was sourced from reputable open-access platforms. Sources of the data included USGS Earth Explorer and the SASSCAL Geo Portal. The data types that were downloaded and used are Shape-files (for administrative boundaries, land use maps, ecological zones), and Raster Files (.tif) (NDVI, precipitation and soil moisture). The selection criteria included high spatial resolution, temporal coverage and dry vs wet season differentiation.
Interviews
Qualitative data was collected through structured interviews with stakeholders who have knowledge or lived experience related to the research area. This enriched the study with local perspectives, contextual understanding, and potential ground-truthing for spatial data. Participants were selected based on: residency in the village during the 2009-2011 flooding event, age (over 30 years old) and experience with flood preparedness and response, starting with the village Chief and Village Development Committee Chairperson. The leaders then introduced some individuals who were affected by the floods, who in turn did the same. Thereby, the snowball sampling technique was used to find interviewees, and interviews were collected until data saturation was reached.
Literature Review
The literature review formed the theoretical and contextual foundation of the study. Relevant academic and grey literature was reviewed to identify gaps, refine the research questions, and contextualize the study geographically and thematically. The sources included peer-reviewed journal articles, policy documents, and institutional reports from databases such ResearchGate, Google Scholar, and relevant organizational sources. Publications from the last 10–20 years that had direct relevance to the research topic (e.g., the nature and properties of soils, flood mapping, and remote sensing) were used.
3.5. Instrumentation
Remote Sensing and GIS methods, techniques and tools were used, mostly on the QGIS software. For the soil sampling procedures from target areas, a soil auger, re-sealable polyethylene bags, a GPS device and a field notebook were used. An interview guide was used for interviewing the key informants and an interview schedule for common village residents.
3.6. Data Collection Procedure
A consent form was handed to the potential interviewee. After explaining the purpose of the interview and obtaining consent from the interviewee, an interview was administered for 20 – 25 minutes. English or Setswana language was used depending on the interviewees’ preferred language. Audio recordings, with permission, and field notes were used for data recording.
For the soil samples, soil augers were used to collect 15-25cm worth of soil from the target areas, and placed into labelled re-sealable polyethylene bags. A GPS device and a field notebook were used to collect and record information about the sample point. Each sample bag was labelled with a sample ID, the village name, GPS point and the area elevation. The samples were then placed in a portable insulated storage container and transported to the ORI lab facilities where they were analyzed for soil texture, bulk density, soil moisture content, organic matter, electric conductivity and pH.
For remote sensing, flood maps and satellite imageries for the period 2009 to 2011 were collected from SASSCAL Geoportal and USGS Earth Explorer and analyzed using the QGIS software.
3.7. Data Processing and analysis
Soil samples
The collected soil samples were processed and analyzed in a chemical laboratory for soil texture, bulk density, soil moisture content, organic matter, electric conductivity (EC), and pH.
Soil texture: The Hydrometer method was used, which is whereby a 50g soil sample is mixed with 100ml dispersing solution, shook and then allowed to settle for twelve to sixteen hours. After sixteen hours, the mixture was put in a blender for 5-10 minutes on medium speed. It was then transferred to a 1000ml graduated cylinder and deionized water was added until the mixture reached the 1000ml mark. The mixture was then hand-mixed using a plunger for 30-60 seconds. After mixing, at the 40 second and 2-hour time intervals density was measured using a hydrometer. After the readings were corrected for temperature (±0.036g/L for each degree below or above 20℃), and density of the dispersing agent (subtracting reading of the blanks from the sample readings), the USDA soil texture chart was used to estimate the percentage of sand, silt and clay.
Bulk density: A soil sample of known volume was collected and dried in an oven for 105⁰C over 24 hours. The dry soil weight and original volume was used to calculate bulk density using the formula; .
Soil moisture content: a wet soil sample was weighed, oven-dried at 105⁰C, then weighed again. The difference in mass percentage divided by the dry soil mass will determine the moisture.
Organic matter content: a dry soil sample was weighed using an analytical balance, and burned in a furnace at 550⁰C for four hours. They were transferred to a desiccator to cool then weighed. The difference in the weight of the samples equaled the total organic carbon in the soil sample
EC and pH: a dried and sieved soil sample of about 20g was mixed with deionized water at a ratio of 1:5. The mixture was then placed on the shaker and mixed for about 60 minutes, then allowed to settle for 30 minutes. The conductivity meter was calibrated with a standard solution (1.4 dS/m KCL solution) while the pH meter was calibrated using standard buffer solutions (pH 4, 7 and 10). The conductivity meter electrode was dipped into the clear supernatant without disturbing the sediment and once the EC value was stable it was recorded. For pH, the pH electrode was immersed in the soil solution, stirred gently and once the reading was stable it was recorded. The electrode and probe were rinsed between samples.
Remote Sensing data
Satellite imageries were pre-processed; by converting binary data to digital data (radiometric calibration), rectifying spatial distortions in the image (geometric correction), carrying out atmospheric correction, image enhancement, noise reduction and topographic normalization. This data was analyzed using the QGIS software. The raster layers were then layered, and their symbology changed to one single-band pseudo-color. A raster calculator was then utilized to compare different years and seasons. The image was then exported as a layout image.
Interviews
Interview responses were transcribed and cleaned up to ensure accuracy before analysis. Thematic analysis was then applied to identify recurring patterns and themes related to flood forecasting accuracy and community risk management, with coding and theme organization carried out using Atlas.ti and Microsoft Excel.
3.8. Ethical Considerations
This study strictly adhered to the established ethical guidelines for conducting research involving human participants. It recognized the need to respect participant dignity, promote voluntary participation and ensure safe and responsible handling of all data collected.
- I.
- Informed Consent: all participants received a clear explanation of the study’s purpose, procedures and potential risks and benefits. Participation were completely voluntary and a written consent form, available in both Setswana and English languages, was signed by the participant before any interviews or soil sampling took place.
- II.
- Respect for Cultural Protocols: the study respected local hierarchies by seeking permission and entry through the Kgosi and Village Developments Committee (VDCs).
- III.
- Minimizing Harm and Discomfort: while the research does not deal with highly sensitive issues, participants recounting experiences of past flood events may be affected emotionally. To mitigate this, participants were allowed to skip questions or terminate interviews at any point. The researcher approached all interviews with empathy.
- IV.
- Institutional and National Ethics Approval: ethical clearance was sought from the University of Botswana Research Ethics Committee. This research was also aligned with the Botswana National Research Ethics Guidelines and any other protocols set by relevant institutions. A research permit was also acquired from the Ministry of Lands and Agriculture.
4. Results
Soil Properties Across Villages
The soils across both villages were mostly sandy in texture, with loamy sand and sandy loam dominating (Table 2). Samples from Gabamocha village showed higher organic matter and moisture content, while Shorobe had higher bulk densities overall. The soils were generally neutral in pH and non-saline across all sites (Table 3).
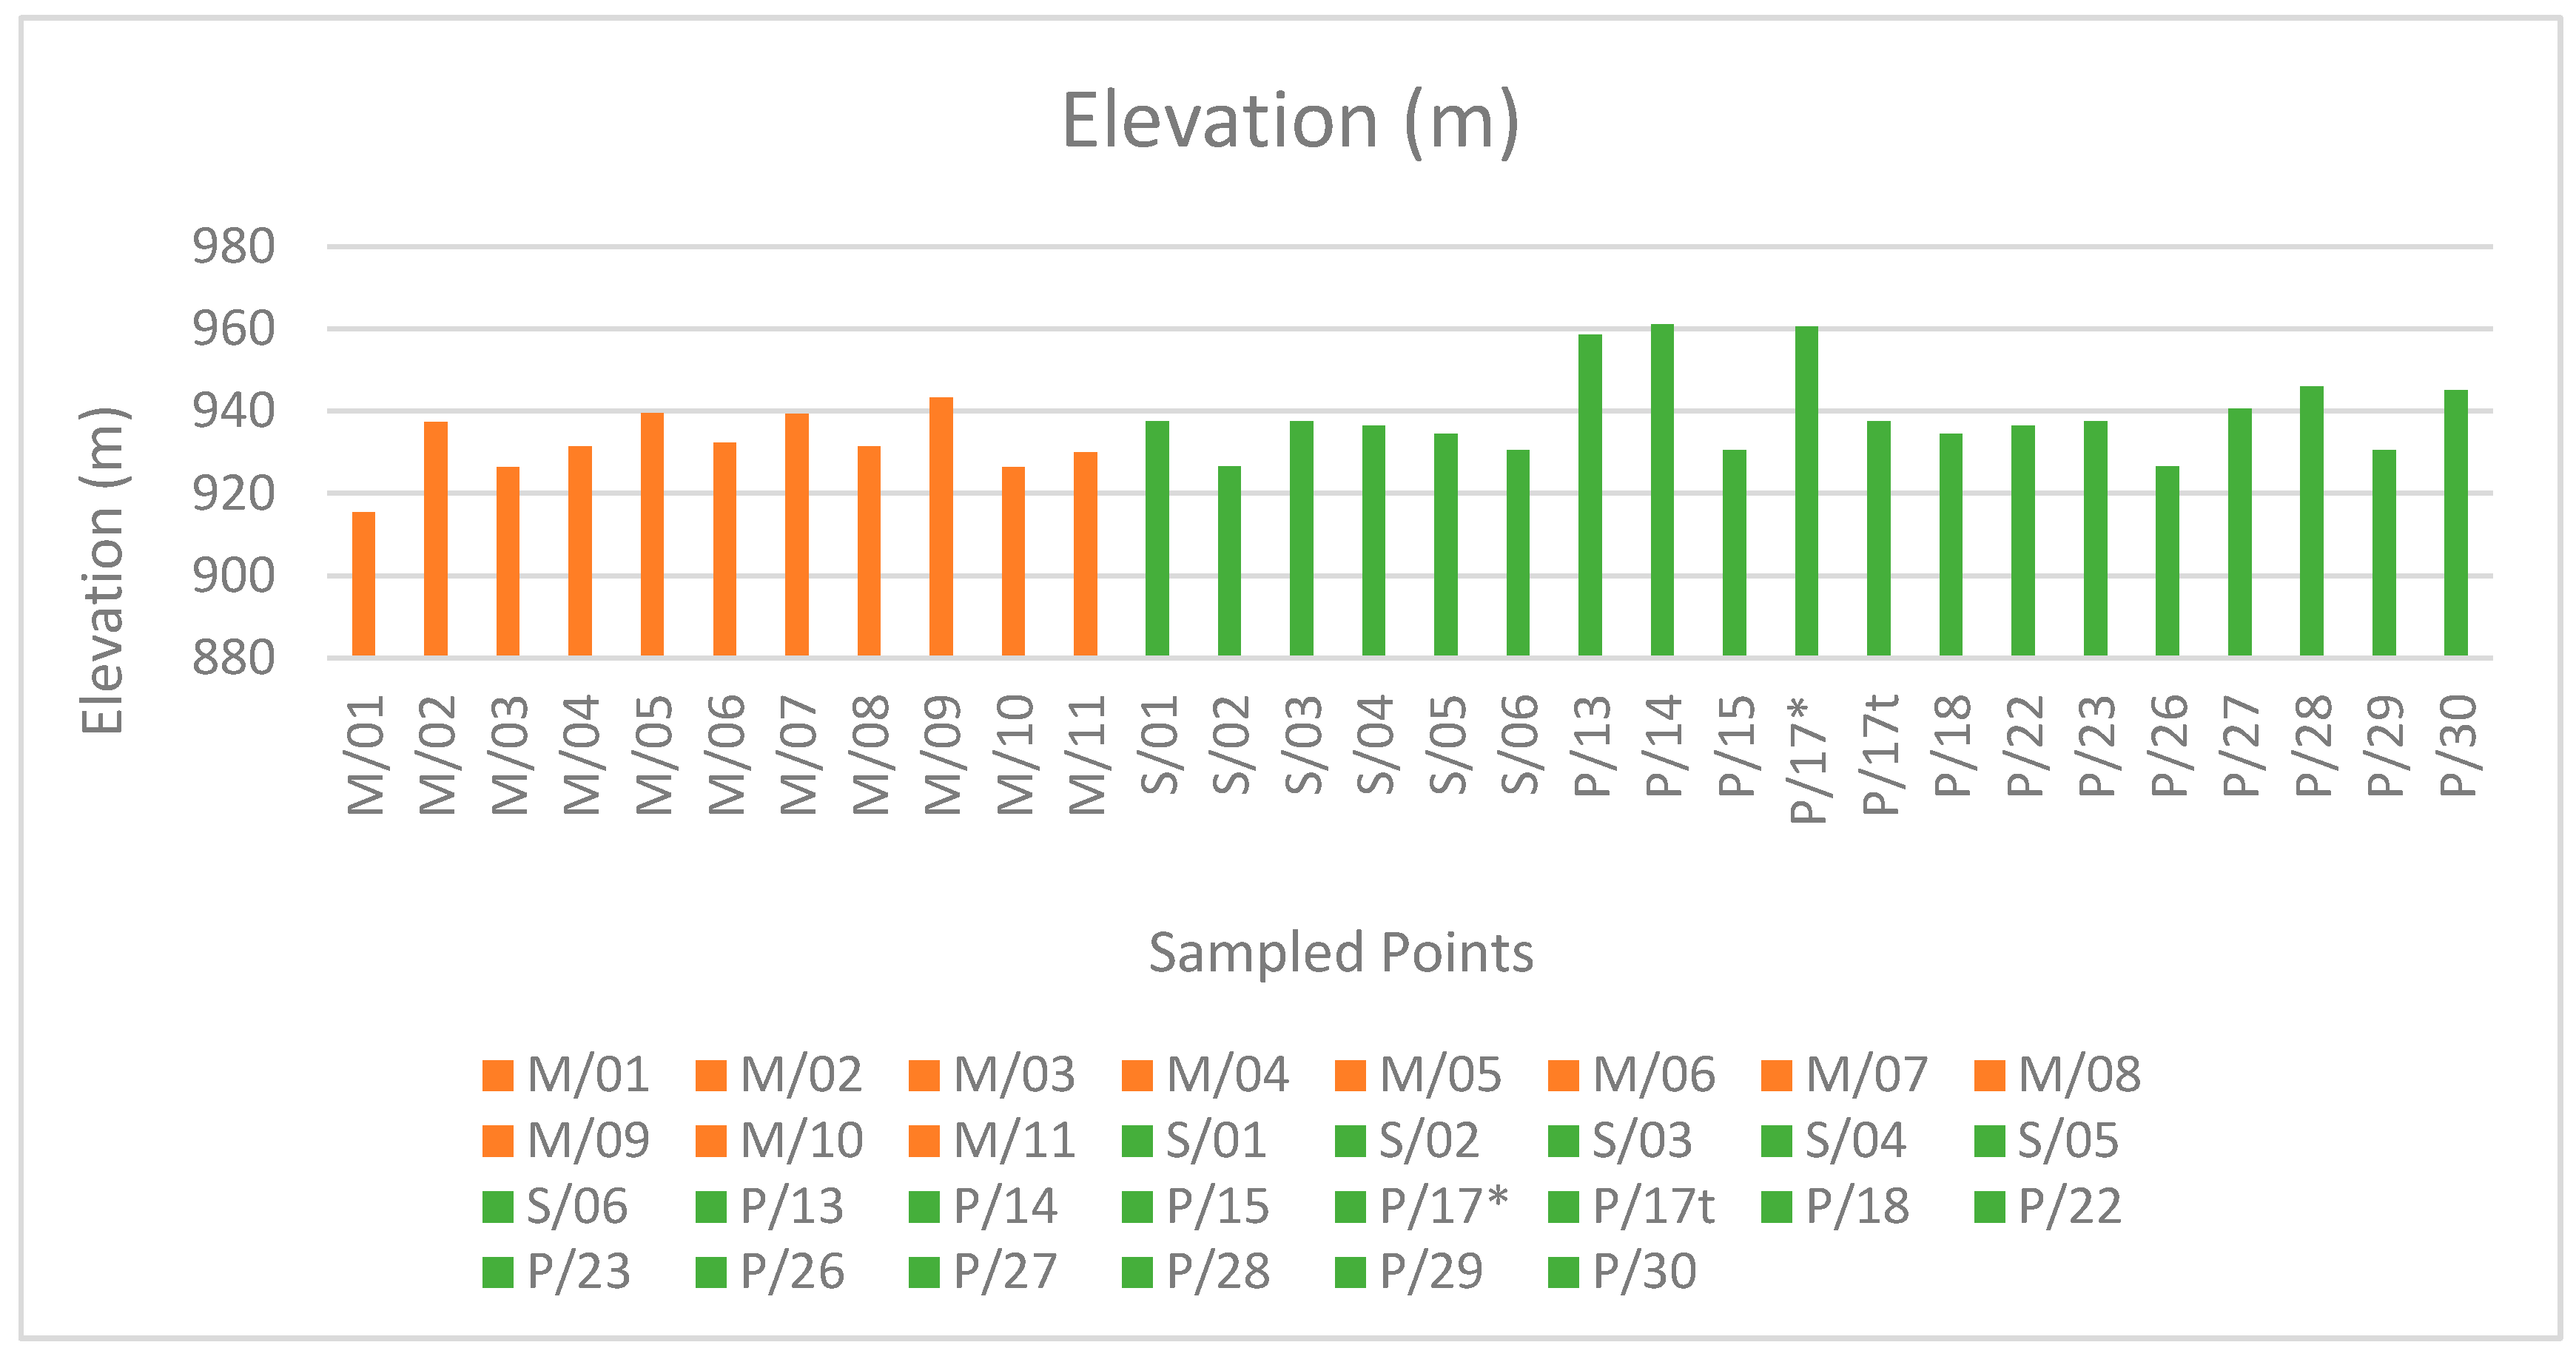
Elevation Data
The distribution of sample points across varying elevations, from below 920m to nearly 970m, demonstrates spatial patterns relevant to flood risk analysis. Elevations were coded for each sampling point, enabling direct comparison between groups of locations identified as either more susceptible to flooding (Gabamocha, low-lying: orange bars) or less susceptible (Shorobe, higher ground: green bars). Gabamocha elevation ranged between 915m and 943m while Shorobe had ranges 925m to 961m.
Figure 3.
Elevations Levels of Soil Sampling Locations.
SMI Data Analysis
To assess the spatial and temporal variability in soil moisture across northern Botswana, Earth Observation (EO) data from 2008 to 2011 were analyzed. The maps in Figure 4 display soil moisture content and its seasonal changes, comparing wet and dry seasons across selected years. These results highlight regions experiencing increased moisture, reduced moisture, or minimal change, which are essential indicators for understanding hydrological responses to rainfall events and potential flood risk.
Interview Responses
Community Awareness and Sources of Flood Information
Interview findings revealed that 82% of the respondents’ primary sources of flooding information in Ngamiland are local observations such as rainfall patterns and river levels and water velocity. Only 18% reported hearing flood forecasts through radio broadcasts, although many noted that this information was often delayed, not locally specific, exaggerated and unreliable, or not relayed at all.
Functionality of CBWES, Timing and Responsiveness
88% of village leaders confirmed that formal early warning systems were either non-functional or entirely absent. As one respondent noted, “we just observe the water ourselves; no one from the government tells us anything.” Another recurring theme was the delay or absence of actionable alerts. Leaders and the community leaders stated that by the time they received word of flooding in surrounding areas or heard flood-warnings the impact had already begun. In the years 2011-2012, community action was only initiated after visible flooding had already occurred.
Risk Perception and Preparedness
Risk awareness varied across villages. Communities that frequently experienced flooding, particularly those along floodplains, expressed a sense of resignation rather than proactive preparedness. Only 9% described any form of prior planning or evacuation plans. There was minimal evidence of structured risk preparedness activities such as evacuation drills, pre-arranged resources or risk communication plans.
Disconnect Between EO-Based Forecast and Community Action
None (0%) of the interviewees were aware of or had interacted with Earth-Observation based forecasts and models. The respondents also noted that since the official reports were usually inaccurate, they rarely act based only on those warnings.
Literature Review
Predictive Accuracy of Remote Sensing Approaches
Thito et al. (2016) attained high predictive accuracy in inundation extent mapping of the Okavango delta using a dynamic thresholding method applied to MODIS SWIR bands (MOD09Q1, MOD11A1). Their approach obtained an overall accuracy of 99.4% and a Kappa coefficient of 80% for the period 2001-2012, showing a maximum inundation extent during 2010–2012. Recent studies by Inman and Lyons (2020) utilized the superior spatial resolution of Landsat imagery (30m) in conjunction with Google Earth Engine to produce high-resolution inundation maps for the period 1990-2019. Their results showed accuracy levels between 91.5%-98.1%. However, Landsat products generally estimated lower total area (approximately 692 km^2 less) compared to MODIS, primarily due to the increased number of mixed pixels that occur when using broad spatial resolution imagery. Mfundisi et al. (2023) combined RapidEye, Sentinel-2 and SRTM DEM data to delineate the 2011 high flood line in the Okavango basin. They integrated NDWI classification with topographic validation, and the flood-prone areas they mapped corresponded closely to known settlement and flood recession agriculture areas. These findings highlight the potential of using diverse tools and techniques of remote sensing for detailed risk mitigation.
Predictive Accuracy of Hydrological Models
Wolski et al. (2006) simulated 34 years of flood dynamics, including 15 years of inundation area data, using semi-distributed reservoir/GIS models. The EF5 hydrological forecasting framework, operational for the Okavango upstream at Rundu, Namibia, achieved strong validation statistics using TRMM rainfall and GIS-derived inputs (Wolski et al., 2020). This highlights the growing potential for very accurate operational flood forecasting using Earth observation and open-access hydrological data.
5. Discussion
Physical and Chemical Soil Properties
The comparison between Gabamocha and Shorobe highlights distinct differences in soil physical and chemical properties, likely linked to land use, topography and flood exposure.
- -
- Soil Texture and Flooding Implications
- -
- Gabamocha’s higher clay content in certain areas, (e.g., M/08) may enhance temporary water retention, making it more susceptible to waterlogging in low-lying areas. Shorobe soils, while sandier, had a sample (P/15) with 41% clay, suggesting isolated zones of potential high flood-water retention.
- -
- Organic Matter and Moisture Retention
- -
- Gabamocha had higher organic matter and moisture levels, especially in M/08 and M/03, pointing to possible organic matter accumulation due to prolonged flooding or vegetation decay. Lower bulk densities in these samples support the idea of looser, more porous soils that retain more water. Shorobe, on the other hand, displayed higher bulk density values and lower organic matter content overall, indicating more compacted soils that favor faster surface water runoff and less water storage during flooding.
- -
- Soil pH and Salinity Status
- -
- Both villages showed favorable pH conditions for plant growth (6.3-7.9), and EC values below 250µS/cm, indicating non-saline soils suitable for most crops and natural vegetation. No significant soil salinity concerns were identified in either site.
Elevation Data
The elevation data clearly distinguishes two villages: one represented by orange bars (Shorobe) and the other by green bars (Gabamocha). Notably, Gabamocha has a relatively recent history of flooding while Shorobe has not experienced significant flood events.
Gabamocha (Flood-Prone)
This area features generally lower elevation points compared to Shorobe. Lower elevation enables the accumulation of surface water, reducing the rate of runoff and increasing the risk of saturation during water inflow. The community’s historical accounts of flooding support these physical characteristics, a relationship confirmed by global and regional analysis indicating that accurate high-resolution elevation data is important for understanding and modelling flood hazards (Blackwell et al., 2024).
Shorobe (Low Flood Risk)
This region comprises of relatively higher elevation sampling points. Elevated terrain enhances surface drainage and limits the amount of water retained within soils after precipitation, reducing flood risk. The historical absence of flooding in this village is consistent with the observed elevation profile, reflecting the pattern in which elevation reduces exposure to flood impacts (Towey & Kemter, 2024).
The contrast between these two villages illustrates how even small differences in elevation and have significant impacts on flood vulnerability. The relationship between elevation and soil moisture is significant: lower sites, especially with higher preceding soil moisture, tend to be more flood prone, as was seen in the case of Gabamocha in 2011-2012. Recent modelling studies, such as those by Ran et al. (2022), have shown that flood peak flows are heightened when both rainfall and preceding soil moisture are high, a relationship that is prominent in lower-elevation catchments (Ran et al., 2022).
EO Data
The EO-derived soil moisture index maps (Figures 2) illustrate inter-annual and seasonal variations in soil moisture across northern Botswana between 2008 and 2011. The observed changes in moisture content, categorized into reduced, increased or minimal change, reveal spatial heterogeneity in surface moisture, which has a large influence on runoff generation and flood potential.
Focusing on the area within the Botswana boundary (outlined in orange), well-defined spatial patterns are showing. During the wet seasons, particularly in 2008 and 2011, the northwestern and central regions of Botswana exhibit increased soil moisture, signaling saturation-prone zones. Likely influenced by topography, drainage networks and soil types and textures, these areas are more responsive to rainfall events, leading to heightened runoff and elevated flood potential. Conversely, in the south and eastern regions of Botswana, most of the area shows little or no change in soil moisture, indicating a relatively stable hydrological regime or possible water retention in deeper soil layers.
The 2010 dry season stands out, as a part of Northern Botswana experienced reduced soil moisture, likely a result of prolonged dry conditions, which can decrease infiltration efficiency during subsequent rains. Drought conditions or reduced soil moisture can lead to hydrophobic soil surfaces, initially reducing infiltration and altering runoff responses when rains return (Seneviratne et al., 2010).
Such discrepancies may partly explain the disconnect between model-based flood forecasts and CBEWS alerts. Models often rely on large-scale precipitation and static soil assumptions and may overestimate flood risk in areas which appear saturated on average, while underestimating risk in locally sensitive zones flagged by communities. CBEWS, grounded in local experience and real-time observations, often capture minute environmental cues such as rising water levels, or subtle changes in river behavior that models miss (Paul et al., 2018). The integration of EO data and local knowledge systems is therefore essential to bridging the communication and accuracy gap between top-down and bottom-up forecasting mechanisms.
Interviews
The interview findings highlight a significant disconnect between scientifically-based flood forecasting, including EO and SMI tools, and the actual community-level risk-response procedures. Despite the existence of scientific tools like EO-based predictions, none of the respondents were aware of such systems. This strongly suggests a structural communication failure, reinforcing previous studies that emphasize the importance of localized and accessible early warning systems (for example, UNDRR, 2019).
Furthermore, the lack of trust or familiarity with modern forecasting tools further deepens the disconnect. While EO data can identify flood risks weeks or months in advance, the absence of community sensitization, training and contextual translation renders forecasts irrelevant to local decision-making. This insight supports the argument that forecasting systems must be people-centered, not just data-centered.
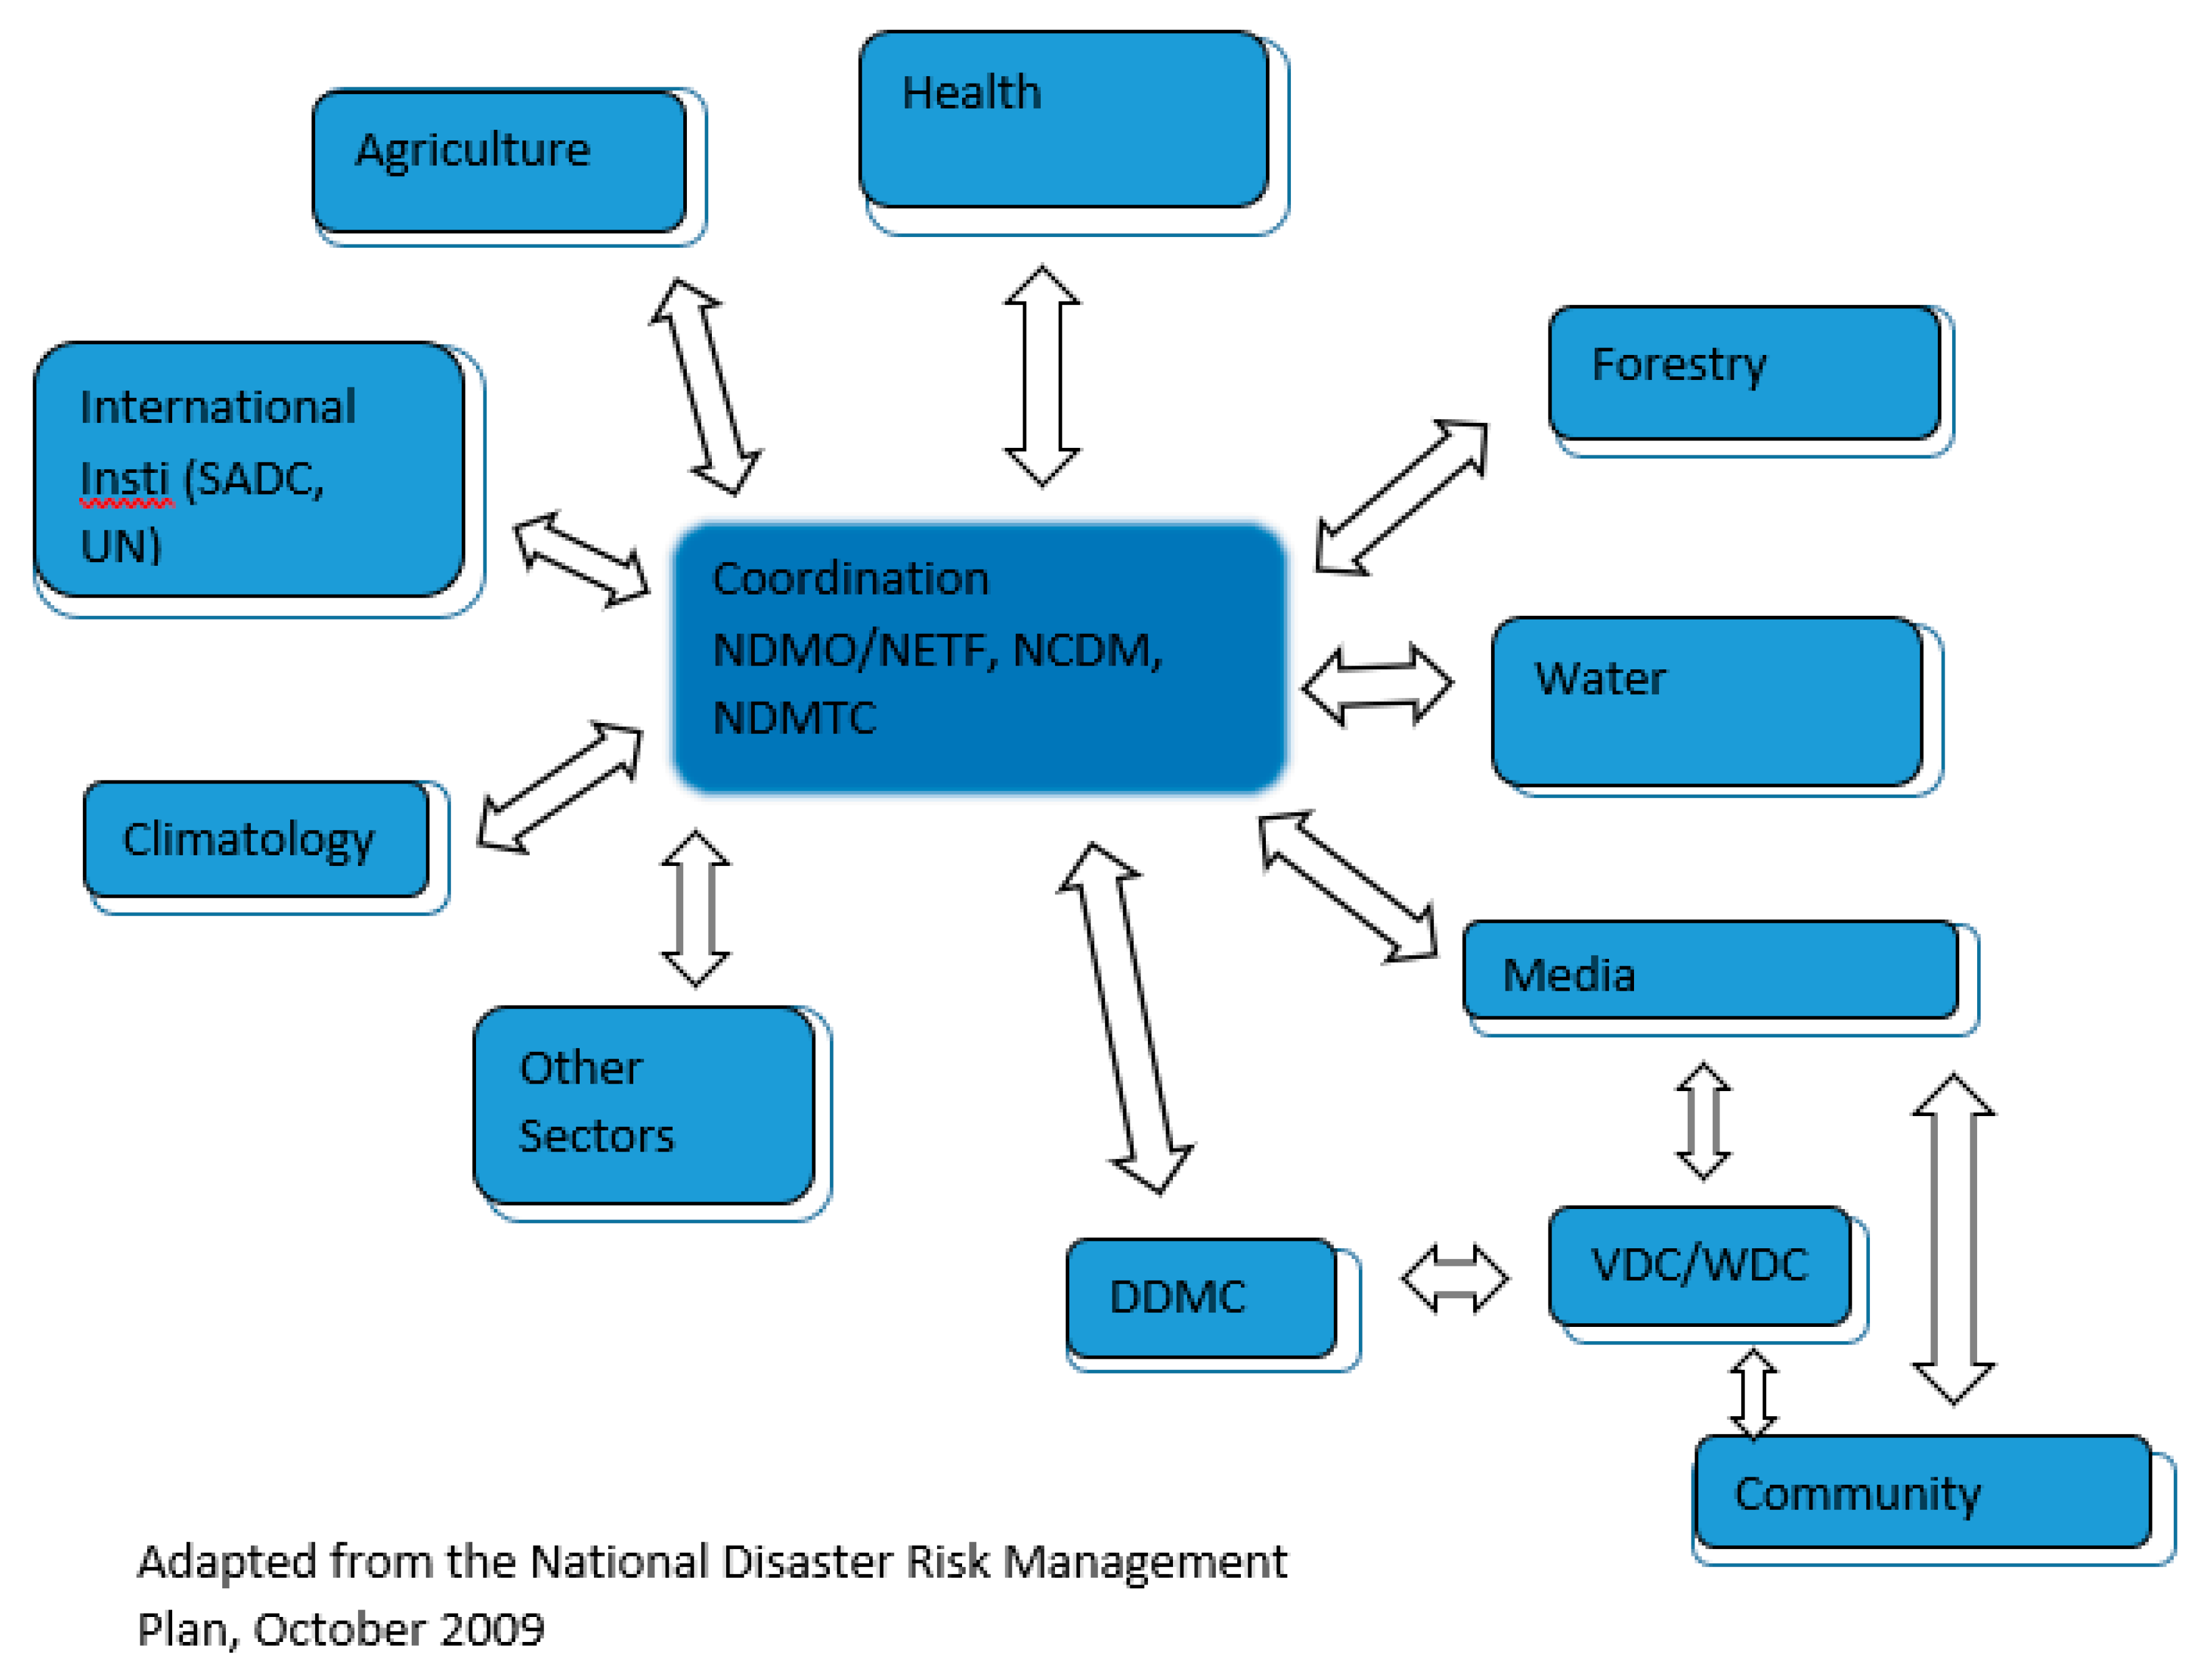
These findings align with the national early warning information flow diagram for Botswana, which centers around a centralized coordination code (NDMO, NETF, NCDM, NDMTF) as the conduit among sectors such as water, health, agriculture, media and meteorology. While this system is designed for integration across institutional levels, its implementation remains uneven at the grassroots. Although the diagram indicates potential outreach to communities, interview data suggest that these flows are rarely observed in practiced.
Finally, the findings highlight an urgent need to redefine flood risk communication pathways- bridging national forecasts with local warnings through participatory design, regular training and culturally grounded outreach. In doing so, flood forecasting can evolve from being a top-down scientific exercise to a community-empowering tool.
Literature Review
This review strongly suggests that remote sensing tools, particularly satellite data, played a critical role in identifying flood extents during the 2009-2011 floods in Ngamiland. Studies such as Garcia-Pintado & Neal (2023) support the reliability of Earth observation in flood modelling. However, the models often struggled with finer-scale predictions, especially in areas with complex hydrology or variable soil characteristics (McClean et al., 2020; Hillel, 2004).
While technology that could detect flood accuracy existed, limitations in local model calibration and real-time data integration reduced flood-forecast precision. This aligns with Motsholapheko et al. (2013), who found that models in Botswana rarely incorporated community level variables such as soil texture. Moreover, early warnings were not consistently trusted or well-communicated at community-level. As Mercer et al. (2012) and King et al. (2016) argue, integrating scientific data with local knowledge is essential for building credible, actionable early warning systems.
Overall, while hydrological models and remote sensing offer powerful tools for flood prediction, their full potential in Botswana remains underutilized due to insufficient integration with community feedback, soil-based and land-based data, and timely information dissemination.
6. Conclusions
Effective flood risk management and land-use planning require a dual approach that bridges the gap between technical forecasting tools with locally grounded knowledge of environmental conditions. The findings of this study reinforce the fact that while scientific modelling is improving flood predictability, its disconnection from community knowledge systems reduces its effectiveness in risk management. Studies such as Garcia-Pintado & Neal (2023) and McClean et al. (2020) highlight the increasing reliability of geospatial tools and Earth Observation data for modelling flood risk, but without localization, these forecasts can fail to trigger effective community risk-response.
Bridging the gap between national-level forecasting and local-level preparedness is not only a technological challenge, it is a governance and communication issue. King et al. (2016) emphasized that rigid livelihoods constrained by policy and resource limitations hinder adaptive behaviors. This was echoed in several interviews where community leaders and other members expressed frustration over the lack of support and late communication from higher authorities. By investing in CBWES functionality, engaging communities in design, and prioritizing localized interpretation of EO and SMI data, Botswana’s flood warning systems can shift from being reactive and top-down to proactive, participatory, and resilient.
7. Recommendations
To transform forecasting into a community-centered tool, several interventions recommended are to:
- -
- Strengthen CBEWS Structures: reactivate and equip VDCs with basic training, materials, and decision-support tools to relay forecast information clearly and timely.
- -
- Promote participatory design of early warning messages by involving local leaders, elders and the youth to improve cultural and linguistic appropriateness, developing trust, comprehension and understanding.
- -
- Enhance Two-way Communication: structured channels such as mobile platforms, community radio sessions or disaster dialogues, where communities can not only receive but also respond to and critique forecast information, should be established.
- -
- Integrate soil properties into flood risk planning; identifying zones with high infiltration potential or those prone to waterlogging. Classifying areas which are more suitable for drainage infrastructure or erosion control interventions is also recommended.
- -
- Encourage collaboration between the National Disaster Management Office (NDMO), Department of Water Affairs, and agricultural extension services to ensure that flood forecasts and risk-management are coordinated and implemented at village level.
- -
- Incorporate high-resolution topography in hydrological models and flood forecasts to better represent risks at the village scale, as studies (e.g., Towey & Kemter, 2024; McClean et al., 2020) have shown the sensitivity of flood predictions to the accuracy of elevation inputs.
Appendix A
Figure A1.
Interview guide for data collection on community (Ngamiland, 2009-2011) flood experiences.
Figure A1.
Interview guide for data collection on community (Ngamiland, 2009-2011) flood experiences.
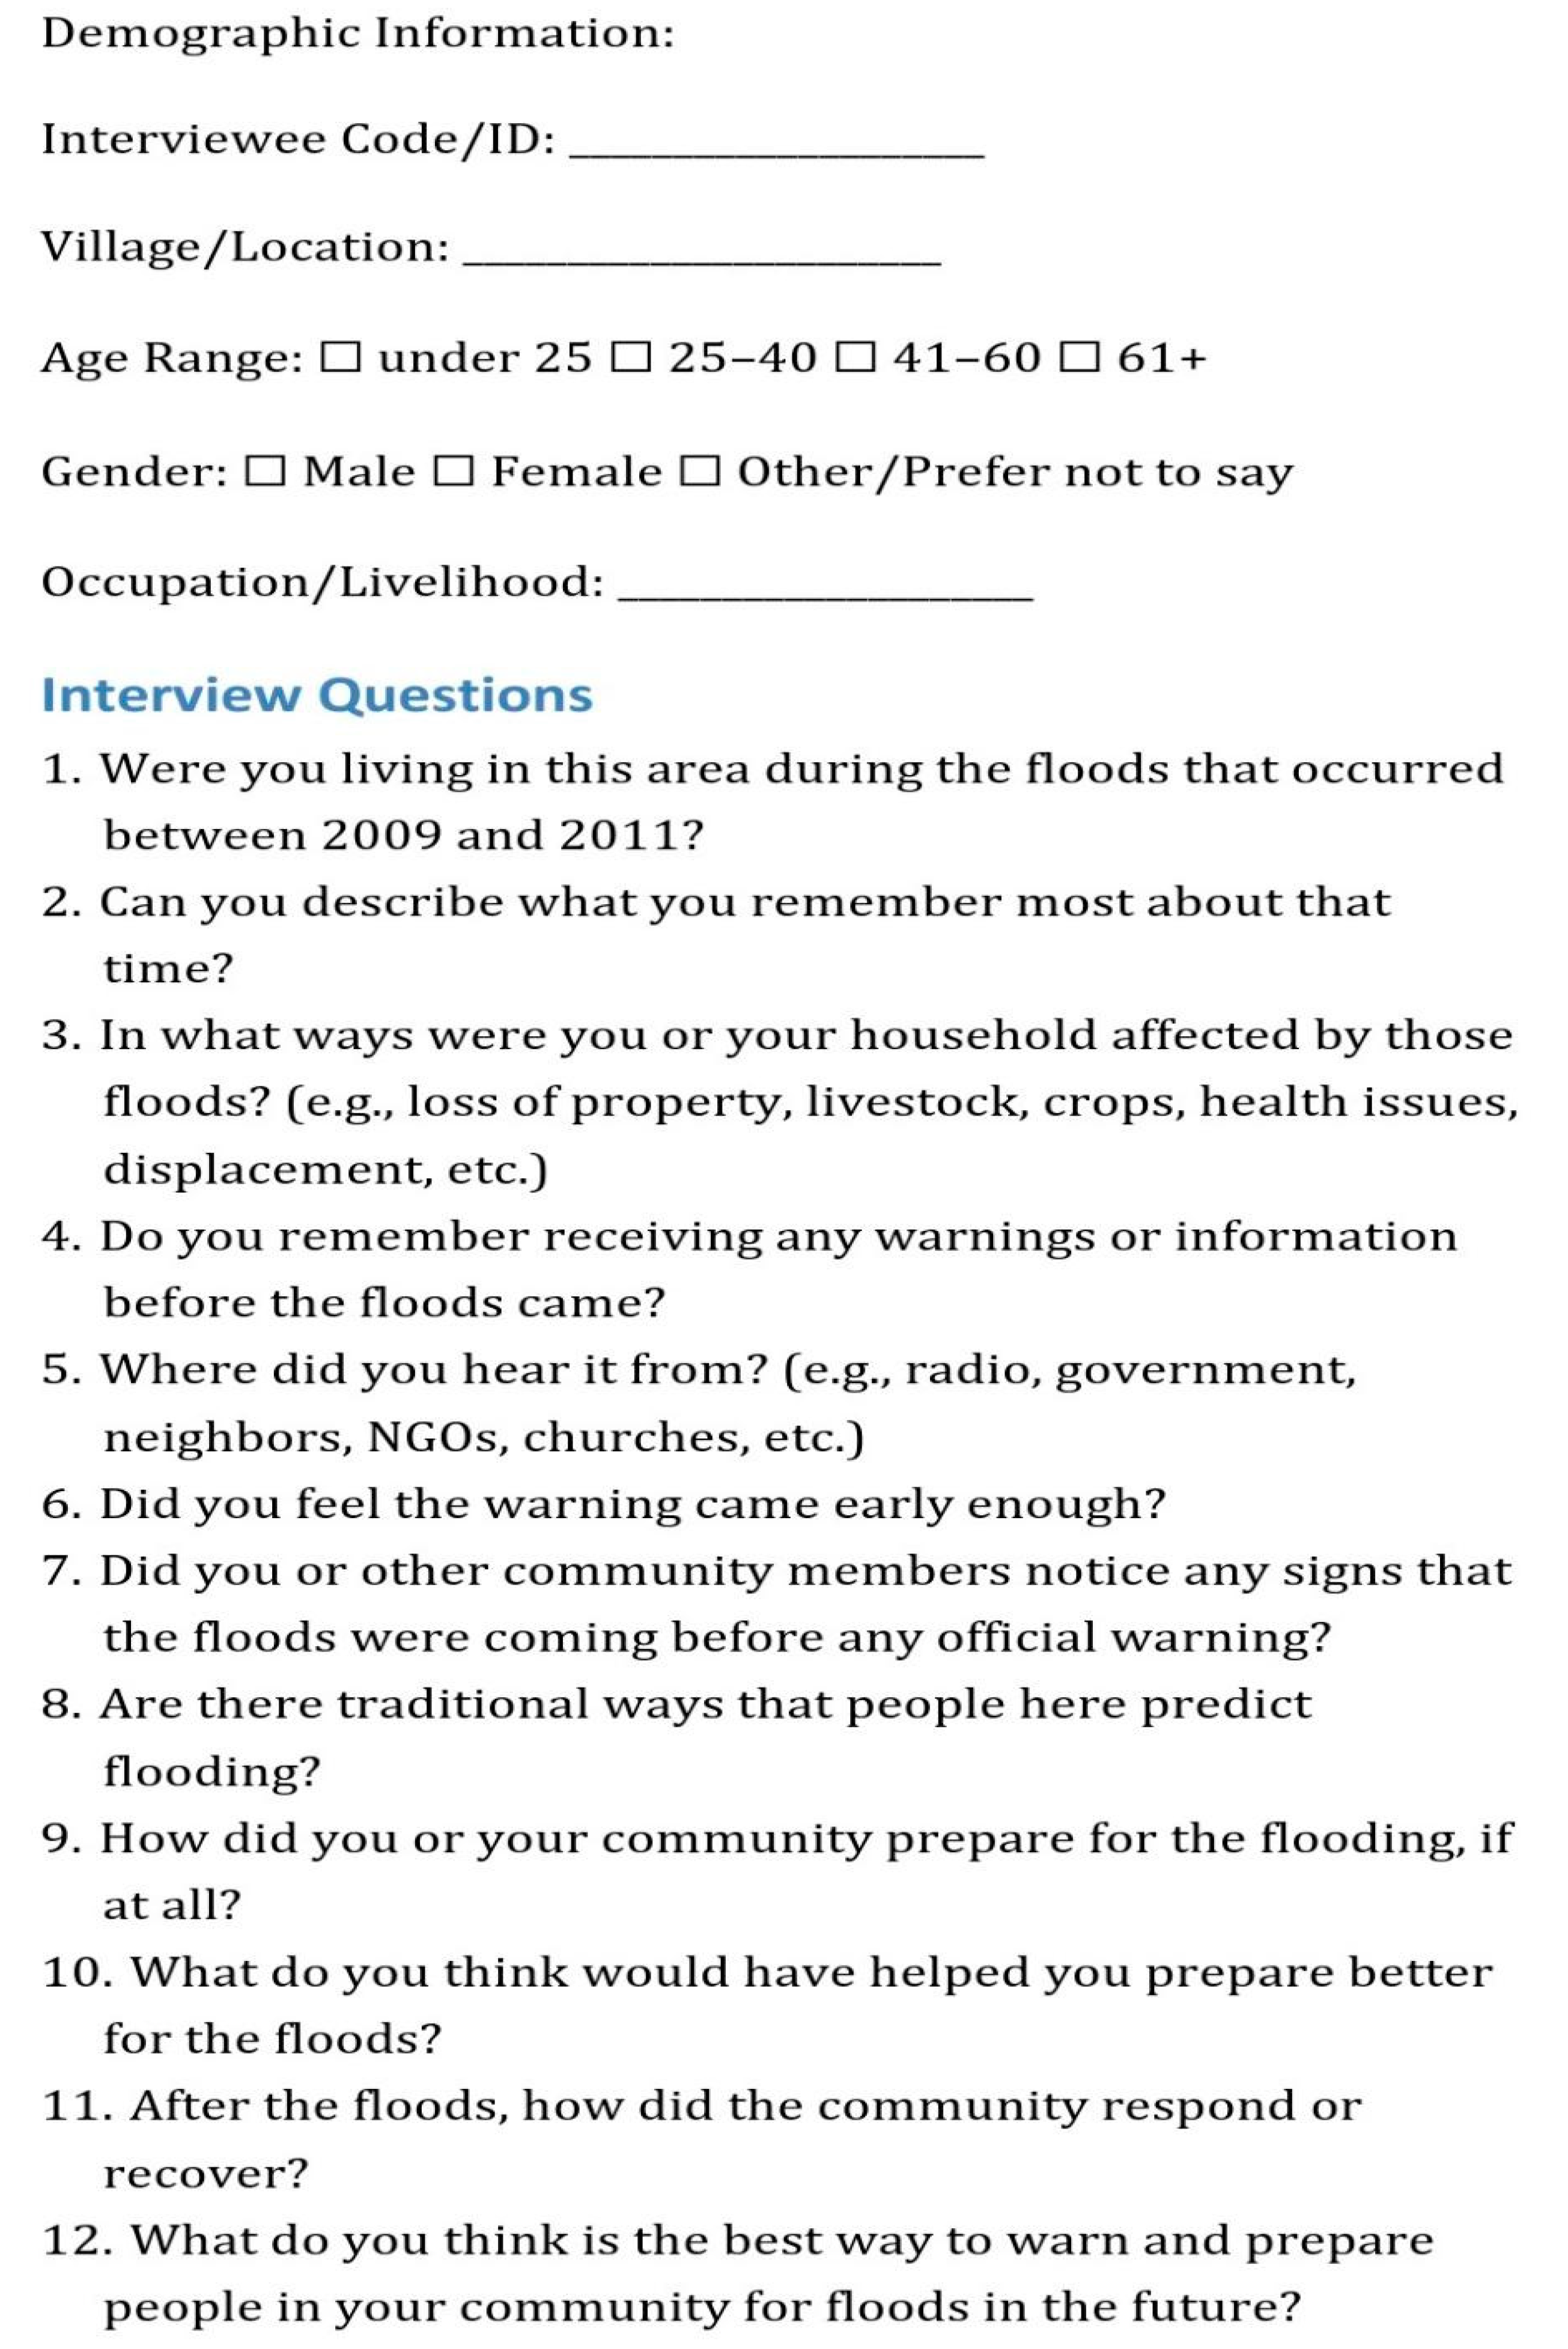
Figure A2.
USDA Soil Texture Classification Chart. Nano-Yield. (n.d). the soil texture triangle. Retrieved July 21,2025.
Figure A2.
USDA Soil Texture Classification Chart. Nano-Yield. (n.d). the soil texture triangle. Retrieved July 21,2025.
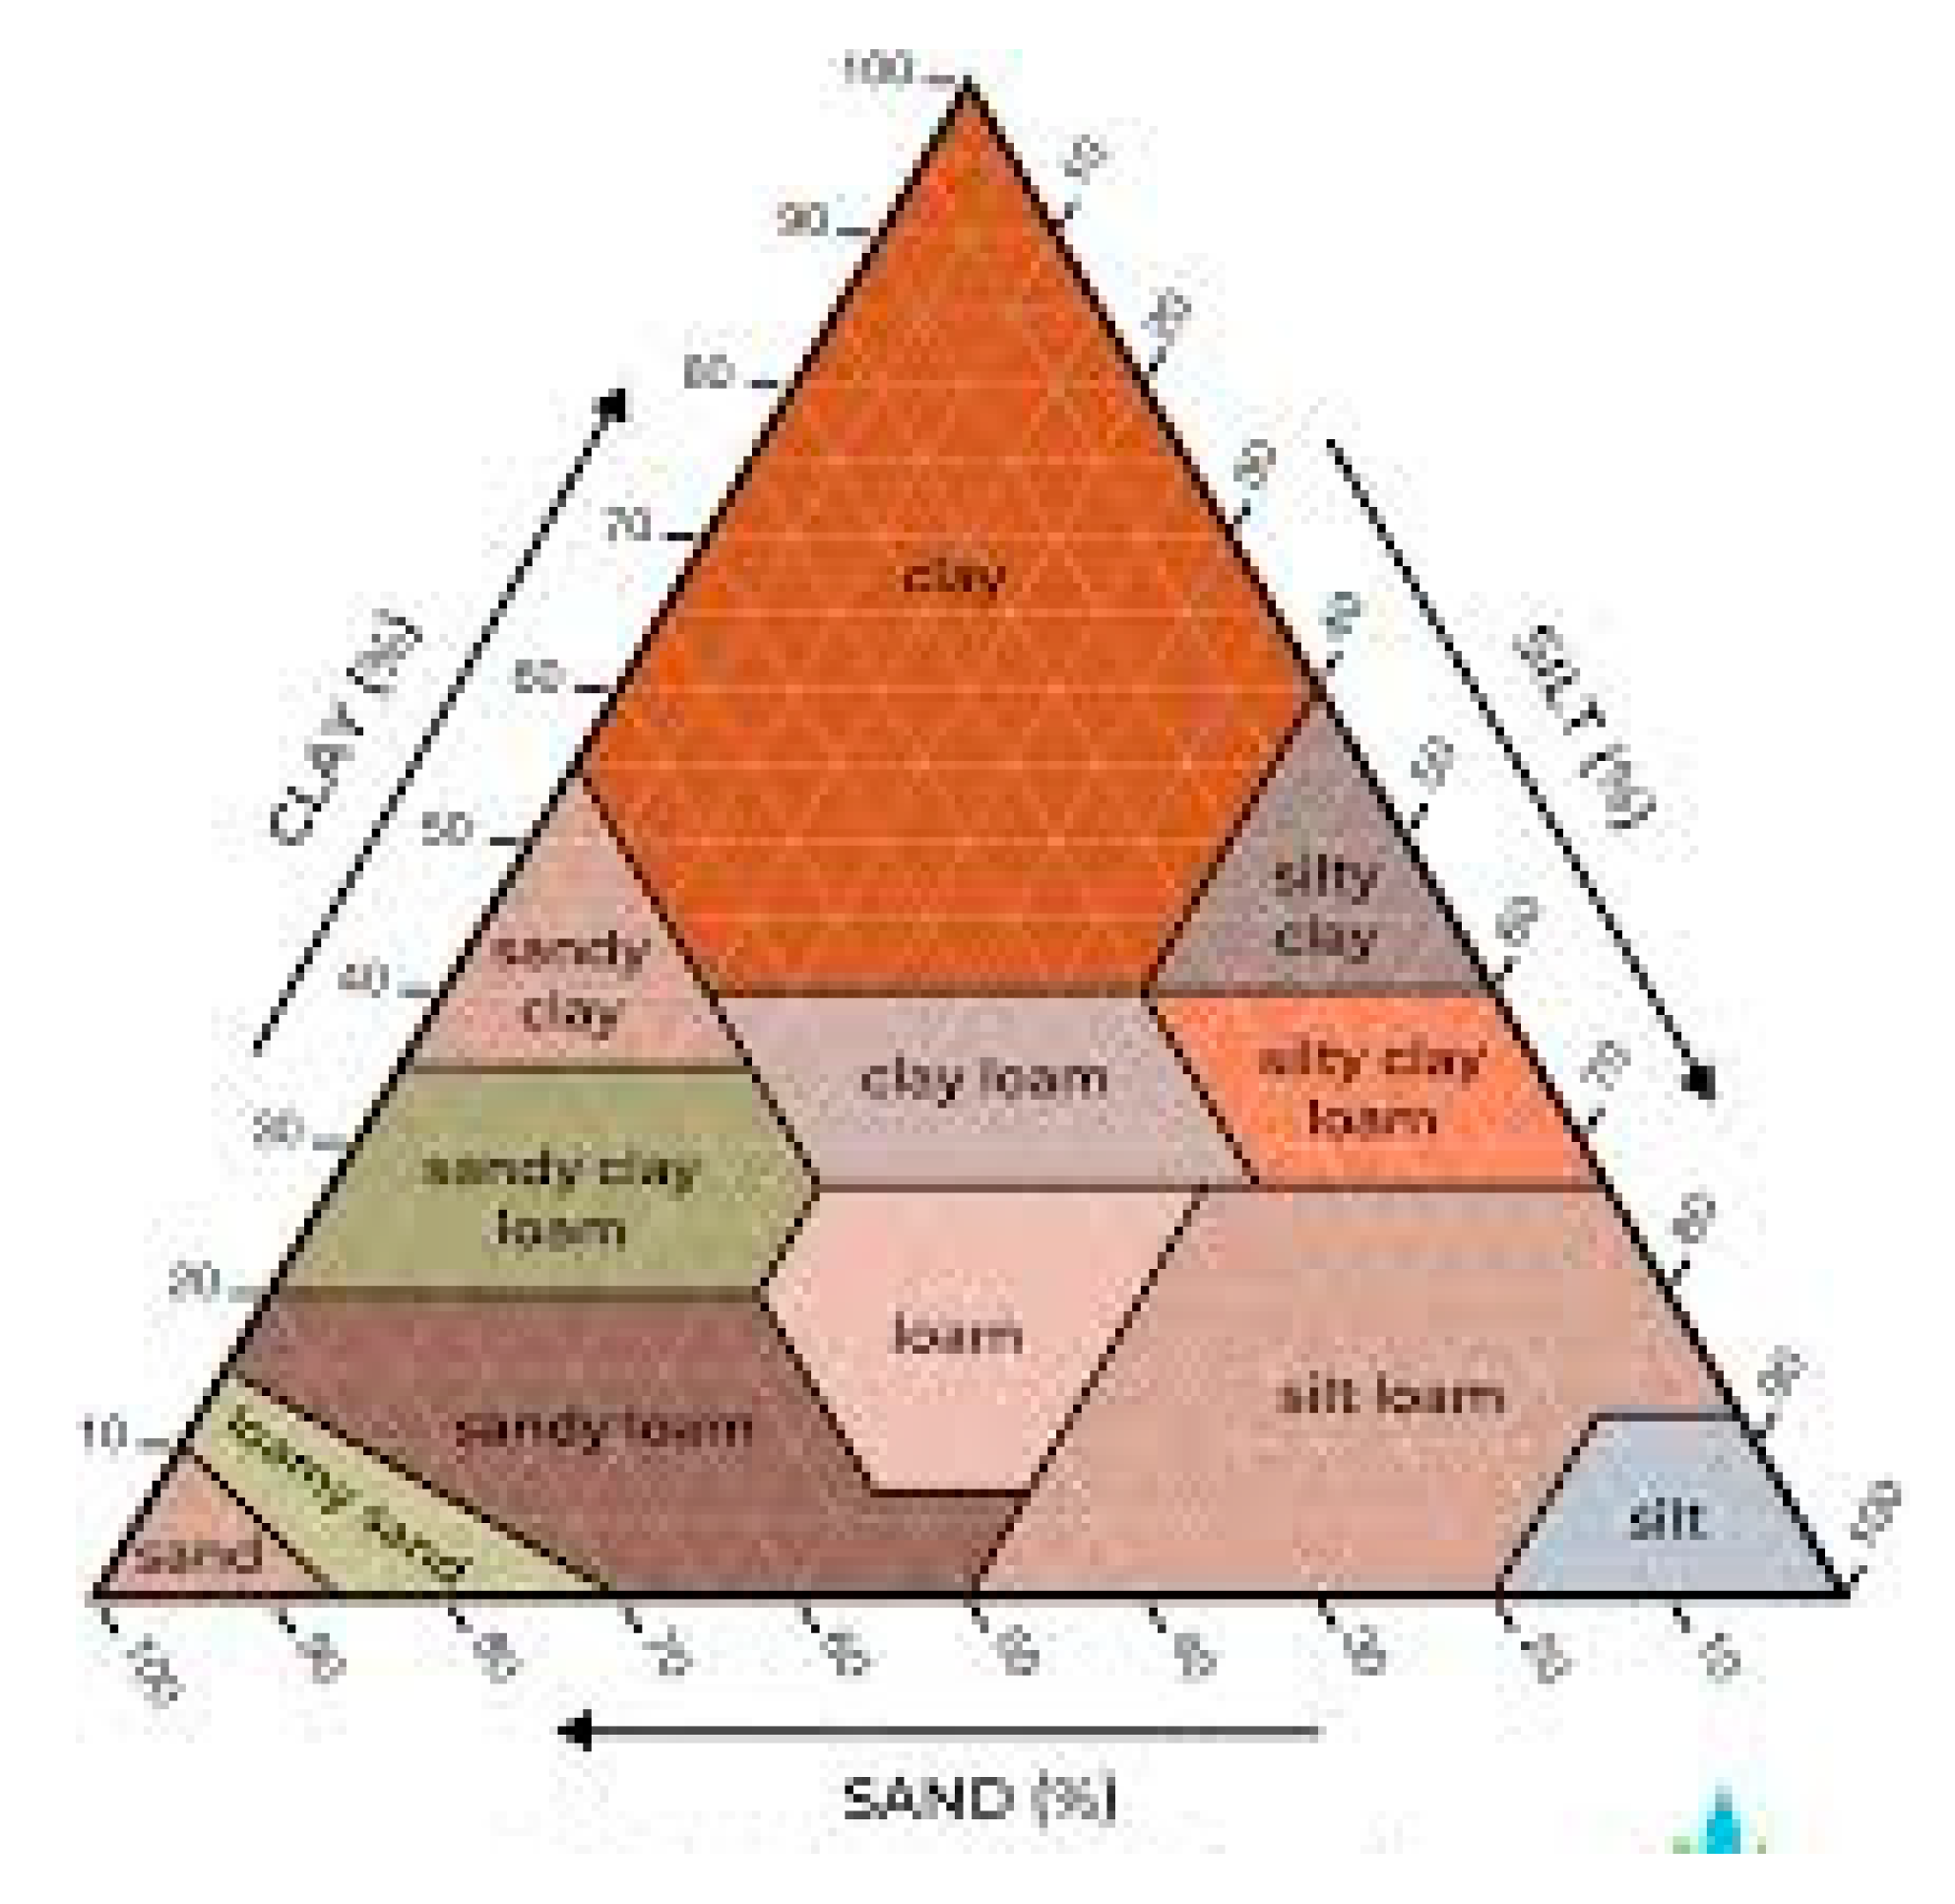
Figure A3.
National Disaster Risk Management Office (NDMO) Early Warning Information Flow in Botswana.
Figure A3.
National Disaster Risk Management Office (NDMO) Early Warning Information Flow in Botswana.
References
- Blackwell, C. , Mothorpe, C., & Wright, J. (2024). Flooding and Elevation: An Examination of Differential Price Responses to Flood Events. Journal of Sustainable Real Estate, 16(1). [CrossRef]
- Bhattamishra, R., & Barrett, C. B. (2010). Community-based risk management arrangements: A review. World Development, 38(7), 923–932. [CrossRef]
- Brown, C., Visser, H., & Mbungu, G. (2019). Strengthening Early Warning Systems in the Zambezi Basin. International Journal of Disaster Risk Science, 10(3), 317-330.
- Centre for Research on the Epidemiology of Disasters (CRED) & United Nations Office for Disaster Risk Reduction (UNDRR), (2015). The human cost of natural disaster: A global perspective (No. ISBN 978-92-9139-204-6). United Nations.
- Garcia-Pintado, J., & Neal, J. C. (2023). Flood modeling and prediction using Earth observation data. Surveys in Geophysics, 44, 1553-1578. [CrossRef]
- Hillel, D. (2004). Introduction to Environmental Soil Physics. Academic Press.
- Inman, V. L., & Lyons, M. B. (2020). Automated Inundation Mapping Over Large Areas Using Landsat Data and Google Earth Engine. Remote Sensing, 12(8), 1348. [CrossRef]
- King, B. , Shinn, J. E., Crews, K. A., & Young, K. R. (2016). Fluid waters and rigid livelihoods in the Okavango Delta of Botswana. Land, 5(2), Article 16. [CrossRef]
- McClean, F., Dawson, R., & Kilsby, C. (2020). Implications of Using Global Digital Elevation Models for Flood Risk Analysis in Cities. Water Resources Research, 56(12), e2020WR028241. [CrossRef]
- Mercer, J., Kelman, I., Taranis, L., & Suchet-Pearson, S. (2012). Framework for integrating indigenous and scientific knowledge for disaster risk reduction. Disasters, 34(1), 214-239.
- Mfundisi, K. B. (2023). Multi-source Earth observation derived data for delineating the high flood waterline in the Okavango Delta (Unpublished master’s thesis or report). University of Twente. https://research.utwente.nl/en/publications/multi-source-earth-observation-derived-data-for-delineating-the-2.
- Mmopelwa, G., Kgathi, D. L., & Molefhe, L. (2011). Flooding in the Okavango Delta, Botswana: impacts on livelihoods and coping strategies. Physics and Chemistry of the Earth, Parts A/B/C, 36(15-15), 984—991.
- Motsholapheko, M. R., Kgathi, D. L., & Vanderpost, C. (2013). An assessment of adaptation planning for flood variability in the Okavango Delta, Botswana. Environmental Development, 5, 62-86.
- NASA Earth Observatory. (2008, January 4). Intense seasonal floods in Southern Africa. NASA. https://earthobservatory.nasa.gov/images/19495/intense-seasonal-floods-in-southern-africa.
- Paul, B. K. , Rashid, H., & Islam, M. S. (2018). Community-based early warning systems for disaster resilience: Lessons from cyclone-affected communities in coastal Bangladesh. Sustainable Development, 26. [CrossRef]
- Rahman, M., Ahmed, S., & Haque, A. (2021). Community-based early warning systems in flood prone areas. Disasters, 45(2), 273-295.
- Tiwari, U. K. , Deo, R. C., & Adamowski, J. F. (2021). Short-term flood forecasting using artificial neural networks, extreme learning machines, and M5 model tree. In P. Sharma & D. Machiwal (Eds.), Advances in streamflow forecasting (pp. 263–279). Elsevier. [CrossRef]
- Seneviratne, S. I. , Corti, T., Davin, E. L., Hirschi, M., Jaeger, E. B., Lehner, I.,... & Teuling, A. J. (2010). Investigating soil moisture–climate interactions in a changing climate: A review. Earth-Science Reviews, 99. [CrossRef]
- Shinn, JE. Toward anticipatory adaptation: Transforming social-ecological vulnerabilities in the Okavango Delta, Botswana. Geogr J. 2018; 184: 179–191. [CrossRef]
- Schumann, G. J. P., & Bates, P.D. (2018). The need for a high-accuracy, open-access global DEM. Frontiers in Earth Science, 6, 225.
- Tarpanelli, A., Brocca, L., Melone, F., et al. (2017). Toward operational satellite remote sensing of flood inundation. Remote sensing of flood inundation. Remote Sensing, 9(6), 560.
- Tevera, D. , Musasa, D., & Simelane, T. (2021). Assessment of Cyclone Idai floods on local flood systems and disaster management responses in Mozambique and Zimbabwe. Cyclones in Southern Africa (pp. 111-132).
- Thakadu, O. T. , Kolawole, O. D., & Sommer, C. (2017). Flood risk communication within flood-prone communities of the Okavango Delta, Botswana. Botswana Notes and Records, 49, Special Issue.
- Thito, K., Wolski, P., & Murray-Hudson, M. (2016). Mapping inundation extent, frequency and duration in the Okavango Delta from 2001 to 2012. African Journal of Aquatic Science, 41(3), 267–277. [CrossRef]
- Towey, K., & Kemter, M, (2024). Location, Location, Location: The Role of Elevation in Flood Models. MSCI. https://www.msci.com/research-and-insights/quick-take/location-location-location-the-role-of-elevation-in-flood-models.
- United Nations Office for Disaster Risk Reduction (UNDRR). 2017. The Sendai Framework Terminology on Disaster Risk Reduction. “Early warning system”. Accessed 14 June 2025. https://www.undrr.org/terminology/early-warning-system.
- UNISDR. (2009). 2009 UNISDR Terminology on Disaster Risk Reduction. United Nations International Strategy for Disaster Reduction. https://www.unisdr.org.
- Ward, P. J., Jongman B., Salamon, P., et al. (2015). Usefulness and limitations of global flood risk models. Nature Climate Change, 5(8), 712-715.
- Wisner, B., Blaikie, P., Cannon, T., & Davis, I. (2004). At Risk: Natural Hazards, People’s Vulnerability and Disasters. Routledge.
- Wolski, P., Savenije, H. H. G., Murray-Hudson, M., & Gumbricht, T. (2006). Modelling of the flooding in the Okavango Delta, Botswana, using a hybrid reservoir-GIS model. Journal of Hydrology, 331(1–2), 58–72. [CrossRef]
- Wolski, P., Murray-Hudson, M. & Todd, M. (2017). Modelling floods in the Okavango Delta. Journal of Hydrology, 549, 788-800.
- World Meteorological Organization. (2011). Manual on flood forecasting and warning (WMO-No. 1072). World Meteorological Organization. https://www.pseau.org/outils/ouvrages/omm_manual_on_flood_forecasting_and_warning_2011.pdf.
Figure 1.
Conceptual framework for showing the interaction of environmental, institutional, and socio-technical factors influencing community vulnerability to floods in the Okavango Delta (2009-2011).
Figure 1.
Conceptual framework for showing the interaction of environmental, institutional, and socio-technical factors influencing community vulnerability to floods in the Okavango Delta (2009-2011).
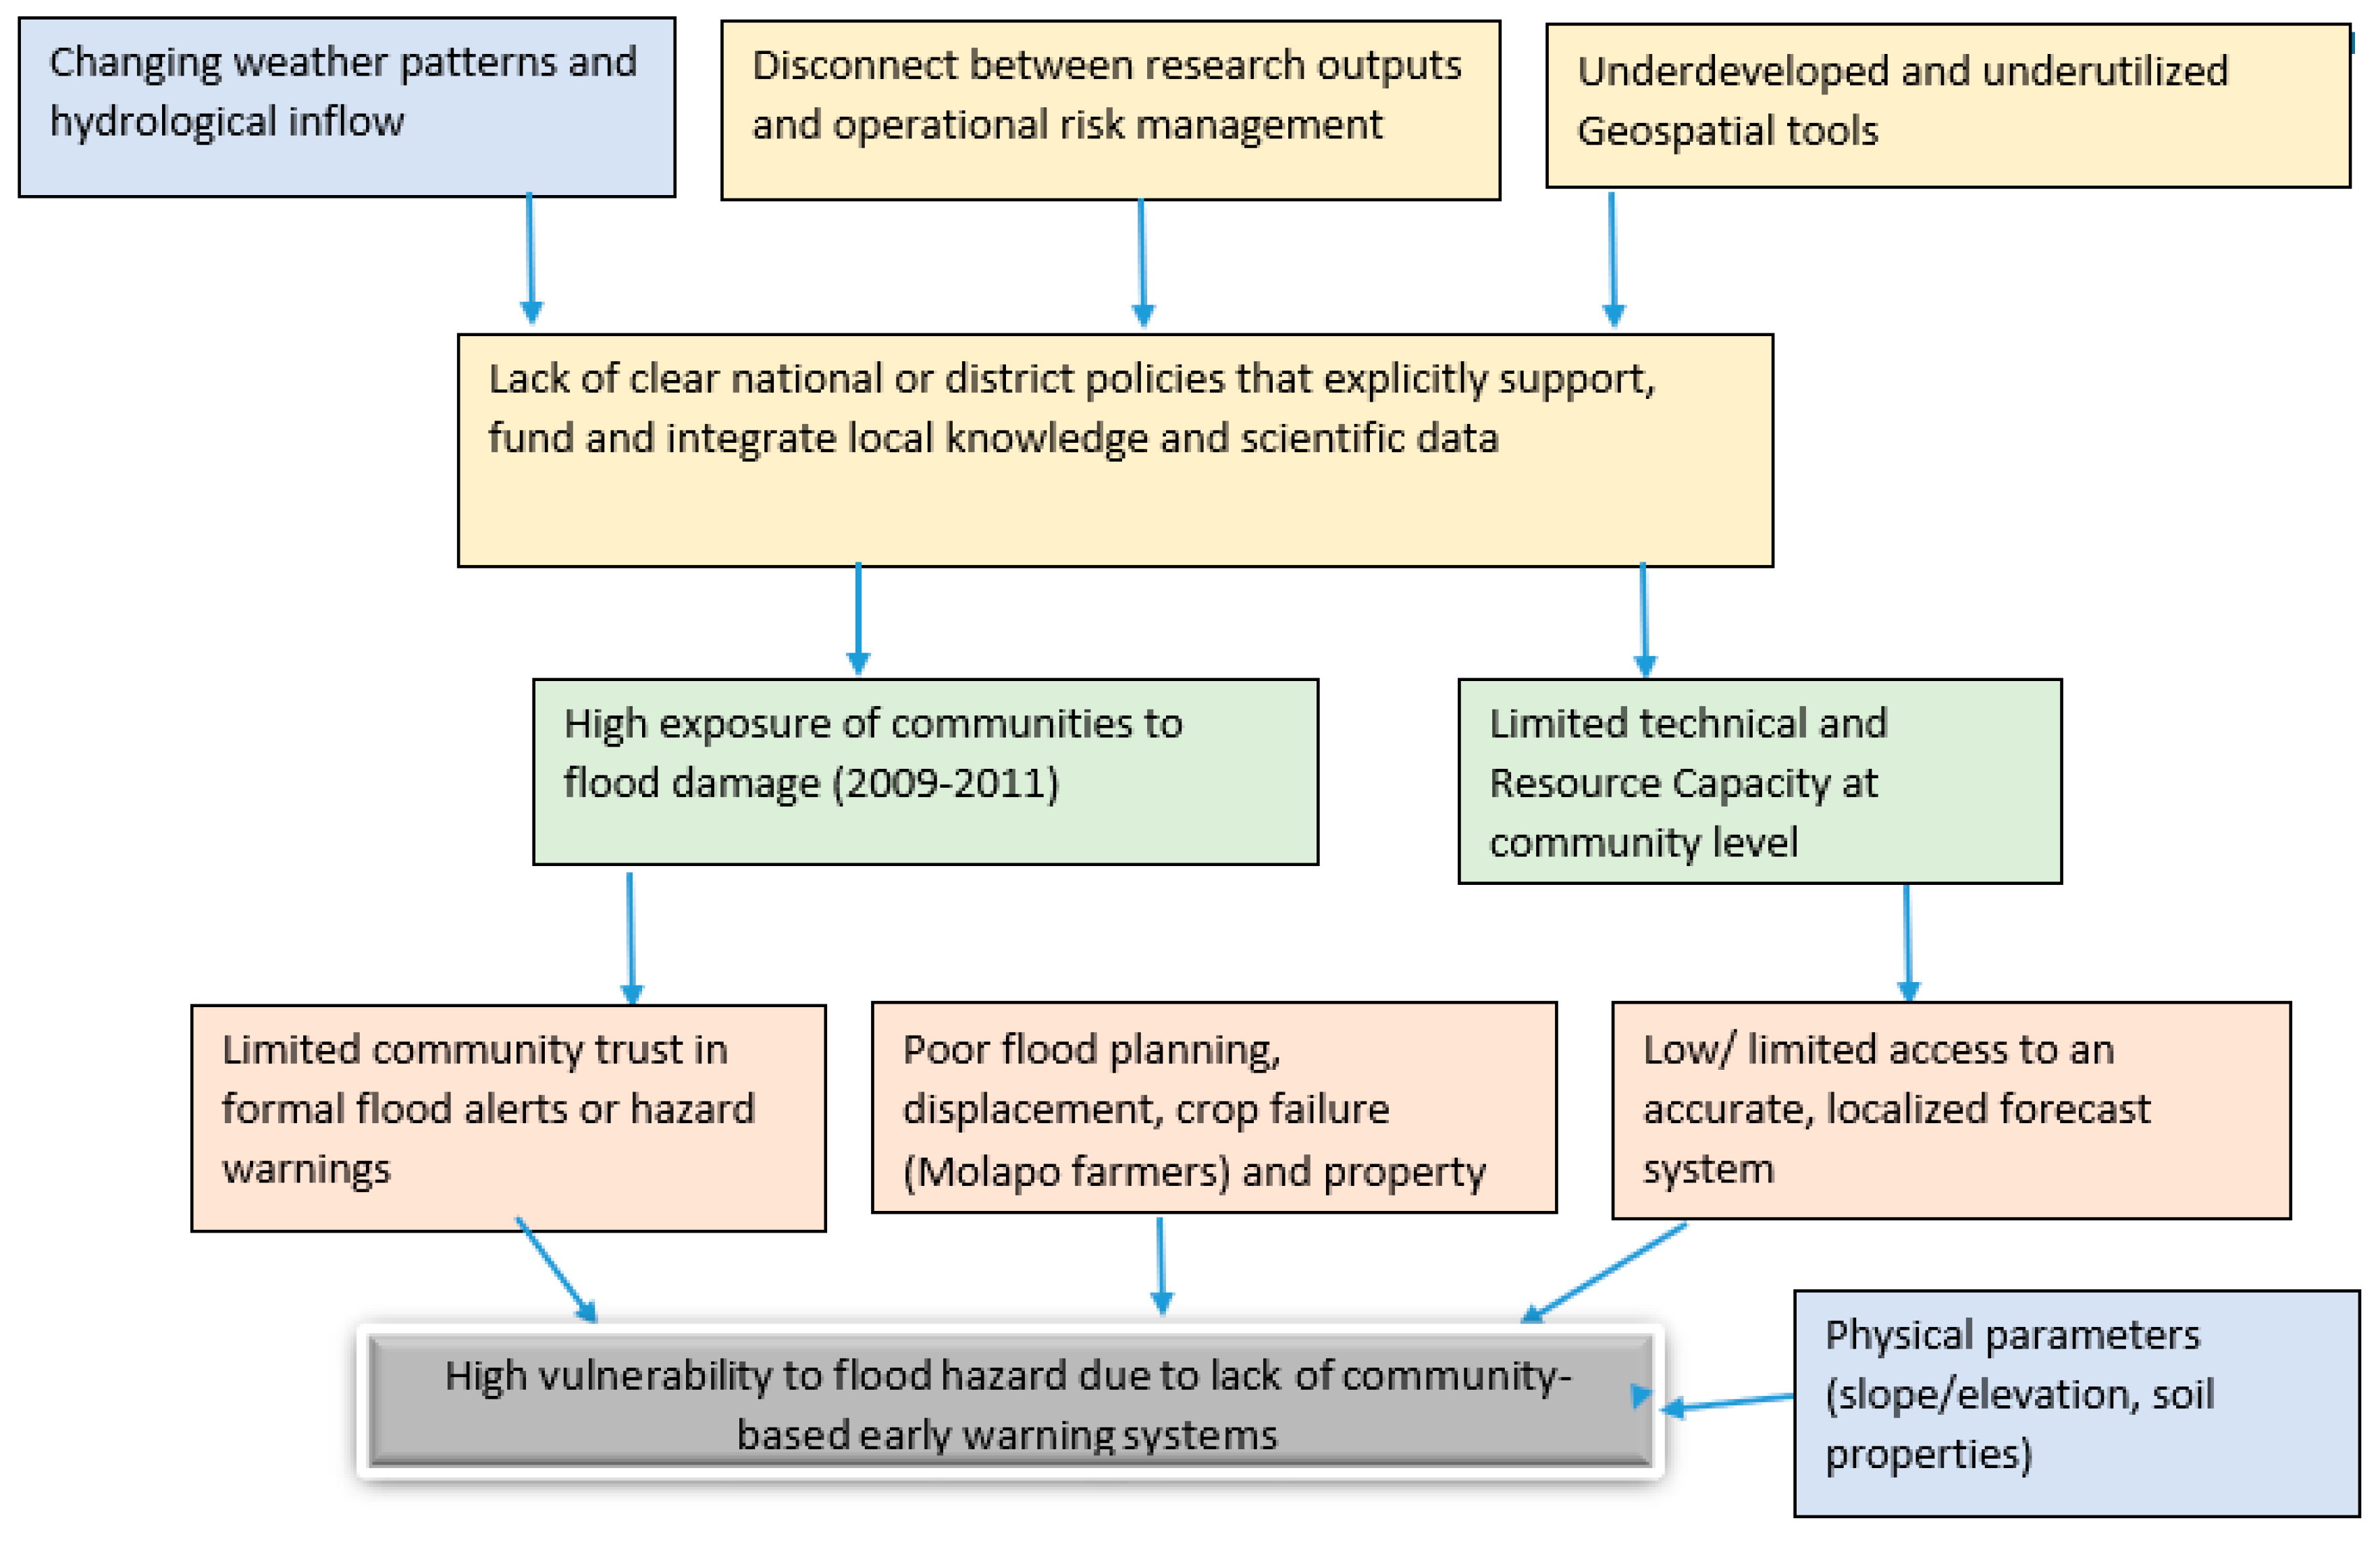
Figure 4.
a Showing the Comparative analysis of Soil Moisture Index in the 2008 Wet and Dry Season. b Showing the Difference Between the Soil Moisture Index in the 2009 Wet and Dry Season. c Showing the Difference Between the Soil Moisture Index in the 2009 Wet and Dry Season. d Showing the Difference Between the Soil Moisture Index in the 2009 Wet and Dry Season.
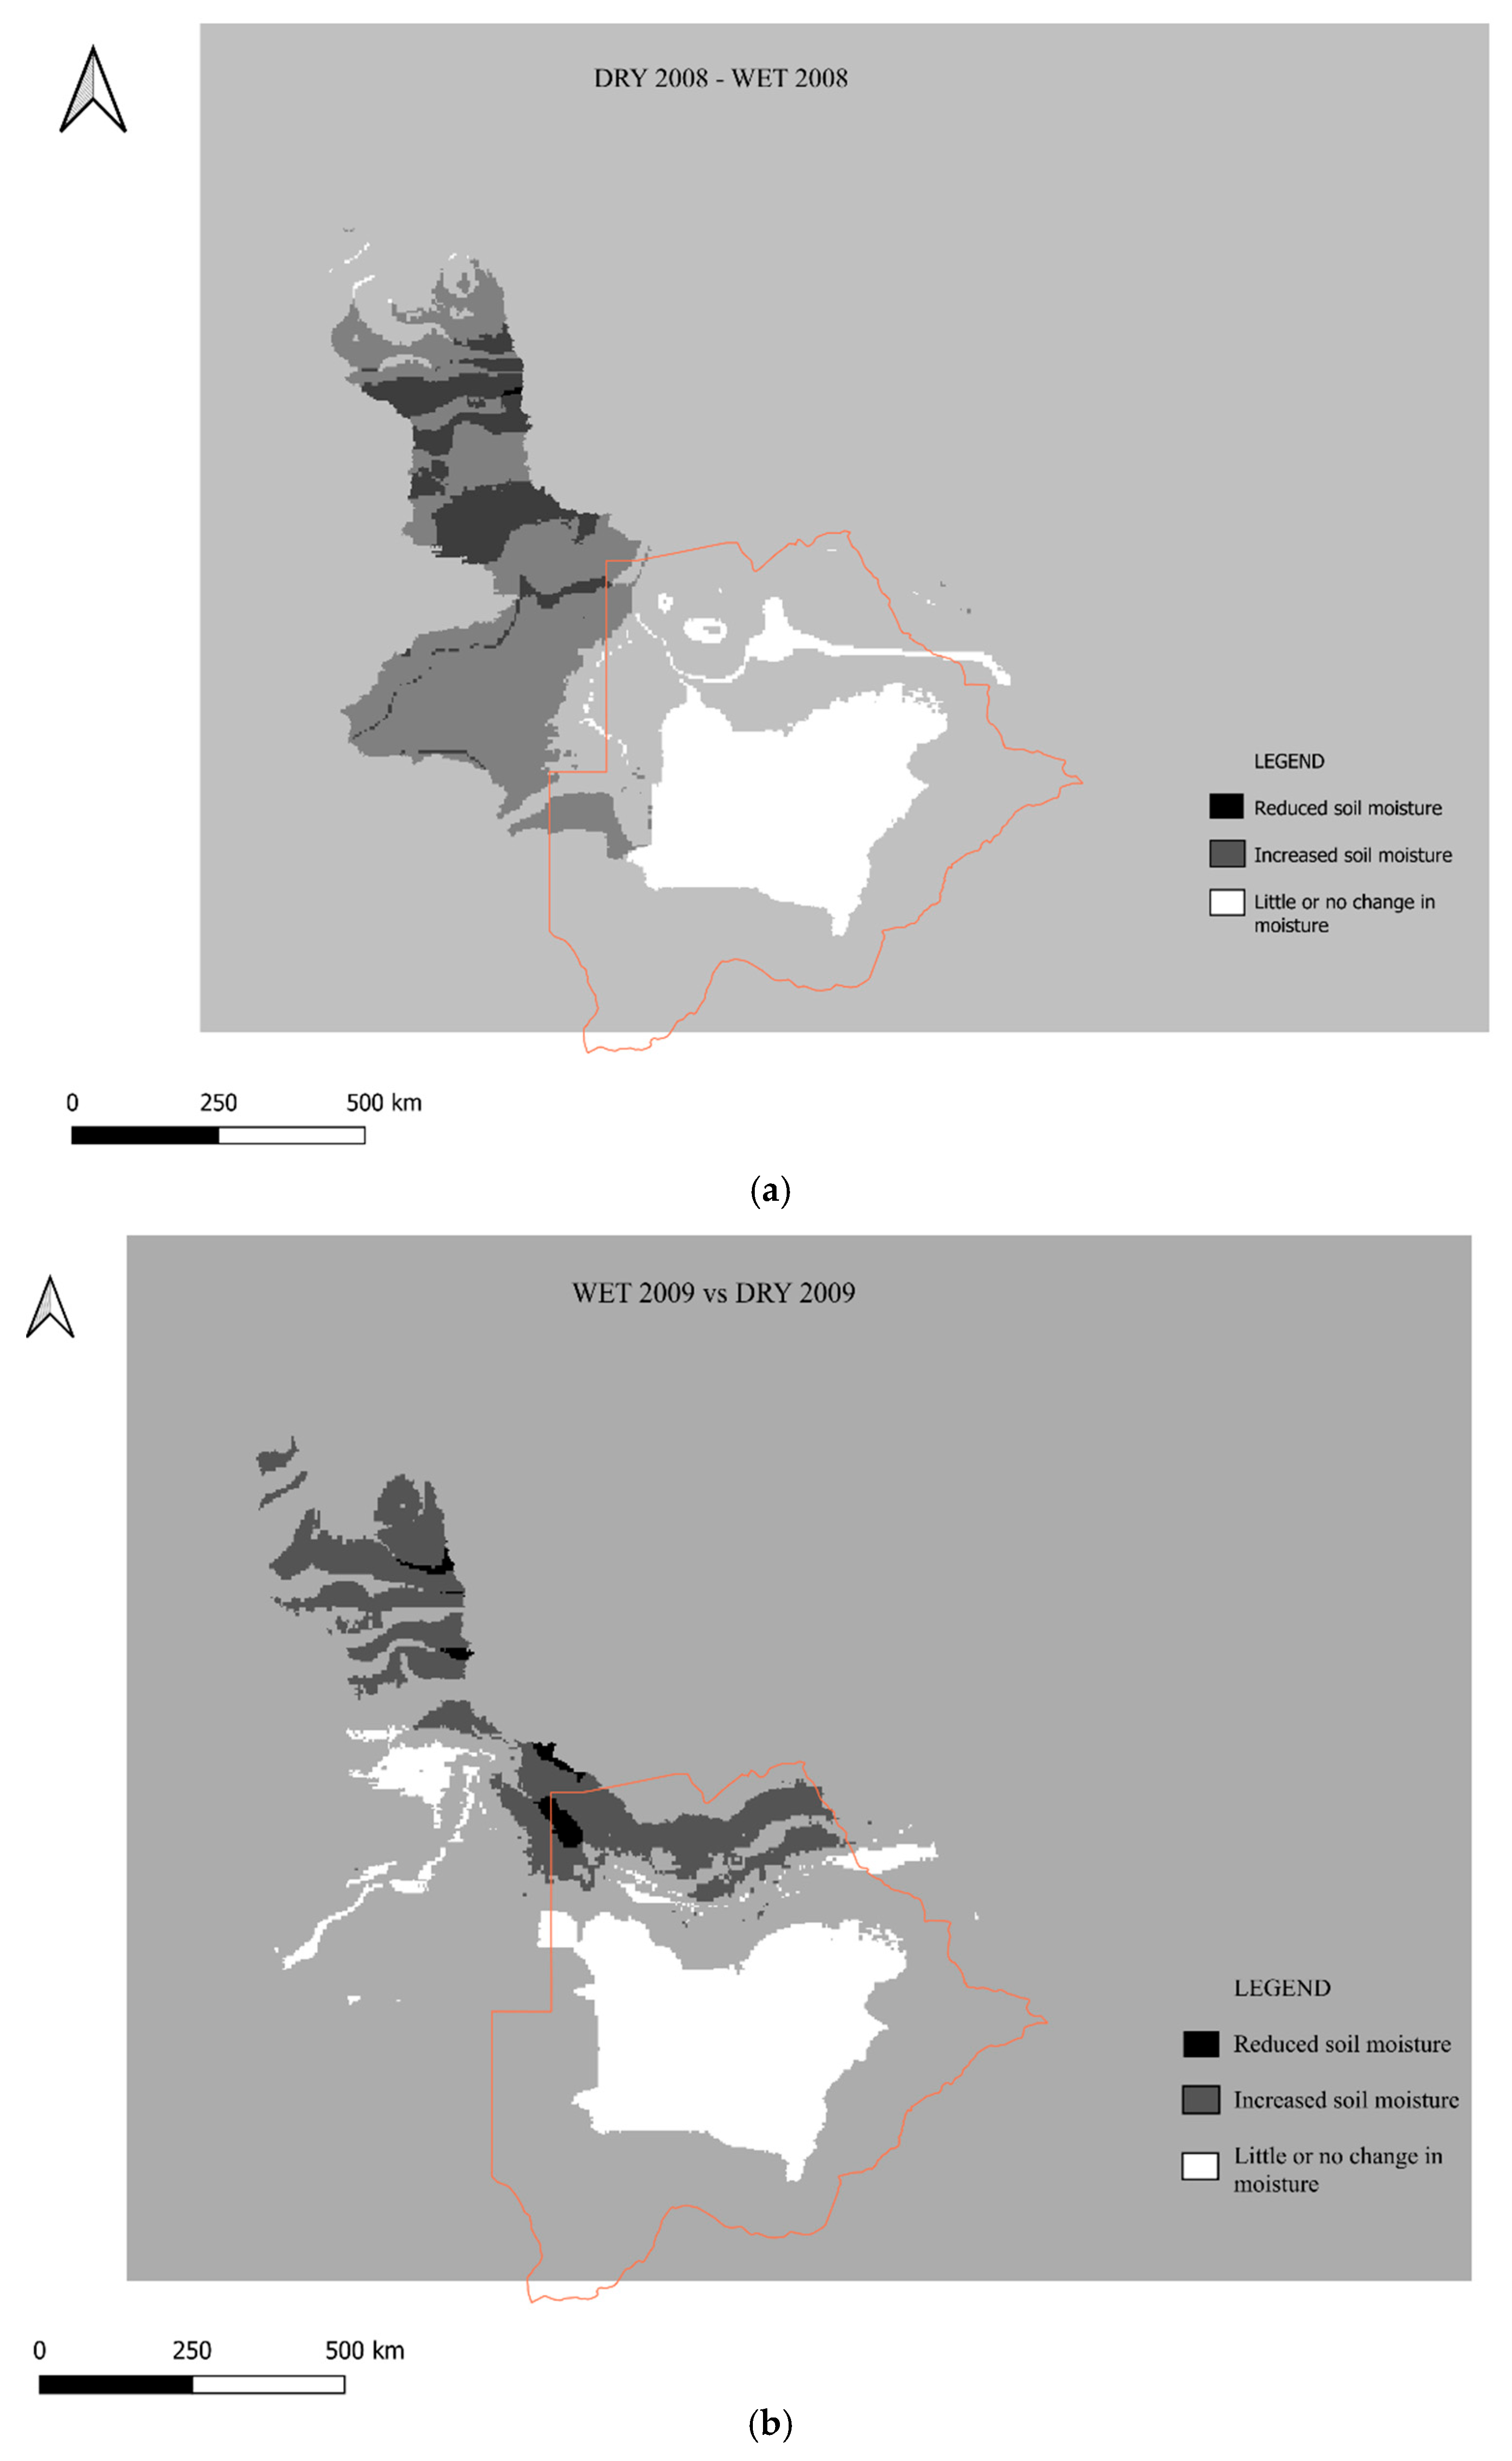
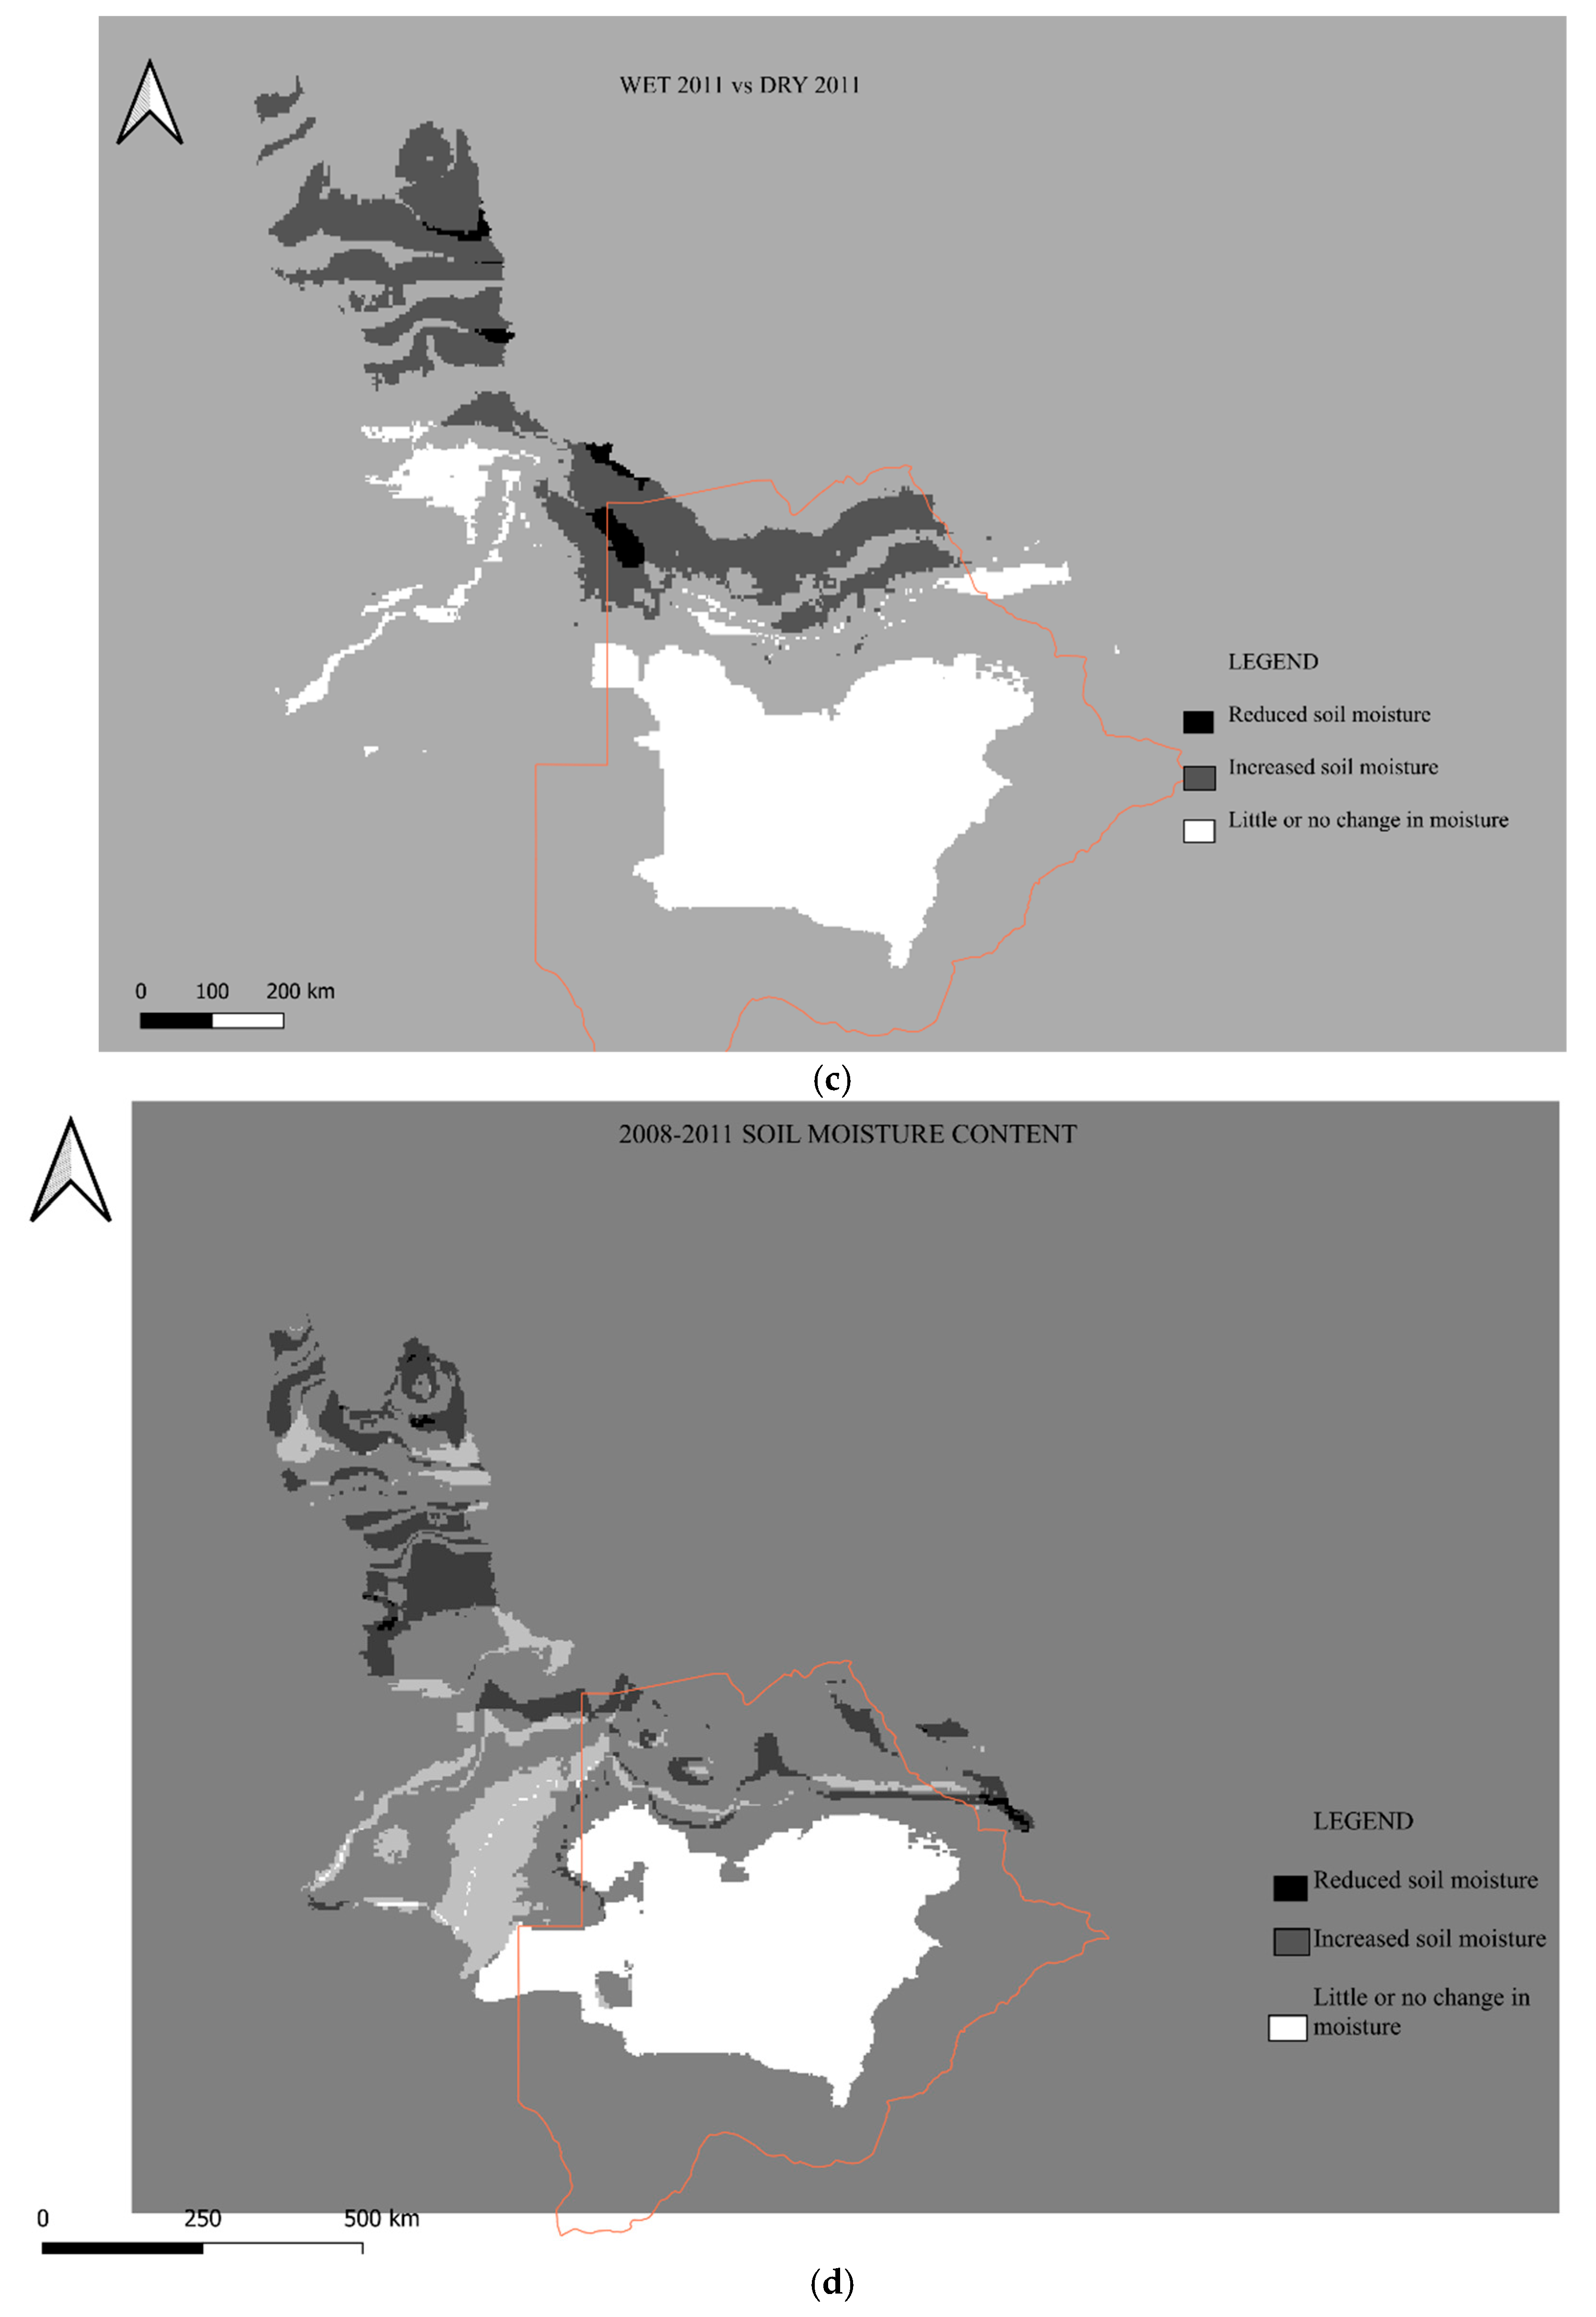

Table 1.
Soil Sample Collection Points and Their Geographic Coordinates.
| Point ID | Latitude | Longitude |
| M/01 | -19.762898 | 23.612183 |
| M/02 | -19.76288 | 23.610231 |
| M/03 | -19.762828 | 2.609059 |
| M/04 | -19.762879 | 23.607991 |
| M/05 | -19.784474 | 23.646196 |
| M/06 | -19.761711 | 23.605911 |
| M/07 | -19.759971 | 23.589081 |
| M/08 | -19.760359 | 23.589116 |
| M/09 | -19.759706 | 23.589 |
| M/10 | -19.759562 | 23.588717 |
| M/11 | -19.758563 | 23.586337 |
| S/01 | -19.763571 | 23.671286 |
| S/02 | -19.76204 | 23.669155 |
| S/03 | -19762277 | 23.667103 |
| S/04 | -19.761481 | 23.666396 |
| S/05 | -19.761381 | 23.674333 |
| S/06 | -19.761261 | 23.674839 |
| P/13 | -19.778946 | 23.663702 |
| P/14 | -19.770677 | 23.668104 |
| P/15 | -19.771028 | 23.672285 |
| P/17* | -19.761192 | 23.677708 |
| P/17t | -19.761243 | 23.679253 |
| P/18 | -19.757296 | 23.682271 |
| P/22 | -19.768464 | 23.679633 |
| P/23 | -19.764147 | 23.682874 |
| P/26 | -19.779198 | 23.679412 |
| P/27 | -19.775864 | 23.678411 |
| P/28 | -19.770731 | 23.682409 |
| P/29 | -19.766557 | 23.686373 |
| P/30 | -19.763207 | 23.688853 |
Table 2.
Summary of Soil Physical and Chemical Properties for Shorobe and Gabamocha.
| SAMPLE ID | MOISTURE CONTENT (%) | TOTAL ORGANIC CONTENT(%) | pH | ELECTRIC CONDUCTIVITY (μs/cm) | BULK DENSITY (g/ml) |
| *M/01 | 82.67 | 12.034 | 6.81 | 69.3 | 1.2535 |
| *M/02 | 154.18 | 15.52 | 6.639 | 221 | 1.0423 |
| *M/03 | 759.95 | 9.1 | 7.017 | 54 | 1.4077 |
| *M/04 | 39.91 | 5.38 | 7.975 | 54.4 | 1.2669 |
| *M/05 | 33.66 | 5.45 | 7.499 | 33.2 | 1.2808 |
| *M/06 | 234.3 | 12.05 | 7.017 | 60 | 1.0461 |
| *M/07 | 78.24 | 9.84 | 6.883 | 43.4 | 1.2309 |
| *M/08 | 432.58 | 2312.13 | 6.86 | 63.4 | 0.9380 |
| *M/09 | 112.59 | 12.24 | 6.685 | 38.1 | 1.1531 |
| *M/10 | 75.68 | 9.53 | 6.601 | 39.9 | 1.2482 |
| *M/11 | 52.33 | 6.99 | 6.489 | 48.3 | 1.1289 |
| ^S/01 | 71.54 | 4.64 | 7.405 | 76.6 | 1.2863 |
| ^S/02 | 22.26 | 1.16 | 7.305 | 16.2 | 1.5519 |
| ^S/03 | 97.79 | 4.56 | 6.57 | 53.8 | 1.0030 |
| ^S/04 | 30.56 | 1.89 | 6.635 | 15.6 | 1.1760 |
| ^S/05 | 27.02 | 4.32 | 6.538 | 53 | 1.4573 |
| ^S/06 | 17.13 | 2.35 | 6.319 | 26.6 | 1.4204 |
| ^P/13 | 64.47 | 17.71 | 7.816 | 112.6 | 1.2655 |
| ^P/14 | 45.98 | 424.77 | 7.46 | 31.8 | 1.3140 |
| ^P/15 | 75.32 | 47.39 | 6.841 | 28.5 | 1.2377 |
| ^P/17 | 21.08 | 41.7 | 6.89 | 57.9 | 1.2759 |
| ^P/17t | 23.79 | 96.33 | 6.757 | 17.9 | 1.4138 |
| ^P/18 | 44.86 | 5.4 | 6.65 | 18.9 | 1.2498 |
| ^P/22 | 59.78 | 4.4 | 6.475 | 27.9 | 1.3472 |
| ^P/23 | 57.63 | 5.54 | 6.532 | 32.8 | 1.3859 |
| ^P/26 | 23.88 | 3.64 | 6.312 | 16.5 | 1.4417 |
| ^P/27 | 31.06 | 5.45 | 6.591 | 25.4 | 1.3512 |
| ^P/28 | 42.88 | 5.85 | 6.25 | 18.5 | 1.2686 |
| ^P/29 | 46.24 | 5.44 | 6.289 | 17.6 | 1.4041 |
| ^P/30 | 57 | 7.24 | 6.373 | 15.3 | 1.4694 |
Legend: * Sample from Gabamocha. ^ Sample from Shorobe.
Table 3.
0 USDA Soil Texture Classification for Shorobe and Gabamocha Based on Sand, Silt and Clay Percentages.
Table 3.
0 USDA Soil Texture Classification for Shorobe and Gabamocha Based on Sand, Silt and Clay Percentages.
| SAMPLE ID | % Sand | % Silt | % Clay | Texture Class |
| *M/02 | 52.2 | 31.1 | 16.7 | Sandy clay loam |
| *M/04 | 57.3 | 30.4 | 12.3 | Sandy loam |
| *M/05 | 74 | 19 | 7 | Loamy sand |
| *M/08 | 53.4 | 19.4 | 27.2 | Sandy loam |
| *M/11 | 70.2 | 29.4 | 0.4 | Loamy sand |
| ^P/14 | 66.2 | 21.4 | 12.4 | Sandy loam |
| ^P/15 | 53 | 6 | 41 | Sandy clay loam |
| ^P/29 | 53.6 | 24.8 | 21.6 | Sandy loam |
| ^S/02 | 75 | 5.4 | 19.6 | Loamy sand |
| ^S/05 | 77.6 | 16 | 6.4 | Loamy sand |
Legend: * Sample from Gabamocha. ^ Sample from Shorobe .
Disclaimer/Publisher’s Note: The statements, opinions and data contained in all publications are solely those of the individual author(s) and contributor(s) and not of MDPI and/or the editor(s). MDPI and/or the editor(s) disclaim responsibility for any injury to people or property resulting from any ideas, methods, instructions or products referred to in the content. |
© 2025 by the authors. Licensee MDPI, Basel, Switzerland. This article is an open access article distributed under the terms and conditions of the Creative Commons Attribution (CC BY) license (http://creativecommons.org/licenses/by/4.0/).
Copyright: This open access article is published under a Creative Commons CC BY 4.0 license, which permit the free download, distribution, and reuse, provided that the author and preprint are cited in any reuse.


