Submitted:
09 January 2025
Posted:
10 January 2025
You are already at the latest version
Abstract
Flash floods, driven largely by climate and land-use changes, are among the most destructive natural hazards globally, causing significant damage and loss of life. This study employs the Flash Flood Potential Index (FFPI) to assess flood-prone areas in North Macedonia's catchments, utilizing GIS and advanced geospatial analytics. The average FFPI values for the main and subcatchments range from 5.34 to 6.46. Across the country's territory, 24.7% of the subcatchments are identified as very highly vulnerable to flash floods (torrential catchments). Correspondingly, the FFPI model ranges from 2.1 to 15.1, with an average value of 5.9, revealing significant spatial variability in flash flood risks across the country. The model classifies vulnerability into five categories, from 1 (very low) to 5 (very high). The Treska, Kriva Reka, and Pčinja River catchments exhibit the highest flood-prone susceptibility, with average FFPI values of 3.36, 3.30, and 3.22, respectively. Nationwide, 25.6% of the area is categorized as highly vulnerable to flash floods. The FFPI model was validated using intense precipitation data and historical flash flood events, ensuring a robust assessment of flood susceptibility. This research addresses the challenges of flash flood forecasting and management in North Macedonia, particularly in regions with limited observational data. By integrating factors such as slope, lithology, land use, vegetation, and the Bare Soil Index (BSI), alongside rainfall, peak discharges, and response times, this study aims to inform improved flood risk management strategies.
Keywords:
flash flood vulnerability
; flood risk management
; geospatial analysis
; remote sensing
; climate change
; precipitation
; erosion
; torrential catchments
1. Introduction
Floods are natural hazards that vary in intensity and can lead to substantial economic and human losses. These events are driven by anthropogenic and natural factors specific to an area and interact differently to influence flood occurrence. The rising frequency and intensity of flood events in recent years can be attributed to global climate change, exacerbated by increasing human activities [1]. The Intergovernmental Panel on Climate Change (IPCC) has emphasized the need to adopt measures and take action to mitigate current climatic changes’ environmental impact [2]. Research on the effect of climate change on flood risk is predominantly conducted at the river basin or regional scale (e.g., [3,4]. Integrating strategies for both mitigation and adaptation requires utilizing technology and information effectively to support decision-makers [5].
Flood hazard management involves control measures such as spatial planning, engineered flood defense systems, and financial aid from national governments to promote cooperation between local communities and authorities. These efforts aim to ensure safe development and support local flood planning [6]. Two main approaches are used in flood analysis: deterministic modeling and parametric approaches, both seeking to utilize available information to map flood-prone areas [7]. When necessary, if data for modeling is unavailable, significant anomalies may arise, making it essential to assess flood vulnerability through parametric methods.
Characterizing flash floods, typically triggered by short, intense rainfalls in basins under 1000 km², is crucial for understanding their hydrological dynamics. These events often expose unexpected or previously unobserved behaviors in catchments, offering insights into extreme flood responses and their dependence on catchment properties (e.g., [8,9]). In Europe, flash flood regimes vary systematically between Continental and Mediterranean regions, with seasonal shifts from summer to autumn [10], impacting land use and climate change considerations.
Flash floods, driven primarily by climate and land-use changes, have emerged as one of the most destructive natural phenomena globally, causing extensive material damage and significant loss of life [11]. Between 1996 and 2015, flash floods claimed approximately 150,061 lives worldwide [12], underscoring the critical need for comprehensive research into flash flood susceptibility [13]. Flash floods occur rapidly following intense rainfall, producing high peak discharges within hours, particularly on slopes with active surface runoff [14,15]. The susceptibility of an area to flash floods is influenced by its physical-geographical characteristics [16], making it essential for effective management and forecasting efforts to accurately identify these susceptible areas (e.g., [17,18]). This has led to the development of flash flood susceptibility models that incorporate past flood data, morphometric factors, lithology, land use, and other variables into predictive frameworks, often using Geographic Information Systems (GIS) and remote sensing (RS) techniques for large-area assessments [19].
Flash floods rank among the most devastating natural disasters due to their high impact on populations and the significant proportion of flood-related fatalities they cause. In Europe, flash floods accounted for 40% of flood-related casualties between 1950 and 2006 [20]. The growing risks associated with flash floods are driven by social and economic development [21], which increases pressure on land use, and by the intensification of the global hydrological cycle due to climate change [22,23]. Consequently, the frequency and severity of flash floods are expected to rise, particularly in regions where storm systems and river discharge patterns are affected by global climate shifts.
The parametric approach estimates system vulnerability using freely available databases and designs methodologies for evaluating vulnerability to flooding. Remote sensing and GIS technologies, combined with advanced modeling techniques, enhance our ability to predict and manage floods [24,25,26]. Numerous methods, such as multicriteria evaluation (e.g., [27]), decision tree analysis [28,29,30], the weight of evidence [31], artificial neural networks [32,33,34], frequency ratio [35], and logistic regression [36], are widely used for flood sensitivity mapping.
This study employs the Flash Flood Potential Index (in further FFPI) model to identify areas vulnerable to flash floods, utilizing the frequency ratio (FR) method for its simplicity and widespread application in previous research (e.g., [37,38,39,40,41]). The results are integrated into a GIS environment to produce flood and flash flood hazard maps, commonly used in hazard mapping studies [35,42,43,44,45].
Recent research underscores the significance of employing advanced methodologies for flood hazard mapping, as demonstrated by the application of the Flood and FFPI [49], the characterization of extreme flash floods across Europe [50], and the integration of multi-criteria decision-making and machine learning techniques supported by remote sensing and GIS [51].
Recent advances in vulnerability modeling have increasingly relied on machine learning algorithms such as artificial neural networks (ANN), decision trees (DT), and support vector machines (SVM), often combined with multi-criteria decision-making (MCDM) methods like the Analytical Hierarchy Process (AHP) [52,53,54]. These models are particularly effective when coupled with remote sensing data, which is crucial in creating input datasets [55]. For instance, the integration of machine learning with MCDM techniques has significantly enhanced the accuracy of flash flood vulnerability assessments [56,57,58,59].
Flash floods pose a prominent natural hazard in North Macedonia, distinguished by their intense and rapid water flow and sediment transport. Triggered frequently by heavy rainfall, thunderstorms, or sudden snowmelt [50,60,61,62], these events are challenging to predict due to their heavily predictable nature. Nevertheless, early indicators such as extreme precipitation events are crucial for improving forecasting accuracy [63]. The FFPI is a critical tool in North Macedonia, enabling the identification and modeling of areas where flash floods are likely to occur, thereby enhancing the precision of early warning systems and risk assessments [64,65,66,67,68].
Substantial research efforts in North Macedonia have been concentrated on flash flood modeling and risk assessment, with recent studies utilizing the FFPI to evaluate flood vulnerability and enhance predictive capabilities [47,69,70,71,72]. The integration of historical data with remote sensing techniques has been pivotal in validating these assessments and formulating effective flood management strategies [73].
The research addresses the challenges of flash flood forecasting and management in North Macedonia, focusing on the complexities of rapid, localized predictions with limited observational data [46]. By employing indices such as Slope, Lithology, Land Use, Vegetation, and BSI, alongside flood-generating rainfall, peak discharges, and response times, the study enhances risk management strategies in the country.
Using open-source software—QGIS 3.38.0 and SAGA GIS 9.7.0—the research develops a comprehensive database through satellite imagery analysis. Integrating GIS techniques with the FFPI, identifies key flash flood drivers and high-risk areas, offering a robust framework for flood risk assessment and mitigation [47]. This novel application of GIS and remote sensing notably advances flood risk management and preventive measures at both local and national levels [48].
2. Methods
This study employs the Flash Flood Potential Index (FFPI) model to identify areas vulnerable to flash floods at the national level, using North Macedonia as a case study. GIS technology and advanced geospatial analytics are utilized in the analysis, which starts at the catchment level and extends to the national scale. The FFPI is validated using intensive precipitation data, to pinpoint sources of flash floods. Additionally, the systematic documentation of historical flood events enhances the analysis, improving the accuracy of the FFPI and supporting effective flood risk management strategies.
2.1. Study Area
Republic of North Macedonia, with its 25,713 km² located in the southern part of the Balkan Peninsula, is characterized by a predominantly mountainous terrain, which accounts for 79% of its total area (Figure 1). Plains constitute only 19%, while lakes and reservoirs cover the remaining 2%. The country’s topography is marked by alternating mountains and valleys, leading to a significant average slope of 15.4°, with 39.5% of the land exhibiting slopes greater than 15° [74]. Geologically, North Macedonia is divided into six distinct geotectonic units, showcasing a wide variety of lithological formations that span from Precambrian to Cenozoic periods [75]. The landscape is particularly vulnerable to erosion and landslides, especially in the foothill regions where highly erodible crystalline and clastic sedimentary rocks are predominant. The region’s climate is influenced by its diverse topography, which subjects it to Mediterranean, continental, and mountainous climatic factors. Recent decades have seen an increase in storm frequency and heavy rainfall events linked to climate change, further intensifying the risks of erosion and flash floods in this semi-arid region, which receives approximately 500-700 mm of precipitation annually [76]. Additionally, the abrupt influx of warm Mediterranean air during winter-to-spring transitions often results in rapid snowmelt and significant overland flow, triggering extensive flash floods [77].
The highest mountains in North Macedonia are located in the western part of the country, while the lowlands are situated in the central parts, known as the Vardar Basin. This area is predominantly composed of fluvial landforms shaped by the Vardar River, which is the longest river in North Macedonia, and its major tributaries, including Treska, Crna Reka, Pčinja, Bregalnica, and Lepenec. According to the Study of Natural Characteristics for Spatial Plan of the Republic of North Macedonia 2021–2040 [78], the Vardar Basin is characterized by complex climatic conditions, with significant variations between individual catchments.
The Vardar River originates from the Vrutok spring near Gostivar city at an elevation of 683.5 m. It flows for 301 km, making it the longest river in the country, covering a catchment area of 22,475 km², with an average slope of 2.1 m/km and an average elevation of 793 m. The first major tributary of the Vardar is the Lepenec River, followed by the Pčinja River, which is the second-largest left tributary. The Bregalnica River, the longest left tributary of the Vardar, and the Crna Reka River, the largest right tributary, also contribute significantly to the river’s flow.
The total length of rivers in North Macedonia is 7,637 km, with a river network density of 0.30 km/km² [78]. These catchments, each with unique hydrological characteristics, play a crucial role in shaping the country’s hydrological dynamics, influencing both water resources and climatic conditions (Figure 2). Understanding these features is essential for effective water resource management and environmental conservation.
2.2. Flash Flood Potential Index (FFPI)
The FFPI is a statistical method widely utilized in global and regional studies to identify areas prone to flash flooding (e.g., [79,80,81]). This approach quantitatively assesses the vulnerability of regions to flash floods by considering various weighting factors, including slope, vegetation cover, land use, and soil type. However, due to the limited detail of the available Soil Map of North Macedonia at a 200k scale, lithological types [75] were used instead of soil types for this analysis.
Flash floods frequently occur in catchment areas where soil infiltration rates are compromised, particularly in regions characterized by bare soil, deforestation, or steep terrain. In response to this, we conducted a national analysis at the country level to identify areas where the risk is highest. Key factors influencing flash flood potential include intense precipitation, which may be compounded by snowmelt, terrain slope, soil characteristics, and vegetation density—specifically forests, shrubs, and grasses. Areas with sparse vegetation are particularly vulnerable to flash floods. The FFPI, recognized as an effective tool for assessing flash flood potential at both global and regional scales, was originally developed by the Colorado River Basin Forecast Center and is based on the model employed by the U.S. National Weather Service [65,82,83,84].
The FFPI is calculated using GIS tools through a statistical analysis that correlates various factors with the spatial distribution of drainage within a watershed. Based on empirical observations, this method indexes the weighting factors influencing flash floods [48,65,72,82,83,84,85,86,87,88]. The model assigns values ranging from 1 to 10, where 1 indicates the lowest and 10 is the highest potential for flash floods. The FFPI model was preferred over meteorological parameters, which often yielded unsatisfactory flood predictions, and was also chosen due to the ambiguous relationship between flash flood occurrence and specific physical-geographical characteristics of the area.
Soil structure and texture are critical in determining water retention and infiltration capacity, while terrain slope affects runoff rate and concentration. The degree to which atmospheric water is retained on the surface is largely influenced by vegetation cover. Seasonal changes in vegetation, such as the shedding of leaves in deciduous forests, can significantly alter flash flood potential. Conversely, wildfires can degrade soil quality by reducing its infiltration capacity due to the combustion of organic material.
Land use, particularly urbanization, significantly impacts water infiltration, runoff concentration, and watershed drainage. These natural and anthropogenic factors collectively inform the assessment of flash flood risk in a given area (e.g., [83]).
2.3. Geospatial Analysis for FFPI
To assess flash flood vulnerability at a national scale, specifically for North Macedonia, an analysis was conducted using GIS technology. The FFPI method was employed in this analysis. Due to the limitations of the available Soil Map of North Macedonia (at 200k scale), which lacks detailed soil data, lithological characteristics of the study area were considered instead of soil types. The model incorporated several weighting factors: slope, vegetation cover, lithology, and land use. The FFPI is calculated using the following formula [84]:
FFPI = (M + S + L + V) / 4
Here, M represents the slope of the terrain, S denotes lithology, L corresponds to land use, and V refers to the vegetation index. The terrain slope (M) was derived using QGIS 3.38.0 and SAGA GIS 9.7.0 software, based on a 5-m Digital Elevation Model (DEM) provided by the Ministry of Agriculture, Forestry, and Water Management of North Macedonia. The slope, expressed as a percentage, was calculated using the formula:
M = 10n / 30
In this equation, n is the average slope of the terrain expressed as a percentage. If n equals or exceeds 30%, the M value is set to 10. For this study, the average slope (n) in North Macedonia was found to be 29.2%, resulting in an M value of 9.7.
Lithological analysis (S) was conducted using a digital lithological map based on the Geological Map of North Macedonia, 100k [75]. Rocks were categorized with values ranging from 1 to 10, depending on their susceptibility to erosion.
The land use index (L) was determined using data from the Corine Land Cover database (2018) [89], with land cover classes assigned values from 1 to 9 based on their potential impact on flash flooding.
The vegetation index (V) was calculated using the Bare Soil Index (BSI) derived from multispectral satellite imagery obtained through the Sentinel-2 program via Earth Explorer, United States Geological Survey [90]. Remote sensing, particularly the BSI, is an effective method for estimating erosion rates associated with flash floods (e.g., [91]). The Sentinel 2-based BSI used in our study (BSI S2) is calculated from the values of the spectral bands B, according to the form:
BSI S2 = ((B11 + B04) − (B08 + B02)) / ((B11 + B04) + (B08 + B02))
To avoid negative values in the vegetation index formula, a value of 1 was added, resulting in the following equation:
V = 7.68 × ln (BSI + 1) + 8
The FFPI is developed by integrating raster datasets representing essential geographical and environmental variables within a study area. GIS and remote sensing technology are crucial in this process, facilitating the precise adjustment, categorization, and integration of datasets on terrain slope, lithology, land use, and vegetation cover. Each attribute is classified to reflect its contribution to flash flood risk. By merging these categorized datasets, the FFPI provides a quantitative assessment of flood vulnerability. The FFPI is applied to national wide flash flood model, allowing for the identification of catchments most vulnerable to flooding. This index remains consistent over time, reflecting the stable characteristics of the area and offering a reliable metric for long-term flood risk evaluation and management.
Furthermore, high-resolution precipitation data from WorldClim2 [92] for the period 1970–2000 was incorporated into the geospatial analysis. This data facilitated the examination of correlations between historical flood hotspots and precipitation patterns. Such correlations enhance flood risk assessment by providing deeper insights into how variations in precipitation influence flood occurrences, thereby improving flood management strategies.
3. Results
3.1. FFPI Components
Slope variation, derived from a high-resolution 5-m DEM, is a critical factor influencing hydrological processes such as runoff timing and infiltration capacity across North Macedonia. As slope angles increase, the infiltration rate diminishes, leading to higher surface runoff and an elevated potential for flash floods [93]. The national average slope is calculated at 15.4°. The slope map was created and categorized in percentage terms (coefficient M). Following this classification, the model was assigned an FFPI value ranging from 1 to 10 (Table 1). Slopes of 29.2 % or greater were assigned the maximum FFPI value of 10 (Figure 3).
Rocks that are susceptible to flash floods typically possess low permeability and are easily eroded. Due to their limited ability to absorb water, these rocks contribute to rapid surface runoff, increasing the potential for flash flooding. Fast-moving water can easily erode or transport loose or soft rocks, further exacerbating flood risks. Shale, mudstone, clay-rich sedimentary rocks, siltstone, and schists, along with non-porous or unfractured marble and limestone, are particularly vulnerable. Conversely, rocks such as granite, basalt, and diabase, known for their hardness and resistance to erosion, are generally less susceptible to flash floods due to their low permeability. However, when these rocks occur in fractured zones, their permeability increases, making them more prone to surface water infiltration and potentially more vulnerable to flash flooding. The lithology index is derived from the lithological map [75], incorporating 9 principal lithological units: quartzite, amphibolite, diabase, solid volcanic rocks (andesite, dacite, basalt), clastic sediments, compact marble, limestone, gneisses, granite, chert, shists, slate, mica shists, tuffs, and clay containing clastic sediments (Table 2). These units are classified according to their susceptibility to flash floods based on erodibility and water permeability. Units such as clay-containing clastic sediments and tuffs, which are highly prone to erosion, receive the highest susceptibility coefficients, thereby increasing flash flood potential. In contrast, solid volcanic rocks, quartzite, amphibolite, and diabase, which are more resistant to erosion, are assigned the lowest susceptibility coefficients. This index is crucial, as the distribution and proportion of these lithological units influence infiltration rates and runoff during intense rainfall. The lithology index map (see Figure 4) is then converted into an FFPI value, as illustrated in the analysis.
The land-use terrains with the highest susceptibility to the FFPI include bare rocks and sparsely vegetated areas, whereas mixed forests exhibit the lowest susceptibility (Table 3). The land use map was employed according to CLC2018 [89] to create a land use index, which was then classified into FFPI categories, as shown in Figure 5. Forests in North Macedonia—encompassing mixed, broad-leaved, and coniferous types—are increasingly threatened by illegal logging, deforestation, and forest fires, particularly during summer. This deforestation leads to significant loss of forest cover, diminishing the land’s capacity to retain and absorb rainfall, exacerbating runoff and increasing flood risk. Removing vegetation degrades soil structure and reduces permeability, resulting in diminished infiltration and increased surface runoff. Moreover, the soils in deforested areas, often already prone to erosion, exhibit further reduced absorption capabilities. Coupled with unfavorable lithological conditions, these factors contribute to heightened flood susceptibility, underscoring the urgent need for effective forest management and conservation practices to mitigate flood risks.
Using Sentinel-2 satellite imagery and the BSI provided in-depth insights into flash flood susceptibility and erosion intensity within the study area. This analytical approach enabled the precise identification of areas susceptible to the formation of flash floods. A significant correlation between vegetation density and erosion rates was observed, which is essential for developing effective land management strategies and implementing measures to mitigate flash flood impacts. Integrating remote sensing data with BSI analysis has substantially advanced the understanding of erosion dynamics and the area’s vulnerability to flash floods. BSI values varied from 0.10 to 0.99, with a mean value of 0.57, reflecting a broad spectrum of soil exposure levels. Lower values indicate relatively well-vegetated and less exposed areas, while higher values signify greater soil exposure and reduced vegetation cover. The mean BSI value of 0.57 thus represents a moderate level of soil exposure, indicating a balanced mix of vegetated and exposed soil areas within the study area. Furthermore, a vegetation index ranging from 1 to 9 was generated to quantify land cover conditions and their impact on flood vulnerability (Figure 6).
3.2. Nationwide GIS-based Flash Flood Modelling
The FFPI serves as a critical indicator of flood susceptibility, with values ranging from 2.08 to 15.07. Using SAGA GIS software (v. 9.7.0), according to Natural Breaks classification we classified FFPI values into five classes, ranging from 1 (very low vulnerability) to 5 (very high vulnerability). The flash flood potential model for the entire area of North Macedonia has an average value of 5.9, revealing considerable variability in flood risk (Figure 7).
This variability is driven by steep slopes, which increase runoff speed and erosion; deforestation, which reduces soil stability and absorption capacity, and erodible lithologies like tuffs and schists, which are prone to weathering and erosion. Additionally, areas with sparse vegetation contribute to higher flood risk due to diminished water absorption and increased sediment transport. Collectively, these factors create a complex landscape of flood vulnerability across the country. Thus, the FFPI analysis shows that most of North Macedonia’s territory is classified as having moderate vulnerability, covering 46.7% of the area. This is followed by low vulnerability at 23.4%, with high vulnerability at 22.3%. Very low vulnerability constitutes 4.3%, and very high vulnerability represents the smallest portion at 3.3% of the total area (Table 5).
3.3. Flash Flood Potential in Catchment Areas
The average FFPI values for the main and subcatchments range from 5.34 to 6.46. As mentioned earlier, the values are reclassified into five classes, ranging from 1 (very low vulnerability) to 5 (very high vulnerability). Starting with the highest average value, the analysis reveals significant variability in flash flood vulnerability across catchments in North Macedonia (Figure 8).
To better assess the susceptibility to flash floods, a map of average FFPI values was created for small catchments extracted from 5-m DEM with areas ranging from 1 km² to 100 km². Across the country’s territory, 1,236 such catchments were identified, forming the basis for flash flood assessment. Using the Natural Breaks (Jenks) classification, all catchments were categorized according to their average FFPI values, and the results are presented in Table 4.
The table clearly shows that in North Macedonia, catchments with high and very high susceptibility to flash floods dominate, both in terms of number (789 or 63.9%) and area (63.6%). This is mainly a result of steep terrain slopes, sparsely vegetated and unprotected soil, and lithology. Combined with the increased frequency of intense rainfall (partly due to climate change), this leads to strong flash floods. The majority of the catchments exhibit torrential characteristics, as confirmed by the register of torrential watercourses in North Macedonia [94]. This is closely linked to the high erosive potential of the area and the significant accumulation of sediments. On the other hand, only 6.6% of the catchments, covering just 7.5% of the territory, have low or very low susceptibility to flash floods. Most of the torrential catchments are part of the basins of the Bregalnica and Pčinja rivers, as well as the Treska, Strumica, Crna, and others. Due to good forest coverage, the fewest are found in the basin of the Crn Drim with the Radika river.
3.4. Flash Flood Potential Validation
The best method for validating flash flood occurrences is through analyzing intense rainfall data. This is especially important considering the expected increase in daily extreme precipitation events, which are likely to heighten flash flood risk. Hence, the validation utilizes detailed rainfall intensity data from meteorological stations, covering durations from 5 to 1440 minutes, as detailed in the work of [95]. This data is analyzed to assess the spatial and temporal variability of rainfall intensities, enabling the clear identification of catchments most susceptible to flash floods. The study highlights areas most likely to be triggered by intense rainfall events by correlating rainfall patterns with geographic and physiographic factors. Integrating these precipitation data and GIS-based spatial analysis enhances the FFPI’s results and supports more effective flood risk management strategies.
Understanding the specific catchments from which flash floods originate is crucial, as flooding in the area can often be traced back to one or more smaller catchments. By focusing on high- and very high-risk catchments, this analysis identifies areas most vulnerable to flash flood occurrences. This targeted approach facilitates a more effective assessment of vulnerable catchments, contributing to improved flood risk management strategies. Furthermore, this process enhances the accuracy and reliability of the FFPI by systematically documenting historical flood events, thereby offering valuable context that complements the remote sensing data.
The validation of the FFPI for North Macedonia utilizes detailed rainfall intensity data from meteorological stations, as outlined by [95]. This dataset offers a strong foundation for analyzing spatial and temporal variability in rainfall intensities over durations ranging from 5 to 1440 minutes. It enables a nuanced understanding of the influence of geographic and physiographic factors on precipitation patterns and associated flash flood risks.
A critical aspect of this study is the emphasis on understanding the source catchments of flash floods, as flooding is often attributable to smaller, contributing catchments within larger basins. By focusing on high- and very high-risk catchments, the assessment becomes more refined, allowing for a precise identification of the areas most vulnerable to flash flood occurrences. This approach enhances the predictive capabilities of the FFPI, correlating detailed rainfall data with known flood events and ensuring more effective flood risk management.
For short-duration rainfall events, such as those lasting 5 minutes, Bitola exhibits the lowest intensities, followed sequentially by Prilep, Ohrid, Lazaropole, Shtip, Kriva Palanka, and Demir Kapija, with Skopje consistently recording the highest intensities. This hierarchy remains largely consistent for 10-minute events, where Lazaropole records the lowest intensities, followed by Bitola, Shtip, Prilep, Ohrid, Demir Kapija, and Kriva Palanka, with Skopje again maintaining the highest values. Similarly, for 20-minute durations, Lazaropole remains the lowest, followed by Prilep, Bitola, Ohrid, Demir Kapija, Kriva Palanka, and Shtip, while Skopje continues to exhibit the highest intensity.
For intermediate durations, shifts in intensity patterns become apparent. For 40-minute rainfall events, Lazaropole retains the lowest values, followed by Ohrid, Prilep, Demir Kapija, Bitola, Kriva Palanka, and Skopje, while Štip demonstrates the highest intensity. For 60-minute events, the lowest intensities are observed at Lazaropole, followed by Ohrid, Prilep, Demir Kapija, Bitola, Skopje, and Kriva Palanka, with Štip maintaining the highest intensity. Interestingly, for 90-minute rainfall events, Lazaropole records the lowest values, followed by Ohrid, Demir Kapija, Prilep, Skopje, Bitola, and Štip, with Kriva Palanka exhibiting the highest intensity.
Longer-duration events reveal further variability in intensity distribution. For 150-minute rainfall events, Ohrid shows the lowest intensity, followed by Lazaropole, Demir Kapija, Skopje, Štip, Prilep, and Bitola, while Kriva Palanka demonstrates the highest values. This trend persists for 300-minute durations, where the lowest intensities occur at Lazaropole, followed by Ohrid, Štip, Demir Kapija, Bitola, Prilep, and Skopje, with Kriva Palanka again recording the highest intensities. At 720 minutes, Lazaropole retains the lowest values, followed by Štip, Bitola, Prilep, Ohrid, Demir Kapija, and Skopje, with Kriva Palanka at the uppermost intensity level. For the longest rainfall durations of 1440 minutes, Štip records the lowest intensity, followed by Skopje, Kriva Palanka, Prilep, Ohrid, Bitola, and Demir Kapija, with Lazaropole exhibiting the highest values.
The validation of the FFPI using these rainfall intensity patterns underscores the spatial heterogeneity of flash flood susceptibility across North Macedonia. High intensities in Skopje for short-duration events are indicative of its increased flash flood risk, aligning with historical flood occurrences in the region. Conversely, Lazaropole and Ohrid, with persistently low intensities, exhibit a substantially reduced potential for flash flood events, reflecting their topographic and climatic conditions. The integration of rainfall intensity data across varying temporal scales ensures the FFPI’s robustness in identifying high-risk zones.
Extreme precipitation events can exhibit distinct characteristics and typically larger magnitudes of change than average rainfall figures. In warmer conditions, the atmosphere’s capacity to hold moisture increases exponentially, which enhances the potential for heavier rainfall. This indicates that intense rainfall events will likely occur more frequently, potentially increasing flood risk. Conversely, only in areas where precipitation significantly decreases can the trend towards heavier rainfall be offset, resulting in longer return periods for major events instead of shorter ones. A similar situation applies to extreme drought occurrences, which result from rising temperatures and reduced rainfall in arid regions. Additionally, the combination of geological composition and historical land-use changes—particularly deforestation over the last 50 to 100 years, along with frequent summer forest fires—increases the risks of erosion, and flash floods.
4. Discussion
The results of this study provide a comprehensive assessment of flash flood susceptibility across North Macedonia, offering critical insights into the spatial variability of flood risk and its underlying drivers. The calculated FFPI values, derived from GIS-based modeling and validated through rainfall intensity data, reveal notable differences in vulnerability among the country’s major river basins and sub-catchments.
The Moravica, Treska (Lower and Middle), Kriva Reka, Bregalnica Lower and Pčinja river catchments emerge as the most vulnerable to flash floods. These findings align with the physical and geological characteristics of these catchments, including steep slopes, rapid river flows, significant deforestation, sparse vegetation, and particularly in areas dominated by erosion-prone lithologies such as schists, tuffs, and compact magmatites. Steep slopes facilitate increased runoff velocity and soil erosion, while deforestation reduces vegetation that otherwise stabilizes soil and mitigates runoff. Erodible lithologies contribute to sediment transport and accumulation, particularly in lower-lying areas. High-risk zones are notably concentrated around settlements, where these adverse conditions converge, underscoring the urgent need for targeted flood management strategies. Urbanization exacerbates flood risk due to the reduced absorption capacity of impervious surfaces. The high-risk nature of these basins demands prioritized interventions, including improved stormwater management infrastructure, afforestation programs, and the enforcement of land-use regulations.
The reclassification of FFPI values into five vulnerability classes emphasize that 46.7% of North Macedonia’s territory falls under moderate vulnerability, while 22.3% and 3.3% of the area exhibit high and very high vulnerability, respectively. These spatial patterns underscore the role of steep slopes, deforestation, BSI, land cover, land use, and erodible lithologies in shaping the flood risk landscape. Steeper slopes facilitate rapid runoff, while areas with higher BSI and reduced vegetation are more prone to erosion. Variations in lithology affect water retention and drainage characteristics, while land use changes—especially deforestation and urbanization—can heighten vulnerability. Therefore, integrating average precipitation data with these environmental factors offers a comprehensive flood risk assessment across diverse landscapes.
The validation of the FFPI model using detailed rainfall intensity data reinforces its robustness in capturing flash flood dynamics. The strong correlation between high-risk areas and recorded flood events underscores the model’s predictive reliability. However, discrepancies in rainfall intensity distribution, particularly in urban versus rural settings, highlight the need for continuous updates to meteorological datasets and their integration into future iterations of the model.
Flash floods typically begin in small sub-catchments and can progressively affect larger areas, ultimately leading to broader basin-wide flooding. This emphasizes the importance of the FFPI model, which enables the assessment of flood risk across various scales, from smaller sub-catchments to entire river basins. By incorporating both natural and anthropogenic factors, the model offers a comprehensive framework for identifying vulnerable areas and informing effective flood risk management strategies in North Macedonia.
Furthermore, the systematic integration of historical flood occurrences strengthens the FFPI’s accuracy and reliability, offering a comprehensive framework that combines remote sensing data with ground-truth information. This inclusion of detailed historical data not only improves the identification of high-risk zones but also enhances the model’s predictive capabilities, ensuring more precise flood risk management.
According to our FFPI model and historical events, key catchments—such as Treska, Kriva Reka, Bregalnica, Pena, Crna, Pčinja (Figure 10), and—Vardar show significant vulnerability to flash floods.
The Treska catchment, detailed in the flood management plan by the [97], has similarly experienced significant flooding events in 1979, 1996, 2005, 2010, and 2021, reinforcing its vulnerability.
Hence, Kriva Reka catchment is identified as one of the most vulnerable in the country. The work of [69] reports that the highest recorded maximum flow of the Kriva Reka occurred in July 1970, reaching 313 m³/s. Other significant flooding events include 264 m³/s in August 1966 and 249 m³/s in May 1964, with a further notable event in September 1975 recording 190 m³/s. Over recent decades, the catchment has experienced floods with peak flows exceeding 150 m³/s approximately every 2–3 years (2004, 2005, 2010, 2013, 2014). These events have caused severe damage to infrastructure, particularly in the floodplain of Kriva Reka and its tributary, Kratovska Reka (e.g., [47,71]).
Another high-risk catchment is Bregalnica, particularly its eastern subcatchments, including the downstream sections of the Želevica, Pehčevska Reka, and Umlenska Rivers, which are especially prone to flooding [96]. In the Bregalnica catchment, smaller subcatchments pose significant flood risks during intense precipitation events. Research by [72] indicates that the Kamenica River, located in the eastern part of the Bregalnica catchment, shows a very high susceptibility to flash floods, with the FFPI yielding an average value of 5.7. Historical data confirm that the Bregalnica River experienced significant flooding in 1962, 1979, 2010, 2015, 2016, and more recently in 2021 and 2023, underscoring the region’s vulnerability to hydrological extremes. These floods have caused extensive damage in urban areas, including Štip, Vinica, Pehčevo, and Kočani.
The Pena catchment is characterized by a high risk of flash floods, as indicated by a very high FFPI (shown in red). In August 2015, Šipkovica village, located in the central part of this catchment (north of Tetovo), experienced a devastating flash flood due to intense rainfall. This event resulted in the loss of four lives and significant damage to infrastructure (based on official media, Figure 11).
The FFPI model shows that The Crna Reka is in the risk zone of vulnerability catchments. According to the media, and historical flood events, Crna Reka has similarly experienced significant flooding, particularly in 1966, 1994, and 2005, leading to notable damage to infrastructure and local communities. More recent floods in 2013, 2018, 2010, 2015, 2021, and 2023, driven by intense precipitation, further illustrate the catchment’s vulnerability to extreme weather conditions.
The Vardar catchment has also faced major flood events, particularly in 1962, 1979, and 1990, resulting in extensive damage, particularly in the Skopje region. Recent floods in 2010, 2016, 2020, 2021, and 2023, driven by heavy precipitation, underscores the catchment’s ongoing susceptibility to extreme weather [98]. A tragic incident in 2016, when severe flooding resulted in the loss of 22 lives, underscores this risk (Figure 12). According to the [101], approximately 93 mm of rain (93 liters per m2) fell in about four hours. These events have led to considerable agricultural losses and infrastructure damage, underscoring the urgent need for improved flood management strategies. A comprehensive approach integrating hydrological monitoring and effective land-use planning is essential to mitigate future flood impacts in high-risk catchments.
As a final point, the Strumica River has experienced several significant flooding events, particularly in 1969 [99], 1994, 2010, 2015, 2021, and 2023, causing considerable damage to infrastructure and agricultural areas [100]. Hence, although the FFPI model indicates an average low risk, there are smaller catchments that, due to intense rainfall, may experience flash floods. These vulnerable areas are prone to flash flooding as a result of heavy rainfall and extreme weather events.
Based on historical data regarding significant floods in November 1962, 1979, and other major events, the maximum recorded flows in North Macedonia demonstrate pronounced seasonal variability, complicating their prediction. The spring months remain dominant for high-flow events in the western part of the country, while November is noted for the highest frequency of significant flows due to intense precipitation. This results from short-duration, intense rainfall and prolonged high-flow conditions, leading to what are termed fluvial floods.
In recent decades, June and July have increasingly been associated with rapid and torrential flood events (flash floods). Assessments of extreme hydrological events in North Macedonia are based on future climate scenarios [102] from 2006 to 2100, incorporating three distinct emission scenarios and changes compared to the reference period of 1986 to 2005.
Results from climate projections indicate that North Macedonia will experience a warmer and drier climate by 2050, characterized by an increase in warm temperature extremes and a decrease in cold temperature extremes. Despite expectations of drier conditions, an increase in extreme precipitation events is anticipated, leading to a heightened risk of flash floods. During the summer months, an increase in consecutive dry days is expected, resulting in more frequent drought occurrences. Additionally, a shift in the vegetative season is anticipated, leading to an extended growing season [97].
One of the main objectives of constructing artificial reservoirs is to mitigate flooding risks in populated areas and agricultural lands from high-flow events. This process involves coordinated water retention strategies to protect downstream infrastructure from flooding. The Treska River is a typical example of this type of reservoir construction, with three reservoirs established along its lower reaches to significantly minimize the flood risk to Skopje. These findings underscore the need for enhanced flood risk management strategies targeted at these catchments, especially in urban areas. Improved data collection and monitoring are essential for accurate predictions and effective mitigation measures, ensuring community safety and resilience against increasing hydrological extremes. By understanding historical disaster patterns, policymakers and stakeholders can better anticipate and manage future risks, ultimately safeguarding lives and economies [21].
Furthermore, as noted by [50], the flash flood regime is generally more intense in the Mediterranean Region, which is particularly relevant for North Macedonia, located within this area. Currently, there is a lack of national-level research on flash floods that employs the FFPI methodology. Comparative analysis with studies from neighboring European countries using alternative methodologies can provide valuable insights into regional flood risk dynamics. For example, Serbia has approximately 18% of its territory exposed to flood hazards [103], significantly lower than the estimated 25.1% high and very high flooding risk in North Macedonia. In Slovenia, more than 70% of the territory has been adversely impacted by flooding, primarily within the Danube River Basin [104]. Additionally, Croatia has 16.0% of its territory at risk of flooding [68], which is approximately 1.6 times lower than the flooding risk in North Macedonia. Bosnia and Herzegovina presents a notably lower risk of 4.89% [105], making it approximately 5.1 times lower than North Macedonia. These findings underscore the urgent need for a strategy in North Macedonia that employs the flash flood model based on the FFPI methodology to effectively reduce flood risks and improve regional resilience to hydrological extremes.
5. Conclusions
This study aims to assess flash flood potential across North Macedonia by conducting advanced geo-spatial analyses of key factors such as slope, lithology, rainfall, land cover and land use. This contribution enhances the current understanding of flood risk in the region. Utilizing modern GIS and remote sensing tools, the study identifies areas most vulnerable to flash floods, offering valuable insights for vulnerability assessment and flood risk reduction interventions. The FFPI model, due to its simplicity and ease of implementation, provides a robust framework for predicting and preventing flash floods, especially in areas lacking detailed hydrological data. The model’s regional application extends the relevance of flood management strategies, particularly in regions with steep slopes, low vegetation cover, and high erosion potential. On a broader scale, this study’s results are valuable for disaster risk management globally, offering a method that can be adapted to other regions facing similar challenges due to data scarcity.
Nevertheless, the study recognizes certain limitations. To improve the model’s predictive accuracy, future research should incorporate more precise soil data, as well as real-time rainfall monitoring. Establishing a more comprehensive historical record of flash flood events would also strengthen model validation and enhance forecasting capabilities. Additionally, integrating geoanalytical data, such as the Stream Potential Index (SPI) and Terrain Wetness Index (TWI), alongside machine learning algorithms approaches (ML), could provide deeper insights into flood dynamics and refine flood risk management strategies.
Additionally, the scientific contribution of this study is significant, offering a prototype for nationwide flood predictions that could be adapted to other regions with similar challenges. The model has also been successfully hindcasted for historical flood events, bolstering confidence in its application for future hydrological research.
Practically, the study’s findings are crucial for improving flood risk management in North Macedonia. Government agencies and local authorities can use the results to refine early warning systems, develop sustainable flood protection measures, and inform urban planning, land use management, and environmental protection policies. The adoption of this model will enable local and regional authorities to implement targeted preventive measures, increasing resilience for vulnerable populations. The findings underscore the importance of focusing on high-risk catchments for immediate action, such as the implementation of flood barriers and early warning systems. Medium- and low-risk areas should also be prioritized to prevent risk escalation due to land-use changes and climate variability. Policymakers can leverage these insights to allocate resources effectively and develop region-specific flood management plans. Given the significant variability across the country, tailored flood risk management strategies that account for both natural and anthropogenic factors are essential.
While the FFPI model provides valuable insights, future research should address its limitations by incorporating temporal datasets and hydrodynamic modeling to better capture the dynamic nature of flood risks, particularly in the context of climate change and land-use transformations. Thus, exploring the role of socio-economic factors in influencing flood impacts is an important avenue for further investigation.
Author Contributions
B.A. conceived the original idea for this study and developed the study design; B.A. and I.M. contributed to the analyzed and interpreted the data; B.A., I.M. and V.M.C. made a significant contribution by drafting the introduction; B.A. drafted the discussion, and made the GIS analyses; B.A. and I.M. composed the conclusions; B.A., I.M., V.M.C. and N.N. critically reviewed the data analysis and contributed to revising and finalizing the manuscript; All authors have read and agreed to the published version of the manuscript.
Funding
This research was funded by the Scientific–Professional Society for Disaster Risk Management, Belgrade (https://upravljanje-rizicima.com/, accessed on 1 January 2025), and the International Institute for Disaster Research (https://idr.edu.rs/, accessed on 1 January 2025), Belgrade, Serbia.
Data Availability Statement
Data are contained within the article.
Acknowledgments
The authors acknowledge the use of Grammarly Premium in the process of translating and improving the clarity and quality of the English language in this manuscript. The authors take full responsibility for the originality, validity, and integrity of the manuscript.
Conflicts of Interest
The authors declare no conflicts of interest.
References
- Didovets, I.; Krysanova, V.; Bürger, G.; Snizhko, S.; Balabukh, V.; Bronstert, A. Climate Change Impact on Regional Floods in the Carpathian Region. J. Hydrol. Reg. Stud. 2019, 22, 100590. [Google Scholar] [CrossRef]
- Clar, C. Barriers and Guidelines for Public Policies on Climate Change Adaptation: A Missed Opportunity of Scientific Knowledge-Brokerage. Nat. Resour. Forum 2013. Available online: https://onlinelibrary.wiley.com/doi/abs/10.1111/1477-8947.12013 (accessed on 26 August 2024). [CrossRef]
- Dobler, C.; Bürger, G.; Stötter, J. Assessment of Climate Change Impacts on Flood Hazard Potential in the Alpine Lech Watershed. J. Hydrol. 2012, 460, 29–39. [Google Scholar] [CrossRef]
- Zelenáková, M.; Purcz, P.; Blišt’an, P.; Vranayová, Z.; Hlavatá, H.; Diaconu, D.C.; Portela, M.M. Trends in Precipitation and Temperatures in Eastern Slovakia (1962–2014). Water 2018, 10, 727. [Google Scholar] [CrossRef]
- Yohe, G.W. Mitigative Capacity – The Mirror Image of Adaptive Capacity on the Emissions Side. Clim. Chang. 2001, 49, 247–262. [Google Scholar] [CrossRef]
- Filatova, T. Market-Based Instruments for Flood Risk Management: A Review of Theory, Practice and Perspectives for Climate Adaptation Policy. Environ. Sci. Policy 2013, 37, 227–242. [Google Scholar] [CrossRef]
- Balica, S.F.; Popescu, I.; Wright, N.G.; Beevers, L. Parametric and Physically Based Modelling Techniques for Flood Risk and Vulnerability Assessment: A Comparison. Environ. Model. Softw. 2013, 41, 84–92. [Google Scholar] [CrossRef]
- Archer, D.R.; Leesch, F.; Harwood, K. Learning from the Extreme River Tyne Flood in January 2005. Water Environ. J. 2006, 21, 133–141. [Google Scholar] [CrossRef]
- Borga, M.; Boscolo, P.; Zanon, F.; Sangati, M. Hydrometeorological Analysis of the 29 August 2003 Flash Flood in the Eastern Italian Alps. J. Hydrometeorol. 2007, 8, 1049–1067. [Google Scholar] [CrossRef]
- Gaume, E.; Bain, V.; Bernardara, P.; Viglione, A.; et al. A Collation of Data on European Flash Floods. J. Hydrol. 2009, 367, 70–78. [Google Scholar] [CrossRef]
- Costache, R. Flash-Flood Potential Assessment in the Upper and Middle Sector of Prahova River Catchment (Romania): A Comparative Approach between Four Hybrid Models. Sci. Total Environ. 2019a, 659, 1115–1134. [Google Scholar] [CrossRef] [PubMed]
- Termeh, S.V.R.; Kornejady, A.; Pourghasemi, H.R.; Keesstra, S. Flood Susceptibility Mapping Using Novel Ensembles of Adaptive Neuro Fuzzy Inference System and Metaheuristic Algorithms. Sci. Total Environ. 2018, 615, 438–451. [Google Scholar] [CrossRef]
- Hong, H.; Tsangaratos, P.; Ilia, I.; Liu, J.; Zhu, A.X.; Chen, W. Application of Fuzzy Weight of Evidence and Data Mining Techniques in Construction of Flood Susceptibility Map of Poyang County, China. Sci. Total Environ. 2018, 625, 575–588. [Google Scholar] [CrossRef] [PubMed]
- Costache, R. Flood Susceptibility Assessment by Using Bivariate Statistics and Machine Learning Models—A Useful Tool for Flood Risk Management. Water Resour. Manag. 2019b, 33, 3239–3256. [Google Scholar] [CrossRef]
- Elkhrachy, I. Flash Flood Hazard Mapping Using Satellite Images and GIS Tools: A Case Study of Najran City, Kingdom of Saudi Arabia (KSA). Egypt. J. Remote Sens. Space Sci. 2015, 18, 261–278. [Google Scholar] [CrossRef]
- Jacinto, R.; Grosso, N.; Reis, E.; Dias, L.; Santos, F.; Garrett, P. Continental Portuguese Territory Flood Susceptibility Index: Contribution to a Vulnerability Index. Nat. Hazards Earth Syst. Sci. 2015, 15, 1907–1919. [Google Scholar] [CrossRef]
- Khosravi, K.; Pham, B.T.; Chapi, K.; Shirzadi, A.; Shahabi, H.; Revhaug, I.; Prakash, I.; Bui, D.T. A Comparative Assessment of Decision Trees Algorithms for Flash Flood Susceptibility Modeling at Haraz Watershed, Northern Iran. Sci. Total Environ. 2018, 627, 744–755. [Google Scholar] [CrossRef]
- Youssef, A.M.; Pradhan, B.; Sefry, S.A. Flash Flood Susceptibility Assessment in Jeddah City (Kingdom of Saudi Arabia) Using Bivariate and Multivariate Statistical Models. Environ. Earth Sci. 2016, 75, 12. [Google Scholar] [CrossRef]
- Carpenter, T.; Sperfslage, J.; Georgakakos, K.; Sweeney, T.; Fread, D. National Threshold Runoff Estimation Utilizing GIS in Support of Operational Flash Flood Warning Systems. J. Hydrol. 1999, 224, 21–44. [Google Scholar] [CrossRef]
- Barredo, J.I. Major Flood Disasters in Europe: 1950–2005. Nat. Hazards 2007, 42, 125–148. [Google Scholar] [CrossRef]
- Cvetković, V.M.; Renner, R.; Aleksova, B.; Lukić, T. Geospatial and Temporal Patterns of Natural and Man-Made (Technological) Disasters (1900–2024): Insights from Different Socio-Economic and Demographic Perspectives. Appl. Sci. 2024, 14, 8129. [Google Scholar] [CrossRef]
- Groisman, P.Y.; Knight, R.W.; Karl, T.R.; Easterling, D.R.; Sun, B.; Lawrimore, J.M. Contemporary Changes of the Hydrological Cycle over the Contiguous United States: Trends Derived from in situ Observations. J. Hydrometeor. 2004, 5, 64–85. [Google Scholar] [CrossRef]
- Huntington, T.G. Evidence for Intensification of the Global Water Cycle: Review and Synthesis. J. Hydrol. 2006, 319, 83–95. [Google Scholar] [CrossRef]
- Pradhan, B. Flood Susceptible Mapping and Risk Area Delineation Using Logistic Regression, GIS, and Remote Sensing. J. Spat. Hydrol. 2009, 9, 1–18. [Google Scholar]
- Giustarini, L.; Chini, M.; Hostache, R.; Pappenberger, F.; Matgen, P. Flood Hazard Mapping Combining Hydrodynamic Modeling and Multi-Annual Remote Sensing Data. Remote Sens. 2015, 7, 14200–14226. [Google Scholar] [CrossRef]
- Gigović, L.; Pamučar, D.; Bajić, Z.; Drobnjak, S. Application of GIS-Interval Rough AHP Methodology for Flood Hazard Mapping in Urban Areas. Water 2017, 9, 360. [Google Scholar] [CrossRef]
- Balogun, A.-L.; Matori, A.-N.; Hamid-Mosaku, A.I. A Fuzzy Multi-Criteria Decision Support System for Evaluating Subsea Oil Pipeline Routing Criteria in East Malaysia. Environ. Earth Sci. 2015, 74, 4875–4884. [Google Scholar] [CrossRef]
- Tehrany, M.S.; Pradhan, B.; Jebur, M.N. Spatial Prediction of Flood Susceptible Areas Using Rule-Based Decision Tree (DT) and a Novel Ensemble Bivariate and Multivariate Statistical Model in GIS. J. Hydrol. 2013, 504, 69–79. [Google Scholar] [CrossRef]
- Mukerji, A.; Chatterjee, C.; Raghuwanshi, N.S. Flood Forecasting Using ANN, Neuro-Fuzzy, and Neuro-GA Models. J. Hydrol. Eng. 2009, 14, 647–652. [Google Scholar] [CrossRef]
- Pulvirenti, L.; Pierdicca, N.; Chini, M.; Guerriero, L. An Algorithm for Operational Flood Mapping from Synthetic Aperture Radar (SAR) Data Using Fuzzy Logic. Nat. Hazards Earth Syst. Sci. 2011, 11, 529–540. [Google Scholar] [CrossRef]
- Tehrany, M.S.; Pradhan, B.; Jebur, M.N. Flood Susceptibility Mapping Using a Novel Ensemble Weights-of-Evidence and Support Vector Machine Models in GIS. J. Hydrol. 2014, 512, 332–343. [Google Scholar] [CrossRef]
- Campolo, M.; Soldati, A.; Andreussi, P. Artificial Neural Network Approach to Flood Forecasting in the River Arno. Hydrol. Sci. J. 2003, 48, 381–398. [Google Scholar] [CrossRef]
- An Artificial Neural Network Model for Flood Simulation Using GIS: Johor River Basin, Malaysia. Available online: https://link.springer.com/article/10.1007/s12665-011-1504-z (accessed on 26 September 2024). [CrossRef]
- Tiwari, M.K.; Chatterjee, C. Uncertainty Assessment and Ensemble Flood Forecasting Using Bootstrap-Based Artificial Neural Networks (BANNs). J. Hydrol. 2010, 382, 20–33. [Google Scholar] [CrossRef]
- Rahmati, O.; Pourghasemi, H.R.; Zeinivand, H. Flood Susceptibility Mapping Using Frequency Ratio and Weights-of-Evidence Models in the Golastan Province, Iran. Geocarto Int. 2016, 31, 42–70. [Google Scholar] [CrossRef]
- Nandi, A.; Mandal, A.; Wilson, M.; Smith, D. Flood Hazard Mapping in Jamaica Using Principal Component Analysis and Logistic Regression. Environ. Earth Sci. 2016, 75, 465. [Google Scholar] [CrossRef]
- Lee, M.J.; Kang, J.; Jeon, S. Application of Frequency Ratio Model and Validation for Predictive Flooded Area Susceptibility Mapping Using GIS. In 2012 IEEE International Geoscience and Remote Sensing Symposium; IEEE: Munich, Germany, 2012; pp. 895–898. [Google Scholar] [CrossRef]
- Evaluating the Application of the Statistical Index Method in Flood Susceptibility Mapping and Its Comparison with Frequency Ratio and Logistic Regression Methods. Geomatics, Natural Hazards and Risk. Available online: https://www.tandfonline.com/doi/full/10.1080/19475705.2018.1506509 (accessed on 31 August 2024). [CrossRef]
- Cao, C.; Chen, J.; Zhang, W.; Xu, P.; Zheng, L.; Zhu, C. Geospatial Analysis of Mass-Wasting Susceptibility of Four Small Catchments in Mountainous Area of Miyun County, Beijing. Int. J. Environ. Res. Public Health 2019, 16, 2801. [Google Scholar] [CrossRef] [PubMed]
- Nohani, E.; Moharrami, M.; Sharafi, S.; Khosravi, K.; Pradhan, B.; Pham, B.T.; Lee, S.; Melesse, A. Landslide Susceptibility Mapping Using Different GIS-Based Bivariate Models. Water 2019, 11, 1402. [Google Scholar] [CrossRef]
- Zhang, T.; Han, L.; Chen, W.; Shahabi, H. Hybrid Integration Approach of Entropy with Logistic Regression and Support Vector Machine for Landslide Susceptibility Modeling. Entropy 2018, 20, 884. [Google Scholar] [CrossRef]
- Khan, H.; Shafique, M.; Khan, M.A.; Bacha, M.A.; Shah, S.U.; Calligaris, C. Landslide Susceptibility Assessment Using Frequency Ratio, a Case Study of Northern Pakistan. Egypt. J. Remote Sens. Space Sci. 2019, 22, 11–24. [Google Scholar] [CrossRef]
- Kumar Samanta, R.; Bhunia, G.; Shit, P.; Pourghasemi, H.R. Flood Susceptibility Mapping Using Geospatial Frequency Ratio Technique: A Case Study of Subarnarekha River Basin, India. Model. Earth Syst. Environ. 2018, 4, 395–408. [Google Scholar] [CrossRef]
- Pham, B.T.; Tien Bui, D.; Prakash, I.; Dholakia, M.B. Hybrid Integration of Multilayer Perceptron Neural Networks and Machine Learning Ensembles for Landslide Susceptibility Assessment at Himalayan Area (India) Using GIS. Catena 2017, 149, 52–63. [Google Scholar] [CrossRef]
- Gómez, H.; Kavzoglu, T. Assessment of Shallow Landslide Susceptibility Using Artificial Neural Networks in Jabonosa River Basin, Venezuela. Eng. Geol. 2005, 78, 11–27. [Google Scholar] [CrossRef]
- Gaume, E.; Borga, M. Post-Flood Field Investigations in Upland Catchments after Major Flash Floods: Proposal of a Methodology and Illustrations. J. Flood Risk Manag. 2008, 1(4), 175–189. [Google Scholar] [CrossRef]
- Aleksova, B.; Milevski, I.; Mijalov, R.; Marković, S.B.; Cvetković, V.M.; Lukić, T. Assessing Risk-Prone Areas in the Kratovska Reka Catchment (North Macedonia) by Integrating Advanced Geospatial Analytics and Flash Flood Potential Index. Open Geosci. 2024, 16, 20220684. [Google Scholar] [CrossRef]
- Milevski, I. Natural Hazards in the Republic of Macedonia with Special Emphasis on Flood and Earthquake in Skopje. Geogr. Rev. 2017, 50(5–22), 2016.
- Popa, M.C.; Peptenatu, D.; Draghici, C.; Diaconu, D.C. Flood Hazard Mapping Using the Flood and Flash-Flood Potential Index in the Buzău River Catchment, Romania. Water 2019, 11, 2116. [Google Scholar] [CrossRef]
- Marchi, L.; Borga, M.; Preciso, E.; Gaume, E. Characterisation of Selected Extreme Flash Floods in Europe and Implications for Flood Risk Management. J. Hydrol. 2010, 394(1–2), 118–133. [CrossRef]
- Costache, R.D.; Pham, Q.B.; Sharifi, E.; Khoi, D.N. Flash-Flood Susceptibility Assessment Using Multi-Criteria Decision Making and Machine Learning Supported by Remote Sensing and GIS Techniques. Remote Sens. 2019, 12(1), 106. [Google Scholar] [CrossRef]
- Georgakakos, K.P. Analytical Results for Operational Flash Flood Guidance. J. Hydrol. 2006, 317, 81–103. [Google Scholar] [CrossRef]
- Ntelekos, A.A.; Georgakakos, K.P.; Krajewski, W.F. On the Uncertainties of Flash Flood Guidance: Toward Probabilistic Forecasting of Flash Floods. J. Hydrometeorol. 2006, 7, 896–915. [Google Scholar] [CrossRef]
- Petroselli, A.; Vojtek, M.; Vojteková, J. Flood Mapping in Small Ungauged Basins: A Comparison of Different Approaches for Two Case Studies in Slovakia. Hydrol. Res. 2019, 50, 379–392. [Google Scholar] [CrossRef]
- Costache, R.; Bui, D.T. Spatial Prediction of Flood Potential Using New Ensembles of Bivariate Statistics and Artificial Intelligence: A Case Study at the Putna River Catchment of Romania. Sci. Total Environ. 2019, 691, 1098–1118. [Google Scholar] [CrossRef]
- Bui, D.T.; Hoang, N.D.; Martínez-Álvarez, F.; Ngo, P.T.T.; Hoa, P.V.; Pham, T.D.; Samui, P.; Costache, R. A Novel Deep Learning Neural Network Approach for Predicting Flash Flood Susceptibility: A Case Study at a High Frequency Tropical Storm Area. Sci. Total Environ. 2020, 701, 134413. [Google Scholar] [CrossRef]
- Aktar, M.A.; Shohani, K.; Hasan, M.N.; Hasan, M.K. Flood Vulnerability Assessment by Flood Vulnerability Index (FVI) Method: A Study on Sirajganj Sadar Upazila. Int. J. Disaster Risk Manag. 2021, 3(1), 1–14. [Google Scholar] [CrossRef]
- Cvetković, V.; Martinović, J. Innovative Solutions for Flood Risk Management. Int. J. Disaster Risk Manag. 2020, 2(2), 71–100. [Google Scholar] [CrossRef]
- Hossen, M.N.; Nawaz, S.; Kabir, M.H. Flood Research in Bangladesh and Future Direction: An Insight from the Last Three Decades. Int. J. Disaster Risk Manag. 2022, 4(1), 15–41. [Google Scholar] [CrossRef]
- Dragičević, S.; Filipović, D. Natural Conditions and Disasters in Planning to Protect Space. 2nd ed.; University of Belgrade - Geography Faculty: Belgrade, Serbia, 2016. (In Serbian).
- Gavrilović, L.J. Floods in SR Serbia in the 20th Century—Causes and Consequences. Special Issue SGD, no. 52; Serbian Geographical Society: Belgrade, Serbia, 1981. (In Serbian).
- Petrović, A. Flash Floods in Serbia. Special Editions SGD, Book 73; Serbian Geographical Society: Belgrade, Serbia, 2021. ISBN 978-86-82751-62-5. (In Serbian). ISBN 978-86-82751-62-5.
- Jovanović, D. Application of the Flash Flood Potential Index in Torrential Floods Risk Assessment (FFPI): A Case Study of Svilajnac Municipality. Proc. Fac. Geogr., Univ. Belgrade 2023, 71, 65–78. [Google Scholar] [CrossRef]
- Trobec, T. Spatio-Temporal Distribution of Flash Floods in Slovenia. Dela 2016, 46, 5–20. [Google Scholar] [CrossRef]
- Durlević, U.; Novković, I.; Lukić, T.; Valjarević, A.; Samardžić, I.; Krstić, F.; et al. Multi-Hazard Susceptibility Assessment: A Case Study—Municipality of Štrpce (Southern Serbia). Open Geosci. 2021, 13(1), 1414–1431. [Google Scholar] [CrossRef]
- Dragičević, S.; Kostadinov, S.; Novković, I.; Momirović, N.; Langović, M.; Stefanović, T., et al. Assessment of Soil Erosion and Torrential Flood Q9 Susceptibility: Case Study—Timok River Basin, Serbia. In The Lower Danube River, Hydro-Environmental Issues and Sustainability; Springer: Berlin, Germany, 2022; Chapter 12. [CrossRef]
- Lazarević, K.; Todosijević, M.; Vulević, T.; Polovina, S.; Momirović, N.; Caković, M. Determination of Flash Flood Hazard Areas in the Likodra Watershed. Water 2023, 15(15), 2698. [Google Scholar] [CrossRef]
- Krvavica, N.; Šiljeg, A.; Horvat, B.; Panđa, L. Pluvial Flash Flood Hazard and Risk Mapping in Croatia: Case Study in the Gospić Catchment. Sustainability 2023, 15(2), 1197. [Google Scholar] [CrossRef]
- Milevski, I.; Dragicević, S.; Radevski, I. GIS and Remote Sensing Based Natural Hazard Modelling of Kriva River Catchment, Republic of Macedonia. Zeitschrift für Geomorphologie Supplementary Issues 2017, 61(2), 213–228. [CrossRef]
- Aleksova, B.; Lukić, T.; Milevski, I.; Spalević, V.; Marković, S.B. Modelling Water Erosion and Mass Movements (Wet) by Using GIS-Based Multi-Hazard Susceptibility Assessment Approaches: A Case Study—Kratovska Reka Catchment (North Macedonia). Atmosphere 2023, 14, 1139. [Google Scholar] [CrossRef]
- Aleksova, B.; Lukić, T.; Milevski, I.; Puhar, D.; Marković, S.B. Preliminary Assessment of Geohazards’ Impacts on Geodiversity in the Kratovska Reka Catchment (North Macedonia). Geosciences 2024a, 14, 62. [Google Scholar] [CrossRef]
- Aleksova, B.; Milevski, I.; Dragićević, S.; Lukić, T. GIS-Based Integrated Multi-Hazard Vulnerability Assessment in Makedonska Kamenica Municipality, North Macedonia. Atmosphere 2024c, 15, 774. [Google Scholar] [CrossRef]
- Shawaqfah, M.; Almomani, F.; Khatatbeh, A.A. Mapping Flash Flood Q10 Potential and Risk Level Using GIS Techniques and the Flash Flood Potential Index (FFPI) in Amman Zarqa Basin of Jordan. Jordanian J. Eng. Chem. Ind. 2020, 3(3). [CrossRef]
- Milevski, I. Digital Model of the Mean Annual Temperature and Precipitation of the Republic of Macedonia. Geogr. Rev. 2015, 48, 33–38. [Google Scholar]
- Federal Geological Survey of SFRY. Interpreter of the Basic Geological Map of Socialist Federal Republic of Yugoslavia 100k (Sheet 25 for SR Macedonia); Professional Fund of the Federal Geological Survey of SFRY: Belgrade, Yugoslavia, 1963–1985. (In Macedonian).
- Djordjević, M.; Trendafilov, A.; Jelić, D.; Georgievski, S.; Popovski, A. Erosion Map of the Republic of Macedonia—Textual Part; Water Development Institute: Skopje, Macedonia, 1993. (In Macedonian).
- Jovanovski, M.; Milevski, I.; Papić, J.B.; Peševski, I.; Markoski, B. Landslides in the Republic of Macedonia Triggered by Extreme Events in 2010. In Geomorphological Impacts of Extreme Weather: Case Studies from Central and Eastern Europe; Denes, L., Ed.; Springer: Berlin, Germany, 2013; pp. 265–280.
- Milevski, I.; Radevski, I.; Dimitrovska, O.; Drogreška, K.; Gorin, S. Study for the Spatial Plan of the Republic of North Macedonia 2021–2040: Natural Characteristics. Ministry of Environment and Spatial Planning: Skopje, North Macedonia, 2023. Tech. No. A90123.
- Minea, G. Assessment of the Flash Flood Potential of Bâsca River Catchment (Romania) Based on Physiographic Factors. Cent. Eur. J. Geosci. 2013, 5(3), 344–353. [Google Scholar] [CrossRef]
- Costache, R.; Pravalie, R.; Mitof, I.; Popescu, C. Flood Vulnerability Assessment in the Low Sector of Saratel Catchment. Case Study: Joseni Village. Carpathian J. Earth Environ. Sci. 2015, 10(1), 161–169.
- Tincu, R.; Lazar, G.; Lazar, I. Modified Flash Flood Potential Index in Order to Estimate Areas with Predisposition to Water Accumulation. Open Geosci. 2018, 10, 593–606. [Google Scholar] [CrossRef]
- Petrović, A.; Kostadinov, S.; Dragićević, S. The Inventory and Characterization of Torrential Flood Phenomenon in Serbia. Pol. J. Environ. Stud. 2014, 23, 823–830. [Google Scholar]
- Petrović, A.; Dragićević, S.; Radić, B.; Milanović Pešić, A. Historical Torrential Flood Events in the Kolubara River Basin. Nat. Hazards 2015, 79, 537–547. [Google Scholar] [CrossRef]
- Smith, G. Flash Flood Potential: Determining the Hydrologic Response of FFMP Basins to Heavy Rain by Analyzing Their Physiographic Characteristics. Available online: https://www.cbrfc.noaa.gov/papers/ffp_wpap.pdf (accessed on 29 May 2024).
- Pravalie, R.; Costache, R. The Analysis of the Susceptibility of the Flash-Floods’ Genesis in the Area of the Hydrographical Basin of Basca Chiojdului River. Forum Geogr. 2014, 13, 39–49. [Google Scholar] [CrossRef]
- Ristić, R.; Radić, B.; Vasiljević, N. Characteristics of Maximal Discharges on Torrential Watersheds in Serbia. Bull. Serbian Geogr. Soc. 2009, 89, 161–189. [Google Scholar]
- Minea, G.; Iliescu, M.; Dedu, F. Temporal Rainfall Properties at Events Scale in the Curvature Subcarpathians (Romania). Forum Geografic 2016, 15, 115–123. [Google Scholar] [CrossRef]
- Kostadinov, S.; Dragićević, S.; Stefanović, T.; et al. Torrential Flood Prevention in the Kolubara River Basin. J. Mt. Sci. 2017, 14, 2230–2245. [Google Scholar] [CrossRef]
- Copernicus. Corine Land Cover 2018: Copernicus Land Monitoring Service; Technical Report; Office for Official Publications of the European Communities: Luxembourg, 2016.
- United States Geological Survey. Landsat 8 Program Taken by Earth Explorer. United States Geological Survey, 2024. Available online: https://earthexplorer.usgs.gov (accessed on 29 May 2024).
- Yue, J.; Fu, Y.; Guo, W.; Feng, H.; Qiao, H. Estimating Fractional Coverage of Crop, Crop Residue, and Bare Soil Using Shortwave Infrared Angle Index and Sentinel-2 MSI. Int. J. Remote Sensing 2022, 43, 1253–1273. [Google Scholar] [CrossRef]
- Fick, S.E.; Hijmans, R.J. WorldClim2: New 1-km Spatial Resolution Climate Surfaces for Global Land Areas. Int. J. Climatol. 2017, 37, 4302–4315. [Google Scholar] [CrossRef]
- Fox, D.; Bryan, R.B.; Price, A.G. The Influence of Slope Gradient on Infiltration Rate for Interrill Conditions. Geoderma 1997, 80, 181–194. [Google Scholar] [CrossRef]
- Crisis Management Center of North Macedonia. (accessed on December 5, 2024) www.cuk.gov.mk.
- Gjeshovska, V.; Taseski, G.; Ilioski, B. Heavy Rainfall in the R.N. Macedonia. Sci. J. Civil Eng. 2021, 10(2), 19–30. [CrossRef]
- Milevski, I.; Dragićević, S.; Georgievska, A. GIS and RS-Based Modelling of Potential Natural Hazard Areas in Pehchevo Municipality, Republic of Macedonia. J. Geogr. Inst. Jovan Cvijić SASA 2012, 63, 95–107. [Google Scholar] [CrossRef]
- Ministry of Environment and Spatial Planning. Fourth National Climate Change Action Plan; Ministry of Environment and Spatial Planning, GEF, UNDP: Skopje, North Macedonia, 2023. (in Macedonian).
- Popovska, C.; Gjeshovska, V.; Ivanoski, D. Floods in Upper Vardar River Basin, May 2006. Proceedings of the International Conference on Water Observation and Information System for Decision Support (BALWOIS), Ohrid, Macedonia, 2006. [CrossRef]
- Popovska, C.; Gjeshovska, V. Water Balance Model for Vulnerability Assessment of Water Resources in Strumica River Basin. Irrigation & Drainage Systems Engineering 2014, 3(3). [CrossRef]
- Popovska, C.; Jovanovski, M.; Sekovski, D. Build Back Better Approach to Recovery of Flood-Damaged Transport and Water Infrastructure. In Proceedings of the Conference: Water Management and Hydraulic Engineering, Skopje, North Macedonia, 2019.
- Hydrometeorological Service of the Republic of North Macedonia (UHMR). Annual Report, 2023.
- Djurdjevic, V. Report on Climate Change Projections and Changes in Climate Extremes for the Republic of North Macedonia. In Macedonia’s Fourth National Communication and Third Biennial Update Report on Climate Change under the UNFCCC, Global Environmental Facility (GEF), and the United Nations Development Programme (UNDP); Ref. number IC 44/2019, 2020.
- Lukić, T.; Gavrilov, M.B.; Marković, S.; et al. Classification of Natural Disasters Between the Legislation and Application: Experience of the Republic of Serbia. Acta Geographica Slovenica 2013, 53, 149–164. [Google Scholar] [CrossRef]
- International Commission for the Protection of the Danube River - ICPDR. Slovenia’s Flood Forecasting Success: Minimizing Casualties Through Effective Warning Systems. Available online: www.icpdr.org (accessed on date).
- EU Delegation to Bosnia and Herzegovina. Support to Flood Protection and Flood Risk Management; Annual Action Programme for Bosnia and Herzegovina for the Year 2016, 2016.
Figure 1.
Physical geographical map of North Macedonia A), and its location in Europe B).
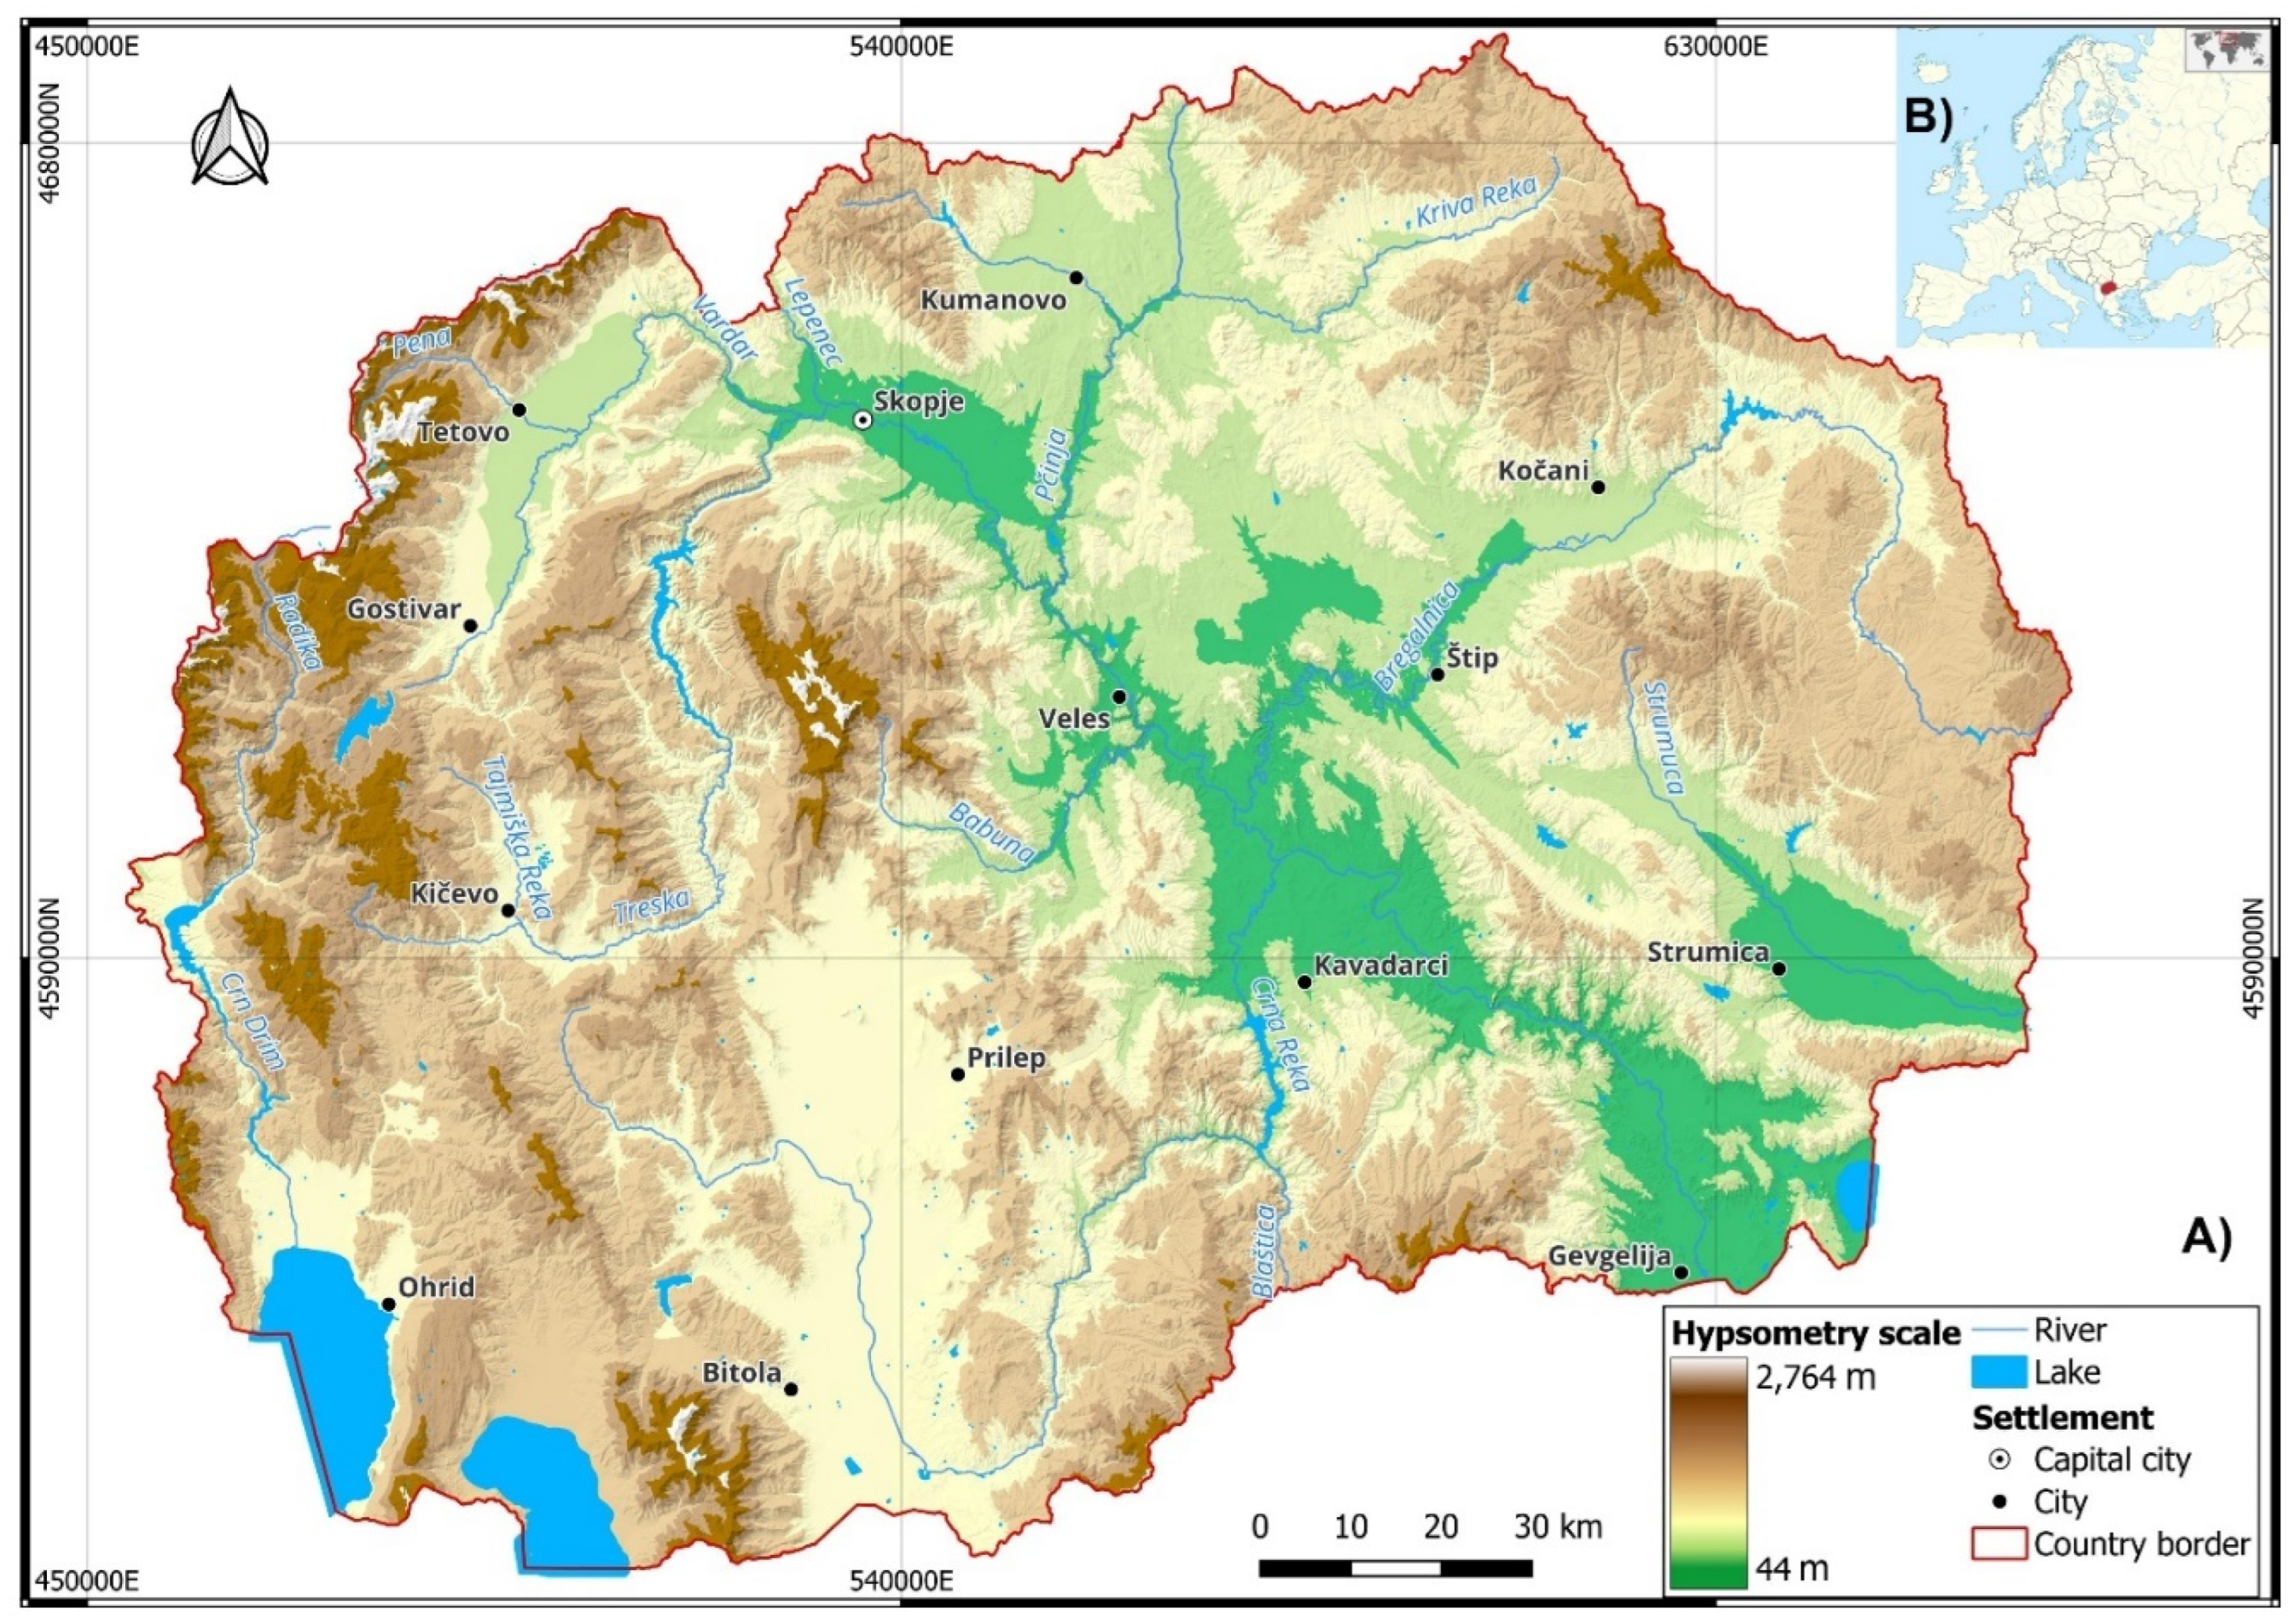
Figure 2.
The hydrographic network of North Macedonia.
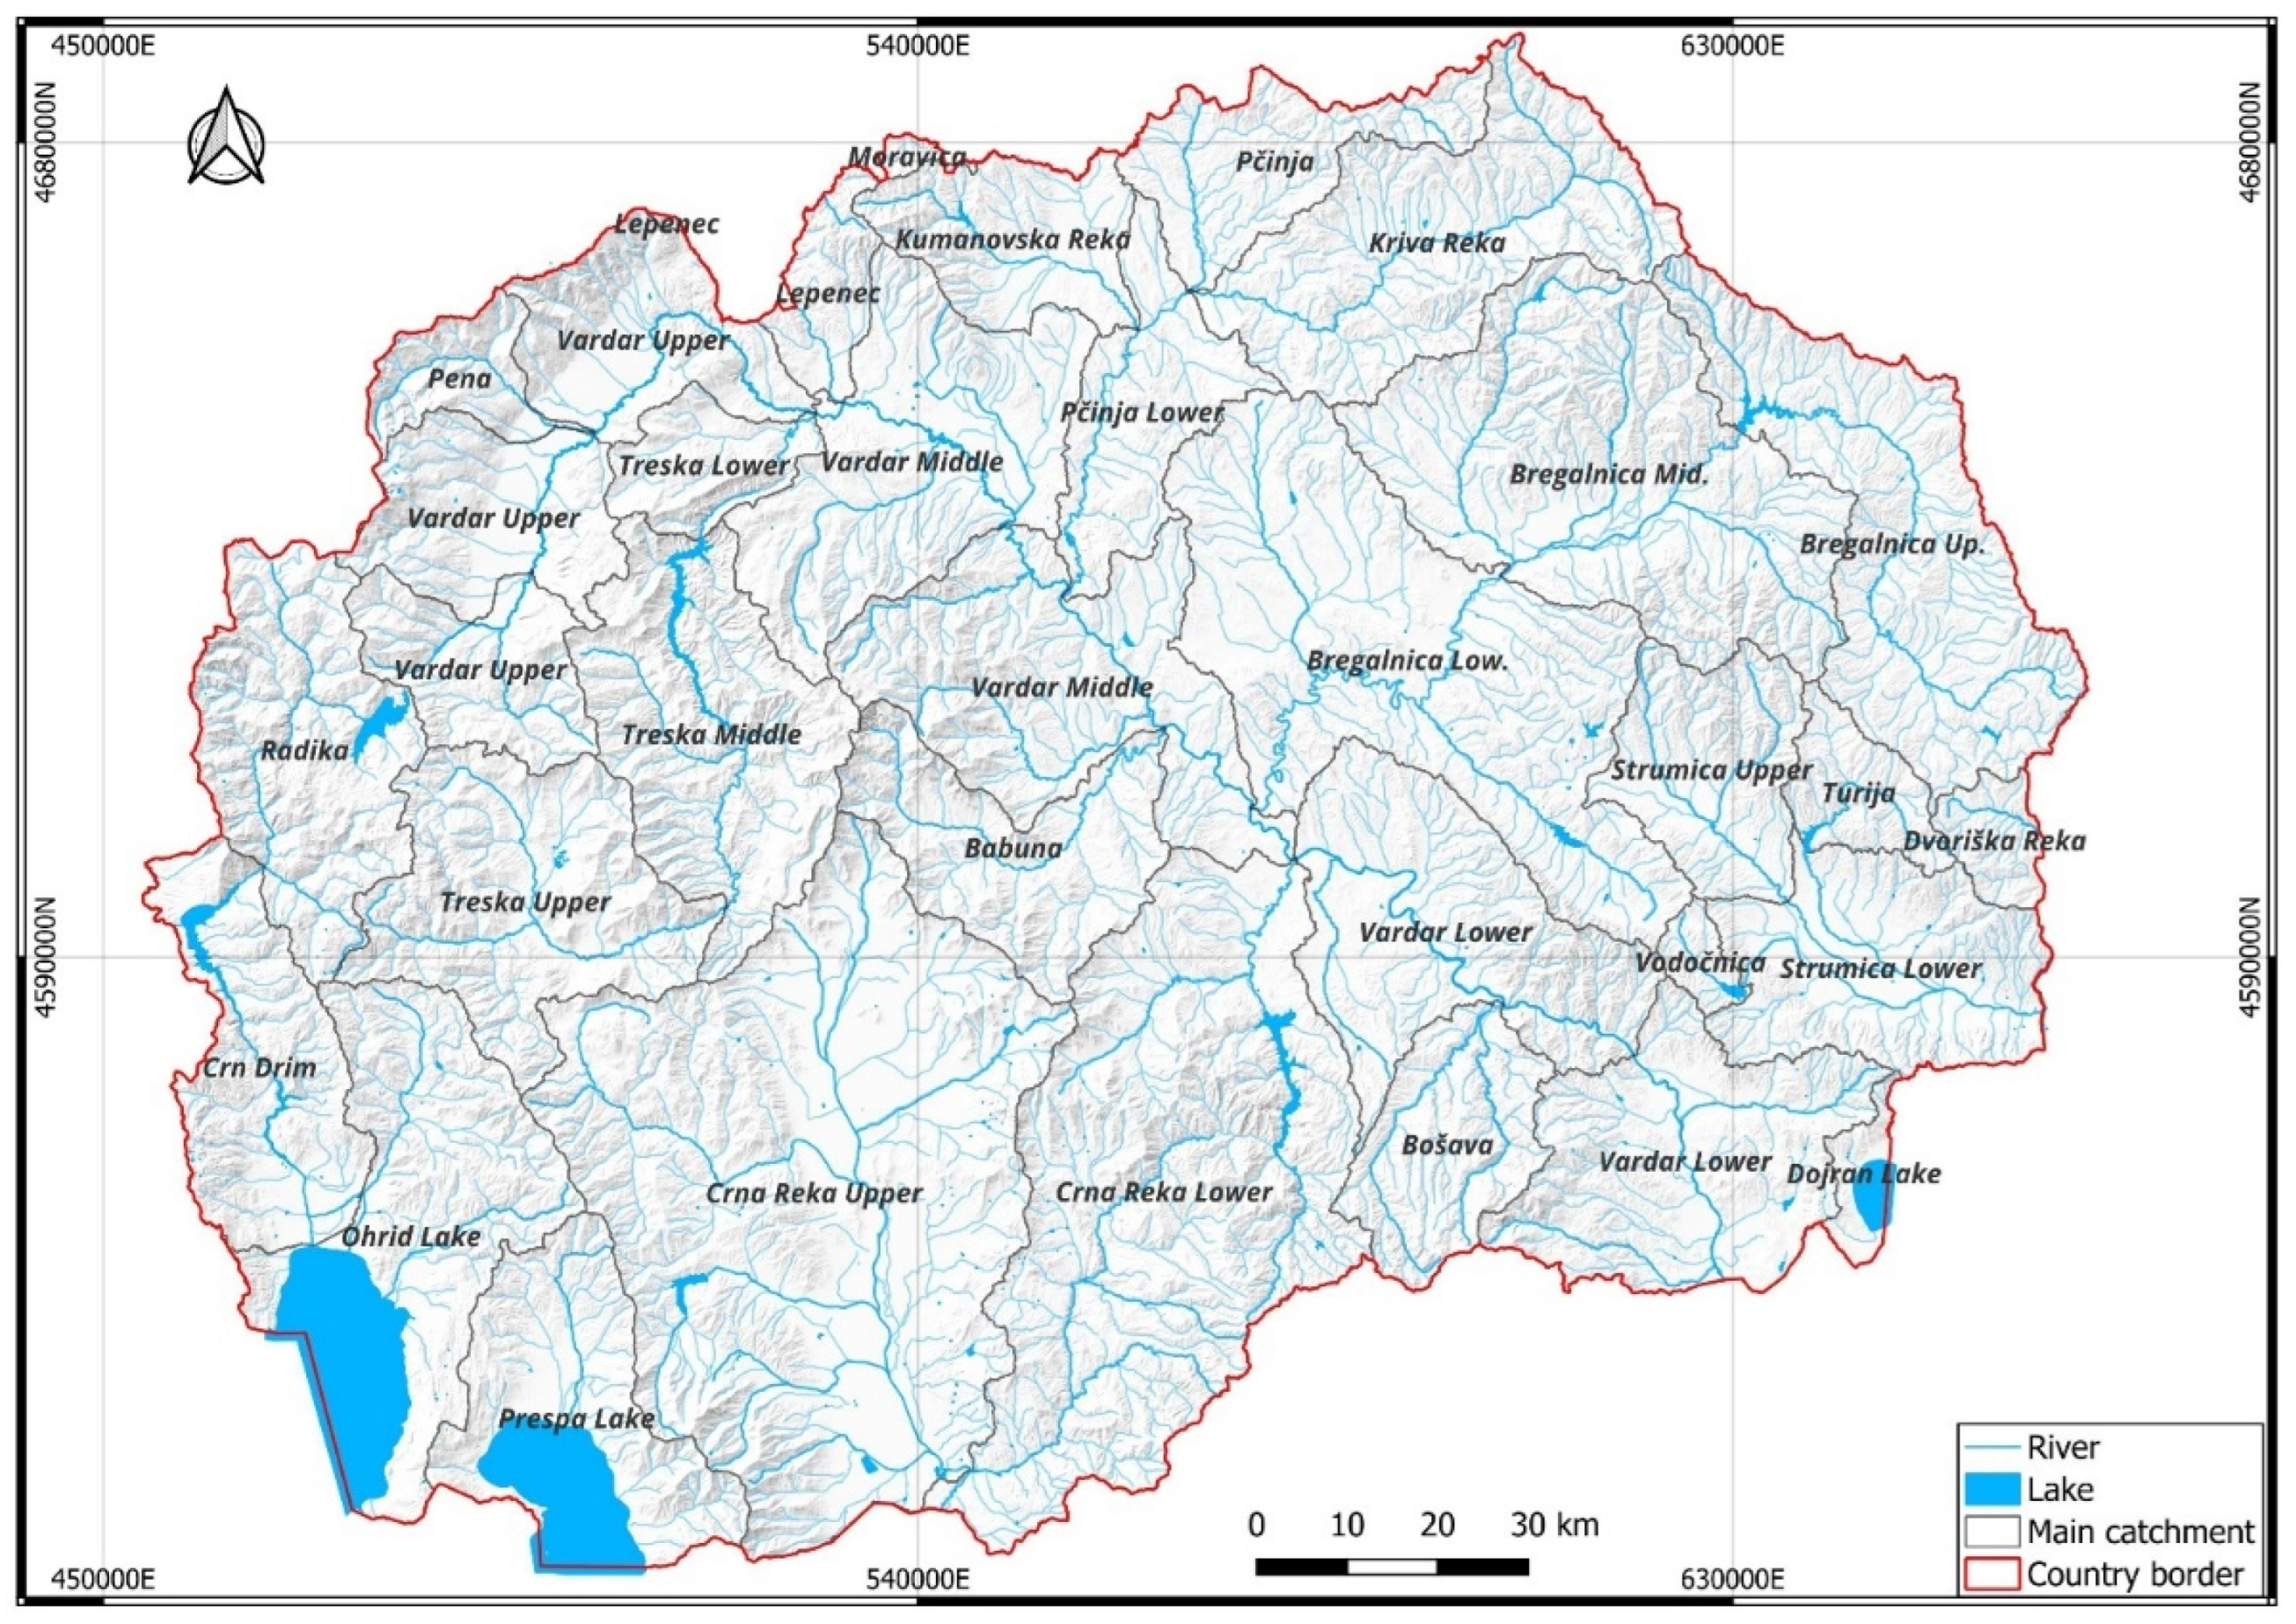
Figure 3.
Overall slope index component of the FFPI.
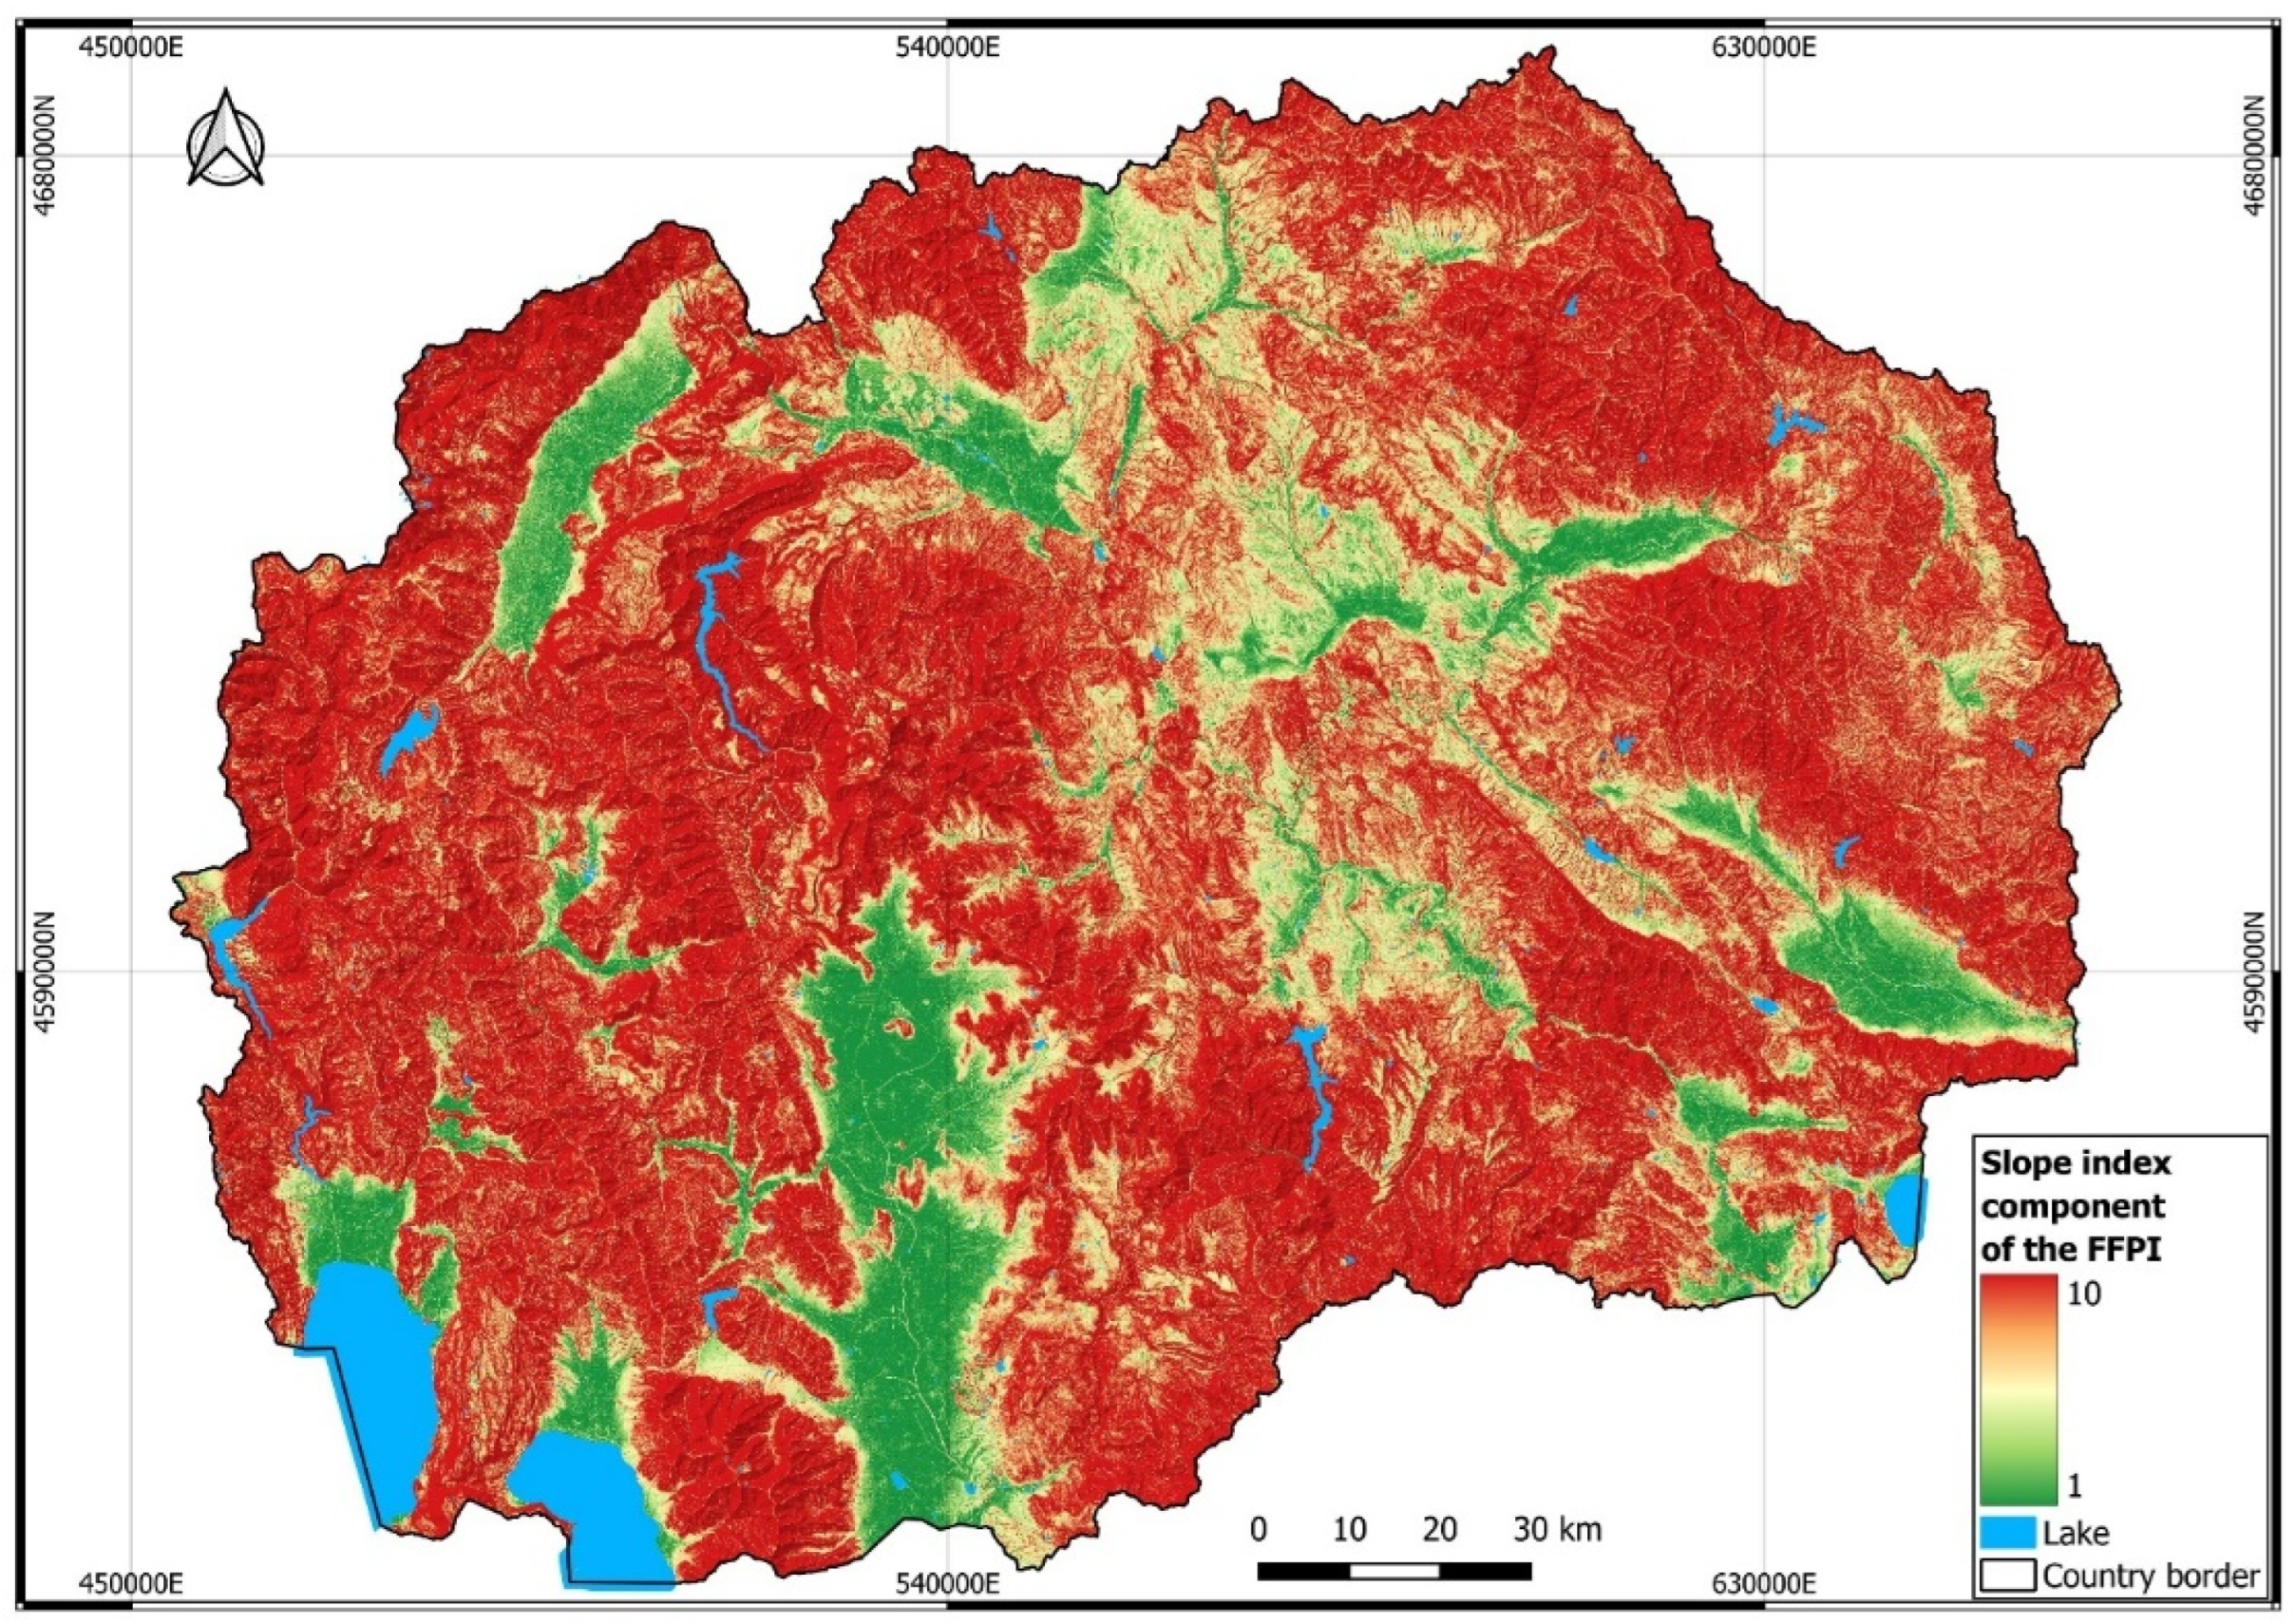
Figure 4.
Overall lithology index component of the FFPI.
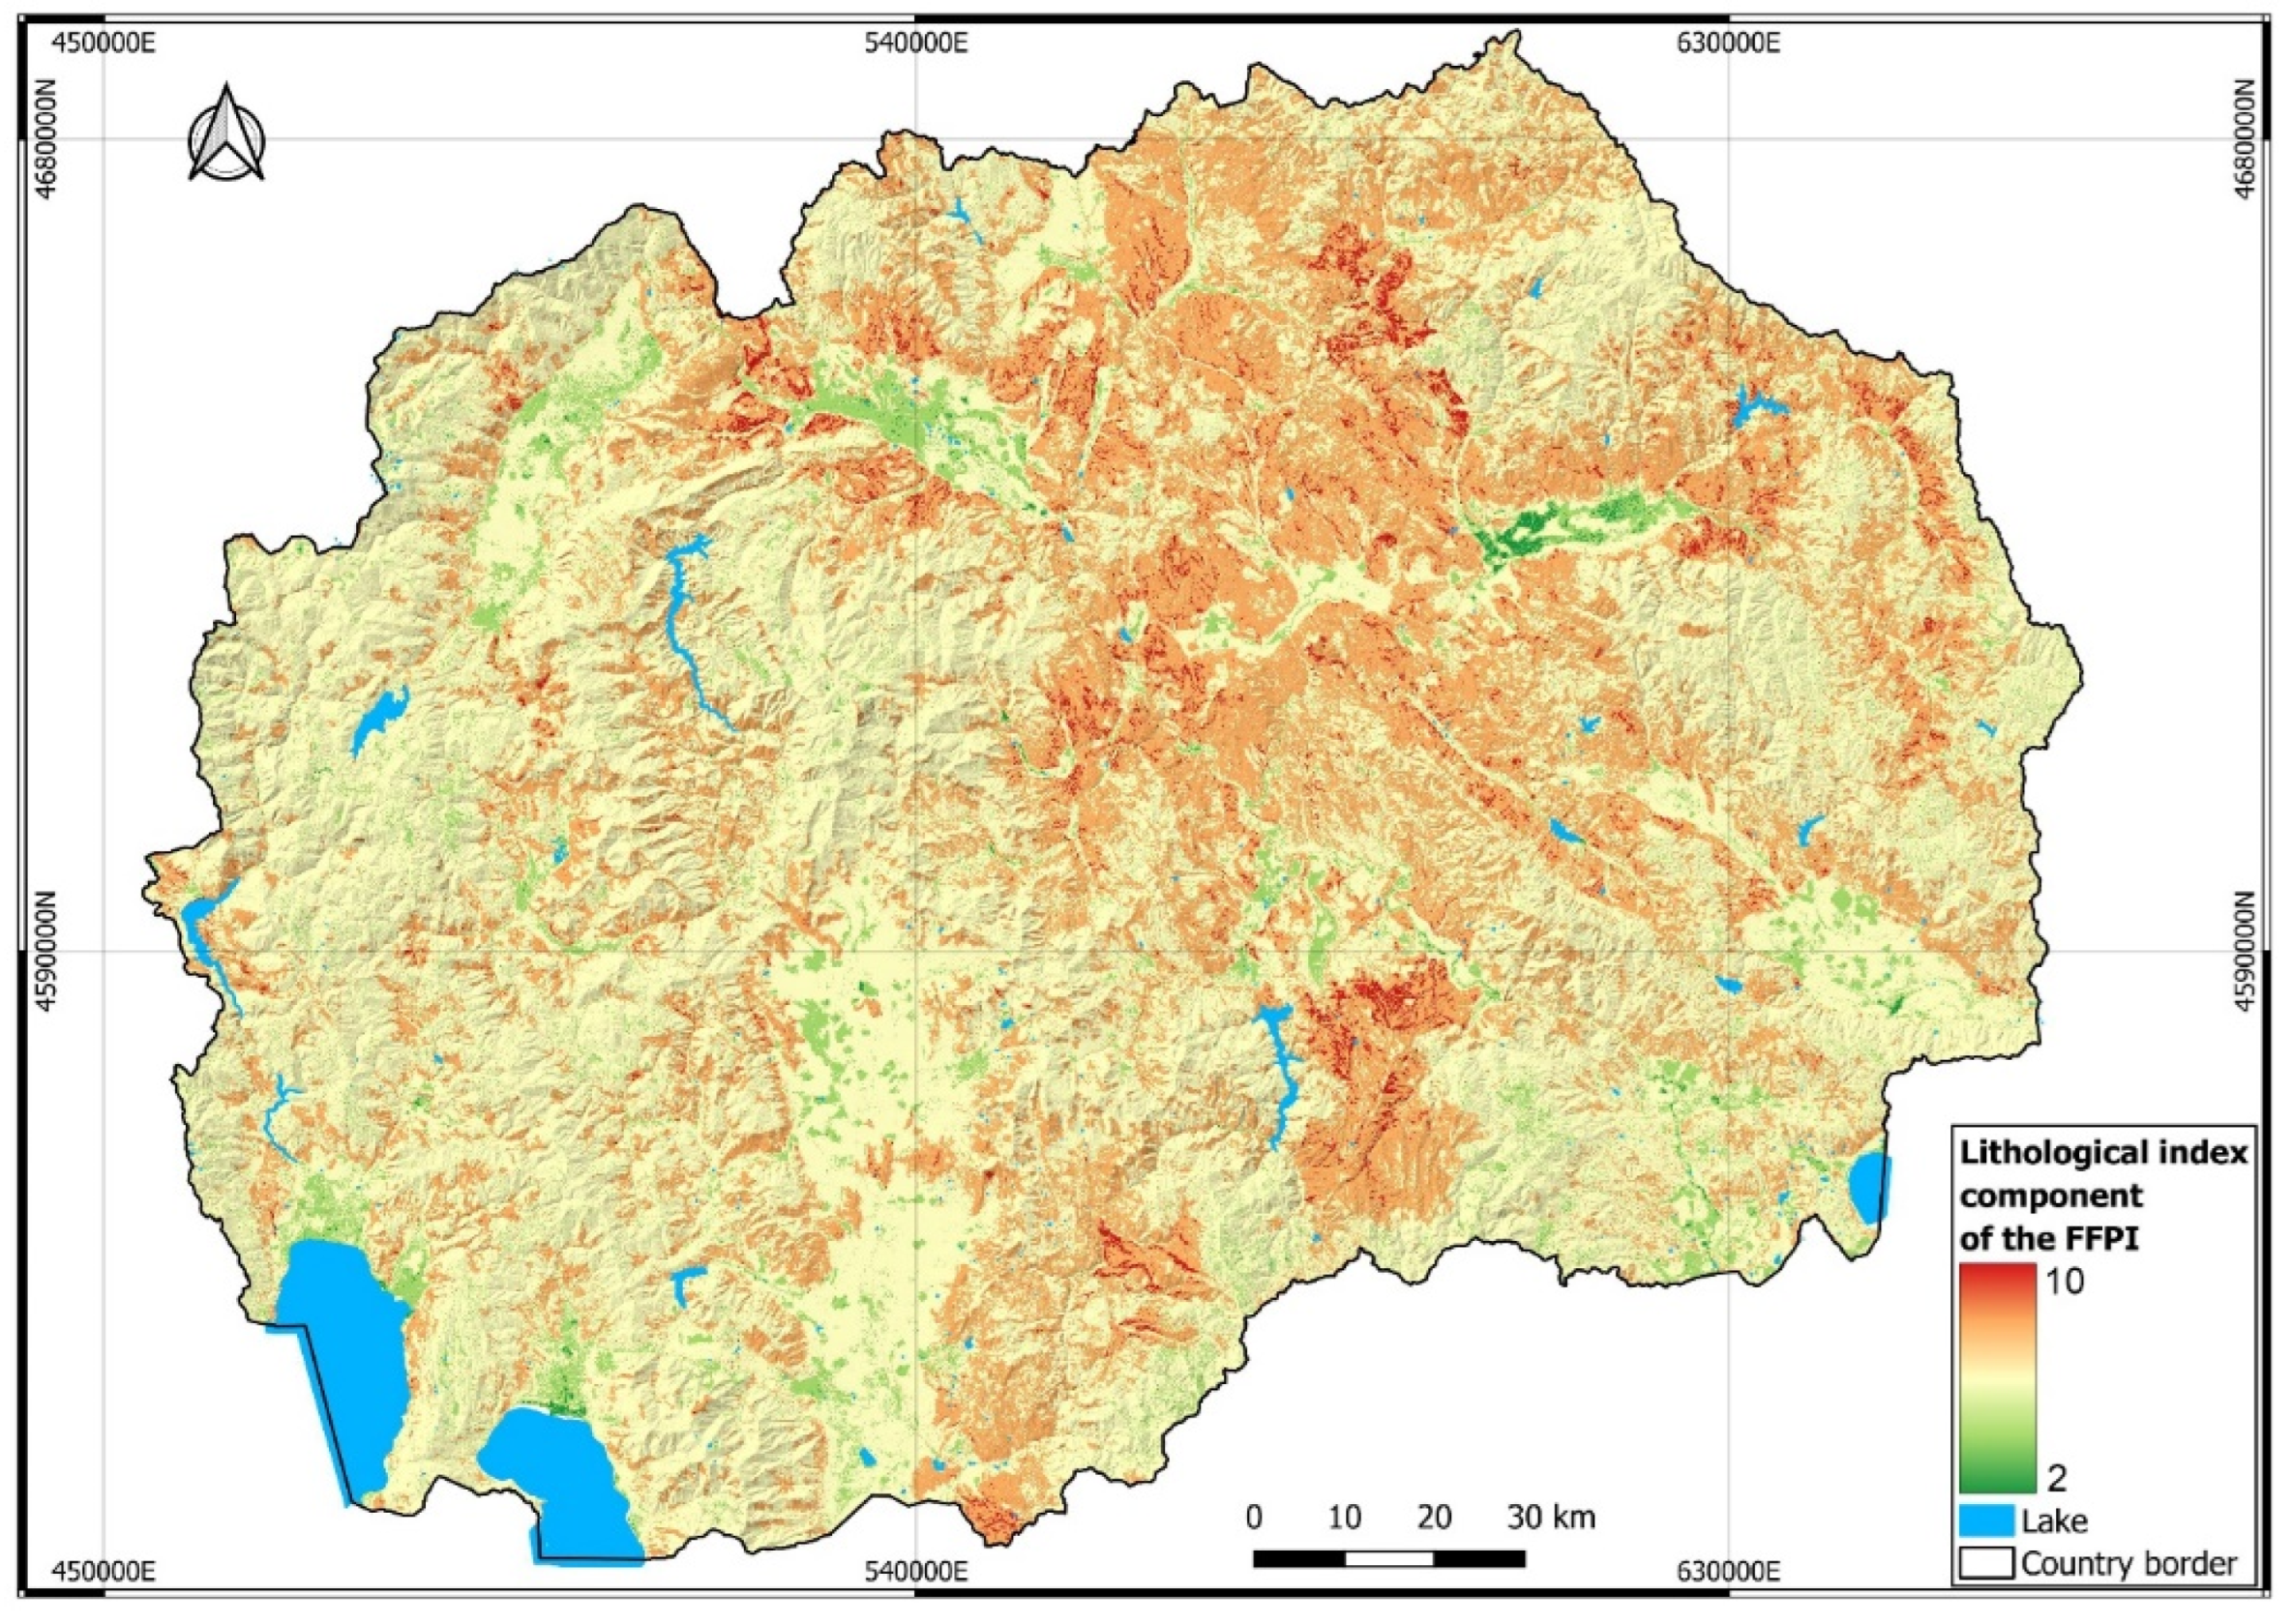
Figure 5.
Overall land use index component of the FFPI.
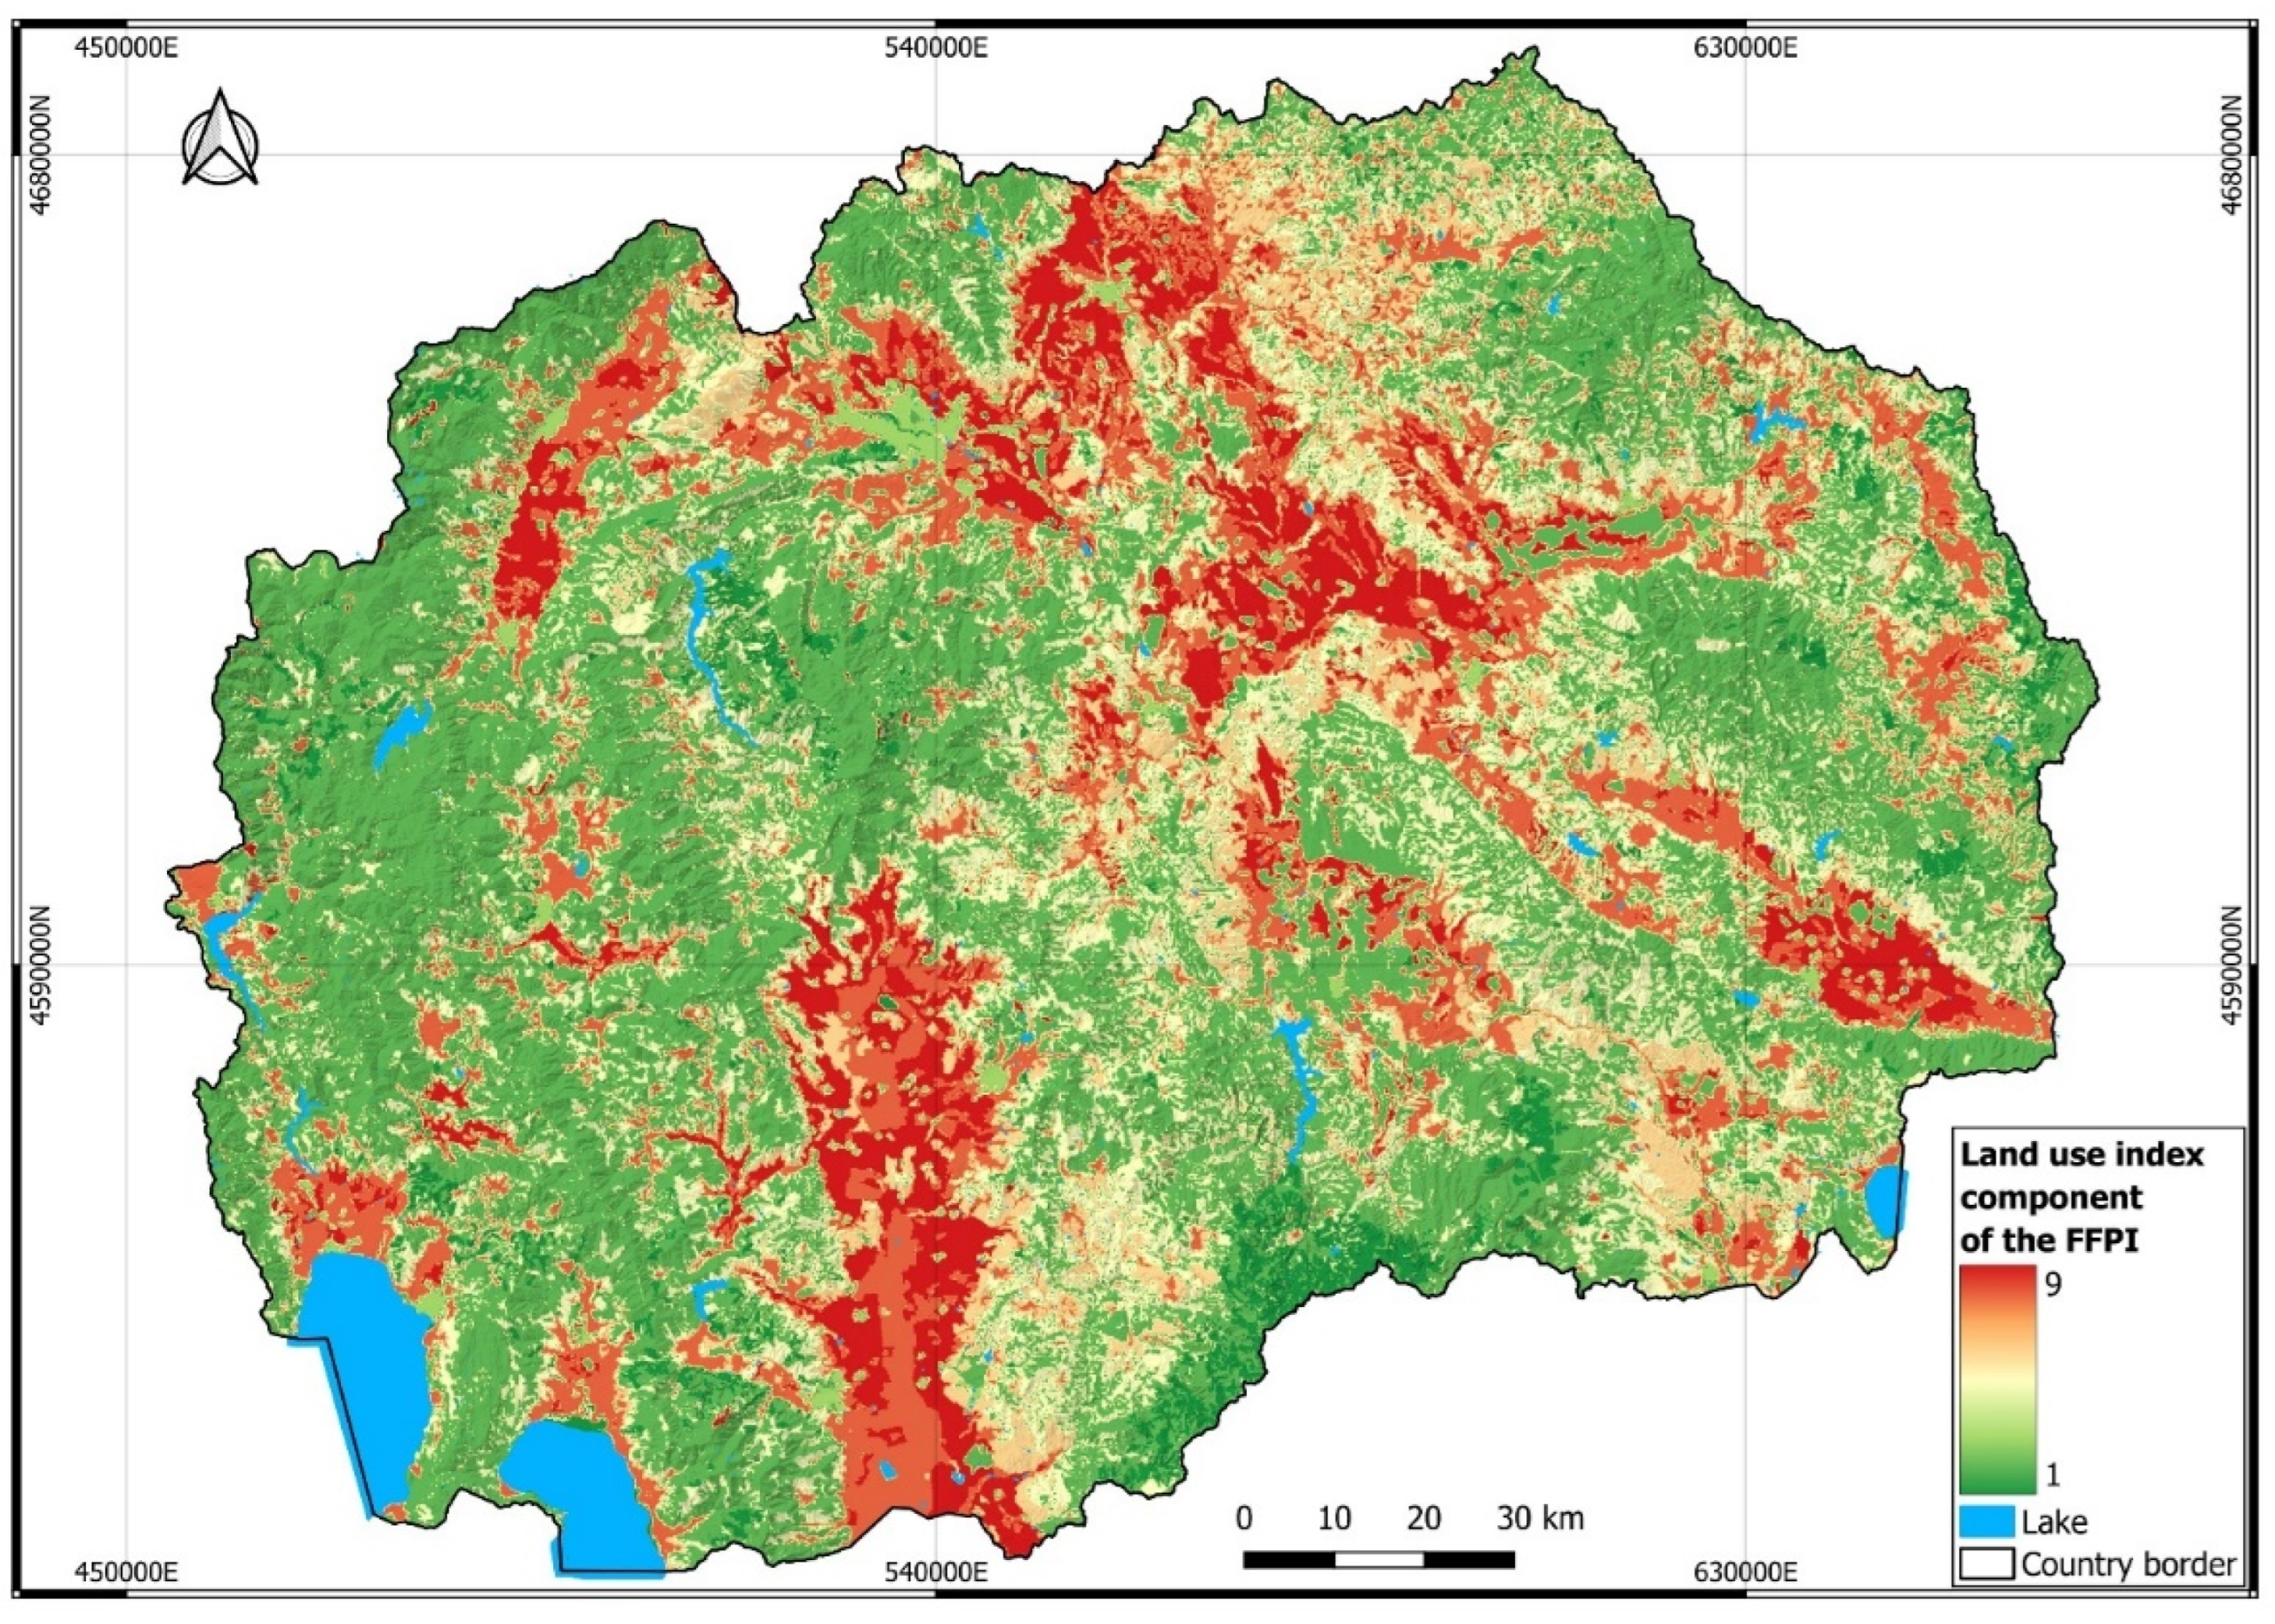
Figure 6.
Overall vegetation index component of the FFPI.
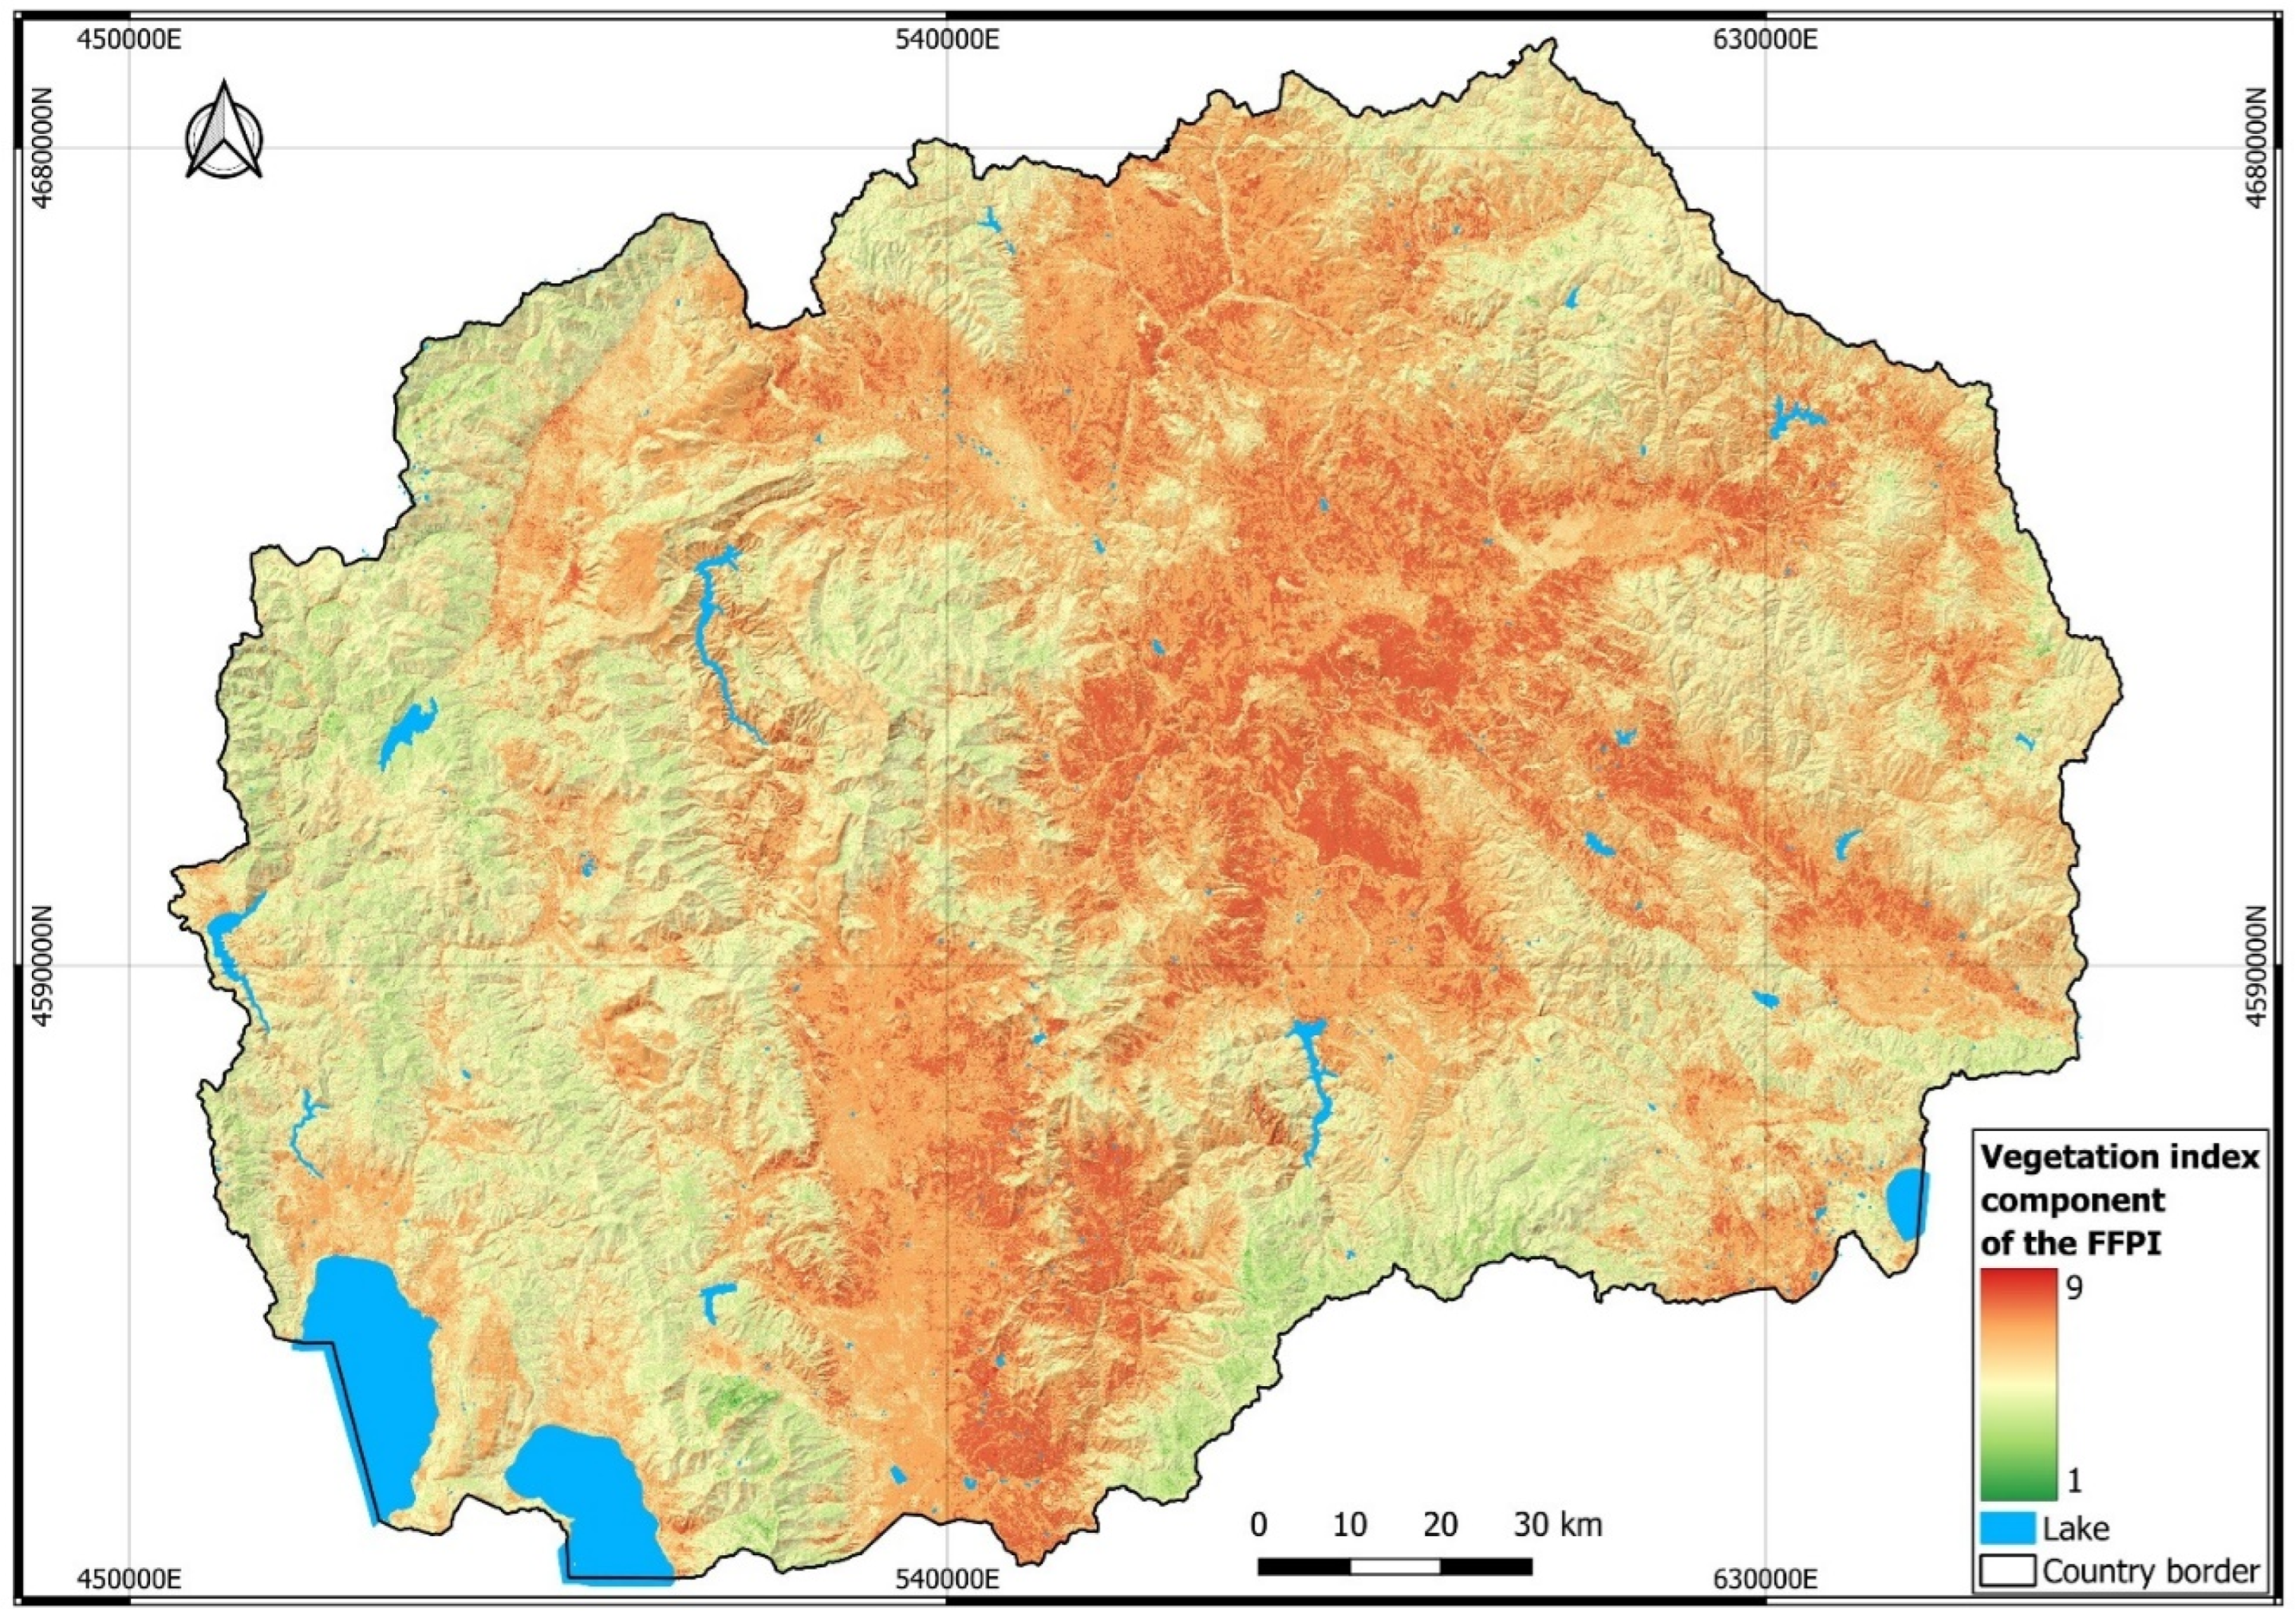
Figure 7.
FFPI Model for North Macedonia.
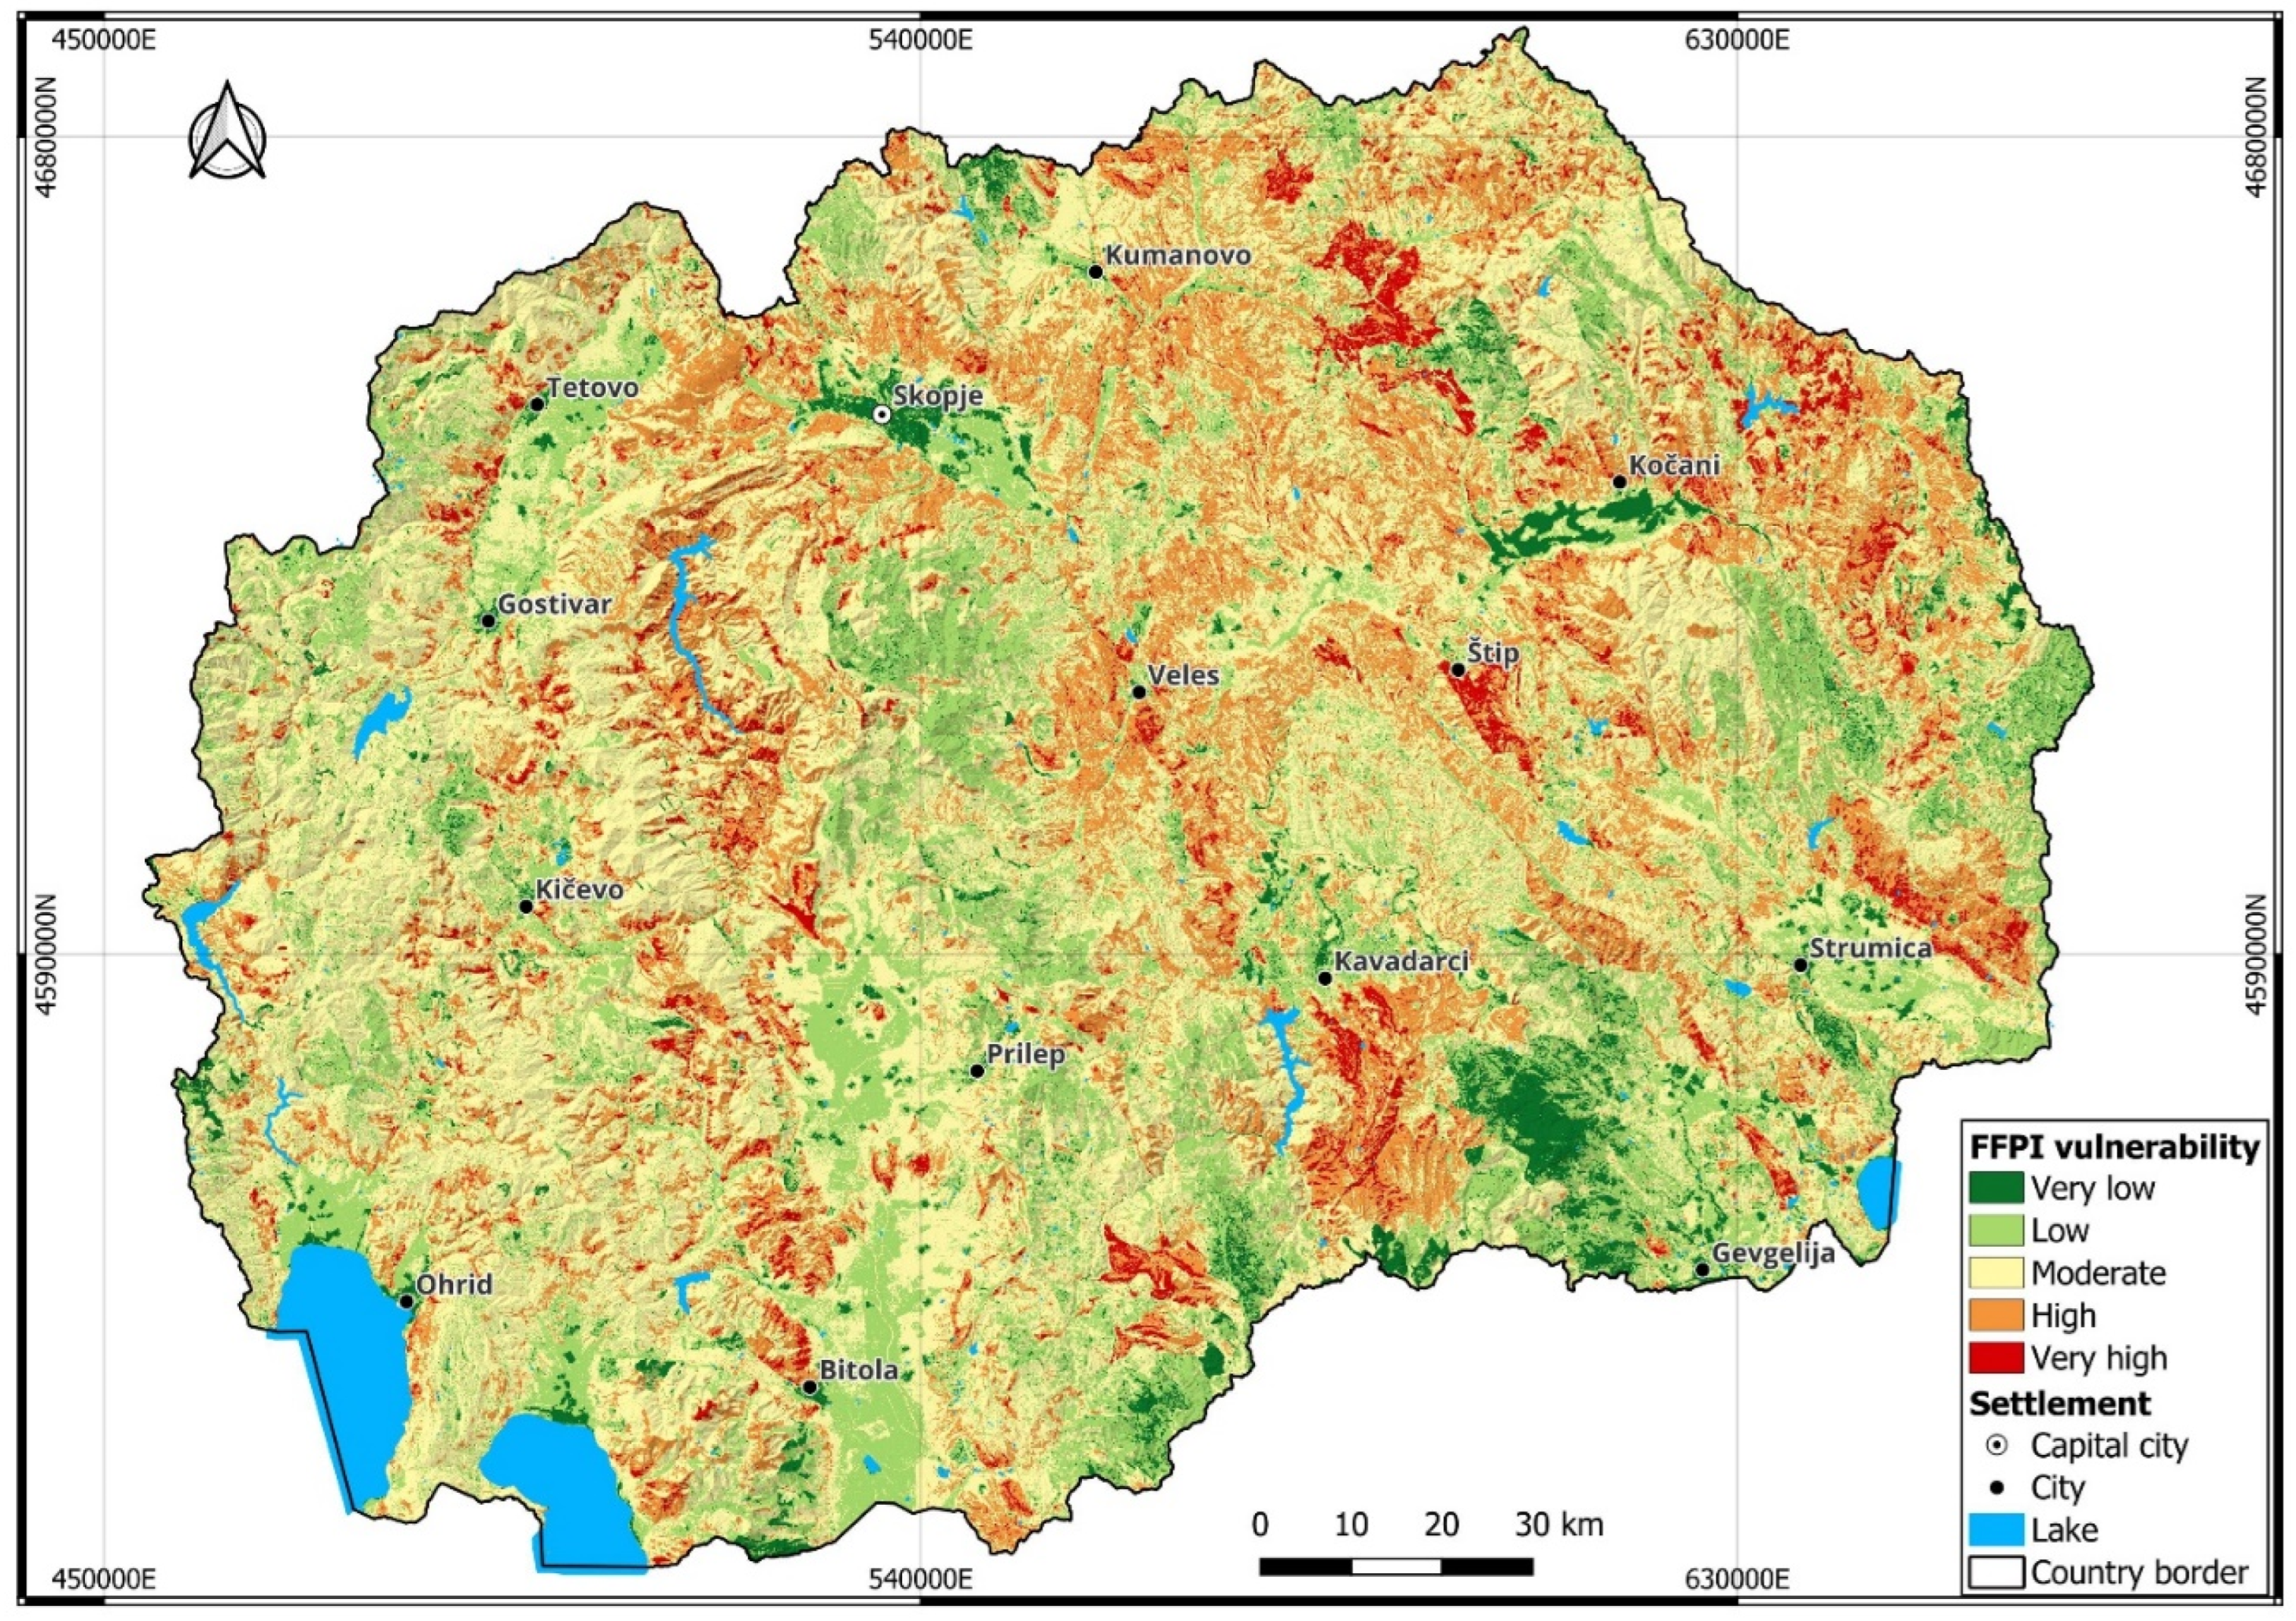
Figure 8.
Small catchments-based mean FFPI values indicating FFPI susceptibility catchments in North Macedonia.
Figure 8.
Small catchments-based mean FFPI values indicating FFPI susceptibility catchments in North Macedonia.
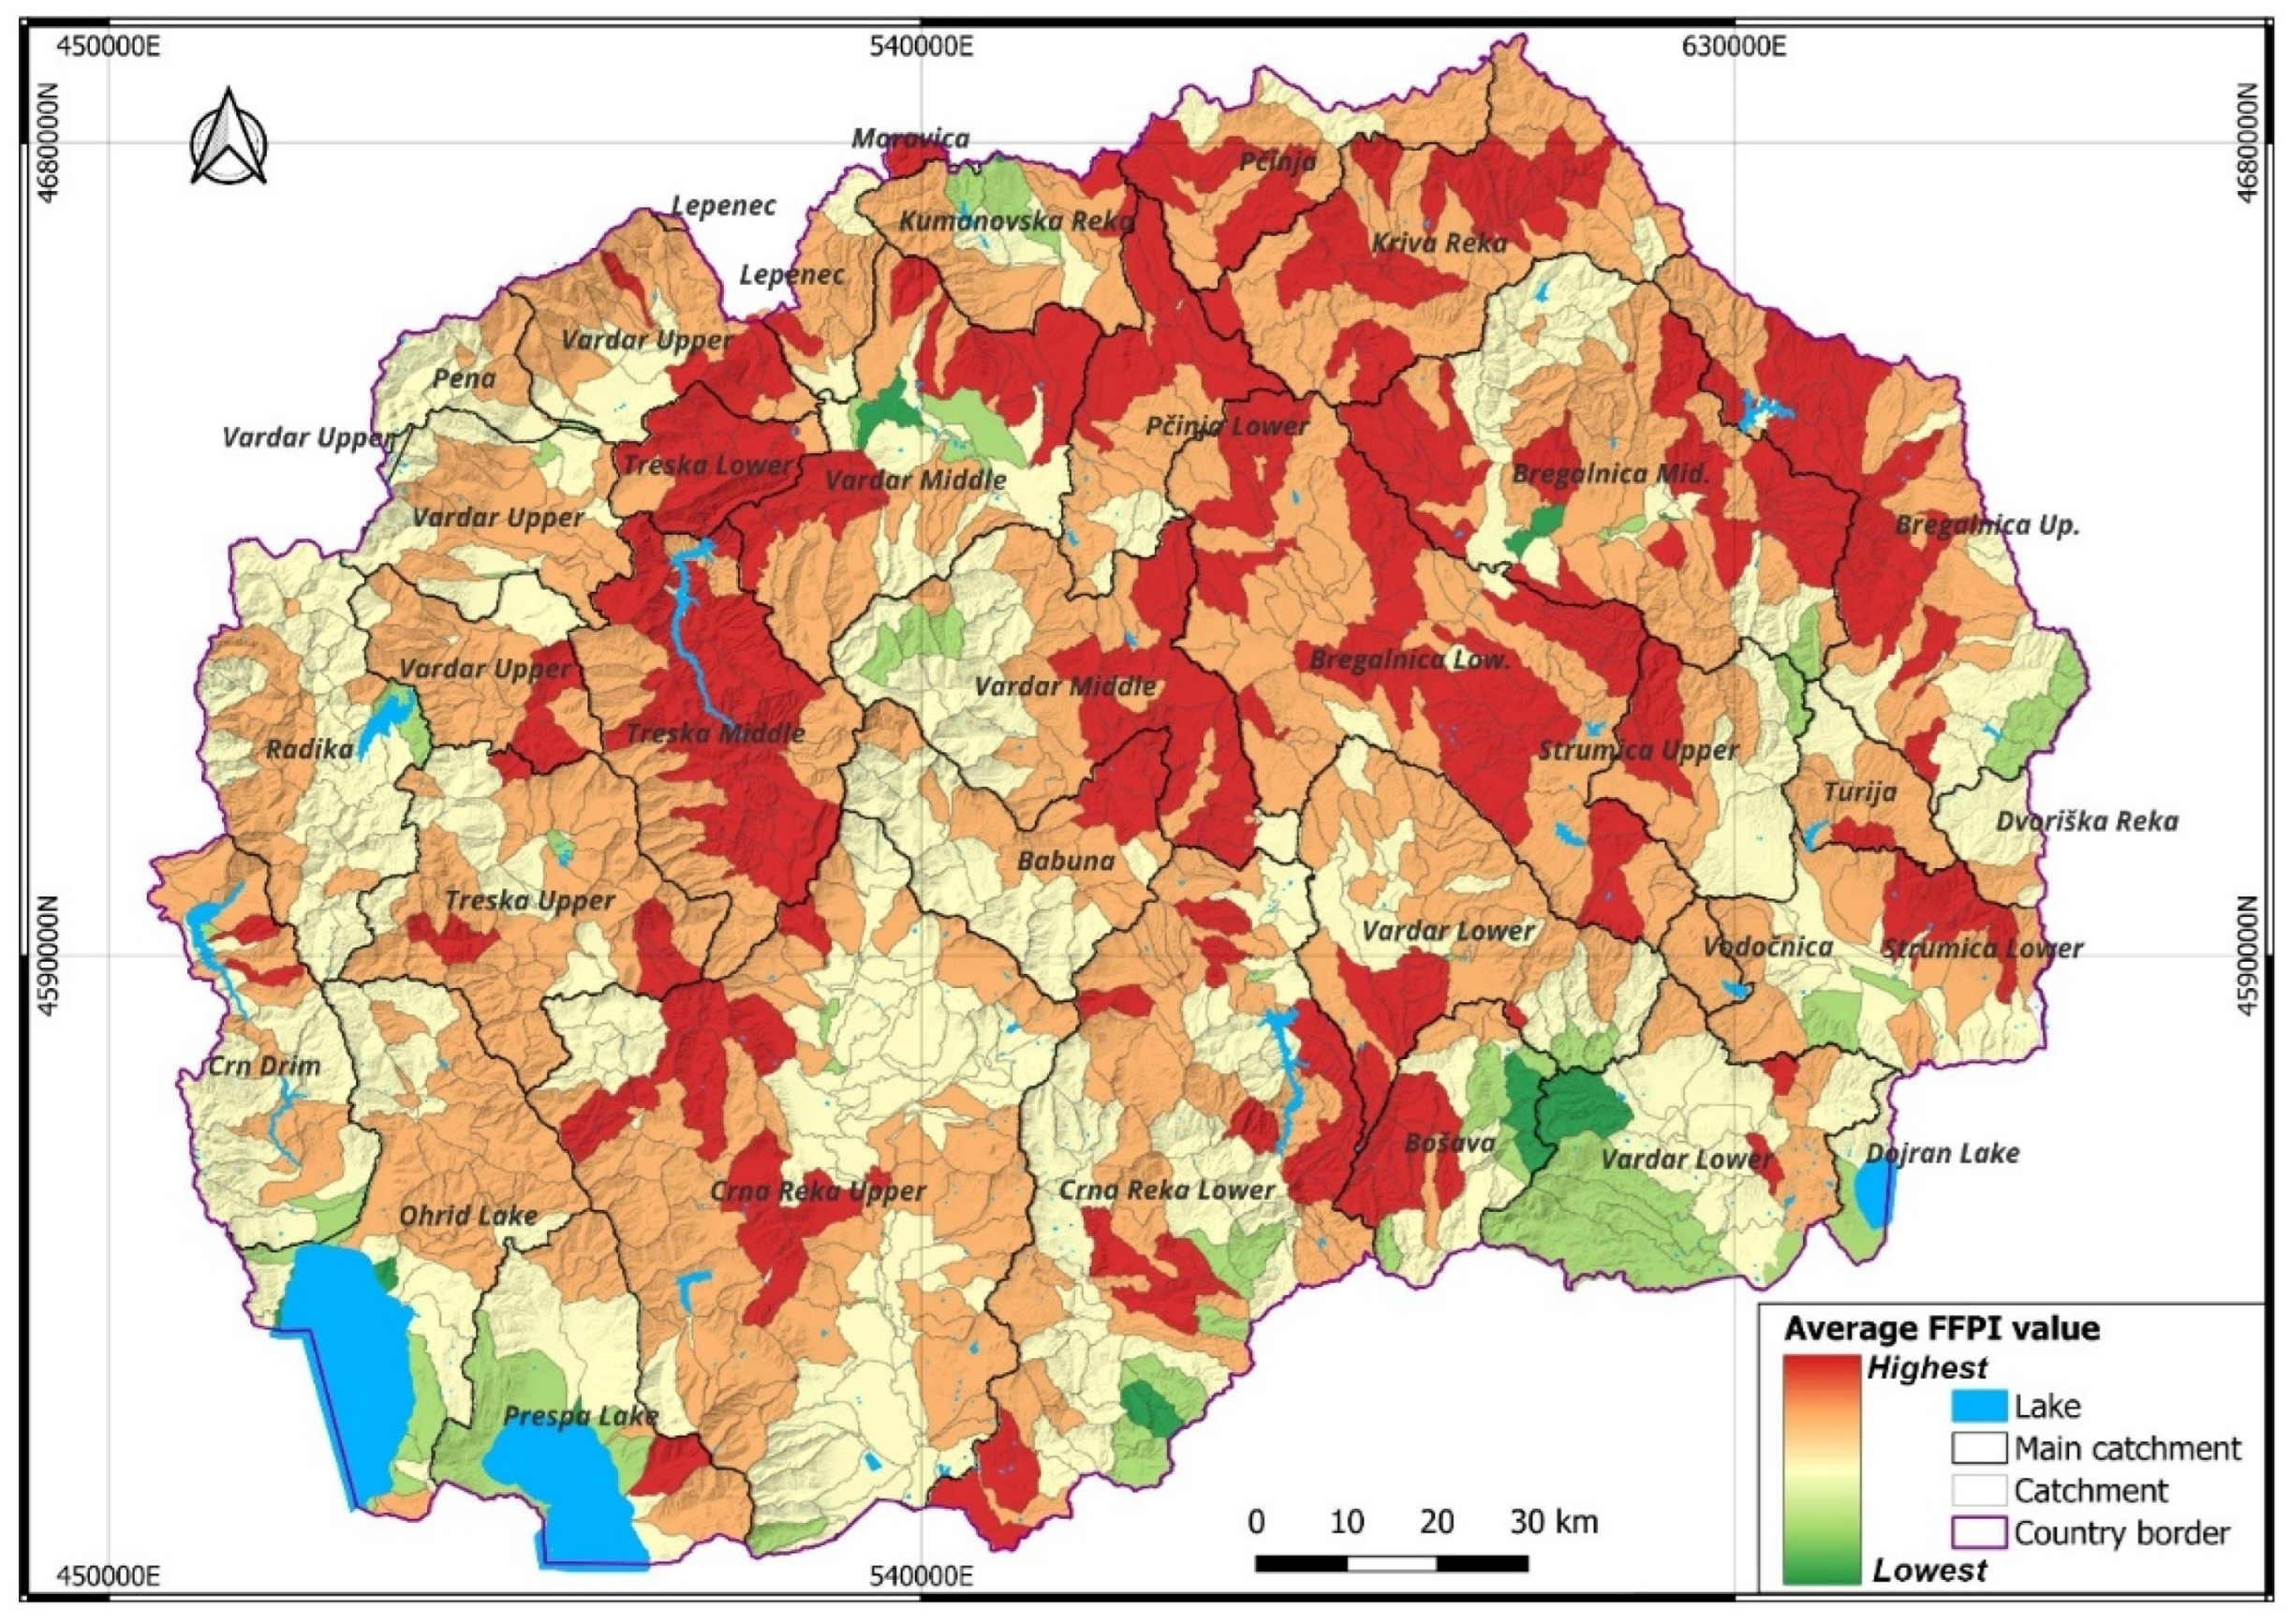
Figure 10.
Flash flood of Pčinja River (the middle part), 2010 (A, B).

Figure 11.
Media coverage of the flash flood on Treska River (A); in Crna Reka catchment (B); in Šipkovica village, Pena catchment (C).
Figure 11.
Media coverage of the flash flood on Treska River (A); in Crna Reka catchment (B); in Šipkovica village, Pena catchment (C).
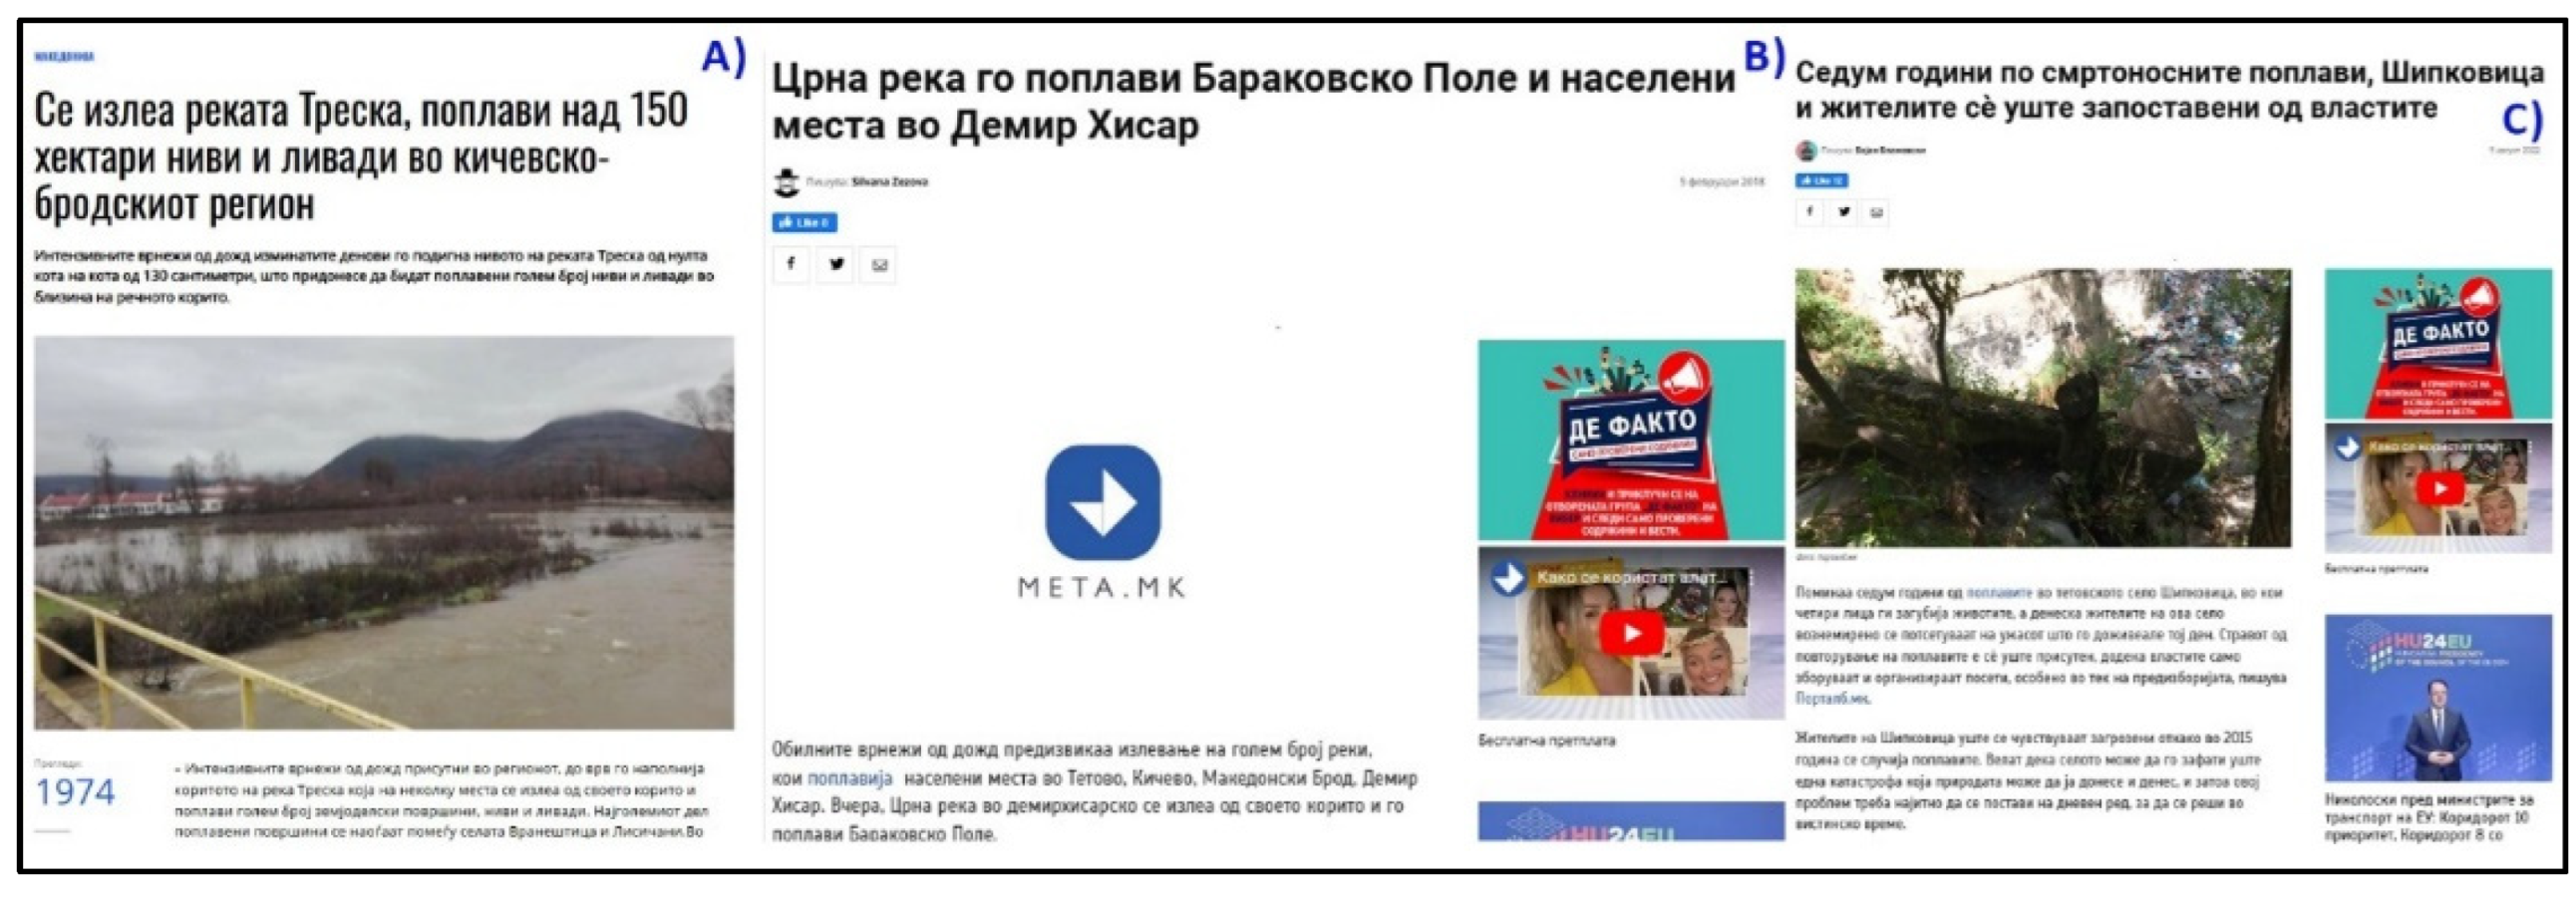
Figure 12.
Flash flood in Šipkovica village, 2015 (A); in Skopje, 2016 (B, C); of Pena R. through Tetovo, 2015 (D).
Figure 12.
Flash flood in Šipkovica village, 2015 (A); in Skopje, 2016 (B, C); of Pena R. through Tetovo, 2015 (D).
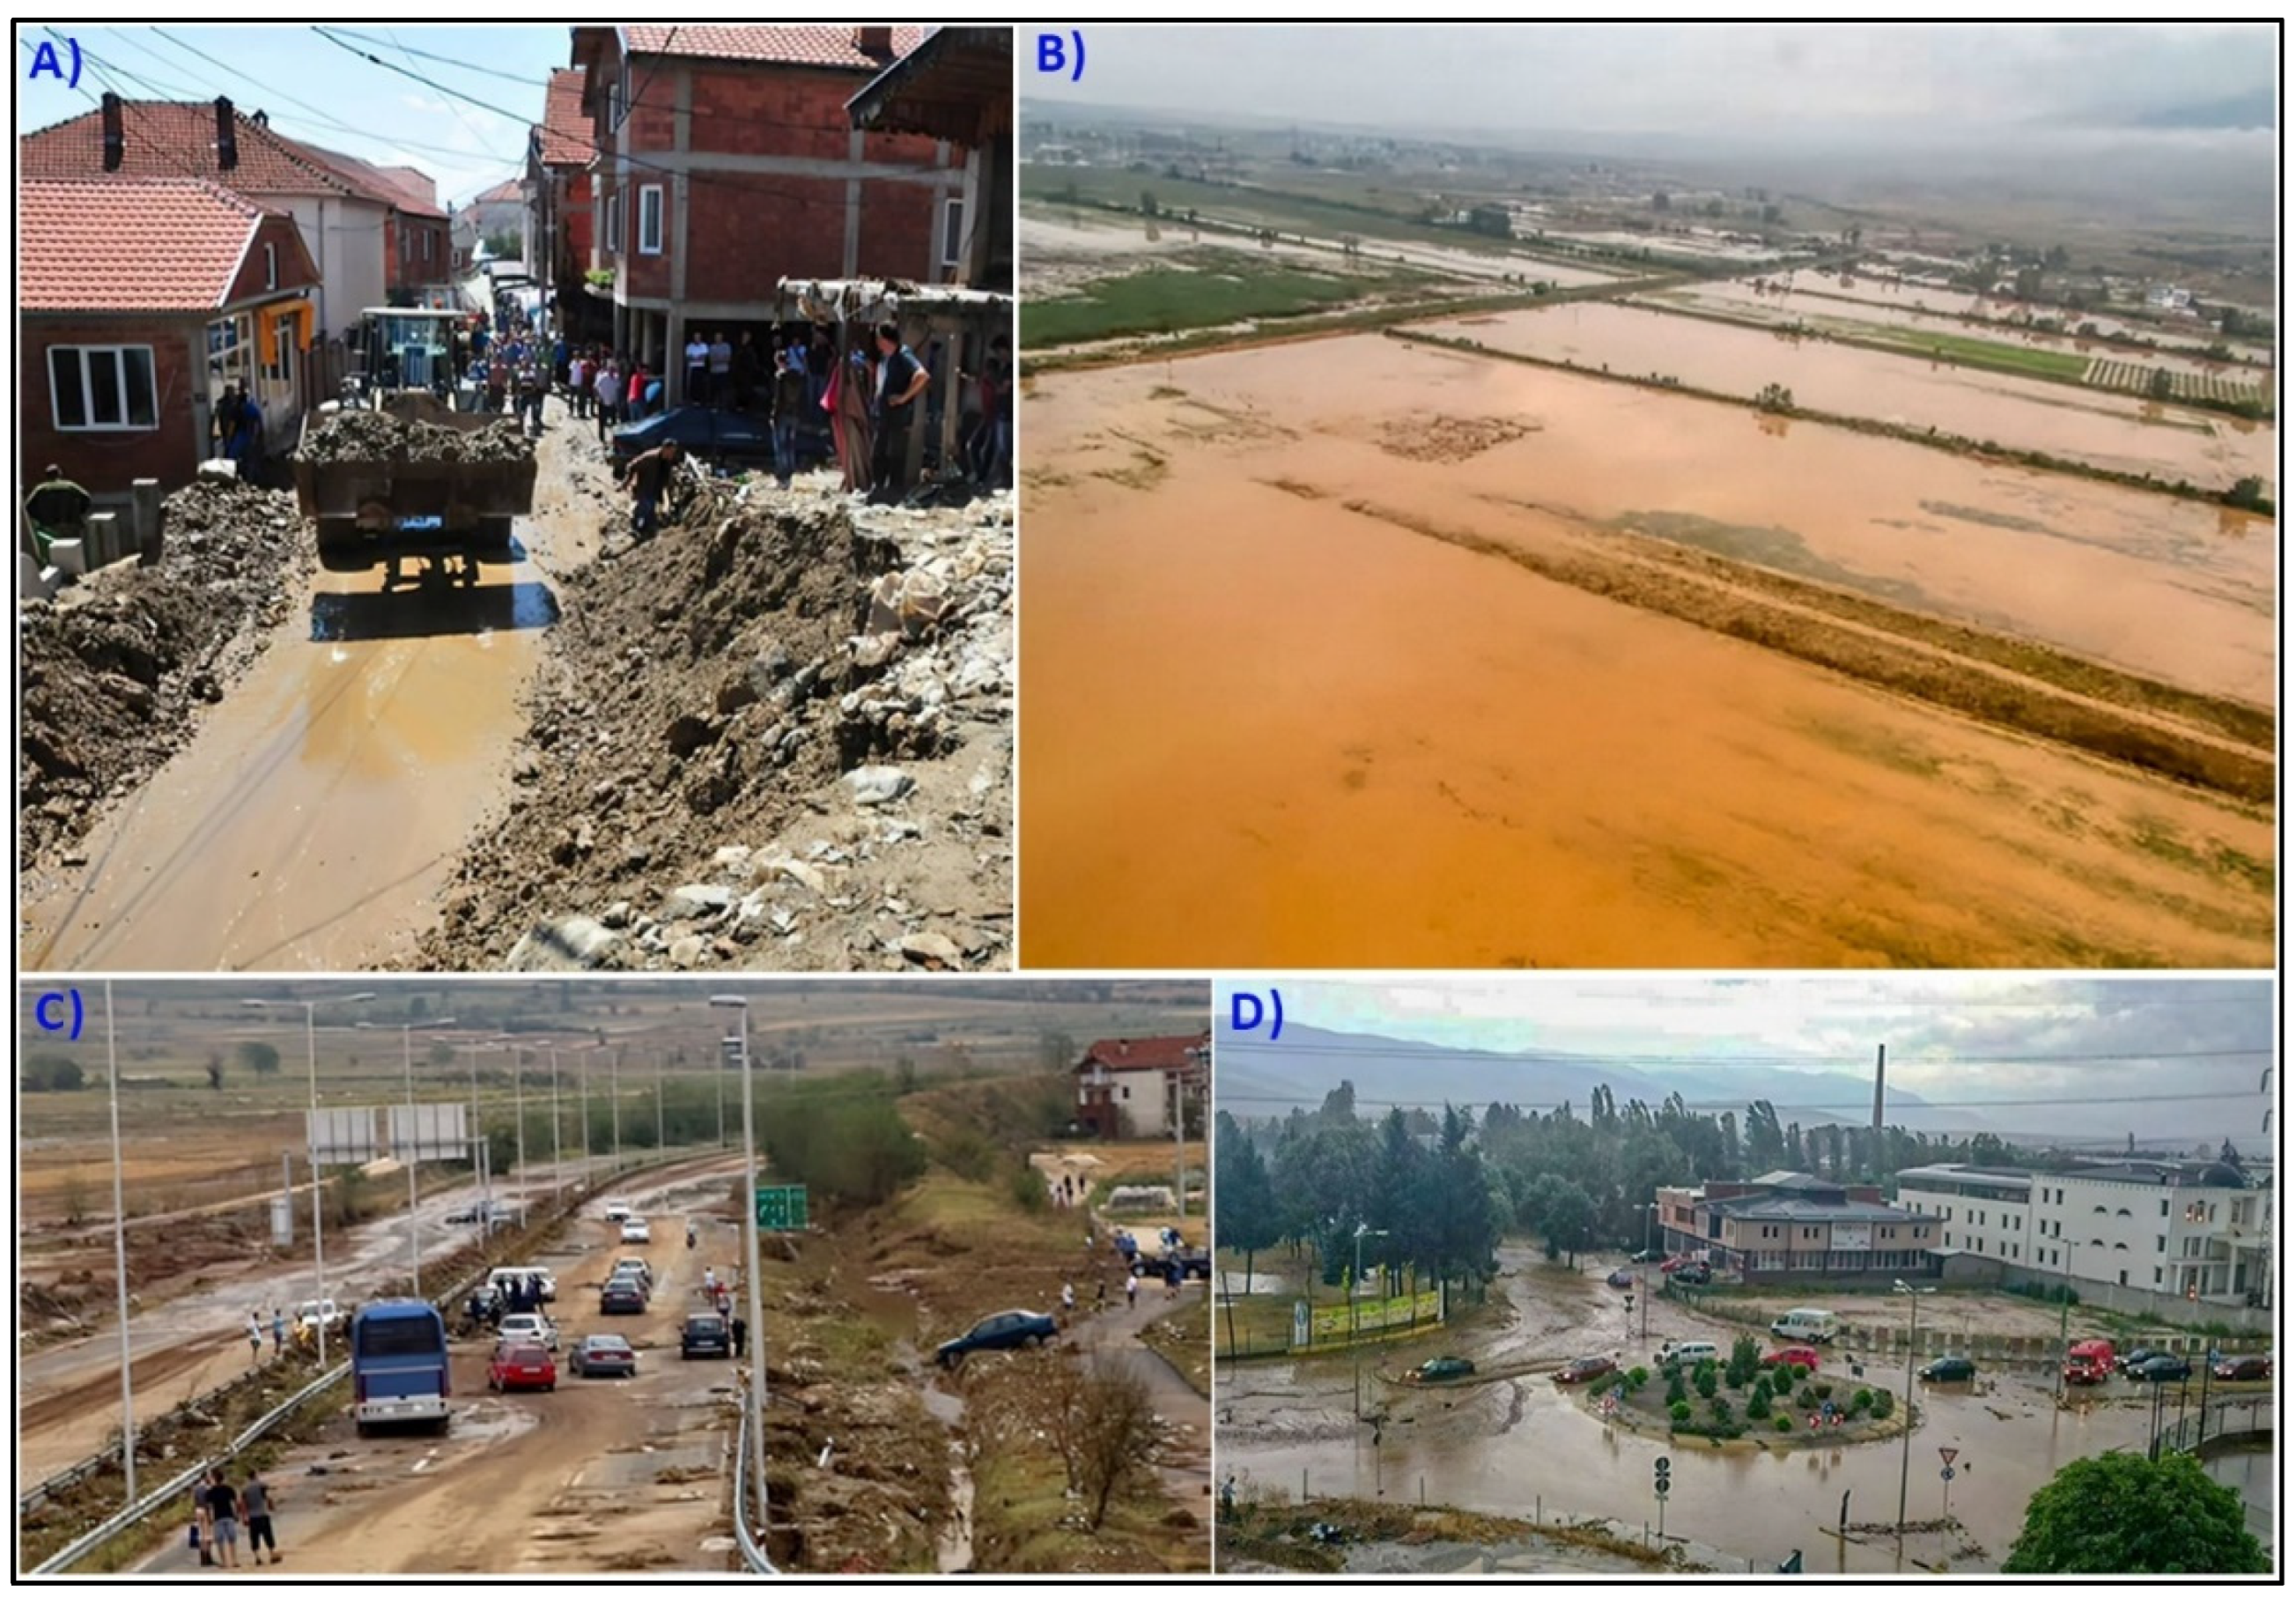

Table 1.
Slope coefficient (M).
| Value | Slope % |
| 1 | 0 – 3 |
| 2 | 3 – 6 |
| 3 | 6 – 9 |
| 4 | 9 – 12 |
| 5 | 12 – 15 |
| 6 | 15 – 18 |
| 7 | 18 – 21 |
| 8 | 21 – 24 |
| 9 | 24 – 29.2 |
| 10 | > 29.2 |
Table 2.
Coefficient of lithological units (S).
| Lithological unit | Susceptibility to flash floods |
| Quartzite, amphibolite, diabase | 2 |
| Solid volcanic rocks (andesite, dacite, basalt) | 3 |
| Clastic sediments | 4 |
| Compact marble, limestone | 5 |
| Gneisses, granite | 6 |
| Chert, shists | 7 |
| Slate, Mica shists | 8 |
| Tuffs | 9 |
| Clay containing clastic sediments | 10 |
Table 3.
Land use types (L).
| Land classes | Value |
| Mixed forest | 1 |
| Broad-leaved and coniferous forest | 2 |
| Shrubs | 3 |
| Natural grasslands | 4 |
| Continuous and discontinuous urban fabric | 5 |
| Transitional woodland-shrub | 6 |
| Pastures | 7 |
| Permanently irrigated land; Complex cultivation patterns; Land principally occupied by agriculture, with significant areas of natural vegetation | 8 |
| Bare rocks; Sparsely vegetated areas | 9 |
Table 5.
Flash Flood Vulnerability Distribution in North Macedonia.
| Flash floods vulnerability | Value | Area | |
| km2 | % | ||
| Very high | 2.1 – 4.5 | 823.6 | 3.3 |
| High | 4.5 – 5.5 | 5625.7 | 22.3 |
| Moderate | 5.5 – 6.5 | 11796.8 | 46.7 |
| Low | 6.5 – 7.5 | 5919.9 | 23.4 |
| Very low | 7.5 – 15.1 | 1082.8 | 4.3 |
| Total | 25248.9 | 100.0 | |
Table 4.
Number and area of catchments by average FFPI value and Natural Breaks classification.
| Class | Values | No. | No. % | Area | Area % |
| Very high | 6.3-7.2 | 305 | 24.7 | 5591.6 | 22.1 |
| High | 5.8-6.3 | 484 | 39.2 | 10473.1 | 41.5 |
| Moderate | 5.2-5.8 | 366 | 29.6 | 7286.0 | 28.9 |
| Low | 4.8-5.2 | 54 | 4.4 | 1411.6 | 5.6 |
| Very low | 3.9-4.8 | 27 | 2.2 | 486.6 | 1.9 |
| Total | 3.9-7.2 | 1236 | 100.0 | 25248.9 | 100.0 |
Disclaimer/Publisher’s Note: The statements, opinions and data contained in all publications are solely those of the individual author(s) and contributor(s) and not of MDPI and/or the editor(s). MDPI and/or the editor(s) disclaim responsibility for any injury to people or property resulting from any ideas, methods, instructions or products referred to in the content. |
© 2025 by the authors. Licensee MDPI, Basel, Switzerland. This article is an open access article distributed under the terms and conditions of the Creative Commons Attribution (CC BY) license (http://creativecommons.org/licenses/by/4.0/).
Copyright: This open access article is published under a Creative Commons CC BY 4.0 license, which permit the free download, distribution, and reuse, provided that the author and preprint are cited in any reuse.


