
Submitted:
19 November 2025
Posted:
20 November 2025
You are already at the latest version
Abstract
The aim of the study was to determine the effect of cultivar and nitrogen fertilization on the morphological and physiological traits and yield of soybean (Glycine max (L.) Merrill) grown in central-eastern Poland. In a strict, two-factor field experiment, four soybean cultivars were used: ‘Abelina’, ‘Malaga’, ‘Coraline’ and ‘Petrina’, and three nitrogen rates: 0, 30 and 60 kg N ha-¹. A moderate rate (N30) was applied before sow-ing, while the higher rate (N60) was divided into two parts, with 50% applied before sowing and 50% top-dressed at BBCH 61. The studies were conducted during two growing seasons. It was shown, that both the cultivar and nitrogen fertilization signif-icantly affected plant height, leaf area index (LAI), leaf greenness index (SPAD) and chlorophyll fluorescence indices (Fv/Fm, PI). The interaction among cultivar, fertiliza-tion, and years was significant for several physiological parameters, indicating a strong influence of environmental factors on plant response. Nitrogen fertilization in-creased plant height and chlorophyll content, but reduced fluorescence indices. Among the cultivars studied, 'Malaga' was characterized by the highest physiological activity and seed yield, while 'Abelina' had the lowest values for these parameters. The appli-cation of a moderate rate of nitrogen (N30) im-proved the physiological indicators of plants and elements of yield structure without reducing potential photochemical effi-ciency of PSII, while a higher rate (N60) did not result in a significant increase in yield, despite a greater number of pods and seeds per plant, which may have been due to a reduction in the thousand seed weight. The results obtained indicate, that moderate nitrogen fertilization, combined with the right choice of cultivar, can help to increase the physiological efficiency and yield stability of soybeans in temperate climates.
Keywords:
soybean
; cultivar
; nitrogen rate
; drought stress
; physiological traits
; leaf area index (LAI)
; leaf greenness index (SPAD)
; chlorophyll fluorescence indices (Fv/Fm
; PI)
; seed yield
; yield components
1. Introduction
Soybean (Glycine max (L.) Merrill) is one of the most important legumes in the world, valued for its high protein and fat content and its ability to biological nitrogen fixation (BNF) in symbiosis with Bradyrhizobium japonicum [1]. Due to its versatile use, soybean is a leader in the global agricultural economy as a major oilseed and important protein crop. Soybean has high thermal requirements, which is why it is not easy to obtain a satisfactory yield in temperate climates [2]. However, recent years have seen an increase in interest in soybean cultivation in Central and Eastern Europe, including Poland, due to the need to increase domestic sources of plant protein, but also due to intensive breeding progress and progressive climate warming [3].
Soybean productivity is highly dependent on weather conditions, especially temperature and precipitation during the growing season. The increase in average air temperature at this latitude is beneficial for thermophilic soybeans, but precipitation patterns are becoming increasingly unfavorable. As a result of climate change, many European countries, including Poland, are experiencing increasingly frequent periodic droughts, which cover large areas and cause significant losses in agricultural production [4]. Soil water deficiency disrupts physiological and metabolic processes, leading to reduced plant growth, decreased stomatal conductance, inhibited photosynthesis, accelerated leaf ageing and, consequently, affects crop yield and quality [5,6].
The reduction in soybean productivity under drought conditions depends on the duration and intensity of stress and the phenological stage of the plants. Soybeans are particularly sensitive to water deficit during the generative phase, i.e., during flowering, pod setting and seed filling. This is a critical period associated with increased water demand by plants, therefore water shortage during this period can cause a significant reduction in seed yield [7,8]. Limited soil moisture also reduces the activity of Bradyrhizobium japonicum symbiotic bacteria and the efficiency of biological nitrogen fixation, leading to physiological disturbances, deterioration in the efficiency of assimilate utilization and, consequently, a reduction in seed yield [7,9,10,11].
Nitrogen fertilization is one of the most important agrotechnical factors determining plant growth and yield. Nitrogen plays a key role in growth processes, protein, chlorophyll and enzyme synthesis, and its availability determines the efficiency of photosynthesis and biomass production, thus having a decisive impact on both yield and quality [12,13,14]. Soybeans assimilate large amounts of nitrogen, both in the vegetative and generative phases, and the total amount of N taken up is closely correlated with seed yield. Soybeans require approximately 70-90 kg of N per ton of seed [15]. It meets its nitrogen requirements using biologically fixed nitrogen as well as nitrogen originating from the soil and from mineral fertilizers. With abundant nodulation, symbiotic bacteria can fix up to 100 kg N ha-¹, which can cover up to 60% of the plants’ demand for this element [16]. The remainder should be supplemented with mineral nitrogen, whereby the application of an appropriate rate is crucial to maintain a balance between growth and the efficiency of BNF. Optimal rates of mineral nitrogen can stimulate early soybean development, increase leaf area, chlorophyll content and photosynthetic activity. However, excessive nitrogen fertilizations can lead to reduced nodule activity, decreased symbiosis efficiency, as well as disturbances in assimilate metabolism and accelerated leaf ageing [17].
An important factor in production that improves the technological and utility value of plants is breeding progress. New cultivars are generally characterized by higher yields, better quality traits and greater resistance to environmental stresses. Genetic diversity between cultivars determines their ability to adapt to specific environmental conditions, the efficiency of water and nutrient use, including nitrogen, and resistance to abiotic stresses. Cultivars also differ in growth dynamics, length of the growing season, plant architecture, and photosynthesis intensity, which can affect plant productivity and morphological and physiological parameters such as plant height, LAI index, chlorophyll content in leaves and PSII efficiency [18].
Understanding the interaction between genetic factors, nitrogen fertilization and weather conditions is crucial for optimizing the yield and physiological efficiency of soybeans in temperate climates. The aim of the study was to determine the effect of cultivar and nitrogen fertilization rate on selected morphological and physiological traits and seed yield of soybeans grown under field conditions in central-eastern Poland.
2. Materials and Methods
2.1. Experimental Site and Treatment Specifications
A strict two-year field experiment was conducted at the Experimental and Implementation Field of the Lublin Agricultural Advisory Centre in Końskowola (Lubelskie voivodeship, 51°24′33″N 22°03′06″E). The experiment was established on loamy soil formed from loess, with a soil pH (KCl) ranging from 6.9 to 7.4. The content of available macronutrients ranged from (mg 100g-1 of soil): P – 9.0-19.2; K – 8.6-18.7; Mg – 10.3-11.5. The organic carbon content was 0.96-0.97%.
A two-factor experiment was set up in a split-plot design, with four replicates, on plots with an area of 30 m². The research factors were: nitrogen rate: 0 (control treatment N0), 30 kg ha-¹ (moderate rate N30), 60 kg ha-¹ (high rate N60) and common soybean (Glycine max (L.) Merrill) cultivars: ‘Abelina’ (medium early), ‘Coraline’ (very late), ‘Malaga’ (very late), ‘Petrina’ (very late).
During phosphorus and potassium fertilization, the natural soil fertility was taken into account, using pre-sowing (kg ha⁻¹): P – 17.4, K – 46.5 calculated as pure component. Nitrogen fertilization corresponded to rates of 30 and 60 kg ha-¹, with a rate of 30 kg ha-¹ applied pre-sowing, and a rate of 60 kg divided into two parts, with 50% applied pre-sowing and 50% top-dressing at BBCH 61. No nitrogen was sown on the control object. Before sowing, the soybean seeds were treated with a seed dressing and inoculated with Nitragina containing Bradyrhizobium japonicum bacteria, and sown at a rate of 70 seeds per 1 m². All agrotechnical treatments were performed on time, in accordance with the applicable recommendations for soybeans.
2.2. Agronomic and Physiological Traits
During the growing season, four developmental stages of soybean (BBCH 61, 65, 70, 77) were measured for chlorophyll fluorescence indices (Fv/Fm, PI), leaf area index (LAI) and leaf greenness index (SPAD). Direct chlorophyll fluorescence measurements were performed using a PocketPEA fluorometer (Hansatech Instruments – WB). The Fv/Fm index, which determines the maximum quantum efficiency of photosystem II (PSII), and the PI index, which describes PSII performance index, were evaluated. Chlorophyll fluorescence indices are used to determine the efficiency of the photosynthetic apparatus and to assess the physiological condition of plants. The measurements were taken after 20 minutes of leaf adaptation in the dark, and the result from each plot was the average of 10 measurements.
LAI (leaf area index) measurements were performed using the LAI-2000 Plant Canopy Analyser (LI-COR). It determines the ratio of the total one-sided area of all leaves to the area of the substrate above which they are located. The result from each plot was the average of 3 measurements.
Leaf greenness index (SPAD) measurements were performed using a SPAD-502 chlorophyll meter (Minolta). The device measures the transmission of light beams passing through the leaf, of which only red light is absorbed by the chlorophyll in the leaves. The device measures the differences between light absorption by the leaf at wavelengths of 650 and 950 nm, and the quotient of these differences is the leaf greenness index or relative chlorophyll content. The value of the reading is proportional to the chlorophyll content in the tested area (6 mm²) of the leaf. The result from each plot was the average of 30 measurements.
Before harvesting, 10 plants were randomly selected from each plot to determine the biometric characteristics of the plants: plant height (cm), number of pods per plant (pcs), number of seeds per plant (pcs), seed weight per plant (g). At the stage of full maturity, the seed yield (t ha-¹) at 14% moisture content and the thousand seed weight (TSW) (g) were determined.
2.3. Statistical Analysis
The collected research results were statistically analyzed using analysis of variance (ANOVA) for a three-factor system, in which the factors were: soybean cultivar, nitrogen fertilization rate and year of research. To compare the differences between the means for the main factors and interactions, Tukey’s multiple range test (HSD) was used at a significance level of p≤0.05. The calculations were performed using Statgraphics Centurion XVI software. In addition, Pearson’s correlation coefficients (r) were calculated between selected morphological, yield-related and physiological traits in order to determine the relationships between the analyzed parameters.
2.4. Weather Conditions
Weather conditions varied between the two growing seasons (Figure 1). Analysis of thermal conditions showed that these years were exceptionally warm, with the average monthly air temperature in all months and years of the study being higher than the long-term average. In the first growing season (2018), April, May and August were particularly warm (temperatures higher by 6.2, 4.3 and 3.4 oC) higher than the long-term average, while in the second (2019) – June and August (temperatures 5.7 and 3.0 o C higher, respectively) compared to the long-term averages.
The total precipitation for the entire growing season (April-September) was lower in both the first and second years of the study, by 20 and 11%, respectively, compared to the long-term average. In the first growing season, significant rainfall deficits were recorded in April, June and August, 20, 51 and 65% lower than the long-term average, respectively. In July, however, rainfall was 33% higher than average. In the second season, the greatest rainfall deficits were recorded in June and July, 53 and 23% lower than the long-term average, respectively, while August saw a 15% increase in rainfall.
Hydrothermal conditions were also described using the Sielianinov hydrothermal index (k) [19], calculated using the following formula:
where:
k = (10∙P)/(∑ t)
P - monthly sum of precipitation (mm),
Ʃ t - sum of average daily temperatures in a given month > 0 °C.

Table 1.
Characteristics of growing seasons based on the Sielaninow hydrothermal index (k).
| Month | 2018 | k (2018) | 2019 | k (2019) |
|---|---|---|---|---|
| April May June July August September |
dry fairly dry very dry moderately wet very dry fairly dry |
0.71 1.08 0.65 1.87 0.43 1.03 |
fairly dry optimal very dry fairly dry optimal optimal |
1.30 1.60 0.54 1.17 1.49 1.33 |
k ≤ 0.4 – extremely dry, 0.4 < k ≤ 0.7 – very dry, 0.7 < k ≤ 1.0 – dry, 1.0 < k ≤ 1.3 – fairly dry, 1.3 < k ≤ 1.6 – optimal, 1.6 < k ≤ 2.0 – moderately wet, 2.0 < k ≤ 2.5 – wet, 2.5 < k ≤ 3.0 – very wet, k > 3.0 – extremely wet.
3. Results
3.1. Morphological and Physiological Characteristics of Soybean Plants
The results of statistical analysis (ANOVA) indicate that both the genetic factor (cultivar) and nitrogen rate significantly affected plant height, canopy structure (LAI index), relative chlorophyll content in leaves (SPAD index) and chlorophyll fluorescence indices: Fv/Fm – maximum quantum efficiency of PSII and PI – PSII performance index (Table 2). A significant effect of years on the parameters studied was also demonstrated. The interaction between cultivar and fertilization was significant for all parameters except PI, and between cultivars and years for all parameters except LAI. The interaction between fertilization and years significantly affected the SPAD index and chlorophyll fluorescence indices. A significant interaction between cultivar, fertilization and years was demonstrated for the SPAD index and the maximum quantum efficiency of PSII (Fv/Fm). Considering the average values, the tallest plants were characterized by the ‘Caroline’ cultivar, while ‘Malaga’ showed the highest values for the SPAD index and the Fv/Fm and PI indices. Nitrogen fertilized soybeans were significantly taller, the leaves had a higher SPAD index, while the chlorophyll fluorescence indices were lower. In addition, all parameters showed significantly higher values in the second year of the study compared to the first.
In both years of the study, the tallest plants were recorded in the ‘Coraline’ cultivar, although in the second year their height did not differ significantly from ‘Malaga’ and ‘Petrina’ (Table 3). In turn, the shortest plants in both years were recorded in ‘Abelina’, although its height did not differ significantly from the ‘Petrina’ in the first year. The tested soybean cultivars differed significantly in terms of relative chlorophyll content in leaves in individual years of the study (Table 4). All cultivars had significantly higher SPAD index values in the second year compared to the first. The highest SPAD index was noted for ‘Petrina’, although this value did not differ significantly from the SPAD index for ‘Malaga’ and ‘Abelina’. The lowest SPAD index was recorded for ‘Abelina’ and ‘Petrina’ in the first year of the study. The nitrogen rate significantly differentiated the SPAD index only in the first year of the study, while in the second year this index was significantly higher than in the first, and did not depend on the nitrogen rate. Chlorophyll fluorescence indices significantly depended on the cultivar and nitrogen rate, but regardless of the cultivar, their values were significantly higher in the second year compared to the first. The maximum quantum efficiency of PSII index (Fv/Fm) had the lowest values in ‘Petrina’ and ‘Coraline’, while the PSII performance index (PI) had the lowest values in ‘Petrina’ and ‘Abelina’. In the first year of the study, both chlorophyll fluorescence indices showed significantly higher values in treatment N0 compared to N30 and N60, while in the second year, the chlorophyll fluorescence indices did not differ significantly between treatments N0 and N30.
The interaction between N fertilization and cultivar significantly influenced soybean plant height, LAI and SPAD indices, and the Fv/Fm chlorophyll fluorescence ratio (Figure 2). Among the cultivars tested, ‘Abelina’ was significantly taller under nitrogen fertilization (N30 and N60), while ‘Malaga’ was taller after the application of a moderate rate of N30, compared to the control N0 (Figure 2a). The highest LAI index was observed in the ‘Coraline’ cultivar fertilized with nitrogen only before sowing (N30), while the lowest values of this index were recorded in ‘Abelina’, regardless of the N rate (Figure 2b). In the case of the ‘Malaga’ and ‘Petrina’ cultivars, the nitrogen rate had no significant effect on the LAI index. Regardless of the N rate, the relative chlorophyll content in the leaves was highest in ‘Malaga’, while a significantly lower SPAD index was recorded in ‘Abelina’ and in ‘Petrina’ fertilized with nitrogen (Figure 2c). The maximum quantum efficiency of PSII index (Fv/Fm) in all cultivars reached the highest values in N0 treatment, but significant differences in ‘Abelina’, ‘Coraline’ and ‘Petrina’ were only observed in comparison to the N60 treatment, and in ‘Malaga’ – N30 treatment (Figure 2d). The highest values of the PSII performance index (PI) were recorded in ‘Malaga’, and the lowest in ‘Petrina’, but the differences were not statistically significant (Figure 2e).
3.2. Yield Performance and Yield Structure of Soybean
The results of statistical analysis (ANOVA) indicate, that both the genetic factor and the nitrogen rate significantly affected the yield and a thousand seeds weight (TSW) of soybean, as well as yield structure elements such as the number of pods, number of seeds and seed weight per plant (Table 5). A significant effect of years on the parameters studied was also demonstrated, with the exception of seed weight per plant. The interaction of cultivar with years was significant for all parameters, while the interaction of cultivar with fertilization and fertilization with years was significant for all parameters except TSW. A significant interaction of cultivar, fertilization and years was demonstrated for all parameters except seed weight per plant. Taking into account the average values, the best-yielding cultivar was ‘Malaga’ (5.06 t ha-¹), which also had the highest TSW (230 g), while the lowest yield (4.25 t ha-¹) and the lowest TSW (170 g) was observed in ‘Abelina’, which also had the lowest number of pods and seeds and seed weight per plant. A significantly higher yield was obtained on nitrogen-fertilized objects compared to the control, although the N rate did not have a significant effect on the seed yield of the cultivars. In addition, in the first year of the study, a significantly higher yield was obtained, which was associated with a significantly higher number of pods and seeds per plant, while TSW was significantly lower.
In both years of the study, ‘Malaga’ was the best-yielding cultivar, while ‘Abelina’ was the weakest, although in the second year of the study its yield did not differ significantly from ‘Malaga’ (Table 6). In the first year of the study, the yield of nitrogen-fertilized soybeans (N30, N60) was significantly higher than in the control (N0), with no significant difference between N30 and N60, only a tendency for higher yields at higher N rates. In the second year of the study, the soybean yield was similar across all objects. In both years, ‘Malaga’ had the highest TSW, which was significantly higher than the other objects. The lowest TSW was recorded for ‘Abelina’ in the second year of the study. The N rate did not significantly differentiate this parameter in individual years of the study.
‘Coraline’ produced the highest number of pods and seeds per plant in the first year of the study, with no significant difference in these parameters compared to ‘Petrina’ in the second year (Table 7). In both years, the seed weight per plant was significantly lower in ‘Abelina’ compared to the other cultivars. Furthermore, in the first year of the study, soybean fertilized with a higher rate of nitrogen (N60) had a significantly higher number of pods and seeds per plant compared to N0 and N30, as well as the highest seed weight, while in the second year, the values of these parameters did not differ significantly between the individual treatments.
The interaction between fertilization and cultivar significantly influenced the soybean seed yield and yield components, i.e., the number of pods and seeds and the seed weight per plant (Figure 3). Regardless of the fertilization rate, ‘Malaga’ was the highest-yielding cultivar (Figure 3a). On the N0 and N30 objects, ‘Malaga’ yielded significantly higher than all other cultivars, while on the N60 object, its yield was significantly higher only in comparison to ‘Abelina’. Regardless of the nitrogen rate, ‘Malaga’ developed the highest TSW, but the effect of the interaction between fertilization and cultivar on this trait was not statistically confirmed (Figure 3b). ‘Coraline’ produced the most pods and seeds per plant on the N60, but this value was significantly higher only in comparison to ‘Abelina’ (Figure 3c,d). On the treatments fertilized with a moderate rate of nitrogen (N30), ‘Coraline’ and ‘Petrina’ produced significantly more pods and seeds compared to ‘Abelina’ and ‘Malaga’, while on the N0, ‘Malaga’ proved to be significantly weaker in terms of this trait compared to all other cultivars. The weight of seeds per plant was the highest in ‘Malaga’ fertilized with a higher rate of N (N60) and this value was significantly higher compared to ‘Abelina’ fertilized with the same rate (Figure 3e). On treatment with a moderate nitrogen rate (N30), significantly lower seed weight was found in ‘Abelina’ compared to other cultivars, while on control object (N0) no statistically significant differences were found.
3.3. Correlation Analysis Among the Analyzed Traits
The analysis of the interdependence between the studied plant traits is presented in Table 8. A varied direction and strength of correlation between yield, yield parameters, and physiological indicators was demonstrated. Soybean seed yield was positively and significantly correlated with the thousand seed weight (r = 0.31; p < 0.05) and with the weight of seeds per plant (r = 0.31; p < 0.05). A positive, although statistically insignificant, correlation was also found between yield and plant height and the number of pods and seeds per plant. A negative, statistically significant correlation was found between yield and LAI (r = –0.30; p < 0.05). Strong positive correlations were also observed between LAI and Fv/Fm, PI and SPAD indices, as well as TSW and Fv/Fm, PI and SPAD indices, while correlations between yield and chlorophyll fluorescence indices (Fv/Fm, PI) were negative but weak and statistically insignificant.
4. Discussion
The success of soybean cultivation in Poland depends on many factors, but one of the most important is the weather conditions during the growing season [8,20]. During the years of research, plant growth and development were shaped by variable temperature and humidity conditions, which was reflected in the diversity of morphological and physiological traits and the level of soybean yield. The first year of the study was characterized by a high average air temperature during the growing season (18.1 °C) and low total precipitation (303 mm), which indicates water stress during the vegetative phase and the beginning of soybean flowering (May-June) and pod filling (August-September) (Table 1). In the second year of the study, the average air temperature during the growing season (16.8 °C) was higher than the long-term average (14.6 °C), and the total precipitation (337 mm) was below the long-term average (377 mm), but the distribution of precipitation was more even. The greatest water shortages occurred during the critical phase of soybean flowering and pod setting (June-July).
Soybean yields were significantly higher in the first year (by an average of 12.7%) compared to the second year. Soybeans have moderate water requirements and tolerate short periods of drought quite well, as they are genetically adapted to this. It develops a strong root system, pubescence on leaves and stems to reduce transpiration, and we also observe the phenomenon of heliotropism, which involves the vertical positioning of leaves in conditions of high temperatures and water shortages, limiting leaf heating and excessive transpiration. This is confirmed by the research of Tabrizi et al. [21], which showed that reducing soybean irrigation by 25% compared to optimally irrigated controls allowed yields to be maintained at a stable level of around 90%.
The reduction in soybean productivity due to soil water deficiency depends on the duration and severity of the drought and the phenological stage of the plants [6,22,23]. Soybeans do not tolerate prolonged water shortages during critical periods, especially during flowering and pod set [7]. Lack of moisture during this period causes the rejection of flowers and young pods and results in a lower number of pods and seeds set [24,25]. This is confirmed by the studies of Eck et al. [26] which showed that prolonged stress imposed on plants from the beginning of flowering to the end of pod development reduced soybean seed yield more (by 45%) compared to stress in earlier stages of development. A smaller reduction in yield was also recorded when the stress was short-term and occurred between the beginning and full flowering and the beginning of pod development (by 9-13%). In addition, drought in the summer months, combined with high temperatures, leads to faster soybean maturation and a shorter flowering and pod filling phase [27]. In our own studies, the first growing season was more deficient in terms of rainfall, but the dry periods occurred mainly at the beginning (June) and end of the growing season (August-September), while the critical period, which falls during flowering and pod setting (July), was moderately humid, which allowed for the formation of a larger number of pods and a significantly higher seed yield (average 4.80 t ha-¹) compared to the yield in the second season (4.26 t ha-¹). On the other hand, water shortages during the vegetative phases of soybean contributed to a significant reduction in plant height (by 5.3% on average), a reduction in leaf area index (by 29.1% on average), relative chlorophyll content in leaves (by 24.7% on average) and a reduction in photosynthetic activity expressed by chlorophyll fluorescence indices Fv/Fm and PI (by 9.5 and 58.2%, respectively). In turn, low rainfall at the end of the growing season resulted in a significantly lower TSW (by 5.3% on average). Higher values describing these parameters were obtained in the second year of the study, when air temperatures were lower and rainfall distribution during the growing season was more even. The reduction in morphological and physiological parameters under drought conditions is associated with a decrease in the intensity and disruption of the photosynthesis process, which in turn weakens biomass accumulation and its transfer to seeds. This is confirmed by the results of studies by various authors [6,7,25,27].
One of the main factors determining the growth, development and yield of soybeans is the genotype [28,29]. The results of our own research showed, that the soybean cultivars studied differed significantly in terms of the analyzed traits. The very late cultivar ‘Coraline’ stood out with the highest height, while the highest physiological parameters (SPAD index, Fv/Fm and PI indices) were found in the very late ‘Malaga’, which may indicate its greater adaptability to stressful conditions associated with soil water deficiencies. The high values of physiological parameters translated into good productivity of the ‘Malaga’ cultivar, whose average seed yield (5.06 t ha-¹) was significantly higher than that of the other cultivars, on average by 14.5-19.0% depending on the cultivar. In addition, ‘Malaga’ was characterized by seeds with the highest TSW (230 g). Among the cultivars tested, the medium-early ‘Abelina’ had the lowest yield, as well as was the shortest in height and showed the lowest SPAD and LAI indices.
The genetic potential of soybean cultivars largely depends on their earliness class. Cultivars with a long growing season generally yield better than earlier cultivars because they have more time to grow and develop assimilation organs and produce a yield. This contributes to the development of a larger leaf area and longer photosynthetic activity, which affects biomass growth and seed yield. This is confirmed by the results of our own research, as well as earlier by the authors’ previous studies. Staniak et al. [30] showed that among the 15 genotypes studied, late and very late cultivars yielded on average 22.5% more, and medium-early cultivars 20.0% more than early and very early cultivars. Significant differences were also found within individual groups of cultivars. This is confirmed by the research of Prusiński et al. [31], which showed that the very early cultivar ‘Annushka’ had a significantly higher seed yield, plant height, lowest pod height and thousand seed weight compared to the early ‘Aldana’.
Nitrogen fertilization had a significant effect on plant growth, physiological parameters and, consequently, seed yield and its structural elements. Soybeans fertilized with rates of 30 and 60 kg N ha⁻¹ were significantly taller and had a higher SPAD index compared to the control treatment, which confirms the positive effect of nitrogen on chlorophyll synthesis and photosynthetic activity. At the same time, a decrease in chlorophyll fluorescence indices (Fv/Fm and PI) was observed after the application of higher N rates (N60), which may indicate a decrease in the efficiency of PSII functioning with greater availability of mineral nitrogen. For most plants, the Fv/Fm parameter is considered the most sensitive indicator for determining the efficiency of the photosynthetic apparatus, although it is highly dependent on environmental factors [32]. According to Kaschuk et al. [17], soybeans using nitrogen bound as a result of symbiosis with Bradyrhizobium japonicum show higher photosynthetic activity and slower leaf ageing compared to plants fertilized with mineral nitrogen. The use of higher nitrogen rates in our own studies (N60) may therefore indicate a reduction in PSII activity due to a decrease in the role of BNF. These results confirm, that excessive mineral nitrogen fertilization, despite its positive effect on plant growth and leaf greenness index (SPAD), may not be conducive to maintaining high photosynthetic activity, especially in later stages of development. In contrast, moderate fertilization (N30) improved the physiological condition of plants (high SPAD values) without a significant decrease in PSII efficiency, indicating a more balanced use of mineral and symbiotic nitrogen.
The effect of nitrogen was also evident in the formation of yield components. The application of a higher rate of nitrogen (N60) significantly increased the number of pods per plant and the number and weight of seeds, but did not result in a proportional increase in yield. This was probably due to a reduction in the TSW, which was significantly higher in the control object (N0) and with moderate fertilization (N30). This phenomenon may indicate compensation between the elements of the yield structure, as the increase in the number of seeds was at the expense of their unit weight. Similar relationships were observed by other authors [33], who found that moderate nitrogen fertilizations (30 kg N ha-1) improved the vegetative parameters of soybeans without significantly increasing seed yield. The results obtained indicate, that moderate nitrogen fertilization (N30) is more beneficial for maintaining the balance between vegetative growth and soybean productivity.
5. Conclusions
Studies have shown that soybean growth, physiological activity and yield varied significantly depending on the cultivar, nitrogen rate and weather conditions. The ‘Malaga’ cultivar exhibited the highest potential photosynthetic efficiency (SPAD, Fv/Fm, PI) and the highest yield, while ‘Abelina’ showed the greatest sensitivity to environmental stress associated with rainfall deficiency. Nitrogen fertilization increased plant height and relative chlorophyll content in leaves, but a higher rate (60 kg N ha-¹) reduced chlorophyll fluorescence parameters, which may indicate a decrease in photosynthetic efficiency. The most favorable effects were obtained after applying a moderate rate of 30 kg N ha-¹, which had a positive effect on the physiological parameters of the plants without reducing potential photosynthetic efficiency, indicating a more balanced use of mineral and symbiotic nitrogen. A higher rate of N did not improve yields. The results confirm, that the selection of a suitable cultivar in combination with moderate nitrogen fertilization can increase physiological efficiency and promote soybean yield stability under variable environmental conditions. Further research should focus on better understanding the mechanisms responsible for the physiological efficiency and productivity of soybeans under different habitat conditions.
Author Contributions
Conceptualization, M.S. and E.B.; methodology, E.B.; investigation, E.B., K.C., A.S; resources, M.S..; data curation, E.B.; writing—original draft preparation, M.S.; writing—review and editing, M.S., E.B., K.C., A.S.; visualization, M.S.; supervision, M.S.; funding acquisition, E.B. All authors have read and agreed to the published version of the manuscript.
Funding
This research received no external funding
Institutional Review Board Statement
Not applicable
Informed Consent Statement
Not applicable.
Data Availability Statement
The original contributions presented in this study are included in the article. Further inquiries can be directed to the corresponding author.
Conflicts of Interest
The authors declare no conflicts of interest.
Abbreviations
The following abbreviations are used in this manuscript:
| PH | Plant height |
| LAI | Leaf area index |
| SPAD Fv/Fm |
Leaf greenness index Maximum quantum efficiency of PSII |
| PI TSW |
PSII performance index Thousand seed weight |
References
- Sun, J.; Mooney, H.; Wu, W.; Tang, H.; Tong, Y.; Xu, Z.; Huang, B.; Cheng, Y.; Yang, X.; Wei, D.; Zhang, F.; Liu, J. Importing food damages domestic environment: Evidence from global soybean trade. PNAS 2018, 115, 5415–5419. [Google Scholar] [CrossRef]
- Gaynor, L.G.; Lawn, R.J.; James, A.T. Agronomic studies on irrigated soybean in southern New South Wales. I. Phenological adaptation of genotypes to sowing date. Crop Pasture Sci. 2011, 62, 1056–1066. [Google Scholar] [CrossRef]
- Karges, K.; Bellingrath-Kimura, S.D.; Watson, C.A.; Stoddard, F.L.; Halwani, M.; Reckling, M. Agro-economic prospects for expanding soybean production beyond its current northerly limit in Europe. Eur. J. Agron. 2022, 133, 126415. [Google Scholar] [CrossRef]
- Górski, T.; Kozyra, J.; Doroszewski, A. Field crop losses in Poland due to extreme weather conditions: Case studies. In: The Influence of Extreme Phenomena on the Natural Environment and Human Living Conditions; S. Liszewski Ed.; ŁTN, Łodź, Poland, 2008; pp. 35–49.
- Hou, G.; Ablett, G.R.; Pauls, K.P.; Rajcan, I. Environmental effects on fatty acid levels in soybean seed oil. J. Am. Oil Chem. Soc. 2006, 83, 759–763. [Google Scholar] [CrossRef]
- Souza, G.M.; Catuchi, T.A.; Bertolli, S.C.; Soratto, R.P. Soybean under water deficit: Physiological and yield responses. In A Comprehensive Survey of International Soybean Research—Genetics, Physiology, Agronomy and Nitrogen Relationships; INTECH: London, UK, 2013; pp. 273–298. [Google Scholar] [CrossRef]
- Desclaux, D.; Huynh, T.T.; Roumet, P. Identification of soybean plant characteristics that indicate the timing of drought stress. Crop Sci. 2000, 40, 716–722. [Google Scholar] [CrossRef]
- Staniak, M.; Szpunar-Krok, E.; Kocira, A. Responses of soybean to selected abiotic stresses—photoperiod, temperature and water. Agriculture 2023, 13, 146. [Google Scholar] [CrossRef]
- Sentelhas, P.C.; Battisti, R.; Câmara, G.M.S. , Farias, J.R.B.; Hampf, A.C.; Nendel, C. The soybean yield gap in Brazil – magnitude, causes and possible solutions for sustainable production. J. Agric. Sci. 2015, 153, 1394–1411. [Google Scholar] [CrossRef]
- Tawaha, A.R.M.; Alatrash, H.; Jabbour, Y.; Al-Tawaha, A.R.; Qaisi, A.M.; Jammal, R.; Karnwal, A.; Shatnawi, M.; Saranraj, P.; Rammal, J. Drought stress and sustainable legume production. In Marker-Assisted Breeding in Legumes for Drought Tolerance, Springer, 2025, pp. 23–40. [CrossRef]
- Zanon, A.J.; Streck, N.A.; Grassini, P. Climate and management factors influence soybean yield potential in a subtropical environment. Agron. J. 2016, 108, 1447–1454. [Google Scholar] [CrossRef]
- Anas, M.; Liao, F.; Verma, K.K.; Sarwar, M.A.; Mhmood, A.; Chen, Z.-L.; Li, Q.; Zeng, X.-P.; Liu, Y.; Li, Y.-R. Fate of nitrogen in agriculture and environment: agronomic, eco-physiological and molecular approaches to improve nitrogen use efficiency. Biol. Res. 2020, 53, 47. [Google Scholar] [CrossRef] [PubMed]
- Kraiser, T.; Gras, D.E.; Gutiérrez, A.G.; González, B.; Gutiérrez, R.A. A holistic view of nitrogen acquisition in plants. J. Exp. Bot. 2011, 62, 1455–1466. [Google Scholar] [CrossRef]
- Szpunar-Krok, E.; Wondołowska-Grabowska, A.; Bobrecka-Jamro, D.; Jańczak-Pieniążek, M.; Kotecki, A.; Kozak, M. Effect of nitrogen fertilization and inoculation with Bradyrhizobium japonicum on the fatty acid profile of soybean (Glycine max (L.) Merrill) seeds. Agronomy 2021, 11, 941. [Google Scholar] [CrossRef]
- Ohyama, T.; Minagawa, R.; Ishikawa, S.; Yamamoto, M.; Van Phi Hung, N.; Ohtake, N.; Sueyoshi, K.; Sato, T.; Nagumo, Y.; Takahashi, Y. Soybean seed production and nitrogen nutrition. In: A Comprehensive Survey of International Soybean Research - Genetics, Physiology, Agronomy and Nitrogen Relationships. J. Board Ed., Publisher: IntechOpen, United States of America, 2013, pp. 115–157. [CrossRef]
- Fiolda, G.; Mrówczyński, M. (Eds.) Metodyka integrowanej ochrony i produkcji soi dla doradców [Integrated Pest Management and Soybean Production Methodology for Advisors]. IOR-PIB Poznań, 2016, ss. 137. [in Polish].
- Kaschuk, G.; Hungria, M.; Leffelaar, P.A.; Giller, K.E.; Kuyper, T.W. Differences in photosynthetic behavior and leaf senescence of soybean (Glycine max [L.] Merrill) dependent on N2 fixation or nitrate supply. Plant Biol. 2010, 12, 60–69. [Google Scholar] [CrossRef] [PubMed]
- Tagliapietra, E.L.; Streck, N.A.; da Rocha, T.S.M.; Richter, G.L. , da Silva, M.R.; Cera, J.C.; Guedes, J.V.C.; Zanon, A.J. Optimum leaf area index to reach soybean yield potential in subtropical environment. Agron. J. 2018, 110, 3. [Google Scholar] [CrossRef]
- Skowera, B. Changes of hydrothermal conditions in the Polish area (1971-2010). Fragm. Agron. 2014, 31, 74–87, [in Polish]. [Google Scholar]
- Rymuza, K.; Radzka, E. Analysis of trait stability of soybean cultivated under various environmental conditions. J. Water Land Dev. 2023, 59, 1–7. [Google Scholar] [CrossRef]
- Tabrizi, M.S.; Parsinejad, M.; Babazadeh, H. Efficacy of partial root drying technique for optimizing soybean crop production in semi-arid regions. Irrig. Drain. 2012, 61, 80–88. [Google Scholar] [CrossRef]
- Sadeghipour, O.; Abbasi, S. Soybean response to drought and seed inoculation. World Appl. Sci. J. 2012, 17, 55–60. [Google Scholar]
- Ku, Y-S.; Au-Yeung, W-K.; Yung, Y-L.; Li, M-W.; Wen, C-Q.; Liu, X.; Lam, H-M. Drought Stress and Tolerance in Soybean. In: A Comprehensive Survey of International Soybean Research - Genetics, Physiology, Agronomy and Nitrogen Relationships. INTECH: London, UK, 2013; pp. 209–237. [CrossRef]
- Nadeem, M.; Li, J.; Yahya, M.; Sher, A.; Ma, C.; Wang, X.; Qiu, L. Research progress and perspective on drought stress in legumes: A Review. Int. J. Mol. Sci. 2019, 20, 2541. [Google Scholar] [CrossRef]
- Mandić, V.; Krnjaja, V.; Tomić, Z.; Bijelić, Z.; Simić, A.; Đorđević, S.; Stanojković, A.; Gogić, M. Effect of water stress on soybean production. In Proceedings of the 4th International Congress New Perspectives and Challenges of Sustainable Livestock Production, Belgrade, Serbia, 7–9 October 2015. Available online: http://r.istocar.bg.ac.rs/handle/123456789/602. [Google Scholar]
- Eck, H.V.; Mathers, A.C.; Musick, J.Y. Plant water stress at various growth stages and growth and yield of soybeans. Field Crops Res. 1987, 17, 716–722. [Google Scholar] [CrossRef]
- Kobraee, S.; Shamsi, K. Effect of drought stress on dry matter accumulation and morphological traits in soybean. Int. J. Biosci. 2012, 10, 73–79. [Google Scholar]
- Oleksiak, T.; Arseniuk, E. Progress in crop breeding. Pam. Puł., 2002, 130, 509–521. [in Polish].
- Księżak, J.; Bojarszczuk, J. The seed yield of soybean cultivars and their quantity depending on sowing term. Agronomy 2022, 12, 1066. [Google Scholar] [CrossRef]
- Staniak, M.; Czopek, K.; Stępień-Warda, A.; Kocira, A.; Przybyś, M. Cold stress during flowering alters plant structure, yield and seed quality of different soybean genotypes. Agronomy 2021, 11, 2059. [Google Scholar] [CrossRef]
- Prusiński, J.; Baturo-Cieśniewska, A.; Borowska, M. Response of soybean (Glycine max (L.) Merrill) to mineral nitrogen fertilization and Bradyrhizobium japonicum seed inoculation. Agronomy 2020, 10, 1300. [Google Scholar] [CrossRef]
- Tuba, Z.; Saxena, D.K.; Srivastava, K.; Singh, S.; Czobel, S.; Kalaji, H.M. Chlorophyll a fluorescence measurement for validating the tolerant bryophytes for heavy metal (Pb) biomapping. Curr. Sci. 2010, 98, 1505–1508. [Google Scholar]
- Umburanas, R.C.; Yokoyama, A.H.; Balena, L. , Dourado-Neto, D.; Teixeira, W.F.; Reichardt, K.; Kawakami, J. Soybean yield in different sowing dates and seeding rates in a subtropical environment. Int. J. Plant Prod. 2019, 13. [Google Scholar] [CrossRef]
Figure 1.
Average monthly air temperature and monthly sum of precipitation in 2018-2019, taking into account the long-term average (1871-2000).
Figure 1.
Average monthly air temperature and monthly sum of precipitation in 2018-2019, taking into account the long-term average (1871-2000).
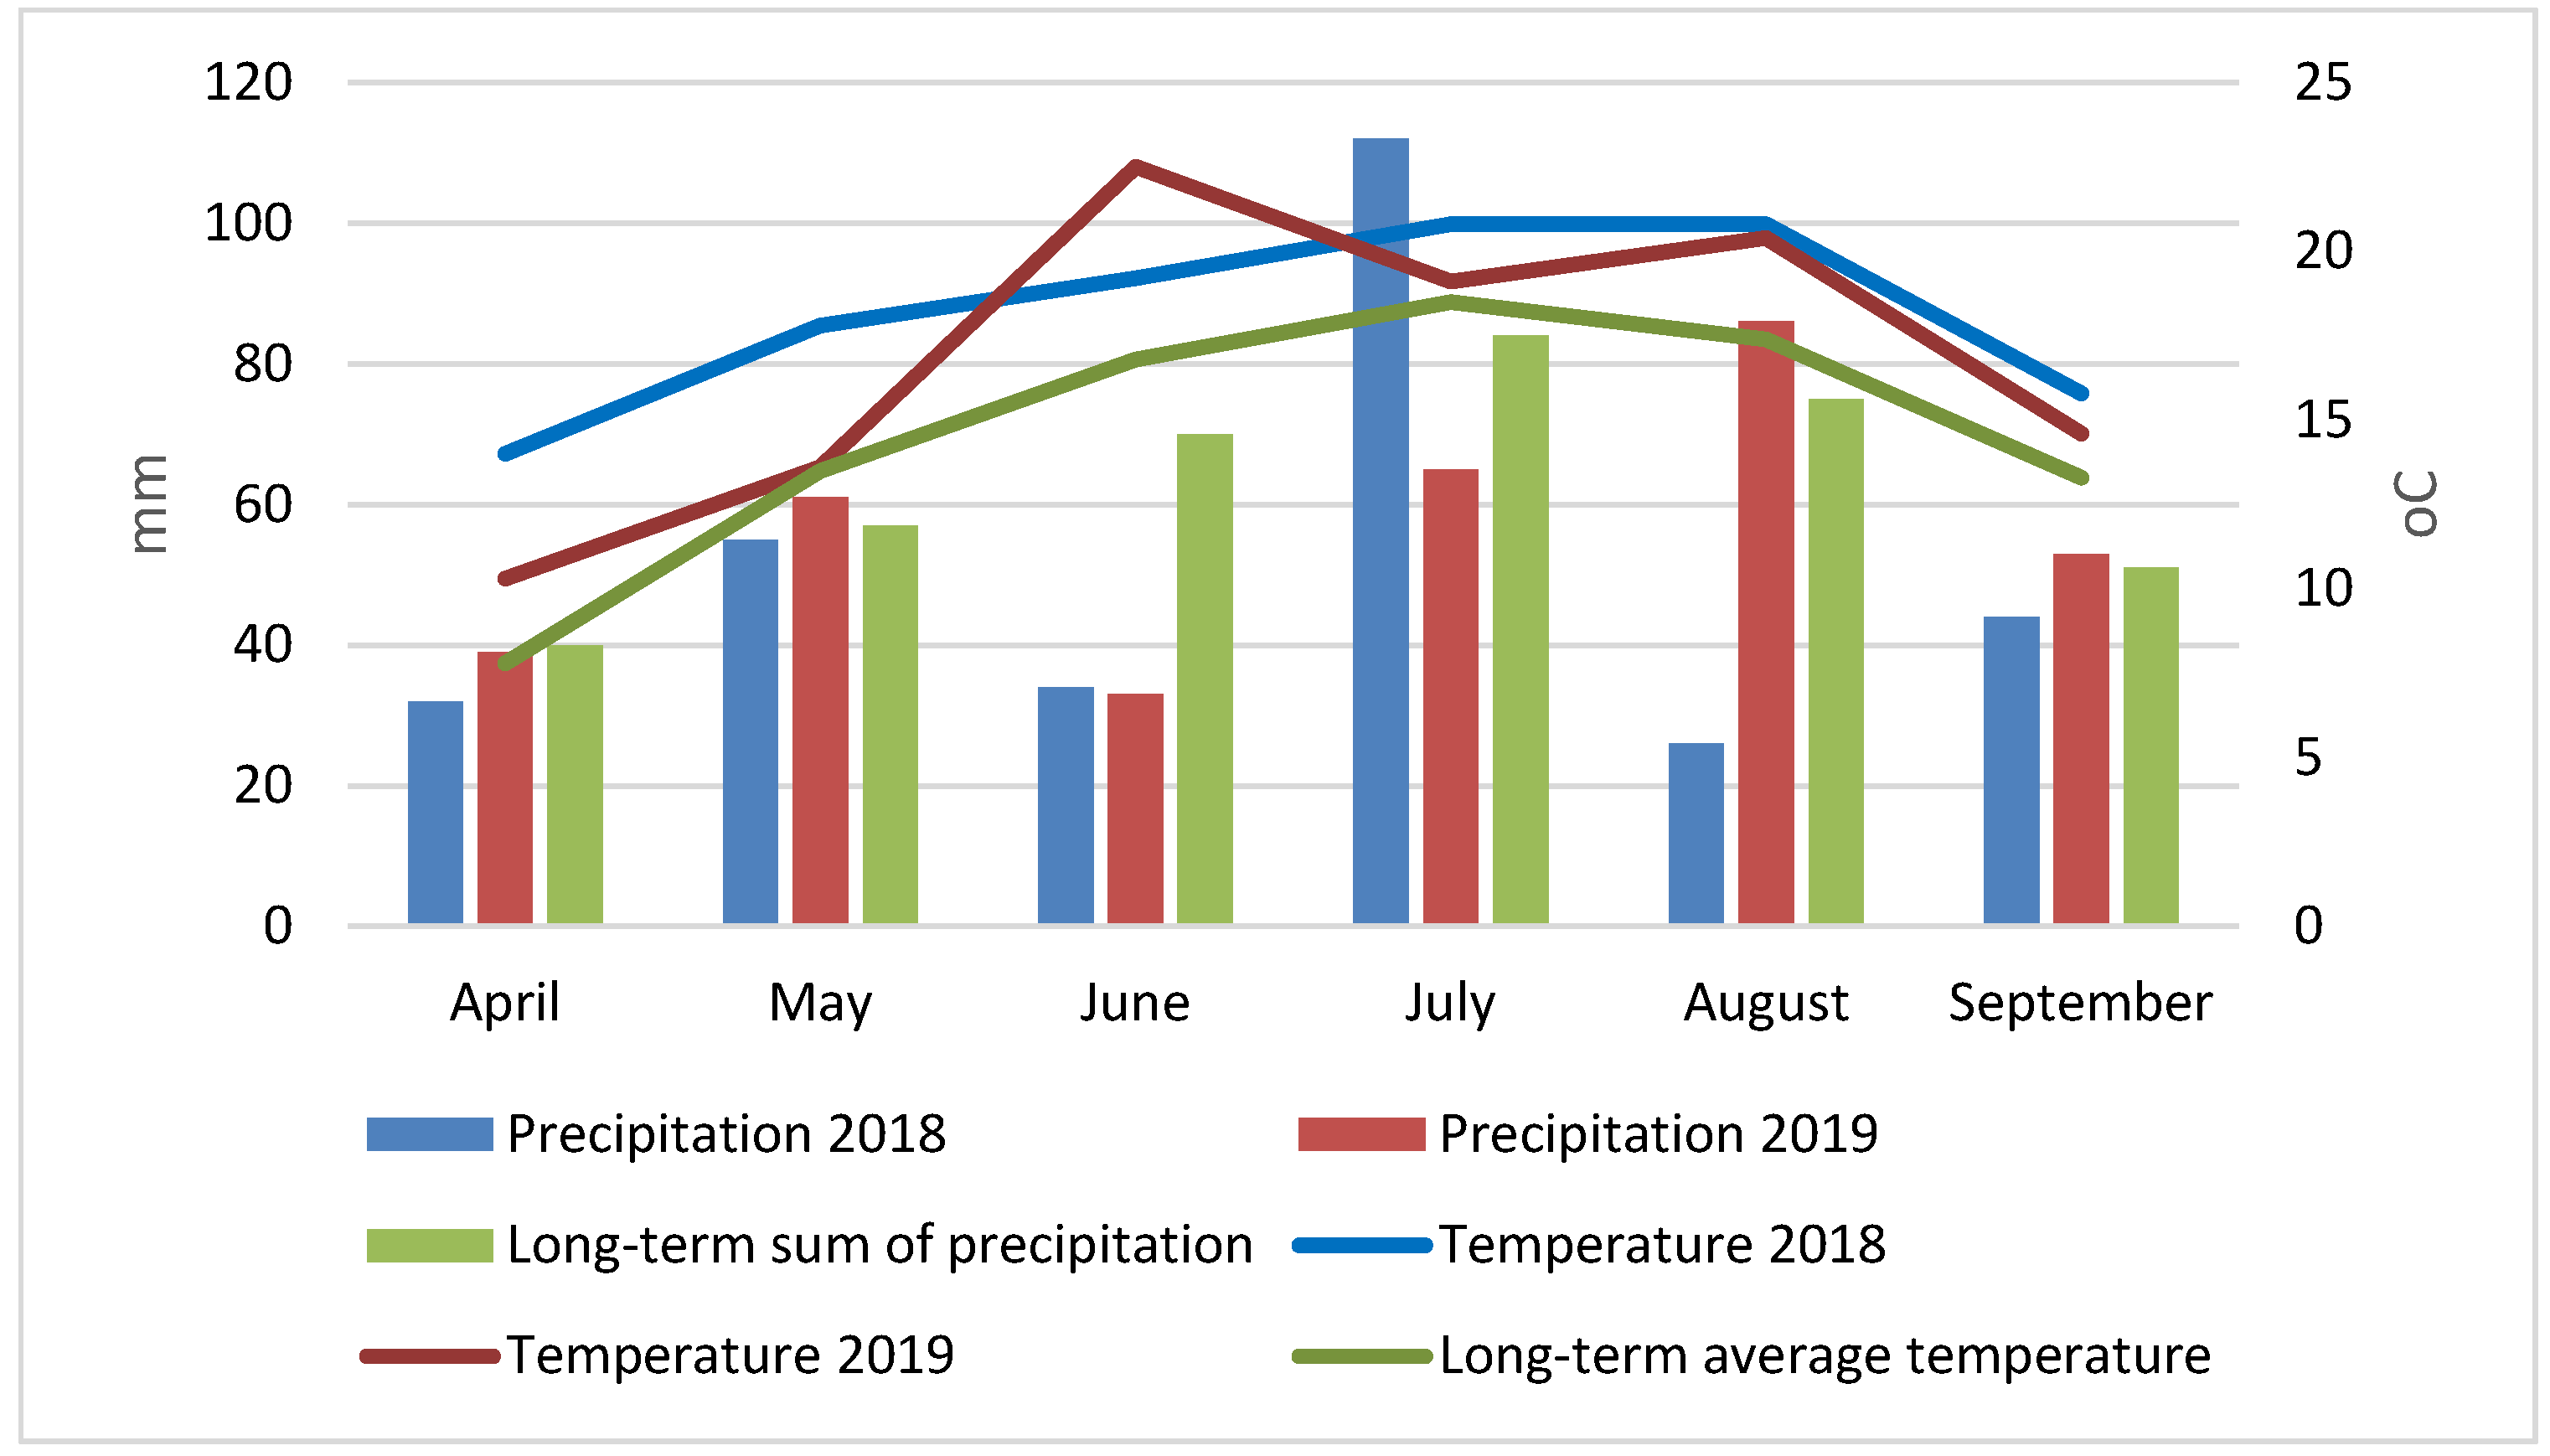
Figure 2.
Effects of the cultivar and nitrogen rate on: (a) the plant height, (b) leaf area index (LAI), (c) leaf greenness index (SPAD), (d) maximum quantum efficiency of PSII (Fv/Fm), (e) PSII performance index (PI). Means followed by different letters are significantly different. The level of significance p≤0.05 (HSD, Tukey test).
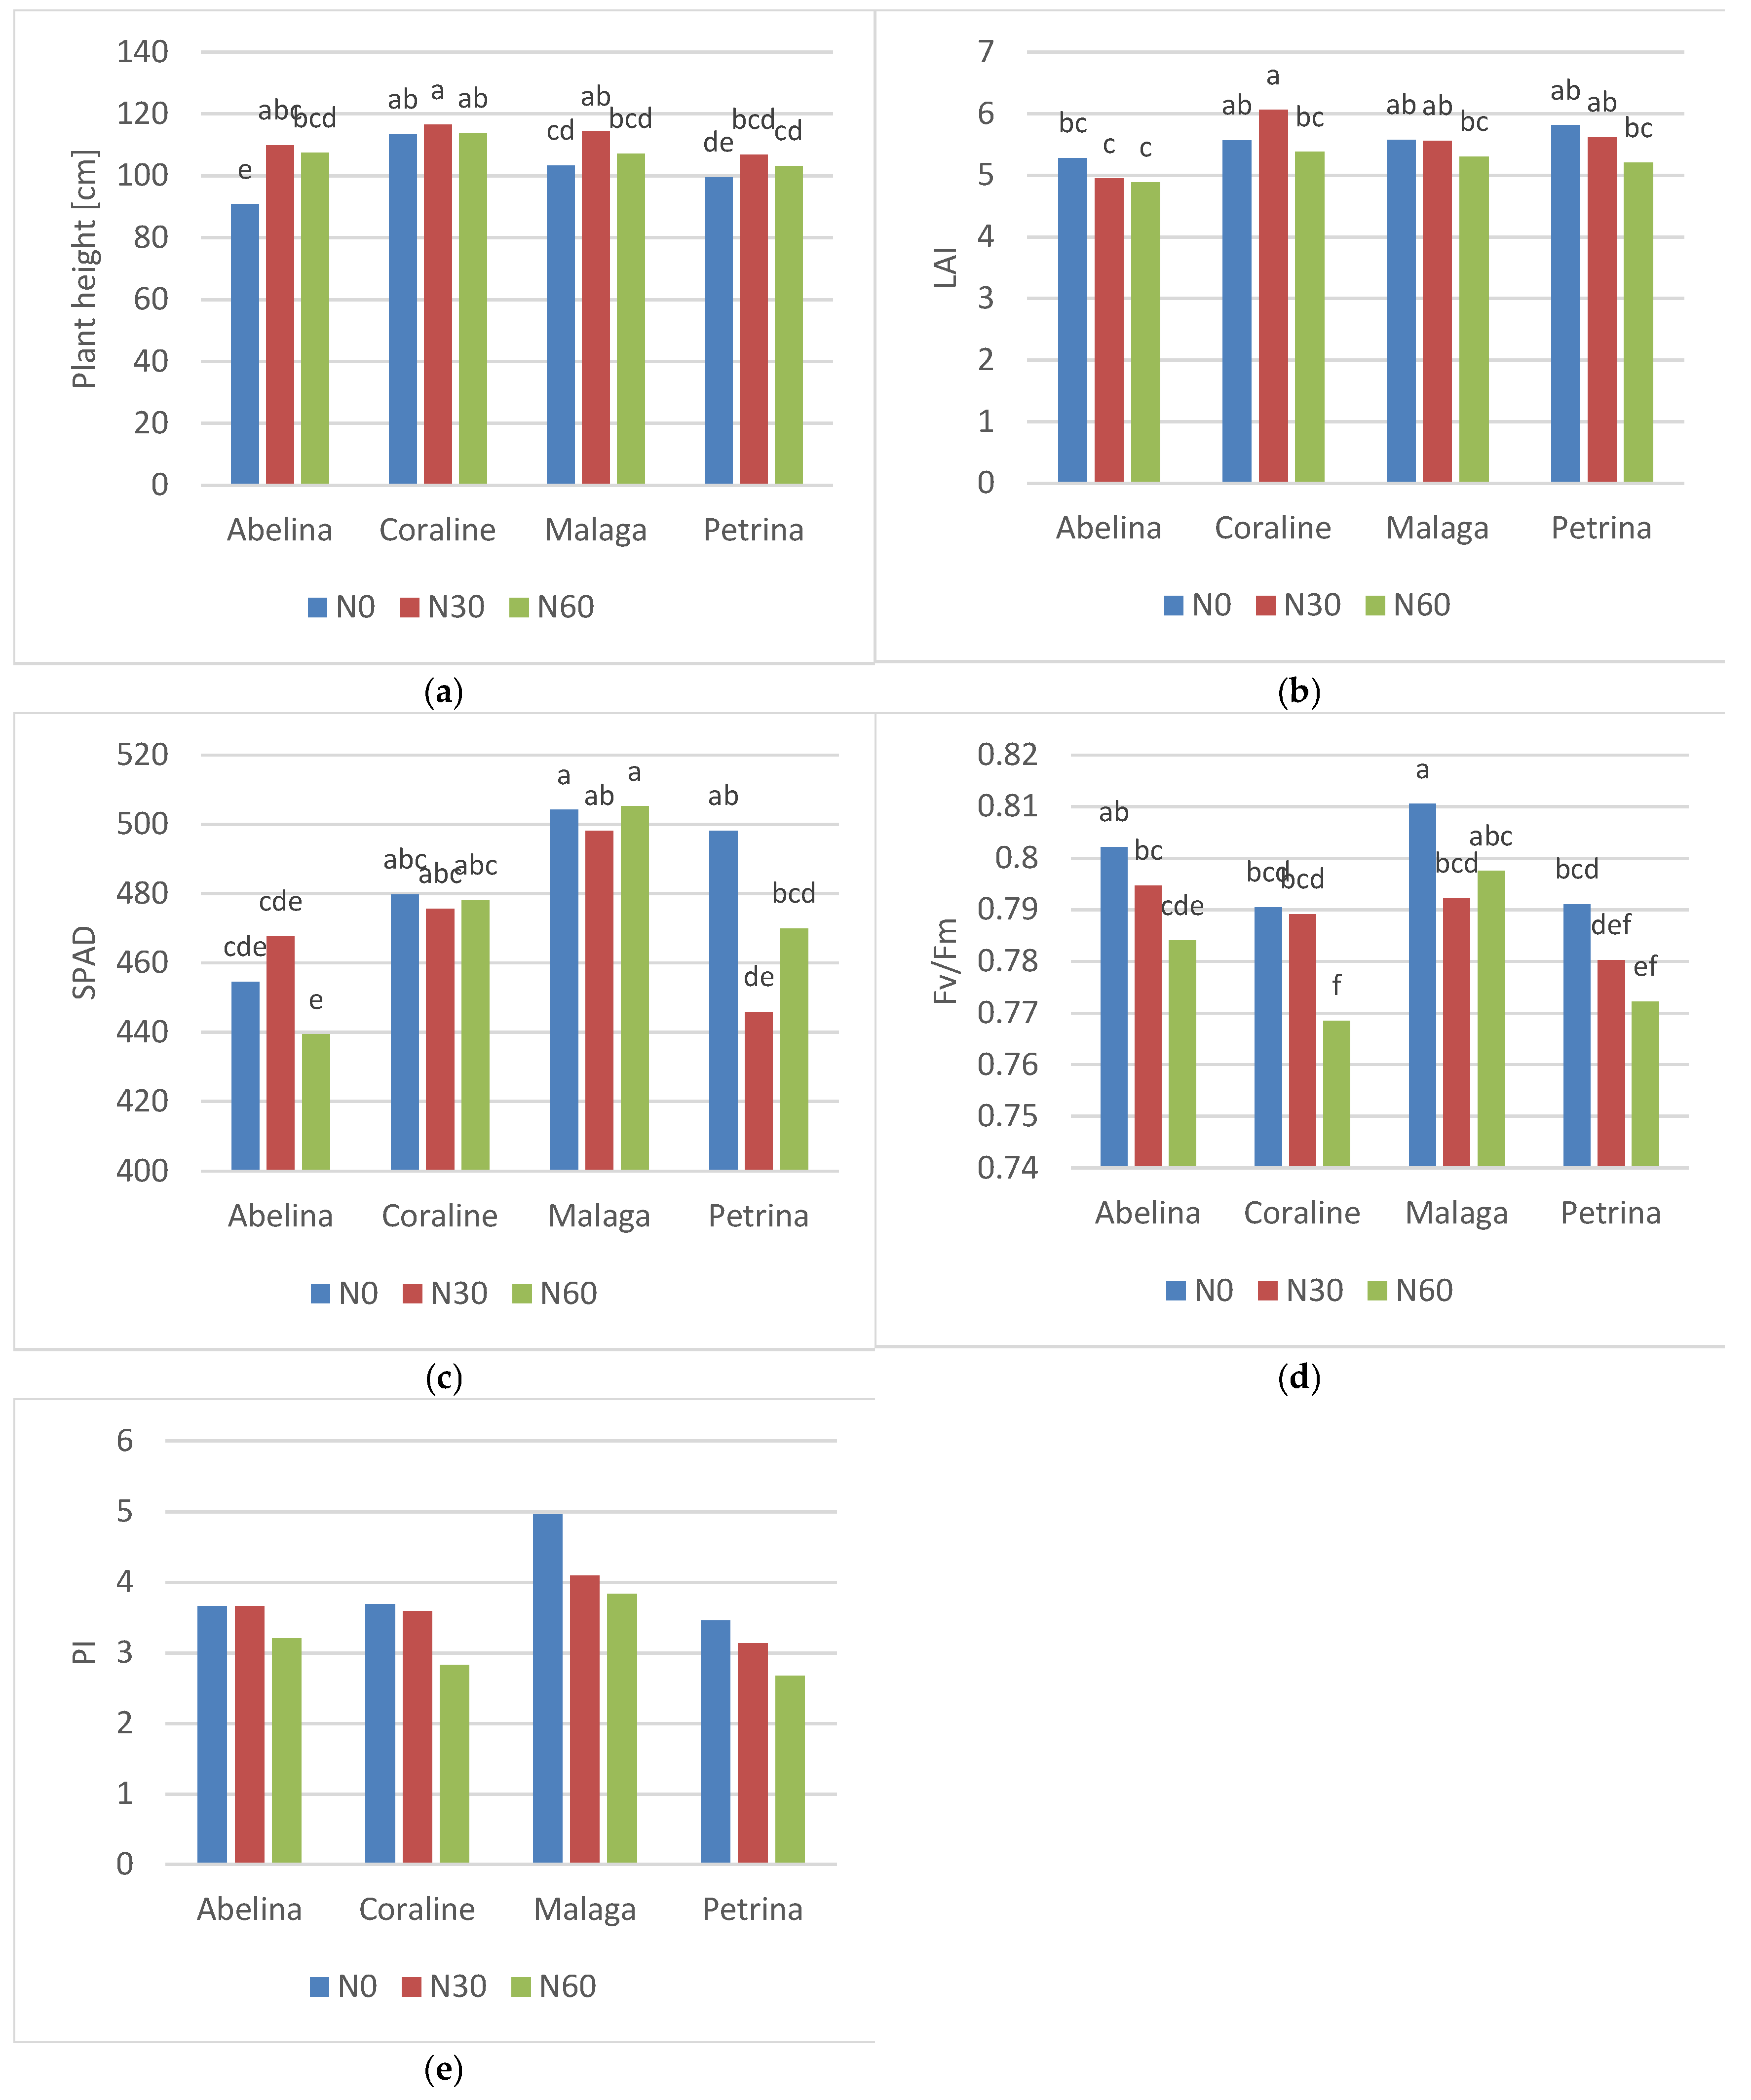
Figure 3.
Effects of the cultivar and nitrogen rate on: (a) seed yield, (b) thousand seed weight (TSW), (c) number of pods, (d) number of seeds, (e) weight of seeds; Means followed by different letters are significantly different. The level of significance p≤0.05 (HSD, Tukey test).
Figure 3.
Effects of the cultivar and nitrogen rate on: (a) seed yield, (b) thousand seed weight (TSW), (c) number of pods, (d) number of seeds, (e) weight of seeds; Means followed by different letters are significantly different. The level of significance p≤0.05 (HSD, Tukey test).

Table 2.
Effects of the variety, nitrogen rate and year on the plant height (PH), leaf area index (LAI), leaf greenness index (SPAD) and chlorophyll fluorescence indices: Fv/Fm – maximum quantum efficiency of PSII and PI – PSII performance index.
Table 2.
Effects of the variety, nitrogen rate and year on the plant height (PH), leaf area index (LAI), leaf greenness index (SPAD) and chlorophyll fluorescence indices: Fv/Fm – maximum quantum efficiency of PSII and PI – PSII performance index.
| Factor | Source of variation |
PH (cm) | LAI | SPAD | Fv/Fm | PI |
|---|---|---|---|---|---|---|
| Variety (V) | Abelina Malaga Coraline Petrina p-value |
102.7 c 108.3 b 114.5 a 103.2 c *** |
5.04 b 5.48 a 5.67 a 5.54 a *** |
453.9 c 502.4 a 477.8 b 471.3 b *** |
0.794 b 0.800 a 0.783 c 0.781 c *** |
3.507 b 4.296 a 3.369 bc 3.136 c *** |
| Fertilization (F) | N0 N30 N60 p-value |
101.8 c 111.9 a 107.9 b *** |
5.56 a 5.55 a 5.19 b *** |
484.1 a 471.8 b 473.2 b ** |
0.799 a 0.789 b 0.781 c *** |
3.940 a 3.620 a 3.136 b *** |
| Year (Y) | 2018 2019 p-value |
104.3 b 110.1 a *** |
4.51 b 6.36 a *** |
409.2 b 543.5 a *** |
0.750 b 0.829 a *** |
2.101 b 5.030 a *** |
| V x F V x Y F x Y V x F x Y |
p-value p-value p-value p-value |
*** *** ns ns |
* ns ns ns |
*** *** ** *** |
** *** *** *** |
ns *** * ns |
Means followed by different letters are significantly different. The level of significance: ***p≤0.001, ** p≤0.01, * p≤0.05, ns – not significant (HSD, Tukey test);.
Table 3.
Plant height (PH) and leaf area index (LAI) of soybean in 2018-2019.
| Treatment | PH (cm) | LAI | ||||
|---|---|---|---|---|---|---|
| 2018 | 2019 | 2018 | 2019 | |||
| Abelina | 102.6 c | 102.9 bc | 4.00 | 6.07 | ||
| Coraline | 114.9 a | 114.1 a | 4.81 | 6.53 | ||
| Malaga | 102.9 bc | 113.7 a | 4.55 | 6.41 | ||
| Petrina | 96.8 c | 109.6 ab | 4.67 | 6.42 | ||
| p-value | *** | ns | ||||
| N0 | 99.3 | 104.2 | 4.72 | 6.40 | ||
| N30 | 108.1 | 115.7 | 4.58 | 6.51 | ||
| N60 | 105.4 | 110.4 | 4.22 | 6.17 | ||
| p-value | ns | ns | ||||
Means followed by different letters are significantly different. The level of significance: ***p≤0.001; ns – not significant (HSD, Tukey test).
Table 4.
Leaf greenness index (SPAD) and chlorophyll fluorescence indices: Fv/Fm – maximum quantum efficiency of PSII and PI – PSII performance index, in 2018-2019.
Table 4.
Leaf greenness index (SPAD) and chlorophyll fluorescence indices: Fv/Fm – maximum quantum efficiency of PSII and PI – PSII performance index, in 2018-2019.
| Treatment | SPAD | Fv/Fm | PI | |||
|---|---|---|---|---|---|---|
| 2018 | 2019 | 2018 | 2019 | 2018 | 2019 | |
| Abelina | 372.1 e | 535.6 ab | 0.761 b | 0.827 a | 1.794 cd | 5.220 a |
| Coraline | 424.2 d | 531.3 b | 0.735 c | 0.830 a | 2.001 c | 4.737 a |
| Malaga | 455.1 c | 549.8 ab | 0.768 b | 0.832 a | 3.287 b | 5.306 a |
| Petrina | 385.3 e | 557.3 a | 0.735 c | 0.828 a | 1.322 d | 4.857 a |
| p-value | *** | *** | *** | |||
| N0 | 422.2 b | 546.0 a | 0.764 c | 0.833 a | 2.570 c | 5.311 a |
| N30 | 395.6 c | 548.0 a | 0.744 d | 0.835 a | 1.942 d | 5.297 a |
| N60 | 409.7 bc | 536.5 a | 0.741 d | 0.820 b | 1.791 d | 4.482 b |
| p-value | ** | *** | ** | |||
Means followed by different letters are significantly different. The level of significance: ***p≤0.001, ** p≤0.01, * p≤0.05 (HSD, Tukey test).
Table 5.
Effects of the cultivar, nitrogen rate and year on seed yield, thousand seeds weight (TSW) and yield structure of soybean by three-way ANOVA.
Table 5.
Effects of the cultivar, nitrogen rate and year on seed yield, thousand seeds weight (TSW) and yield structure of soybean by three-way ANOVA.
| Factor | Source of variation |
Number of pods per plant | Number of seeds per plant | Weight of seeds per plant (g) | Seed yield (t ha-1) |
TSW (g) |
|---|---|---|---|---|---|---|
| Variety (V) | Abelina Malaga Coraline Petrina p-value |
28.3 b 38.3 a 30.3 b 37.5 a *** |
50.4 b 78.5 a 56.8 b 69.7 a *** |
9.01 b 14.2 a 13.6 a 14.0 a *** |
4.25 c 4.42 b 5.06 a 4.39 bc *** |
169.7 c 186.5 b 229.8 a 190.5 b *** |
| Fertilization (F) | N0 N30 N60 p-value |
32.6 b 30.8 b 37.4 a *** |
62.3 b 58.1 b 71.2 a *** |
12.4 b 11.5 b 14.2 a ** |
4.17 b 4.65 a 4.77 a *** |
197.2 a 199.9 a 185.3 b *** |
| Year (Y) | 2018 2019 p-value |
35.2 a 32.0 b * |
66.8 a 60.9 b * |
12.9 a 12.5 a ns |
4.80 a 4.26 b *** |
188.9 b 199.4 a *** |
| V x F V x Y F x Y V x F x Y |
p-value p-value p-value p-value |
*** *** * ** |
*** *** ** ** |
*** ** * ns |
*** *** *** *** |
ns *** ns ** |
Means followed by different letters are significantly different. The level of significance: ***p≤0.001, ** p≤0.01, * p≤0.05, ns – not significant (HSD, Tukey test).
Table 6.
Seed yield and thousand seeds weight (TSW) of soybean in 2018-2019.
| Treatment | Yield of seeds (t ha-1) | TSW (g) | ||||
|---|---|---|---|---|---|---|
| 2018 | 2019 | 2018 | 2019 | |||
| Abelina | 4.29 cd | 4.21 cd | 177.6 c | 161.4 d | ||
| Coraline | 4.80 b | 4.05 d | 170.5 c | 202.4 b | ||
| Malaga | 5.71 a | 4.40 c | 230.6 a | 229.1 a | ||
| Petrina | 4.40 c | 4.39 c | 176.9 c | 204.1 b | ||
| p-value | *** | *** | ||||
| N0 | 4.11 b | 4.23 b | 192.2 | 202.2 | ||
| N30 | 5.06 a | 4.24 b | 195.9 | 204.0 | ||
| N60 | 5.23 a | 4.31 b | 178.6 | 192.0 | ||
| p-value | *** | ns | ||||
Means followed by different letters are significantly different. The level of significance: ***p≤0.001, ** p≤0.01, * p≤0.05, ns – not significant (HSD, Tukey test); TSW–thousand seed weight.
Table 7.
Yield structure of soybean in 2018-2019.
| Treatment | Number of pods per plant | Number of seeds per plant | Weight of seeds per plant (g) | |||
|---|---|---|---|---|---|---|
| 2018 | 2019 | 2018 | 2019 | 2018 | 2019 | |
| Abelina | 28.1 c | 28.5 c | 50.2 c | 50.6 c | 9.0 b | 9.0 b |
| Coraline | 44.5 a | 32.1 bc | 92.8 a | 64.2 bc | 15.5 a | 12.9 a |
| Malaga | 32.9 bc | 27.8 c | 61.8 bc | 51.9 c | 14.8 a | 12.3 ab |
| Petrina | 35.4 bc | 39.6 ab | 62.5 bc | 77.0 ab | 12.3 ab | 15.6 a |
| p-value | *** | *** | ** | |||
| N0 | 32.2 b | 33.1 b | 60.6 b | 64.0 b | 11.7 b | 13.1 ab |
| N30 | 32.0 b | 29.5 b | 59.4 b | 56.8 b | 11.5 b | 11.5 b |
| N60 | 41.5 a | 33.4 b | 80.5 a | 61.9 b | 15.5 a | 12.8 ab |
| p-value | * | * | * | |||
Means followed by different letters are significantly different. The level of significance: ***p≤0.001, ** p≤0.01, * p≤0.05 (HSD, Tukey test).
Table 8.
Pearson correlation coefficients (r) among the analyzed traits of soybean (n = 48).
| Variable | PH | NP | NS | SW | TSW | LAI | Fv/Fm | PI | SPAD |
|---|---|---|---|---|---|---|---|---|---|
| SY | 0.11 | 0.17 | 0.19 | 0.31* | 0.31* | -0.30* | -0.27 | -0.07 | -0.003 |
| PH | — | 0.09 | 0.20 | 0.19 | 0.06 | 0.21 | 0.05 | 0.10 | 0.23 |
| NP | — | — | 0.97*** | 0.90*** | -0.23 | -0.01 | -0.24 | -0.13 | 0.13 |
| NS | — | — | — | 0.89*** | -0.22 | -0.01 | -0.24 | -0.12 | 0.14 |
| SW | — | — | — | — | 0.11 | 0.06 | -0.07 | 0.05 | 0.28 |
| TSW | — | — | — | — | — | 0.28 | 0.42** | 0.48** | 0.39** |
| LAI | — | — | — | — | — | — | 0.75*** | 0.77*** | 0.80*** |
PH–plant height, NP–number of pods per plant; NS–number of seeds per plant; SW–seed weight per plant; TSW–thousand seed weight; LAI–leaf area index; Fv/Fm–maximum quantum efficiency of PSII; PI–PSII performance index; SPAD–leaf greenness index; SY–seed yield.
Disclaimer/Publisher’s Note: The statements, opinions and data contained in all publications are solely those of the individual author(s) and contributor(s) and not of MDPI and/or the editor(s). MDPI and/or the editor(s) disclaim responsibility for any injury to people or property resulting from any ideas, methods, instructions or products referred to in the content. |
© 2025 by the authors. Licensee MDPI, Basel, Switzerland. This article is an open access article distributed under the terms and conditions of the Creative Commons Attribution (CC BY) license (http://creativecommons.org/licenses/by/4.0/).
Copyright: This open access article is published under a Creative Commons CC BY 4.0 license, which permit the free download, distribution, and reuse, provided that the author and preprint are cited in any reuse.


