
Submitted:
19 November 2025
Posted:
21 November 2025
You are already at the latest version
Abstract
This study develops and characterizes a patented eco-friendly engineered cementitious composite (ECC) that incorporates waste glass powder (WGP) and silica fume (SF) as supplementary cementitious materials (SCMs) and recycled glass aggregate (WGA) as an alternative aggregate. Four stages of experimental design produced 14 concrete mixtures tested at 7, 28, 56, 90, and 120 days. Fresh and hardened properties were evaluated, and the optimal mixture, S8-1, A, achieved the requirements of strength class C60/75 and workability with slump class/ consistency class S3. Microstructural analyses using X-ray diffraction and optical microscopy confirmed the formation of secondary hydration products, particularly C-S-H and A-S-H, which contributed to matrix densification and improved performance. To complement the experimental program, an artificial neural network (ANN) was developed to predict compressive strength based on mixture proportions and curing age. Each strength measurement was treated as an independent data point, resulting in 70 samples for model training and testing. A shallow feedforward ANN with three hidden layers was implemented, trained using the Adam optimizer and validated with 10-fold cross-validation. The model achieved high predictive accuracy with R² of about 0.968, mean absolute error of 1.94 MPa, and root mean square error of 2.52 MPa. The results confirm that recycled WGP and SF can be effectively incorporated into ECC while ANN modeling provides a reliable tool for predicting compressive strength and supporting sustainable concrete mix design.
Keywords:
machine learning
; artificial neural network (ANN)
; compressive strength
; engineered cementitious composite (ECC)
; high-performance concrete (HPC)
; waste glass powder (WGP)
; silica fume (SF)
; waste glass aggregates (WGA)
; hyperparameter optimization
1. Introduction
Environmentally friendly concretes with glass aggregates, glass powder and ultrafine silica offer innovative solutions for sustainable construction. The use of supplementary cementitious materials (SCMs) obtained from the recycling of glass in powder form (Waste Glass Powder ((WGP) and as an industrial by-product (Microsilic/ Silica fume, (SF)) contributes not only to reducing the environmental impact but also to improving the physical and mechanical characteristics of engineering cementitious composites (ECCs). These types of ECCs can significantly contribute to the development of sustainable solutions in the construction industry. In the Waste Framework Directive DC2008/98/CE, recycling occupies a leading place in the process hierarchy, being located before landfill and incineration [1].
The development of new environmentally friendly materials, in a developing country such as Romania, gives the change in construction practices and the integration of ecological design for one of the most frequently used construction materials and which is one of the "greenest" options available [2], namely, concrete. Concrete meets many requirements of environmental responsibility, which is why it can be integrated in green design. Such products can support Romania in the transition from a linear to a circular economy [3,4]. The engineering cementitious composite (ECC) in this work is patented [5] and was developed for the purpose of designing and obtaining a sustainable concrete by simultaneously utilizing recycled glass waste in the form of alternative aggregates (WGA) and glass powder (WGP) but also to obtain an advanced class of concrete, which requires the use of ultrafine silica (SF) to effectively support the characteristics of the composites ECCs.
To document the research on concrete with aggregates and glass powder, the extensive work of Shayan A. (2002) [6], Meyer C. et. al (1996) [7] and Shi C., (2004) [8], in which very detailed information is found on the adverse influence of the use of recycled glass aggregates in concrete and on the need to use a shrinkage inhibitor, to cancel ASR reactions (alkali - aggregates, alkali - silica). The SCMs used in our study also have the role of inhibitors of destructive reactions, in the case of WGA use. Studies of concrete with glass in various forms and dimensions have been carried out and quite a few after 2014, of which, I will list only a few [9,10,11]. Despite all the production of scientific works, the research on this ternary composition has not been highlighted. Only after 2020 do composite matrices like those in the present study appear and much more rarely for obtaining High Performance Concretes (HPC) and Ultra-High-Performance Concrete (UHPC), the latter being made with dispersed reinforcement and much more cement [12,13,14,15,16,17,18,19,20,21].
The results presented in this paper for obtaining concrete mixtures were completed in four stages. Stage I, consisted of the development of several trial mixes, with various values of the Water/Cement (W/C) ratio and superplasticizer dosages. The result of this first step was reference mix S7, which meets strength and workability criteria proposed. Stage II consisted of developing control mixtures marked M and Mr. These were necessary to compare the results obtained on the S7 mixture and with the following mixtures that will be developed in stages III and IV. In the M mixture, crushed quarry aggregates are used, while the Mr mixture uses crushed river stone as aggregates. Stage III consisted of the development of 3 mixes, namely S8-1, S8-2 & S8-3. The quantitative variations of materials can be seen in Table 4. Stage IV consists of the development of two new mixes: S8-1, A and S8-1, B based on the results obtained for mixes S7 and S8-1. Of the two designed S8-1 mixtures, A meets the consistency criterion, being an easy-to-place concrete, and also that of compressive strength, reaching the strength class level of C 60/75, being a high-performance concrete (HPC).
To confirm the macro-level development of the compressive strength and characteristics of the engineering cementitious composites (ECCs), especially S8-1, A, nano-level tests (SEM, XRF) were performed, which highlighted the chemical compounds responsible for the formation of minerals, respectively the hydration products of the ternary matrix. The results are also due to the intense pozzolanic activity of SF and WGP, from the designed mixtures, both with high SiO2 content. SF, having also a very large specific surface area compared to CEM and WGP, makes the greatest contribution to the development of compressive strength and all other characteristics in the hardened state.
Artificial intelligence (AI) and machine learning (ML) methods have become valuable tools in materials engineering for modeling the complex relationships between mixture parameters and mechanical performance. Conventional regression or empirical models often fail to capture nonlinear interactions among constituents in advanced concretes that include supplementary cementitious materials or recycled waste products. Artificial Neural Networks (ANNs), in particular, have shown strong capability in predicting key mechanical properties such as compressive strength, tensile strength, and fracture energy, even when experimental data are limited. By integrating AI-based prediction with experimental work, the design of sustainable, high-performance concrete mixtures can be significantly accelerated, reducing reliance on costly and time-consuming laboratory testing [22,23,24].
Therefore, in addition to the experimental investigations, this study aims to develop and evaluate optimized ANN models for predicting the compressive strength of high-performance eco-friendly concrete incorporating recycled waste glass and silica fume. The combined experimental and computational approach demonstrates how AI can be effectively applied to support mix design optimization and enhance the sustainable development of next-generation cementitious materials.
2. Materials and Methods
The challenge of designing the mixtures and the ECCs was to incorporate the glass aggregates with coarse dimensions so as to achieve an ECC of high strength and performance. By using WGP and SF, the goal was achieved following four design stages, briefly presented.
2.1. The Ternary Binder (CEM + WGP + SF)
The main binder used in the designed mixtures was Portland cement CEM I 52.5R, in accordance with the harmonized standard SR EN 197-1 [25], with a strength class of 52.5 MPa and fast curing. In order to reach high strength classes for the composite, it is necessary to use a high-class cement. This cement is also used due to its low alkali content, reducing the possibility of alkaline-aggregate and alkaline-silica (ASR) reactions, respectively reducing their negative effects on the concrete produced [26,27]. The manufacturer reports that the grinding fineness of this EMF was 4560 + 120 cm2/gr, with a sulphate (SO3) content of 3,4 + 0,4 %. The physical and mechanical characteristics of cement are found in. Table 1.
The ternary binder is made up of CEM I 52,5 R cement and two SCMs, namely silica fume SF, an industrial by-product, and WGP, a product obtained from the recycling of post-consumer glass, in powder form (Waste Glass Powder). SF and WGP are pozzolanic materials, chemically activated during cement hydration. In European standards, respectively in the harmonized Romanian ones, these SCMs are also called “Type II Additives“ in accordance with SR EN 206 +A2 [31], being taken into account in the composition of the concrete designed in accordance with the concrete norm NE 012-1 [32].
SF Type II Additive (pozzolanic or latent hydraulic) is an ultra-fine MICROSILICA silica supplied by BASF Construction Chemicals. The experimental program used the Grade 940-U variant, hereinafter referred to as "silica fume", which is an ultra-fine, non-densified silica, with an apparent weight of 250 ÷ 300 kg/m3, with a specific surface area of 16,4 m²/g and with a SiO2 content > 90 %. Given the very high fineness of ultra-fine silica granules (size between 0,01 ÷ 0,5 μm), it was used in concrete mixes to create a dense and compact structure by increasing the density of the matrix and implicitly supporting the characteristics of ECCs. The distribution of SF particles is shown in Figure 1.
WGP with particles < 0,250 mm can be used as a fine glass aggregate, as a cement substitute due to the fine powder content, and as an addition to the designed mixture. In Figure 2, the ternary group (CEM + WGP + SF) in the dry mixture of S8-1, A can be observed, which became representative at the end of the research.
In a supporting study [34] for the present one, we made a standard cement mortar and other compositions with SF, for a substitution of 10 % and 20 % of the cement, respectively. Through electron microscopy (SEM) performed on fragments of samples obtained after determining the compressive strength, it was possible to observe how the fine glass particles are consumed in the pozzolanic reactions that begin in the hydration process of the cement particles in the mixing water. These are represented by SEM images of the mortar composites with WGP in Figure 3 [34]. Very good compressive strength results were obtained for the designed mixture with a 10 % substitution, exceeding the standard mixture (46,7 MPa) in the case of substitution with WGP (48,8 MPa) and SF (69,2 MPa) but also in the case of substitution of 20 % SF (67,2), tests performed on 40 x 40 x 40 mm specimens.
Through X-ray fluorescence (XRF) analysis performed on cement, ultrafine silica, glass powder and river sand, the chemical composition of these raw materials is obtained, presented in Table 2.
Figure 4, Figure 5 and Figure 6 show the mineralogical compositions of EMC, SF and WGP, the components can be found in the legend of the graph in the figure. The mineralogical copositions were obtained by X-ray diffractions.
The main mineral phases of CEM are Calcium Silicate, Calcite, Brownmilerite, Lamite; of the SF are Quartz, Rutile, Bearing; of the WGP are Quartz, Calcite, Cobaltite.
2.2. Natural and Alternative Aggregates
The materials introduced into the designed mixtures are shown in Figure 7 and in Table 3, their physical characteristics.
Grade 0/4 mm is considered fine sand-type aggregate and 4/8 mm and 8/16 mm of the work are considered coarse gravel aggregate.
For the Mr control mixtures, crushed river aggregates (CRA) with the dimensions of 4/8 mm and 8/16 mm were used, respectively for the control mixtures M, crushed quarry aggregates (CAC)// Crushed aggregates / Chippings (CAC).
2.3. Water and Superplasticizer Admixture
The water used for the concrete mixtures was from the city's drinking water circuit. The Water/ Cement ratio for the mixtures was 0,35 except for the final mixtures where it is slightly increased to 0,36. The strong water-reducing superplasticizer admixture based on polycarboxylates comes from BASF Chemical Company and is called Glenium ACE 30. It was used at a percentage of 2 % compared to the reference cement quantity, with the exception of the final mixtures, those in Stage IV, respectively S 8-1, A and S 8-1, B at 2,50 %, these can be found in Table 4.
2.4. Stages in the Evolution of Design ECCs_The Developed Models Demonstrative
The proportions of the projected mixtures are shown in Table 4. All SCMs calculations are related to the initial cement quantity of 465 kg/m3. WGP in the composition of the mixtures, substitutes 10 % of the mass of cement in the control mixture (465 kg/m3) and 10% WGP (46,5 kg/m3) is an additional quantity to the amount of binder.

Table 4.
ECCs mixture proportions.
|
Mix |
Mixture Proportions | ||||||||||||
|---|---|---|---|---|---|---|---|---|---|---|---|---|---|
| CEM I 52,5 R | SF 10% |
WGP ≤ 0.250 20÷30% |
2 NRA 0/4 45% |
WGA 0/4 45% |
WGA 4/8 30% |
WGA 8/16 25% |
Water |
1 Admixcer ACE 30 |
Density | W/C | W/B | Stages | |
| kg/m3 | kg/m3 | kg/m3 | kg/m3 | kg/m3 | kg/m3 | kg/m3 | lit/m3 | lit/m3 | kg/m3 | ||||
| 4 S 7 | 465 | 46.5 | - | 749 | - | 500 | 416 | 153.5 | 9.30 | 2339 | 0.35 | 0.250 | I |
| S 8-1 | 372 | 46.5 | 93 | 767 | - | 511 | 426 | 122.8 | 7.44 | 2346 | 0.35 | 0.250 | III |
| S 8-2 | 465 | 46.5 | - | - | 716 | 477 | 398 | 153.5 | 9.30 | 2265 | 0.35 | 0.250 | |
| S 8-3 | 372 | 46.5 | 93 | - | 744 | 496 | 413 | 122.8 | 7.44 | 2295 | 0.35 | 0.250 | |
| S 8-1, A | 372 | 46.5 | 93 | 761 | - | 507 | 423 | 125.9 | 9.30 | 2338 | 0.36 | 0.260 | IV |
| S 8-1, B | 372 | - | 139.5 | 761 | - | 507 | 423 | 125.9 | 9.30 | 2337 | 0.36 | 0.260 | |
| NRA 0/4 | CRA 4/8 | CRA 8/16 | II | ||||||||||
| 4 Mr | 372 | 46.5 | - | 820 | - | 540 | 457 | 122.8 | 7.44 | 2376 | 0.35 | 0.311 | |
| NRA 0/4 | 3CAC 4/8 | 3CAC 8/16 | |||||||||||
| 4 M | 372 | 46.5 | - | 810 | 540 | 450 | 122.8 | 7.44 | 2349 | 0.35 | 0.311 | ||
1 The additive plus the amount of water is included in the calculation of the W/C ratio; 2 0 /4 mm Natural River Aggregate for all the mixes (NRA); 3 4/8 mm, 8/16 mm Crushed River Aggregates (CRA); 4 S7 is the benchmark mixture of the 7 mixtures designed in stage I and Mr and M are control mixtures, made with crushed river aggregates (CRA) and quarry crushed aggregates (CAC)// Crushed aggregates / Chippings (CAC)., respectively; All SCMs calculations are related to the initial cement quantity of 465 kg/m3.
2.5. Artificial Neural Network (ANN) Modeling Approach
Artificial Neural Networks (ANNs) were used in this study as a predictive tool for estimating the compressive strength of the designed concrete mixtures. Since the number of mixture designs was limited to 14, each compressive strength value measured at different curing ages (7, 28, 56, 90 and 120 days) was considered as an individual data point. By treating age-dependent strength development separately, the total dataset expanded to 70 samples. This approach has been applied in previous studies on concrete strength prediction where curing age plays a decisive role in strength gain [35,36].
2.5.1. Input and Output Variables
The ANN models were developed using mixture composition and curing age as input features. The main mixture parameters included the cement content, silica fume (SF), waste glass powder (WGP), type of aggregates, water-to-binder (W/B) ratio, and dosage of the superplasticizer. The curing age was also included as an input variable to account for the progressive development of strength over time. The target output was the measured compressive strength (MPa) of each sample.
2.5.2. Network Architecture
A shallow feedforward ANN was adopted because such networks have been demonstrated to perform effectively with small datasets, while also being less prone to overfitting compared to deeper networks [37,38,39]. The chosen ANN consisted of three hidden layers, with the number of neurons in each layer determined through trial-and-error and supported by grid search hyperparameter tuning. The rectified linear unit (ReLU) activation function was employed for the hidden layers, while a linear activation was used for the output layer. The architecture of the artificial neural network is shown in Figure 8.
2.5.3. Training Procedure
The models were implemented in Python using the TensorFlow/Keras library. Training was performed using the Adam optimization algorithm, which combines the advantages of adaptive learning rates and momentum. The loss function was defined as mean squared error (MSE), which is a standard measure for regression-type problems such as strength prediction. The batch size and learning rate were tuned during the optimization process to improve the convergence of the network.
2.5.4. Data Preprocessing
Prior to training, all input variables were normalized to the range [0,1]. This step ensured that variables with larger magnitudes did not dominate the learning process and that the network converged more efficiently. The expanded dataset of 70 samples was randomly split into training and testing sets, with 70 percent of the data used for training and 30 percent reserved for independent testing.
2.5.5. Validation Strategy
To further assess the robustness of the ANN, a 10-fold cross-validation strategy was applied. In this method, the dataset is divided into 10 subsets, and the network is trained on nine subsets while the remaining one is used for validation. This process is repeated 10 times until each subset has been used once for validation. Cross-validation is widely recommended for small datasets, as it provides a more reliable estimate of the model’s predictive capability than a simple train/test split [40].
2.5.6. Performance Evaluation
The predictive accuracy of the ANN was evaluated using several statistical measures: coefficient of determination (R²), mean absolute error (MAE), and root mean square error (RMSE). R² indicates the proportion of variance in the experimental data explained by the model, while MAE and RMSE quantify the absolute and squared deviations between predicted and measured strengths. These metrics have been widely adopted in previous studies involving ANN-based prediction of concrete properties [36,41,42].
3. Results
For the designed high-strength concrete class C60/75, the workability of the fresh mix for easy installation and compressive resistance were pursued. Also, the microstructure and compositional characteristics of the optimally selected mixture (S8-1, A) have also been investigated using polarized light optical microscopy (OM) and powder X-ray diffraction (PXRD) for the qualitative analysis of crystalline constituents.
3.1. Slump
3.2. Compressive Strength of ECCs Mixtures and Other Characteristics of Durability
3.3. Optical Microscopy and Powder X-Ray Diffraction (PXRD) Method for Qualitative Analysis of Crystalline Constituents
3.3.1. The Mineralogical Composition of ECC, S8-1, A with Powder X-Ray Diffraction Method (PXRD)
X-ray diffraction (XRD) was performed on S8-1, A, using a Bruker D8 Advance diffractometer with Cu Kα radiation (λ = 1.541874 Å), a 0.01 mm Fe filter, and a one-dimensional LynxEye detector at the Department of Geology, Babeș-Bolyai University (Cluj-Napoca, Romania). For this X-ray analysis, fragments from specimens S1-8, A were mortified to powder sizes to obtain an overview of the mineralogical composition of the composite ECC, S8-1, A, shown in the legend in Figure 11.
Minerals are formed during cement hydration. X-ray investigation performed on the sample from mixture S8-1, A indicated the presence of mineral phases originating from aggregates (Quartz, Muscovite, Albite), as well as newly formed minerals, such as Portlandite (Ca (OH)2) and Calcite (CaCO3).
3.3.2. Optical Microscopy with Polarizing Light
For this analysis, thin sections of the investigated concrete sample S8-1, A were prepared and one-Nikon Optiphot T2 – Pol was used for optical studies (textural and compositional) at the crossed and parallel polars (microscope conditions), respectively, as well as for taking photographs. In the microscopic study with crossed polarizing light (Nt - crossed polar) the glass is dark in color and in the twin image (1N - one Nicol) on the left it is transparent. The images are in the mirror.
In Figure 12, images obtained by exposure to polarizing light are presented to observe the anisotropic (crystallized) state of the S8-1, A engineering cementitious concrete composite. In this analysis, a microscopic study with polarizing light was performed on thin strips taken from the ECC, S1-8, A specimen, which highlights certain properties. The microscope conditions are 1 Nicol/ one nicol polar (left images) and Nt/ crossed polar (right images). It is observed that all natural and glass aggregates are crystallization support for minerals in the dense matrix. The minerals form during hydration and are observed as bright formations around the aggregates, (C-S-H and A-S-H) as in Figure 12 (c), (d), (e) and (f).
In addition to portlandite, muscovite, calcium silicate hydrate (C-S-H) and aluminum silicate hydrate (A-S-H) new minerals formed during hydration are visible. The fact that there is non-hydrated clinker shows the prospect of increasing compressive strength under favorable storage conditions.
4. Discussion
Given that the main characteristics targeted in this work are workability and compressive strength for a high-performance ECCs. Having achieved a high strength for a high-density ECC, the results for durability characteristics are implicitly increased. ECC, S8-1, A enters the evaluation of predictions, having the best characteristics in the fresh and hardened state, ranking in the compressive strength class of C60/75, for a high-strength and performance concrete.
4.1. The Ternary Binder (CEM + WGP + SF)
SF has the role of increasing the densification of the mixture, supporting all the short and long-term properties, and WGP stands out by supporting the wear resistance [26] and also on the densification of the mixture the smaller the granulation. SF and WGP also act as an inhibitor of alkali-silica reaction (ASR), eliminating the possibility of cracks from contractions. Many studies by researchers have reported that WGP ground into a fine powder, as close as possible to that of cement and due to its high SiO2 content, is a very effective SCM alternative, following the activation of the pozzolanic reaction [43,44,45,46,47,48,49].
4.2. Fresh State Characteristics of S8-1, A
The slump for the composition S8-1, A has a higher value than the composition S8-1, B due to the lower amount of WGP which reduces the workability of the concrete by the fact that the shape of its granules is not spherical as in the case of SF. The value obtained in consistency class S3 is due to the lower water absorption which compensates for the spherical shapes of SF but with a high-water absorption. Thus, a good packing density of the coarse aggregates WGA and good cohesion between them is achieved, without opposing the flow (we are talking about crushed glass aggregates).
4.3. Optical Microscopy and Powder X-Ray Diffraction (PXRD) Method for Qualitative Analysis of Crystalline Constituents. Microstructure Characterization
The major mineral phase for SF and WGP is crystalline silica oxide (SiO2) while cement has calcium oxide (CaO).
Kunther, W. et al (2017) [50] discovered in his studies that low Ca/Si ratios, in the matrix of the designed mixtures, influence the increase in compressive strengths and their evolution over time, due to the quantitative increase in C-S-H phases. In the initial stages, an additional amount of C-S-H can act as a nucleus for faster formation of the hydrated gel, leading to significant increases in compressive strength at 7 or 28 days. This effect is observed in studies using additional C S H nanoparticles, especially when combined with SCMs as an addition or as cement substitutes. [51]. Since additional C-S-H continues to form and densify the internal network, improving the microstructure in proportion to the curing time of the ECC, it leads to a continuous development of strength, [52,53].
The hydrated calcium silicate gel (C-S-H) is the fundamental phase that influences most of the mechanical properties of hardened concrete.
4.4. Compressive Strength of ECCs Mixtures and Other Characteristics of Durability
All that was mentioned in the previous chapter 4.3. confirms the influence of the use of SCMs in the composition of ECCs for the evolution of the characteristics in the hardened state in particular. The results show that the particle size and the degree of hydration of the cement together with SCMs in the matrix continued to develop up to 120 days (the last age of compressive strength testing), thus resulting in very good characteristics of the ECCs, especially of ECC, S8-1, A which is classified in strength class C60/75, as high-performance concrete, just like ECC, Witness M.
The concrete class is defined based on the characteristic compressive strength fck, 28, in Table 7, which is determined on cubic specimens with a side of 150 mm or cylindrical specimens of 150/300 mm, hardened under standard conditions and tested at the age of 28 days under laboratory conditions. To establish the characteristic compressive strength fck,cub, different sources suggest the relationships shown in Table 6.
Table 6.
Relations used to determine characteristic strength.
| Reference | Formula | Maximum concrete class |
|---|---|---|
| fib (Buletin 42) [54] | 1fcm = fck + Δf, Δf = 8 MPa | C120 / 140 |
| NE 012-1/ (SR EN 206-1) [31,32] | fcm = 2fck + (6 ÷ 12) MPa | C105 / 115 |
1fcm – the average compressive strength of concrete at a certain age. 2fck, cub – the characteristic compressive strength of concrete determined by testing cubic specimens measuring 150 x 150 x 150 mm.
Table 7.
ECCs - Strength class achieved.
| Compressive strength | ECCs | |||||||
|---|---|---|---|---|---|---|---|---|
| S7 | S8-1 | S8-2 | S8-3 | S8-1, A | S8-1, B | M | Mr | |
| fcm 28 days | 69.6 | 70.3 | 68.0 | 79.6 | 83.0 | 50.3 | 87.9 | 79.7 |
| fk, | 61.6 | 62.0 | 60.0 | 71.6 | 75.0 | 42,3 | 79.9 | 71.7 |
| Strength class achieved/ concrete-class cubic specimens |
C50/60 | C50/60 | C50/60 | C50/60 | C60/75 | C30/37 ÷ C35/45 | C60/75 | C55/67 |
Since the value Δf = 8 MPa from the relation proposed by fib (International Federation for Structural Concrete) falls within the range (6 ÷ 12) MPa proposed by the concrete standard in our country [31,32] this value is considered in establishing the concrete strength classes.
Analyzing Table 5, which presents the characteristics of ECCs in the hardened state and Table 7, which presents the classification in strength classes, the analysis is reduced to ECCs, S8-1, A versus ECCs, M, classified in the same strength class and with an evolution of the characteristics, with the closest values. Due to the glass powder content of S8-1, A compared to M which contains only SF, the evolution after 28 days does not have the same growth rate.
Analyzing Table 8, it is found that there is an evolution of the compressive strengths over time of the two compositions. The evolution of the strength for ECC, Control M, increases compared to that of composition S8-1, A between the ages of 90 ÷ 120 days, the difference in strength being 16 % and 24 %, respectively. For the other test ages, the difference between the strengths of ECC, M and that of ECC, S8-1, A is in the range (6 ÷ 11) %. The addition of WGP to composition S8-1, A leads to a slowdown in the evolution of the long-term compressive strength.
The Ecm values are those related to a higher concrete class. The class related to the M and S8-1, A composition is C60/75 and C60 respectively for which SR EN 19921-1/2004 [52] provides Ecm is 41 GPa compared to the experimentally obtained value of 48 GPa and 54 GPa respectively.
The ECC composite, S8-1, A, containing WGP, shows after 120 days of monitoring, drying shrinkage values of approx. 0,30 mm/m. Their stabilization is noted after approx. 56 days from casting.
The strength loss values following the 100 repeated freeze-thaw cycles of 100 cycles, for ECC, S8-1, A are 5,54 %, well below the limit value of 25 %.
The permeability of ECC, S8-1, A, is at a maximum of 10 % of the minimum allowed in the corresponding national code.
All compositions fall into the best performance class according to the performance criteria in SR EN 1338: 2004 [56], placing us in Class 4 - mark I, which requires a volume loss < 18000 mm³/ 5000 mm².
Carbonation: 0 %, it is non-existent, no ECCs have changed their basicity.
Mixture S8-1, A shows that the incorporation of the two SCMs, SF and WGP, into the mixture influences the durability of the concrete.
4.5. Artificial Neural Network Modeling
The ANN model developed in this study provided reliable predictions of compressive strength based on mixture composition and curing age. Despite the limited number of mixture designs, the use of multiple curing ages expanded the dataset to 70 data points, which proved sufficient for training a shallow network. The predictive accuracy, expressed in terms of R², MAE, and RMSE, demonstrated that the model was able to capture the nonlinear relationships between input variables and strength development.
The good performance of the ANN confirms earlier findings that shallow networks are effective when working with relatively small experimental datasets. Yeh [54] first demonstrated that ANN models could successfully predict the strength of high-performance concrete (HPC) with limited data. Topçu and Sarıdemir [58] also reported accurate predictions of fly ash concretes using ANN and fuzzy logic. More recently, Behnood and Golafshani [59] employed ANN models for concretes containing waste foundry sand and achieved similar levels of predictive capability. In line with these works, the present study shows that ANN can also be applied to eco-friendly concrete mixes incorporating waste glass powder and silica fume.
An additional observation is that the incorporation of curing age as an input significantly improved model performance. This agrees with the work of Chou and Pham [60], who emphasized that time-dependent strength development must be explicitly included for accurate prediction. In the current study, the ANN model successfully differentiated strength evolution across 7 to 120 days, capturing both the early-age and long-term strength gain of the mixtures.
The results are also consistent with our previous research on asphalt concrete mixtures, where a shallow three-layer ANN achieved a higher coefficient of determination than a deeper architecture [61]. Together, these findings support the conclusion that relatively simple ANN models are well-suited for experimental datasets in civil engineering, where the cost of material testing often limits the number of samples.
Figure 13.
Experimental versus ANN-predicted compressive strengths for all mixtures and ages (n = 40). The dashed line indicates perfect agreement. The shallow feedforward ANN (three hidden layers) achieved R², MAE, and RMSE as reported on the plot. Experimental values are from the present study.
Figure 13.
Experimental versus ANN-predicted compressive strengths for all mixtures and ages (n = 40). The dashed line indicates perfect agreement. The shallow feedforward ANN (three hidden layers) achieved R², MAE, and RMSE as reported on the plot. Experimental values are from the present study.

Although the dataset size was constrained, the application of cross-validation ensured robust model evaluation. This approach reduced overfitting and provided more generalizable results, confirming that ANN can serve as an efficient predictive tool even under data limitations. Importantly, the ANN predictions aligned well with the experimental compressive strength values, highlighting the model’s potential as a supplementary design tool for developing sustainable concrete mixtures.
5. Conclusions
This study deals with a green, or eco-friendly, concrete with a skeleton formed from coarse aggregates, derived from the recycling of glass waste, which demonstrates once again that through intelligent design, it can achieve very high compressive strengths.
The incorporation of supplementary cementitious materials, namely mineral admixtures such as SF and WGP, leads to notable improvements in the hardening properties of concrete, both mechanical and durability, placing ECCs in the HPC category.
SCMs (SF & WGP) exhibit pozzolanic properties that contribute to the refinement of the pore structure, thus improving mechanical properties and resistance to alkali-silica reactions (ASR).
For ECCs containing WGP, after 28 days of curing, the rate of increase in compressive strength is reduced, however, ECCs with the highest WGP content have the highest abrasion resistance.
The evolution of the hardened characteristics of ECCs depends on the nature of the origin of the aggregate, the content of active pozzolanic SCMs and the content of superplasticizer which reduces the water intake from the designed mixture and increases its workability.
The pozzolanic reaction of WGP, but especially SF, with calcium hydroxide (Ca(OH)2) leads to the formation of an additional gel, hydrated calcium silicate (C-S-H), known for its essential role in increasing the mechanical characteristics and long-term durability of concrete, as in the present case for the ECC composite, S8-1, A.
The artificial neural network accurately predicted compressive strength based on mixture composition and curing age, demonstrating the effectiveness of shallow feedforward architectures for modeling nonlinear behavior in limited experimental datasets.
The integration of artificial intelligence into the concrete mix design process highlights the potential of machine learning as a decision-support tool, enabling optimization of mixture proportions and performance prediction with reduced reliance on extensive laboratory testing.
6. Patents
CONCRETE CONTAINING GLASS WASTE AGGREGATES, RO127399A2 (B1) • 2012-05-30 • UNIV TEHNICĂ DIN CLUJ-NAPOCA [RO], Earliest priority: 2010-10-15 • Earliest publication: 2012-05-30, Inventors, MĂGUREANU CORNELIA [RO]; CORBU OFELIA CORNELIA [RO].
Author Contributions
Conceptualization, O.C.C. and S.G.; methodology, O.C.C. and S.G.; software, S.G.; validation, O.C.C.; S.G and A.G.P.; investigation, O.C.C. and S.G.; resources, A.G.P.; data curation, O.C.C.; writing—original draft preparation, O.C.C. and S.G.; writing—review and editing, S.G. and A.G.P.; visualization, O.C.C. and S.G; supervision, S.G. and A.G.P.; project administration, O.C.C. . All authors have read and agreed to the published version of the manuscript.
Funding
This research was funded by UEFISCDI, grant number CNCSIS 1036/ 2007 - 2009, "Green Concrete–Ecology & Sustainability" was funded by Prof. dr. eng. Cornelia Măgureanu.
Institutional Review Board Statement
Not applicable.
Informed Consent Statement
Not applicable.
Data Availability Statement
Not applicable.
Acknowledgments
We thank Professor Har Nicolae from Faculty of Biology and Geology, Babeș-Bolyai University, 400347 Cluj-Napoca, Romania for the investigated using polarized light optical microscopy (OM), scanning electron microscopy (SEM), and X-ray diffraction by the Powder method (PXRD) for the qualitative analysis of crystalline constitutive materials.
Conflicts of Interest
“The authors declare no conflicts of interest.”
Abbreviations
The following abbreviations are used in this manuscript:
| ECC | Engineered Cementitious Composite |
| WGP | Waste Glass Powder |
| SF | Silica Fume |
| SCMs | Supplementary Cementitious Materials |
| HPC | High-Performance Concrete |
| CEM | Cement |
| WGA | Waste Glass Aggregates |
| ANNs | Artificial Neural Networks |
| AI | Artificial Intelligence |
| ML | Machine Learning |
References
- DC2008/98/CE Directiva cadru – Directiva a Parlamentului European si a Consiliului privind desesurile, din 30 noiembrie 2008 cu completari in 2014, (accessed on 30 august 2025).
- Malhotra, V.M. Making Concrete “Greener” with Fly Ash. Concr. Int. 1999, 21, 61–66. [Google Scholar]
- Hângănuţ, R. Economia de la Liniar la Circular. Available online: https://www.revistasinteza.ro/economia-de-la-liniar-la-circular (accessed on 24 May 2025).
- Romanian Government Strategia Națională Privind Economia Circulară. Proiect. Available online: https://sgg.gov.ro/1/wp-content/uploads/2022/08/Strategia-economie-circulara_18.08.2022.pdf (accessed on 30 August 2025).
- Patent: CONCRETE CONTAINING GLASS WASTE AGGREGATES, RO127399A2 (B1) • 2012-05-30 • UNIV TEHNICĂ DIN CLUJ-NAPOCA [RO], Earliest priority: 2010-10-15 • Earliest publication: 2012-05-30, Inventors, MĂGUREANU CORNELIA [RO]; CORBU OFELIA CORNELIA [RO].
- Shayan, A. Value-added Utilisation of Waste Glass in Concrete, IABSE Symposium Melbourne, Australia, 2002, IABSE Symposium Report 86, 12-21. [CrossRef]
- Meyer, C.; Baxter, S.; Jin, W. Alkali-aggregate reaction in concrete with waste glass as aggregate, Proceedings of 4th Materials Engineering Conference: Materials for the New Millennium, ASCE, Reston, pp. 1388–1397, 1996.
- Shi, C.; Wu, Y.; Shao, Y. & Riefler C. Alkali-aggregate reaction of concrete containing ground glass powder, Proceedings of the 12th International Conference on AAR in Concrete Beijing, pp. 789–795, 2004.
- Praveen Kumar, J.; Chandana, T. Influence of Metakaolin, Glass Powder, And Silica Fume On The Properties Of Cement-Substituted Concrete: A Laboratory Study. IJESAT 2015, 15. [Google Scholar]
- Dvořák, K.; Dolák,D. ; Dobrovolný, P. The Improvement of the Pozzolanic Properties of Recycled Glass during the Production of Blended Portland Cements. Procedia Engineering 2017, 180, 1229–1236. [Google Scholar] [CrossRef]
- Majeed, W.Z.; Aboud, R.K.; Naji, N.B.; Mohammed, S.D. Investigation of the Impact of Glass Waste in Reactive Powder Concrete on Attenuation Properties for Bremsstrahlung Ray. East Eur. J. Phys. 2023, 1, 102–108. [Google Scholar] [CrossRef]
- Mehta, A.; Ashish, D. K. Silica fume and waste glass in cement concrete production: A review. J. Build. Eng., 2020, 29. [Google Scholar] [CrossRef]
- Ibrahim, K.I.M. Recycled waste glass powder as a partial replacement of cement in concrete containing silica fume and fly ash. Case Stud. Constr. Mater. 2021, 15, e00630. [Google Scholar] [CrossRef]
- Saify, S.; Radhi, M. S.; Al-Mashhadi, S. A.; Mareai, B.; Jabr, S. F.; Mohammed, Z. A.; Al-Khafaji, Z.; Al-Husseinawi, F. Impact of waste materials (glass powder and silica fume) on features of high-strength concrete. Open Eng. 2023, 13, 9. [Google Scholar] [CrossRef]
- Bameri, M.; Rashidi, S.; Mohammadhasani, M.; Maghsoudi, M.; Madani, H.; Rahmani, F. Evaluation of mechanical and durability properties of eco-friendly concrete containing silica fume, waste glass powder, and ground granulated blast furnace slag. Adv. Mater. Sci. Eng. 2022, 2730391. [Google Scholar] [CrossRef]
- Singh, G.; Tiwary, A.K.; Singh, S.; Kumar, R.; Chohan, J.S.; Sharma, S.; Li, C.; Sharma, P.; Deifalla, A.F. Incorporation of silica fumes and waste glass powder on concrete properties containing crumb rubber as a partial replacement of fine aggregates. Sustainability 2022, 14, 14453. [Google Scholar] [CrossRef]
- Aruchamy, V.; Subramaniyan, Y.; Viswanathan, R.; Manoharan, A. Improving durability and mechanical features of silica fume and waste glass powder in eco-friendly self-compacting concrete. Matéria (Rio de Janeiro) 2024, 29. [Google Scholar] [CrossRef]
- Liu, Z.; Jiao, Y.; Zhang, Y.; Li, O.; Du, Y. Partial replacement of silica fume with waste glass powder in UHPC: Filling micropores and promoting hydration. Constr. Build. Mater. 2025, 490, 5. [Google Scholar] [CrossRef]
- Damdelen, Ö.; Mosaberpanah, M.A.; Olabimtan, S.B.; Anthony, M.D.; Oluwole, B.O. Binary effect of silica fume and waste glass powder as a cement replacement for a sustainable concrete. Discov. Concr. Cem. under review. 2024. [Google Scholar] [CrossRef]
- Mosaberpanah, M.A.; Eren, O.; Tarassoly, A.R. The effect of nano-silica and waste glass powder on mechanical, rheological, and shrinkage properties of UHPC using response surface methodology. J. Mater. Res. Technol. 2019, 8, 804–811. [Google Scholar] [CrossRef]
- Taiyab, M.; Ramesh, S. Experimental study on UHPC using nano silica, waste glass powder and steel fibers. Int. Res. J. Eng. Technol. (IRJET) 2021, 8. [Google Scholar]
- Behnood, A.; Golafshani, E.M. Machine learning study of the mechanical properties of concretes containing waste foundry sand. Constr. Build. Mater. 2020, 243, 118152. [Google Scholar] [CrossRef]
- Ghafari, S.; Ehsani, M.; Nejad, F.M. Prediction of Low-Temperature Fracture Resistance Curves of Unmodified and Crumb Rubber Modified Hot Mix Asphalt Mixtures Using a Machine Learning Approach. Constr. Build. Mater. 2022, 314, 125332. [Google Scholar] [CrossRef]
- Zhang, J.; Liu, J.; Zhang, W.; Li, V.C. Machine learning-based prediction of compressive strength of green high-performance concrete incorporating waste glass powder. J. Build. Eng. 2023, 66, 105828. [Google Scholar] [CrossRef]
- SR EN 197-1, Cement. Composition, specifications and conformity criteria for common cements.
- Corbu, O. , Puskas A., Dragomir M.L., Har N., Toma, I.O. Eco-Innovative Concrete for Infrastructure Obtained with Alternative Aggregates and a Supplementary Cementitious Material (SCM). Coatings 2023, 13, 1710. [Google Scholar] [CrossRef]
- Corbu, O. , Chira, N., Szilagyi, H., Constantinescu, H., Ecological concrete by use of waste glass, 13th International Multidisciplinary Scientific GeoConference SGEM 2013 - Green Buildings Technologies and Materials, Albena, Bulgaria, 13, pp. 411-418. 20 July.
- SR EN 197-1, Standard Cement- Part 1: Composition, specification, and conformity criteria common cements; ASRO Bucharest, 2011.
- SR EN 196-6 Methods of testing cements. Part 6: Determining Fineness.
- SR EN 196-3 Methods of testing cement. Part 3: Determination of setting time and stability.
- SR EN 206 + A2, Concrete – Part 1: specification, performance, production and conformity. s.
- NE 012-1 Code of Practice for execution of concrete, reinforced concrete and prestressed concrete. Part 1: Concrete Production.
- Nemeș, O.-C. (married Corbu) Advanced concrete, Technical University of Cluj-Napoca, Cluj-Napoca, Romania, 2011.
- Corbu, O.; Ioani, A.M.; Al Bakri Abdullah, M.M.; Meiță, V.; Szilagyi, H.; Sandu, A.V. The pozzoolanic activity level of powder waste glass in comparison with other powders. Key Eng. Mater. 2015, 660, 237–243. [Google Scholar] [CrossRef]
- Yeh, I.C. Modeling of strength of high-performance concrete using artificial neural networks. Cem. Concr. Res. 1998, 28, 1797–1808. [Google Scholar] [CrossRef]
- Topçu, İ.B.; Sarıdemir, M. Prediction of compressive strength of concrete containing fly ash using artificial neural networks and fuzzy logic. Comput. Mater. Sci. 2008, 41, 305–311. [Google Scholar] [CrossRef]
- Ghafari, S.; Nejad, F.M.; Sheikh-Akbari, A.; Kazemi, H. Automating the Determination of Low-Temperature Fracture Resistance Curves of Normal and Rubberized Asphalt Concrete in Single-Edge Notched Beam Tests Using Convolutional Neural Networks. Constr. Build. Mater. 2024, 428, 136376. [Google Scholar] [CrossRef]
- Ghafari, S.; Nejad, F.M. Low-Temperature Mixed Mode (I/II) Fracture Characterization of Polymerized Sulfur Modified AC Mixtures. Key Eng. Mater. 2024. [Google Scholar] [CrossRef]
- Ghafari, S.; Nejad, F.M.; Aflaki, E. Low Temperature J-Resistance Curve Determination of Asphalt Concrete Using Wavelet-Radon Transform. J. Cent. South Univ. 2013, 20, 2563–2569. [Google Scholar] [CrossRef]
- Chou, J.S.; Pham, A.D. Enhanced artificial intelligence for ensemble approach to predicting high performance concrete compressive strength. Constr. Build. Mater. 2013, 49, 554–563. [Google Scholar] [CrossRef]
- Kohavi, R. A study of cross-validation and bootstrap for accuracy estimation and model selection. In Proceedings of the 14th International Joint Conference on Artificial Intelligence, Montreal, Canada; 1995; pp. 1137–1143. [Google Scholar]
- Behnood, A.; Golafshani, E.M. Machine learning study of the mechanical properties of concretes containing waste foundry sand. Constr. Build. Mater. 2020, 243, 118152. [Google Scholar] [CrossRef]
- Kalakada, Z. , Doh, J. H. & Zi, G. Utilisation of coarse glass powder as pozzolanic cement—A mix design investigation. Constr. Build. Mater., 2020, 240, 117916. [Google Scholar] [CrossRef]
- Jain, K. L. , Sancheti, G., Gupta, L. K. Durability performance of waste granite and glass powder added concrete. Constr. Build. Mater. 2020, 252, 119075. [Google Scholar] [CrossRef]
- Omran, A.; Soliman, N.; Zidol, A.; Tagnit, A. HamouPerformance of ground-glass pozzolan as a cementitious material—A review. Adv. Civ. Eng. Mater. 2018, 7, 237–270. [Google Scholar] [CrossRef]
- McCarthy, M. J.; Dyer, T. D. Pozzolanas and pozzolanic materials. Leas Chem. Cem. Concr. 2019, 5, 363–467. [Google Scholar] [CrossRef]
- Aïtcin, P. C. Supplementary cementitious materials and blended cements. In Science and Technology of Concrete Admixtures, 2016, 53–73. [CrossRef]
- Aliabdo, A. A.; Abd Elmoaty, M.; Aboshama, A. Y. Utilization of waste glass powder in the production of cement and concrete. Constr. Build. Mater., 2016, 124, 866–877. [Google Scholar] [CrossRef]
- Kumpueng, P.; Phutthimethakul, L.; Supakata, N. Production of cement mortars from glass powder and municipal incinerated bottom ash. Sci. Rep. 2024, 14, 1569. [Google Scholar] [CrossRef] [PubMed]
- Kunther, W. , Ferreiro, S. & Skibsted, J. Inluence of the Ca/Si ratio on the compressive strength of cementitious calcium–silicate–hydrate binders. J. Mater. Chem. A 2017, 5, 17401–17412. [Google Scholar] [CrossRef]
- Wang, S. , Zhao, P., Tian, Y., Liu, J. Effects of C-S-H Seed Prepared by Wet Grinding on the Properties of Cement Containing Large Amounts of Silica Fume. Polymers 2024, 16, 2769. [Google Scholar] [CrossRef]
- Shen, X.; Feng, P.; Zhang, Y.; de Souza, FB; Duan, W. Multi-step nucleation of C-S-H: DFT simulation on silicate oligomerization and Si (Qn) evolution dynamics. Constr. Build. Mater. 2024, 439, 137372. [Google Scholar] [CrossRef]
- Yu, J.; Wang, K.; Yang, P.; Li, M.; Dong, B.; Jin, Z.; Hong, S.; Ma, H. Simulation of calcium carbonate nucleation processes in confined C-S-H nanopores with different calcium-silicon ratios. Constr. Build. Mater. 2024, 438, 137157. [Google Scholar] [CrossRef]
- Fib - Buletinul 42, Constitutive modelling of high strength/high performance concrete, 2008, pp. 4, ISSN 1562-3610, ISBN 978-2-88394-6.
- SR EN 1992-1-1, Eurocode 2: Design of concrete structures - Part 1-1: General rules and rules for buildings, 2004.
- SR EN 1338, Concrete paving stones. Test conditions and methods, 2004.
- Yeh, I.C. Modeling of strength of high-performance concrete using artificial neural networks. Cem. Concr. Res. 1998, 28, 1797–1808. [Google Scholar] [CrossRef]
- Topçu, İ.B.; Sarıdemir, M. Prediction of compressive strength of concrete containing fly ash using artificial neural networks and fuzzy logic. Comput. Mater. Sci. 2008, 41, 305–311. [Google Scholar] [CrossRef]
- Behnood, A.; Golafshani, E.M. Machine learning study of the mechanical properties of concretes containing waste foundry sand. Constr. Build. Mater. 2020, 243, 118152. [Google Scholar] [CrossRef]
- Chou, J.S.; Pham, A.D. Enhanced artificial intelligence for ensemble approach to predicting high performance concrete compressive strength. Constr. Build. Mater. 2013, 49, 554–563. [Google Scholar] [CrossRef]
- Ghafari, S.; Ehsani, M.; Ranjbar, S.; Nejad, F.M. Formulation of Low Temperature Mixed Mode Crack Propagation Behavior of Crumb Rubber Modified HMA Using Artificial Intelligence. Sci. Rep. 2025, 15, 20376, https://www.nature.com/articles/s41598-025-08404-5. [Google Scholar] [CrossRef] [PubMed]
Figure 1.
Particle size distribution of silica fume (SF) [33].
Figure 1.
Particle size distribution of silica fume (SF) [33].
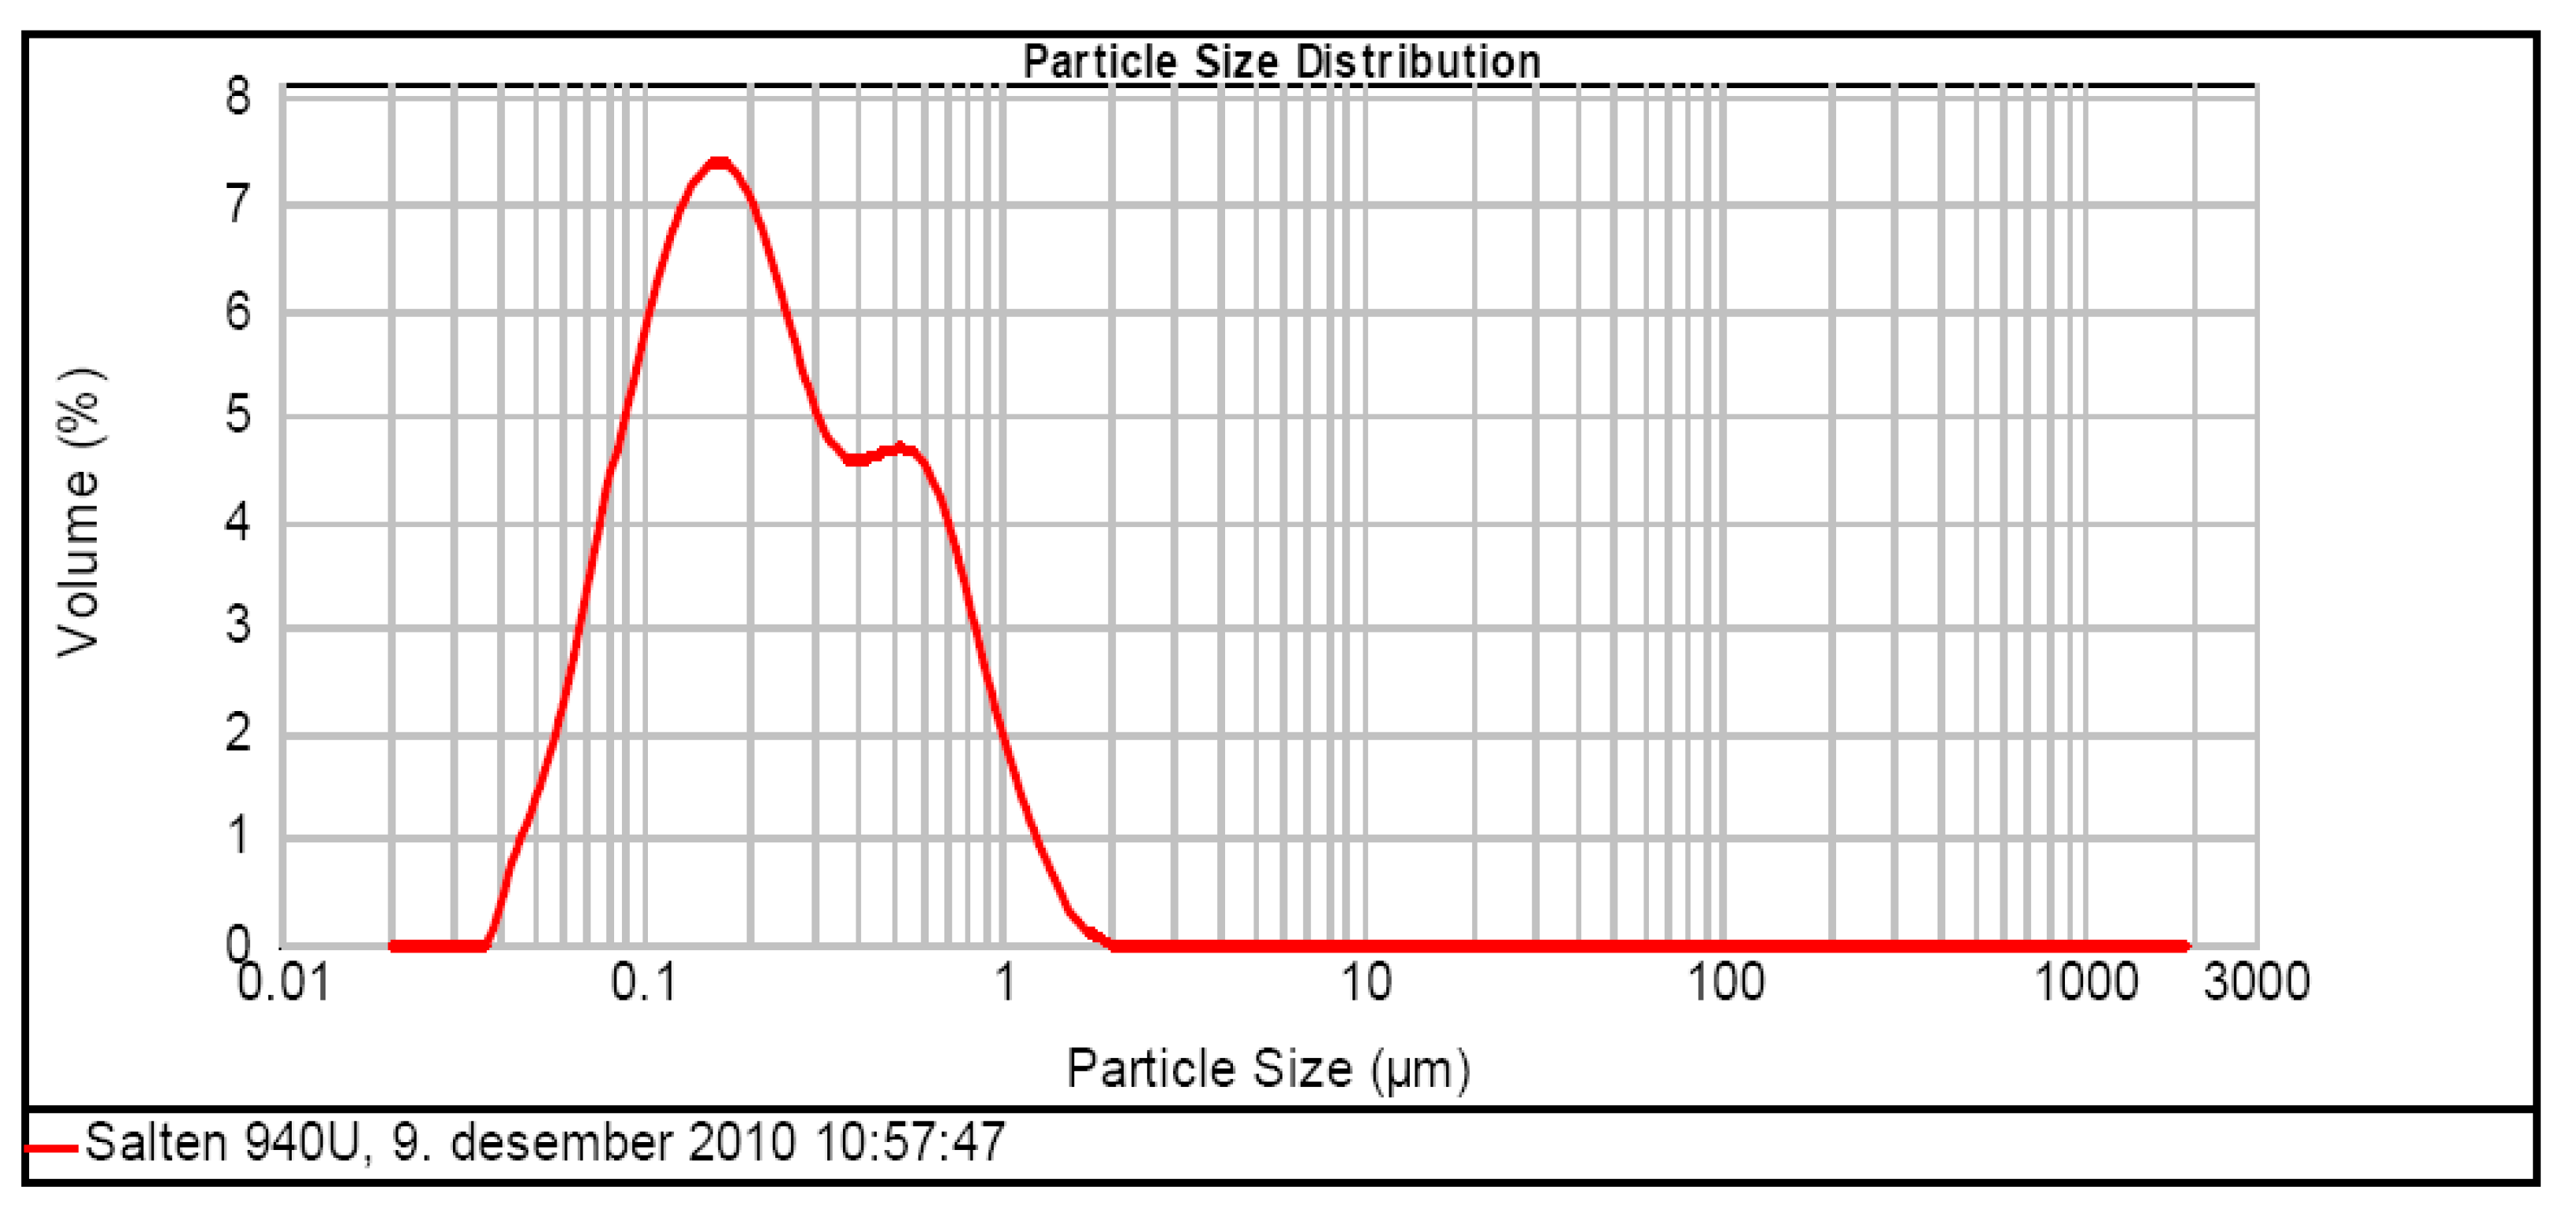
Figure 2.
The ternary binder (CEM + WGP + SF) of the dry mixture of S 8-1, A.
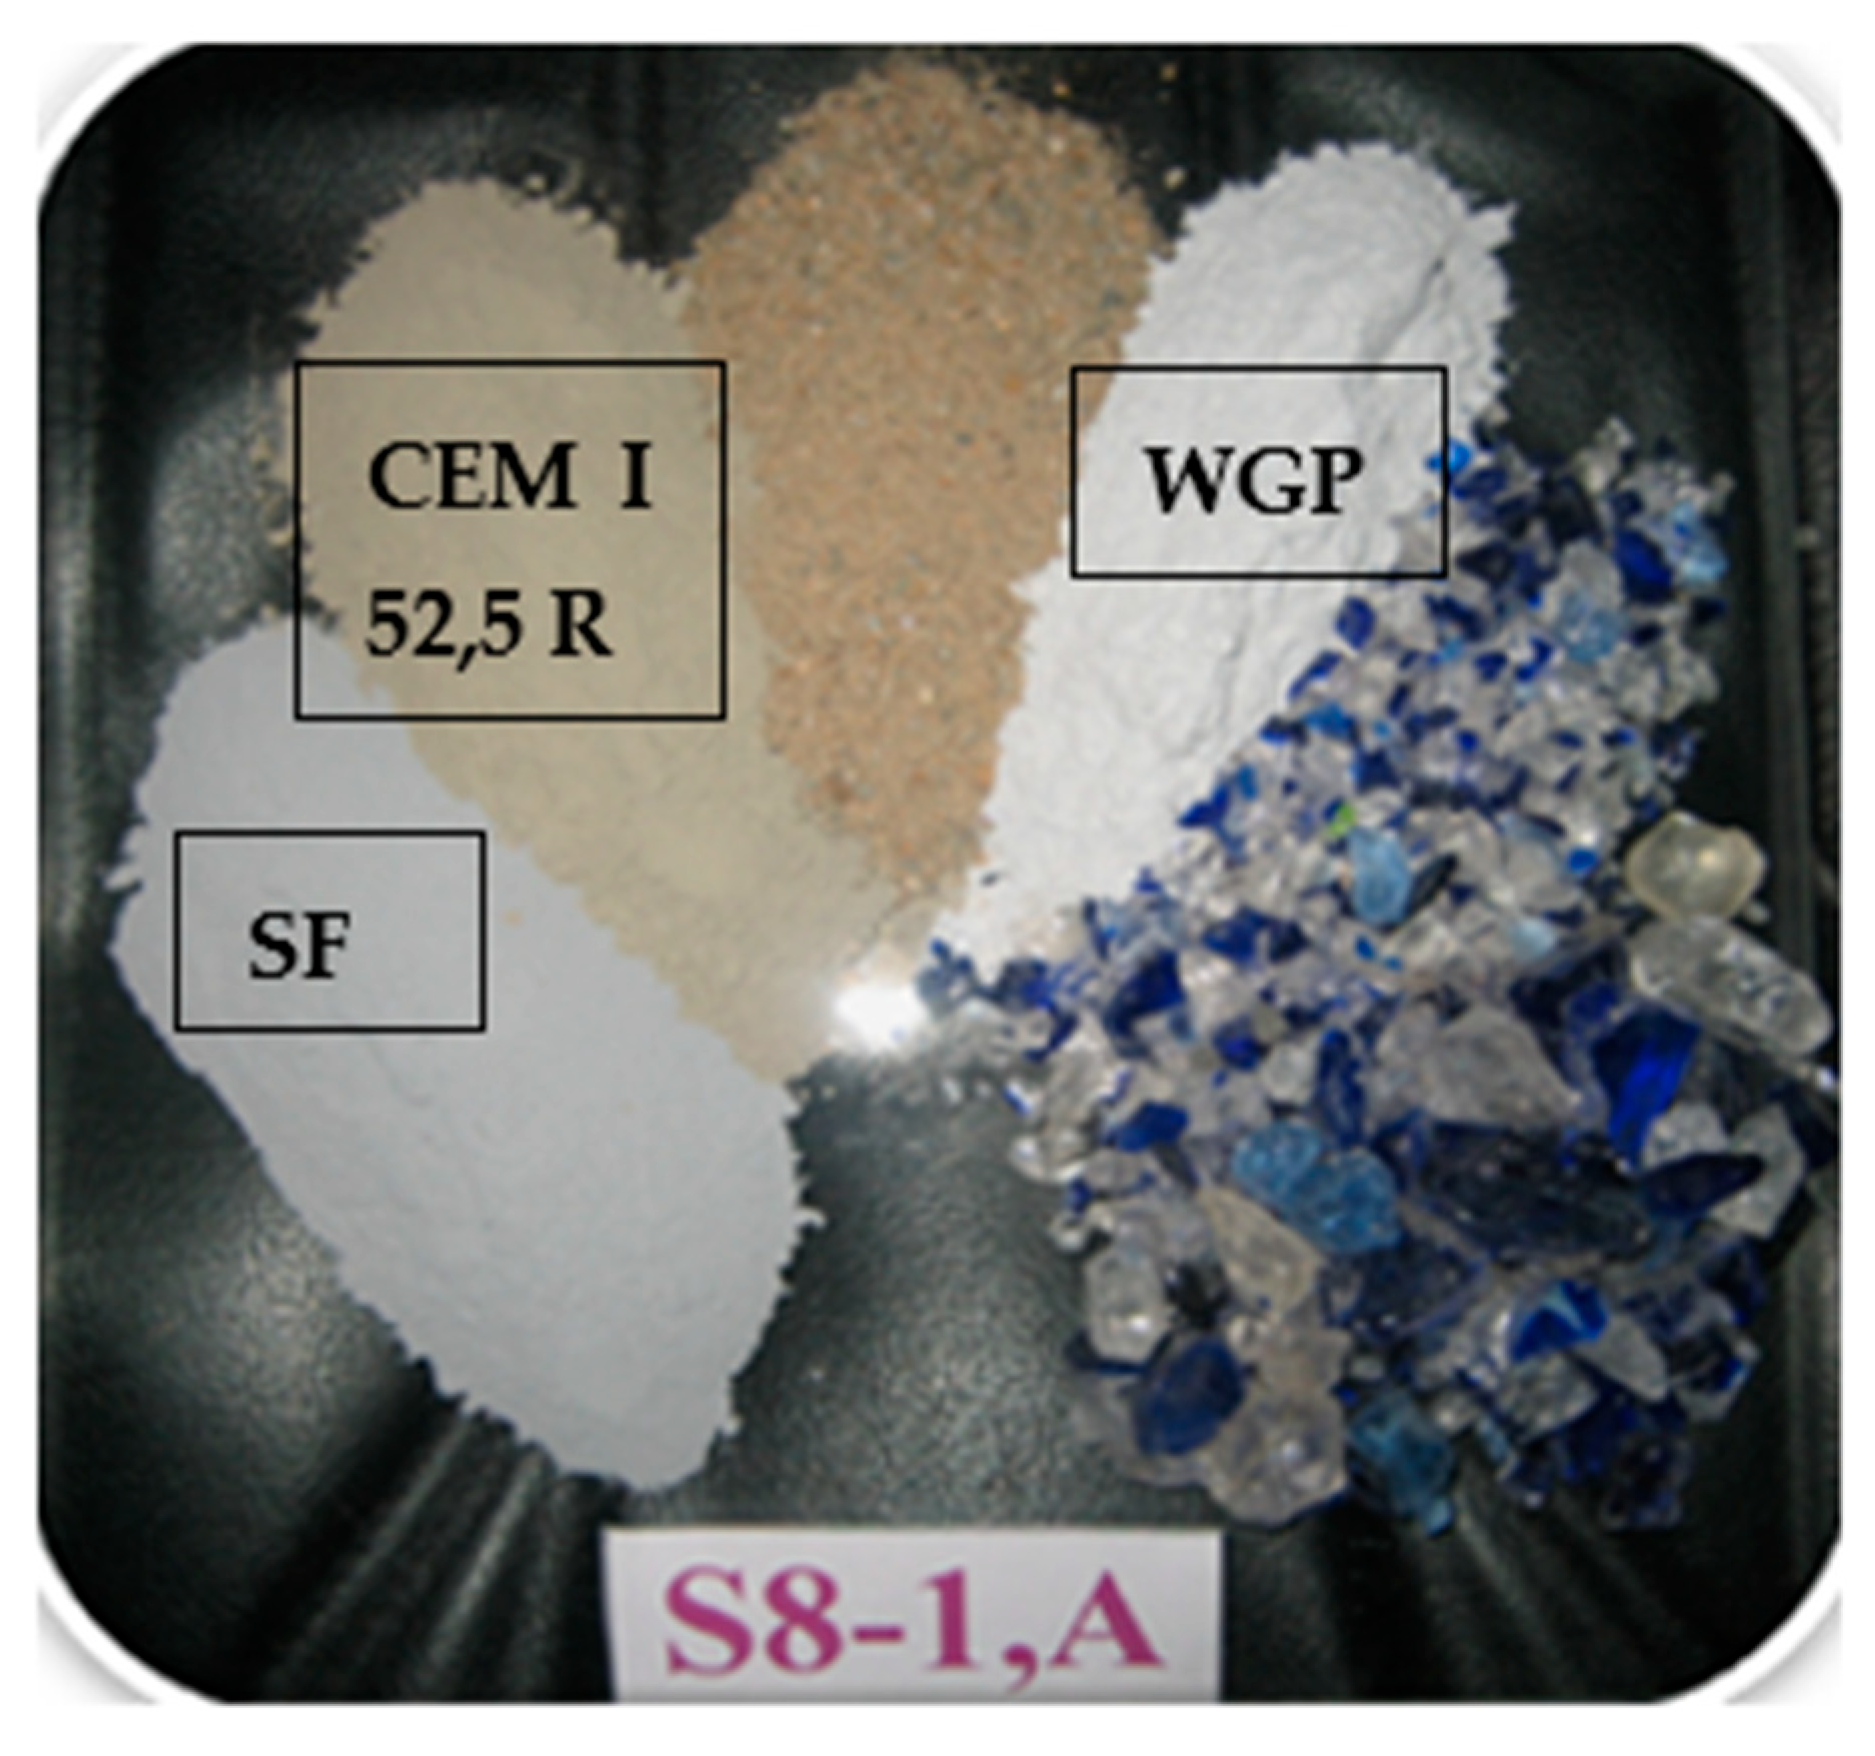
Figure 3.
SEM Microstructures of the mixes: (a) CEM_M standard mixture; (b) CEM-10% WGP; (c) CEM-20% WGP.
Figure 3.
SEM Microstructures of the mixes: (a) CEM_M standard mixture; (b) CEM-10% WGP; (c) CEM-20% WGP.
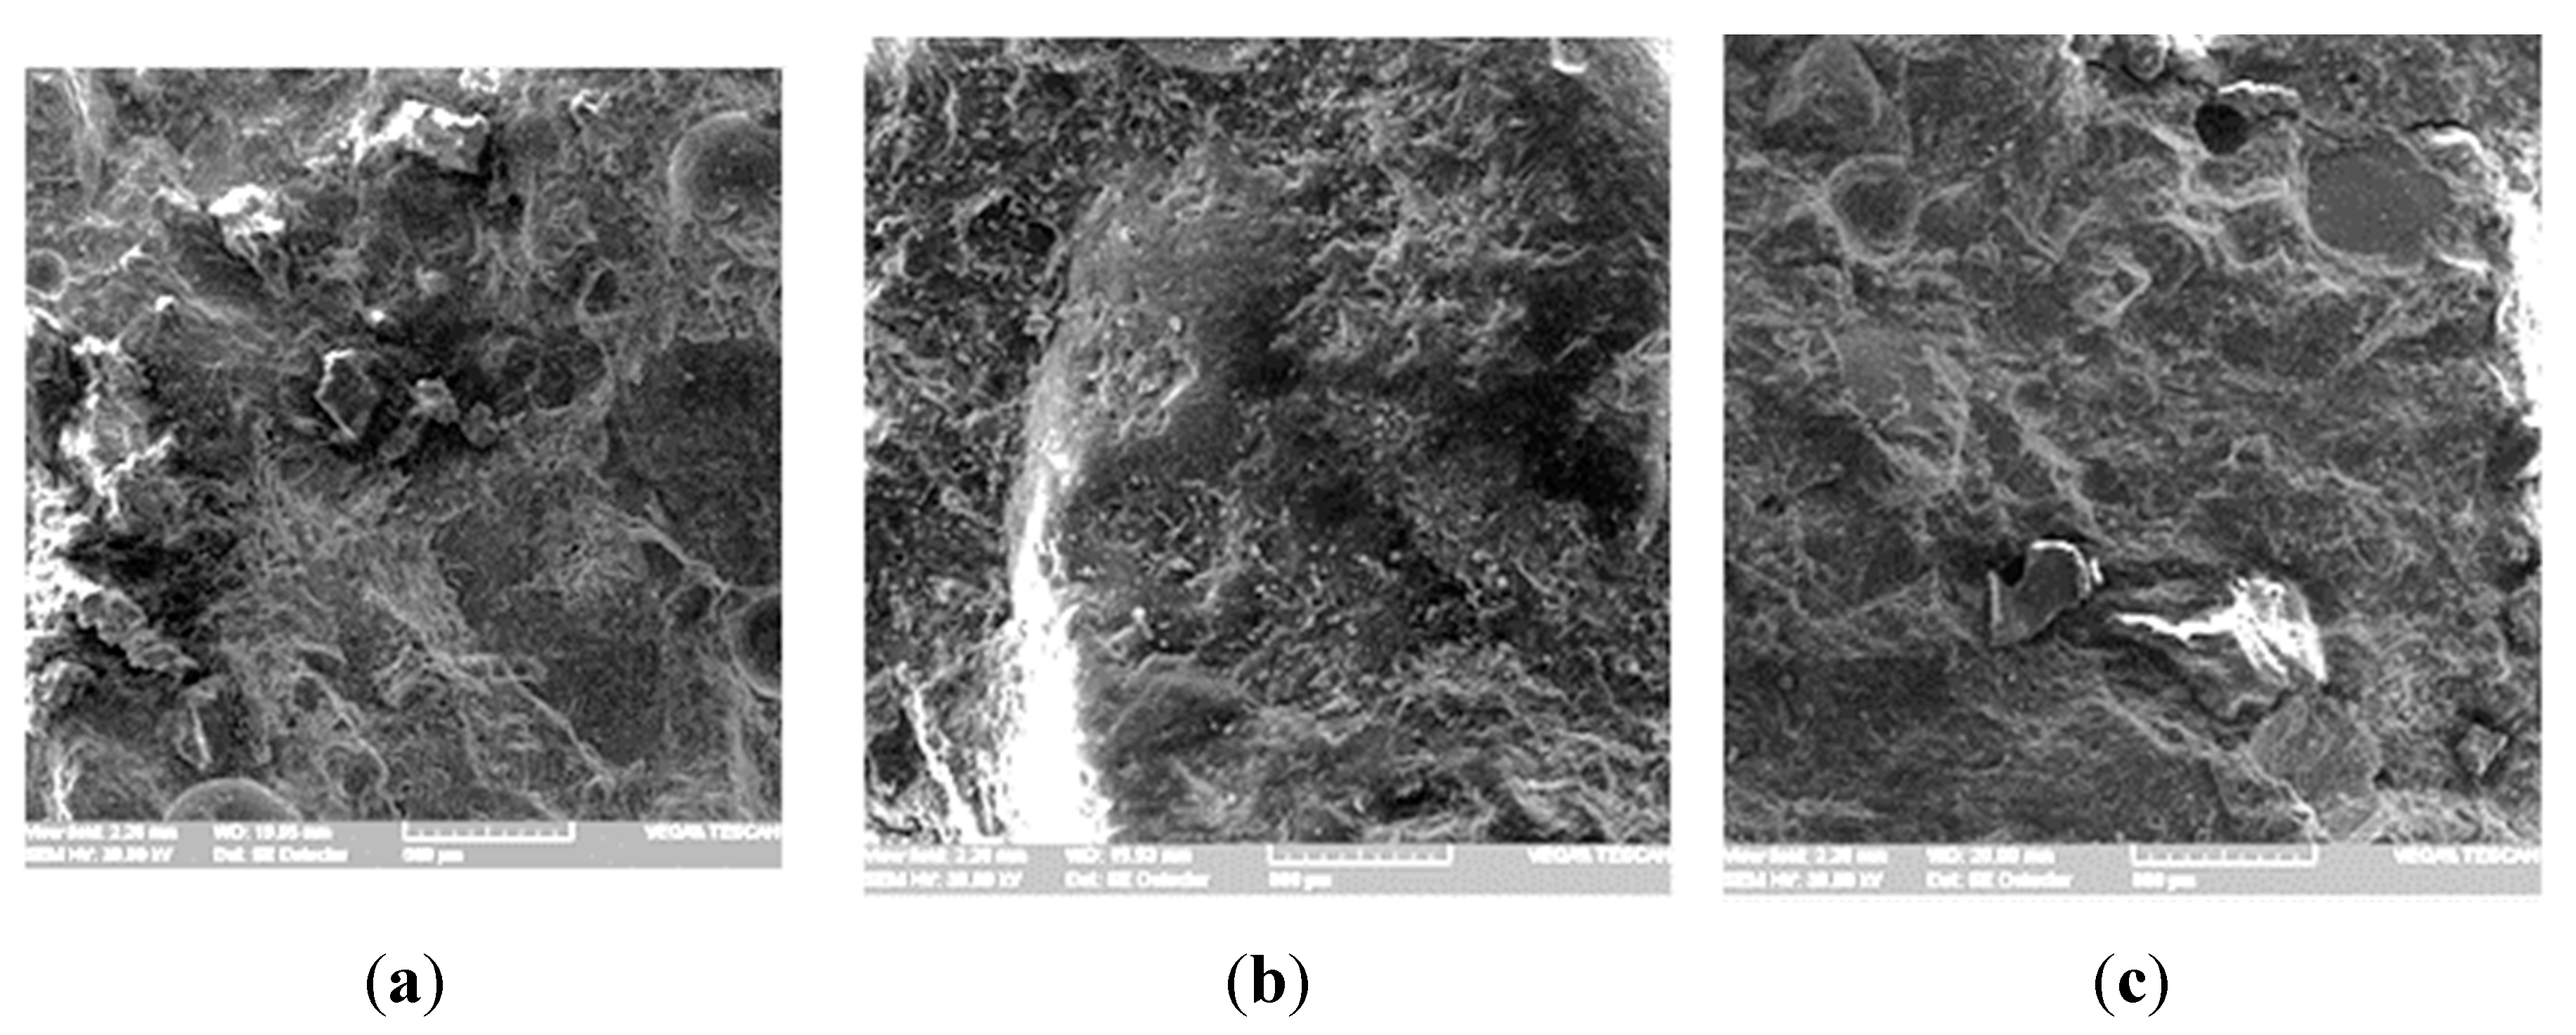
Figure 4.
The mineralogical composition of CEM I 52,5 R.
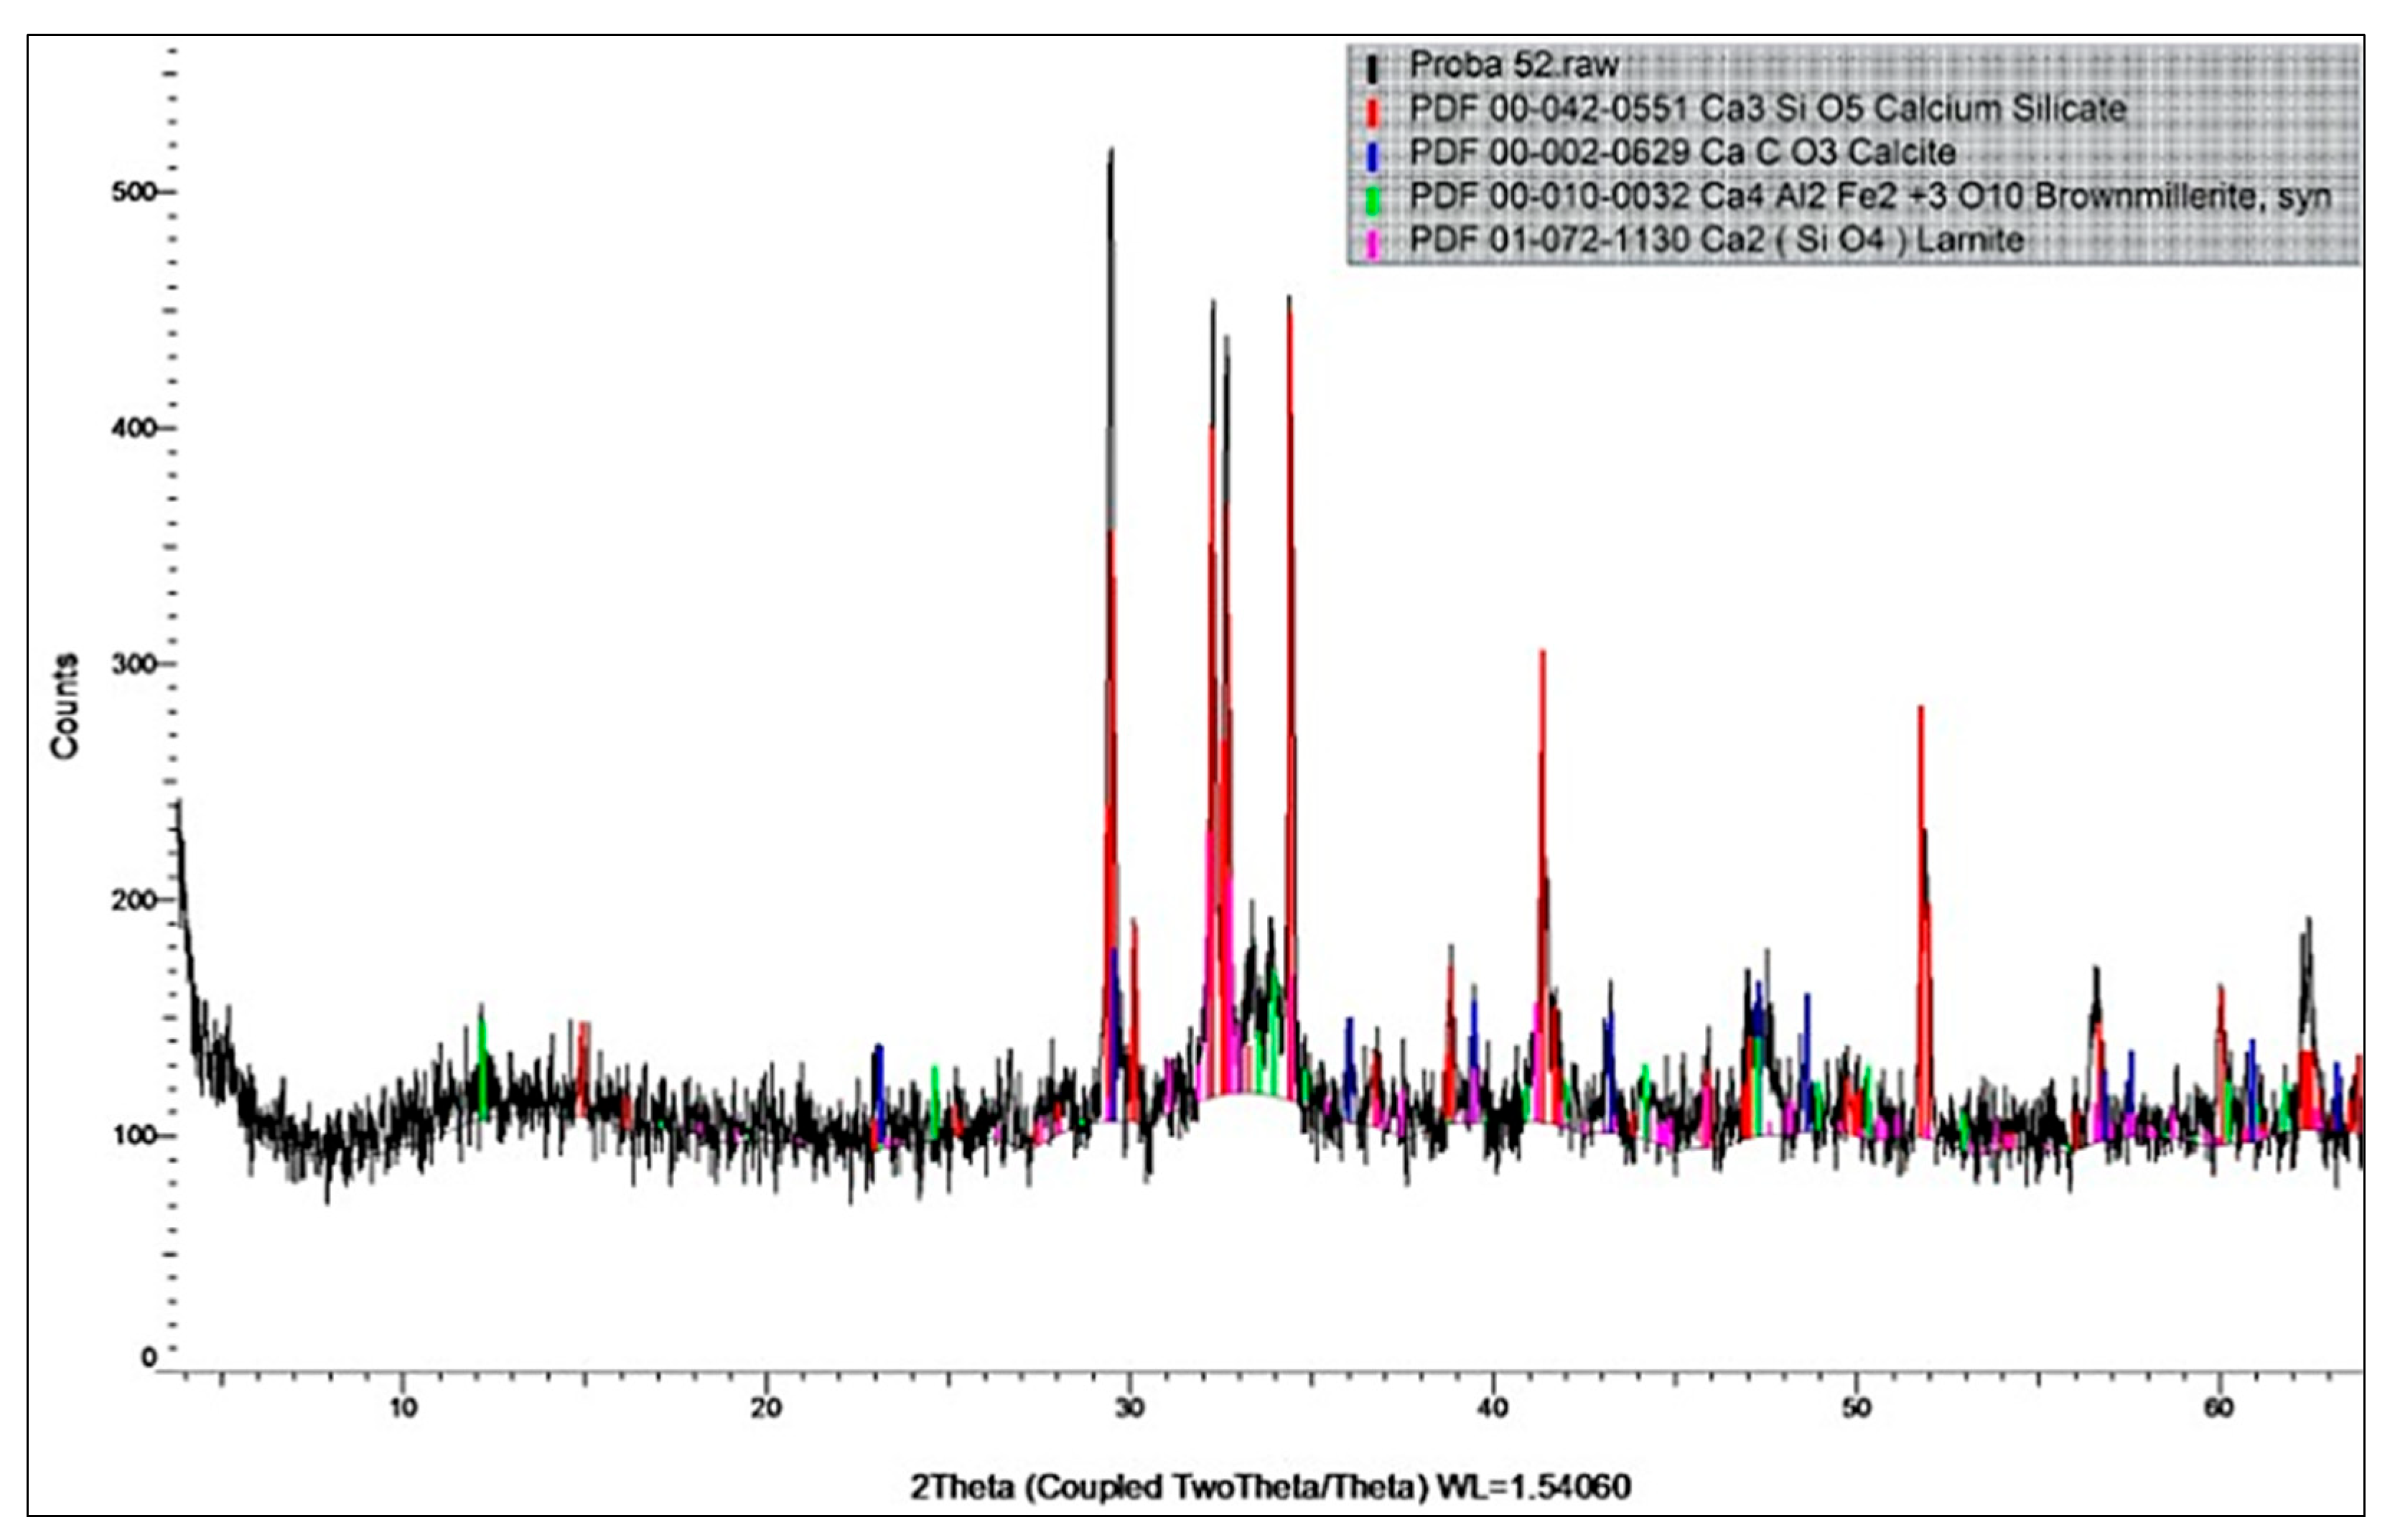
Figure 5.
The mineralogical composition of SF.
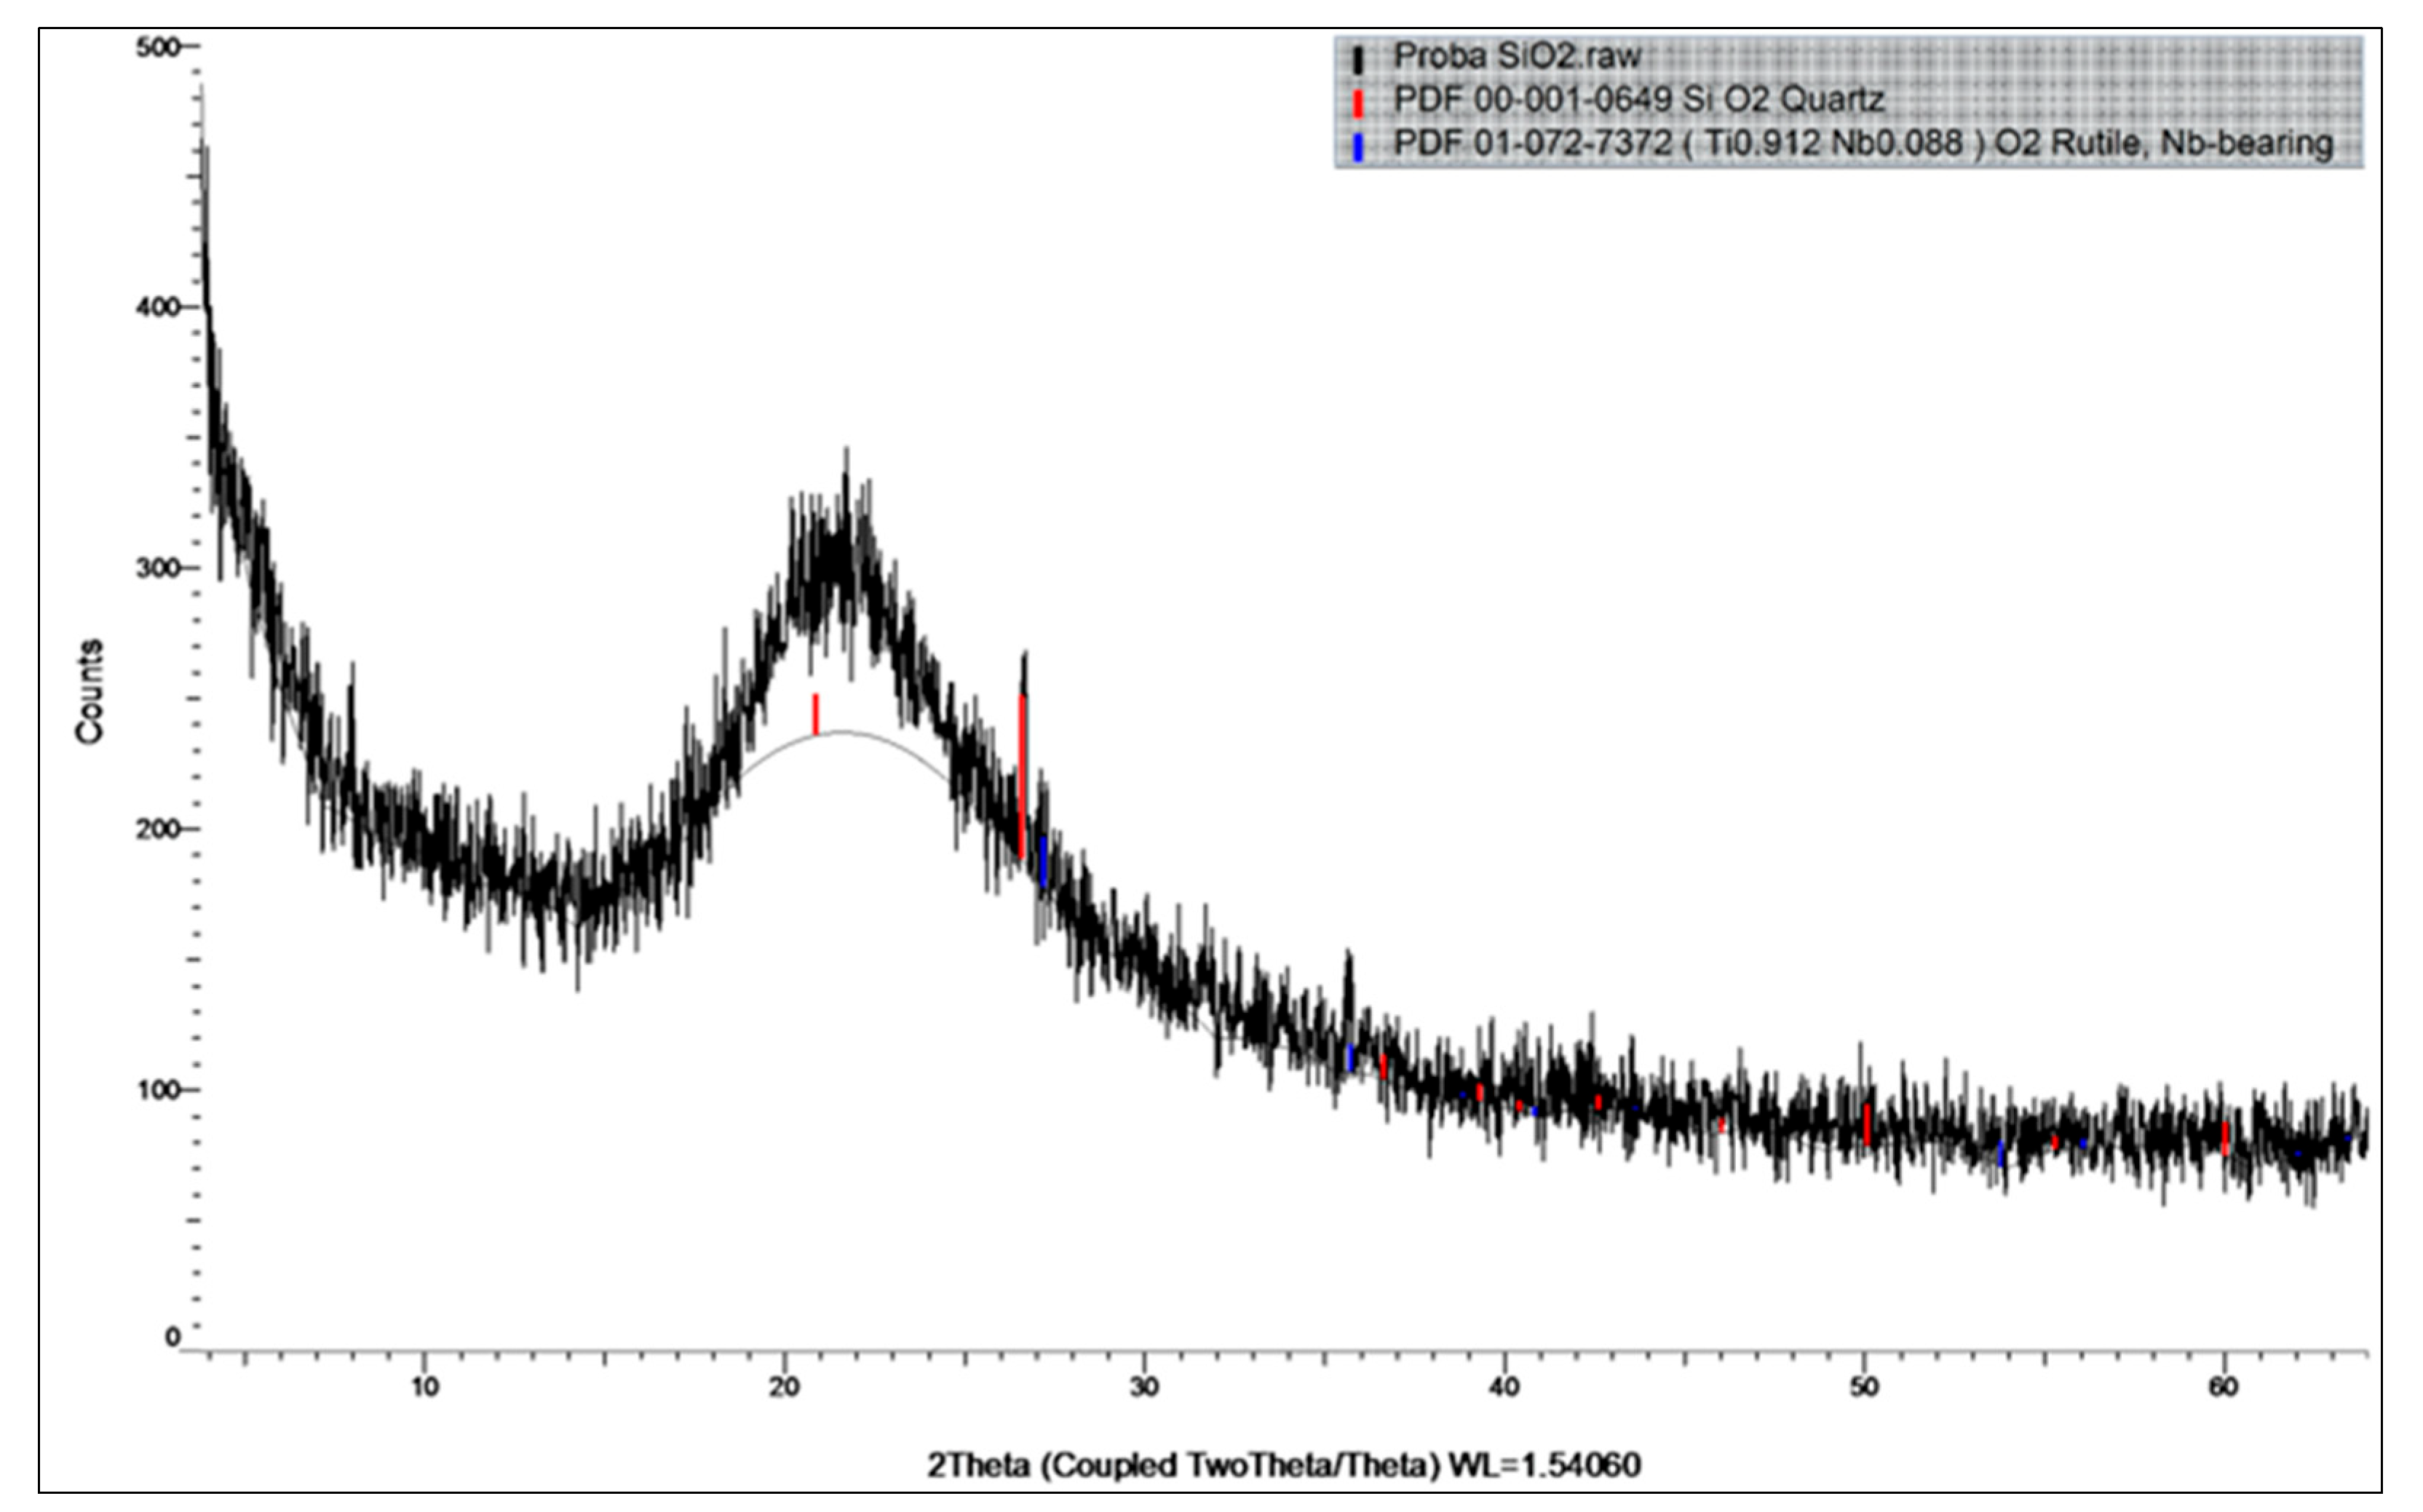
Figure 6.
The mineralogical composition of WGP.
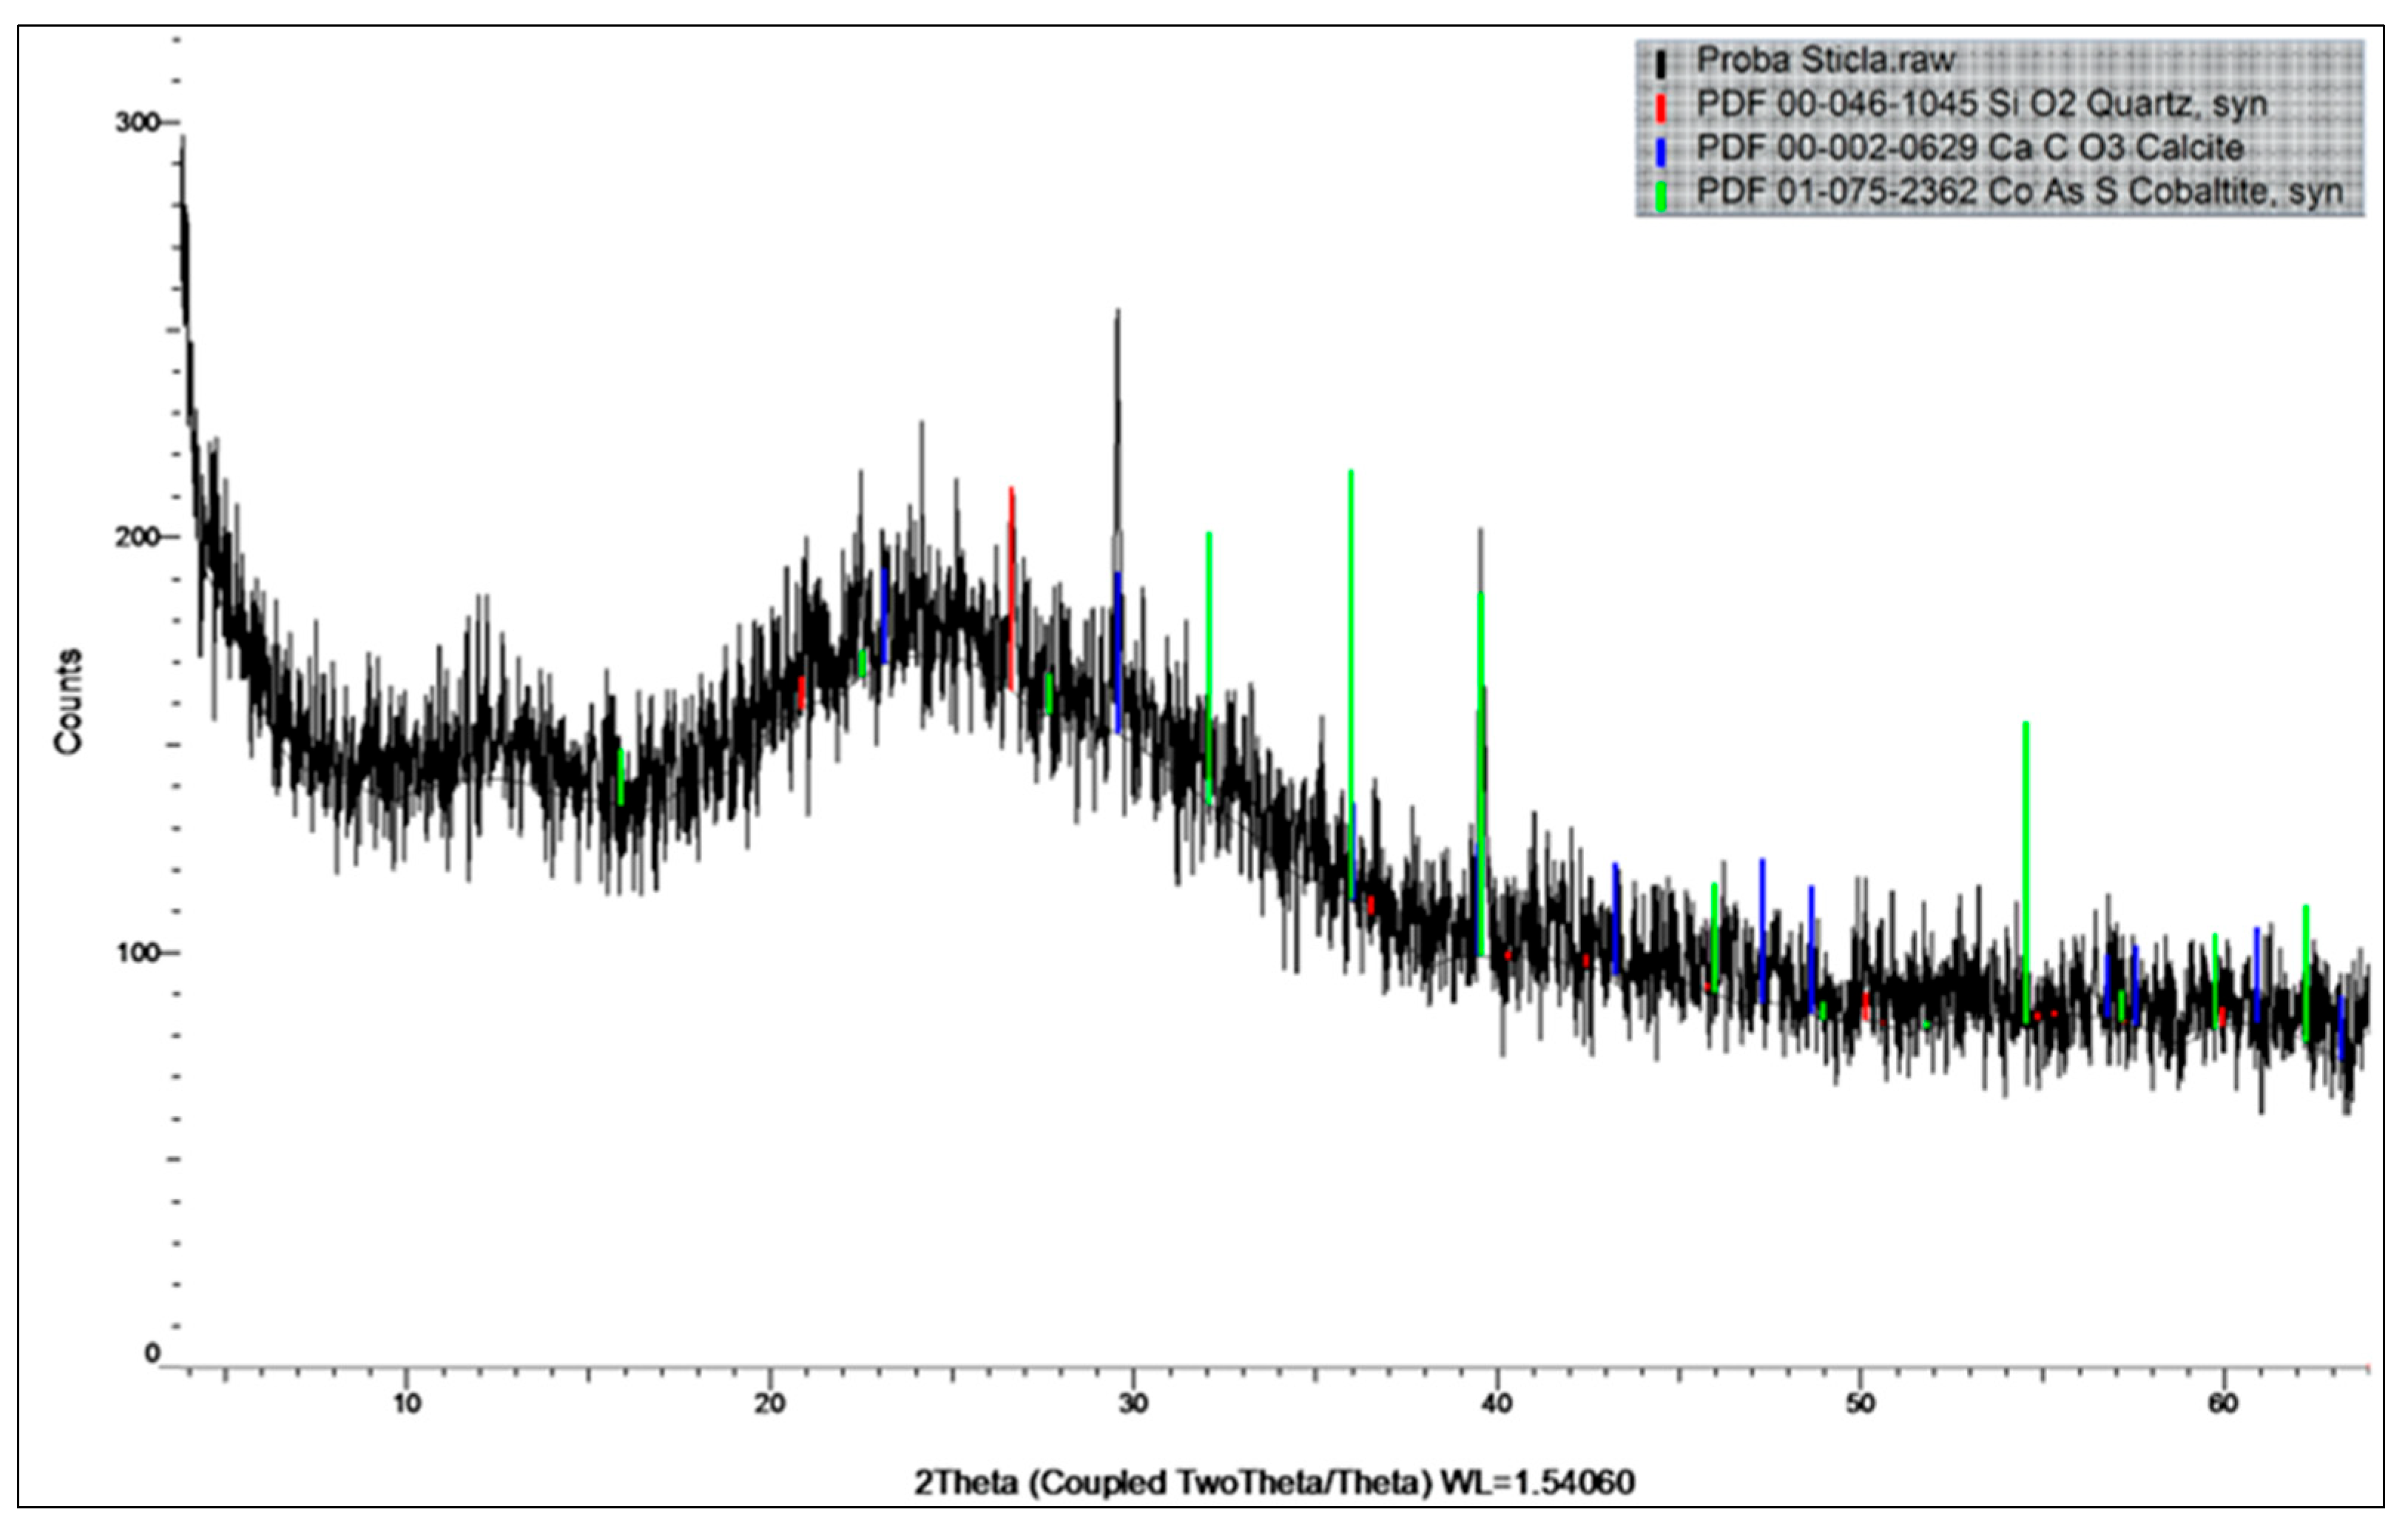
Figure 7.
Types of aggregates used in engineered concrete mixes. (a) natural river sand, Natural River Aggregate (NRA) for all main mixes 0/4 mm; (b) Alternative aggregate from recycled glass waste (WGA) 0/4 mm for ECCs, S 8-2 and S 8-3; (c) WGA 4/8 mm (gravel); (d) WGA 8/16 mm. (e) CRA 4/8 mm for ECC, M (gravel); (f) CRA 8/16 mm for ECC, M.; (g) Crushed aggregates / Chippings (CAC) 4/8 mm for ECC, Mr; (h) CAC 8/16 mm for ECC, Mr.
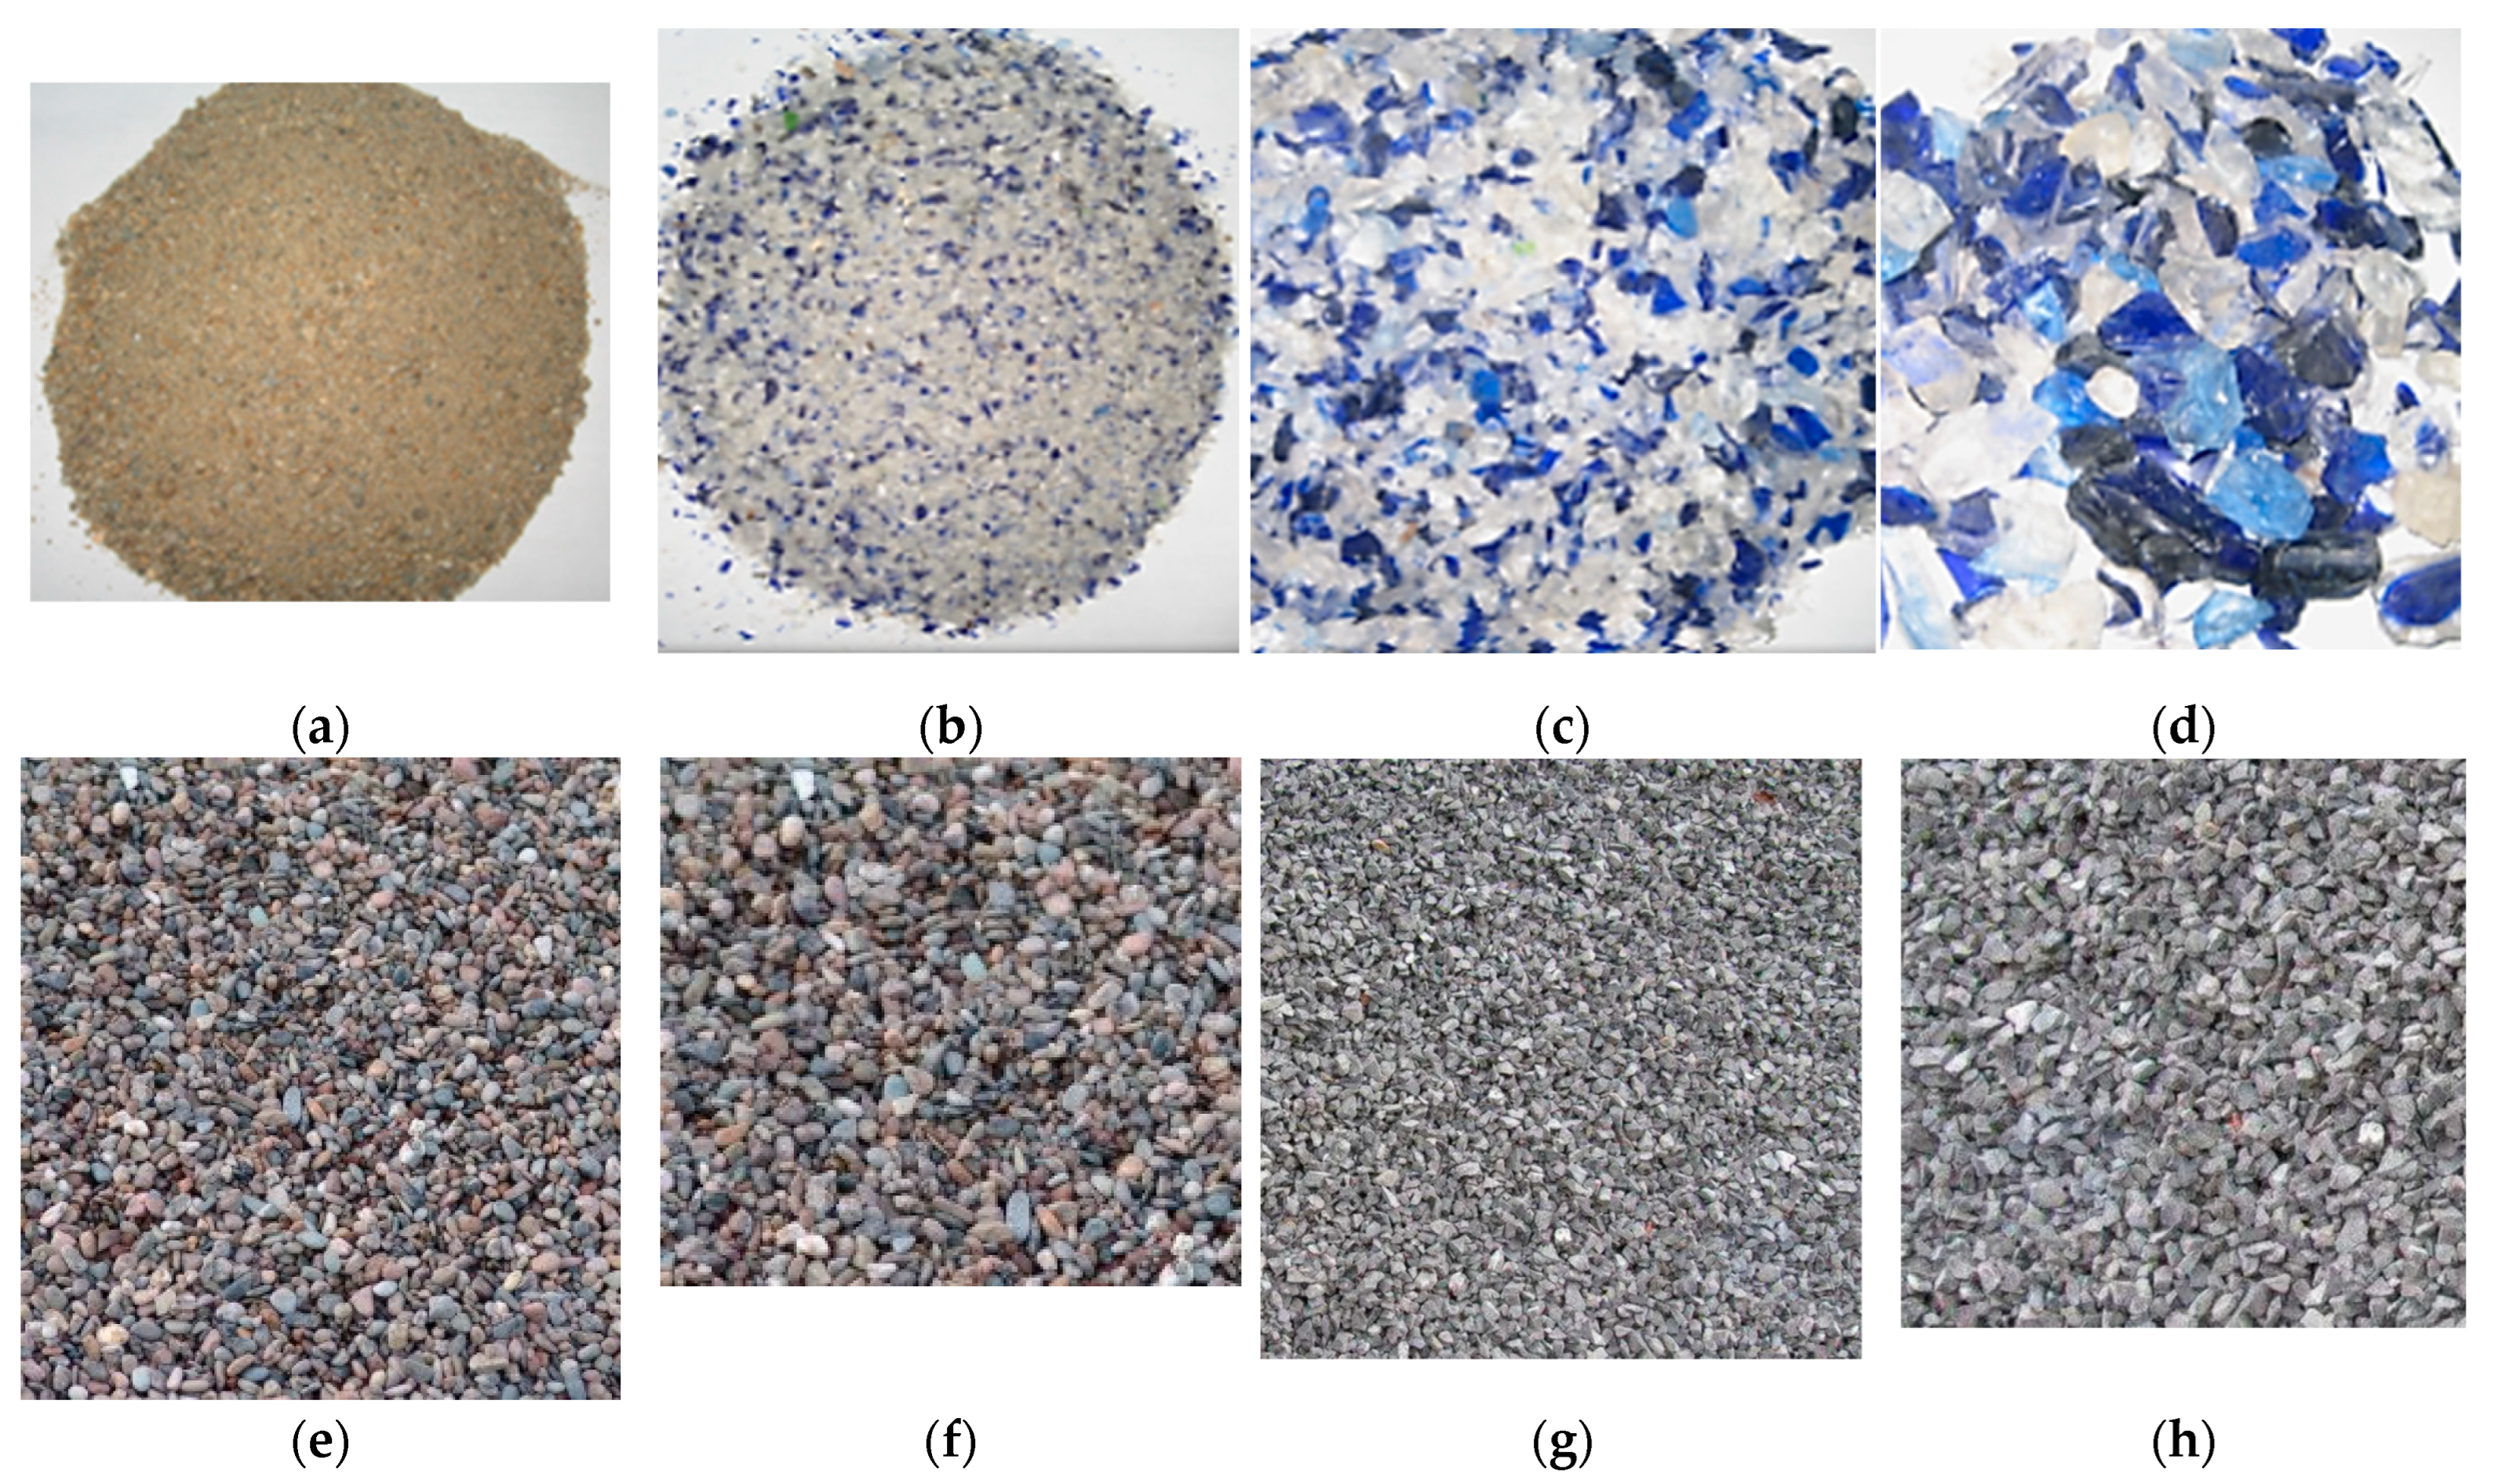
Figure 8.
Artificial Neural Network architecture (shallow).
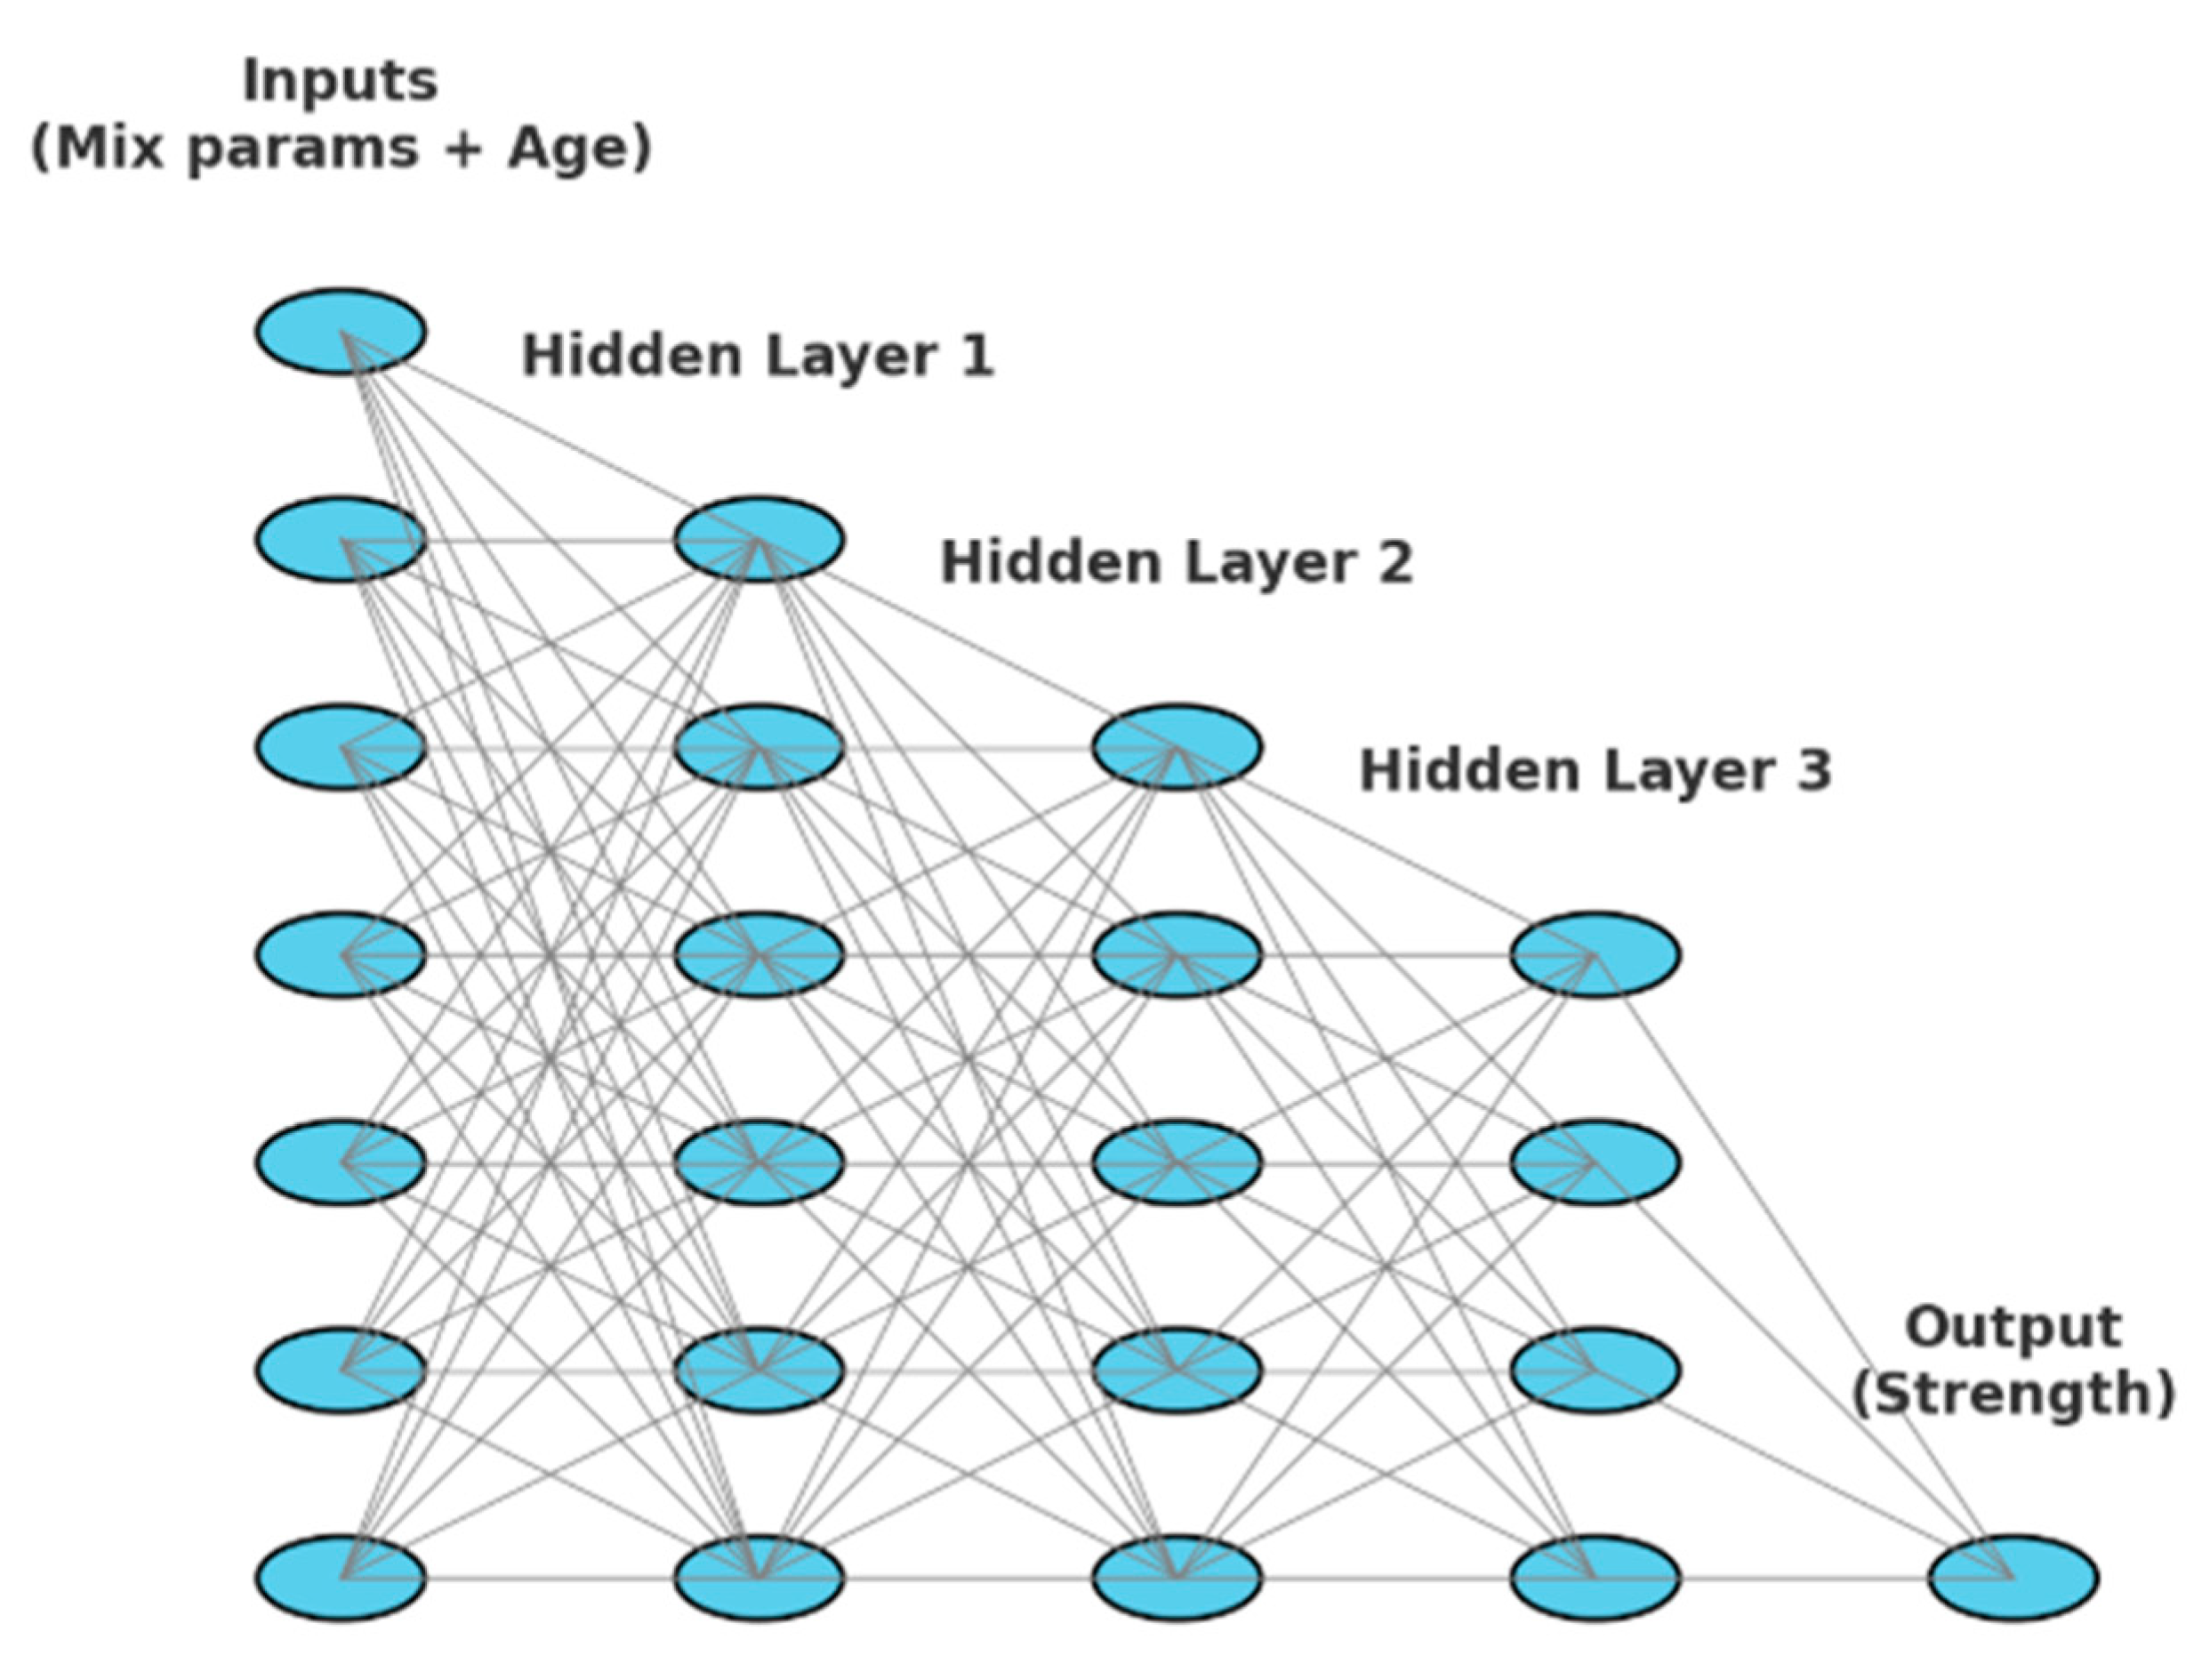
Figure 9.
The slump for Stage I mixtures: (a) and (b) Mixture S1, with the slump value is 0, the mixture after vibration shows cohesion; (c) Mixture S2, “Shear slump”, with classification in the compaction class S5 - 210 mm; (d) Mixture S3, "Shear slump" S4 -200 mm.; (e) Mixture S4, "Shear slump" S4 - 200 mm; (f) Mixture S5 , slump with central agglomeration of aggregates, S5 - 260 mm; (g) Mixture S6, "Shear slump" S4 - 165 mm.; (h) Mixture S7 with S5 - 255 mm.
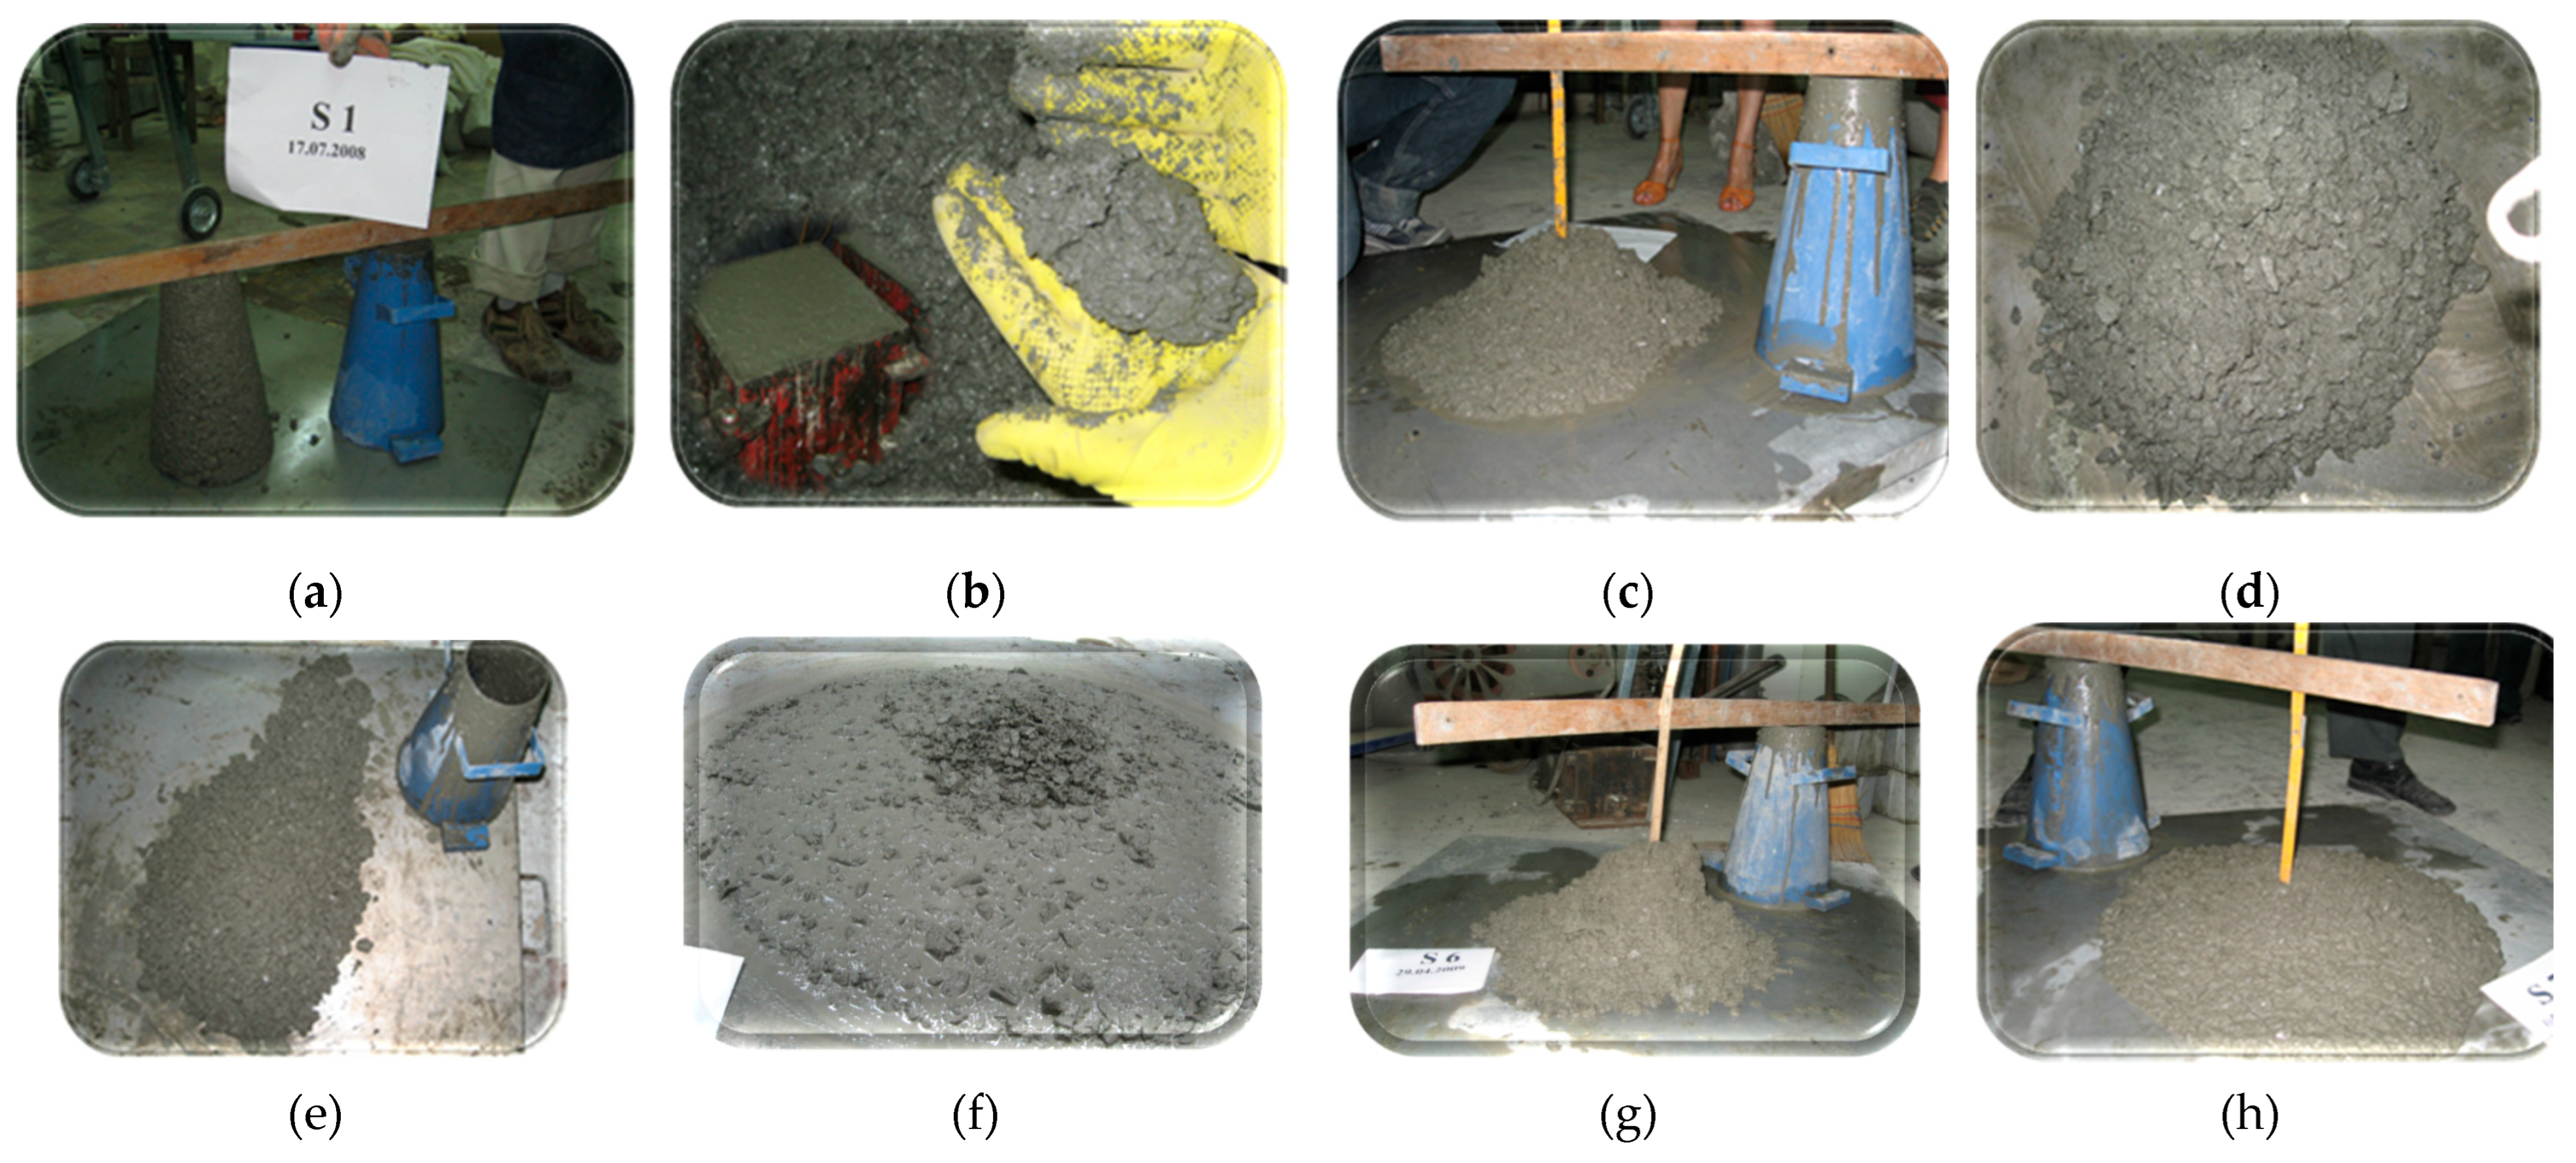
Figure 10.
The slump for Stage II ÷ IV mixtures: (a) Mixture S8-1, compaction class S2 = 53 mm (b) Mixture S8-3, Cone of slump left standing, without slump; (c) Mixture M, Cone of slump left standing, without slump; (d) Mixture Mr, Cone of slump left standing, without slump; (e) Mixture S8-1,A, compaction class S4 - 188 mm mm; (f) Mixture S8-1, A, concrete appearance after vibration compaction; (g) Mixture S8-1,B, S4 - 165 mm , slump followed by collapse called "Shear slump"; (h) Mixture S8-1, B, concrete appearance after vibration compaction;.
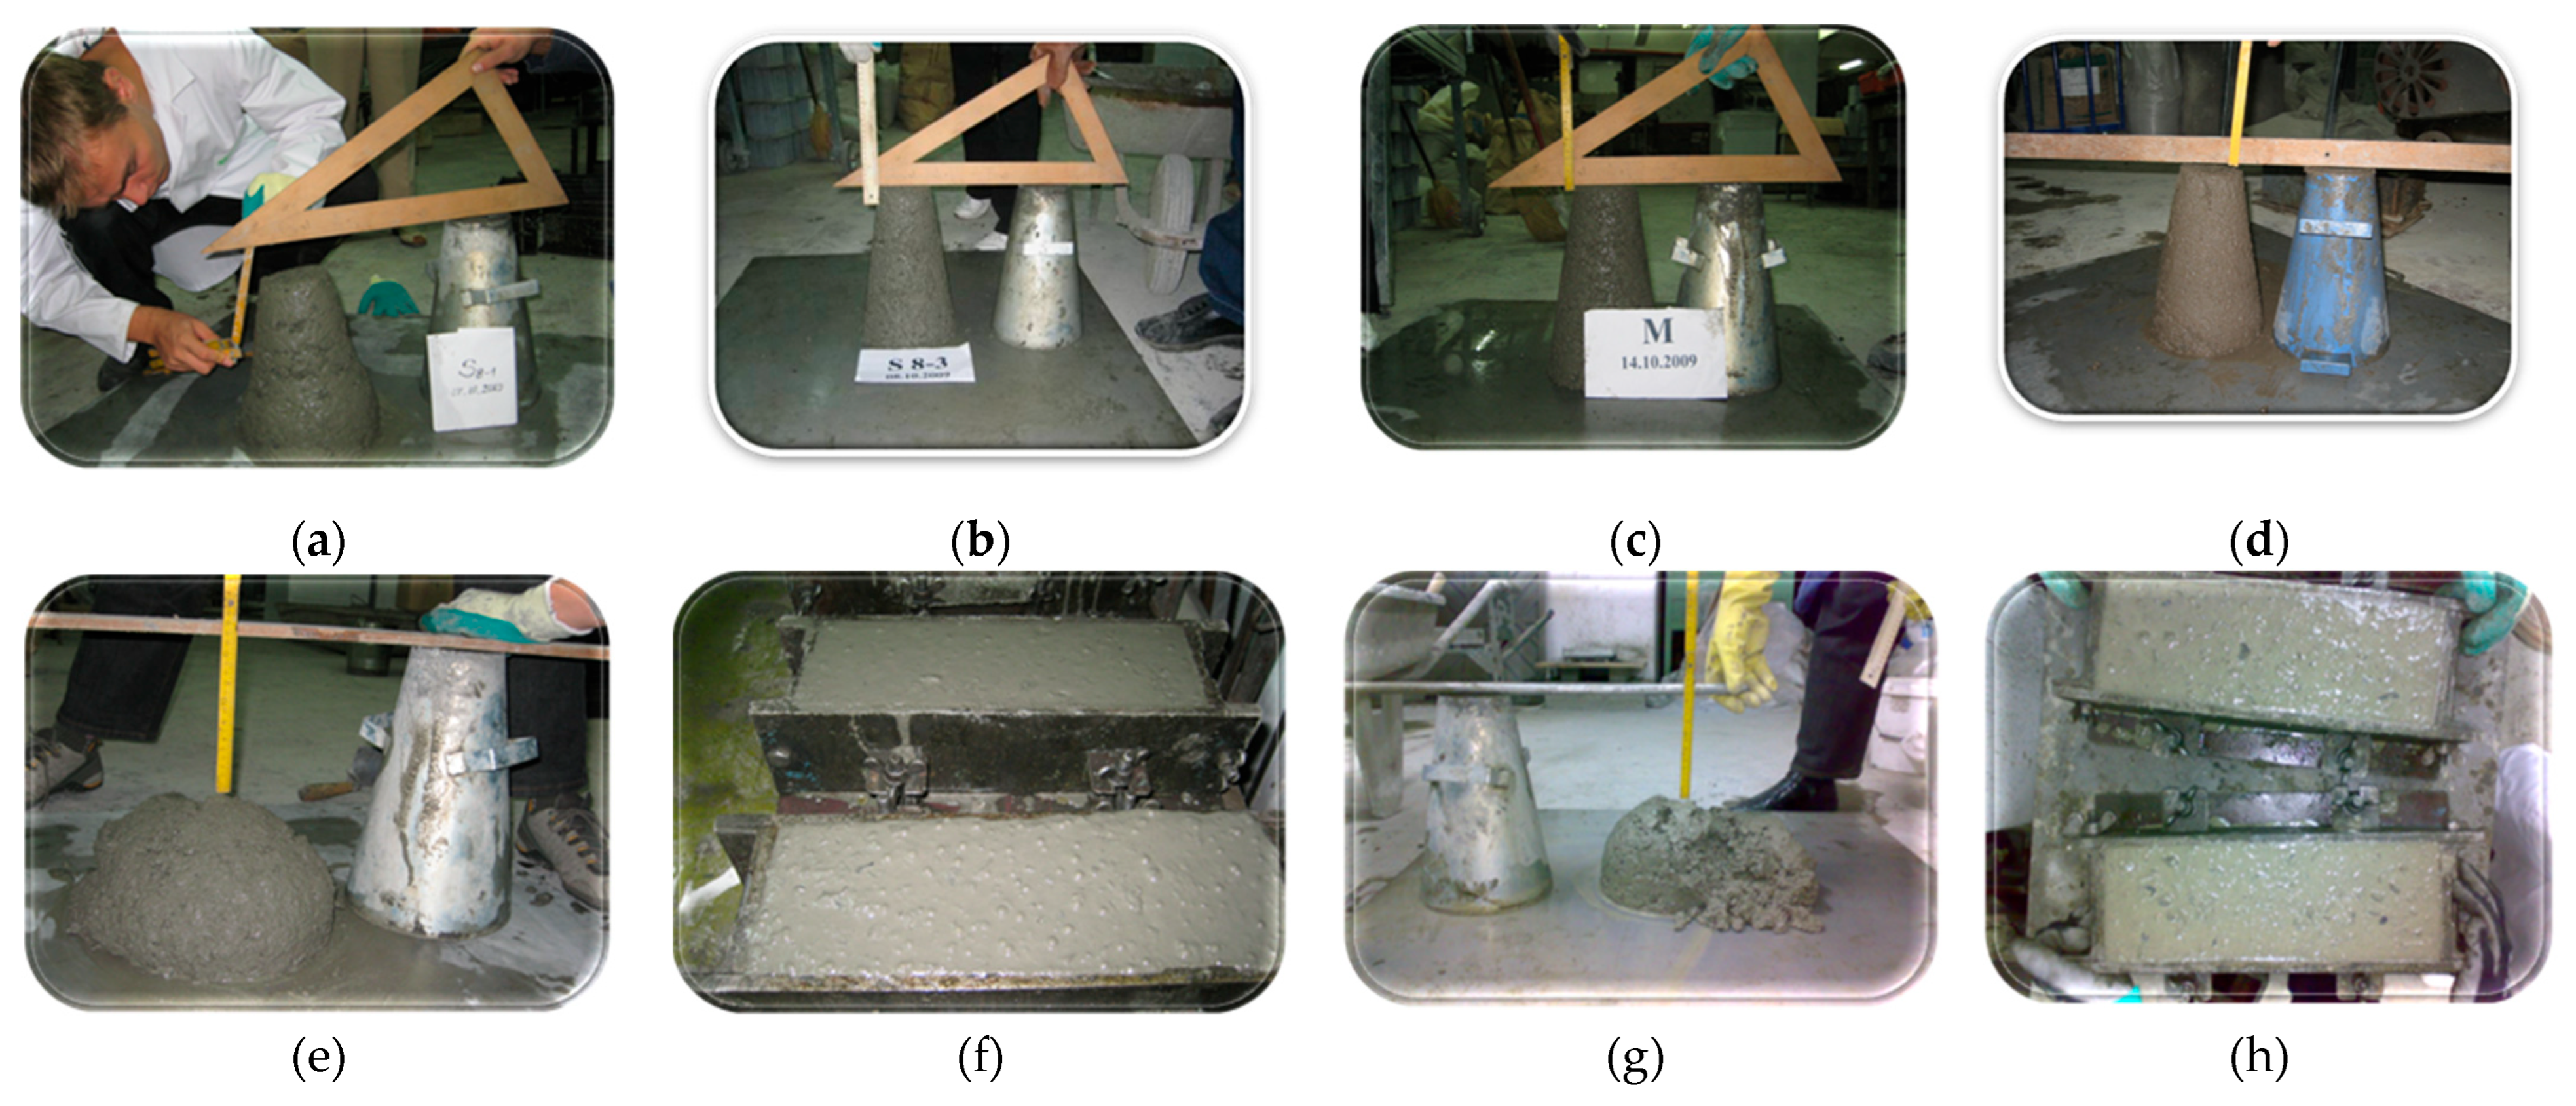
Figure 11.
The X ray spectra of the sample S1-8, A with the typical line for Quartz (Qz), Muscovite, Albite, Calcite, Clonochlore, Portlandite and Magnesio-homblende.
Figure 11.
The X ray spectra of the sample S1-8, A with the typical line for Quartz (Qz), Muscovite, Albite, Calcite, Clonochlore, Portlandite and Magnesio-homblende.
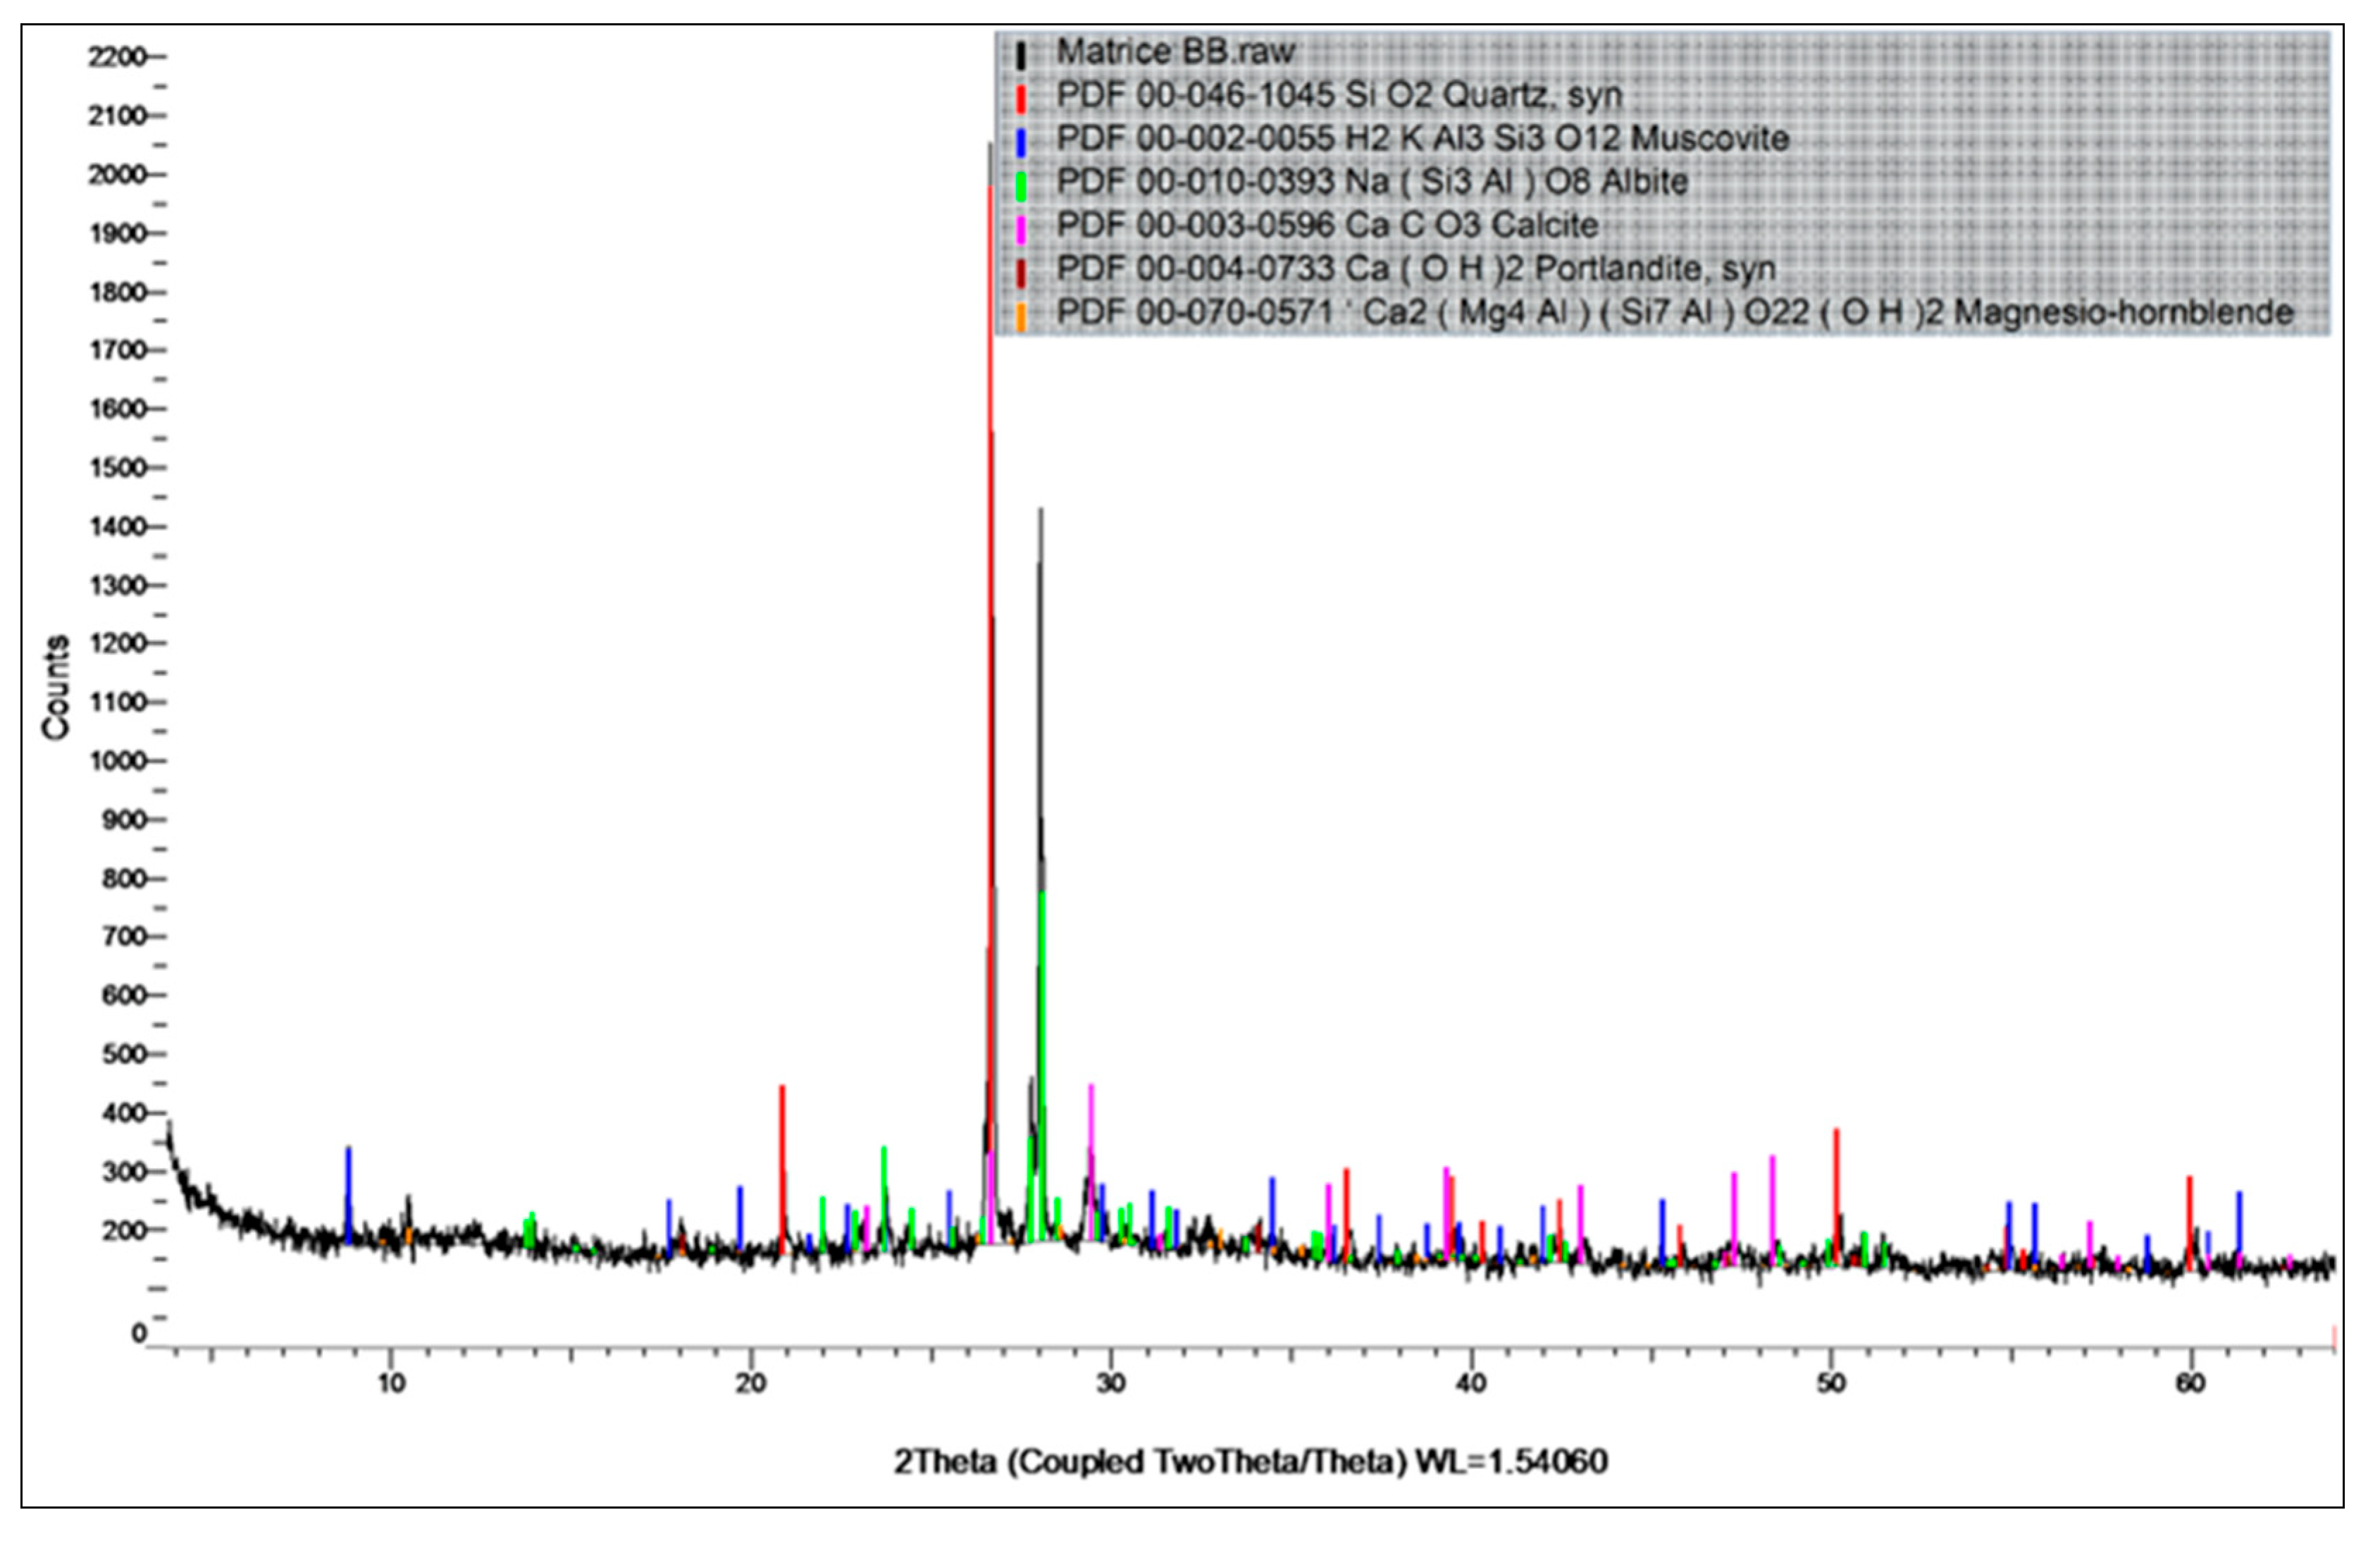
Figure 12.
Microscopic image of the sample S8-1, A at parallel pollars (on the left side) and crossed pollars (on the right side): (a) and (b) WGA, CRA, CAC, Quartz (Qz), (c) and (d) light formations around the aggregates ((C-S-H) - hydrated calcium silicates, (A-S-H)—hydrated aluminum silicates); (e) and (f) light formations around the aggregates (C-S-H) and (A-S-H); WGA; (g) and (h) non-hydrated clinker. The scale bar is 1 mm.
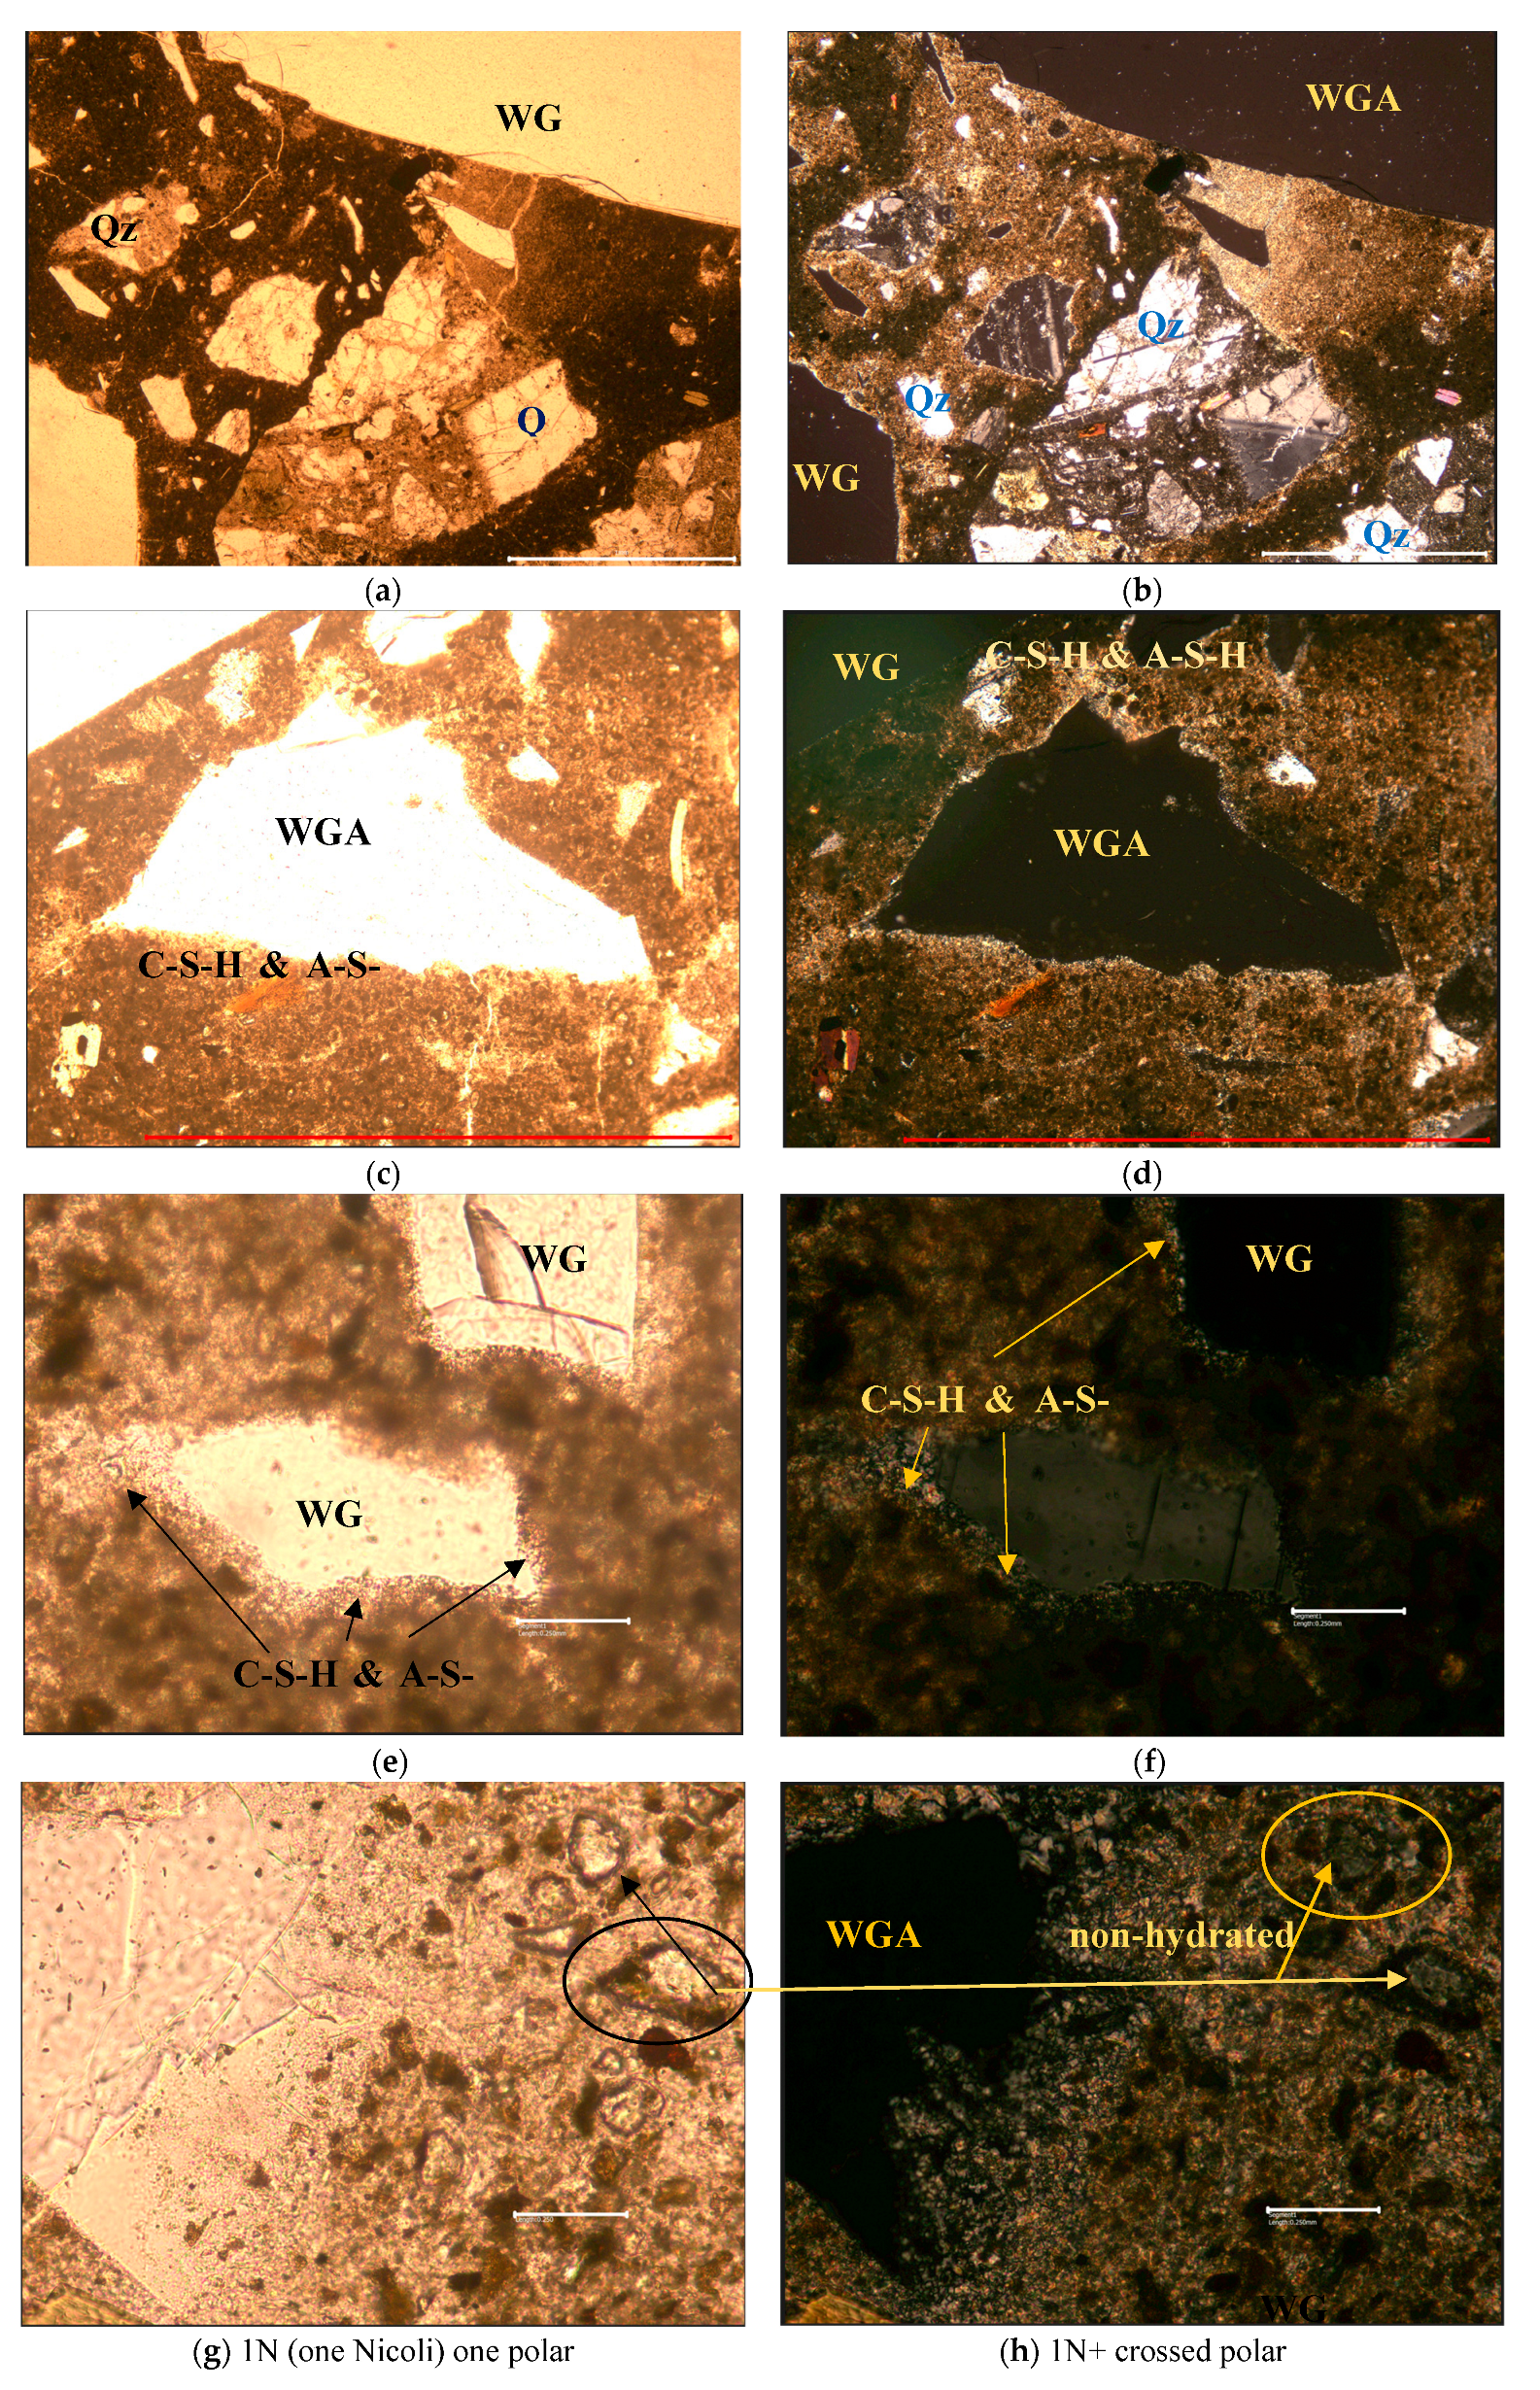
Table 1.
The physical-mechanical characteristics of CEM I 52,5 R.
| Characteristics | UM | Determined values | Standards | |||
|---|---|---|---|---|---|---|
| Fineness | The Blaine Method | cm2/g | 4560 + 120 | SR EN 196-6 [28] |
||
| Sieving method, refusal on 90 mm sieve | % | 0 | ||||
| Determination of setting time and stability | Initial setting time | Min. | 130 | SR EN 196-3 [29] |
||
| Stability | mm | Max. 10 | ||||
| Determination of mechanical strengths | Compressive strength 2 days |
MPa | 33.7 | 33.9 | 32.3 | SR EN 196-1 [30] |
| 33.5 | 32.3 | 34.1 | ||||
| 33.3 | ||||||
| Compressive strength 28 days | 63.0 | 63.0 | 62.4 | |||
| 62.7 | 62.5 | 62.0 | ||||
| 62.6 | ||||||
Table 2.
Chemical composition main oxides of ordinary Portland cement (OPC), glass powder (GP), silica fume (SP) and river sand 0/4 mm.
Table 2.
Chemical composition main oxides of ordinary Portland cement (OPC), glass powder (GP), silica fume (SP) and river sand 0/4 mm.
| Composition main oxides (%) | Content (wt%) | |||
|---|---|---|---|---|
| CEM I 52.5 R | SF | WGP | River Sand | |
| SiO2 | 14.30 | 98.350 | 74.25 | 73.60 |
| CaO | 69.46 | 0.334 | 8.10 | 0.080 |
| Fe2O3 | 3.79 | 0.168 | 0.06 | 0.765 |
| Al2O3 | 5.90 | 0.880 | 0.25 | 4.720 |
| SO3 | 3.70 | 0.035 | - | - |
| Na2O | 0.07 | - | 16.27 | 0.266 |
| MgO | 1.30 | 0.096 | 0.01 | - |
| Oder | 1.48 | 0.137 | 1.06 | 20.569 |
Table 3.
Physical properties of aggregates.
| Materials | Specific gravity | Bulk Density | Water absorption |
|---|---|---|---|
| mg/m3 | kg/m3 | % | |
| River sand 0/4 mm | 2.70 | 1743 | 3.50 |
| CRA 4/8 mm | 2.70 | 1635 | 2.40 |
| CRA 8/16 mm | 2.70 | 1635 | 1.80 |
| CAC 4/8 mm | 2.65 | 1630 | 1.40 |
| CAC 8/16 mm | 2.67 | 1630 | 1.20 |
| WGA 0/4 mm | 2.47 | 1640 | 2.74 |
| WGA 4/8 mm | 2.47 | 1533 | 0.35 |
| WGA 8/16 mm | 2.47 | 1533 | 0.3 |
Table 5.
Hardened concrete properties.
| Properties | ECCs | |||||||||
| S7 | S8-1 | S8-2 | S8-3 | S8-1, A | S8-1, B | M | Mr | |||
| fcm | 7 days | 61.1 | 66.3 | 59.2 | 69.1 | 71.9 | 48.4 | 80.4 | 74.2 | |
| 28 days | 69.6 | 70.3 | 68.0 | 79.6 | 83.0 | 50.3 | 87.9 | 79.7 | ||
| 56 days | 76.5 | 82.9 | 73.8 | 79.6 | 83.7 | 50.7 | 92.8 | 80.3 | ||
| 90 days | 79.9 | 83.2 | 74.4 | 83.7 | 85.6 | 52.3 | 101.7 | 80.7 | ||
| 120 days | 86.8 | 85.5 | 74.7 | 89.9 | 88.4 | 54.2 | 116.5 | 89.6 | ||
| fct,fl | 270 days | 4.0 | 3.1 | 2.7 | 3.2 | 5.8 | - | - | - | |
| fct,sp | 28 days | 3.7 | 6.1 | 4.5 | 4.5 | 5.7 | - | 3.7 | 1.7 | |
| MOE [GPa] | 28 days | 47 | 50 | 50 | 52 | 54 | - | 48 | - | |
| Abrasion [mm3/ 5000 mm2] | 8482 | 7684 | 12216 | 14204 | 7517 | 5632 | 6913 | 7068 | ||
| Strength loss η (%) at G100 | - | - | - | - | 5.54 | 9.87 | 5.52 | |||
| Permeability at 12 atm. [mm] | - | - | - | - | 10 | - | - | - | ||
| Carbonation [mm] | 360 days | 0 | 0 | 0 | 0 | 0 | 0 | 0 | 0 | |
| Shrinkage [mm/m] 120 days | 0.20 | 0.30 | ||||||||
* fcm – the average compressive strength of concrete at curing age; fct,fl - flexural strength; fct,sp splitting tensile strength in accordance with SR EN 12390-6; G100 - samples were subjected to 100 freeze-thaw cycles.
Table 8.
Evolution of the compressive strength of ECCs, Control M and S8-1, A.
| ECCs | Average compressive strength of concrete at curing age | ||||
|---|---|---|---|---|---|
| fcm 7 days | fcm 28 days | fcm 56 day | fcm 90 days | fcm 120 days | |
| S8-1, A | 71.9 | 83.0 | 83.7 | 85.6 | 88.4 |
| M | 80.4 | 87.9 | 92.8 | 101.7 | 116,5 |
| S8-1, A / M | 0.89 | 0.94 | 0.90 | 0.84 | 0.76 |
Disclaimer/Publisher’s Note: The statements, opinions and data contained in all publications are solely those of the individual author(s) and contributor(s) and not of MDPI and/or the editor(s). MDPI and/or the editor(s) disclaim responsibility for any injury to people or property resulting from any ideas, methods, instructions or products referred to in the content. |
© 2025 by the authors. Licensee MDPI, Basel, Switzerland. This article is an open access article distributed under the terms and conditions of the Creative Commons Attribution (CC BY) license (http://creativecommons.org/licenses/by/4.0/).
Copyright: This open access article is published under a Creative Commons CC BY 4.0 license, which permit the free download, distribution, and reuse, provided that the author and preprint are cited in any reuse.


