
Submitted:
06 October 2025
Posted:
08 October 2025
You are already at the latest version
Abstract
This study investigates the mechanical performance of concrete incorporating wood ash (WA) and nanosilica (NS) as partial cement replacements, with a focus on optimizing compressive and flexural strength. A total of 21 mortar mixes were designed and tested at various curing ages. Two modelling approaches—Response Surface Methodology (RSM) and Artificial Neural Networks (ANN)—were employed to analyse the effects and interactions of WA and NS on strength development. RSM provided insight into factor significance, while ANN captured complex nonlinear relationships with higher predictive accuracy (R² = 1.000 for 28-day strength). The results showed that NS significantly improved strength up to an optimal dosage (~2.5 g), beyond which performance declined due to agglomeration or matrix over-refinement. Conversely, high WA content generally reduced strength due to dilution effects. Optimization revealed that blends with low WA (≤30 g) and moderate NS (2.0–2.5 g) achieved the best mechanical performance. ANN-based predictions outperformed RSM and multilinear regression, demonstrating its utility for mix design and performance forecasting in sustainable cementitious systems.
Keywords:
wood ash
; nanosilica
; compressive strength
; flexural strength
; artificial neural network (ANN)
; response surface methodology (RSM)
; concrete optimization
; sustainable concrete
; pozzolanic materials
; strength prediction models
1. Introduction
The construction industry faces escalating sustainability pressures, with concrete—second only to water in global consumption—responsible for roughly 8–10% of CO₂ emissions, largely from cement production [1,2,3,4]. Coupled with depletion of natural resources and mounting waste streams, this has accelerated the search for eco-friendly alternatives to conventional concrete constituents [5,6]. Two promising supplementary cementitious materials (SCMs) are wood ash (WA), a biomass-combustion by-product that valorizes waste within circular-economy principles, and nanosilica (NS), whose high specific surface area and reactivity can refine microstructure and boost mechanical performance [7,8,9,10,11,12]. Yet, optimizing mixes that incorporate multiple sustainable ingredients remains challenging due to nonlinear, interacting effects among constituents on fresh and hardened properties; traditional trial-and-error is slow, costly, and often misses these interactions, motivating data-driven modeling via Response Surface Methodology (RSM) and Artificial Neural Networks (ANN) [13,14,15,16,17].
Over the past two decades, WA has been explored as a partial cement replacement with typically weaker pozzolanic activity than fly ash but meaningful contributions through both secondary reactions and filler effects [18,19]. Several studies report viable replacement levels on the order of 10–20% without major losses in mechanical performance when WA is properly characterized and processed [20,21]. Composition varies by fuel type and combustion conditions; higher SiO₂/Al₂O₃ contents generally improve pozzolanic potential [22,23]. Beyond waste diversion, life-cycle assessments indicate carbon-footprint reductions up to ~15% at optimal dosages [24,25]. Practical challenges include variability, workability penalties, and unburnt carbon that may depress strength or entrain air [10,12].
NS improves concrete through a dual mechanism: rapid pozzolanic reaction with Ca(OH)₂ and nano-scale packing that densifies the matrix and refines the pore system [26,27]. Reported compressive-strength gains up to ~25% are common near 2–3% (by binder) when dispersion is well controlled [28,29]. Performance depends on particle size, surface chemistry, and dispersion method; agglomeration above optimal contents can erode benefits and reduce workability [30,31]. Reviews consistently document microstructural densification, reduced permeability, and durability gains attributable to NS-driven nucleation and pore refinement [32,33,34].
Combining WA and NS can yield complementary effects: NS supplies abundant nucleation sites and early-age reaction kinetics, while WA contributes longer-term pozzolanic reactions and filler action, jointly enhancing microstructure when proportioned appropriately [35,36,37]. However, the interaction is complex—spanning chemical, physical, and rheological domains—and requires systematic optimization to balance strength, durability, and workability.
To that end, RSM offers an efficient statistical framework to map factor effects and interactions with relatively few experiments, delivering predictive polynomials and significance analyses well suited to multi-variable mix design [38,39,40,41,42]. Recent sustainable-concrete studies have used RSM to optimize strength, workability, and durability with good fidelity and actionable operating windows [43,44,45,46]. ANNs, in turn, capture strongly nonlinear relationships without imposing parametric forms, often achieving higher predictive accuracy when trained on sufficiently rich datasets with appropriate architectures and regularization [47,48,49,50]. Comparative surveys report ANNs outperforming traditional regressions for strength prediction in complex binders, provided data quality and model design are adequate [51,52,53]; R² values >0.95 for compressive-strength prediction in mixes with multiple SCMs are frequently reported [54,55,56,57].
Despite this progress, key gaps persist: (i) limited studies that co-optimize WA and NS (and other SCMs) within an integrated design space; (ii) limited standardization of testing protocols and performance criteria for greener binders; (iii) sparse long-term durability data across environmental exposures; and (iv) few head-to-head comparisons of RSM versus ANN for sustainable-concrete optimization [61,62,63,64,65,66,67]. Addressing these gaps, the present study investigates eco-friendly concrete with WA and NS using both RSM and ANN to (i) quantify effects on compressive and flexural strengths at multiple curing ages, (ii) compare predictive/optimization performance of RSM and ANN in a shared dataset, (iii) identify optimal WA–NS combinations that maximize mechanical performance while advancing sustainability goals, and (iv) validate predictions and distill practical guidelines for implementation.
The contribution of this study is twofold: it delivers optimized, performance-based formulations that can reduce environmental burdens while maintaining or enhancing structural properties, and it provides a comparative modeling perspective to guide method selection (RSM vs. ANN) for complex, multi-variable sustainable systems. The outcomes support the development of performance-based specifications and can facilitate broader adoption of eco-friendly concretes in practice.
2. Methodology
2.1. Materials and Methods
2.1.1. Chemical Properties of Materials
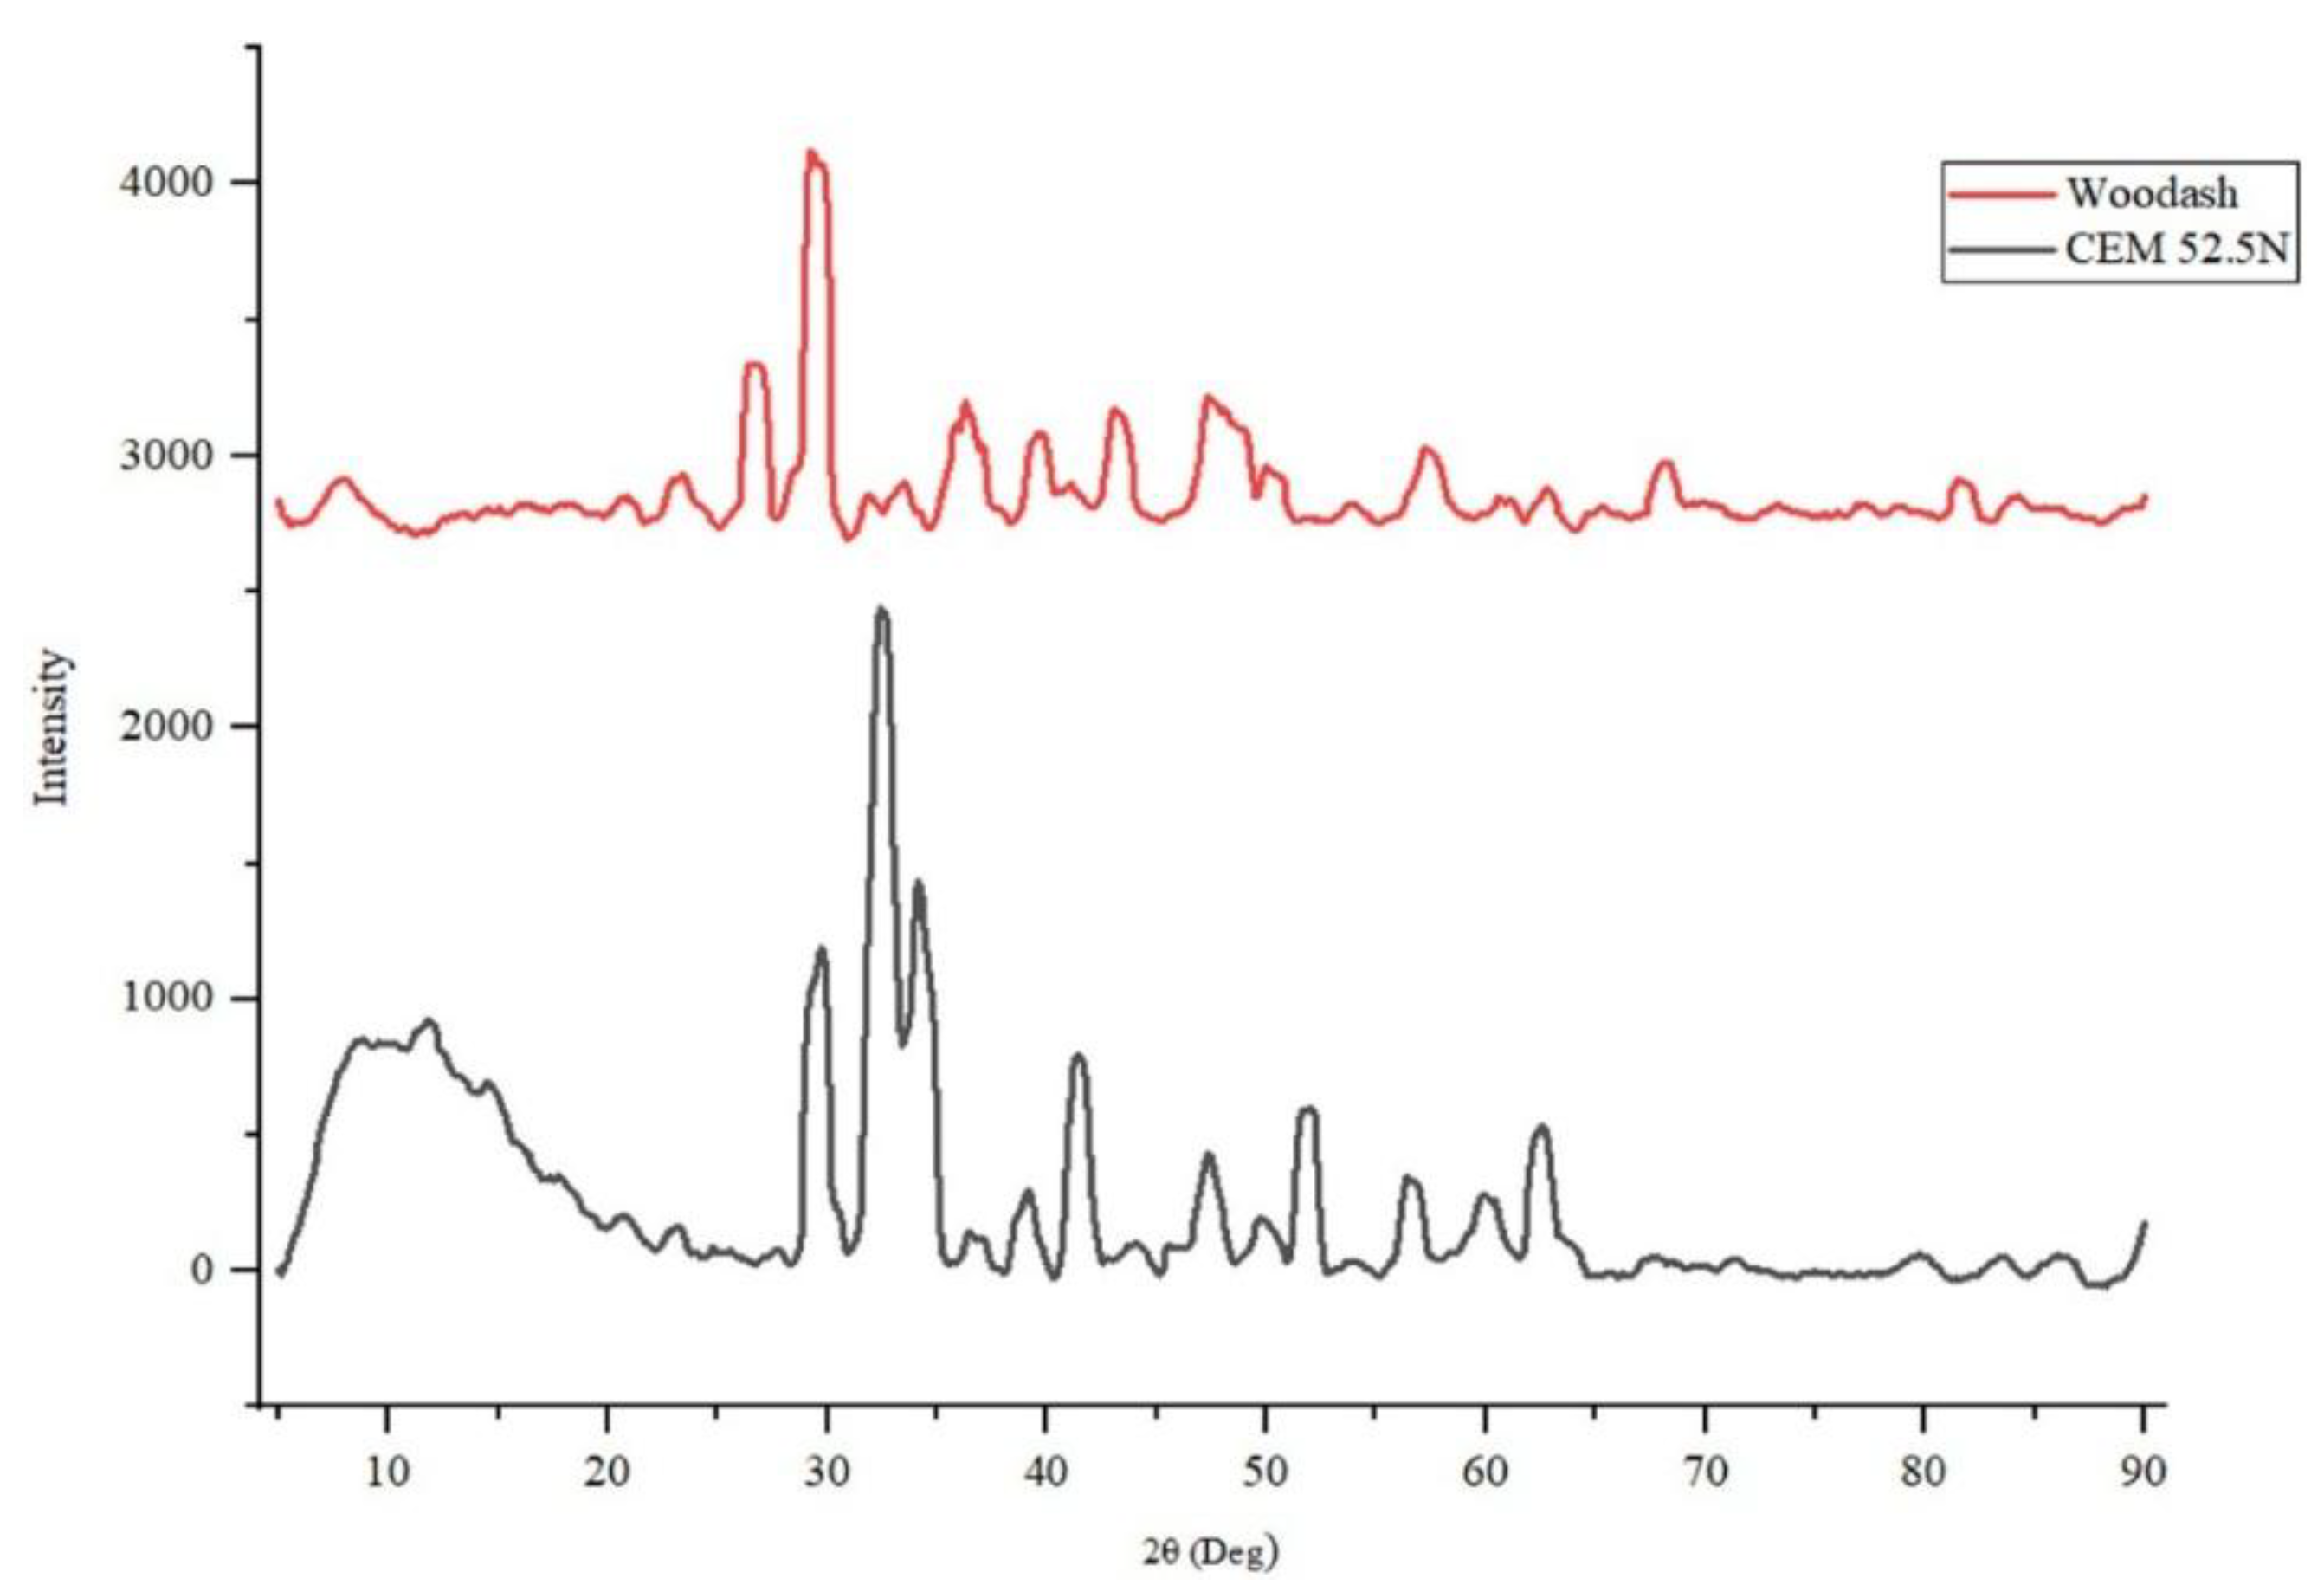
A previous experimental study by the authors [35] gives a full description of the materials used. Ordinary Portland cement conforming to SANS 50197-1 (CEM I 52.5 N) was used as the primary binder. Wood ash was collected from Blackwattle tree residues obtained from commercial caterers in Johannesburg, oven-dried and sieved prior to use. A nanosilica solution was prepared by dissolving 3.5 g of SiO₂ powder in 13.201 L of distilled water as reported in the prior study this yields an approximate concentration of 0.265 mol·L⁻¹ and was used as part of the mixing water to ensure consistent dispersion during batching. Potable tap water was used for all mixes. The wood ash met the pozzolanic oxide criterion, with the combined SiO₂ + Al₂O₃ + Fe₂O₃ content measured at 93.67%, exceeding the 70% threshold as provided in Table 1 below. X-ray diffraction patterns confirmed higher crystallinity for cement relative to wood ash, which exhibited broader humps typical of an amorphous-rich phase; peak intensity for wood ash occurred at 2θ < 30°, while cement peaks were observed between 26–35°.
Figure 1.
Materials used: (a) CEM I 52.5 N; (b) wood ash; (c) nanosilica powder, (d) nanosilica solution prepared in distilled water. Adapted from the prior study [35].
Figure 1.
Materials used: (a) CEM I 52.5 N; (b) wood ash; (c) nanosilica powder, (d) nanosilica solution prepared in distilled water. Adapted from the prior study [35].
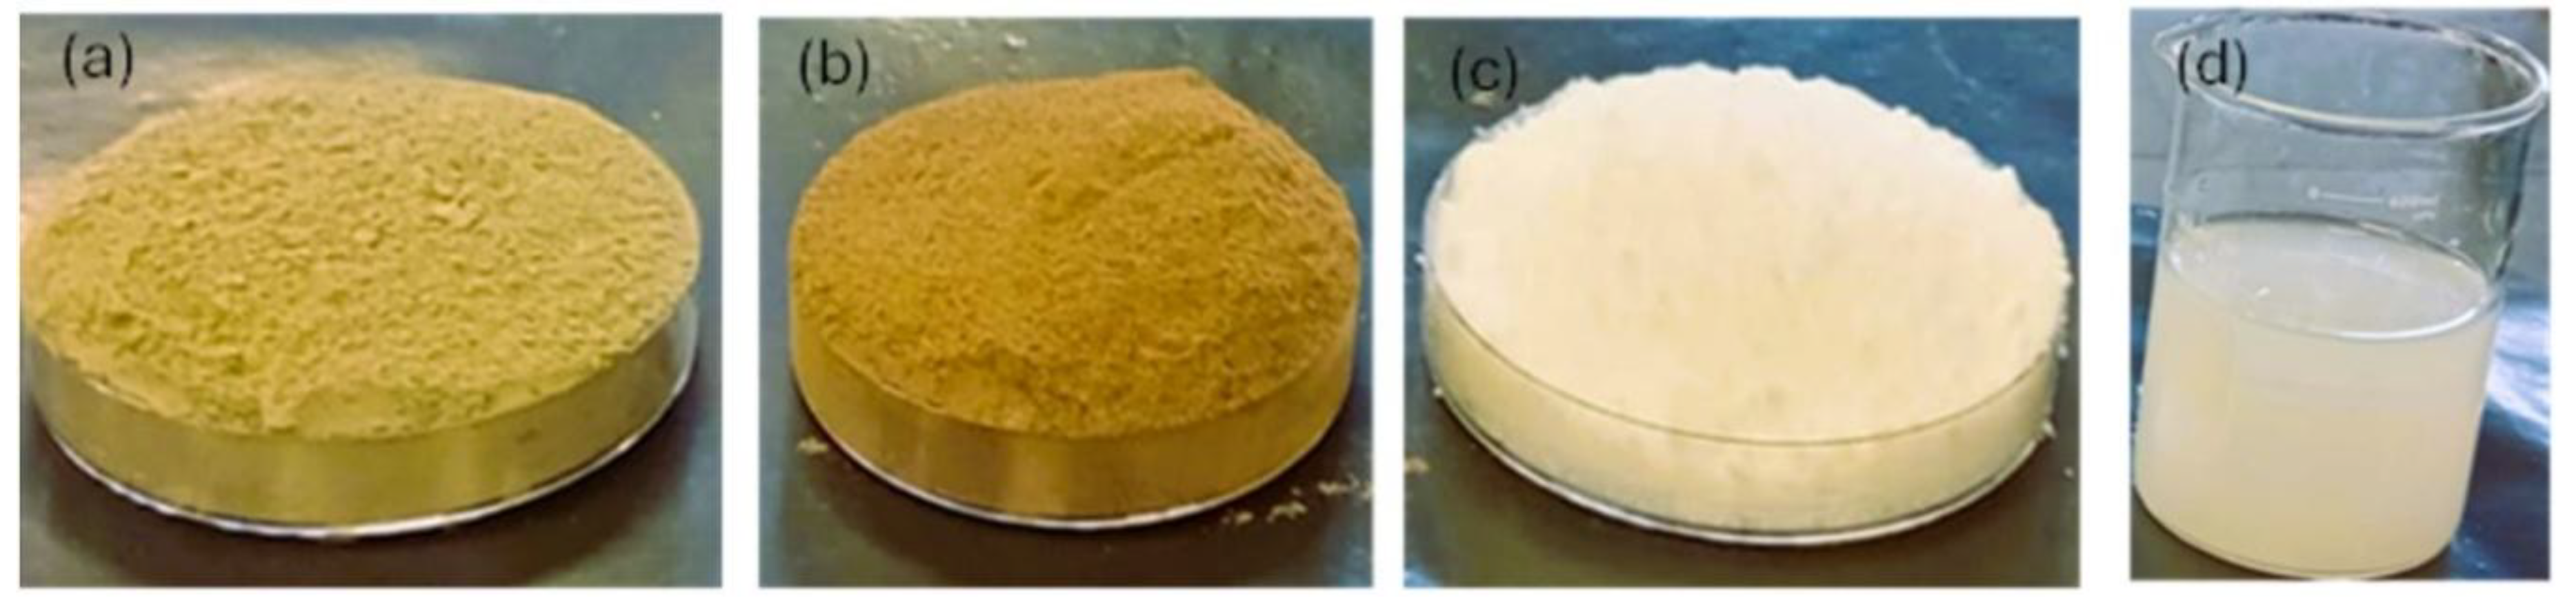
Figure 2.
XRD patterns of wood ash and CEM I 52.5 N showing lower crystallinity in wood ash relative to cement. Adapted from the prior study [35].
Figure 2.
XRD patterns of wood ash and CEM I 52.5 N showing lower crystallinity in wood ash relative to cement. Adapted from the prior study [35].
2.1.2. Mix Design and Preparation
Mortar mixtures followed EN 196-1 proportions, batching 450 ± 2 g cement, 225 ± 1 g water, and 1350 ± 5 g CEN standard sand per prism set. Wood ash replaced cement at 5, 10, 15, 20, and 25% by mass. Nanosilica was dosed at nominal 0, 0.6, 1.1, and 1.7% by binder mass and introduced as part of the mixing water to promote early dispersion. In total, twenty-one mixes were produced, with a water-to-binder ratio spanning 0.50–0.67 as determined by the fixed mass method and constant water content. Mix identities and exact batch masses are listed in Table 2.
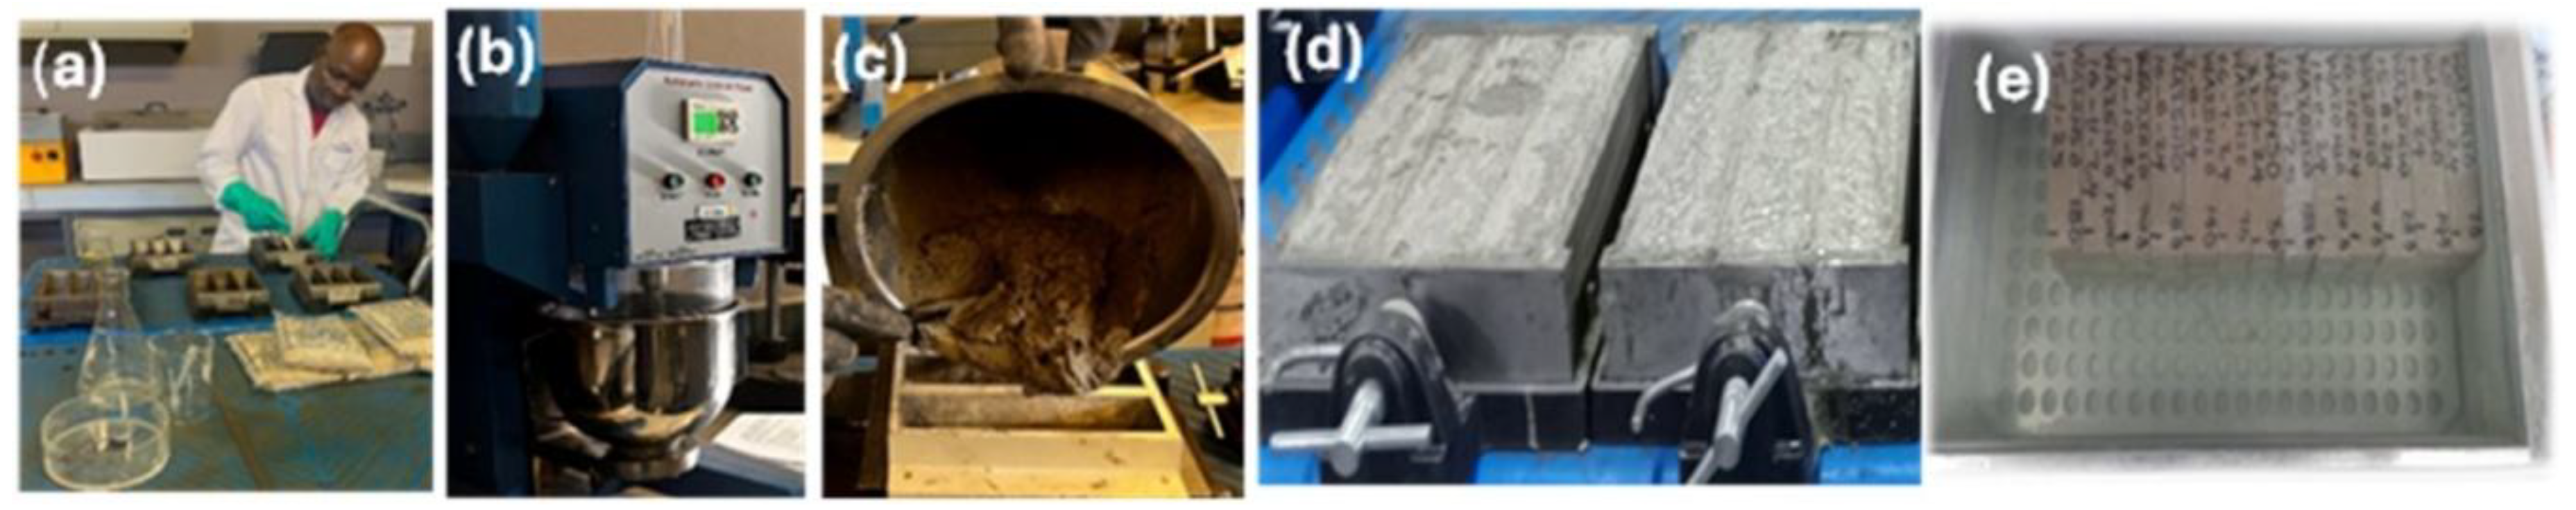
The mixing sequence was standardized to minimize variability and ensure comparable dispersion of nanosilica. Water containing the nanosilica dose was combined with cement at time zero and mixed at low speed for 30 s. Standard sand was introduced gradually between 30 and 60 s with continuous mixing, followed by an additional 30 s at low speed to reach 90 s. A 30 s stop was used for bowl scraping, then the mix rested from 120 to 180 s, and finally was mixed at high speed from 180 to 240 s to achieve a homogeneous mortar suitable for casting.
Figure 3.
Representative preparation stages: mixing, mould filling, early-age prisms after 24 h, and water-curing. Adapted from the prior study [35].
Figure 3.
Representative preparation stages: mixing, mould filling, early-age prisms after 24 h, and water-curing. Adapted from the prior study [35].
2.1.3. Casting, Curing, and Testing
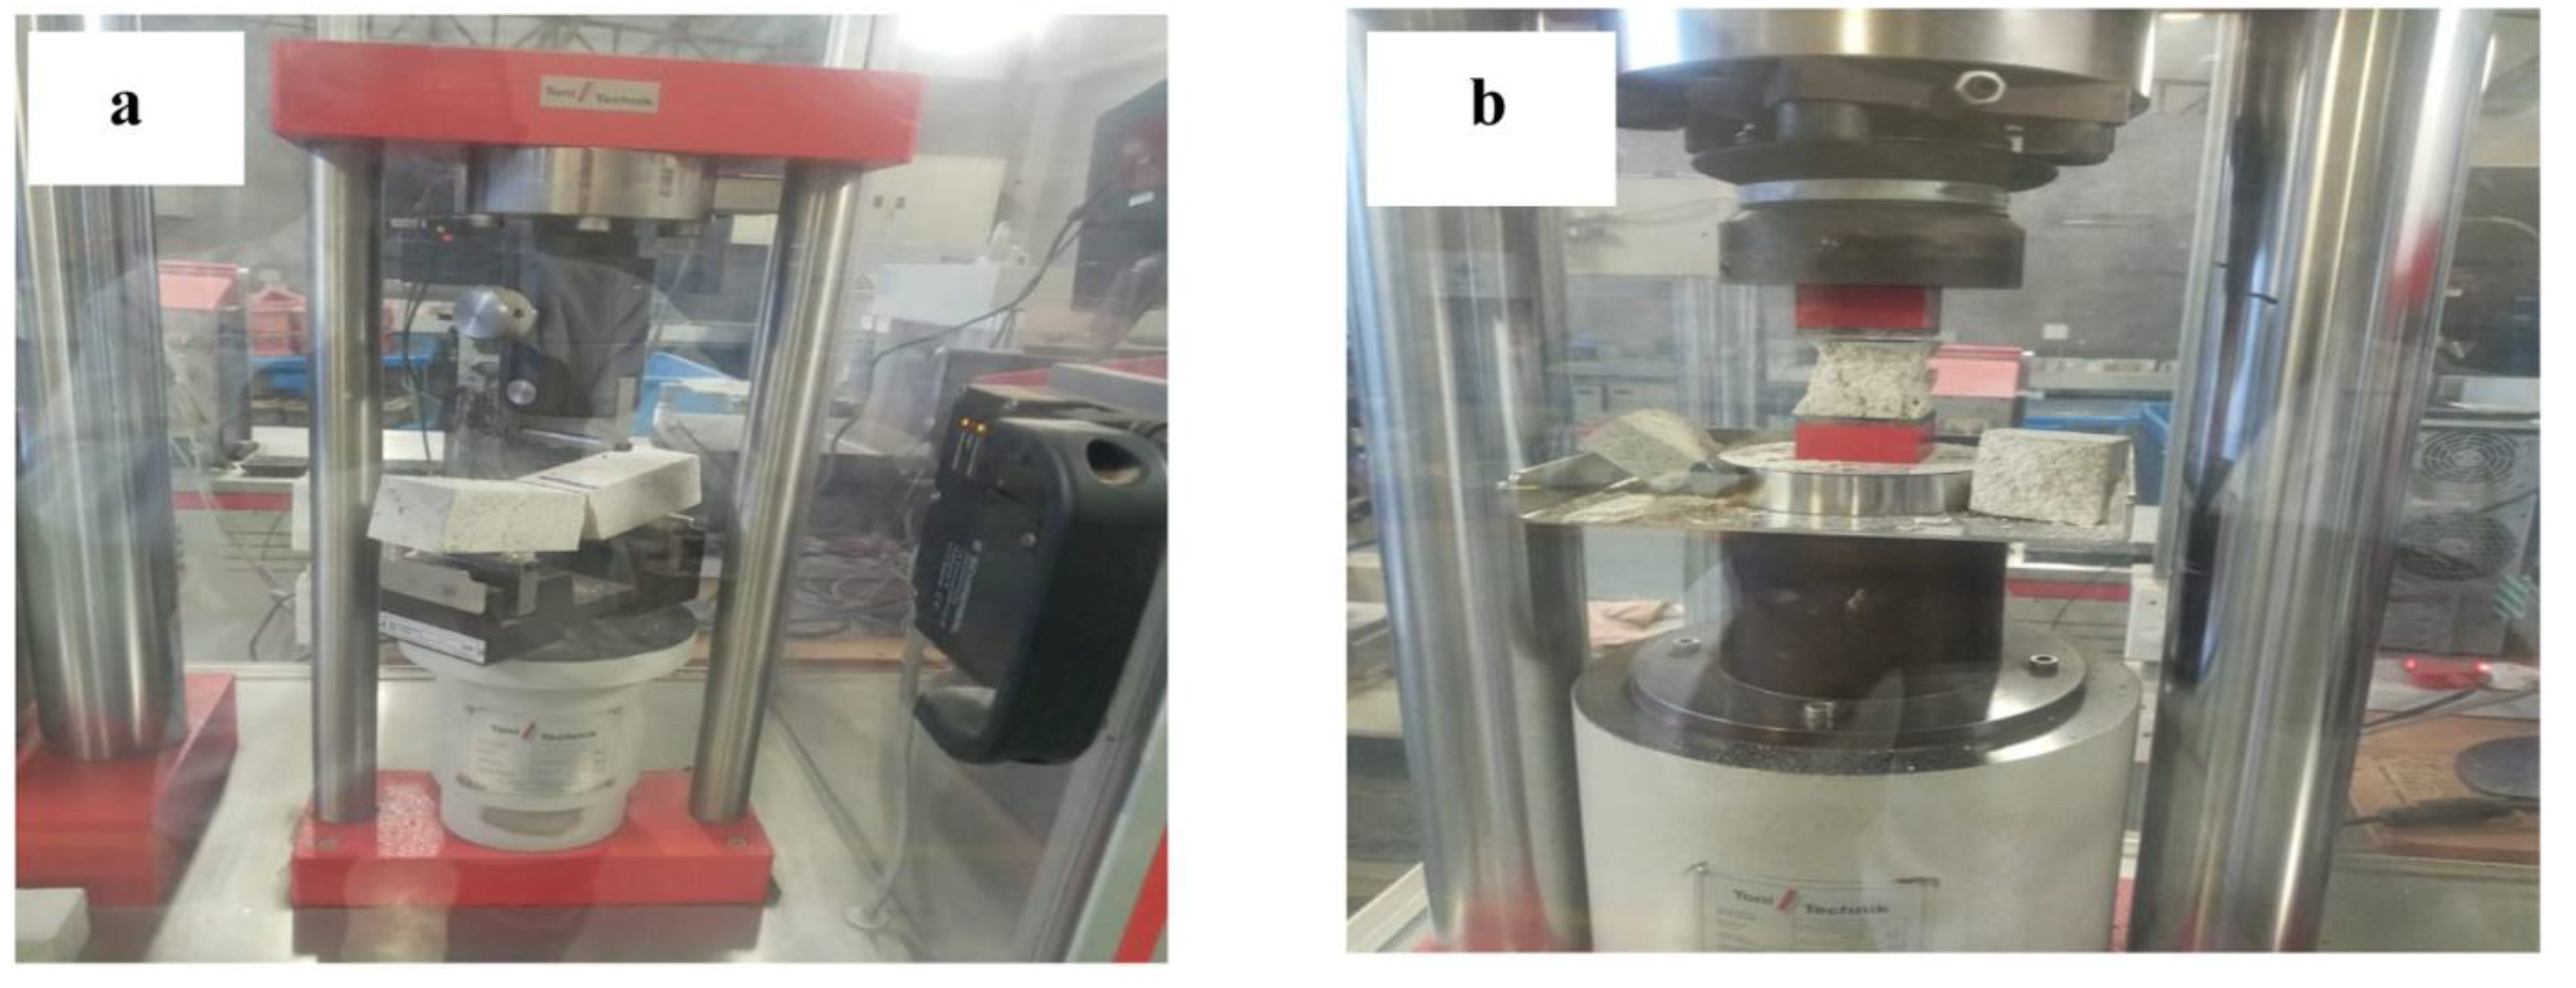
Mortar prisms measuring 40 × 40 × 160 mm were cast in steel moulds. Specimens remained in the laboratory for 24 h, were then demoulded, and cured in water until the designated test ages of 3, 7, 14, 28, and 90 days. Mechanical tests followed SANS 5864. Flexural strength was determined by three-point bending on the full prism; compressive strength was measured on the two halves from the flexural test. All results represent the average of three specimens per age and mix. Testing was performed on a Toni Technik machine rated to 300 kN, with the flexural and compressive failure modes documented for quality control.
Figure 4.
Test configurations and typical failure modes in flexure and compression on 40 × 40 × 160 mm prisms. Adapted from the prior study [35].
Figure 4.
Test configurations and typical failure modes in flexure and compression on 40 × 40 × 160 mm prisms. Adapted from the prior study [35].
2.2. Methods
2.2.1. Response Surface Methodology (RSM)
The RSM [58] was employed to analyse the experimental results related to the flexural and compressive strength of cement mortars incorporating WA and NS. This statistical approach was used to evaluate the significance and interaction effects of the input variables—WA and NS dosage—on strength development at various curing ages. The quality of the developed model was assessed using statistical indicators such as the coefficient of determination (R²), adjusted R², and predicted R². The F-value was used to determine the relative influence of each factor, with a higher F-value indicating a more significant effect on the output response. The P-value was used to assess the statistical significance of the model and its terms; a P-value less than 0.05 was considered statistically significant, indicating that the factor or model term has a meaningful effect on strength development [59]. The RSM analysis in this study was conducted using Design Expert 12 (trial version), allowing for optimization and visualization of the influence of WA and NS contents on mortar performance.
2.2.2. Artificial Neural Network (ANN)
The Artificial Neural Network (ANN) approach was used to develop a predictive model for the strength performance of mortars containing wood ash and nanosilica. ANN is a computational model inspired by the biological neural networks of the human brain and is particularly effective for capturing nonlinear relationships among complex input variables[47,60,61]. In the context of this study, the ANN model was constructed using input features such as cement, sand, water, wood ash, nanosilica, and curing age, with the target output being either compressive or flexural strength. Each input parameter was weighted and combined using a set of learned coefficients (weights), followed by the application of a bias term. This process is illustrated in Figure 5, which shows a schematic representation of an artificial neuron. The mathematical formulation of a single neuron is given by Eq. (1) [62]:
where represents each input (e.g., WA, NS, water content), is the corresponding weight, is the bias, and is the activation function applied to produce the output.
Model training and implementation were carried out using Python 3’s scikit learn module [63], and hyperparameters were optimized [64] to improve prediction accuracy. The ANN model enabled robust prediction of mortar strength by learning from the experimental dataset and generalizing well to unseen mix compositions.
3. Results
3.1.28. Days Compressive Strength Analysis
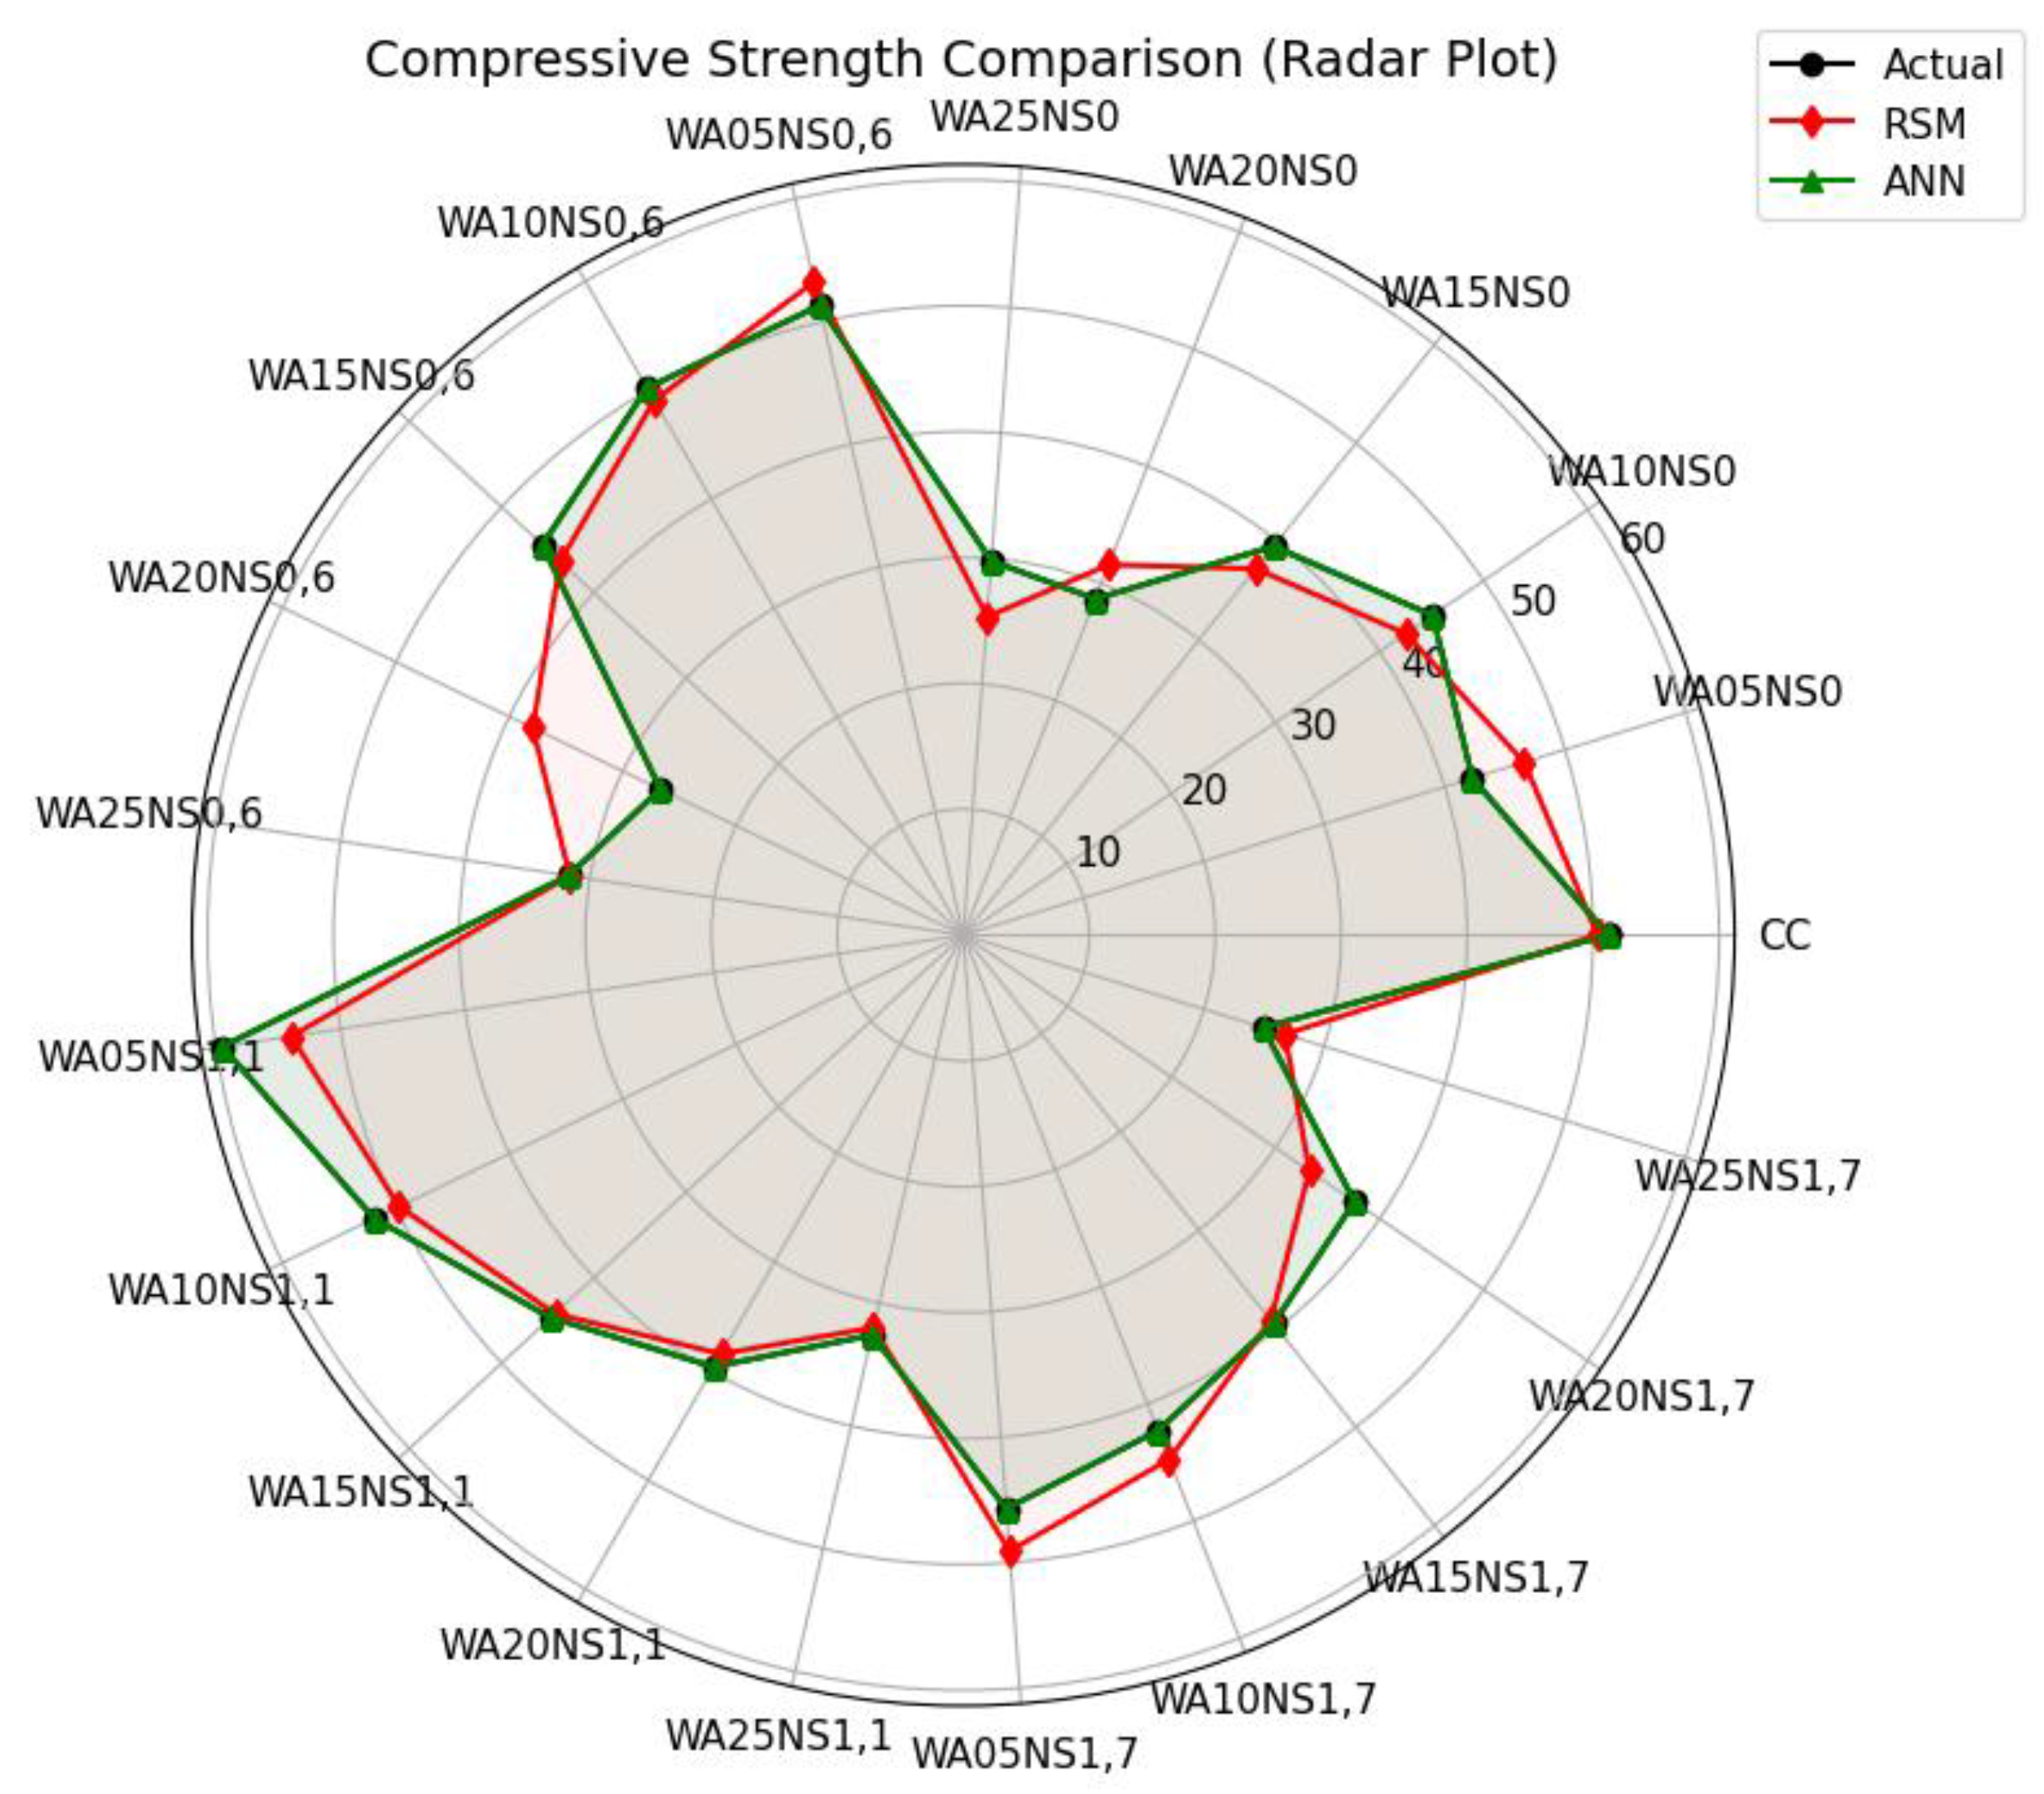
In this section, the influence of WA and NS on the 28-day compressive strength of concrete was investigated using both RSM and ANN. The summary of the design of experiments used for RSM analysis is provided in Table 3. A total of 21 mixes were tested under a user-defined quadratic model structure with randomized run order.
The regression model for compressive strength developed using RSM is expressed in Eq. (2):
where is the wood ash content (g) and is the nanosilica content (g).

Table 4.
Actual and Predicted 28-Day Compressive Strength (MPa).
| Test Specimen | Actual CS (MPa) | Predicted CS (RSM) | ANN Predicted MPa |
| CC | 51.2 | 50.35 | 51.2 |
| WA05NS0 | 42.3 | 46.60 | 42.3 |
| WA10NS0 | 45.1 | 42.52 | 45.1 |
| WA15NS0 | 39.5 | 37.23 | 39.5 |
| WA20NS0 | 28.7 | 31.61 | 28.7 |
| WA25NS0 | 29.8 | 25.36 | 29.8 |
| WA05NS0,6 | 51.3 | 53.23 | 51.3 |
| WA10NS0,6 | 50.2 | 49.06 | 50.2 |
| WA15NS0,6 | 45.6 | 43.66 | 45.6 |
| WA20NS0,6 | 26.7 | 37.94 | 26.7 |
| WA25NS0,6 | 31.7 | 31.59 | 31.7 |
| WA05NS1,1 | 59.5 | 53.96 | 59.5 |
| WA10NS1,1 | 51.9 | 49.71 | 51.9 |
| WA15NS1,1 | 44.7 | 44.23 | 44.7 |
| WA20NS1,1 | 39.6 | 38.42 | 39.6 |
| WA25NS1,1 | 32.6 | 31.99 | 32.6 |
| WA05NS1,7 | 45.7 | 49.08 | 45.7 |
| WA10NS1,7 | 42.3 | 44.74 | 42.3 |
| WA15NS1,7 | 39.5 | 39.15 | 39.5 |
| WA20NS1,7 | 37.6 | 33.25 | 37.6 |
| WA25NS1,7 | 24.9 | 26.72 | 24.9 |
Figure 6.
Radar plot comparing actual and predicted (RSM and ANN) compressive strength values across all mixes.
Figure 6.
Radar plot comparing actual and predicted (RSM and ANN) compressive strength values across all mixes.
The accuracy and significance of the RSM model were evaluated through Analysis of Variance (ANOVA), summarized in Table 5. The p-values indicate that nanosilica (NS) and its squared term significantly influenced compressive strength ( and , respectively) [59]. In contrast, WA and the interaction term were not statistically significant [59]. The RSM model demonstrated a high goodness of fit, with and adjusted .
Figure 7. compares the regression fits of the two models. The ANN model achieved perfect correlation with an , outperforming RSM model. This confirms that the ANN model more accurately captured the nonlinear relationships between the mix parameters and compressive strength. Ray et al. [65] likewise reported that ANN outperformed ANOVA.
The three-dimensional response surface plots shown in Figure 8 further illustrate how compressive strength varies with WA and NS. Both RSM (Figure 8a) and ANN (Figure 8b) models indicate that strength increases with NS up to a critical value beyond which it begins to decline. This trend is attributed to the beneficial pozzolanic effect of nanosilica up to an optimal dosage, beyond which particle agglomeration or excessive matrix refinement may occur [66,67]. Increasing WA, on the other hand, generally led to strength reduction, likely due to dilution of the cementitious matrix and pore structure disruption [68].
Figure 9 and Figure 10 present the optimization of compressive strength using RSM and ANN models, respectively. In the RSM model (Figure 9), the maximum predicted strength of 58.11 MPa was achieved at 0 g WA and 2.12 g NS, with a desirability of 1.00. This confirms that nanosilica significantly enhances strength, while excess wood ash reduces it [35]. The ANN model (Figure 10) predicted higher compressive strength (>60 MPa) under similar conditions. Its response surface shows greater nonlinearity and sharper gradients, highlighting its superior accuracy and sensitivity in capturing complex interactions [65]. Both models identify the same optimal region, but ANN demonstrates better predictive performance for mix design optimization.
Days Flexural Strength Analysis
In this section, the effect of WA and NS on the 28-day flexural strength of concrete was investigated using both RSM and ANN. The same experimental matrix used for compressive strength (Table 3) was adopted for flexural strength analysis, under a user-defined quadratic model with randomized design.
The regression model for flexural strength using RSM is expressed in Eq. (3):
where A is the wood ash content (g) and B is the nanosilica content (g).
The experimental values and corresponding predictions for flexural strength by both RSM and ANN are presented in Table 6. The radar plot comparing actual and predicted values is shown in Figure 11, while the regression plots are provided in Figure 12.
The ANOVA summary for the RSM model is presented in Table 7. Nanosilica and its square term were statistically significant (p = 0.0024 and 0.0049, respectively), while wood ash and its interaction with NS were not. The model achieved a good fit with R2 =0.8621 and adjusted R2=0.8163, suggesting acceptable predictive capability.
The 3D response surface plots in Figure 13 illustrate the effect of WA and NS on flexural strength. Both models confirm that flexural strength increases with NS content up to about 2.3 g and then declines, indicating a saturation point. Increasing WA beyond 10 g negatively affected strength, likely due to its filler role without contributing to bonding or hydration [36].
Figure 14 and Figure 15 show the desirability-based optimization plots. The RSM model (Figure 14) predicts a peak flexural strength of 9.18 MPa at 0 g WA and 2.3 g NS, with a desirability of 1.00. The ANN model (Figure 15) suggests slightly higher optimal strength, exceeding 10 MPa, within a similar input range, demonstrating a sharper optimal region. This supports the higher precision and robustness of the ANN model in capturing complex, nonlinear interactions in flexural strength behaviour [54].
3.3. Compressive Strength Development with Curing Age
The development of compressive strength with curing age for the tested mortar mixtures is presented in Figs 16–18. These results are organized in two complementary ways: grouped by wood ash content (Figure 16) and grouped by nanosilica content (Figure 17). Model predictions from multilinear regression and ANN are shown in Figure 18.
3.3.1. Experimental Insights
Figure 16 illustrates the effect of curing age on compressive strength across six levels of WA content (ranging from 0.0 g to 80.4 g), with four NS contents (0.0 g, 1.4 g, 2.5 g, and 3.8 g) in each subplot. At 0.0 g WA (Figure 16a), strength development is linear and steady across curing ages, with no variation due to NS because only one NS level was tested. At 16.1 g WA (Figure 16b), the addition of NS begins to show significant early-age improvements, with NS = 2.5 g and 3.8 g resulting in notably higher compressive strength by 90 and 180 days.
For 31.1 g WA (Figure 16c), compressive strength continues to benefit from higher
NS content, with NS = 3.8 g yielding the highest strength (~70 MPa) at 180 days. However, as WA increases to 48.2 g and 64.3 g (Figure 16d–e), strength development begins to stagnate or decline at lower NS dosages, emphasizing the need for sufficient NS to offset the reduced reactivity and increased porosity from high ash replacement [32,37,69,70]. The 80.4 g WA mixtures (Figure 16f) show generally reduced strength, although NS = 3.8 g still provides a clear benefit. These results highlight a synergistic relationship between WA and NS, where higher NS levels can partially counterbalance the negative impact of high ash substitution [22,33,71].
To isolate the influence of nanosilica, Figure 17 reorganizes the dataset by NS dosage, showing four subplots for NS = 0.0 g to 3.8 g. Each subplot presents compressive strength evolution over time for six different WA contents. At NS = 0.0 g (Figure 17a), strength gain is gradual but generally lower for higher WA mixtures, confirming the dilutive effect of unmodified ash [23]. With NS = 1.4 g (Figure 17b), strength gain accelerates modestly, but inconsistencies remain at high WA levels. The NS = 2.5 g group (Figure 17c) shows significant improvement in strength consistency and overall gain, especially at 90 and 180 days. Most striking is the NS = 3.8 g set (Figure 17d), where even the high-WA mixtures achieve appreciable long-term strength. This suggests that a high NS content enhances pozzolanic reactions and improves matrix densification, thus mitigating the deleterious effects of increased ash content [67]. Overall, the data show that nanosilica not only improves early strength but sustains strength growth across a wide range of curing ages and ash replacements.
3.3.2. Predictive Modelling and Performance Comparison
The predictive accuracy of the developed models is illustrated in Figure 18. The linear regression model (Figure 18a) shows moderate agreement with experimental data (R² = 0.6964), with significant scatter especially at mid-strength levels. In contrast, the ANN model (Figure 18b), tuned via Optuna, achieves stronger correlation (R² = 0.8438) and better captures the nonlinear relationship between mix proportions and strength development.
The learned linear regression model is expressed as:
where is the compressive strength (MPa), and all inputs are in grams, except curing age which is in days. The equation highlights that curing age and nanosilica content positively influence strength, while higher wood ash content has a marginally negative effect when considered independently [28,29,34]. These results emphasize the limitations of linear models in capturing interaction effects and highlight the effectiveness of machine learning techniques for modelling complex material behaviour [51]. Both models benefit from incorporating curing age as a key predictor, reinforcing the importance of maturity in strength prediction.
3.4. Flexural Strength Development with Curing Age
The development of flexural strength with curing age was comprehensively evaluated using both experimental analysis and predictive modelling through multilinear regression and an optimized ANN. The influence of curing age, WA, and NS on flexural performance is presented in Figure 19, Figure 20 and Figure 21.
3.4.1. Experimental Insights
Figure 19 illustrates the variation in flexural strength with curing age for different WA contents at fixed NS dosages. At 0.0 g NS (Figure 19a), the flexural strength steadily increased with age, peaking around 120 days, especially for WA = 31.1 g and 48.2 g. However, strength declined at WA = 80.4 g, possibly due to dilution effects [72]. As NS was introduced at 1.4 g (Figure 19b) and 2.5 g (Figure 19c), early-age strength improved and remained relatively stable, though higher WA levels began showing diminishing returns. At 3.8 g NS (Figure 19d), strength was highest for mixes with WA between 16.1 g and 31.1 g, confirming an optimal synergy at moderate replacement levels.
Figure 20 complements this by fixing WA levels and varying NS. At 0.0 g WA (Figure 20a), flexural strength peaked at 120 days with no benefit from NS. However, at 16.1 g WA (Figure 20b) and 31.1 g WA (Figure 20c), significant improvement occurred with 2.5 g–3.8 g NS. At 48.2 g WA (Figure 20d), this benefit persisted up to 120 days, while at higher WA levels (Figure 20e,f), flexural strength plateaued and eventually declined, indicating a threshold beyond which further WA replacement impairs mechanical gain.
3.4.2. Predictive Modelling and Performance Comparison
Predictive models were trained to estimate flexural strength based on mix composition and curing age. The multilinear regression model produced the following equation:
Flexural Strength (MPa) = −7.0287 + 0.0321·Cement + 0.0000·Sand + 0.0000·Water + 0.0141·Wood Ash − 0.1684·Nanosilica + 0.0086·Curing Age
This model yielded an R² of 0.5445, suggesting modest predictive accuracy. In contrast, the optimized ANN model, tuned via Optuna [64], significantly outperformed the MLR, achieving an R² of 0.8408. This suggests that the nonlinear interactions among mix parameters were better captured by the ANN architecture [54,65]. Figure 21 presents the parity plots comparing predicted vs. actual values. The linear regression model (Figure 21a) shows larger scatter, especially at higher strengths, while the ANN model (Figure 21b) follows the ideal 1:1 line more closely.
4. Conclusions
This study investigated the optimization of the mechanical properties of concrete incorporating wood ash (WA) and nanosilica (NS) using Response Surface Methodology (RSM) and Artificial Neural Networks (ANN). Both methods were applied to model and predict compressive and flexural strengths at 28 days and across extended curing periods. The following key conclusions can be drawn:
- RSM and ANN were both effective in modelling the compressive and flexural strength of WA-NS blended mortars. However, ANN consistently outperformed RSM, achieving perfect correlation (R² = 1.000) for both strength types, indicating superior capability in capturing complex, nonlinear interactions among mix parameters.
- For 28-day compressive strength, RSM predicted a maximum of 58.11 MPa at 0 g WA and 2.12 g NS, while ANN predicted strengths exceeding 60 MPa under similar conditions. The analysis confirmed that nanosilica significantly enhances strength, while high wood ash content negatively impacts it due to dilution and matrix disruption effects.
- In terms of 28-day flexural strength, RSM predicted a peak of 9.18 MPa at 0 g WA and 2.3 g NS, while ANN exceeded 10 MPa, again validating the enhanced sensitivity of ANN to nonlinearities in the dataset.
- ANOVA results from RSM revealed that NS and its quadratic term were statistically significant (p < 0.01) for both strength types, while WA and interaction terms were not significant, suggesting that nanosilica primarily drives strength improvements.
-
Time-dependent strength development analysis showed that:
- ○
- Compressive and flexural strength improved consistently with curing age, especially for mixes with moderate to high NS content.
- ○
- NS ≥ 2.5 g enhanced long-term strength, particularly in high WA mixtures, by promoting pozzolanic reactions and matrix densification.
- ○
- Strength deteriorated or plateaued beyond 64.3 g of WA, even with high NS, confirming the detrimental effect of excessive ash replacement.
- Multilinear regression (MLR) models performed modestly (R² = 0.6964 for compressive and 0.5445 for flexural strength), while ANN models trained with Optuna demonstrated higher accuracy (R² = 0.8438 and 0.8408, respectively), making ANN a more robust tool for predicting mechanical performance.
- Optimization analysis revealed that NS dosage in the range of 2.0–2.5 g consistently yielded the best mechanical properties across both strength metrics. Wood ash replacement should be kept below 30 g to avoid significant strength loss.
Overall, the combination of experimental validation, statistical modelling, and machine learning demonstrated that nanosilica plays a critical role in enhancing the mechanical characteristics of WA-blended concretes, while artificial neural networks offer superior performance for mix design optimization.
Author Contributions
Conceptualization, A.E., H.W. and A.A.R; methodology, A.E. and H.W.; validation, curation, A.E; wring-original draft preparation, A.E; writing-review and edition, A.E and H.W.; visualization, A.E; supervision, H.W. and A.A.R.; funding acquisition, A.E. All authors have read and agreed to the published version of the manuscript.
Funding
This study was financially supported by South Africa Department of Higher Education and Training as part of Master and Doctorate Support Programme (MDSP).
Data Availability Statement
Data used in this study is part of the author’s postdoctoral research Programme which can be made available upon request
Acknowledgments
The authors wish to thank the University of South Africa for their support and for making this research possible.
Conflicts of Interest
The authors declare no conflicts of interest.
Abbreviations
The following abbreviations are used in this manuscript:
| WA | Wood ash |
| NS | Nanosilica |
| RSM | Response Surface Methodology |
| ANN | Artificial Neural Networks |
| CS | Compressive Strength |
| CC | Control Concrete without WA and NS |
References
- Miller, S.A.; Horvath, A.; and Monteiro, P.J. “Impacts of booming concrete production on water resources worldwide,” Nat. Sustain., vol. 1, no. 1, pp. 69–76, 2018.
- Andrew, R.M. “Global CO2 emissions from cement production,” Earth Syst. Sci. Data, vol. 10, no. 1, pp. 195–217, 2018.
- Scrivener, K.L.; John, V.M.; and Gartner, E.M. “Eco-efficient cements: Potential economically viable solutions for a low-CO2 cement-based materials industry,” Cem. Concr. Res., vol. 114, pp. 2–26, 2018.
- Mehta, P.K.; and Monteiro, P.J. Concrete: microstructure, properties, and materials. McGraw-Hill Education, 2014.
- Benhelal,E.; Zahedi, G.; Shamsaei, E.; and Bahadori, A. “Global strategies and potentials to curb CO2 emissions in cement industry,” J. Clean. Prod., vol. 51, pp. 142–161, 2013.
- Juenger, M.C.; Winnefeld, F.; Provis, J.L.; and Ideker, J.H. “Advances in alternative cementitious binders,” Cem. Concr. Res., vol. 41, no. 12, pp. 1232–1243, 2011.
- Li, H.; Xiao, H.G.; Yuan, J.; and Ou, J. “Microstructure of cement mortar with nano-particles,” Compos. Part B Eng., vol. 35, no. 2, pp. 185–189, 2004.
- Björnström, J.; Martinelli, A.; Matic, A.; Börjesson, L.; and Panas, I. “Accelerating effects of colloidal nano-silica for beneficial calcium–silicate–hydrate formation in cement,” Chem. Phys. Lett., vol. 392, no. 1–3, pp. 242–248, 2004.
- Vassilev, S.V.; Baxter, D.; Andersen, L.K.; Vassileva, C.G.; and Morgan, T.J. “An overview of the organic and inorganic phase composition of biomass,” Fuel, vol. 94, pp. 1–33, 2012.
- Rajamma, R.; Ball, R.J.; Tarelho, L.A.; Allen,G.C.; Labrincha, J.A.; and Ferreira, V.M. “Characterisation and use of biomass fly ash in cement-based materials,” J. Hazard. Mater., vol. 172, no. 2–3, pp. 1049–1060, 2009.
- Senff, L.; Hotza, D.; Repette, W.L.; Ferreira, V.M.; and Labrincha, J.A. “Mortars with nano-SiO2 and micro-SiO2 investigated by experimental design,” Constr. Build. Mater., vol. 24, no. 8, pp. 1432–1437, 2010.
- Cheah C.B.; and Ramli, M. “The implementation of wood waste ash as a partial cement replacement material in the production of structural grade concrete and mortar: An overview,” Resour. Conserv. Recycl., vol. 55, no. 7, pp. 669–685, 2011.
- Khademi, F.; Akbari, M.; Jamal,S.M.; and Nikoo, M. “Multiple linear regression, artificial neural network, and fuzzy logic prediction of 28 days compressive strength of concrete,” Front. Struct. Civ. Eng., vol. 11, no. 1, pp. 90–99, 2017.
- Golafshani, E.M.; Behnood, A.; and Arashpour, M. “Predicting the compressive strength of normal and High-Performance Concretes using ANN and ANFIS hybridized with Grey Wolf Optimizer,” Constr. Build. Mater., vol. 232, p. 117266, 2020.
- Ahmad, A.; Chaiyasarn, K.; Farooq, F.; Ahmad, W.; Suparp, S.; and Aslam, F. “Compressive strength prediction via gene expression programming (GEP) and artificial neural network (ANN) for concrete containing RCA,” Buildings, vol. 11, no. 7, p. 324, 2021.
- Nguyen, K.T.; Nguyen, Q.D.; Le,T.A.; Shin, J.; and Lee, K. “Analyzing the compressive strength of green fly ash based geopolymer concrete using experiment and machine learning approaches, “Constr. Build. Mater., vol. 247, p. 118581, 2020.
- Asteris, P.G.; Skentou, A.D.; Bardhan,A.; Samui, P.; and Pilakoutas, K. “Predicting concrete compressive strength using hybrid ensembling of surrogate machine learning models,” Cem. Concr. Res., vol. 145, p. 106449, 2021.
- Elinwa, A.U. and Mahmood, Y.A. “Ash from timber waste as cement replacement material,” Cem. Concr. Compos., vol. 24, no. 2, pp. 219–222, 2002.
- Cheah, C.B.; and Ramli, M. “The fluid transport properties of HCWA-DSF hybrid supplementary binder concrete,” Compos. Part B Eng., vol. 43, no. 4, pp. 1535–1543, 2012.
- Udoeyo, F.F.; Inyang, H.; Young, D.T.; and Oparadu, E.E. “Potential of wood waste ash as an additive in concrete,” J. Mater. Civ. Eng., vol. 18, no. 4, pp. 605–611, 2006.
- Ban, C.C.; and Ramli, M. “The implementation of wood waste ash as a partial cement replacement material in the production of structural grade concrete and mortar: An overview,” Resour. Conserv. Recycl., vol. 55, no. 7, pp. 669–685, 2011.
- Malaiškienė, J.; and Vaičienė, M. “The Influence of Silica Fly Ash and Wood Bottom Ash on Cement Hydration and Durability of Concrete,” Materials, vol. 17, no. 16. 2024. [CrossRef]
- Sigvardsen, N.M.. “Utilisation of Wood Ash in Cement-Based Materials,” 2020.
- Naik, T.R.; Kraus, R.N.; and Siddique, R. “Controlled low-strength materials containing mixtures of coal ash and a new pozzolanic material,” ACI Mater. J., vol. 100, no. 3, pp. 208–215, 2003.
- Abdullahi, M. “Characteristics of wood ash/OPC concrete,” Leonardo Electron. J. Pract. Technol., vol. 8, pp. 9–16, 2006.
- Jo, B.W.; Kim, C.H.; Tae, G.H.; and Park, J.B. “Characteristics of cement mortar with nano-SiO2 particles,” Constr. Build. Mater., vol. 21, no. 6, pp. 1351–1355, 2007.
- Qing, Y.; Zenan, Z.; Deyu, K.; and Rongshen, C. “Influence of nano-SiO2 addition on properties of hardened cement paste as compared with silica fume,” Constr. Build. Mater., vol. 21, no. 3, pp. 539–545, 2007.
- Abhilash, P.P.; Nayak, D.K.; Sangoju, B.; Kumar, R.; and Kumar, V. “Effect of nano-silica in concrete; a review,” Construction and Building Materials, vol. 278. 2021. [CrossRef]
- Khan, K.; Ahmad, W.; Amin, M.N.; and Nazar, S. “Nano-Silica-Modified Concrete: A Bibliographic Analysis and Comprehensive Review of Material Properties,” Nanomaterials, vol. 12, no. 12. 2022. [CrossRef]
- Ltifi, M.; Guefrech, A.; Mounanga, P.; Khelidj, A.; and Babaaissa, B. “Experimental study of the effect of addition of nano-silica on the behaviour of cement mortars,” Procedia Eng., vol. 10, pp. 900–905, 2011.
- Senff, L.; Labrincha, J.A.; Ferreira, V.M.; Hotza, D.; and Repette,W.L. “Effect of nano-silica on rheology and fresh properties of cement pastes and mortars,” Constr. Build. Mater., vol. 23, no. 7, pp. 2487–2491, 2009.
- Alqamish, H.H.; and Al-Tamimi, A.K. “Development and Evaluation of Nano-Silica Sustainable Concrete,” Applied Sciences, vol. 11, no. 7. 2021. [CrossRef]
- Golewski, G.L “Combined Effect of Coal Fly Ash (CFA) and Nanosilica (nS) on the Strength Parameters and Microstructural Properties of Eco-Friendly Concrete,” Energies, vol. 16, no. 1. 2023. [CrossRef]
- Tabish, M.; Zaheer, M.M.; Baqi, A. “Effect of nano-silica on mechanical, microstructural and durability properties of cement-based materials: A review,” Journal of Building Engineering, vol. 65. 2023. [CrossRef]
- Akinwale, A.; Walied, H.; and Raheem, A.A. “The Combined effect of wood ash and nanosilica on the mechanical properties of blended mortar,” Results Eng., vol. 27, p. 105969, 2025. [CrossRef]
- Samuvel Raj, R.; Arulraj, G.P.; Anand, N.; Kanagaraj, B.; and Lubloy, E. “Nano-bentonite as a sustainable enhancer for alkali activated nano concrete: Assessing mechanical, microstructural, and sustainable properties,” Case Stud. Constr. Mater., vol. 20, p. e03213, 2024. [CrossRef]
- Praveen Kumar, V.V.; and Dey, S. “Study on strength and durability characteristics of nano-silica based blended concrete,” Hybrid Adv., vol. 2, p. 100011, 2023. [CrossRef]
- Anderson, M.J.; and Whitcomb, P.J. RSM simplified: optimizing processes using response surface methods for design of experiments. CRC Press, 2016.
- Montgomery, D.C. Design and analysis of experiments. John Wiley & Sons, 2017.
- Box,G.E.; and Wilson, K.B. “On the experimental attainment of optimum conditions,” J. R. Stat. Soc. Ser. B, vol. 13, no. 1, pp. 1–45, 1951.
- Khuri, A.I.; and Mukhopadhyay, S. “Response surface methodology,” Wiley Interdiscip. Rev. Comput. Stat., vol. 2, no. 2, pp. 128–149, 2010.
- Myers, R.H.; Montgomery, D.C.; and Anderson-Cook, C.M. Response surface methodology: process and product optimization using designed experiments. John Wiley & Sons, 2016.
- Chou, J.S.; Chiu, C.K.; Farfoura, M.; and Al-Taharwa, I. “Optimizing the prediction accuracy of concrete compressive strength based on a comparison of data-mining techniques,” J. Comput. Civ. Eng., vol. 25, no. 3, pp. 242–253, 2011.
- Asteris, P.G.; and Mokos, V.G. “Concrete compressive strength using artificial neural networks,” Neural Comput. Appl., vol. 32, no. 15, pp. 11807–11826, 2020.
- Ma, W.; Wang, Y.; Huang, L.; Yan, L.; and Kasal, B. “Optimisation and prediction of compressive properties for concrete containing recycled aggregates and rice husk ash using response surface methodology (RSM),” ce/papers, vol. 7, no. 3–4, pp. 1234–1241, 2023.
- Gowda, C.C.; Raju, B.C.K.; and Bhojaraj, B.E “Response Surface Models for Optimal Concrete Designs,” in Sustainable Construction and Building Materials, Springer, 2022, pp. 67–78.
- Behnood, A.; and Golafshani, E.M. “Predicting the compressive strength of silica fume concrete using hybrid artificial neural network with multi-objective grey wolves,” J. Clean. Prod., vol. 202, pp. 54–64, 2018. [CrossRef]
- Duan, Z.H.; Kou, S.C.; and Poon, C.S. “Prediction of compressive strength of recycled aggregate concrete using artificial neural networks,” Constr. Build. Mater., vol. 40, pp. 1200–1206, 2013.
- Hagan, M.T.; Demuth, H.B.; Beale, M.H.; and De Jesús, O. Neural network design. Martin Hagan, 2014.
- Haykin, S. Neural networks and learning machines. Pearson Education, 2009.
- Sorour, S.S.; Saleh, C.A.; and Shazly, M. “A review on machine learning implementation for predicting and optimizing the mechanical behaviour of laminated fiber-reinforced polymer composites,” Heliyon, vol. 10, no. 13, p. e33681, 2024. [CrossRef]
- Forsdyke, J.C.; Zviazhynski, B.; Lees, J.M.; and Conduit, G. “Probabilistic selection and design of concrete using machine learning,” Data-Centric Eng., vol. 4, p. e12, 2023.
- Jagadesh, P. et al. “Artificial neural network, machine learning modelling of compressive strength of recycled coarse aggregate based self-compacting concrete,” PLoS One, vol. 19, no. 5, p. e0303101, 2024.
- Lu, K.; Chen, X.; Zhang, J.; Chen, J.; Liu, Z.; and Chen, L. “Comparison of artificial neural network and response surface methodology prediction in key performance of two-component grout material in shield tunneling,” Case Stud. Constr. Mater., vol. 23, p. e05020, 2025. [CrossRef]
- Shaqadan, A.A.; Alshalout, I.; Abojaradeh, M.; Al-Kasasbeh, R.T.; and Al-Khatib, A. “Developing Artificial Neural Networks Model for Concrete Mix Design BT - 2022 5th International Conference on Electronics, Information, and Communication Engineering,” 2022, p. 50473.
- Rao, G.M.; Sandhya, M.M.; Rajeshwari, B.R.; and Oggu, P. “Artificial Neural Networks, A Tool for Predicting Compressive strength of Recycled Aggregate Concrete,” IOP Conf. Ser. Earth Environ. Sci., vol. 1130, no. 1, p. 12016, 2023.
- Mandal, S.; Shiuly, A.; Sau, D.; Mondal, A.K.; and Sarkar, K. “Study on the use of different machine learning techniques for prediction of concrete properties from their mixture proportions with their deterministic and robust optimisation,” AI Civ. Eng., vol. 3, no. 1, pp. 1–24, 2024.
- Korondi, P.Z.; Marchi, M.; and Poloni, C. “Response surface methodology,” in Optimization Under Uncertainty with Applications to Aerospace Engineering, 2021, pp. 387–409. [CrossRef]
- Ustaoglu, A.; Kursuncu, B.; Alptekin, M.; and Gok, M.S. “Performance optimization and parametric evaluation of the cascade vapor compression refrigeration cycle using Taguchi and ANOVA methods,” Appl. Therm. Eng., vol. 180, 2020. [CrossRef]
- Vanneschi, L.; and Silva, S. “Artificial Neural Networks,” in Natural Computing Series, 2023, pp. 161–204. [CrossRef]
- Abdolrasol, M.G.M. et al. “Artificial neural networks based optimization techniques: A review,” Electronics (Switzerland), vol. 10, no. 21. 2021. [CrossRef]
- Topçu, I.B.; and Saridemir, M. “Prediction of mechanical properties of recycled aggregate concretes containing silica fume using artificial neural networks and fuzzy logic,” Comput. Mater. Sci., vol. 42, no. 1, pp. 74–82, 2008. [CrossRef]
- Pedregosa, F. et al. “Scikit-learn: Machine learning in Python,” J. Mach. Learn. Res., vol. 12, pp. 2825–2830, 2011.
- Akiba, T.; Sano, S.; Yanase, T.; Ohta, T.; and Koyama, M. “Optuna: A Next-generation Hyperparameter Optimization Framework,” in Proceedings of the ACM SIGKDD International Conference on Knowledge Discovery and Data Mining, 2019, pp. 2623–2631. [CrossRef]
- Ray, S.; Haque, M.; Ahmed, T.; and Nahin, T.T. “Comparison of artificial neural network (ANN) and response surface methodology (RSM) in predicting the compressive and splitting tensile strength of concrete prepared with glass waste and tin (Sn) can fiber,” J. King Saud Univ. - Eng. Sci., vol. 35, no. 3, pp. 185–199, 2023. [CrossRef]
- Sikora, P. et al. “The effects of nanosilica on the fresh and hardened properties of 3D printable mortars,” Constr. Build. Mater., vol. 281, 2021. [CrossRef]
- Regalla, S.S.; and Senthil, K. N, “The enhancing role of nanomaterials in revolutionizing ultra-high-performance concrete (UHPC): A journey from atomic precision to structural prominence,” Case Stud. Constr. Mater., vol. 22, p. e04608, 2025. [CrossRef]
- De Michele, R. et al. “Wood ash-based materials with improved post-fire resistance for building and infrastructure applications,” Resour. Conserv. Recycl., vol. 222, p. 108475, 2025. [CrossRef]
- Gayathiri, K. and Praveenkumar, S. “Influence of Nano Silica on Fresh and Hardened Properties of Cement-based Materials – A Review,” Silicon, vol. 14, no. 14, pp. 8327–8357, 2022. [CrossRef]
- Zhao, L. et al. “Mechanical properties of hybrid fibers and nano-silica reinforced concrete during exposure to elevated temperatures,” Case Stud. Constr. Mater., vol. 21, p. e04042, 2024. [CrossRef]
- Ehsani, A.; Nili, M. and Shaabani, K. “Effect of nanosilica on the compressive strength development and water absorption properties of cement paste and concrete containing Fly Ash,” KSCE J. Civ. Eng., vol. 21, no. 5, pp. 1854–1865, 2017. [CrossRef]
- Joshua, O.; Tunji-Olayeni, P.; Kolapo, O. Akingunola, O.A. Ede, A.; and Adewale, B. “Investigating for pozzolanic activity in the blend of ground glass waste with cement for sustainable concrete,” Int. J. Mech. Eng. Technol., vol. 9, pp. 808–816, Jun. 2018.
Figure 5.
Schematic representation of an artificial neuron used in ANN modeling of strength in WA-NS blended mortars.
Figure 5.
Schematic representation of an artificial neuron used in ANN modeling of strength in WA-NS blended mortars.
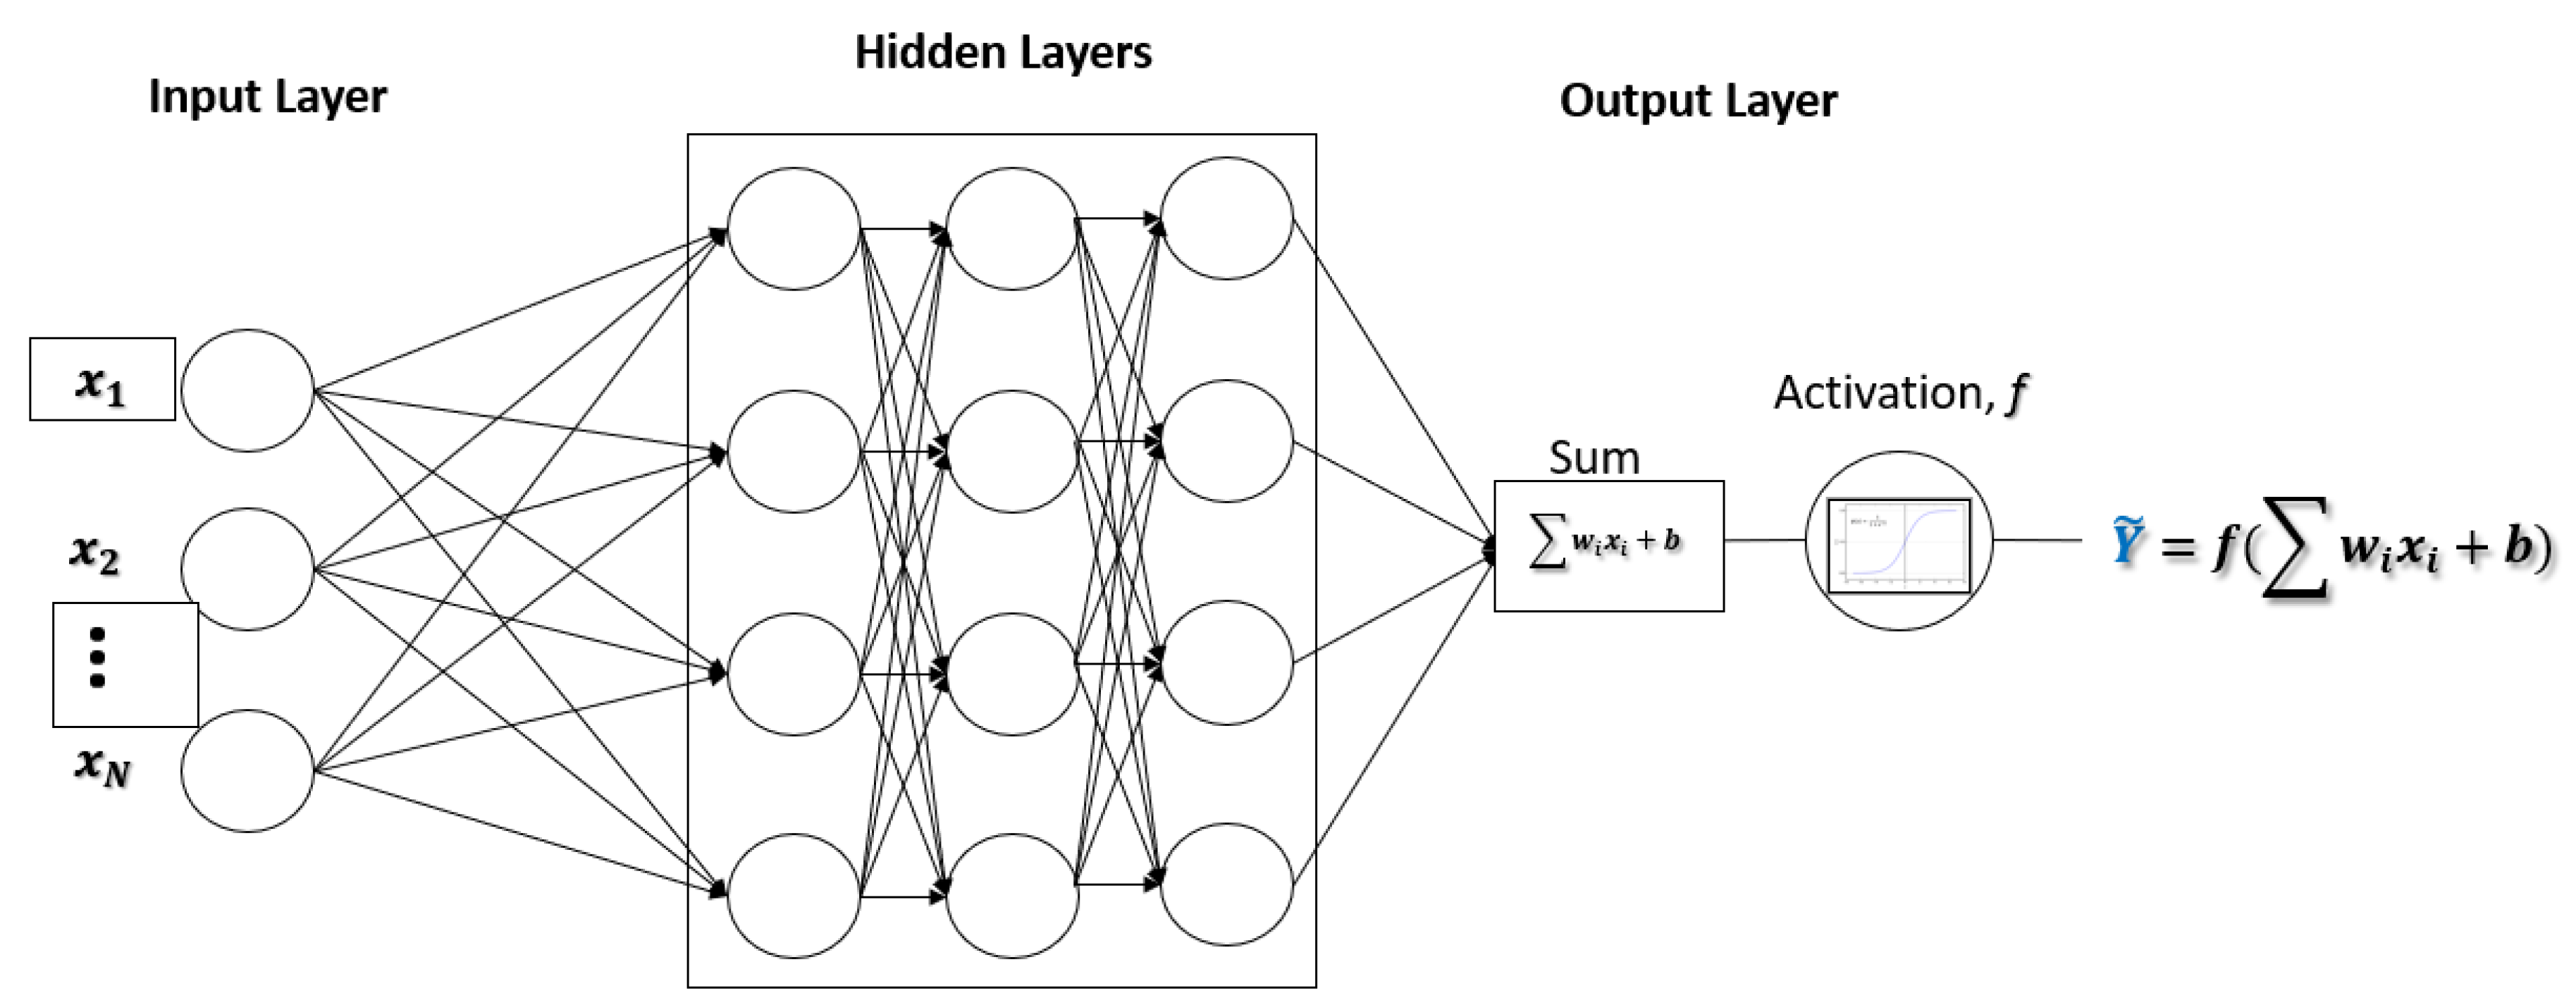
Figure 7.
Predicted vs. Actual Compressive Strength: (a) RSM Model (R² = 0.8447); ANN Model (R² = 1.000).
Figure 7.
Predicted vs. Actual Compressive Strength: (a) RSM Model (R² = 0.8447); ANN Model (R² = 1.000).
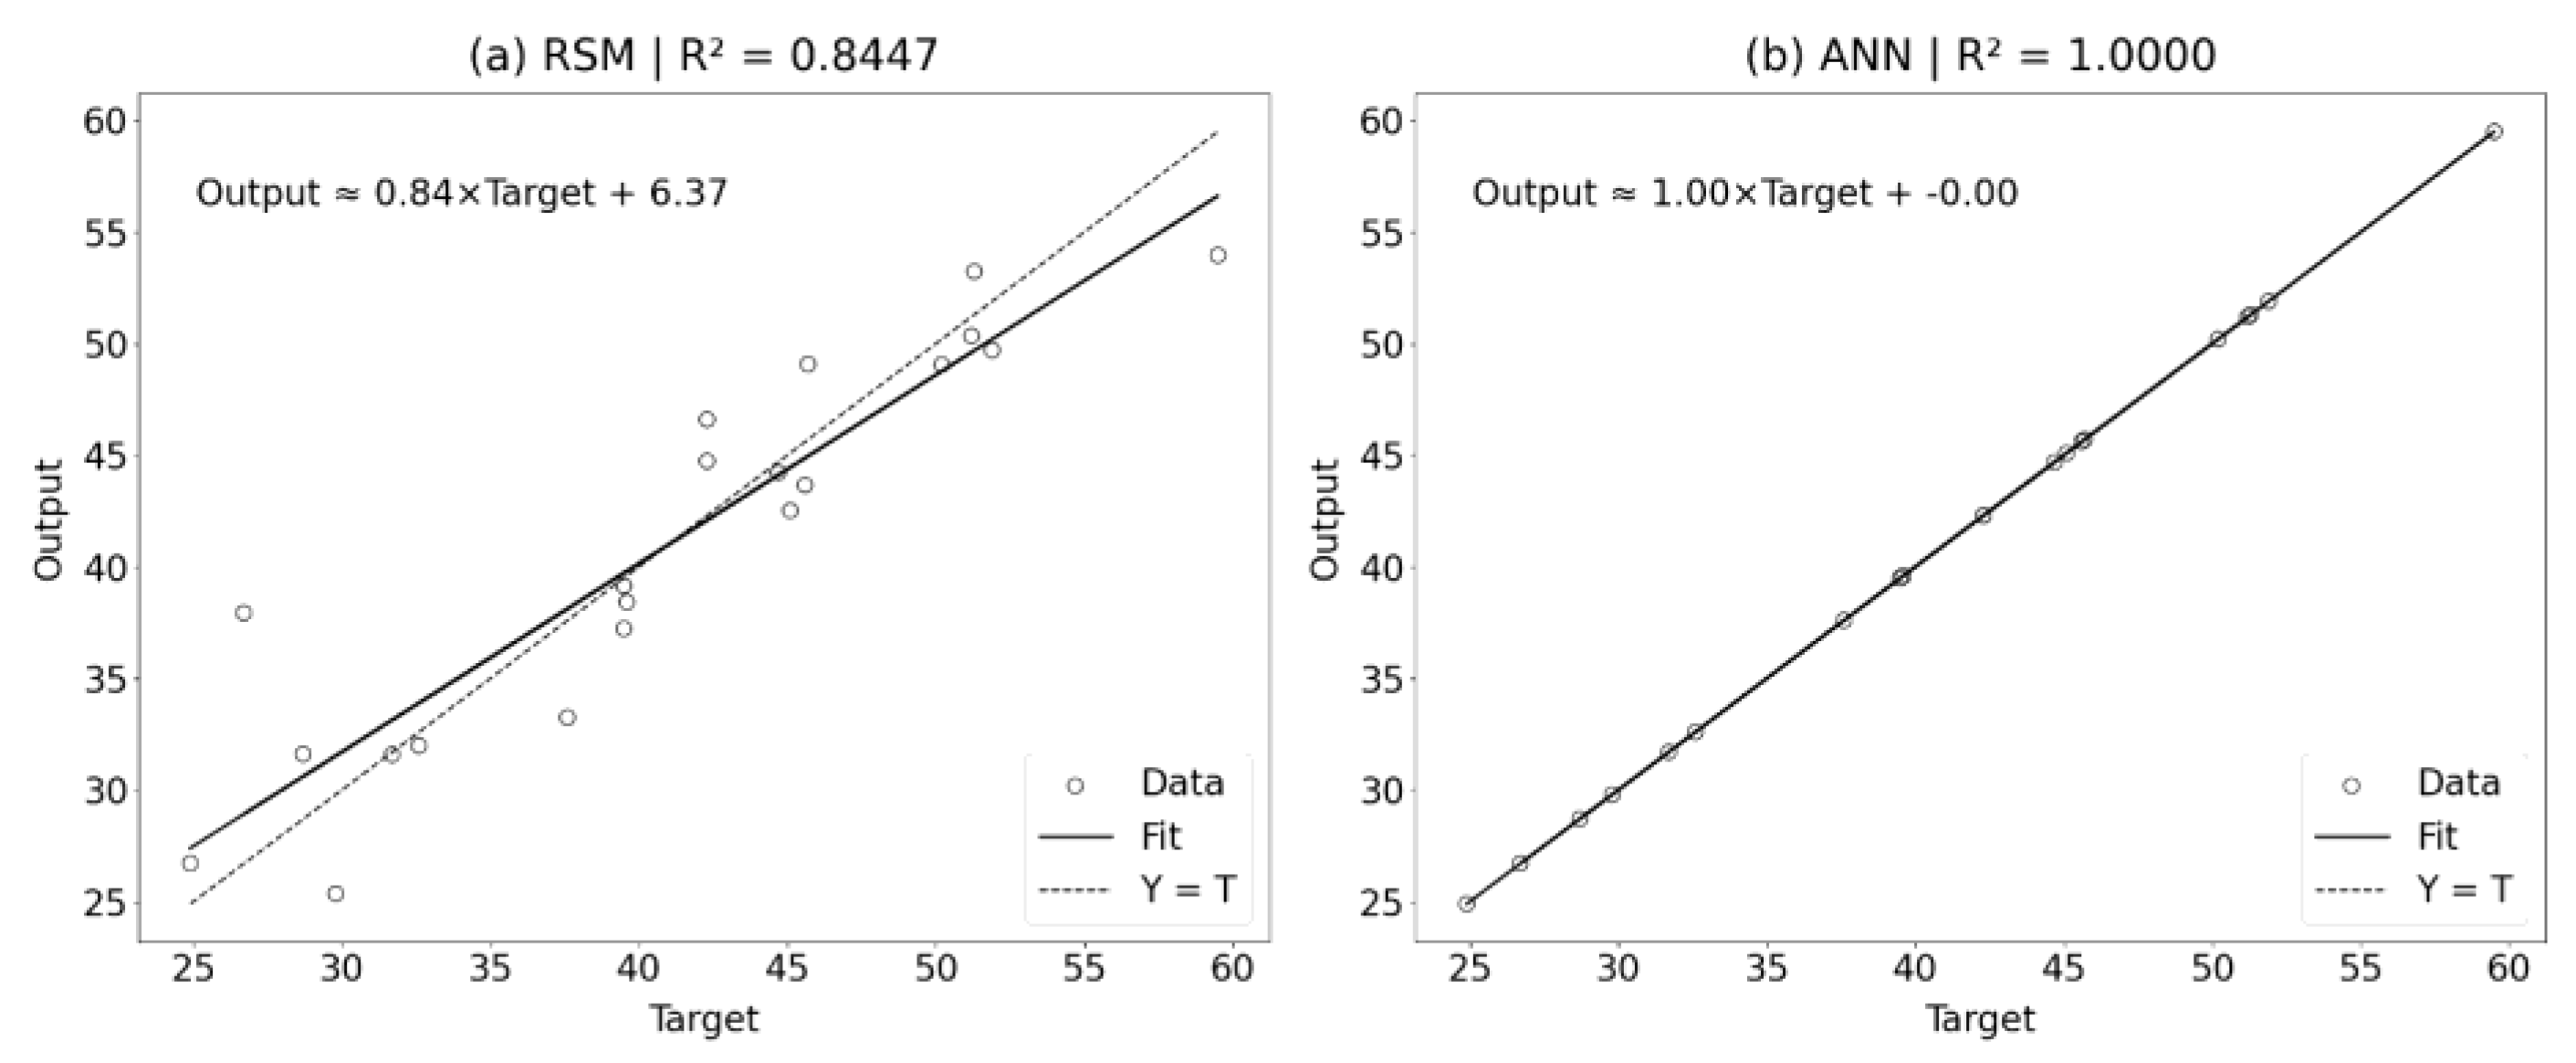
Figure 8.
3D Surface Plot of Compressive Strength: (a) RSM Model; (b) ANN Model.
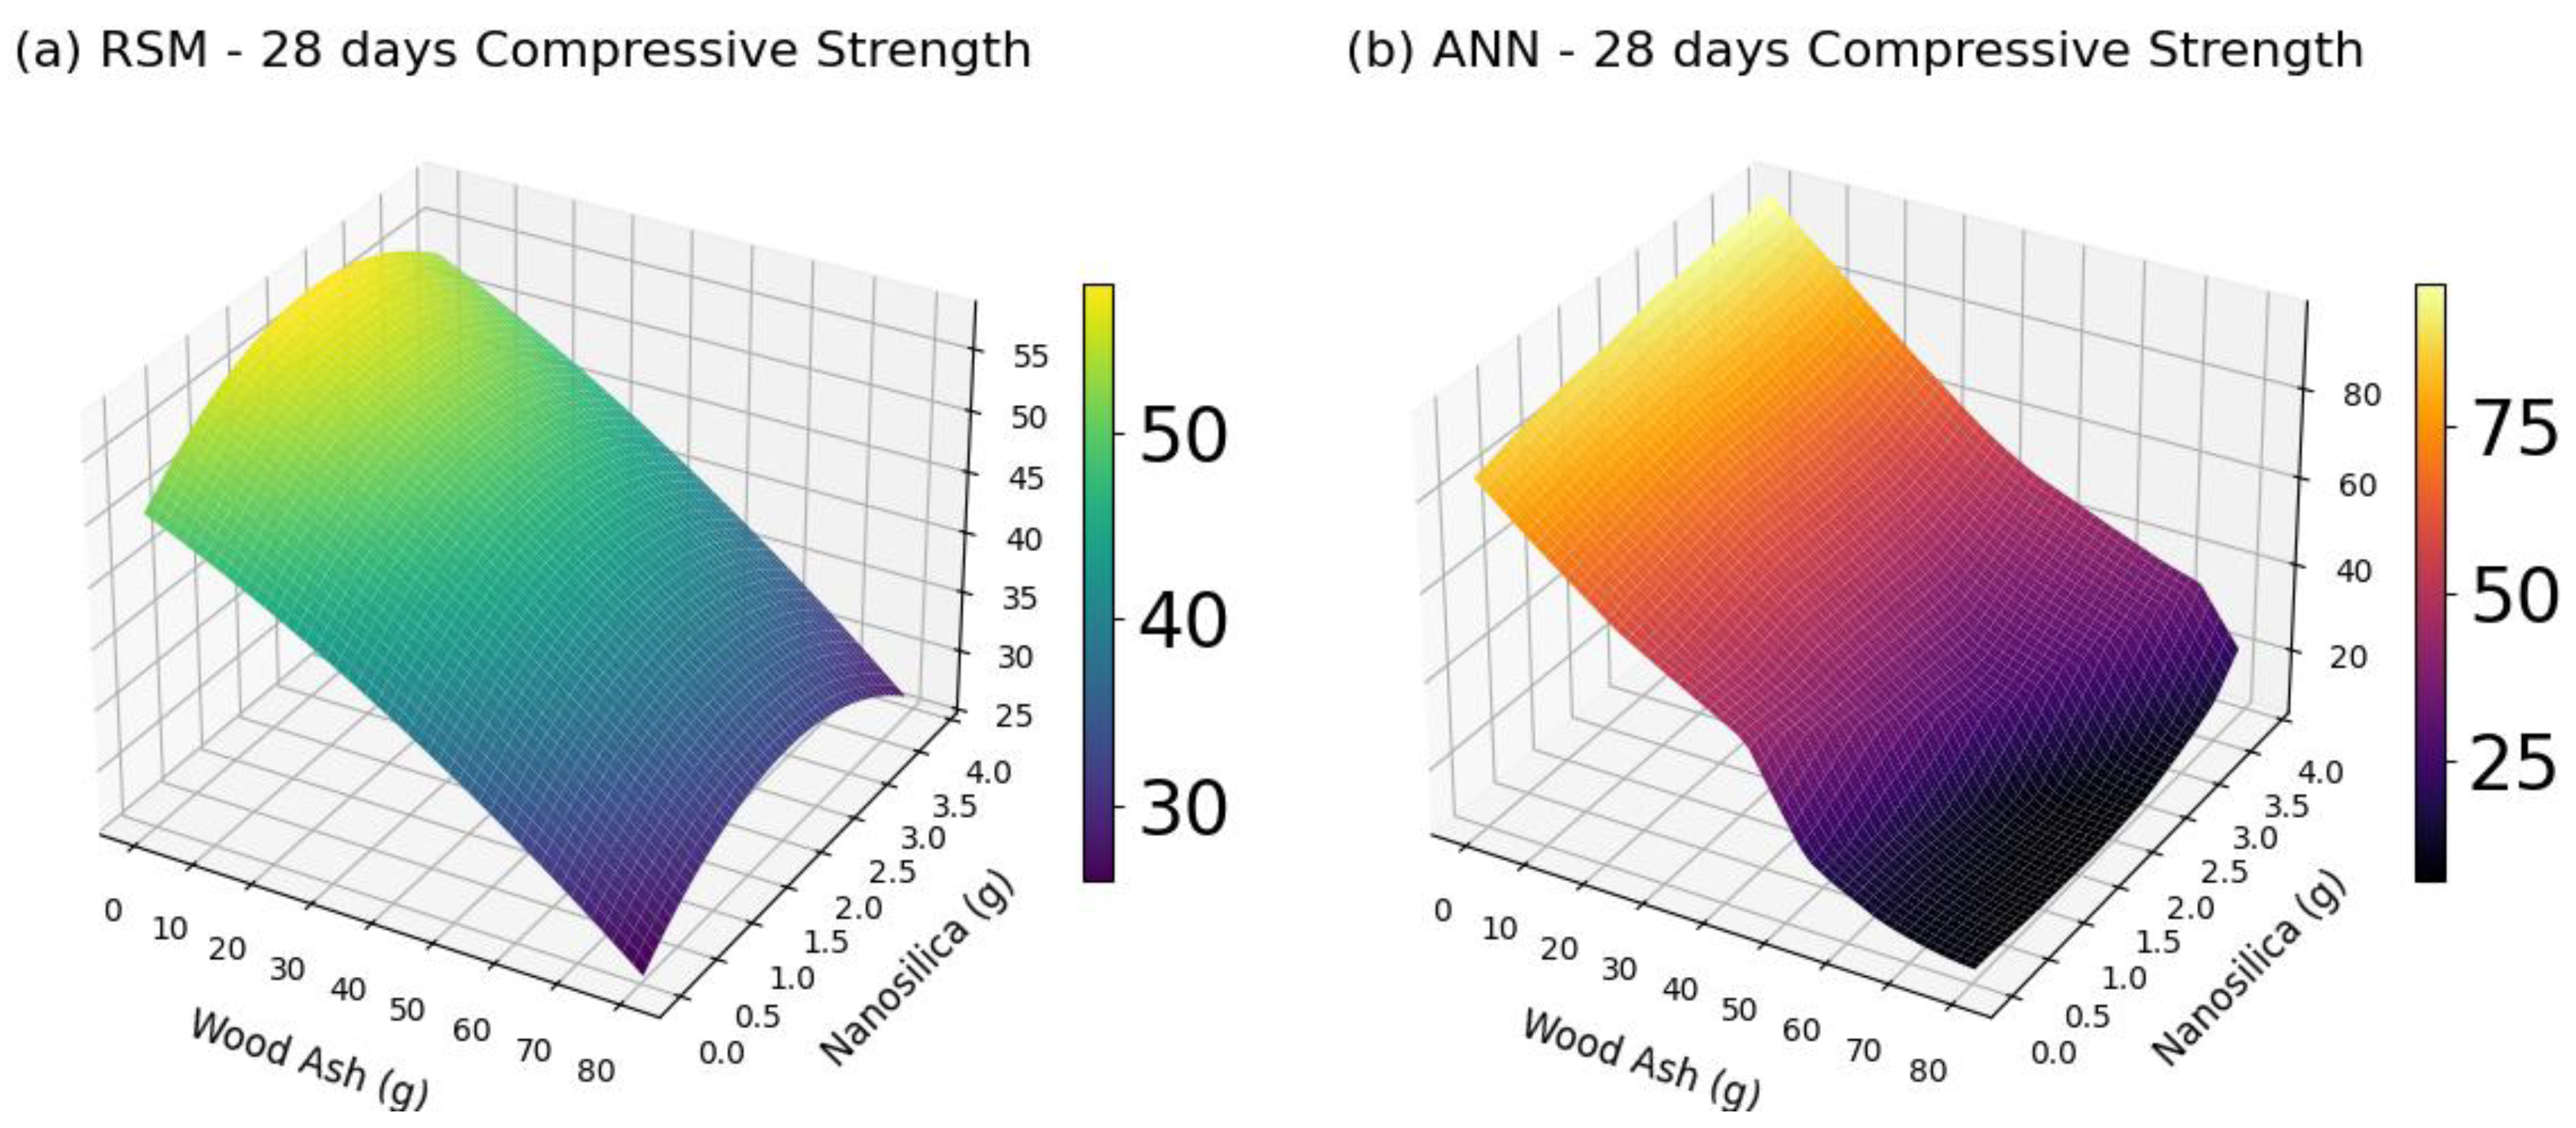
Figure 9.
Optimization Plots for Compressive Strength using the RSM method: (a) Desirability, (b) Compressive Strength Surface.
Figure 9.
Optimization Plots for Compressive Strength using the RSM method: (a) Desirability, (b) Compressive Strength Surface.
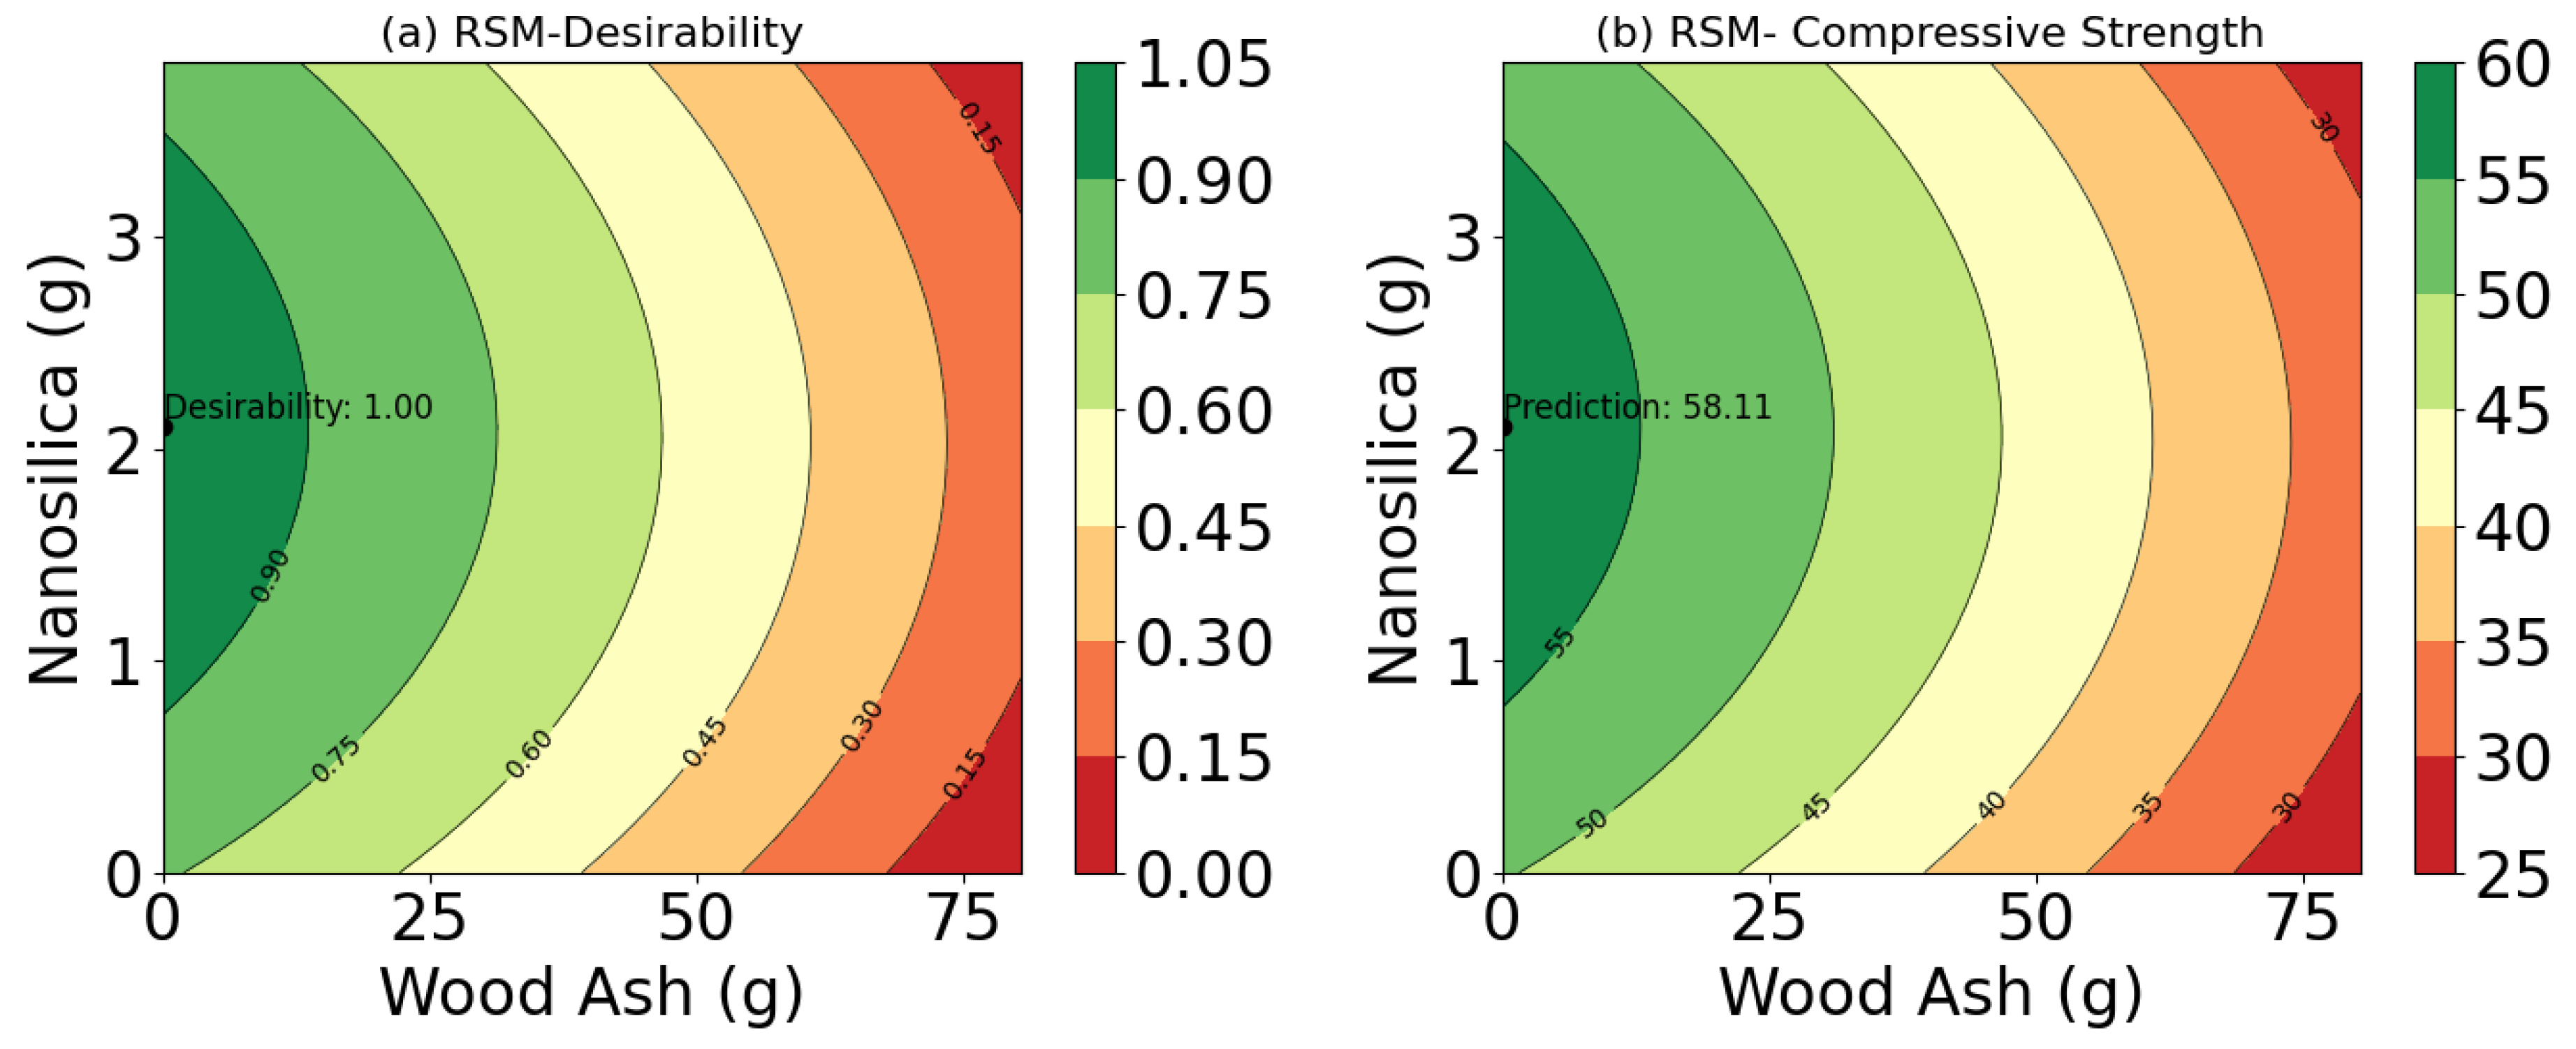
Figure 10.
Optimization Plots for Compressive Strength using the RSM method: (a) Desirability, Compressive Strength Surface.
Figure 10.
Optimization Plots for Compressive Strength using the RSM method: (a) Desirability, Compressive Strength Surface.
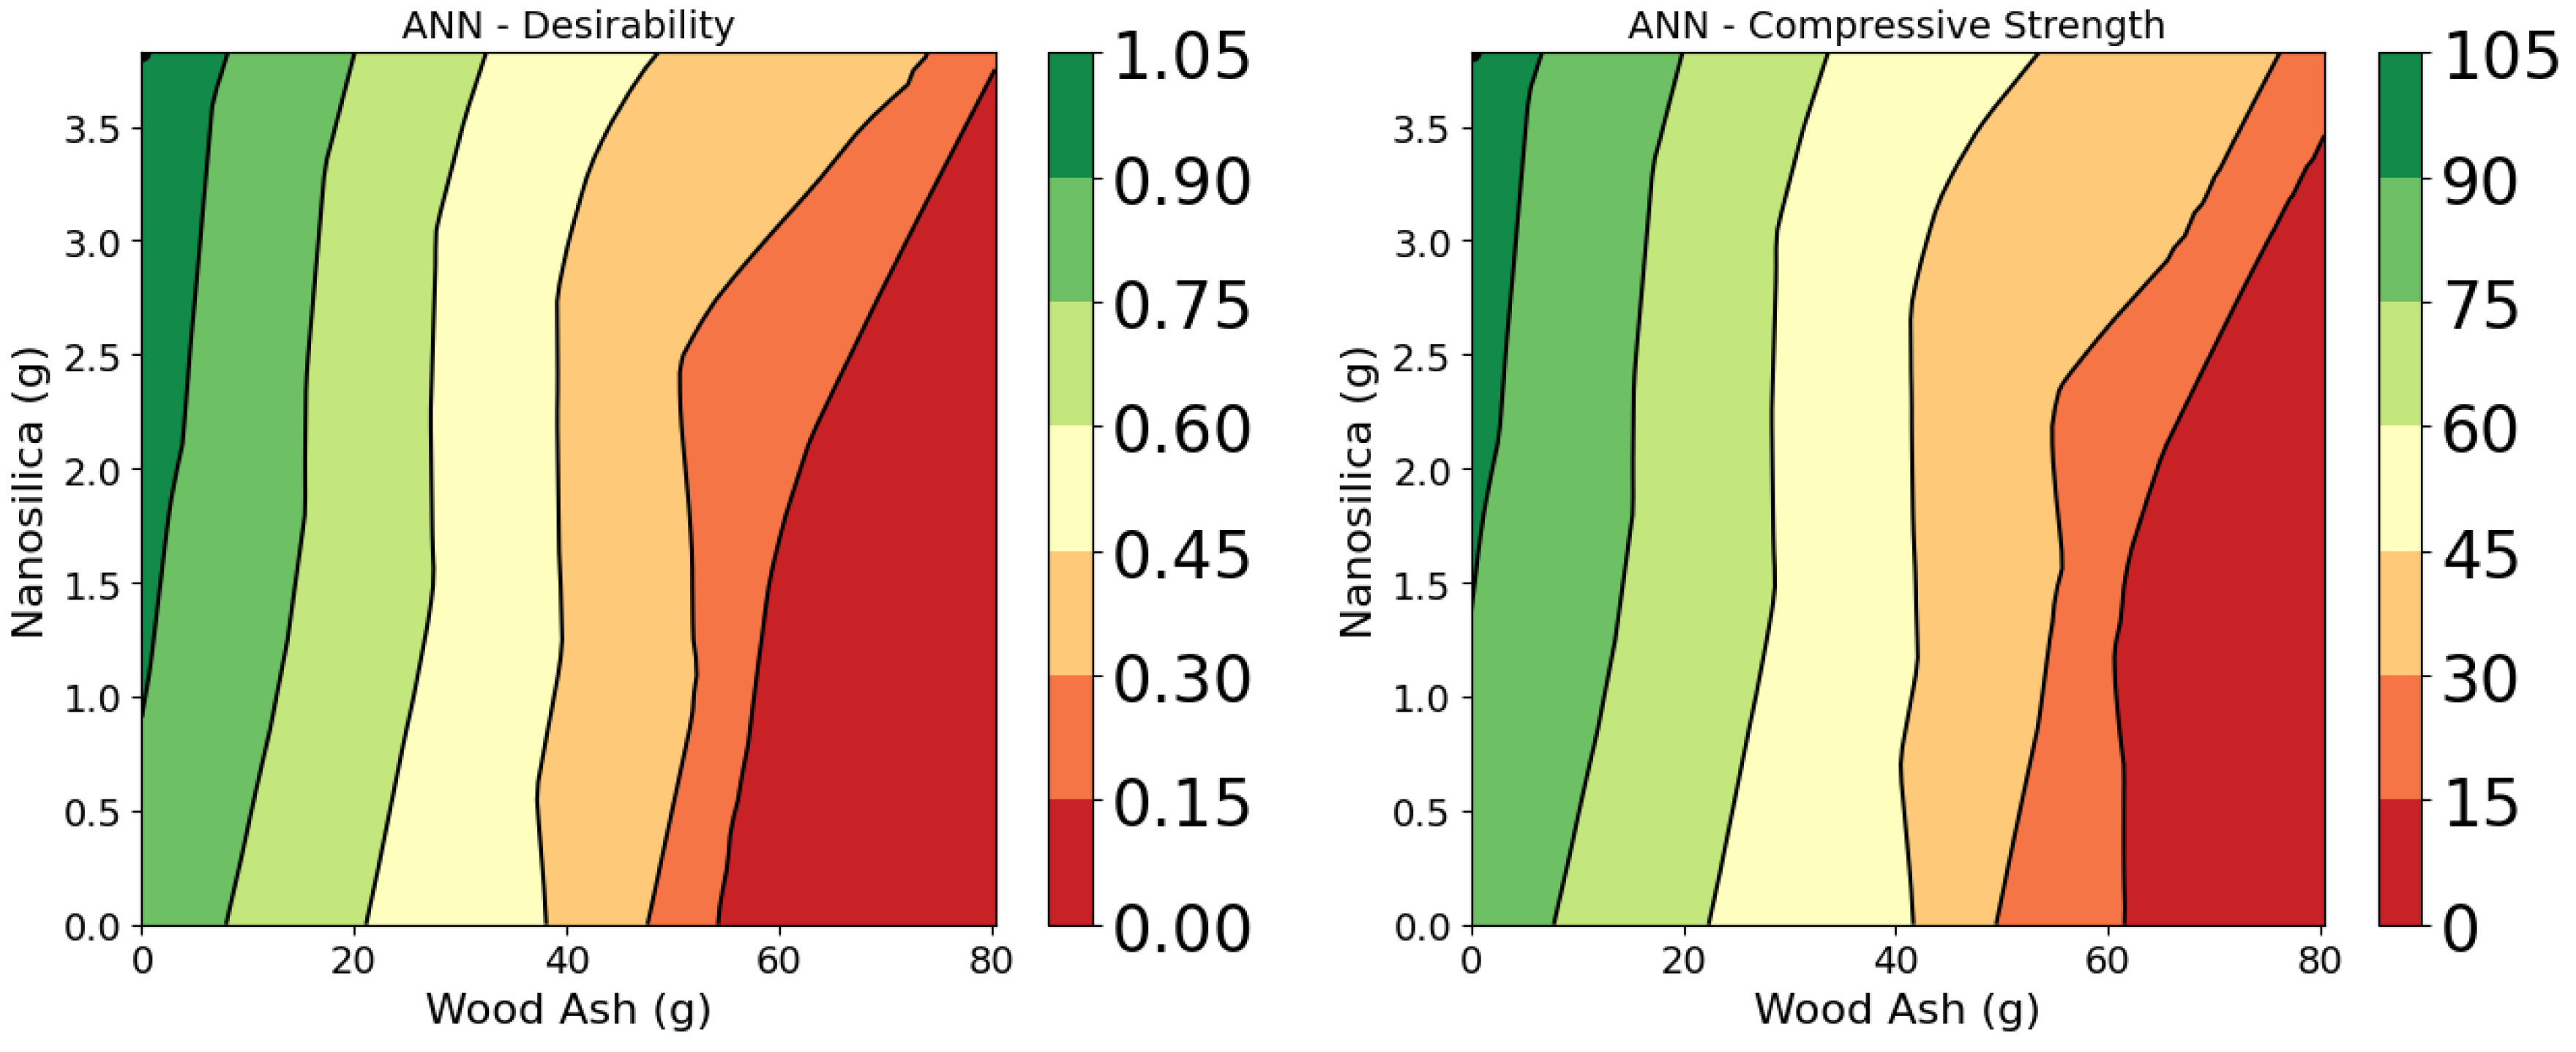
Figure 11.
Radar plot comparing actual and predicted (RSM and ANN) flexural strength values across all mixes.
Figure 11.
Radar plot comparing actual and predicted (RSM and ANN) flexural strength values across all mixes.
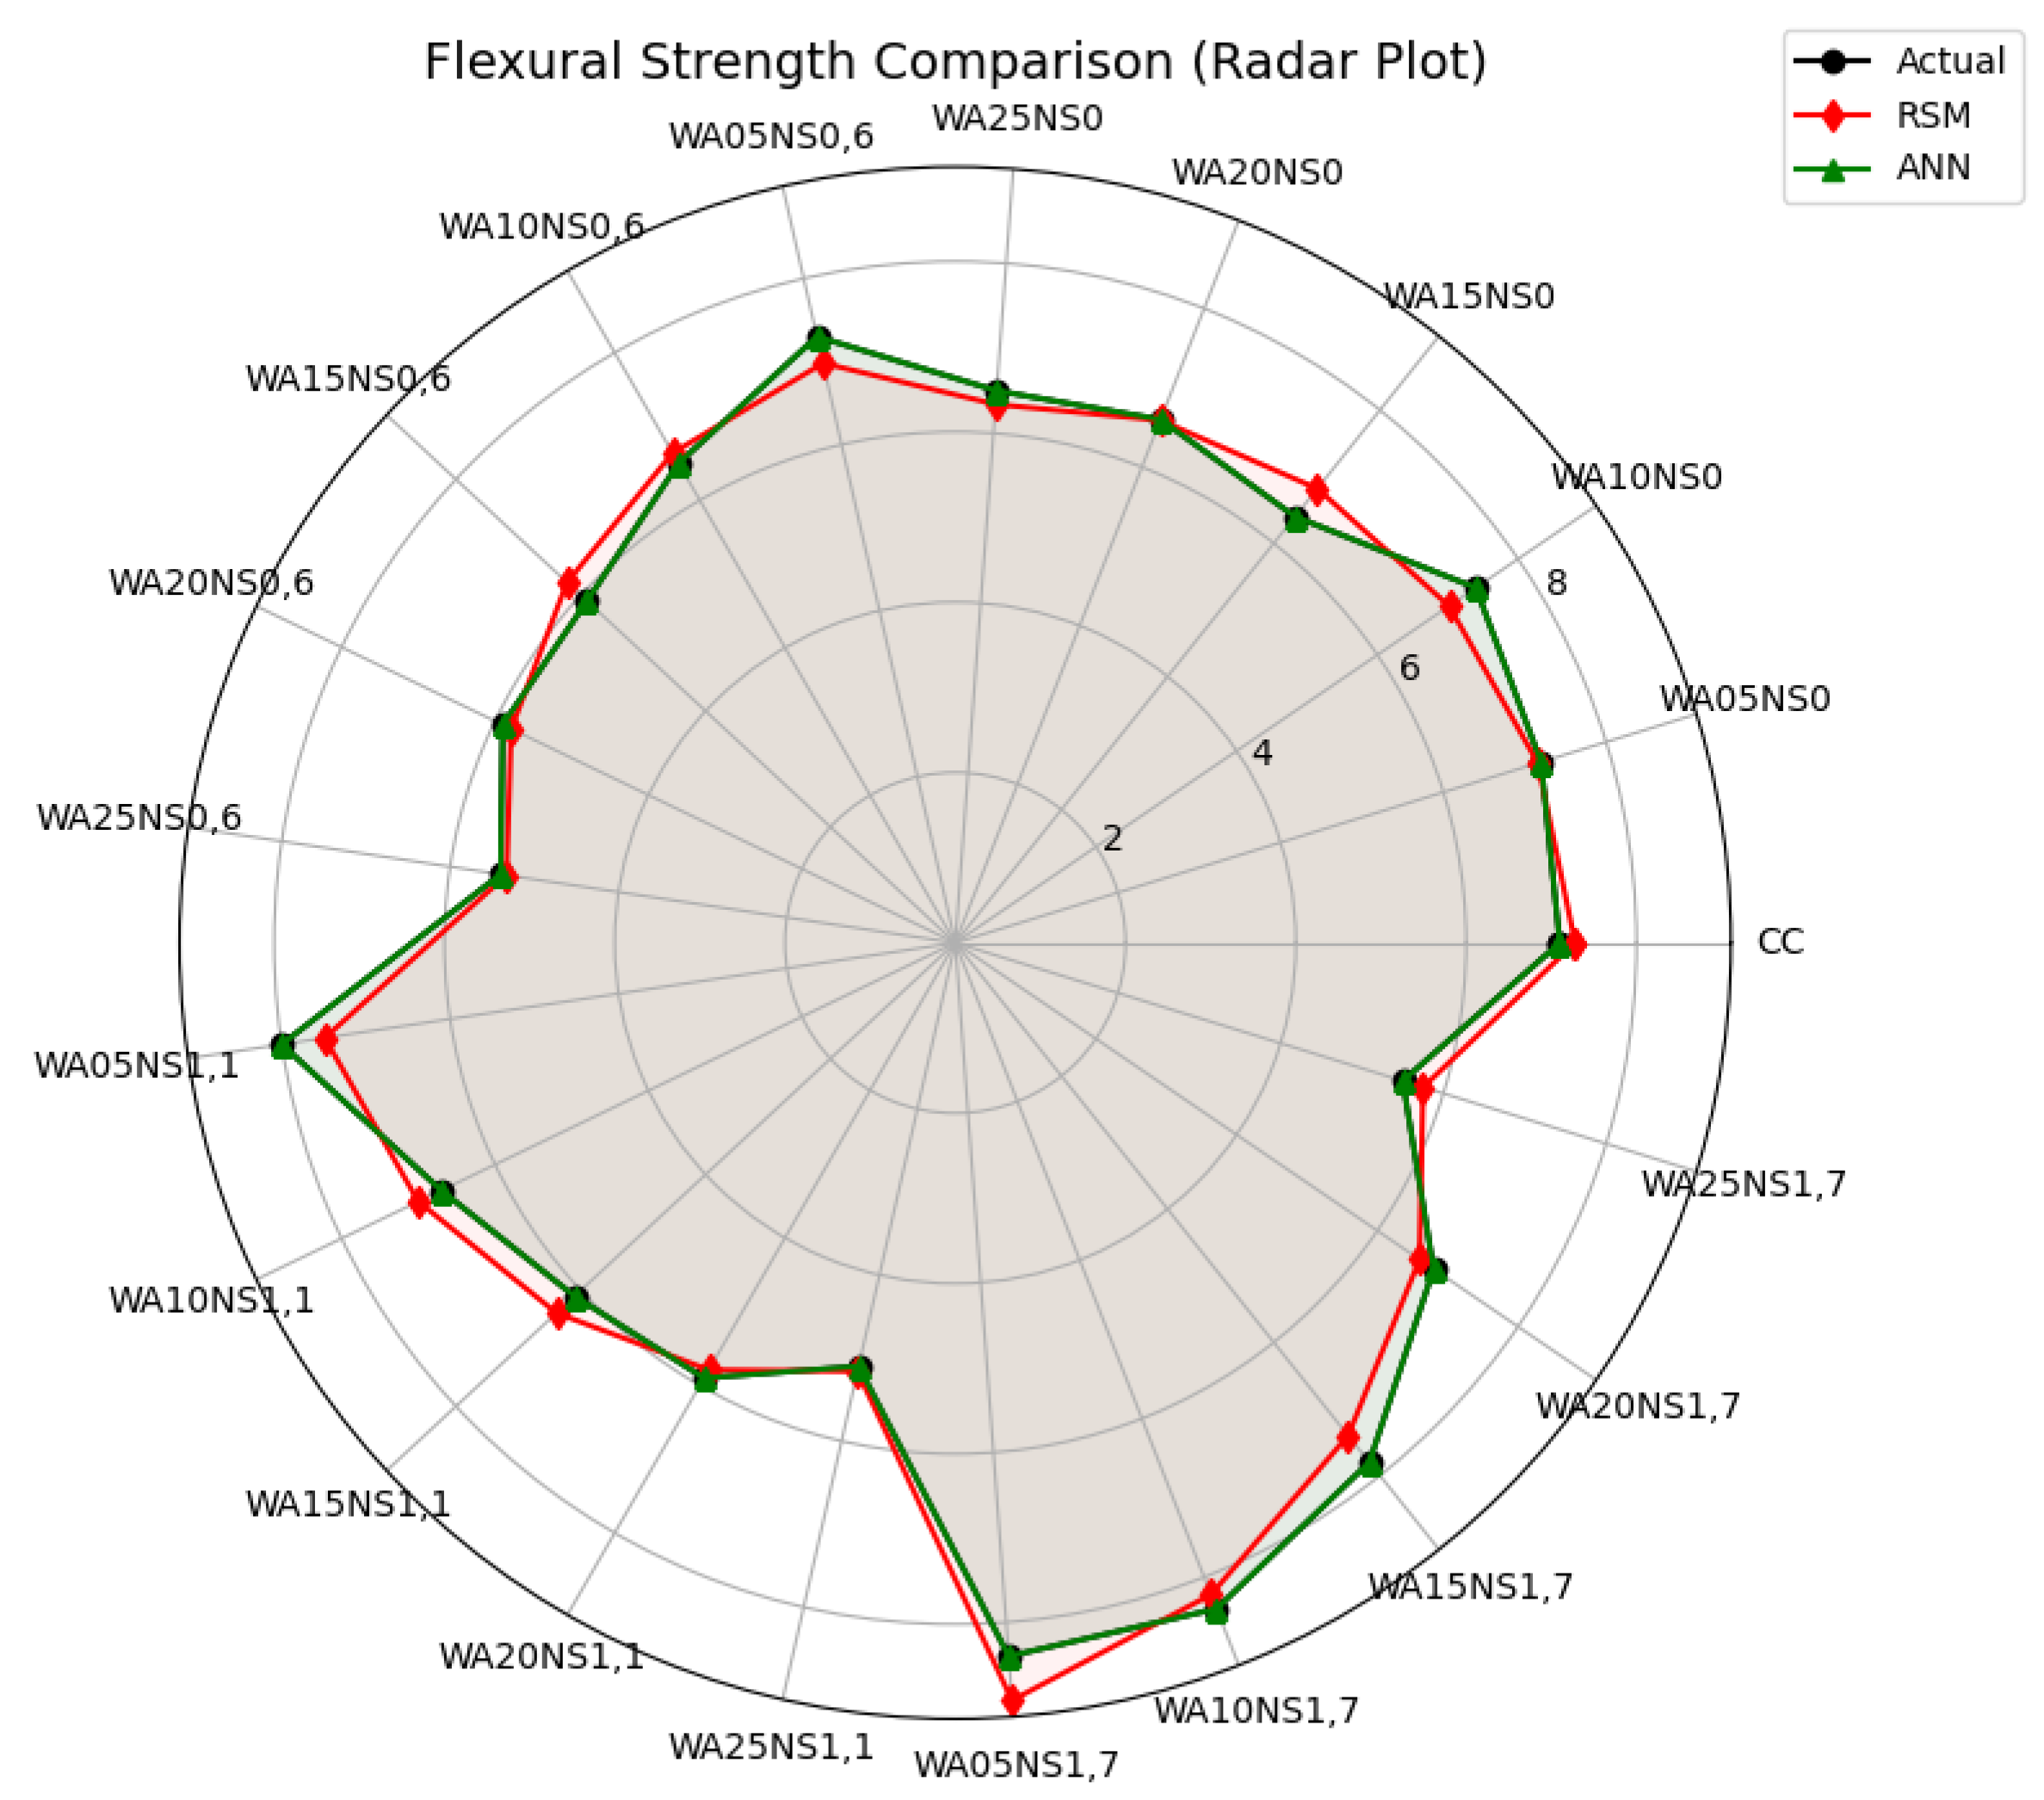
Figure 12.
Predicted vs. Actual Flexural Strength: (a) RSM Model (R² = 0.8621); (b) ANN Model. (R² = 1.000)
Figure 12.
Predicted vs. Actual Flexural Strength: (a) RSM Model (R² = 0.8621); (b) ANN Model. (R² = 1.000)
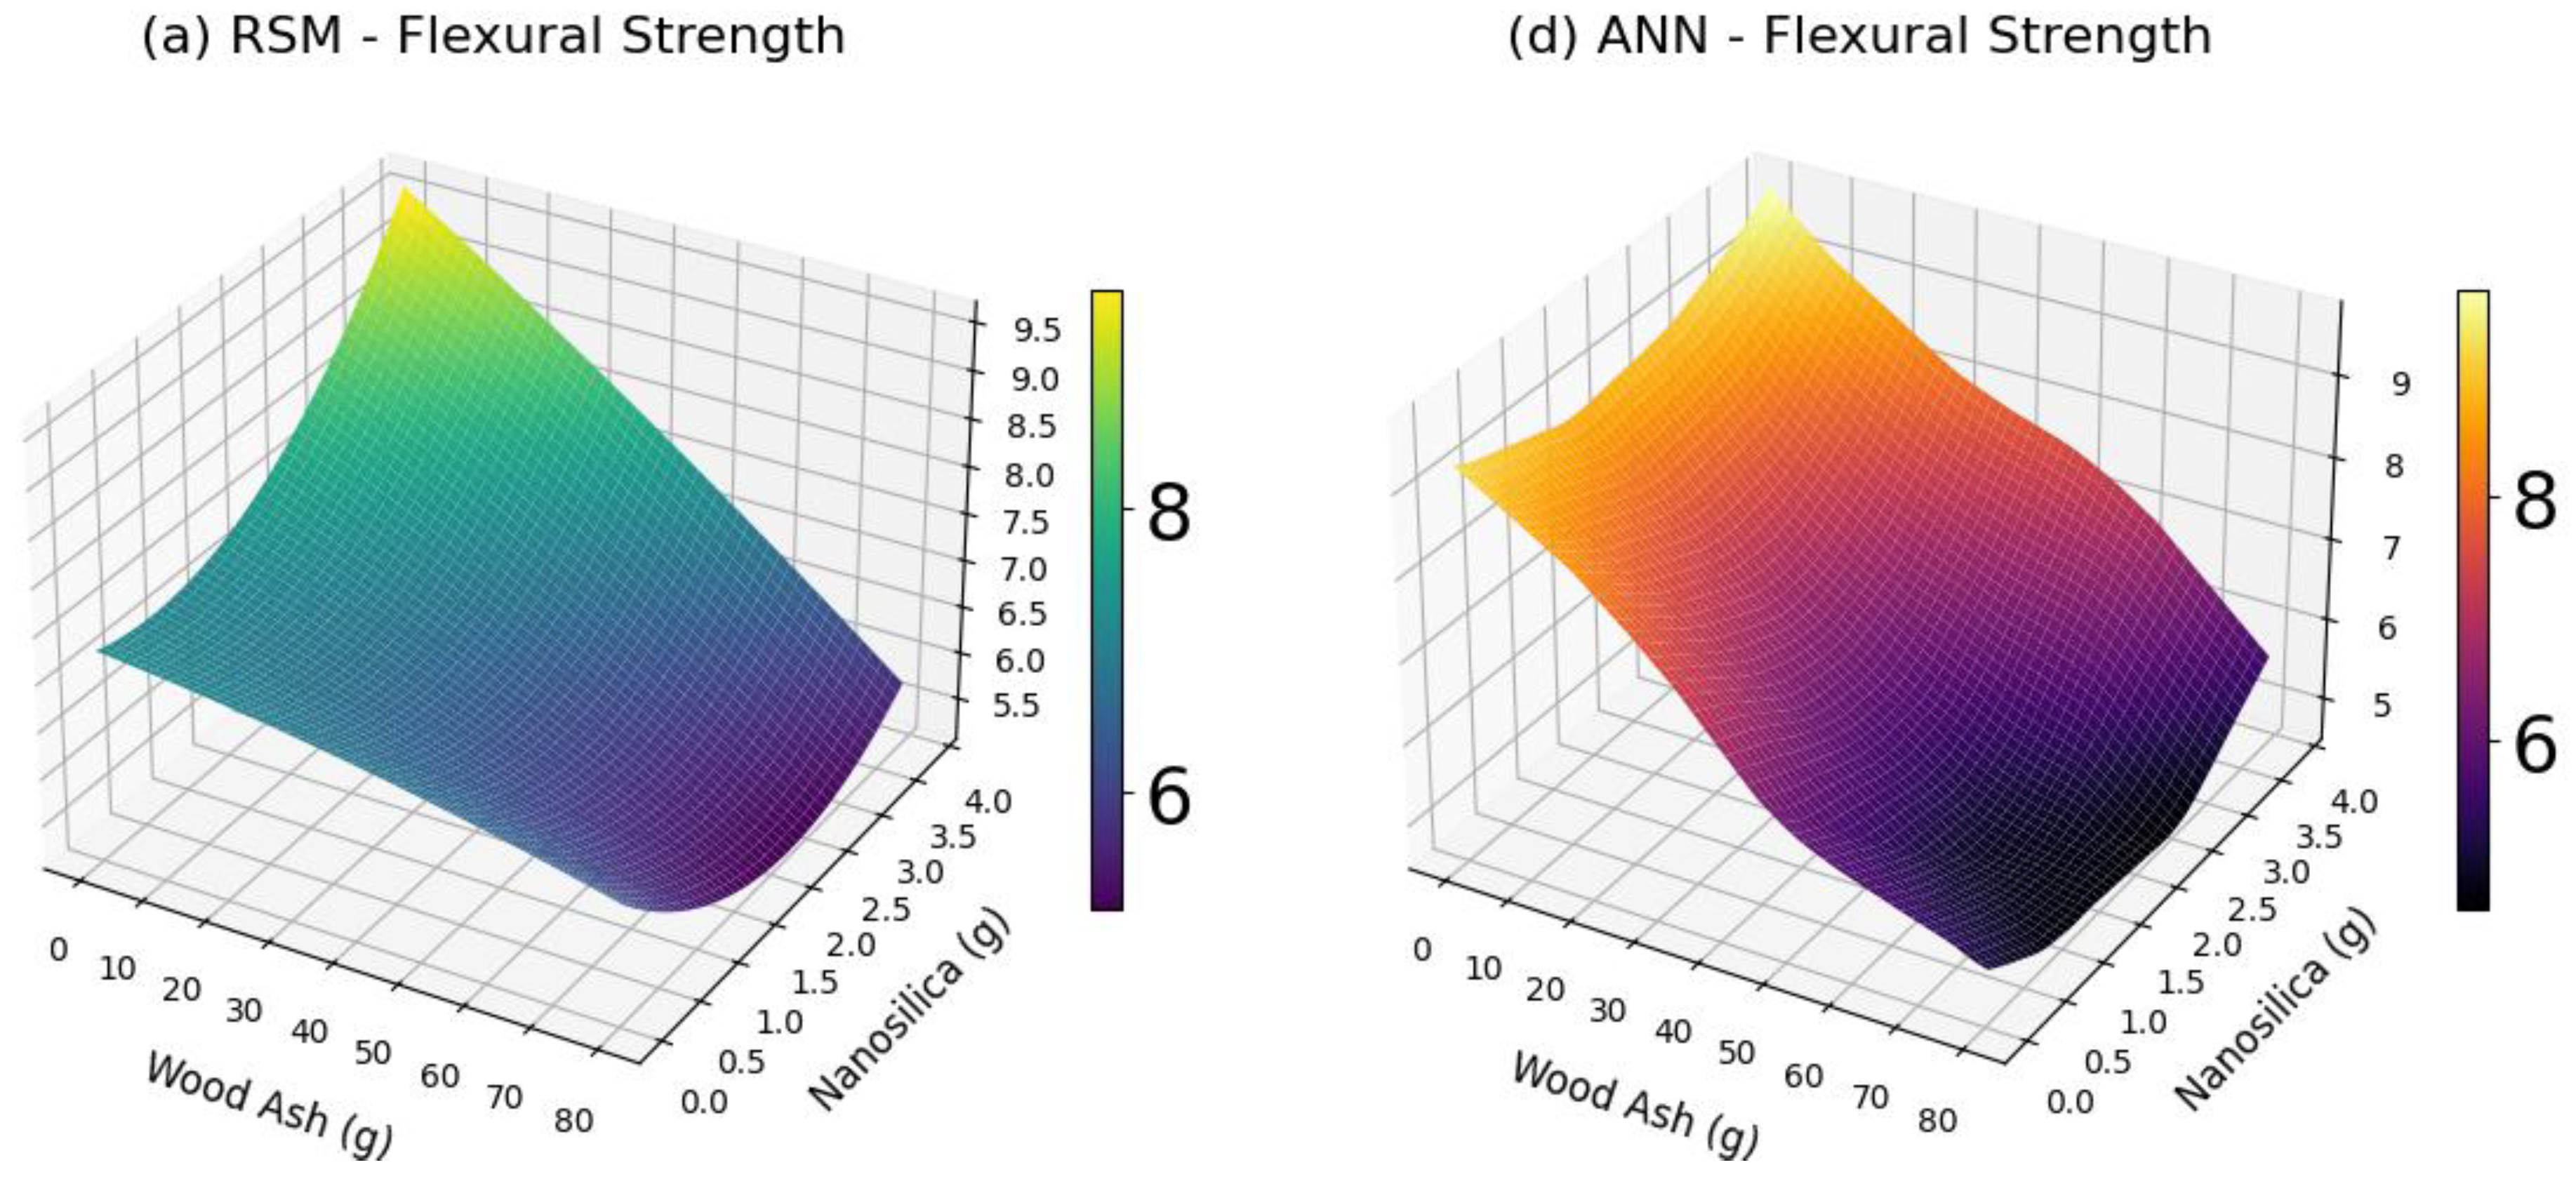
Figure 13.
3D Surface Plot of Flexural Strength: (a) RSM Model; (b) ANN Model.

Figure 14.
Optimization plots for flexural strength using the RSM method: (a) Desirability, (b)Flexural strength surface.
Figure 14.
Optimization plots for flexural strength using the RSM method: (a) Desirability, (b)Flexural strength surface.
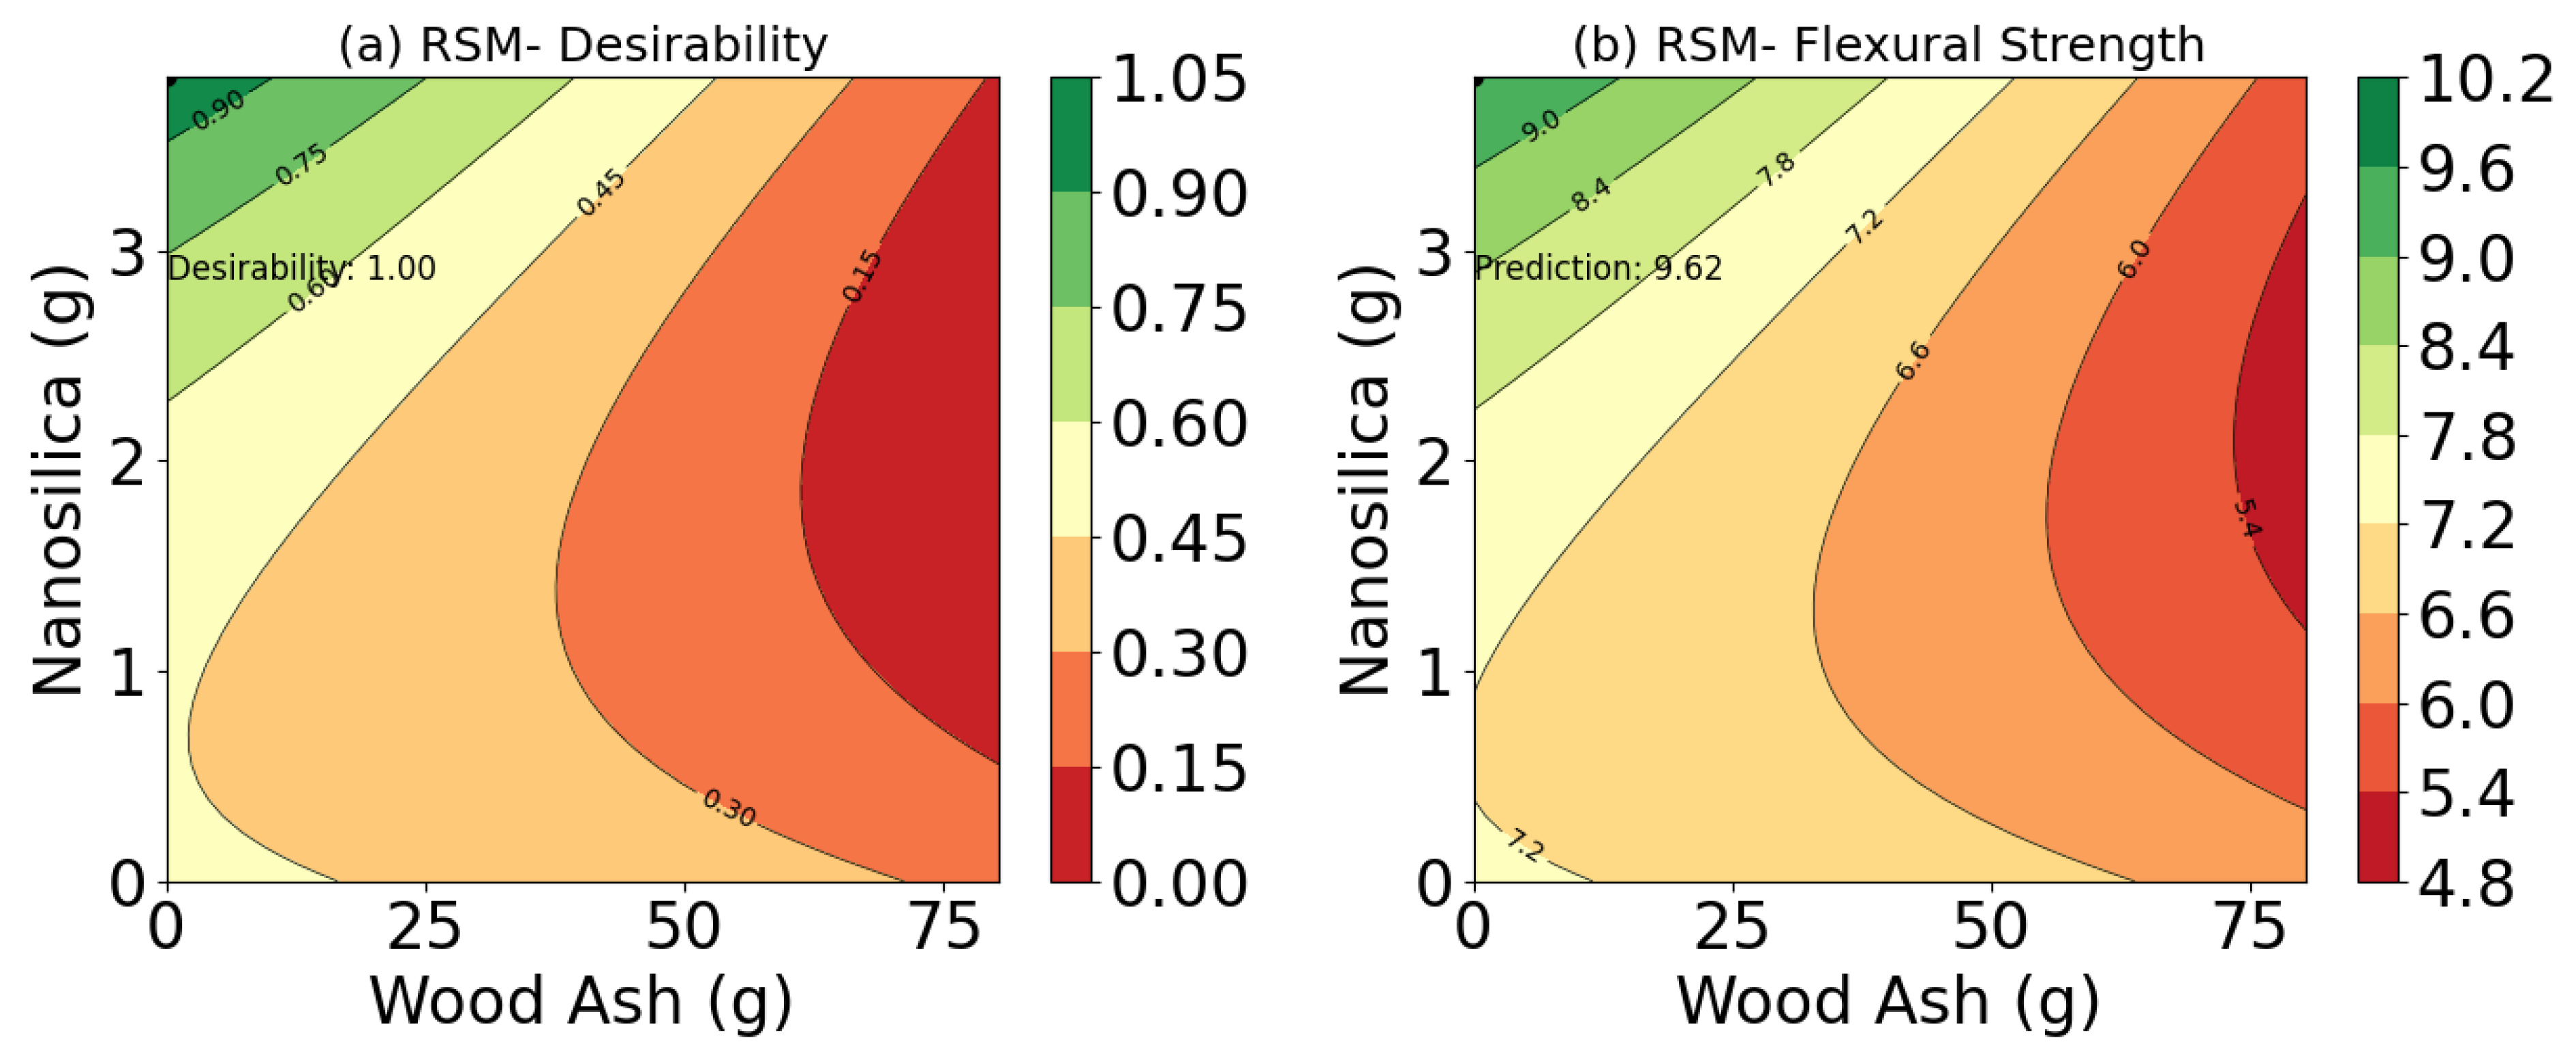
Figure 15.
Optimization plots for flexural strength using the ANN model: (a) Desirability; (b) Flexural strength surface.
Figure 15.
Optimization plots for flexural strength using the ANN model: (a) Desirability; (b) Flexural strength surface.
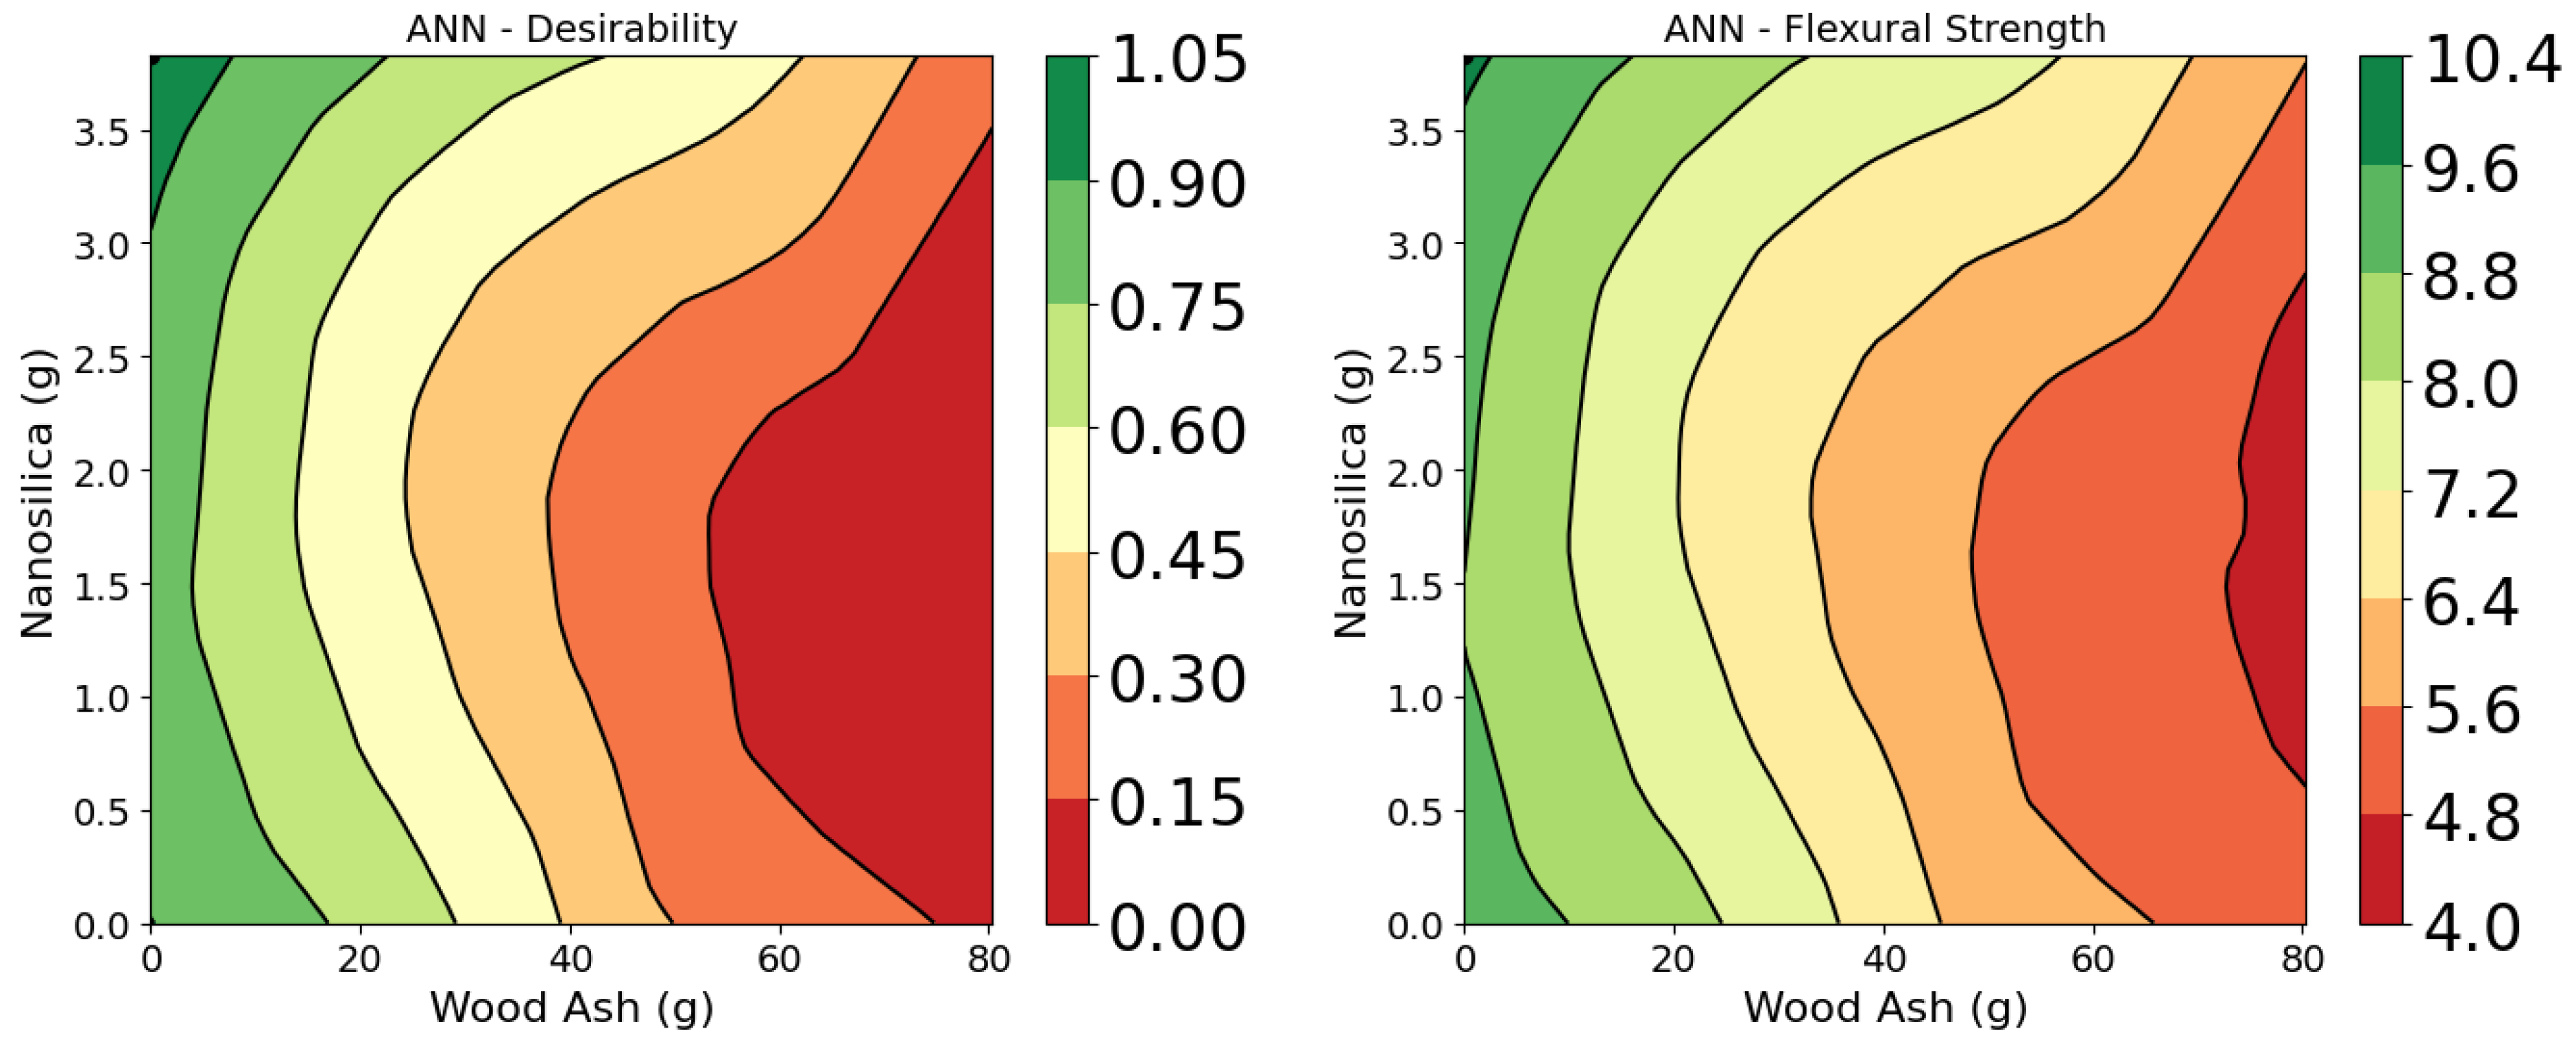
Figure 16.
Compressive strength vs. curing age grouped by wood ash content: (a) WA = 0.0 g, (b) WA = 16.1 g, (c) WA = 31.1 g, (d) WA = 48.2 g, (e) WA = 64.3 g, (f) WA = 80.4 g. Each line represents a different nanosilica content.
Figure 16.
Compressive strength vs. curing age grouped by wood ash content: (a) WA = 0.0 g, (b) WA = 16.1 g, (c) WA = 31.1 g, (d) WA = 48.2 g, (e) WA = 64.3 g, (f) WA = 80.4 g. Each line represents a different nanosilica content.
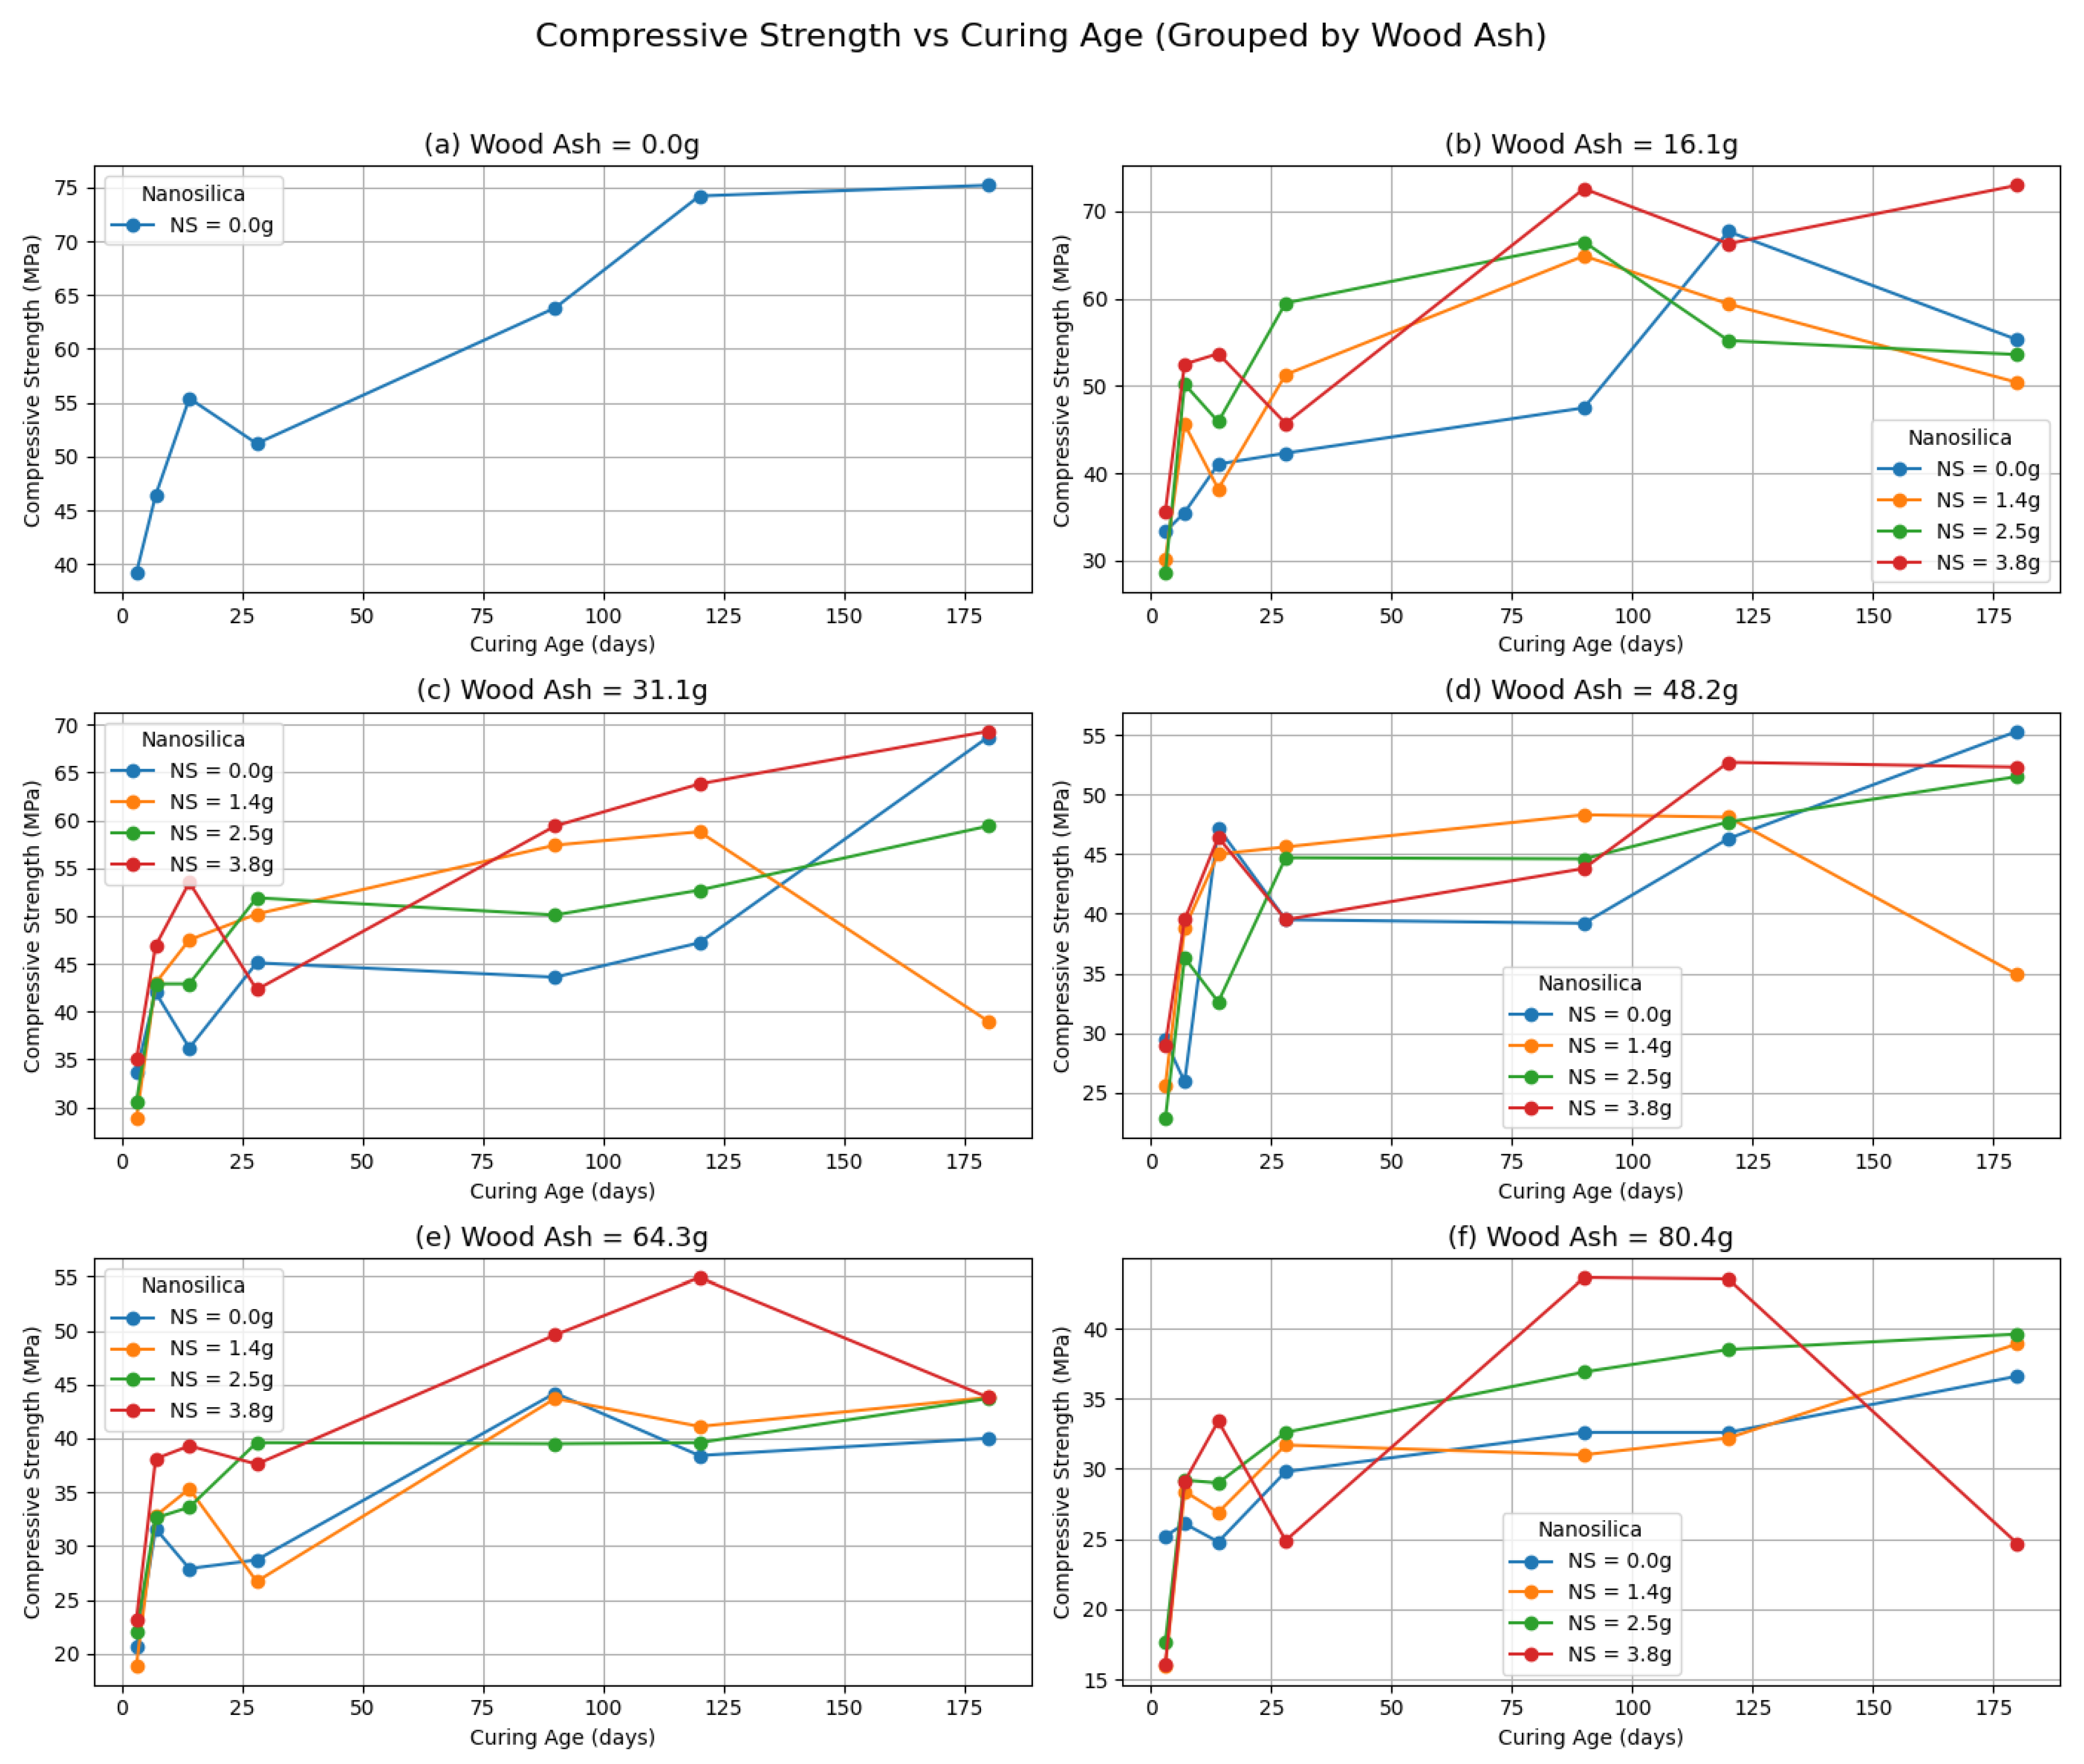
Figure 17.
Compressive strength vs. curing age grouped by nanosilica content: (a) NS = 0.0 g, (b) NS = 1.4 g, (c) NS = 2.5 g, (d) NS = 3.8 g. Each line represents a different wood ash content.
Figure 17.
Compressive strength vs. curing age grouped by nanosilica content: (a) NS = 0.0 g, (b) NS = 1.4 g, (c) NS = 2.5 g, (d) NS = 3.8 g. Each line represents a different wood ash content.
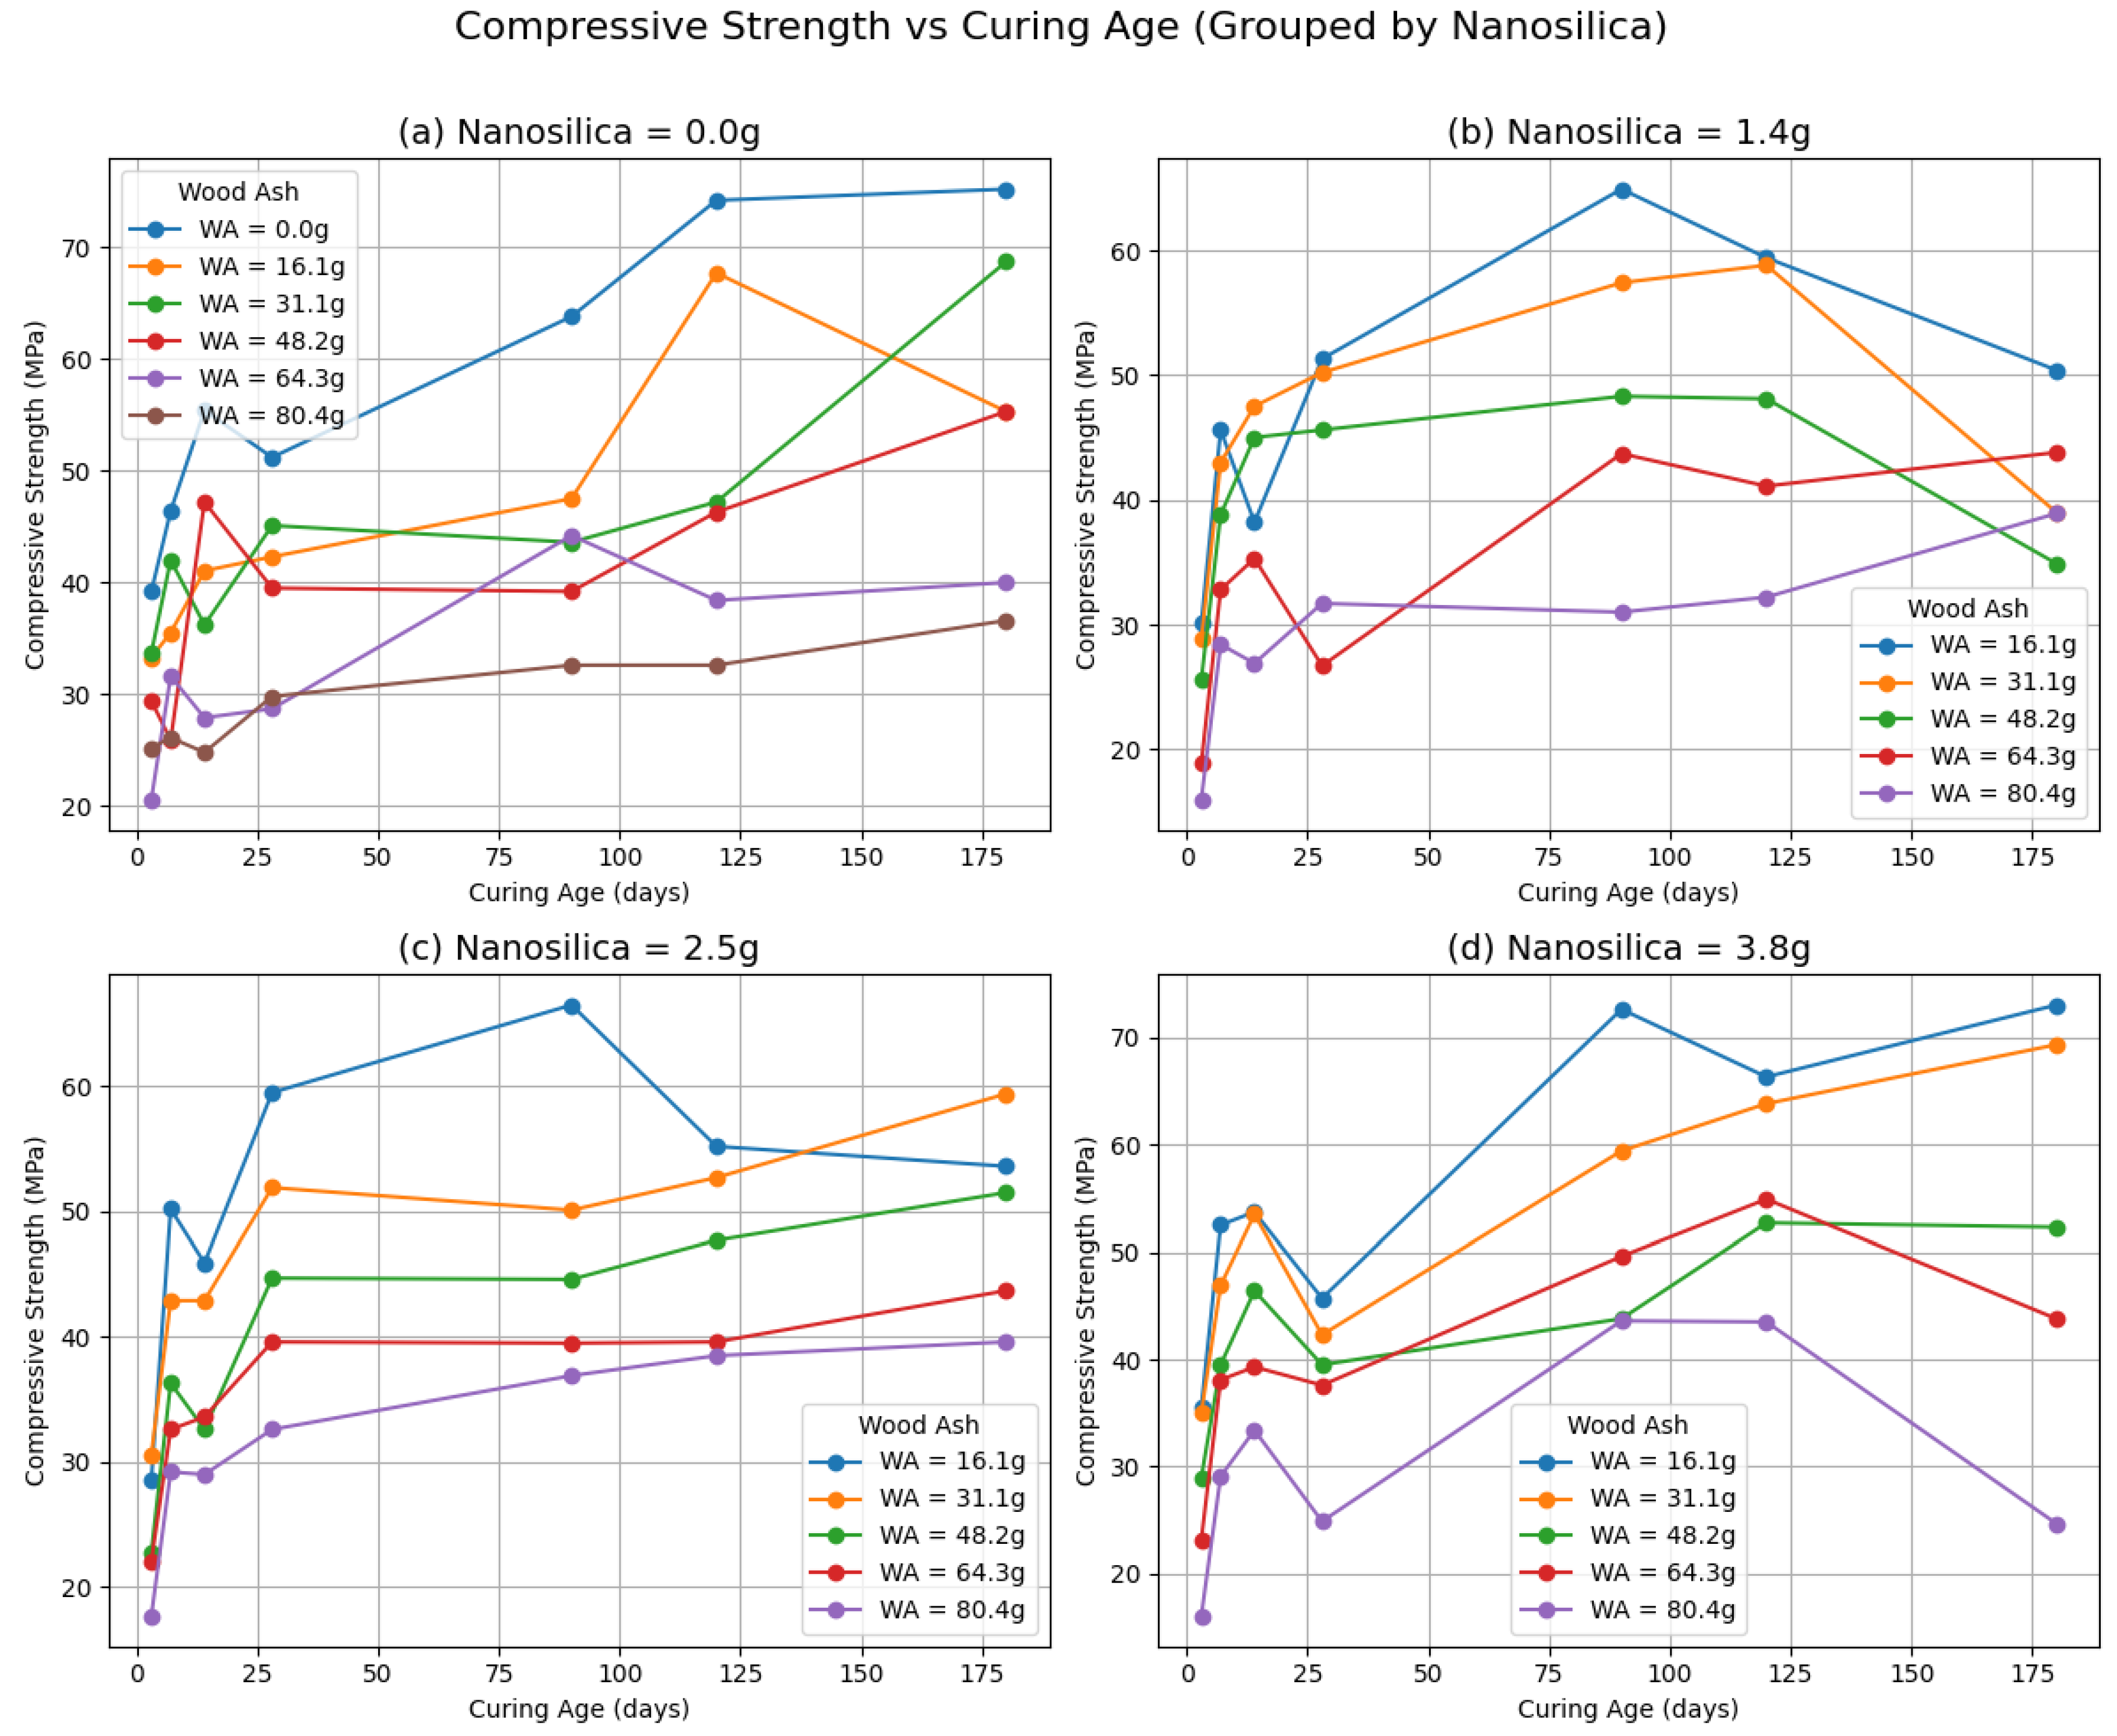
Figure 18.
Actual vs. predicted compressive strength using: (a) Linear Regression, (b) Artificial Neural Network (ANN). Solid line = model fit; dashed line = ideal fit (Y = T).
Figure 18.
Actual vs. predicted compressive strength using: (a) Linear Regression, (b) Artificial Neural Network (ANN). Solid line = model fit; dashed line = ideal fit (Y = T).
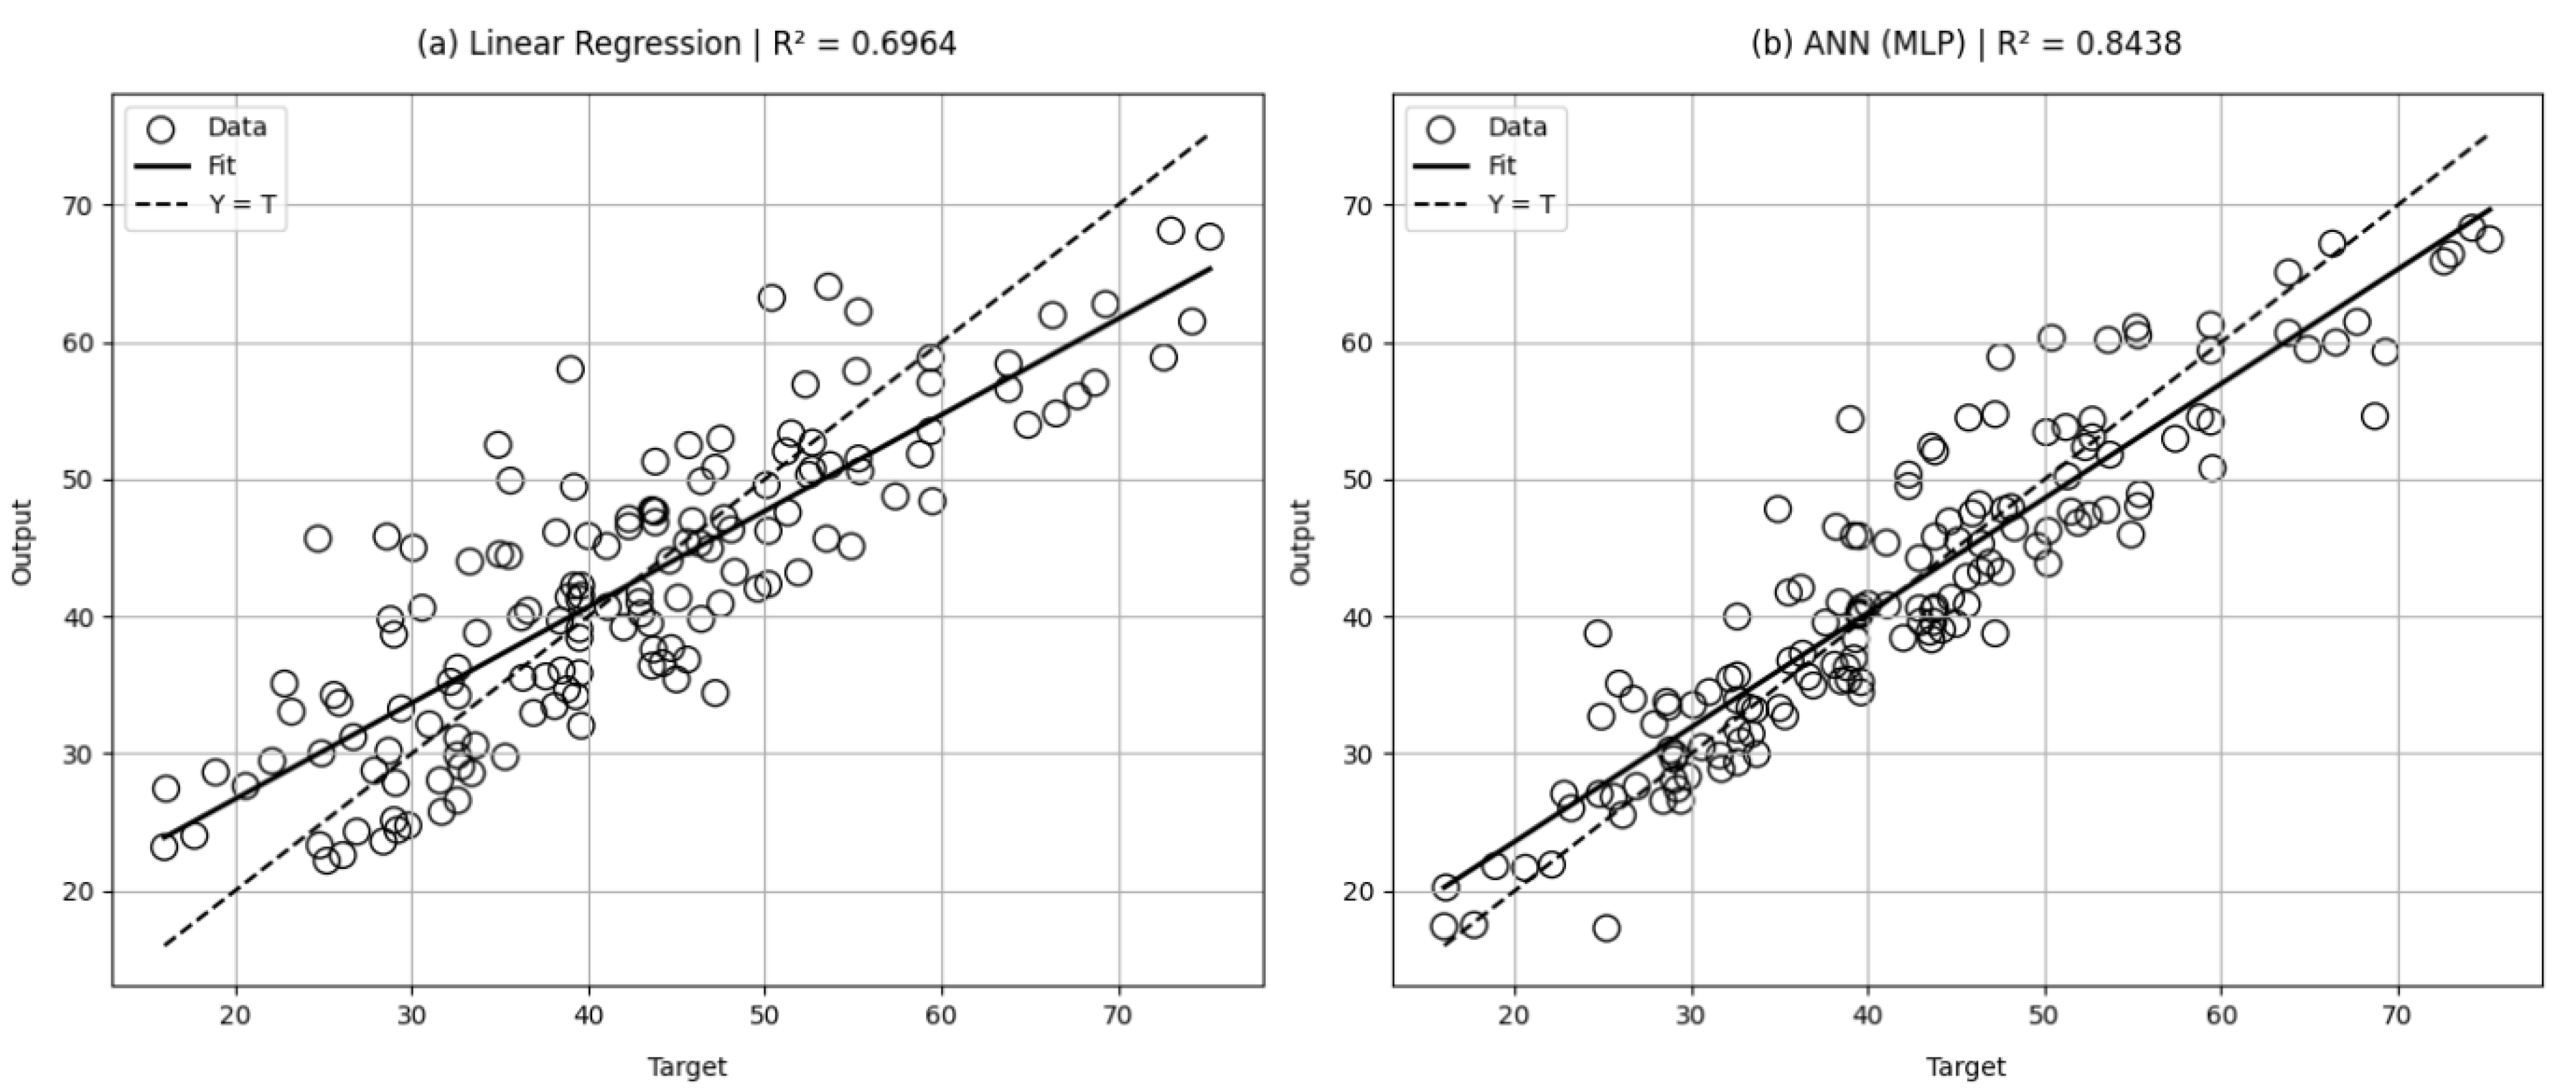
Figure 19.
Flexural strength vs. curing age at constant nanosilica content: (a) NS = 0.0 g, (b) NS = 1.4 g, (c) NS = 2.5 g, (d) NS = 3.8 g for varying wood ash dosages.
Figure 19.
Flexural strength vs. curing age at constant nanosilica content: (a) NS = 0.0 g, (b) NS = 1.4 g, (c) NS = 2.5 g, (d) NS = 3.8 g for varying wood ash dosages.
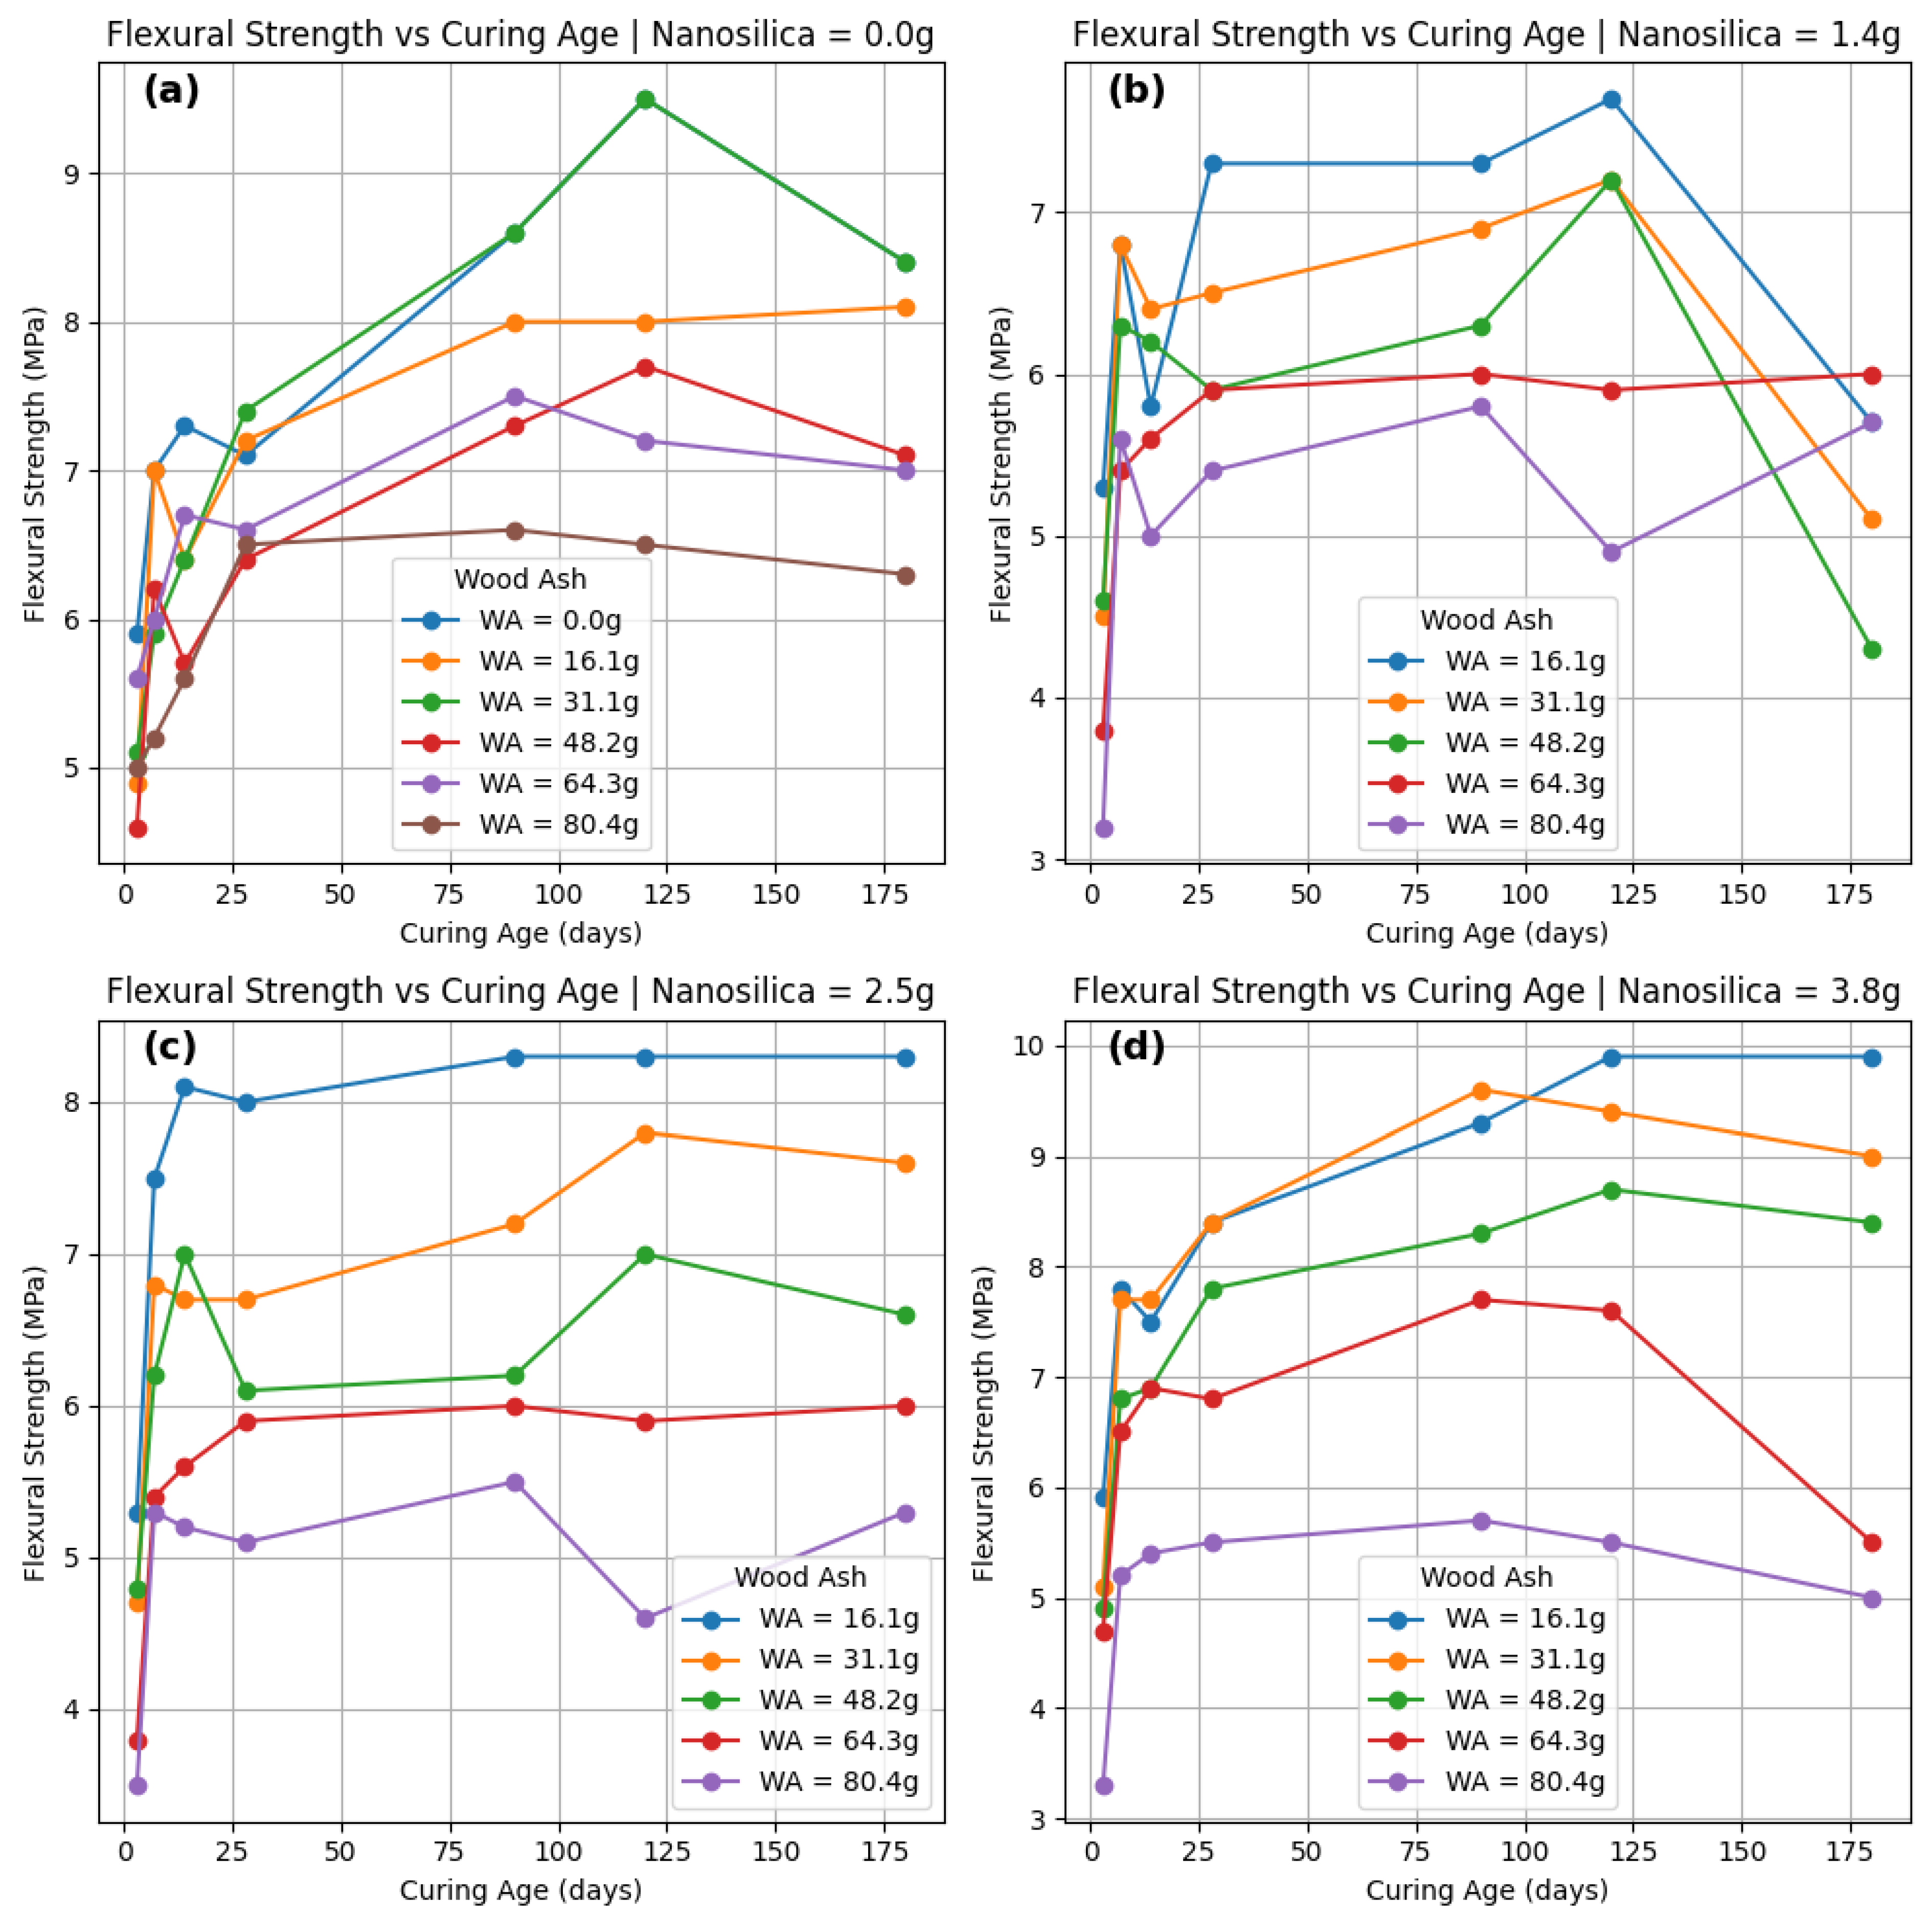
Figure 20.
Flexural strength vs. curing age at constant wood ash content: (a) WA = 0.0 g, (b) WA = 16.1 g, (c) WA = 31.1 g, (d) WA = 48.2 g, (e) WA = 64.3 g, (f) WA = 80.4 g for varying nanosilica dosages.
Figure 20.
Flexural strength vs. curing age at constant wood ash content: (a) WA = 0.0 g, (b) WA = 16.1 g, (c) WA = 31.1 g, (d) WA = 48.2 g, (e) WA = 64.3 g, (f) WA = 80.4 g for varying nanosilica dosages.
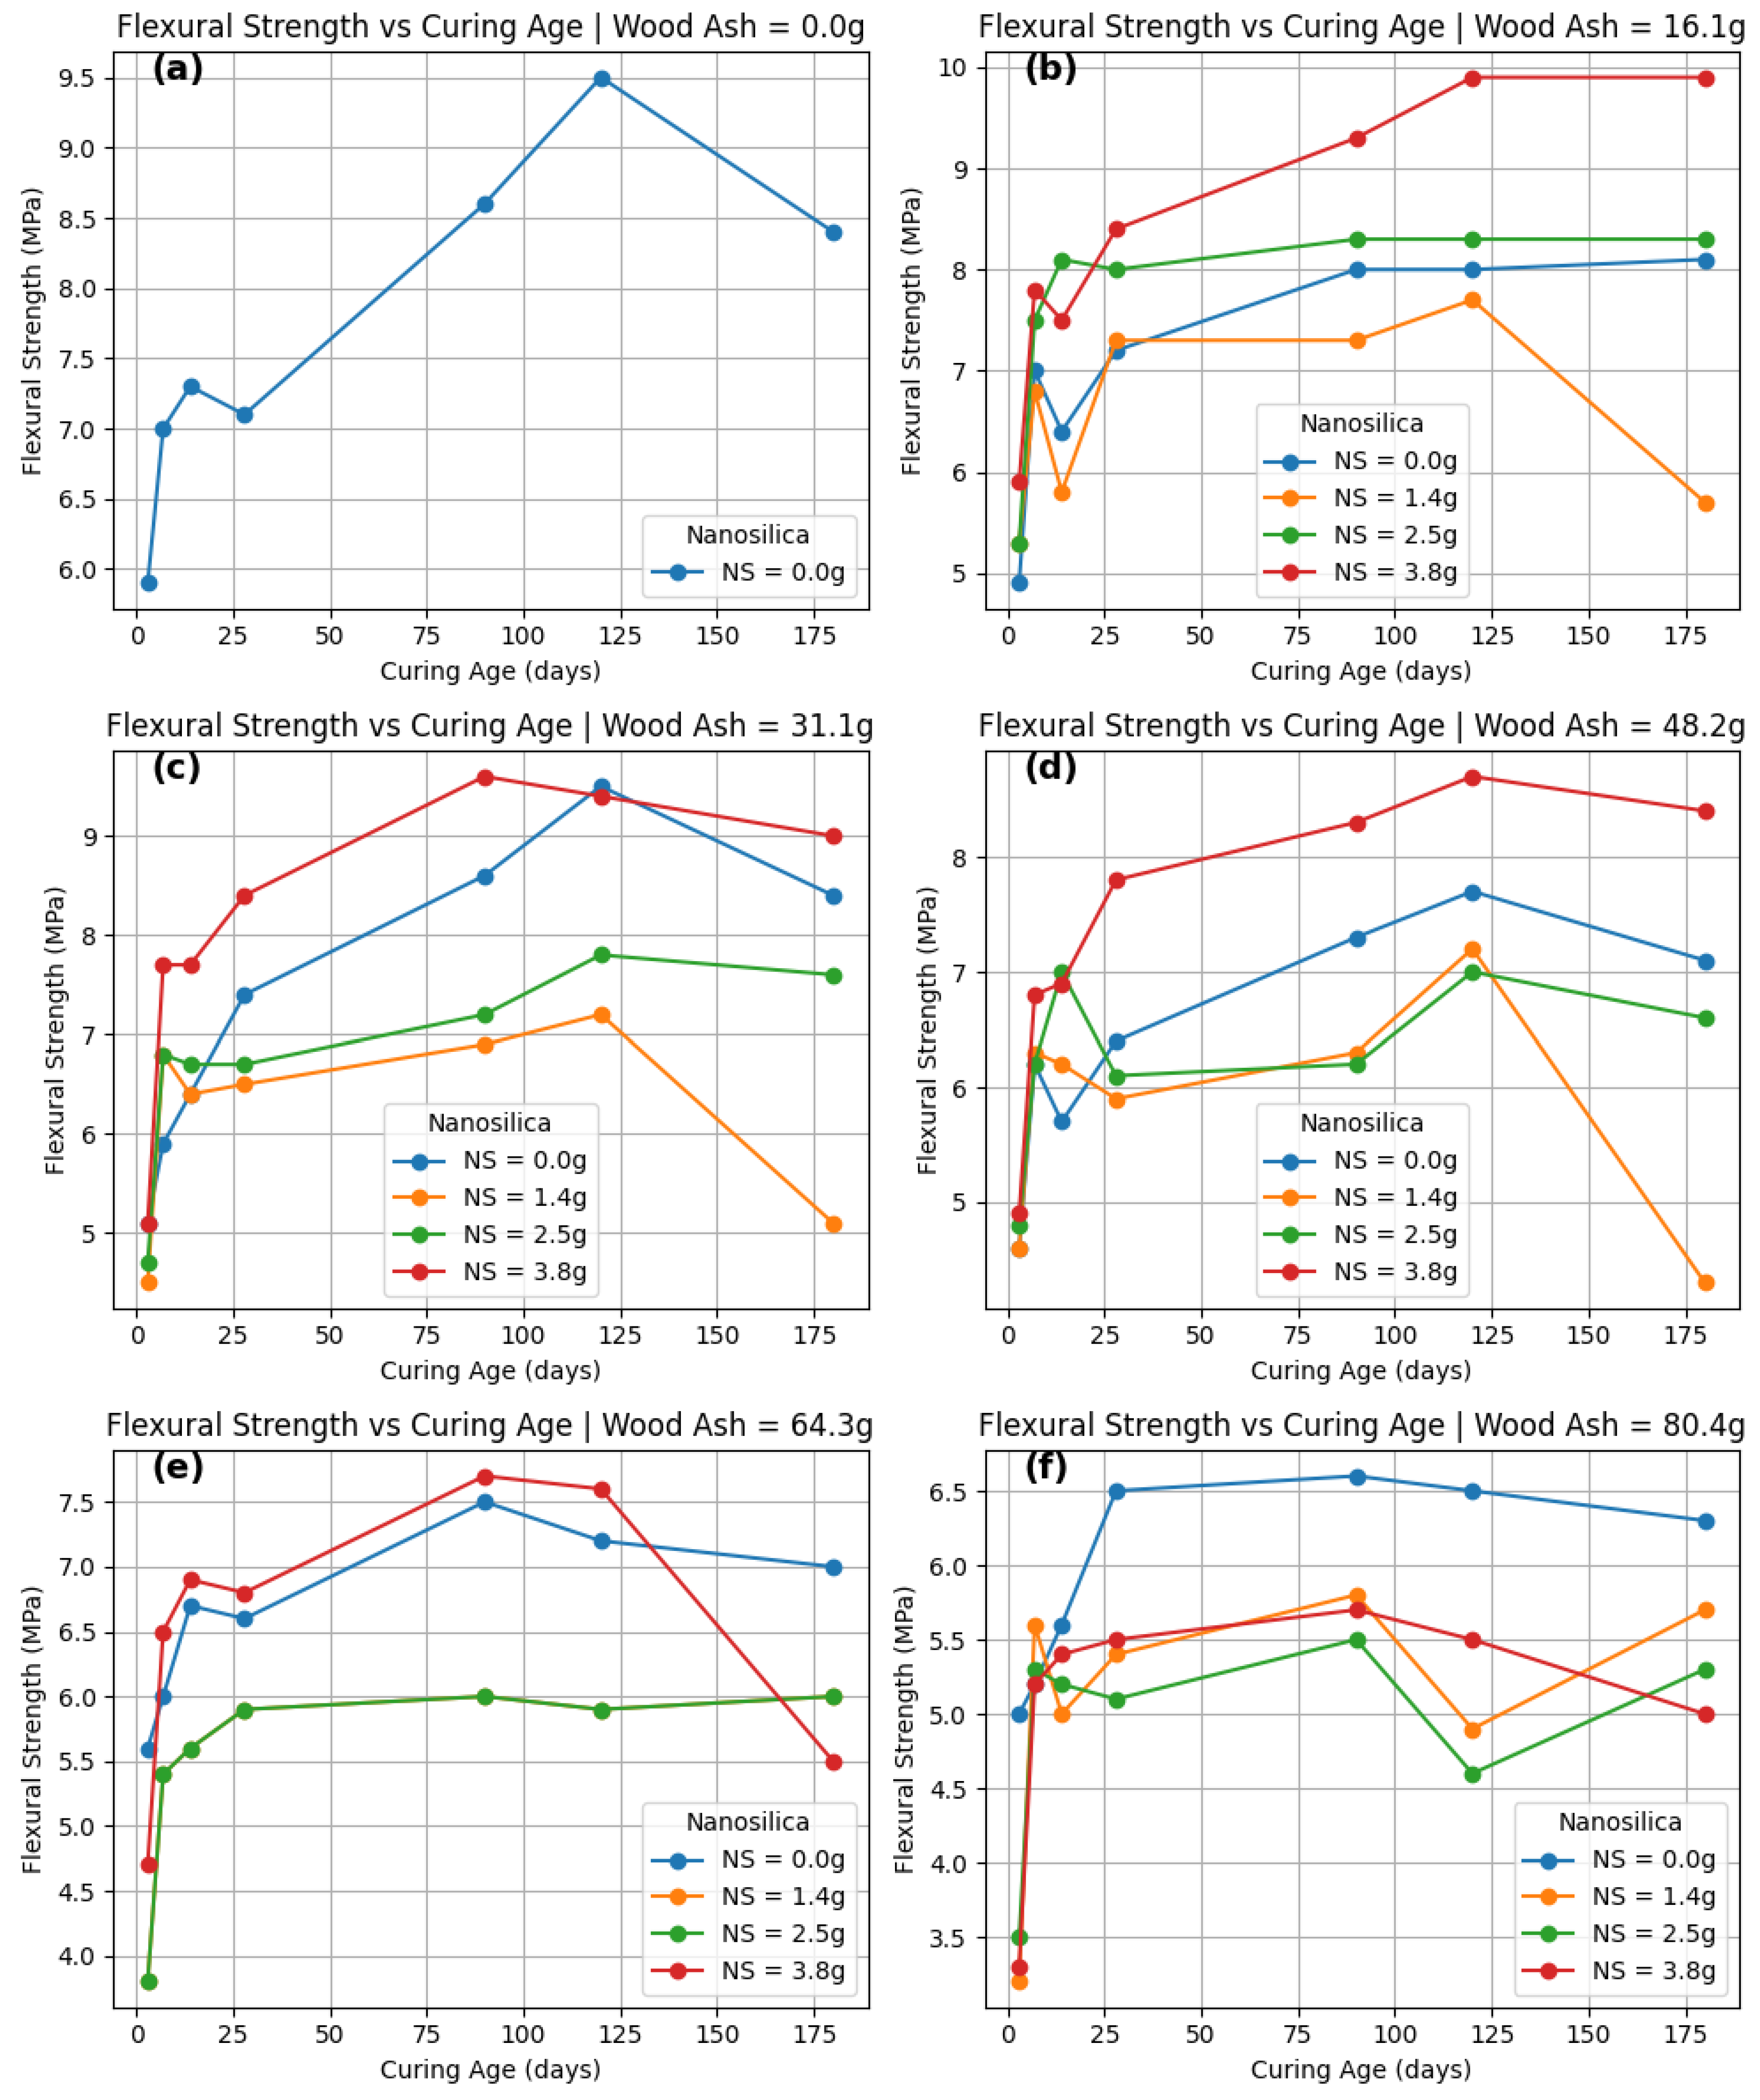
Figure 21.
(a) Linear regression and (b) ANN (MLP) model predictions versus actual flexural strength values.
Figure 21.
(a) Linear regression and (b) ANN (MLP) model predictions versus actual flexural strength values.
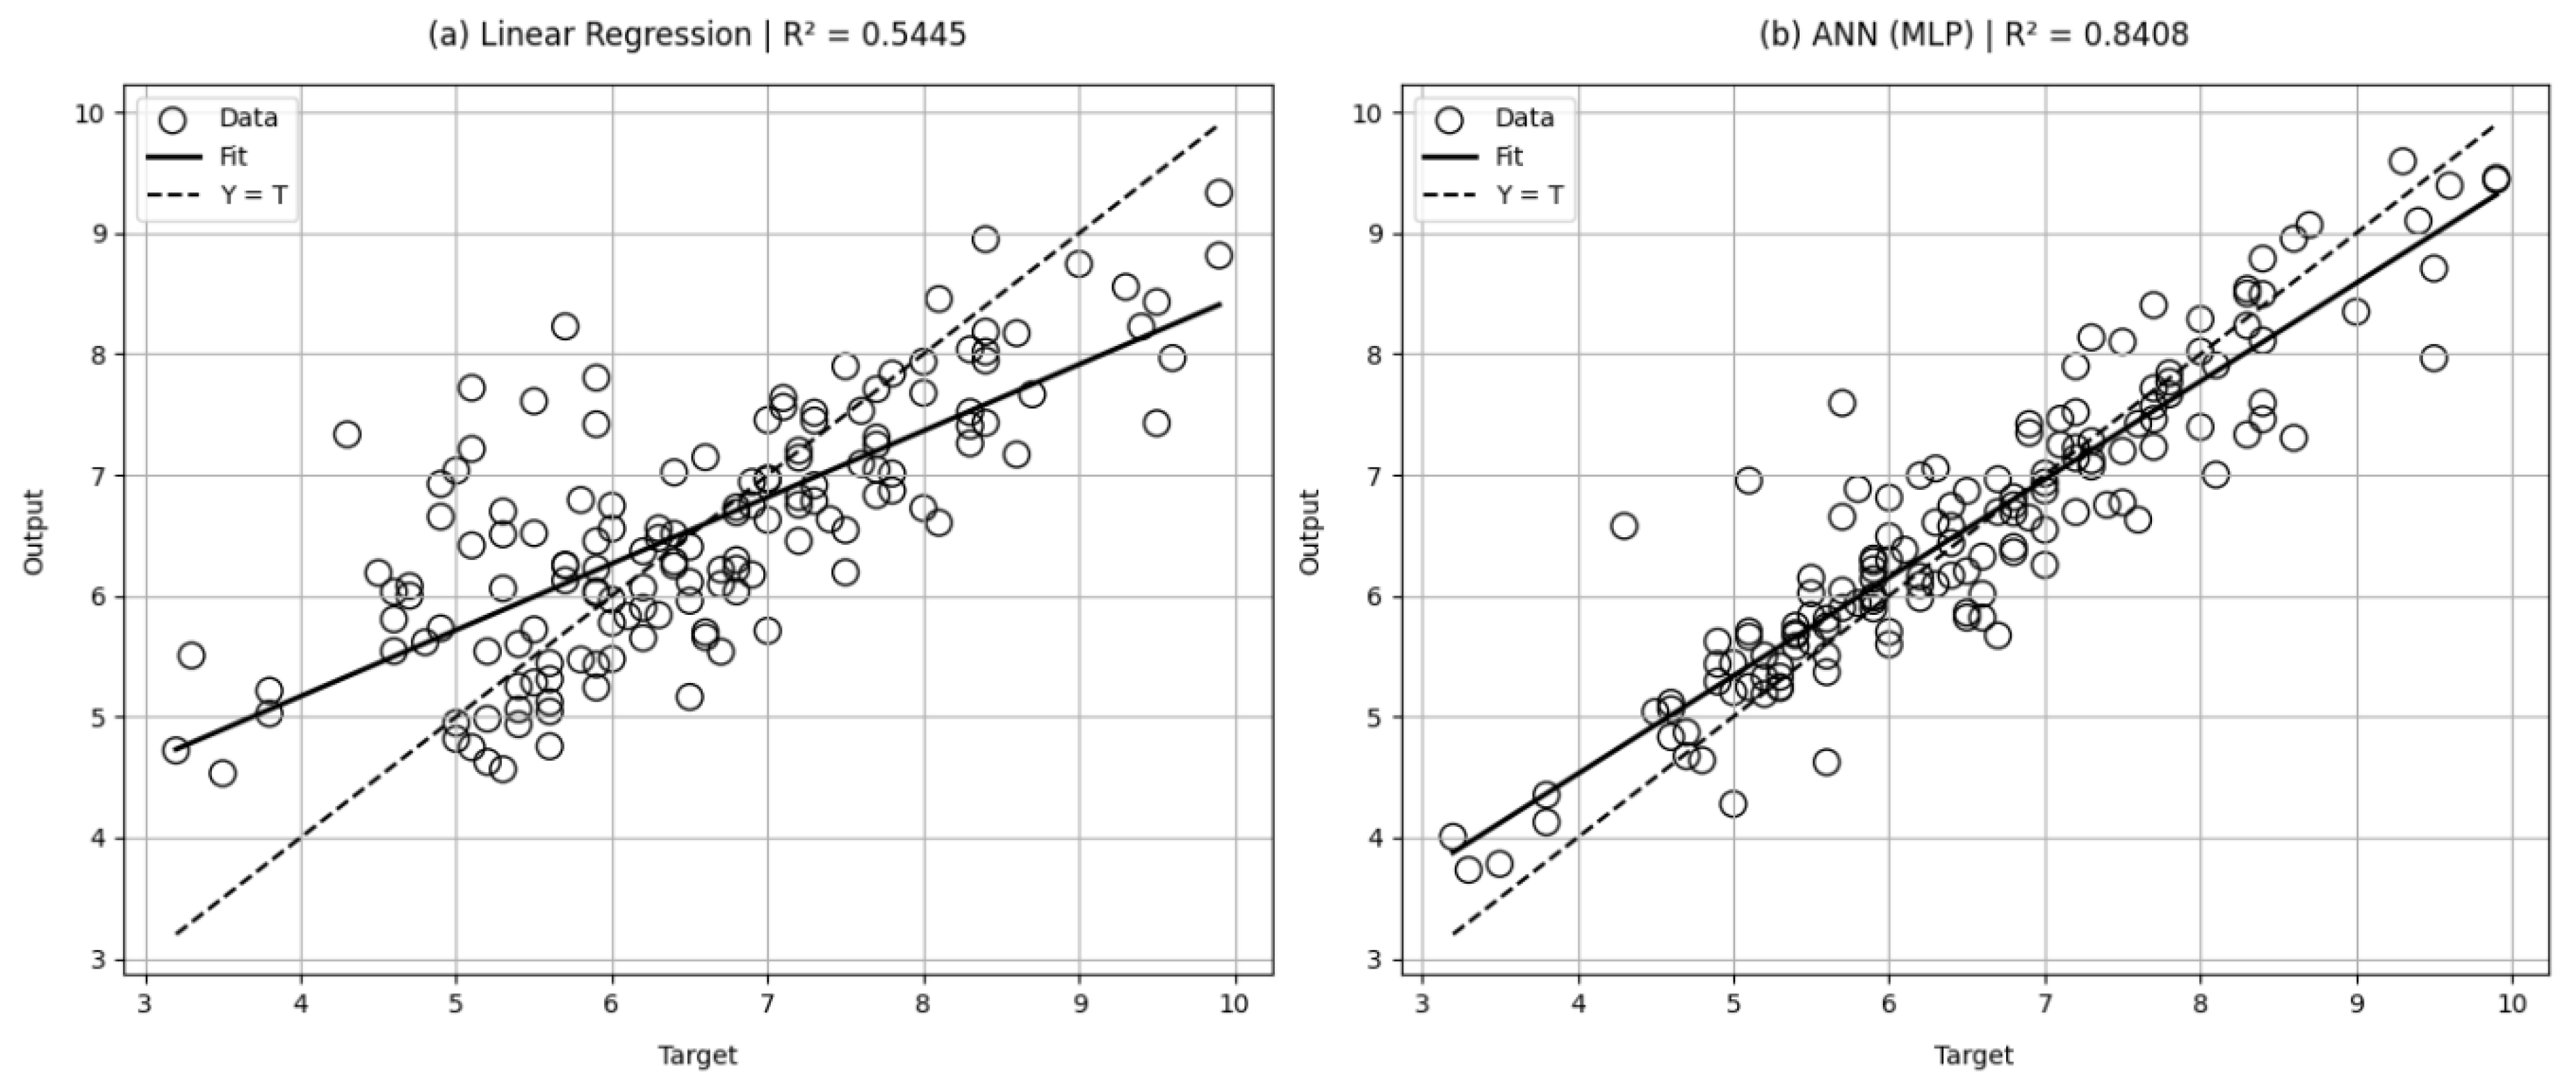
Table 1.
Chemical and physical properties of wood ash (ZAWA).
| Property | Value | Oxide | wt.% |
| Density (kg·m⁻³) | 834 | SiO₂ | 53.57 |
| Specific gravity | 1.92 | Al₂O₃ | 33.98 |
| Mean size (µm) | 0.4 | Fe₂O₃ | 6.12 |
| MgO | 6.23 | ||
| CaO | 3.24 | ||
| MnO | 1.66 | ||
| SO₃ | 1.58 | ||
| Cl | 0.07 | ||
| Na₂O | 0.00 | ||
| K₂O | 0.20 | ||
| TiO₂ | 0.20 | ||
| P₂O₅ | 0.30 | ||
| SrO₂ | 0.08 | ||
| ZrO₂ | 0.96 | ||
| ZnO | 2.66 |
Table 2.
Mix proportions for wood-ash/nanosilica mortars.
| Mix ID |
PC (g) |
Sand (g) |
Water (g) |
Wood ash (g) |
NS (g) |
| CC | 450.0 | 1350 | 225 | 0.000 | 0.000 |
| WA05NS0 | 427.5 | 1350 | 225 | 16.071 | 0.000 |
| WA10NS0 | 405.0 | 1350 | 225 | 31.143 | 0.000 |
| WA15NS0 | 385.5 | 1350 | 225 | 48.214 | 0.000 |
| WA20NS0 | 360.0 | 1350 | 225 | 64.286 | 0.000 |
| WA25NS0 | 337.5 | 1350 | 225 | 80.357 | 0.000 |
| WA05NS0.6 | 427.5 | 1350 | 225 | 16.071 | 1.350 |
| WA10NS0.6 | 405.0 | 1350 | 225 | 31.143 | 1.350 |
| WA15NS0.6 | 385.5 | 1350 | 225 | 48.214 | 1.350 |
| WA20NS0.6 | 360.0 | 1350 | 225 | 64.286 | 1.350 |
| WA25NS0.6 | 337.5 | 1350 | 225 | 80.357 | 1.350 |
| WA05NS1.1 | 427.5 | 1350 | 225 | 16.071 | 2.475 |
| WA10NS1.1 | 405.0 | 1350 | 225 | 31.143 | 2.475 |
| WA15NS1.1 | 385.5 | 1350 | 225 | 48.214 | 2.475 |
| WA20NS1.1 | 360.0 | 1350 | 225 | 64.286 | 2.475 |
| WA25NS1.1 | 337.5 | 1350 | 225 | 80.357 | 2.475 |
| WA05NS1.7 | 427.5 | 1350 | 225 | 16.071 | 3.825 |
| WA10NS1.7 | 405.0 | 1350 | 225 | 31.143 | 3.825 |
| WA15NS1.7 | 385.5 | 1350 | 225 | 48.214 | 3.825 |
| WA20NS1.7 | 360.0 | 1350 | 225 | 64.286 | 3.825 |
| WA25NS1.7 | 337.5 | 1350 | 225 | 80.357 | 3.825 |
Table 3.
Design Summary of the RSM Method.
| Study Type | Design Type | Design Model | Subtype | Runs | Blocks |
| Response Surface | User-Defined | Quadratic | Randomized | 21 | No Blocks |
Table 5.
ANOVA Table for Compressive Strength (RSM Model).
| Source | Sum of Squares (SS) | df | F-value | p-value |
| WA | 31.1778 | 1.0 | 1.7220 | 0.2092 |
| NS | 183.9173 | 1.0 | 10.1582 | 0.0061 |
| WA 2 | 7.9832 | 1.0 | 0.4409 | 0.5167 |
| NS 2 | 168.7324 | 1.0 | 9.3195 | 0.0081 |
| WA NS | 0.5068 | 1.0 | 0.0280 | 0.8694 |
| Residual | 271.5787 | 15.0 | - | - |
| Total | 0.8447 | - | - | - |
| Adj. | 0.7929 | - | - | - |
| Std. Dev. | 3.5962 | - | - | - |
| Mean | 40.9714 | - | - | - |
| C.V. (%) | 8.7772 | - | - | - |
Table 6.
Actual and Predicted 28-Day Flexural Strength (MPa).
| TEST SPECIMEN | ACTUAL FS (MPA) | PREDICTED FS (RSM) | ANN PREDICTED (MPA) |
| CC | 7.10 | 6.40 | 7.10 |
| WA05NS0 | 6.20 | 6.31 | 6.20 |
| WA10NS0 | 5.60 | 5.76 | 5.60 |
| WA15NS0 | 4.70 | 5.21 | 4.70 |
| WA20NS0 | 3.20 | 4.30 | 3.20 |
| WA25NS0 | 3.00 | 3.45 | 3.00 |
| WA05NS0.6 | 7.40 | 7.14 | 7.40 |
| WA10NS0.6 | 6.40 | 6.58 | 6.40 |
| WA15NS0.6 | 5.70 | 6.01 | 5.70 |
| WA20NS0.6 | 3.60 | 5.01 | 3.60 |
| WA25NS0.6 | 4.00 | 4.11 | 4.00 |
| WA05NS1.1 | 8.60 | 7.91 | 8.60 |
| WA10NS1.1 | 7.40 | 7.34 | 7.40 |
| WA15NS1.1 | 6.50 | 6.77 | 6.50 |
| WA20NS1.1 | 5.10 | 5.76 | 5.10 |
| WA25NS1.1 | 4.30 | 4.83 | 4.30 |
| WA05NS1.7 | 6.90 | 7.34 | 6.90 |
| WA10NS1.7 | 6.10 | 6.77 | 6.10 |
| WA15NS1.7 | 5.10 | 6.20 | 5.10 |
| WA20NS1.7 | 4.50 | 5.19 | 4.50 |
| WA25NS1.7 | 3.10 | 4.27 | 3.10 |
Table 7.
ANOVA Table for Flexural Strength (RSM Model).
| Source | Sum of Squares (SS) | df | F-value | p-value |
| WA | 6.2184 | 1 | 2.4146 | 0.1405 |
| NS | 27.4172 | 1 | 10.6411 | 0.0024 |
| WA² | 0.5801 | 1 | 0.2252 | 0.6410 |
| NS² | 23.8191 | 1 | 9.2410 | 0.0049 |
| WA × NS | 0.2186 | 1 | 0.0847 | 0.7743 |
| Residual | 38.6374 | 15 | — | — |
| Total R² | 0.8621 | — | — | — |
| Adj. R² | 0.8163 | — | — | — |
| Std. Dev. | 0.7586 | — | — | — |
| Mean | 5.6857 | — | — | — |
| C.V. (%) | 13.3432 | — | — | — |
Disclaimer/Publisher’s Note: The statements, opinions and data contained in all publications are solely those of the individual author(s) and contributor(s) and not of MDPI and/or the editor(s). MDPI and/or the editor(s) disclaim responsibility for any injury to people or property resulting from any ideas, methods, instructions or products referred to in the content. |
© 2025 by the authors. Licensee MDPI, Basel, Switzerland. This article is an open access article distributed under the terms and conditions of the Creative Commons Attribution (CC BY) license (http://creativecommons.org/licenses/by/4.0/).
Copyright: This open access article is published under a Creative Commons CC BY 4.0 license, which permit the free download, distribution, and reuse, provided that the author and preprint are cited in any reuse.


