Submitted:
19 November 2025
Posted:
20 November 2025
You are already at the latest version
Abstract
Silicone rubber from decommissioned composite insulators has become one of the major environmental chal-lenges in the power industry due to its non-degradable nature. Therefore, the recycling and reuse of silicone rub-ber are of great environmental and economic significance. In this work, a method for preparing silica microspheres based on stepwise pyrolysis combined with post-treatment particle size fractionation is proposed. First, highly spher-ical silica microspheres were obtained by stepwise pyrolysis. Subsequently, glass fiber membrane filtration and aga-rose gel elec-trophoresis were employed as post-treatment methods to achieve particle size fractionation and en-hanced uniformity. The results indicate that the post-treated silica microspheres exhibit high uniformity, high spheric-ity, and good dispersi-bility. This method significantly improves the structural uniformity and microscopic character-istics of the microspheres, making them promising high-value fillers for epoxy resin insulation modification. Com-parative analysis with commer-cial nanosilica used as epoxy fillers shows that the recycled and fractionated silica microspheres achieve comparable improvements in breakdown strength and dielectric performance, confirming their potential for recycling and reuse in high-voltage insulation and electronic packaging applications.
Keywords:
decommissioned composite insulators
; silicone rubber recycling
; silica microspheres
; post‐treatment particle size fractionation
; insulation performance
1. Introduction
Composite insulators are widely used in power systems, particularly in high-voltage and ultra-high-voltage transmission lines [1,2,3,4]. Compared with traditional porcelain or glass insulators, composite insulators offer advantages such as low weight, high mechanical strength, and excellent corrosion resistance, which enable superior performance under harsh environmental conditions and significantly enhance the stability and safety of power transmission systems. From 2024 to 2027, large-scale equipment upgrading in power grids is expected to reach a total investment of 600 billion CNY, with more than 15 million composite insulators already in service. As the primary insulating component, silicone rubber generates approximately 6,500 tons of decommissioned waste annually, and this volume is still increasing rapidly.
The improper disposal of non-degradable silicone rubber from composite insulators not only results in material waste for power utilities but also imposes considerable environmental pressure. Therefore, how to recycle and reuse massive quantities of decommissioned silicone rubber in a green, low-carbon, and safe manner—so as to match the growing retirement scale with efficient resource recovery capacity and eventually achieve full life-cycle environmental sustainability—has become a pressing challenge for both the present and the coming years [5,6].
Conventional recycling methods for silicone rubber include mechanical pulverization, acid/alkali depolymerization, biodegradation, and high-temperature calcination. However, these methods suffer from issues such as low economic value, high energy consumption, or secondary pollution. Mechanical treatment only yields low-value rubber powder (approximately 2 CNY/kg). Acid/alkali depolymerization can produce cyclic siloxanes, but the process involves strong corrosiveness and flammable gas emissions, posing environmental and safety risks. Biodegradation requires long processing periods (typically over 30 days), and the market value of the resulting products is less than 50 CNY/kg. Overall, the low added value of recycled products is the core bottleneck restricting the large-scale reuse of waste silicone rubber [7,8,9,10,11]. In 2021, Chongqing University first proposed a stepwise pyrolysis approach to recover silicone rubber into submicron silica microspheres [12], providing a new pathway for high-value recycling. In this process, silicone rubber undergoes low-temperature thermo-oxidative cracking (300–600 °C) in a muffle furnace to generate silicon–oxygen precursors, which then self-assemble into spherical particles at higher temperatures (>600 °C), forming high-sphericity silica microspheres. Compared with traditional methods, this technique avoids toxic by-products, and the product value can reach 500–1000 CNY/kg, demonstrating remarkable economic potential. However, in practical recovery processes, problems such as broad particle size distribution, insufficient uniformity, and relatively low purity remain and require further optimization.
To address these challenges, post-treatment particle size fractionation has become a crucial step to improve the quality of silica microspheres [13,14]. Physical filtration using glass fiber membranes can effectively remove large particle impurities, narrow the particle size distribution, and increase product purity. Moreover, introducing electrophoresis-based separation techniques such as agarose gel electrophoresis enables nanometer-level classification of silica microspheres with different particle sizes, significantly enhancing particle size uniformity [15,16,17,18]. Post-treatment not only improves the uniformity, purity, and sphericity of the microspheres but also enhances their interfacial compatibility and insulation performance when used as fillers in composite materials such as epoxy resin.
In this work, waste silicone rubber is used as the raw material, and a “recovery preparation + post-treatment” technical route is proposed. First, high-sphericity silica microspheres (hereafter referred to as SiO₂ microspheres) are recovered and prepared from silicone rubber via a stepwise pyrolysis method. Then, post-treatment fractionation techniques, including glass fiber membrane filtration and agarose gel electrophoresis, are systematically investigated to evaluate their effects on the uniformity and purity of the microspheres. Furthermore, the performance differences between recycled and commercial SiO₂ microspheres in epoxy insulation modification are comparatively analyzed to assess the economic benefits of recycling SiO₂ microspheres from silicone rubber.
2. Methods
2.1. Materials and Reagents
SiO₂ microspheres were recovered and prepared from the silicone rubber, which serves as the main insulating component of naturally decommissioned composite insulators. Bisphenol-A type epoxy resin E-51 was selected as the matrix for composite preparation. Methyl tetrahydrophthalic anhydride was used as the curing agent, dimethyl phthalate as the toughening agent, and 1,2-dimethylimidazole as the accelerator. All materials and reagents were purchased from Aladdin Biochemical Technology Co., Ltd. (Shanghai, China). Commercial nanosilica used for performance comparison was provided by NanoMicro Technology Co., Ltd., with a particle size of 100 nm and a purity higher than 99.9%. The 50× TAE electrophoresis buffer was obtained from Solarbio (Cat. No. T1060), and agarose was purchased from Biowest (Cat. No. YZQZT).
2.2. Experimental Procedure
The overall preparation route for SiO₂/epoxy resin-based composite materials using recycled SiO₂ microspheres is illustrated in Fig. 1. SiO₂ microspheres with four different particle sizes (50 nm, 100 nm, 200 nm, and 500 nm) were obtained from silicone rubber via stepwise pyrolysis followed by post-treatment fractionation.
(1) Pretreatment
The silicone rubber sheds of decommissioned composite insulators were first cleaned to remove dust and surface contaminants. The silicone rubber sections were then mechanically cut and dried to obtain fine granulated raw material, improving the efficiency of subsequent recovery.
(2) Stepwise pyrolysis
After pretreatment, the cleaned silicone rubber particles were placed in a reaction chamber for stepwise pyrolysis. The heating rate of the muffle furnace was set to 20 K/min, and the temperature was gradually increased to the target calcination temperature (300 / 400 / 500 / 600 °C, etc.). The system was held at each stage for 30–240 min. Upon completion, rapid cooling was applied, and the white powder carried by the exhaust gas—identified as SiO₂ microspheres—was collected. By adjusting the temperature and holding time, the particle size of the recovered microspheres could be controlled: higher temperature and longer residence time resulted in smaller particle sizes.
(3) Glass fiber membrane filtration
For the post-treatment of the recovered SiO₂ microspheres, the powder was first dispersed ultrasonically in anhydrous ethanol to prevent agglomeration. To further enhance dispersion stability, a silane coupling agent, deionized water, and anhydrous ethanol were mixed in a volume ratio of 1:1:18, allowed to undergo hydrolysis, and then introduced into the SiO₂ suspension.
Filtration membranes with pore sizes of 0.3 μm and 0.5 μm were used. Under pressure-driven conditions, the SiO₂ microsphere suspension in deionized water passed through the membranes, allowing the removal of oversized particles and residual impurities. Ultrasonic-assisted dispersion and controlled temperature filtration were adopted to avoid membrane clogging and secondary agglomeration. Through gradient filtration, a sample with a median particle size of approximately 100 nm and a narrowed distribution range was obtained, serving as a pre-fractionated intermediate for subsequent fine separation.
(4) Agarose gel electrophoresis-based fractionation
To further improve particle size uniformity, agarose gel electrophoresis was employed to fractionate the pre-filtered SiO₂ microspheres. The agarose gel concentration was set to 0.5 wt%, and 1× TAE buffer solution was used as the electrophoretic medium. Under a horizontal electric field, SiO₂ microspheres exhibited differential migration behaviors depending on particle size: smaller particles migrated faster through the gel network, while larger ones were hindered, enabling spatial separation at different migration distances. The applied voltage was controlled within 80–120 V, and the electrophoresis duration was set to 40–60 min. After electrophoresis, the gel was imaged to visualize the fractionation profile, and distinct gel sections were excised. Particles were recovered through water rinsing and ultrasonic dispersion, yielding SiO₂ microspheres with a nearly monomodal particle size distribution.
(5) Preparation of SiO₂/EP composites
The post-treated SiO₂ microspheres were subjected to surface modification by mixing in solution, heating at 120 °C under continuous stirring and reflux for 10–24 h. The resulting suspension was vacuum dried at 60 °C, and the dried microspheres were ball-milled for 12 h to further reduce agglomeration.
The SiO₂ microspheres were then added into the epoxy resin and stirred at 50 °C for 1 h. The curing agent, toughening agent, and accelerator were added sequentially according to the ratio of epoxy resin : curing agent : toughening agent : accelerator = 100 : 80 : 10 : 1. Alternating stirring and ultrasonic dispersion were performed at 50 °C to ensure uniform dispersion.
The mixture was poured into metal molds, degassed under vacuum, and cured thermally under the same curing schedule. After cooling and demolding, circular disc samples were obtained with a diameter of 47 mm and a thickness of 1 mm. The volume fractions of SiO₂ in the SiO₂/EP composites were set to 2%, 5%, 8%, 10%, 15%, and 20%. Samples without post-treatment fractionation of SiO₂ were used as control groups.
2.3. Characterization Techniques
To comprehensively evaluate the morphology, particle size distribution, and insulation performance enhancement of recycled SiO₂ microspheres in epoxy resin, multiple characterization techniques were employed, including scanning electron microscopy (SEM), dynamic light scattering (DLS), breakdown strength testing, and dielectric property measurements.
(1) Microstructural Surface Morphology Analysis
A high-resolution scanning electron microscope (SEM; SU8600) equipped with an energy-dispersive X-ray spectroscopy (EDS) detector was used to characterize the surface morphology of the recycled SiO₂ microspheres and the SiO₂/EP composites. The accelerating voltage was set to 10 kV, and both surface topology and elemental distribution mapping were performed.
(2) Particle Size Distribution Analysis (DLS)
Dynamic light scattering (DLS) was used to analyze the particle size distribution of the recycled SiO₂ microspheres before and after post-treatment. The particle size distribution was characterized using D10, D50, and D90 to quantitatively describe the distribution boundaries:
• D10 represents the particle size below which 10% of the particles are contained, reflecting the lower boundary of fine particles in the sample.
• D50, also known as the median diameter, indicates the particle size below which 50% of the particles are distributed and serves as a representative characteristic diameter.
• D90 refers to the particle size below which 90% of the particles fall, typically used to describe the upper boundary of coarse particles.
(3) Gel Imaging System
A gel imaging system equipped with a high-resolution CCD camera, multi-wavelength light sources (UV, blue light, and white light), and dedicated optical filters was used to visualize and analyze the agarose gel electrophoresis results. The marker-stained SiO₂ microspheres were imaged to observe their migration profiles and separation performance during electrophoretic fractionation.
(4) Breakdown Voltage Test
A CS2674C withstand voltage tester was used for breakdown voltage measurements. The power supply range was 0–100 kV, and both the upper and lower electrodes had a diameter of 25 mm. The electrodes and SiO₂/EP composite specimens were immersed in insulating oil, and the voltage was increased at a rate of 1 kV/s. Breakdown voltage testing was conducted to evaluate the electrical insulation performance of the composites. By comparing breakdown voltages under different SiO₂ particle sizes and filling ratios, the enhancement effect of SiO₂ microspheres on epoxy insulation properties was assessed directly.
(5) Dielectric Property Measurement
A broadband dielectric impedance analyzer (Agilent 4294A) was used to measure the dielectric constant and dielectric loss of the SiO₂/EP composites. The frequency range during testing was 0.1 Hz–1 MHz, and all measurements were conducted at room temperature. Based on the testing results, the influence of particle size, filling concentration, and size uniformity of SiO₂ microspheres on the dielectric behavior of the composites was systematically analyzed.
3. Results and Discussion
3.1. Microstructural Characterization of Recycled SiO₂ Microspheres
Fig.2 presents the microstructural characterization of SiO₂ microspheres recovered from the silicone rubber of decommissioned composite insulators under a holding temperature of 873 K for 240 min. The EDS elemental spectrum shown in Fig. 2(d) reveals the elemental composition of the recovered product. The atomic ratio of silicon (Si) and oxygen (O) in the analyzed region is consistent with the theoretical stoichiometric ratio of SiO₂, confirming that the recovered particles are fully converted silica microspheres.
As shown in Fig. 2(c), the as-prepared SiO₂ microspheres (without agarose gel electrophoresis post-treatment) exhibit high sphericity, good dispersion, and relatively smooth surfaces. After multiple-step filtration through glass fiber membranes, large-sized particles (>1000 nm) and residual impurities generated during pyrolysis were effectively removed. However, the particle size distribution, as shown in Fig. 2(e), remained relatively broad, ranging from 50 to 150 nm, with a D50 of 97 nm and a D90 of 118 nm.
To further narrow the size distribution, electrophoretic fractionation was conducted based on the difference in surface charge and electrophoretic mobility of SiO₂ microspheres with different particle sizes. As illustrated in Fig. 3(a), by precisely controlling the applied electric field and migration time, microspheres with sizes significantly larger than 100 nm remained at the initial loading position, while particles with sizes around 100 nm and 50 nm migrated to different distances within the same electrophoretic period. This enabled high-precision nanometer-scale separation of SiO₂ microspheres. As shown in Fig. 3(b) and Fig. 3(c), after agarose gel electrophoresis treatment, SiO₂ microspheres with extremely high size uniformity were successfully obtained, achieving a D50 of 101.5 nm and a D90 of 103 nm. Compared with the pre-treated samples, the particle size distribution became significantly narrower, indicating the effectiveness of the post-treatment fractionation.
Representative samples of SiO₂/EP composites with different filling ratios are shown in Fig. 4(a–d), where the recycled SiO₂ microspheres used had a nominal particle size of 100 nm. The fracture surface of the composite containing 10 vol% SiO₂ was sputter-coated with gold and examined using SEM, and the microstructure is presented in Fig. 4(e). It can be observed that, after dispersion and post-treatment, no obvious particle agglomeration, stacking, or interconnection occurred. Most of the SiO₂ microspheres were uniformly embedded in the epoxy matrix with a monodispersed spherical morphology.
3.2. Breakdown Strength of SiO₂/EP Composites
For the statistical analysis of breakdown strength in SiO₂/EP composites, the breakdown field strength corresponding to a cumulative failure probability of 63.2% is typically defined as the characteristic breakdown strength. This value is derived based on the two-parameter Weibull distribution, as expressed in Equation (1):
Where E is the electric field strength at breakdown, PE is the cumulative probability of breakdown at field E, E₀ represents the characteristic breakdown strength corresponding to PE = 63.2%(1-e-1), and β is the shape parameter.
Fig. 5 compares the breakdown strength of SiO₂/EP composites with different particle sizes, loading levels, and particle size uniformity. As shown, the pure epoxy resin (EP) exhibits a breakdown strength of 31.3 kV/mm. Upon the incorporation of recycled SiO₂ microspheres under various conditions, the breakdown strength of the composites increased significantly. When SiO₂ microspheres with a particle size of 100 nm, a uniformity higher than 90%, and a filling fraction of 10 vol% were incorporated, the breakdown strength reached a maximum of 40 kV/mm.
From Fig. 5(a) and Fig. 5(b), it can be observed that, under the same filling ratio, SiO₂ microspheres with particle sizes of 50 nm and 100 nm exhibit a stronger enhancement effect, with the maximum increase reaching up to 27.5%. This is attributed to the nano-interface effect, where smaller particles provide a larger specific surface area. Under the same loading, a larger interfacial region is formed between the SiO₂ microspheres and the epoxy matrix, enabling more efficient trapping of charge carriers and suppressing space charge accumulation. As a result, the local electric field distribution becomes more uniform, reducing field distortion and delaying breakdown initiation.
As shown in Fig. 5(d) and Fig. 5(e), when SiO₂ microspheres with the same particle size were added, the breakdown strength of the composites increased initially and then decreased with increasing filler concentration. A peak enhancement was achieved at 8–10 vol% loading, indicating that this concentration range facilitates the formation of a continuous interfacial network with optimized particle dispersion. This network maximizes charge trapping efficiency. However, when the filler content becomes excessive, inevitable particle agglomeration introduces voids and gas-filled gaps, leading to localized partial discharge and premature breakdown.
Fig. 5(c) further shows that particle size uniformity has a noticeable influence on the breakdown strength of SiO₂/EP composites. A higher uniformity results in a more pronounced enhancement effect. Compared with commercial electronic-grade SiO₂ fillers, the post-treated recycled SiO₂ microspheres in this study achieved comparable breakdown performance after particle size refinement, demonstrating their potential as high-value functional fillers for electronic encapsulation and high-voltage insulation applications.
3.3. Dielectric Properties of SiO₂/EP Composites
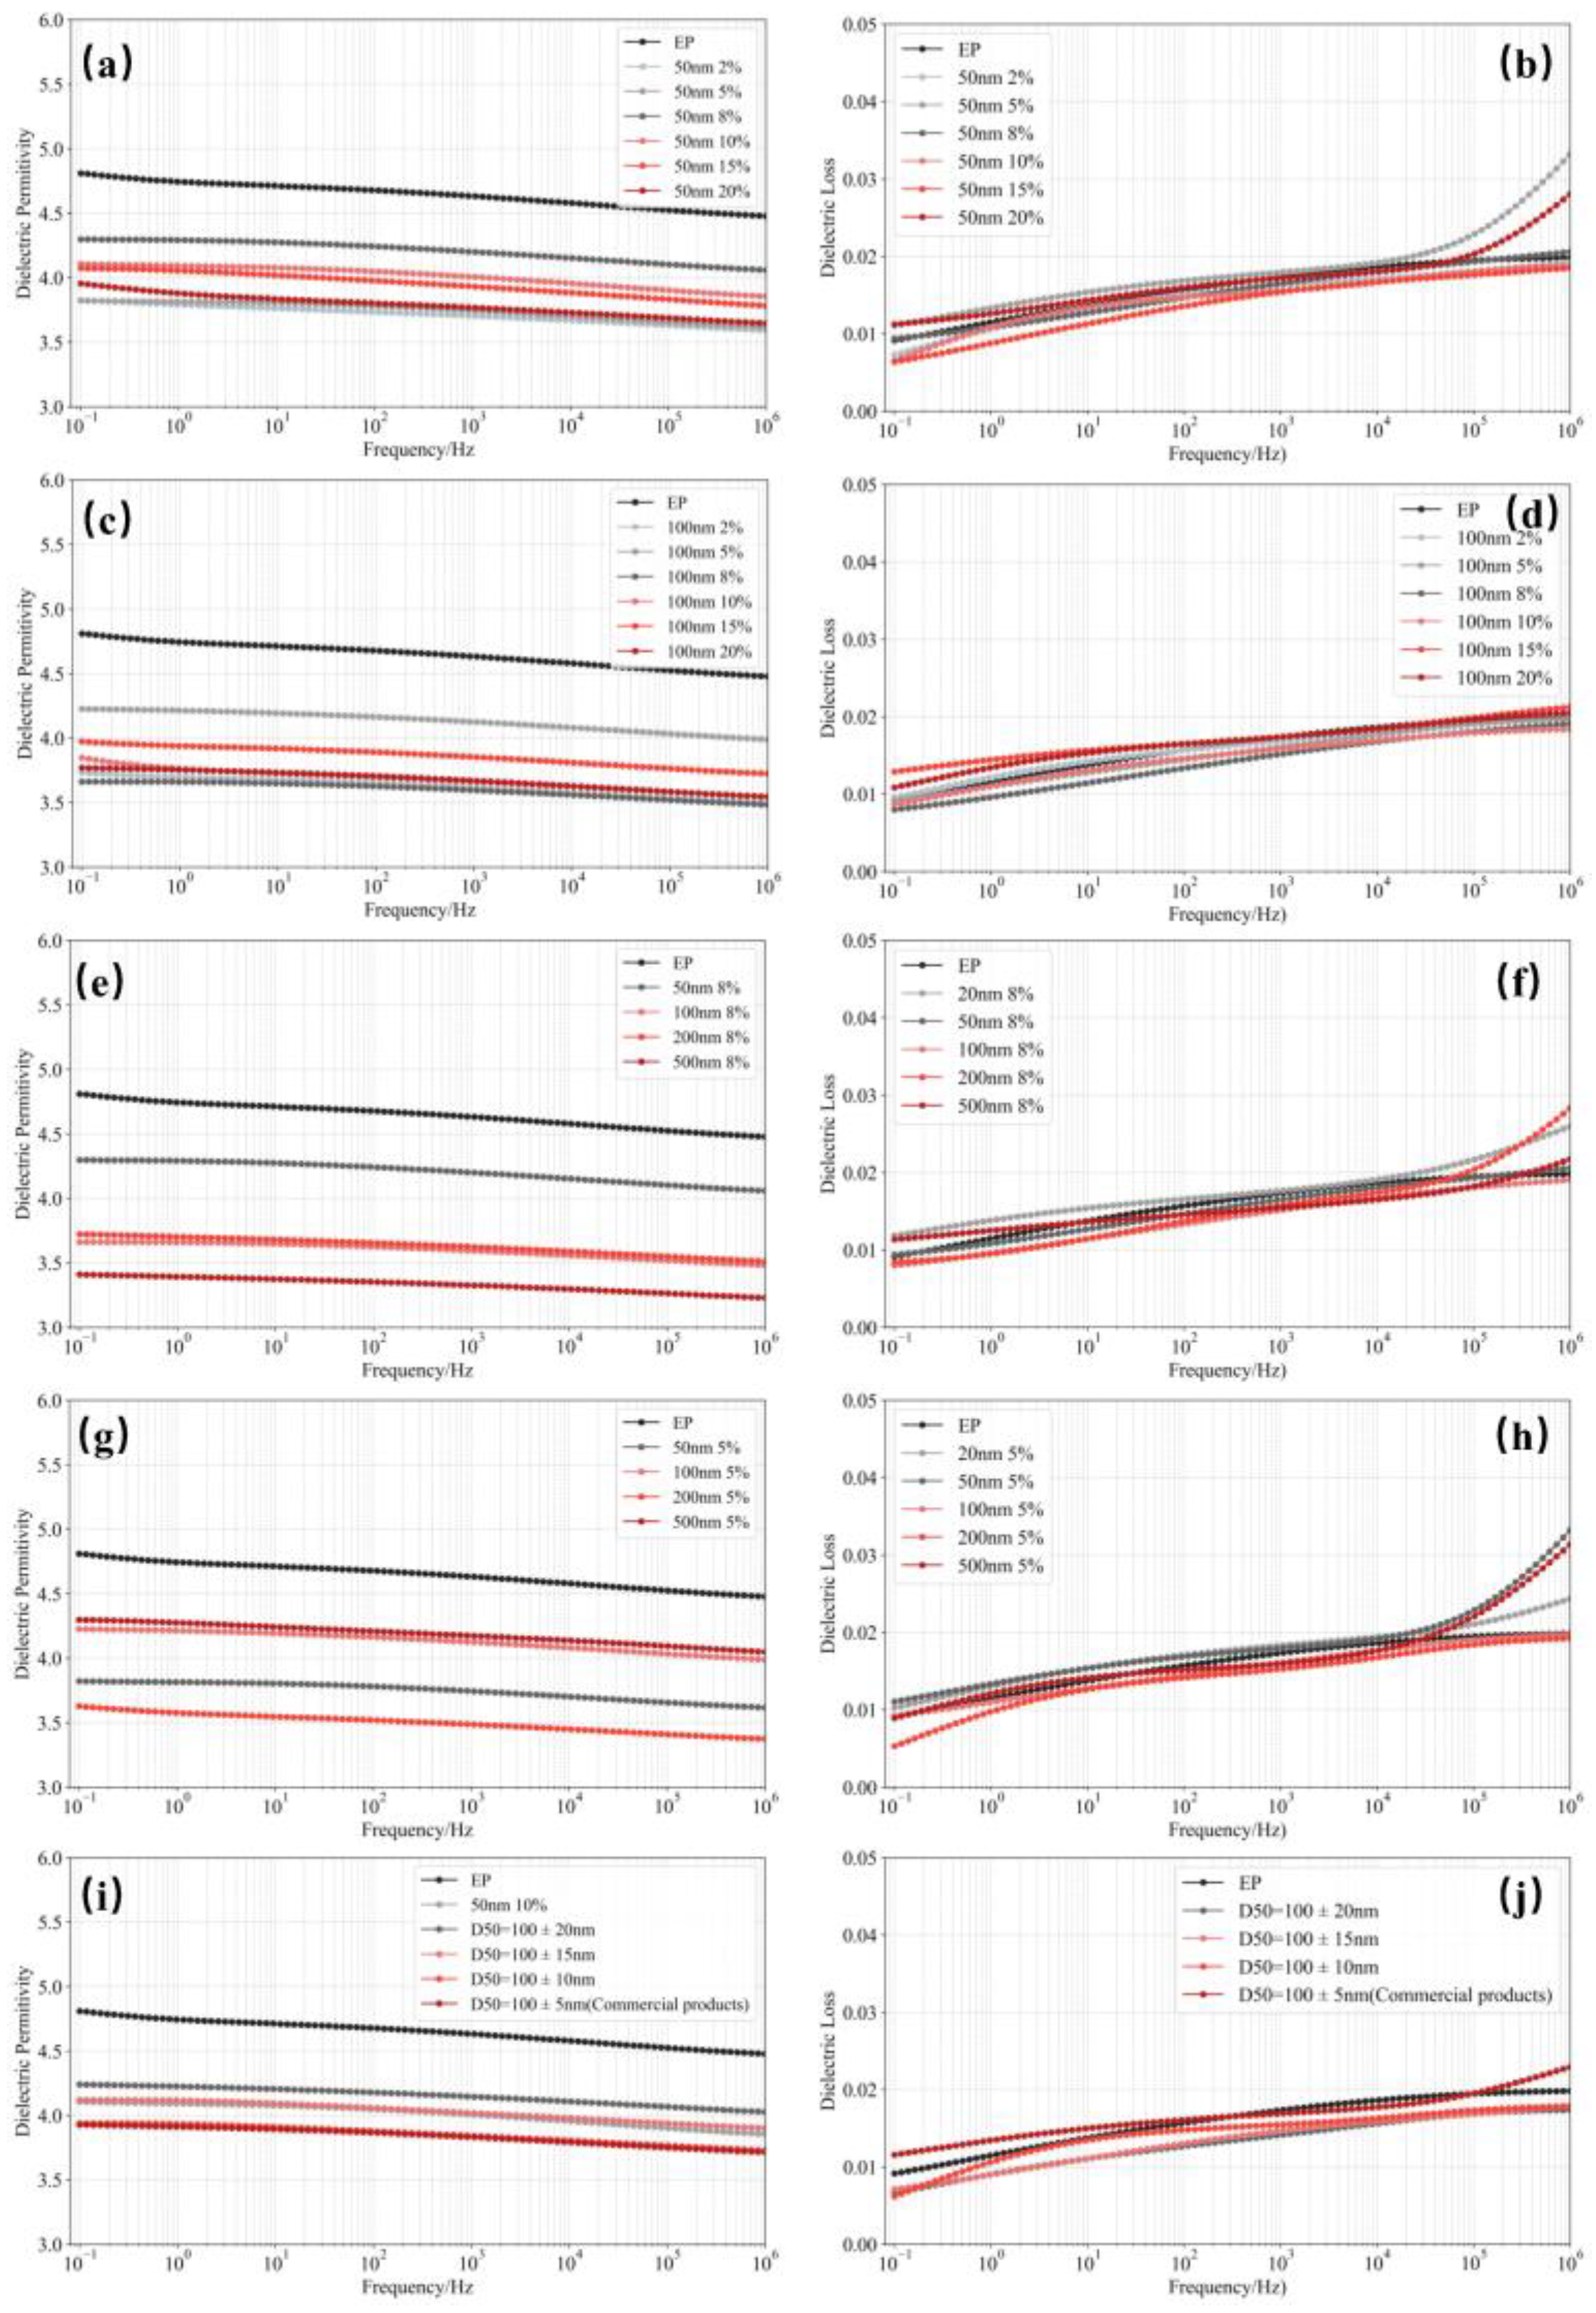
The variation in dielectric constant of SiO₂/EP composites with different filler sizes and loading fractions as a function of frequency is shown in Fig. 6. Overall, the dielectric constant of all samples decreases gradually with increasing electric field frequency, which can be attributed to the inability of dipolar polarization within the material to keep up with the rapid oscillation of the external field at high frequencies.
As shown in Fig. 6(a) and Fig. 6(c), compared with pure epoxy resin (EP), the dielectric constant of the epoxy matrix decreases after the incorporation of recycled SiO₂ microspheres at the same frequency. From Fig. 6(e) and Fig. 6(g), it is evident that composites with different SiO₂ particle sizes exhibit a similar decreasing trend in dielectric constant, and Fig. 6(i) further indicates that a higher particle size uniformity leads to a more pronounced reduction in dielectric constant. These results demonstrate that the incorporation of SiO₂ microspheres induces an overall decrease in the dielectric constant of the composites. By optimizing the particle size, loading content, and uniformity of SiO₂ fillers, the dielectric constant reduction performance of recycled SiO₂ approaches that of commercial high-purity silica, suggesting that silica recovered from decommissioned silicone rubber can meet the requirements for high-insulation-performance applications.
The dielectric loss of SiO₂/EP composites with different SiO₂ sizes and loading levels as a function of frequency is also shown in Fig. 6. As observed in Fig. 6(b), Fig. 6(d), Fig. 6(f), Fig. 6(g), and Fig. 6(k), the dielectric loss of SiO₂/EP composites fluctuates slightly with varying particle size and filler concentration compared to pure epoxy. Although the dielectric loss shows a general upward trend with increasing frequency—and increases more sharply above 100 kHz for some samples—the magnitude of variation remains limited.
This behavior is mainly due to the accelerated motion of polar molecular segments under high-frequency excitation, where increased interfacial friction generates additional heat, leading to an increase in dielectric loss. However, the introduction of SiO₂ microspheres promotes the formation of an interpenetrating polymer network structure with the epoxy matrix, which suppresses carrier mobility to a certain extent. As a result, the increase in dielectric loss remains moderate, indicating that the SiO₂/EP composites can meet the operational requirements of high-frequency electronic insulation applications.
4. Conclusions
Recovering and valorizing the non-degradable silicone rubber from decommissioned composite insulators has become one of the key pathways toward achieving green sustainability and enhancing the life-cycle environmental performance of new energy transmission systems. In this study:
1. Combined recovery + post-treatment route — By integrating stepwise pyrolysis with agarose gel electrophoresis, high-uniformity silica (SiO₂) microspheres were successfully recovered from decommissioned composite insulator silicone rubber. The resulting microspheres exhibited regular smooth spherical morphology, achieved a uniformity of up to 90%, and their diameters were controllably tuned within the 50–500 nm range.
2. Insulation performance enhancement in epoxy composites — The recycled SiO₂ microspheres were incorporated into epoxy resin to prepare SiO₂/EP composites with improved insulating properties. When the filler loading was optimized to 8–10 vol% and the particle size was either 50 nm or 100 nm, the breakdown strength increased from 31.3 kV/mm to 40 kV/mm, a rise of 27.5%. At the same time, at a given frequency, both dielectric constant and dielectric loss were reduced; the dielectric constant decreased by 8%–21%, while the dielectric loss experienced only a modest increase at high frequencies.
3. Comparable performance to commercial high-precision silica — Through comparative analysis of recycled and commercial nanosilica fillers in epoxy resin, the recycled SiO₂ microspheres from silicone rubber demonstrated essentially equivalent capability in enhancing breakdown strength and improving dielectric properties. This confirms the feasibility of achieving high-value, economically beneficial recycling of silicone rubber from retired composite insulators.
In summary, the proposed “recovery + post-treatment” strategy offers a viable route for converting decommissioned silicone rubber into functional high-performance SiO₂ fillers, thereby contributing to sustainable material reuse, value recovery, and cleaner production in the field of high-voltage insulation and electronic packaging.
Author Contributions
[Zhiling Chen]: Conceptualization, Data curation, Formal analysis, Validation, Writing–original draft, Writing–review and editing; [Li Cheng]:Funding acquisition; [Wenlong Xu]:Investigation; [Ruijin Liao]:Supervision.
Funding
This work was supported by the National Natural Science Foundation of China (Youth Science Fund, Project No. 52522707), under the theme “Diagnosis and Evaluation of Power Transmission & Transformation Equipment and Recycling and Reuse of Composite Insulation Materials.”.
Conflicts of Interest
The authors declare that they have no known competing financial interests or personal relationships that could have appeared to influence the work reported in this paper.
References
- Cao, H., Dong, R., Zhang, X. Resource treatment and green recycling application of decommissioned composite insulators in power grids. State Grid Henan Electric Power Research Institute; Henan University of Technology; Henan Enpai Hi-Tech Group Co., Ltd.; Zhengzhou Xianghe Electric Equipment Co., Ltd.; Ningbo Institute of Technology, Zhejiang University; State Grid Kaifeng Power Supply Company, 2019.
- Liu, H., Hu, R., Liu, Y. Feasibility study on overall recycling and reuse of 220 kV decommissioned composite insulator core rods. Transactions of China Electrotechnical Society 2024, 39, 3433–3443. [CrossRef]
- Li, H., Liu, D., Yao, D. Analysis and prospect of China’s power system development for carbon peak and carbon neutrality targets. Proceedings of the CSEE 2021, 41, 6245–6259. [CrossRef]
- Ma, Z., Zhang, H., Zhao, H. New mission and challenges of distribution systems for carbon peak and carbon neutrality. Proceedings of the CSEE 2022, 42, 6931–6945. [CrossRef]
- Lin, H., Dong, W., Lie, J. Study on the resource utilization of decommissioned composite insulators. New Chemical Materials 2019, 47, 240–241, 245.
- Liang, X., Gao, Y., Wang, J. Rapid development of silicone rubber composite insulators in China. High Voltage Engineering 2016, 42, 2888–2896. [CrossRef]
- Hussain, S.; Zhao, Z.; Song, Y.; Zhang, C. Effect of SiO Surface Modification on the Filler-Reinforced Interfaces in SiO-Filled Functional Styrene Butadiene Rubber Composites. Journal of Applied Polymer Science 2023, 140, e54401. [CrossRef]
- Zhang, S.; Tang, N.; Cao, L.; Yin, X.; Yu, J.; Ding, B. Highly Integrated Polysulfone/Polyacrylonitrile/Polyamide-6 Air Filter for Multilevel Physical Sieving Airborne Particles. ACS Appl. Mater. Interfaces 2016, 8, 29062–29072. [CrossRef]
- Yang, S.; Liu, Y.; Zhou, D. Monomer Recovery and Nano-Silica Separation From Biodegraded Waste Silicone Rubber Shed of Composite Insulator. Front Mater 2022, 9, 863731. [CrossRef]
- Sabirova, A.; Florica, C.F.; Pisig, F.; Syed, A.; Buttner, U.; Li, X.; Nunes, S.P. Nanoporous Membrane Fabrication by Nanoimprint Lithography for Nanoparticle Sieving. Nanoscale Adv. 2022, 4, 1119–1124. [CrossRef]
- Akbulut, O.; Mace, C.R.; Martinez, R.V.; Kumar, A.A.; Nie, Z.; Patton, M.R.; Whitesides, G.M. Separation of Nanoparticles in Aqueous Multiphase Systems through Centrifugation. Nano Lett. 2012, 12, 4060–4064. [CrossRef]
- Chen, R.; Cheng, L.; Liu, Y.; Yu, L.; Liao, R.; Wang, T. Synthesis of High-purity Mesoporous Nanosilica Microspheres from Retired Composite Insulators Based on Orthogonal Experiment. High Voltage 2022, 7, 1111–1122. [CrossRef]
- Hendrix, D.; Wille, K. Stabilizing Dispersed Colloidal Nanosilica Exposed to an Ultra-High Performance Concrete Environment. Construction and Building Materials 2023, 409, 133975. [CrossRef]
- A Novel Silica Nanowire-Silica Composite Aerogels Dried at Ambient Pressure. Mater Design 2017, 115, 415–421. [CrossRef]
- Shojaei, M.R.; Pircheraghi, G.; Alinoori, A. Sustainable SBR/Silica Nanocomposites Prepared Using High-Quality Recycled Nanosilica from Lead-Acid Battery Separators. Journal of Cleaner Production 2022, 370, 133316. [CrossRef]
- Wang, R.; Xie, C.; Luo, S.; Gou, B.; Xu, H.; Zeng, L. The Influence Mechanism of Nanoparticles on the Dielectric Properties of Epoxy Resin. Rsc Adv 2019, 9, 19648–19656. [CrossRef]
- Yang, G.; Cui, J.; Ohki, Y.; Wang, D.; Li, Y.; Tao, K. Dielectric and Relaxation Properties of Composites of Epoxy Resin and Hyperbranched-Polyester-Treated Nanosilica. Rsc Adv 2018, 8, 30669–30677. [CrossRef]
- Xie, Q.; Cheng, Y.; Chen, S.; Wu, G.; Wang, Z.; Jia, Z. Dielectric and Thermal Properties of Epoxy Resins with TiO2 Nanowires. J. Mater. Sci.-Mater. Electron. 2017, 28, 17871–17880. [CrossRef]
Figure 1.
Process for recycling and reusing SiO2 microspheres from retired composite insulator silicone rubber.
Figure 1.
Process for recycling and reusing SiO2 microspheres from retired composite insulator silicone rubber.
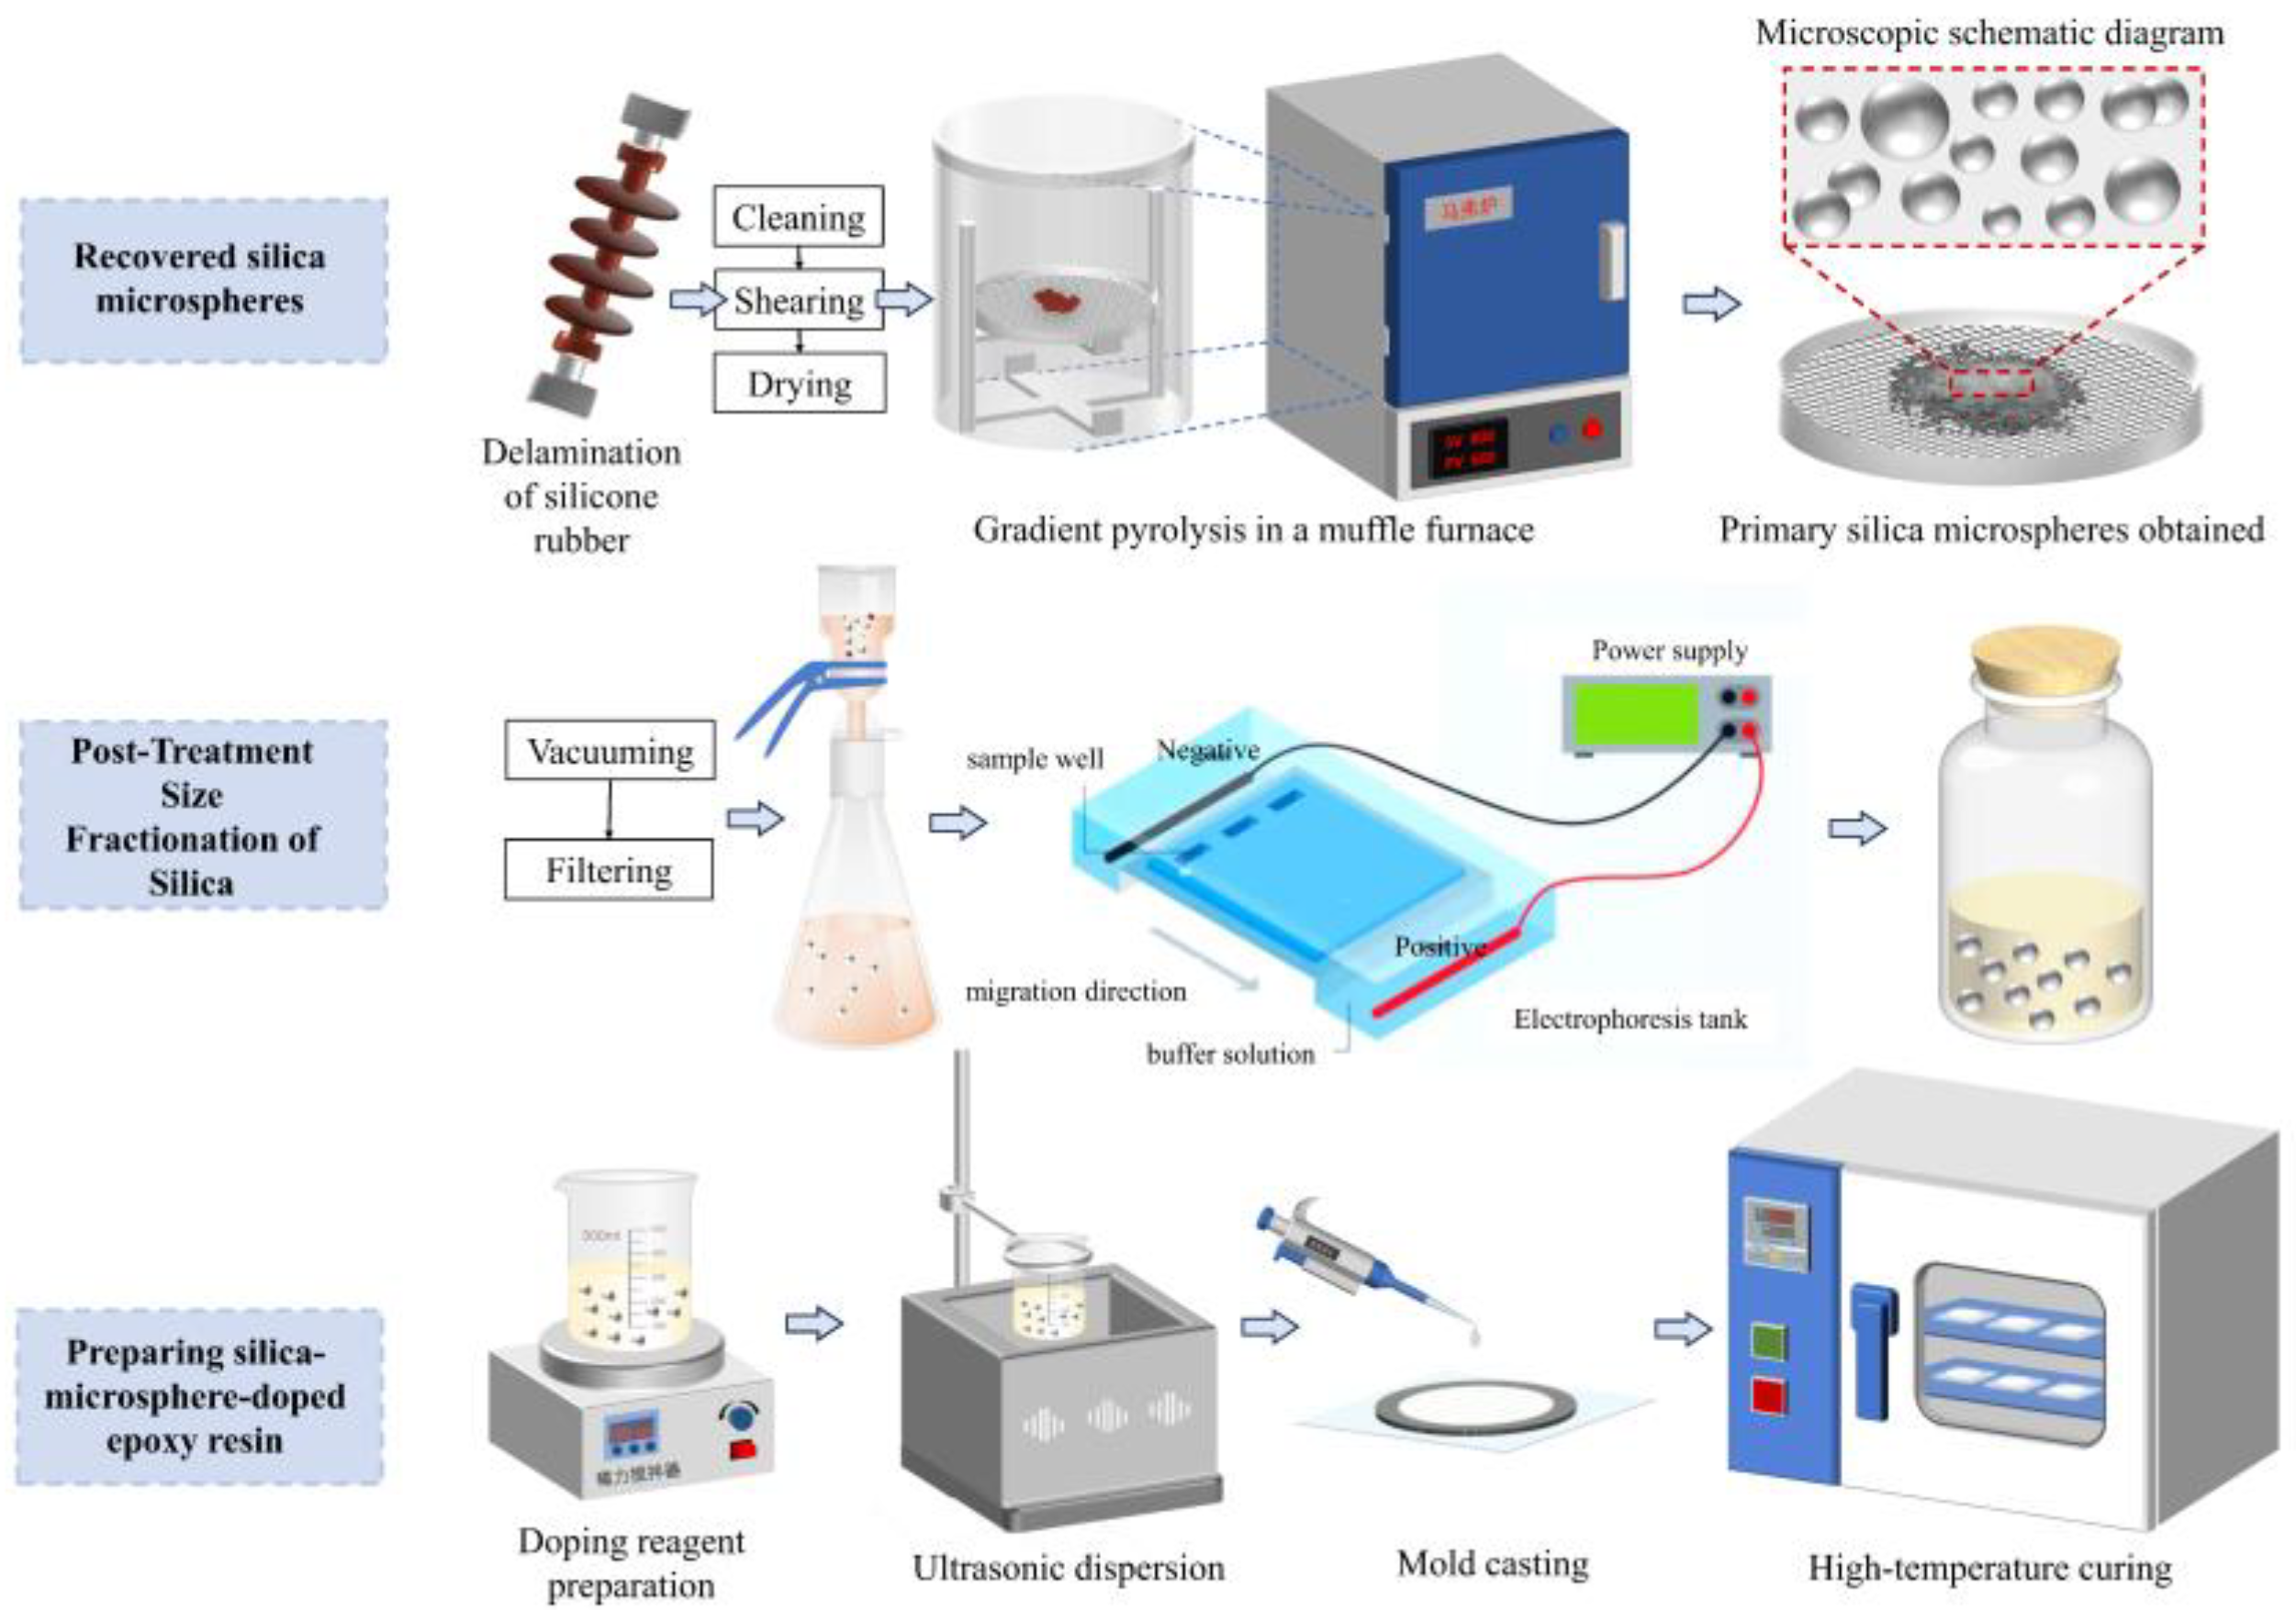
Figure 2.
Microscopic characterization of SiO2 microspheres - Before post-treatment (a) Silicone rubber from retired insulators (b) SiO2 microspheres obtained through recycling (white powder) (c) SEM characterization (d) Particle size distribution (e) EDS component analysis.
Figure 2.
Microscopic characterization of SiO2 microspheres - Before post-treatment (a) Silicone rubber from retired insulators (b) SiO2 microspheres obtained through recycling (white powder) (c) SEM characterization (d) Particle size distribution (e) EDS component analysis.
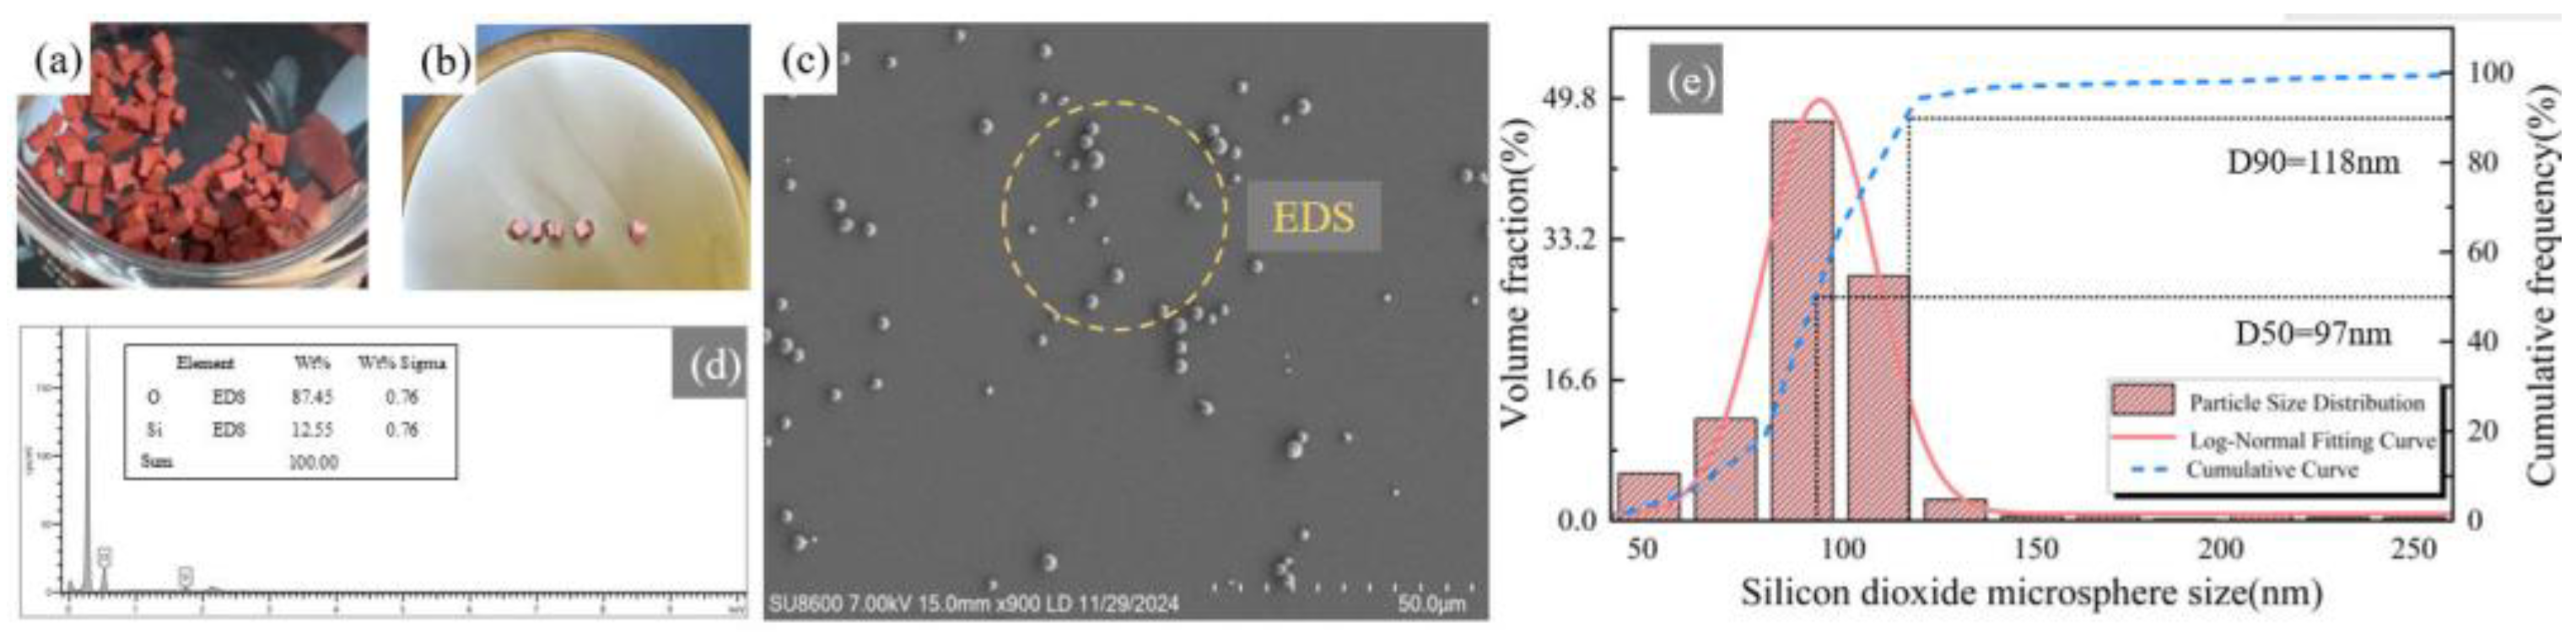
Figure 3.
Microscopic characterization of SiO2 microspheres - Post-treatment after gel electrophoresis (a) Gel electrophoresis imaging result (b) SEM characterization (c) Particle size distribution.
Figure 3.
Microscopic characterization of SiO2 microspheres - Post-treatment after gel electrophoresis (a) Gel electrophoresis imaging result (b) SEM characterization (c) Particle size distribution.
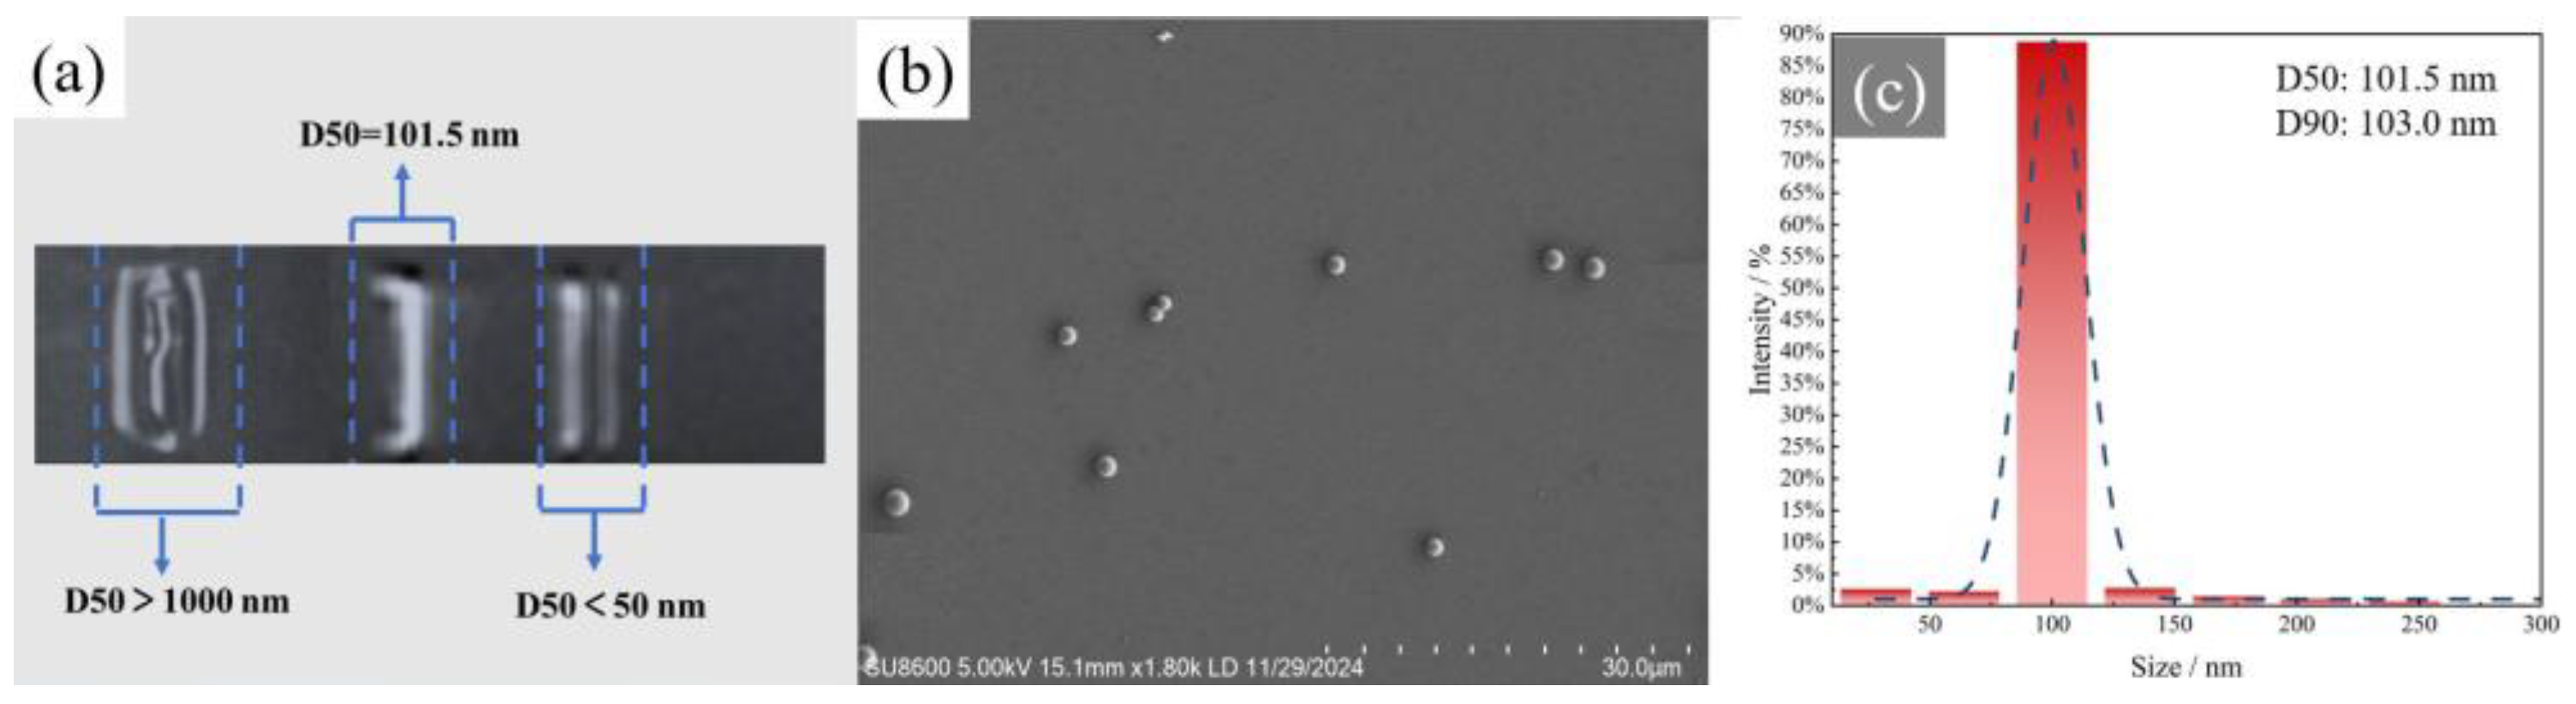
Figure 4.
Microscopic characterization of SiO2/EP composite materials (a) Pure EP sample (b) 2% SiO2/EP sample (c) 5% SiO2/EP sample (d) 10% SiO2/EP sample (e) 10% SiO2/EP sample SEM characterization.
Figure 4.
Microscopic characterization of SiO2/EP composite materials (a) Pure EP sample (b) 2% SiO2/EP sample (c) 5% SiO2/EP sample (d) 10% SiO2/EP sample (e) 10% SiO2/EP sample SEM characterization.
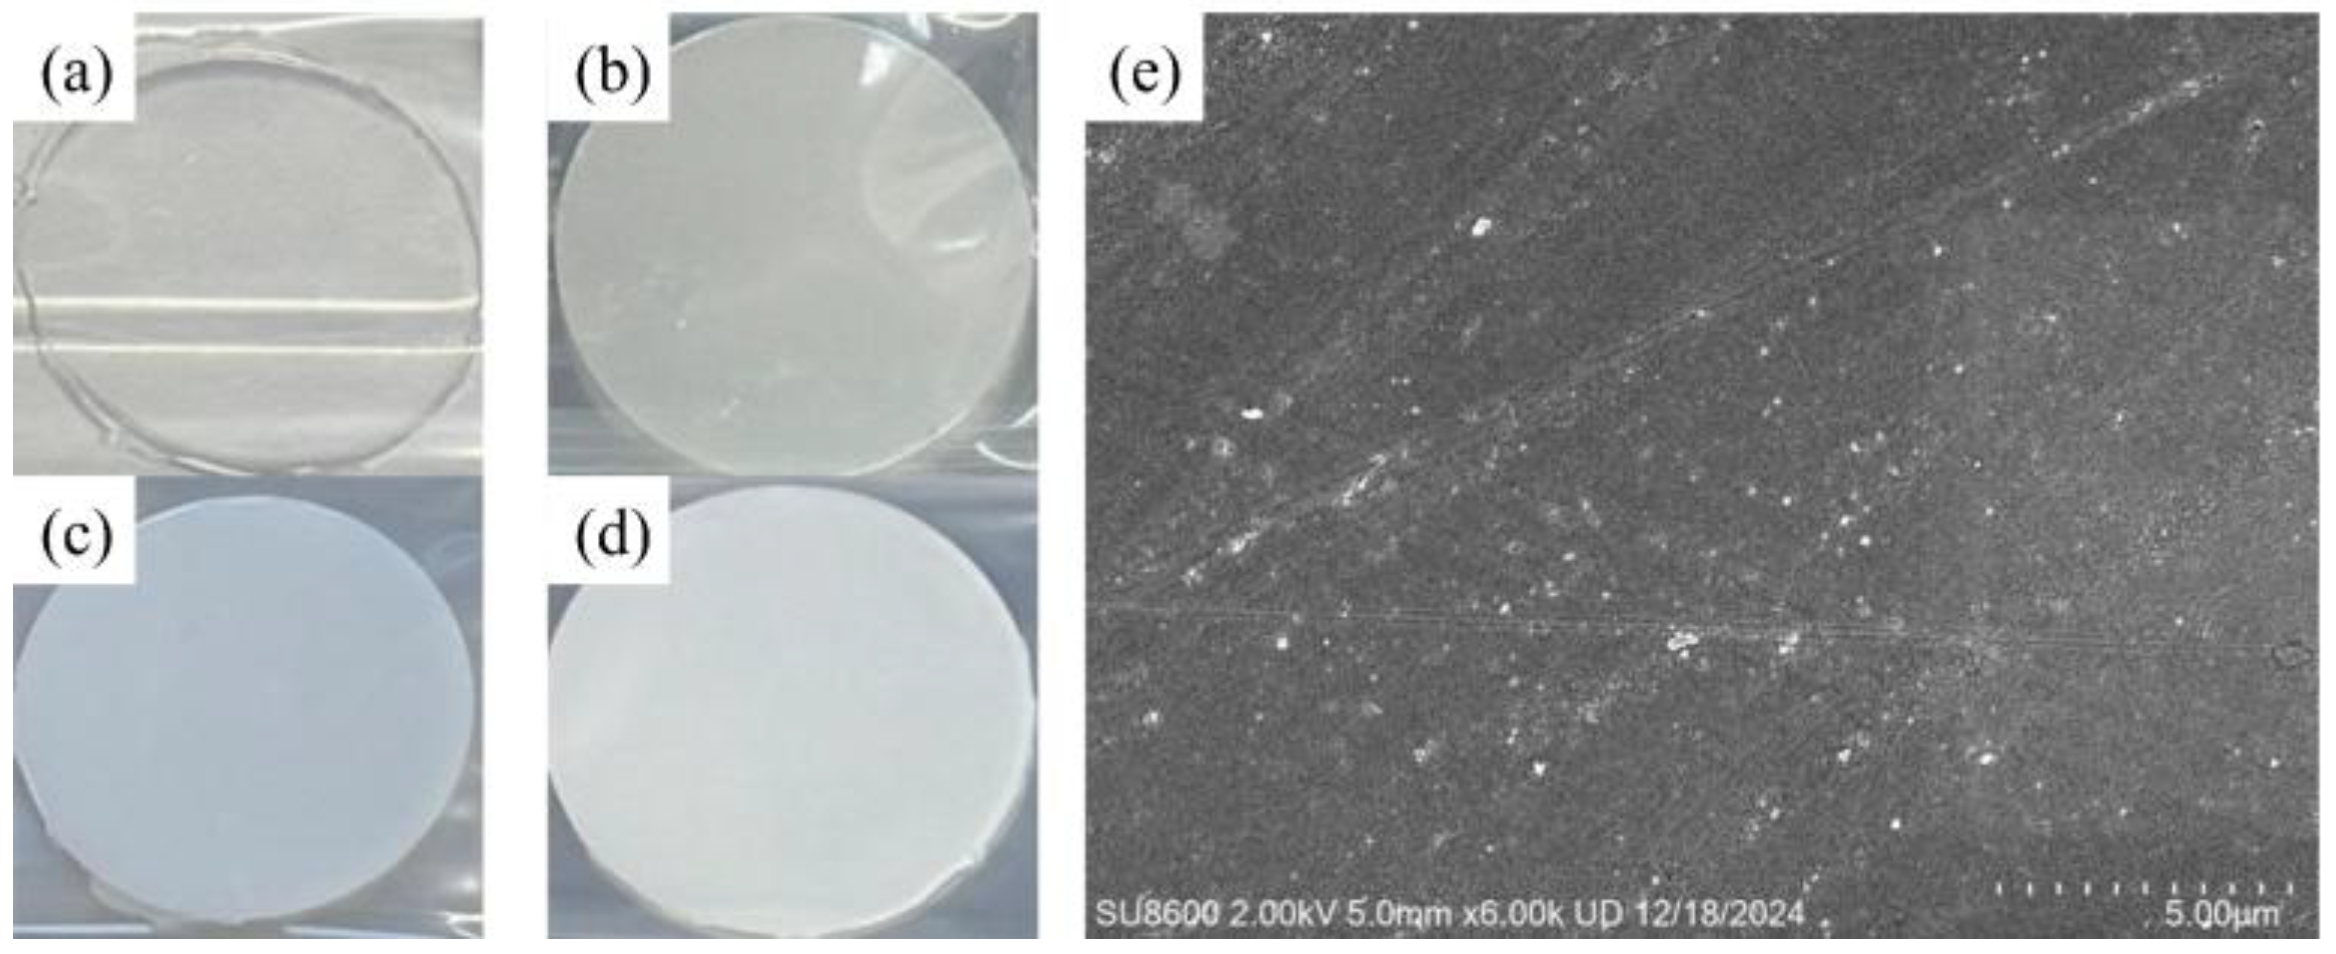
Figure 5.
Comparison of breakdown strength of SiO₂/EP composites. (a) Breakdown strength of epoxy resin filled with 5 vol% SiO₂ microspheres of different particle sizes. (b) Breakdown strength of epoxy resin filled with 8 vol% SiO₂ microspheres of different particle sizes. (c) Breakdown strength of epoxy resin filled with SiO₂ microspheres with different particle size uniformities. (d) Breakdown strength of epoxy resin filled with different concentrations of 50 nm SiO₂ microspheres. (e) Breakdown strength of epoxy resin filled with different concentrations of 100 nm SiO₂ microspheres.
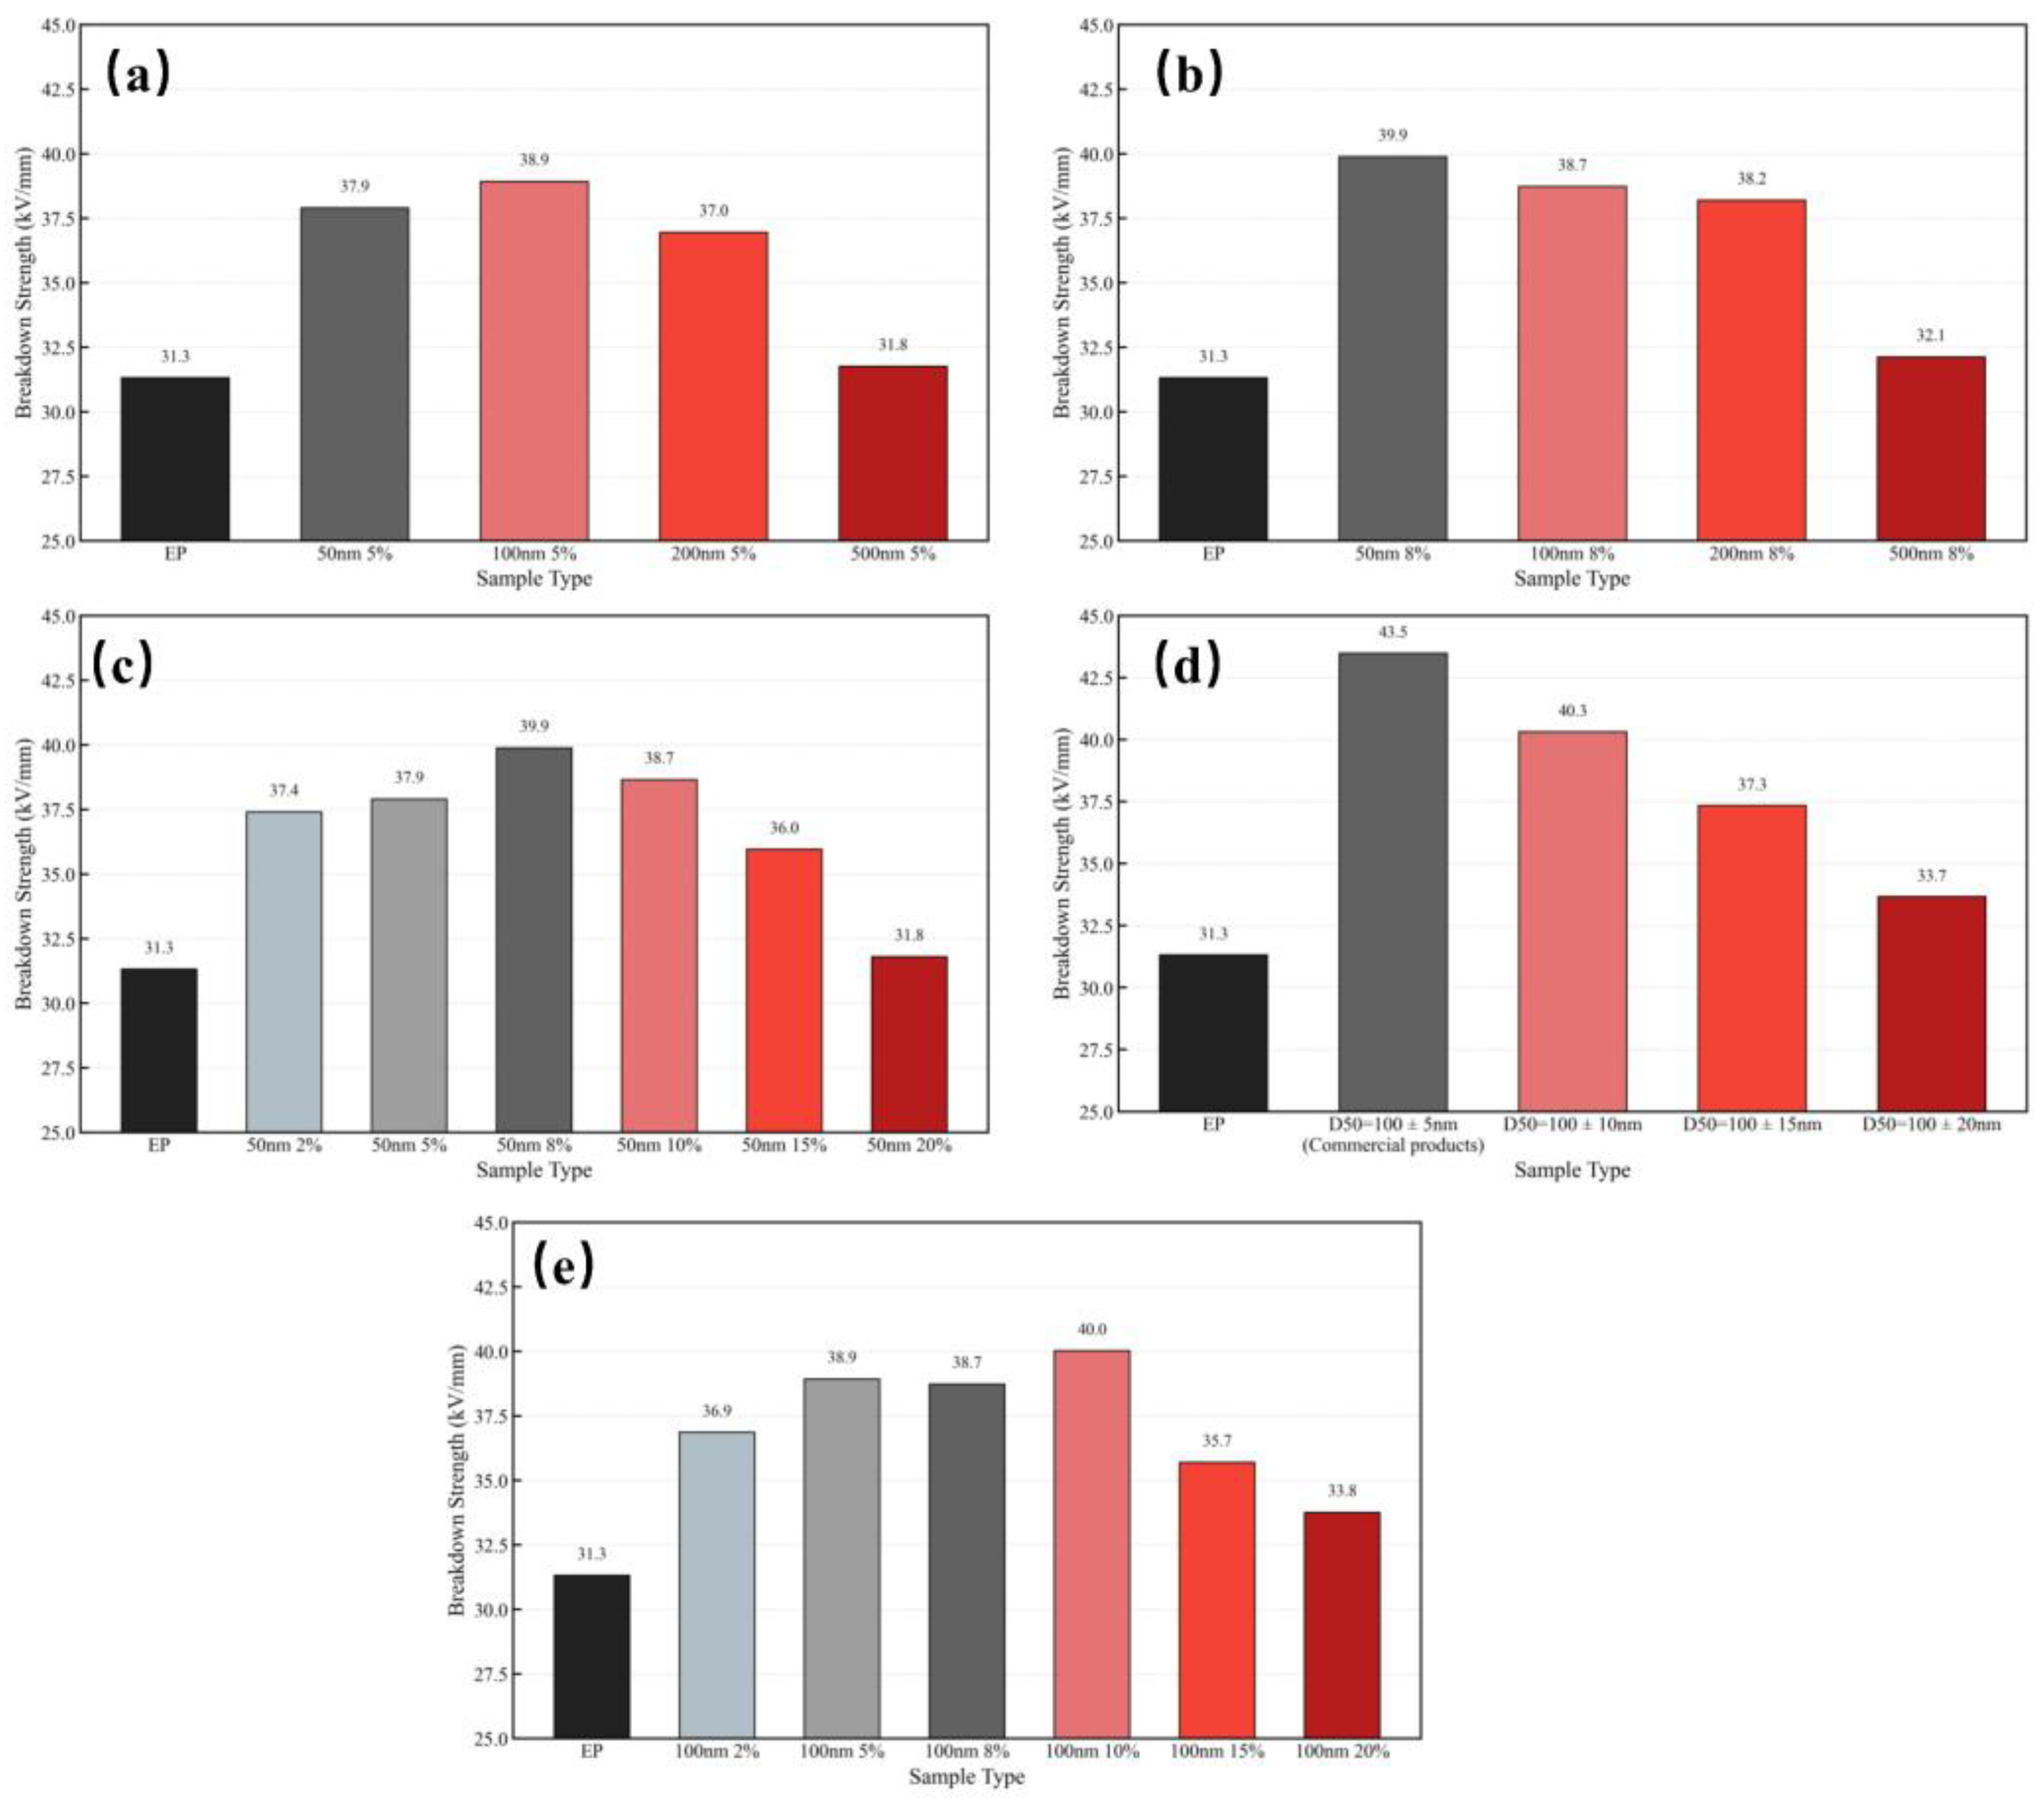
Figure 6.
Frequency-dependent dielectric constant and dielectric loss of SiO₂/EP composites. (a) Dielectric constant of epoxy resin filled with different concentrations of 50 nm SiO₂ microspheres. (b) Dielectric loss of epoxy resin filled with different concentrations of 50 nm SiO₂ microspheres. (c) Dielectric constant of epoxy resin filled with different concentrations of 100 nm SiO₂ microspheres. (d) Dielectric loss of epoxy resin filled with different concentrations of 100 nm SiO₂ microspheres. (e) Dielectric constant of epoxy resin filled with 8 vol% SiO₂ microspheres of different particle sizes. (f) Dielectric loss of epoxy resin filled with 8 vol% SiO₂ microspheres of different particle sizes. (g) Dielectric constant of epoxy resin filled with 5 vol% SiO₂ microspheres of different particle sizes. (h) Dielectric loss of epoxy resin filled with 5 vol% SiO₂ microspheres of different particle sizes. (i) Dielectric constant of epoxy resin filled with SiO₂ microspheres of different particle size uniformities. (j) Dielectric loss of epoxy resin filled with SiO₂ microspheres of different particle size uniformities.
Disclaimer/Publisher’s Note: The statements, opinions and data contained in all publications are solely those of the individual author(s) and contributor(s) and not of MDPI and/or the editor(s). MDPI and/or the editor(s) disclaim responsibility for any injury to people or property resulting from any ideas, methods, instructions or products referred to in the content. |
© 2025 by the authors. Licensee MDPI, Basel, Switzerland. This article is an open access article distributed under the terms and conditions of the Creative Commons Attribution (CC BY) license (http://creativecommons.org/licenses/by/4.0/).
Copyright: This open access article is published under a Creative Commons CC BY 4.0 license, which permit the free download, distribution, and reuse, provided that the author and preprint are cited in any reuse.


