
Submitted:
18 November 2025
Posted:
19 November 2025
You are already at the latest version
Abstract
Identifying superior genotypes in multi-environment trials is crucial for accelerating cultivar improvement and breeding innovation. This study evaluated the yield potential of 29 maize hybrids (including the control) across 10 trial locations in mid-to-high altitude regions of Yunnan Province from two growing seasons (2023-2024), aiming to recommend high-yielding, stable, and widely adapted maize varieties. Analysis of variance indicated that genotype, environment, and their interaction all had highly significant effects (p < 0.001) on maize yield, with environmental factors accounting for the primary source of variation. Yield mean analysis identified the top-performing hybrids annually: in 2023, these were G28, G13, G22, G3, G10, G9, and G27; in 2024, they included G5, G13, G4, G2 G27, G22 and G26. The GGE biplot analysis identified E2 (Binchuan), E5 (Lijiang), E7 (Shilin), and E8 (Xuanwei) as optimal testing environments. Among elite genotypes, G22 (LS-2305), G9 (LS-2303), and G13 (YR-399) exhibited consistent high yields and stability across years, with G13 (YR-399) emerging as the most outstanding. Therefore, these findings confirm that the GGE biplot method is effective for screening high-yielding, stable varieties and identifying representative test environments, thereby providing a scientific foundation for maize breeding work in the region.
Keywords:
maize
; GGE biplot
; G×E interaction
; adaptability
; stability
1. Introduction
Maize (Zea mays L.) originated in Central America and was introduced to Europe and other continents following Columbus's voyages in the late 15th century [1]. With an annual global planting area of about 197 million hectares, positioning it as the world's second most widely planted crop after wheat [2]. China contributes 23% of the global maize supply while accounting for 21% of the world's maize cultivation area [3]. Maize yield serves as a critical indicator of a country or region's economic performance and is closely linked to national and regional food security [4]. Given the widespread issues of cropland occupation and fragmentation[5,6], selecting suitable maize varieties and improving yield per unit area are essential for ensuring food security [7].
In multi-site trials for crop breeding, evaluating yield potential and stability plays a decisive role in assessing and promoting new varieties [8]. Variety stability primarily stems from genotype-by-environment (G × E) interaction effects[9]. However, significant G×E interaction limits single-environment variety recommendations, requiring multi-environment testing for yield stability evaluation [10,11,12]. Therefore, G × E analysis can effectively assess the stability and adaptability of genotypes in terms of yield and yield-related traits [13,14]. Currently, the AMMI model and the GGE biplot are widely used for investigating and interpreting G×E interaction [15,16,17]. The AMMI model can estimate the contributions of genotype (G), environment (E), and genotype-by-environment interaction (GEI) effects on yield [18]. Compared to the AMMI model, the GGE biplot offers superior interpretability and is specifically designed to visualize and dissect GEI patterns in multi-environment studies [19]. And it is widely considered a preferred method for analyzing large-scale environmental impacts, assessing genotypes, associating traits, and examining hybridization pattern [20,21]. The GGE biplot was employed to visualize the GEI, with the goal of identifying high-yielding varieties and selecting genotypes that exhibit both ability and adaptability to the target environments [22,23]. And the GGE biplot model has been widely used to analyze high yield and yield stability in crops, like maize, rice, oats, wheat, and sugarcane in recent years [24,25,26,27,28,29,30]. Hence, in large-scale environmental analyses and genotype evaluations, the GGE biplot offers advantages over the AMMI biplot [30].
Yunnan is characterized by a complex and heterogeneous ecological landscape, where diverse maize varieties have adapted to distinct regional conditions. Consequently, understanding the performance of various genotypes and their interactions with the environment is paramount for shaping future breeding initiatives. This study employed the GGE biplot to conduct a detailed analysis of multi-environment yield trials across Yunnan, with the goal of identifying representative and stable varieties as well as optimal cultivation environments. These findings will not only support the advancement and dissemination of improved maize cultivars but also serve as a valuable guide for farmers in making informed planting decisions.
2. Materials and Methods
2.1. Experimental Materials, Sites, and Design
The trial involved 29 maize genotypes (Table 1) and was conducted over two years (2023–2024) at 10 experimental sites in mid-to-high altitude regions of Yunnan Province (Table 2, Figure 1). The experiment used a randomized complete block design with three replications. Management aligned with local farmers' practices. Each 20 m² plot had alternating wide (0.9 m) and narrow (0.4 m) rows, with plant spacing at 0.25 m, giving a density of 4,105 plants per hectare. Maize was seeded in late April to early May. Fertilization included 30 kg of compound fertilizer per mu as base, mixed with 1.4 kg of phoxim for pest control, and 30 kg of urea per mu was top-dressed later.
2.2. Trait measurement
During the growing seasons of 2023 and 2024, data was collected on the yield and agronomic traits of 29 maize varieties in 10 sites. Traits included ear length, ear diameter, bald tip length, Kernels per row, hundred-kernel weight, kernel output rate, ear kernel weight, growth duration, plant height, and ear height. For plant height and ear height, healthy and disease-free plants were prioritized. Plant height was measured at the full maturity using a tape from the ground to the tassel top, while the ear height was recorded from the ground to the primary ear's node. Ear height was measured from the ground to the node where the primary ear is located. Growth duration was counted as the days from emergence to the maturity. Traits such as ear length, ear diameter, bald tip length, and kernel per row were manually measured post-examination, while the kernel output rate and yield were calculated according to the following formulas.
kernel output rate = (Grain dry weight / Fresh ear weight) × 100%;
Maize yield (kg/ha) = (Yield per unit area (kg) / Unit area (m²)) × 10,000 (m²/ha)
2.3. Data Analysis
We managed data and performed descriptive statistics in Microsoft Excel. All analyses were conducted in R version 4.2.3. We utilized the agricolae package for ANOVA and GGEBiplotGUI package for GGE biplot analysis. The GGE biplot, generated via PCA, visualized genotypes (G) effected and G×E interactions based on the first two principal components [13].
3. Results
3.1. Variance Analysis (ANOVA) for Maize Yield
The combined ANOVA for 29 maize hybrids across 10 locations showed that the genotype (G), environment (E), and their interaction (GEI) had highly significant impacts (p < 0.001) on maize yield in both evaluation years (Table 3 and Table 4). Furthermore, the trial environments explaining 63.79% and 64.15% of the total variation in 2023 and2024, respectively.
3.2. Comprehensive Visualization of Yield Bar Chart and Yield-Environment-Cultivar Relationships Heatmap
Maize yield performance was assessed in Figure 2 and Figure 3. In 2023, the highest-yielding varieties were G28, G13, G22, G3, G10, G9 and G27 (Figure 2a), while in 2024, G5, G13, G4, G2, G27, G22 and G26 emerged as the top performers (Figure 2b). The heatmap of the two-year average yield revealed significant environmental variations in yield (Figure 3). Among the varieties, G3, G10, G2, G11, G9, G22, G27, G13 and G28 had the highest yields. Locations E5, E8, E1and E7 were identified as optimal for cultivating high-yield maize.
3.3. Analysis of Correlation Between Agronomic Traits and Yield
In 2023, grain weight per ear showed a strong positive correlation with yield, and a positive correlation with plant height, while kernel output rate, growth period, and plant height exhibited weak correlations with yield (Figure 4a). In 2024, yield demonstrated weak correlations with ear diameter, hundred-kernel weight, growth duration, and plant height, whereas kernel output rate was positively correlated with ear length (Figure 4b). However, most agronomic traits generally demonstrated weak or negligible correlations with yield, suggesting that these traits may have limited direct influence on yield.
3.4. GGE Biplot Analysis
3.4.1. Relationship among test environments
In the Figure 5, AXIS1 and AXIS2 represent the first two principal components, which account for the variation in maize hybrid yield across 10 environments in 2023 (61.98%) and in 2024 (63.62%). The GGE biplot evaluates the relationships among environments. Small angles (E4 and E7, E2 and E5, and E3 and E8) indicated strong environmental correlations, suggesting similar rankings of maize genotypes within these paired environments. In contrast, the angle between E6 and E8 was greater than 90°, indicating uncorrelated genotypic performance between these two environments (Figure 5a). Similarly, the smallest angles were observed between E1 and E5, as well as among E7, E6, and E8, reflecting the highest environmental correlations. Conversely, the angle between E2 and E10 was more than 90° indicating weak genotypic correlation between these environments (Figure 5b).
3.4.2. Selection of ideal test environments
The GGE biplot of "Discriminating Ability vs. Representativeness" view and environmental ranking view across 10 test environments were displayed in Figure 6 and Figure 7, respectively. In 2023, Environments E6, E2, and E5 had the longest vectors, indicating the strongest discriminative power. Relative to the AEC abscissa, E1, E2, and E5 showed the smallest angles, suggesting their high environments representativeness (Figure 6a). And E1, E2, and E5 were in a smaller concentric circle and could be identified as the top-ranked test environments (Figure 7a). Therefore, E2 (Binchuan) and E5(Lijiang) were identified as ideal test environments with both strong discriminative power and high representativeness in 2023. In 2024, E5 and E7 displayed the longest vectors, indicating the strongest discriminative power, while E8 showed relatively weaker genotype differentiation compared to E5 and E7 but remained a suitable test environment. E6, E7, and E8 had the smallest angles relative to the AEC abscissa, indicating their high representativeness (Figure 6b). And E7 and E8 were the top-ranked test environments because the concentric circles closest to the center of the circle. Consequently, E7(Shilin) and E8(Xuanwei) were identified as ideal test environments in 2024.
3.4.4. Screening of elite cultivars under test environments
The polygon view of the GGE biplot revealed the "which-won-where" pattern of yield performance among 29 maize varieties, with the vertices of the polygon representing the winning genotypes in their respective environmental groups (Figure 8). In 2023, G27, G28, and G3 demonstrated optimal performance in their respective test environments. Moreover, the location of G13 was infinitely close to that of G28, so it can also be regarded as the most promising variety. In 2024, genotypes G27, G5, and G2 exhibited superior performance, with G13 and G22 continuing to show excellent potential in specific sectors. This indicated that G27(SS-2205) and G13(YR-399) had ultimately emerged victorious, emerging as the key candidate for further research and potential commercialization.
3.4.5. Selection of varieties with high stability and productivity
The stability view reflects varietal productivity and stability. Shorter perpendicular distances from the varieties to the AEC indicate higher stability, while smaller concentric circles in the ranking view signify superior varieties (Figure 9). In 2023, G28, G13, G22, G9 and G10 demonstrated the optimal balance between productivity and stability (Figure 9a, Figure 10a). In 2024, G5, G13, G22, G4 and G9 exhibited excellent stability and productivity (Figure 9b, Figure 10b). Therefore, G13(YR-399), G22(LS-2305) and G9 (LS-2303) displayed relatively high stability and productivity over two years.
4. Discussion
4.1. Yield Variance Analysis
The environmental factors accounted for a larger proportion of variation compared to genotypic effects and genotype-by-environment interaction effects, highlighting the paramount role of the environmental condition in shaping yield performance. And this also underscored the necessity of evaluating genotypes across diverse environments to ensure the robustness and reliability of results (Table 3 and Table 4). Similar findings have been documented in previous studies by Ma et al. (2024), Taak et al. (2025), Gonçalves et al. (2025) and Liu et al. (2022) [17,31,32,33]. Furthermore, the effects of environment, genotype, and their interaction on maize yield were all statistically significant at the extremely high levels (p < 0.001). These results aligned with recent research by Zendrato et al. (2025), Neelam et al. (2025), and Nišavić et al. (2025) [34,35,36], confirming that the performance of maize genotypes was strongly modulated by specific environmental conditions. Consequently, the application of the GGE biplot analysis for yield evaluation is methodologically validated.
4.2. Evaluation of Ideal Test Environments
Heatmap analysis identified E5 (Lijiang), E8 (Xuanwei), E1 (Baoshan), and E7 (Shilin) as optimal environments for evaluating high-yielding genotypes (Figure 3). It was worth noting that the three locations E5 (Lijiang), E8 (Xuanwei) and E7 (Shilin) were highly consistent with the ideal environment results obtained by the GGE biplot (Figure 6, Figure 7). This mutual validation of analytical methods has also been confirmed in the studies by Zhang et al. (2016) and Nišavić et al. (2025) [20,37]. Yan et al. (2021) and Li et al. (2023) emphasized that the efficacy and precision of cultivar selection were markedly influenced by the discriminating discriminatory capacity of test environments[38,39], reinforcing the importance of selecting appropriate trial locations. In this study, E2 (Binchuan) and E5 (Lijiang) in 2023, alongside E7 (Shilin) and E8 (Xuanwei) in 2024, were identified as the most suitable ideal test environments for cultivar evaluation (Figure 6, Figure 7). Furthermore, Ma et al. (2024) and Liu et al. (2022) validated that Binchuan, Shilin, and Xuanwei were relatively ideal environments [17,33], which was highly consistent with the ideal environments identified in our study. As highlighted by Mullualem et al. (2024), Kona et al. (2024) and Tiwari et al. (2025) the delineation of representative environments necessitated multi-year experimental validation [40,41,42].
4.3. Evaluation of Ideal Genotypes
The results of high-yielding varieties obtained from the analysis of yield performance and the polygon view of GGE biplot showing a very high degree of overlap (Figure 2 and Figure 8). The high-yielding varieties with complete overlap were as follows: G3(ZF-2303), G27(SS-2205), G28(SS-2206) and G13(YR-399) in 2023, and G27(SS-2205), G5(YR-18), G2(ZF-2302) and G13(YR-399) in 2024. Notably, the mutual validation of analytical approaches has been further confirmed in studies by Liu et al. (2022), Ma et al. (2024), Ruswandi et al. (2022) and BaduApraku et al. (2023) [17,33,43,44]. Otherwise, a mature tool for genotype-by-environment interaction analysis, the GGE model has demonstrated good applicability in selecting ideal genotypes for various important crops, including rice (Li et al., 2023)[29], wheat (Mullualem et al., 2024)[40], and sugarcane (Chaudhary et al., 2025)[45], and oats (Sanadya et al., 2025)[46] in variety adaptation evaluation. However, yield potential alone cannot ensure temporal or spatial stability[47], high and stable yields performance remains a fundamental criterion for determining a variety's suitability for large-scale commercial promotion [48,49]. In this study, G13 (YR-399), G22 (LS-2305), and G9 (LS-2303) were identified as the most desirable genotypes due to their consistently high grain yield and strong stability (Figure 9, Figure 10). This analysis of high-yield and stable varieties based on the GGE model has been validated in studies by Gonçalves et al. (2025), Kumar et al. (2024), and Nagesh et al. (2025)[32,50,51].
5. Conclusions
A multi-environment maize yield trial, analyzed via the GGE biplot model, revealed significant effects of genotypes, environments, and their interactions on yield, with environmental factors accounting for the primary source of variation. The optimal testing environments were E2 (Binchuan), E5 (Lijiang), E7 (Shilin), and E8 (Xuanwei). For superior genotypes, G22 (LS-2305), G9 (LS-2303), and G13 (YR-399) exhibited consistently high and stable yields across years, with G13 (YR-399) emerging as the most exceptional. The GGE biplot approach proved highly effective for screening high-yielding, stable varieties and identifying optimal test environments, thereby offering scientific guidance for maize breeding programs in mid-to-high elevation regions of Yunnan Province.
Author Contributions
Q.Z.: original draft, writing—review and editing, visualization, validation, methodology, investigation, formal analysis, data curation, project administration. Z.Y.: writing—review and editing, supervision, resources, conceptualization, project administration, funding acquisition. C.M.: writing—review and editing, investigation, project administration. C.L.: writing—review and editing, investigation, supervision, project administration. All authors have read and agreed to the published version of the manuscript.
Funding
This work was supported by the National Natural Science Foundation of China (No. 32401771), Yunnan Fundamental Research Projects (Nos. 202201AU070003, 202301AT070025), Xingdian Talent Support Program of Yunnan Province (No. XDYC-QNRC-2023-0016), Scientific Research Foundation of Education Department of Yunnan Province (Nos. 2025J0813, 2025Y1251), Doctoral Research Start-up Project of Dali University (No. KYBS2021068), and Research Development Fund of Dali University (No. KY2519104040). The funding bodies provided the financial support in carrying out the experiments, sample and data analysis, and MS writing.
Data Availability Statement
Dataset available on request from the authors.
Acknowledgments
We would like to express our gratitude to Yunnan Zu Feng Seed Industry Co., Ltd. for their assistance during the crop growth cycle investigation.
Conflicts of Interest
The authors declare that they have no conflict of interest.
References
- Revilla, P.; Alves, M.L.; Andelković, V.; Balconi, C.; Dinis, I.; Mendes-Moreira, P.; Redaelli, R.; Ruiz de Galarreta, J.I.; Vaz Patto, M.C.; Žilić, S. Traditional foods from maize (Zea mays L.) in Europe. Frontiers in Nutrition 2022, 8, 683399. [Google Scholar] [CrossRef]
- Erenstein, O.; Jaleta, M.; Sonder, K.; Mottaleb, K.; Prasanna, B.M. Global maize production, consumption and trade: trends and R&D implications. Food security 2022, 14, 1295–1319. [Google Scholar]
- Luo, N.; Meng, Q.; Feng, P.; Qu, Z.; Yu, Y.; Liu, D.L.; Müller, C.; Wang, P. China can be self-sufficient in maize production by 2030 with optimal crop management. Nature Communications 2023, 14, 2637. [Google Scholar] [CrossRef]
- Ru, Y.; Blankespoor, B.; Wood-Sichra, U.; Thomas, T.; You, L.; Kalvelagen, E. Estimating local agricultural gross domestic product (AgGDP) across the world. Earth Syst Sci Data 15: 1357–1387. 2023.
- Xin, Q.; Zhang, L.; Qu, Y.; Geng, H.; Li, X.; Peng, S. Satellite mapping of maize cropland in one-season planting areas of China. Scientific Data 2023, 10. [Google Scholar] [CrossRef]
- Zhang, P.; Xia, L.; Sun, Z.; Zhang, T. Analysis of spatial and temporal changes and driving forces of arable land in the Weibei dry plateau region in China. Scientific Reports 2023, 13. [Google Scholar] [CrossRef]
- Yan, Y.; Duan, F.; Li, X.; Zhao, R.; Hou, P.; Zhao, M.; Li, S.; Wang, Y.; Dai, T.; Zhou, W. Photosynthetic capacity and assimilate transport of the lower canopy influence maize yield under high planting density. Plant Physiology 2024, 195, 2652–2667. [Google Scholar] [CrossRef] [PubMed]
- Li, Y.; Bao, H.; Xu, Z.; Hu, S.; Sun, J.; Wang, Z.; Yu, X.; Gao, J. AMMI an GGE biplot analysis of grain yield for drought-tolerant maize hybrid selection in Inner Mongolia. Scientific Reports 2023, 13. [Google Scholar] [CrossRef] [PubMed]
- Bocianowski, J.; Nowosad, K.; Rejek, D. Genotype-environment interaction for grain yield in maize (Zea mays L.) using the additive main effects and multiplicative interaction (AMMI) model. Journal of Applied Genetics 2024, 65, 653–664. [Google Scholar] [CrossRef]
- Oladosu, Y.; Rafii, M.Y.; Abdullah, N.; Magaji, U.; Miah, G.; Hussin, G.; Ramli, A. Genotype× Environment interaction and stability analyses of yield and yield components of established and mutant rice genotypes tested in multiple locations in Malaysia. Acta Agriculturae Scandinavica, Section B—Soil & Plant Science 2017, 67, 590–606. [Google Scholar]
- Chauhan, P.; Shrivastava, M.K.; Kumar, V.; Patel, N.; Biswal, M. Stability Analysis in Wheat (Triticum aestivum L.) Genotypes under Different Environmental Conditions. International Journal of Plant & Soil Science 2023, 35, 1218–1223. [Google Scholar] [CrossRef]
- Pour-Aboughadareh, A.; Barati, A.; Gholipoor, A.; Zali, H.; Marzooghian, A.; Koohkan, S.A.; Shahbazi-Homonloo, K.; Houseinpour, A. Deciphering genotype-by-environment interaction in barley genotypes using different adaptability and stability methods. Journal of Crop Science and Biotechnology 2023, 26, 547–562. [Google Scholar] [CrossRef]
- Ligarreto–Moreno, G.; Pimentel–Ladino, C. Grain yield and genotype x environment interaction in bean cultivars with different growth habits. Plant Production Science 2021, 25, 232–241. [Google Scholar] [CrossRef]
- Daemo, B.B.; Wolancho, G.B.; Arke, Z.A.; Wakalto, D.D.; Onu, M.H.; Rahimi, M. Performance Evaluation and Stability of Maize (Zea mays L.) Genotypes for Grain Yield Using AMMI and GGE Biplot. International Journal of Agronomy 2024, 2024. [Google Scholar] [CrossRef]
- Mafouasson, H.N.A.; Gracen, V.; Yeboah, M.A.; Ntsomboh-Ntsefong, G.; Tandzi, L.N.; Mutengwa, C.S. Genotype-by-Environment Interaction and Yield Stability of Maize Single Cross Hybrids Developed from Tropical Inbred Lines. Agronomy 2018, 8. [Google Scholar] [CrossRef]
- Muthoni, J.; Shimelis, H.; Melis, R. Genotype x Environment Interaction and Stability of Potato Tuber Yield and Bacterial Wilt Resistance in Kenya. American Journal of Potato Research 2015, 92, 367–378. [Google Scholar] [CrossRef]
- Ma, C.; Liu, C.; Ye, Z. Influence of Genotype × Environment Interaction on Yield Stability of Maize Hybrids with AMMI Model and GGE Biplot. Agronomy 2024, 14. [Google Scholar] [CrossRef]
- Santos, A.d.; Amaral, A.T.d.; Kurosawa, R.d.N.F.; Gerhardt, I.F.S.; Fritsche, R. GGE Biplot projection in discriminating the efficiency of popcorn lines to use nitrogen. Ciência e Agrotecnologia 2017, 41, 22–31. [Google Scholar] [CrossRef]
- Jandong, E.; Uguru, M.; Oyiga, B. Determination of yield stability of seven soybean (Glycine max) genotypes across diverse soil pH levels using GGE biplot analysis. 2011.
- Zhang, P.-P.; Hui, S.; Yang, L.; Yang, Q.; Wang, S.; ZHENG, D.-f. GGE biplot analysis of yield stability and test location representativeness in proso millet (Panicum miliaceum L.) genotypes. Journal of Integrative Agriculture 2016, 15, 1218–1227. [Google Scholar] [CrossRef]
- Teodoro, P.; Almeida Filho, J.; Daher, R.; Menezes, C.; Cardoso, M.; Godinho, V.; Torres, F.; Tardin, F. Identification of sorghum hybrids with high phenotypic stability using GGE biplot methodology. Genetics and Molecular Research: GMR 2016, 15. [Google Scholar] [CrossRef] [PubMed]
- Gauch Jr, H.G.; Piepho, H.P.; Annicchiarico, P. Statistical analysis of yield trials by AMMI and GGE: Further considerations. Crop science 2008, 48, 866–889. [Google Scholar] [CrossRef]
- Olivoto, T.; Nardino, M.; Carvalho, I.; Follmann, D.; Ferrari, M.; Szareski, V.; De Pelegrin, A.; De Souza, V. REML/BLUP and sequential path analysis in estimating genotypic values and interrelationships among simple maize grain yield-related traits. Genetics and Molecular Research 2017, 16, 1–19. [Google Scholar] [CrossRef]
- Bocci, R.; Bussi, B.; Petitti, M.; Franciolini, R.; Altavilla, V.; Galluzzi, G.; Di Luzio, P.; Migliorini, P.; Spagnolo, S.; Floriddia, R. Yield, yield stability and farmers’ preferences of evolutionary populations of bread wheat: A dynamic solution to climate change. European Journal of Agronomy 2020, 121, 126156. [Google Scholar] [CrossRef]
- Lu, Y.; Zhang, Z.; Lu, Z.; Wang, S.; Hao, D.; Li, P.; Xu, Y.; Xu, C.; Lu, H.; Yang, Z. Analysis of the regional trial for sweet maize in Jiangsu province based on the AMMI model and GGE biplot. Molecular Plant Breeding 2022, 20, 6939–6946. [Google Scholar]
- Wei, P.; Chen, D.; Luo, Y.; Zheng, Y.; Yang, J.; Luo, S.; Cheng, Y.; Wang, A.; Song, B. Evaluation of the high yield, stability and pilot discriminative power of spring maize in different ecological areas of Guizhou based on AMMI and GGE-biplot. Journal of Maize Sciences 2023, 31, 22–31. [Google Scholar]
- Wei, C.; Xu, W.; Xing, Y.; Song, W.; Li, G.; Chen, G.; Zhou, W. Application of AMMI model and GGE biplot of sweet maize varieties in Huang-Huai-Hai regional. Molecular Plant Breeding 2021, 19, 5909–5916. [Google Scholar]
- Gao, H.; Bian, G.; Huang, S.; Yang, G.; Zhang, H.; Gao, S.; Bai, X. Analysis on the stability of national sugar beet varieties by AMMI model. China Beet & Sugar 2008, 4, 10–14. [Google Scholar]
- Li, X.; Ding, Y.; Zuo, S.; Chen, Z.; Xu, M.; Zhao, Y.; Li, P.; Xu, Y.; Xu, C.; Yang, Z. Evaluation and analysis of the results from the regional trial of medium Japonica hybrid rice of Jiangsu province in 2018 based on the AMMI model and GGE biplot. Hybrid Rice 2021, 36, 96–102. [Google Scholar]
- Yan, W.; Kang, M.S.; Ma, B.; Woods, S.; Cornelius, P.L. GGE biplot vs. AMMI analysis of genotype-by-environment data. Crop science 2007, 47, 643–653. [Google Scholar] [CrossRef]
- Taak, Y.; Patel, M.K.; Chaudhary, R.; Basu, S.R.; Pardeshi, P.; Adhikari, S.; Nanjundan, J.; Saini, N.; Vasudev, S.; Yadava, D.K. Determining Drought-and Heat-Tolerant Genotypes in Indian Mustard [Brassica juncea] Employing GGE Biplot Analysis. Agricultural Research 2025, 1–12. [Google Scholar] [CrossRef]
- Gonçalves, V.M.L.; Crevelari, J.A.; Catarina, R.S.; de Souza, Y.P.; Pereira, M.G. Adaptability and stability analysis via GGE biplot in single, double, and interpopulation maize hybrids. Scientific Reports 2025, 15, 5065. [Google Scholar] [CrossRef]
- Liu, C.; Ma, C.; Lü, J.; Ye, Z. Yield stability analysis in maize hybrids of southwest china under genotype by environment interaction using GGE biplot. Agronomy 2022, 12, 1189. [Google Scholar] [CrossRef]
- Zendrato, Y.; Azizah, Y.; Humam, B.; Marwiyah, S.; Ritonga, A.; Azrai, M.; Efendi, R.; Suwarno, W. Maize hybrids’ response to optimum and suboptimum abiotic environmental conditions using genotype by environment interaction analysis. SABRAO J. Breed. Genet 2025, 57, 447–458. [Google Scholar]
- Neelam, S.; Bhoga, J.; Venkata, N.K.M.; Dharavath, B.; Kumari, V.; Kachhapur, R.M.; Dinasarapu, S.; Phagna, R.K.; Appavoo, D. Navigating Hybrid-Environment Interaction in Maize Evaluation: Parametric and Non-Parametric Insights. Crop Breeding, Genetics and Genomics 2025, 7. [Google Scholar]
- Nišavić, N.; Čamdžija, Z.; Živanović, T.; Božinović, S.; Grčić, N.; Radinović, I.; Božović, D. Impact of genotype× environment interactions on the yield and stability of maize hybrids in Serbia. Romanian agricultural research 2025, 42, 4221. [Google Scholar] [CrossRef]
- Sharif, I.; Aleem, S.; Junaid, J.A.; Aleem, M.; Jamshaid, K.; Saleem, H.; Rizwan, M.; Chohan, S.M.; Sohail, S.; Akram, S. Evaluation of Genotype× Environment Interaction and Yield Stability of Cotton (Gossypium hirsutum L) Genotypes Under Heat Stress Conditions. Journal of Crop Health 2025, 77, 16. [Google Scholar] [CrossRef]
- Yan, W. A systematic narration of some key concepts and procedures in plant breeding. Frontiers in Plant Science 2021, 12, 724517. [Google Scholar] [CrossRef] [PubMed]
- Li, Y.; Bao, H.; Xu, Z.; Hu, S.; Sun, J.; Wang, Z.; Yu, X.; Gao, J. AMMI an GGE biplot analysis of grain yield for drought-tolerant maize hybrid selection in Inner Mongolia. Scientific Reports 2023, 13, 18800. [Google Scholar] [CrossRef] [PubMed]
- Mullualem, D.; Tsega, A.; Mengie, T.; Fentie, D.; Kassa, Z.; Fassil, A.; Wondaferew, D.; Gelaw, T.A.; Astatkie, T. Genotype-by-environment interaction and stability analysis of grain yield of bread wheat (Triticum aestivum L.) genotypes using AMMI and GGE biplot analyses. Heliyon 2024, 10. [Google Scholar] [CrossRef]
- Kona, P.; Ajay, B.; Gangadhara, K.; Kumar, N.; Choudhary, R.R.; Mahatma, M.; Singh, S.; Reddy, K.K.; Bera, S.; Sangh, C. AMMI and GGE biplot analysis of genotype by environment interaction for yield and yield contributing traits in confectionery groundnut. Scientific Reports 2024, 14, 2943. [Google Scholar] [CrossRef]
- Tiwari, J.K.; Rai, N.; Singh, M.K.; Reddy, Y.S.; Kumar, R. Delineating genotype× environment interaction for horticultural traits in tomato using GGE and AMMI biplot analysis. Scientific Reports 2025, 15, 23796. [Google Scholar] [CrossRef]
- Ruswandi, D.; Syafii, M.; Wicaksana, N.; Maulana, H.; Ariyanti, M.; Indriani, N.P.; Suryadi, E.; Supriatna, J.; Yuwariah, Y. Evaluation of high yielding maize hybrids based on combined stability analysis, sustainability index, and GGE biplot. BioMed Research International 2022, 2022, 3963850. [Google Scholar] [CrossRef]
- Badu-Apraku, B.; Abubakar, A.M.; Adu, G.B.; Yacoubou, A.-M.; Adewale, S.; Adejumobi, I.I. Enhancing genetic gains in grain yield and efficiency of testing sites of early-maturing maize hybrids under contrasting environments. Genes 2023, 14, 1900. [Google Scholar] [CrossRef] [PubMed]
- Chaudhary, D.; Jeena, A.S.; Singh, N.K.; Pant, U.; Rohit, R.; Gaur, S. GGE biplot analysis for cane yield and sugar yield in advanced clones of sugarcane (Saccharum sp. complex). Journal of Applied Genetics 2025, 66, 279–291. [Google Scholar] [CrossRef]
- Sanadya, S.K.; Sood, V.K.; Kumar, S.; Sharma, G.; Sood, R.; Katna, G.; Enyew, M.; Sahoo, S. Stability Indices, AMMI and GGE Biplots Analysis of Forage Oat Germplasm Under Variable Growing Regimes in the Northwestern Himalayas. Agricultural Research 2025, 1–10. [Google Scholar] [CrossRef]
- Rusinamhodzi, L.; Makumbi, D.; Njeru, J.M.; Kanampiu, F. Performance of elite maize genotypes under selected sustainable intensification options in Kenya. Field crops research 2020, 249, 107738. [Google Scholar] [CrossRef]
- Dang, X.; Hu, X.; Ma, Y.; Li, Y.; Kan, W.; Dong, X. AMMI and GGE biplot analysis for genotype× environment interactions affecting the yield and quality characteristics of sugar beet. PeerJ 2024, 12, e16882. [Google Scholar] [CrossRef]
- Yan, W.; Tinker, N.A. Biplot analysis of multi-environment trial data: Principles and applications. Canadian journal of plant science 2006, 86, 623–645. [Google Scholar] [CrossRef]
- Kumar, B.; Choudhary, M.; Kumar, P.; Kumar, S.; Sravani, D.; Vinodhana, N.K.; Kumar, G.S.; Gami, R.; Vyas, M.; Jat, B.S. GGE biplot analysis and selection indices for yield and stability assessment of maize (Zea mays L.) genotypes under drought and irrigated conditions. Indian Journal of Genetics and Plant Breeding 2024, 84, 209–215. [Google Scholar] [CrossRef]
- Nagesh, P.; Takalkar, S.A.; Mohan, S.M.; Naidu, P.B.; Lohithaswa, C.H.; Kachapur, R.M.; Kuchanur, P.; Injeti, S.K.; Singh, N.K.; Kanwade, D.G. Genotype and environmental interactions in Maize ('Zea mays L.') across regions of India: Implications for hybrid testing locations in South Asia. Australian Journal of Crop Science 2025, 19, 773–783. [Google Scholar] [CrossRef]
Figure 1.
The location of 10 test sites in mid-to-high altitude areas of Yunnan Province.
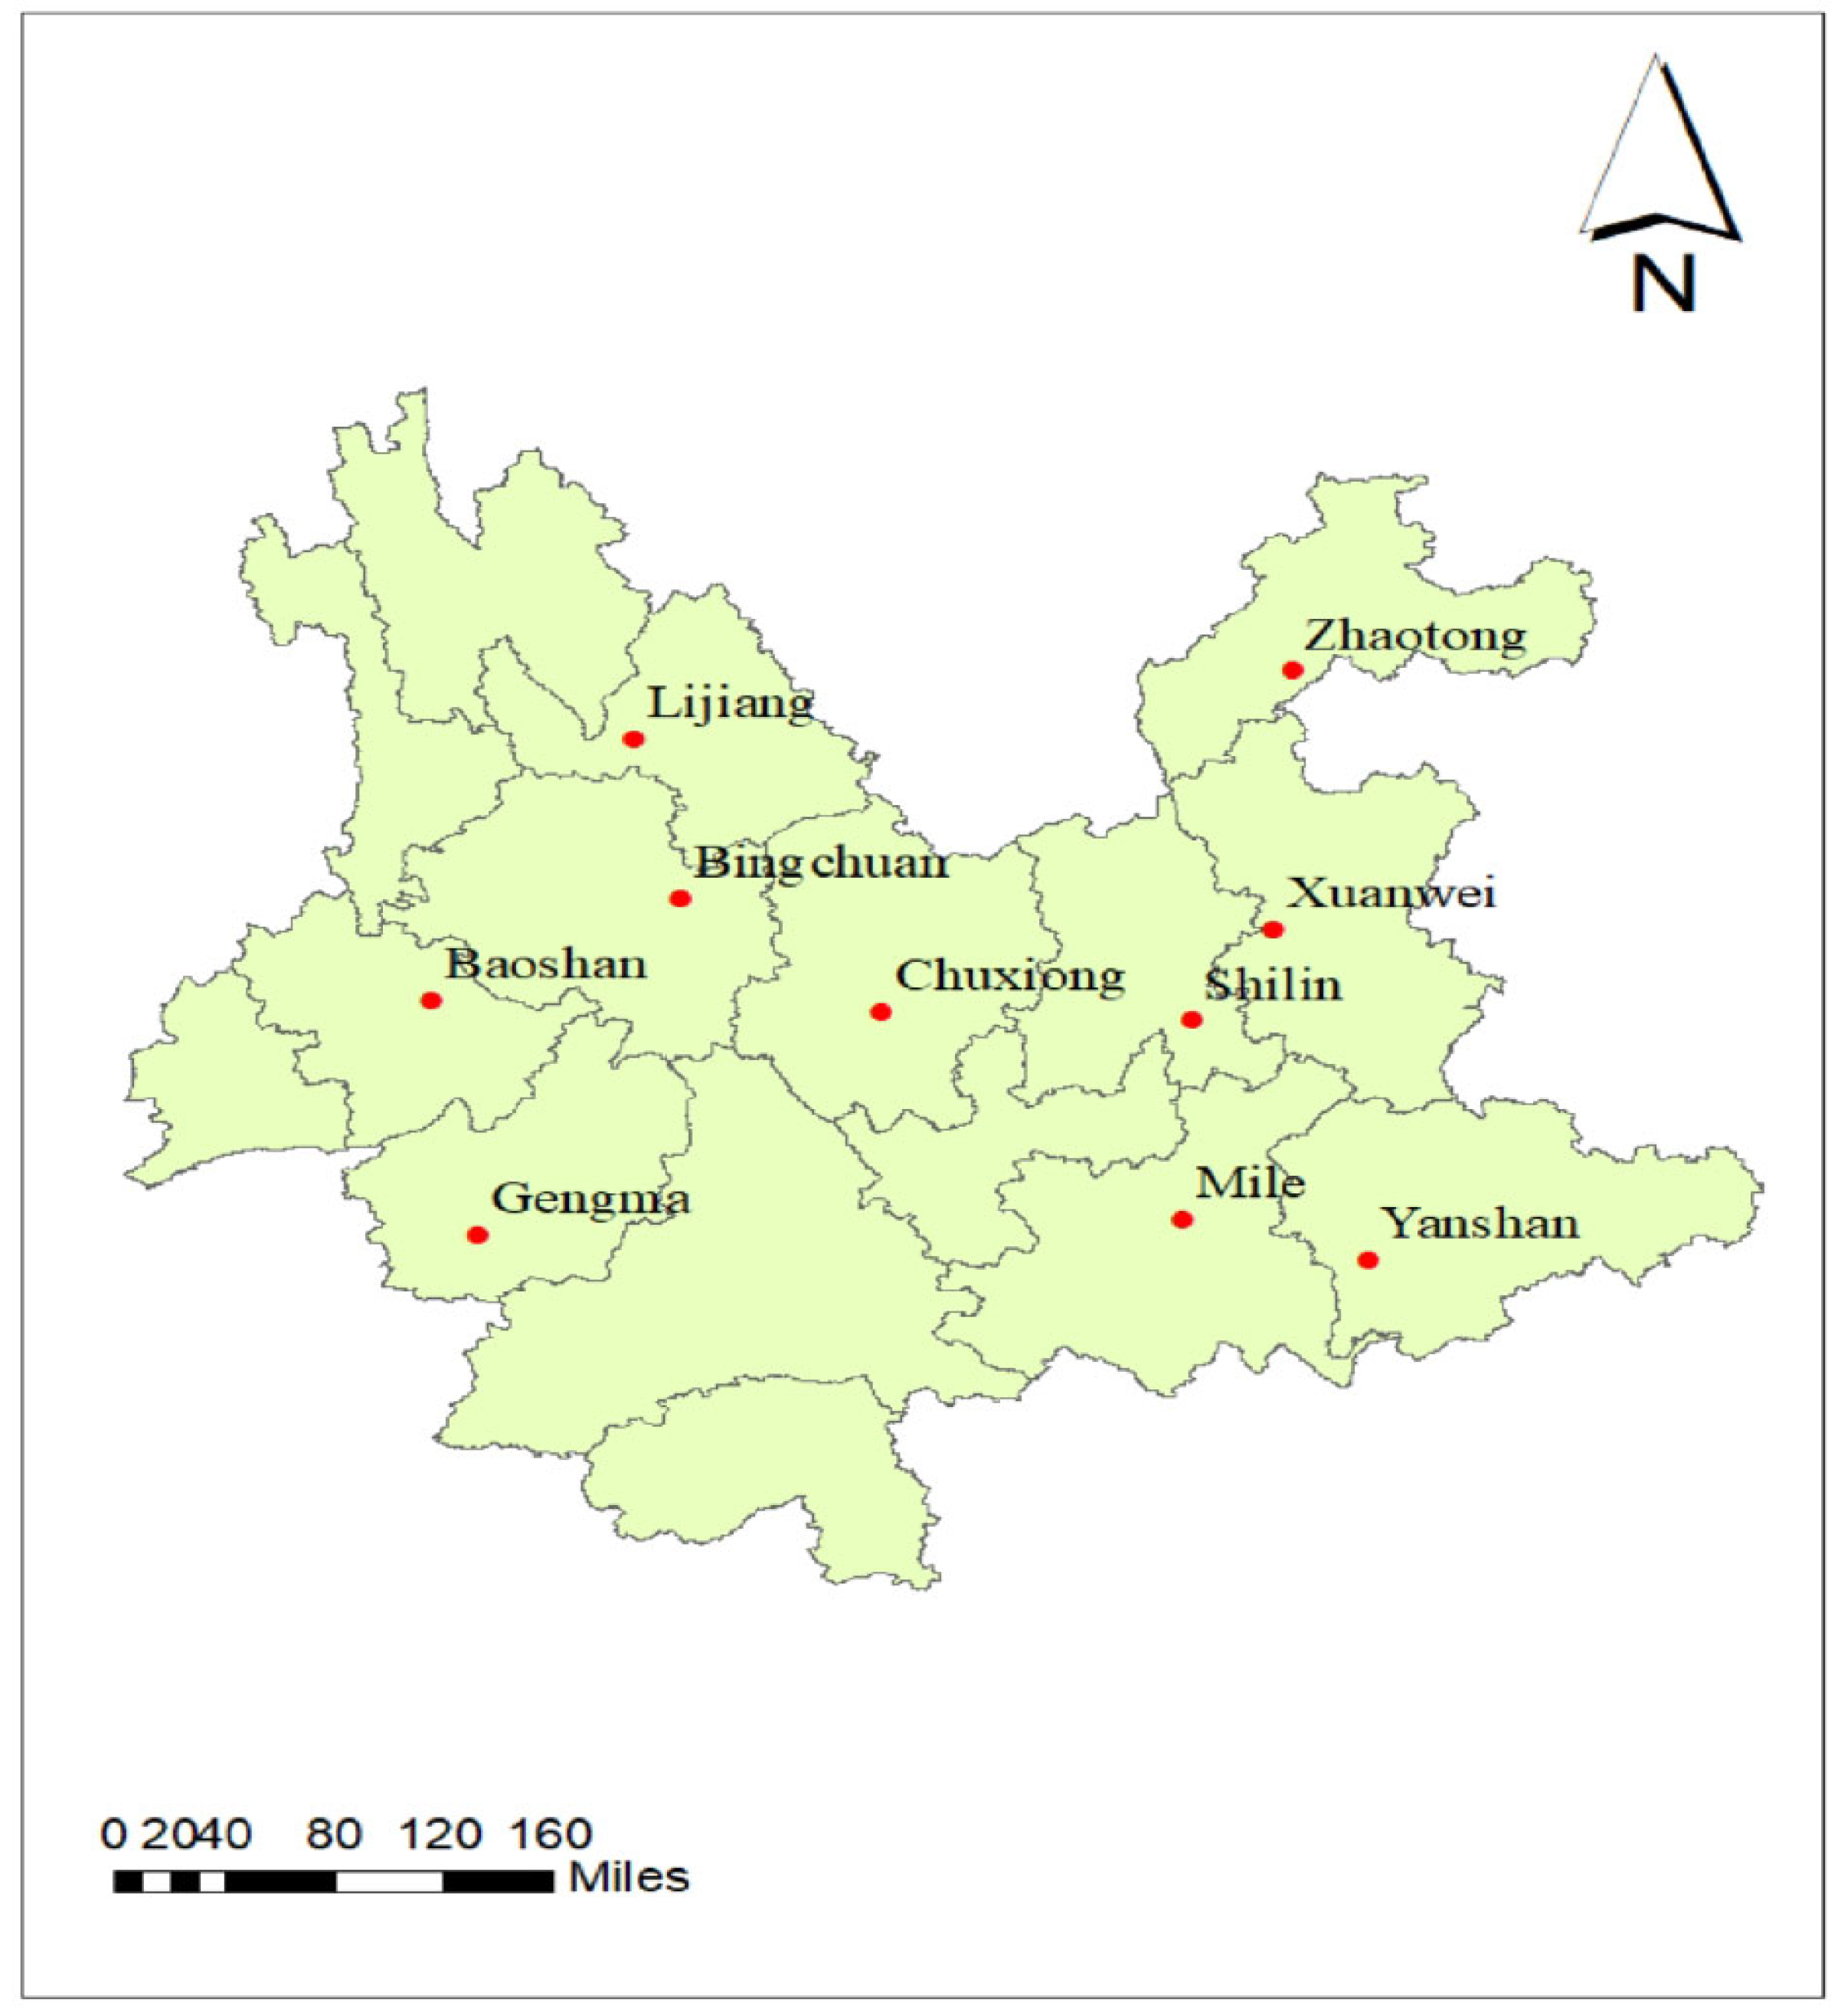
Figure 2.
(a) Maize yield performance in 2023; (b) Maize yield performance in 2024.
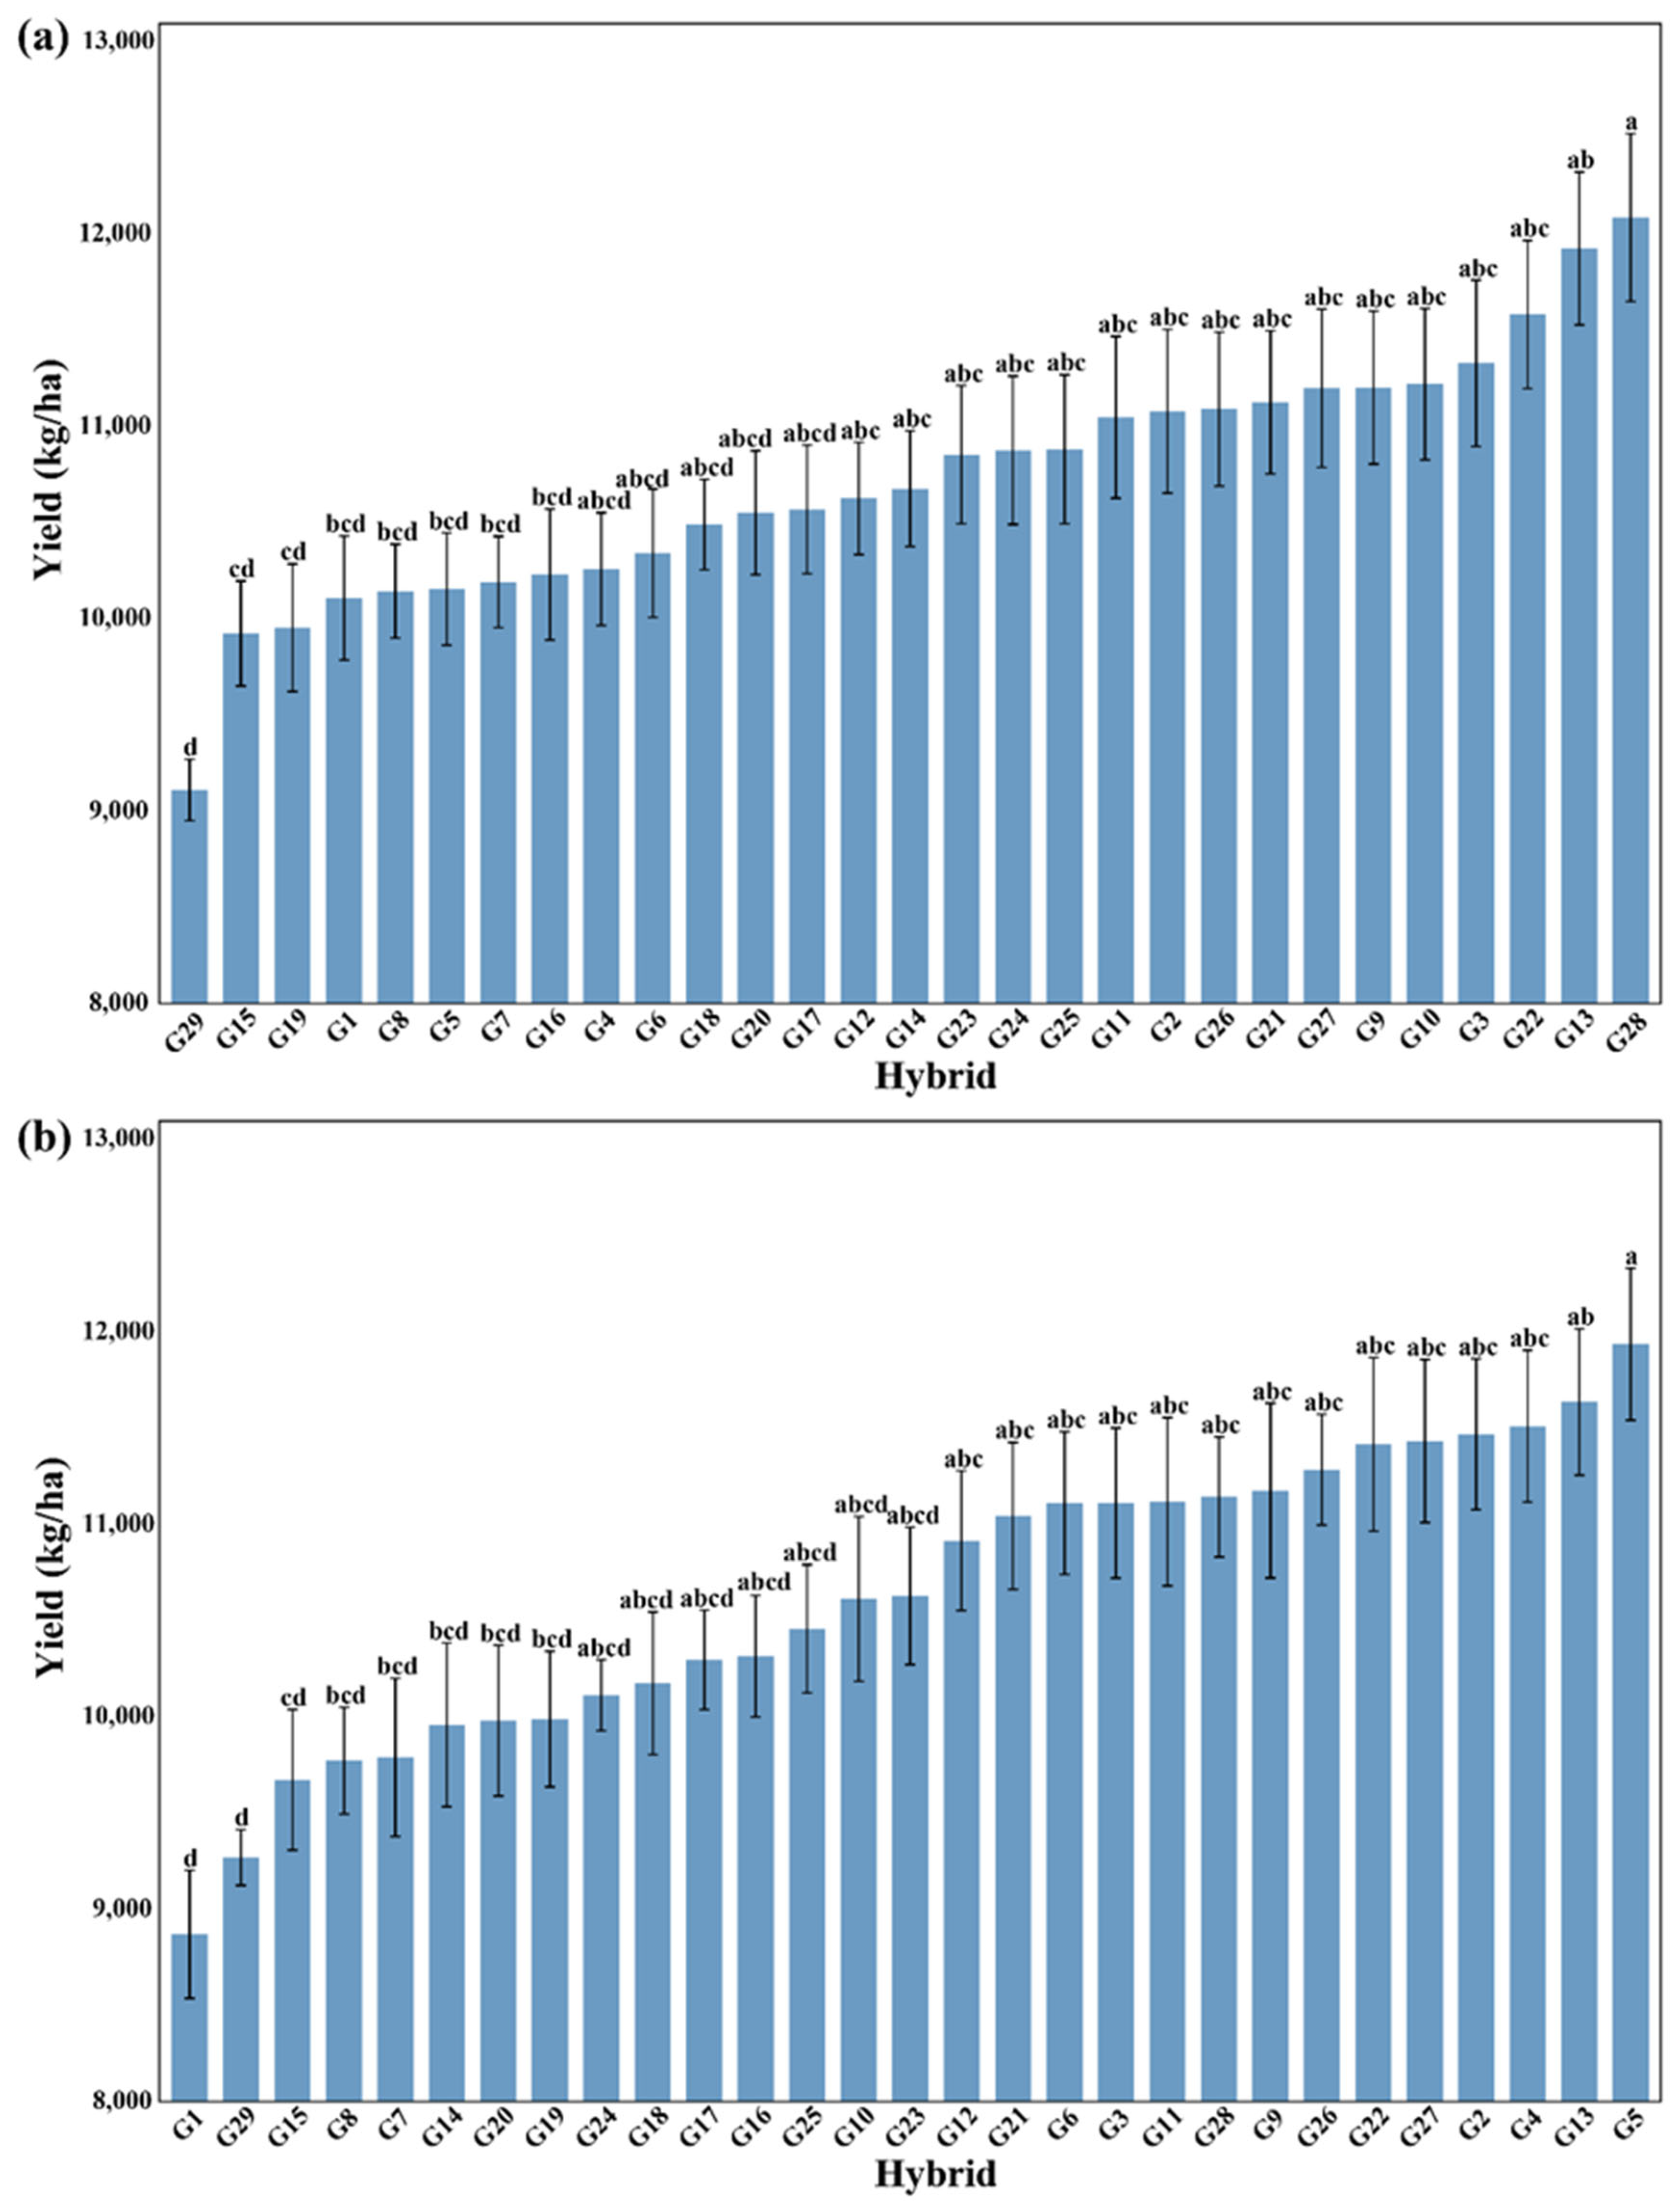
Figure 3.
Heatmap of two-year average yield from 2023 to 2024.
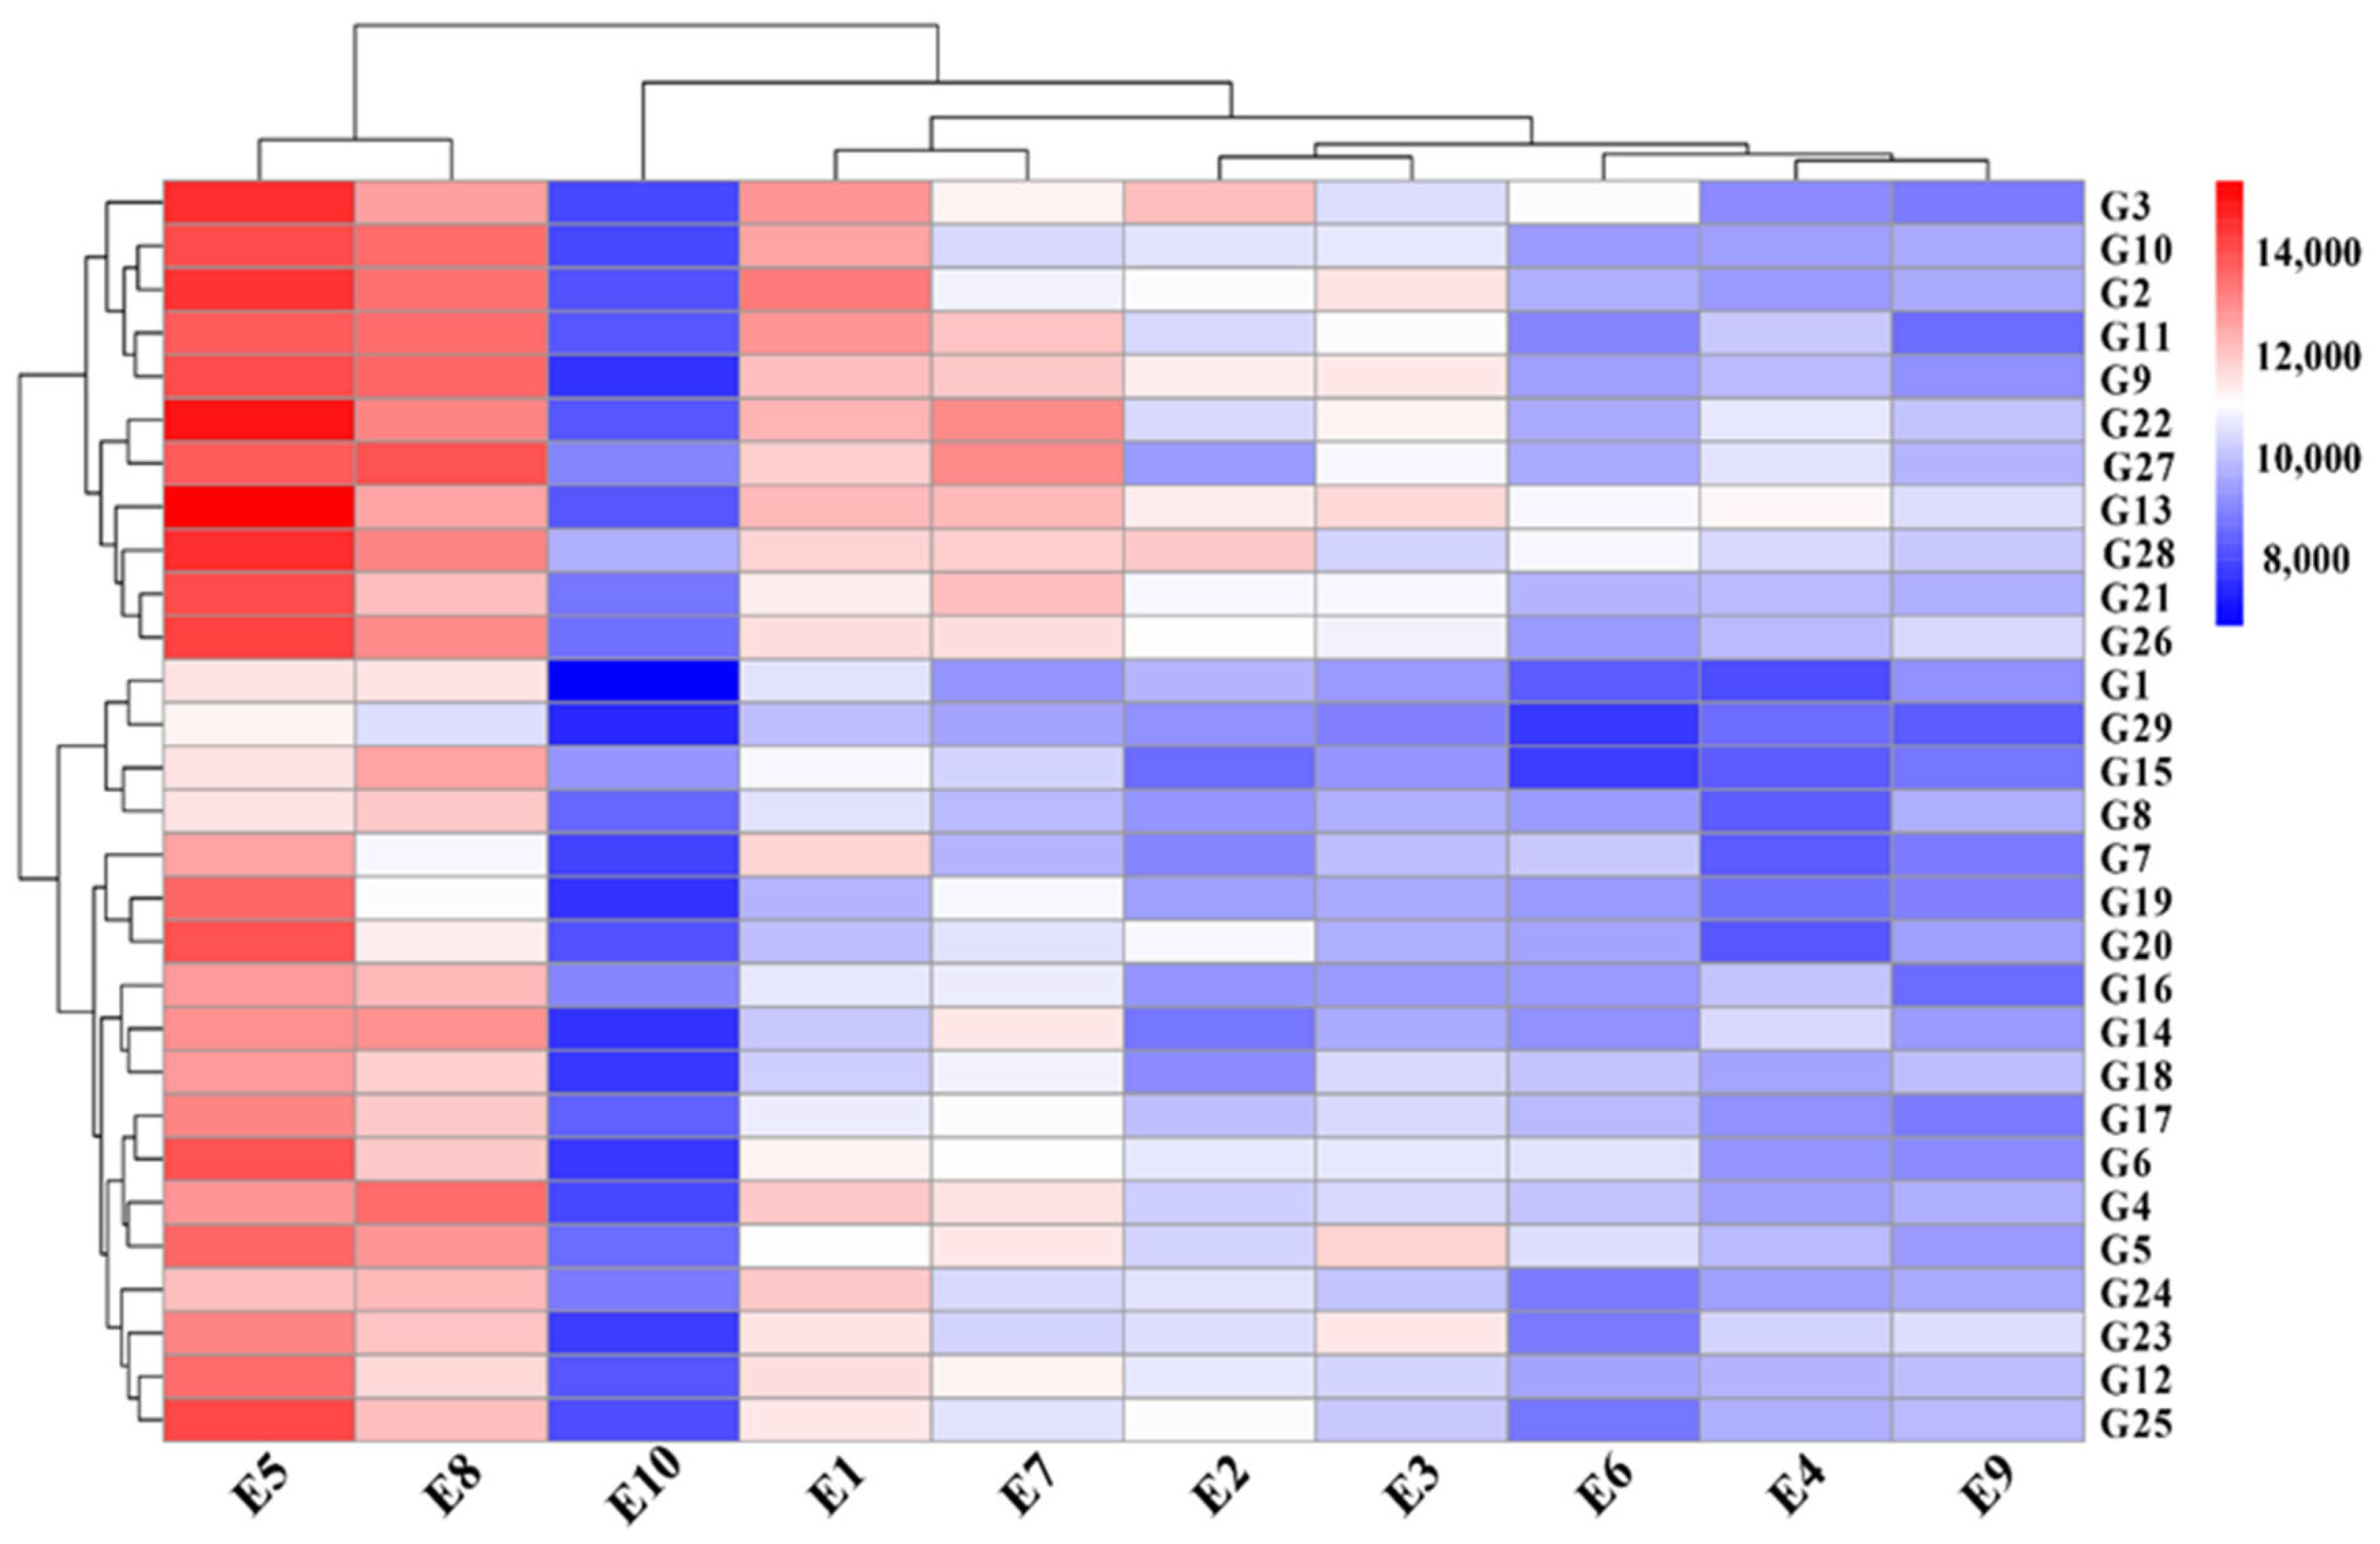
Figure 4.
(a) Correlation analysis of agronomic traits in 2023; (b) Correlation analysis of agronomic traits in 2024. EL: Ear length; ED: Ear diameter; BTL: Bald tip length; KPR: Kernels per row; HKW: Hundred-kernel weight; KR: Kernel output rate; EKW: Ear kernel weight; HD: Growth duration; PH: Plant height; EH: Ear height.
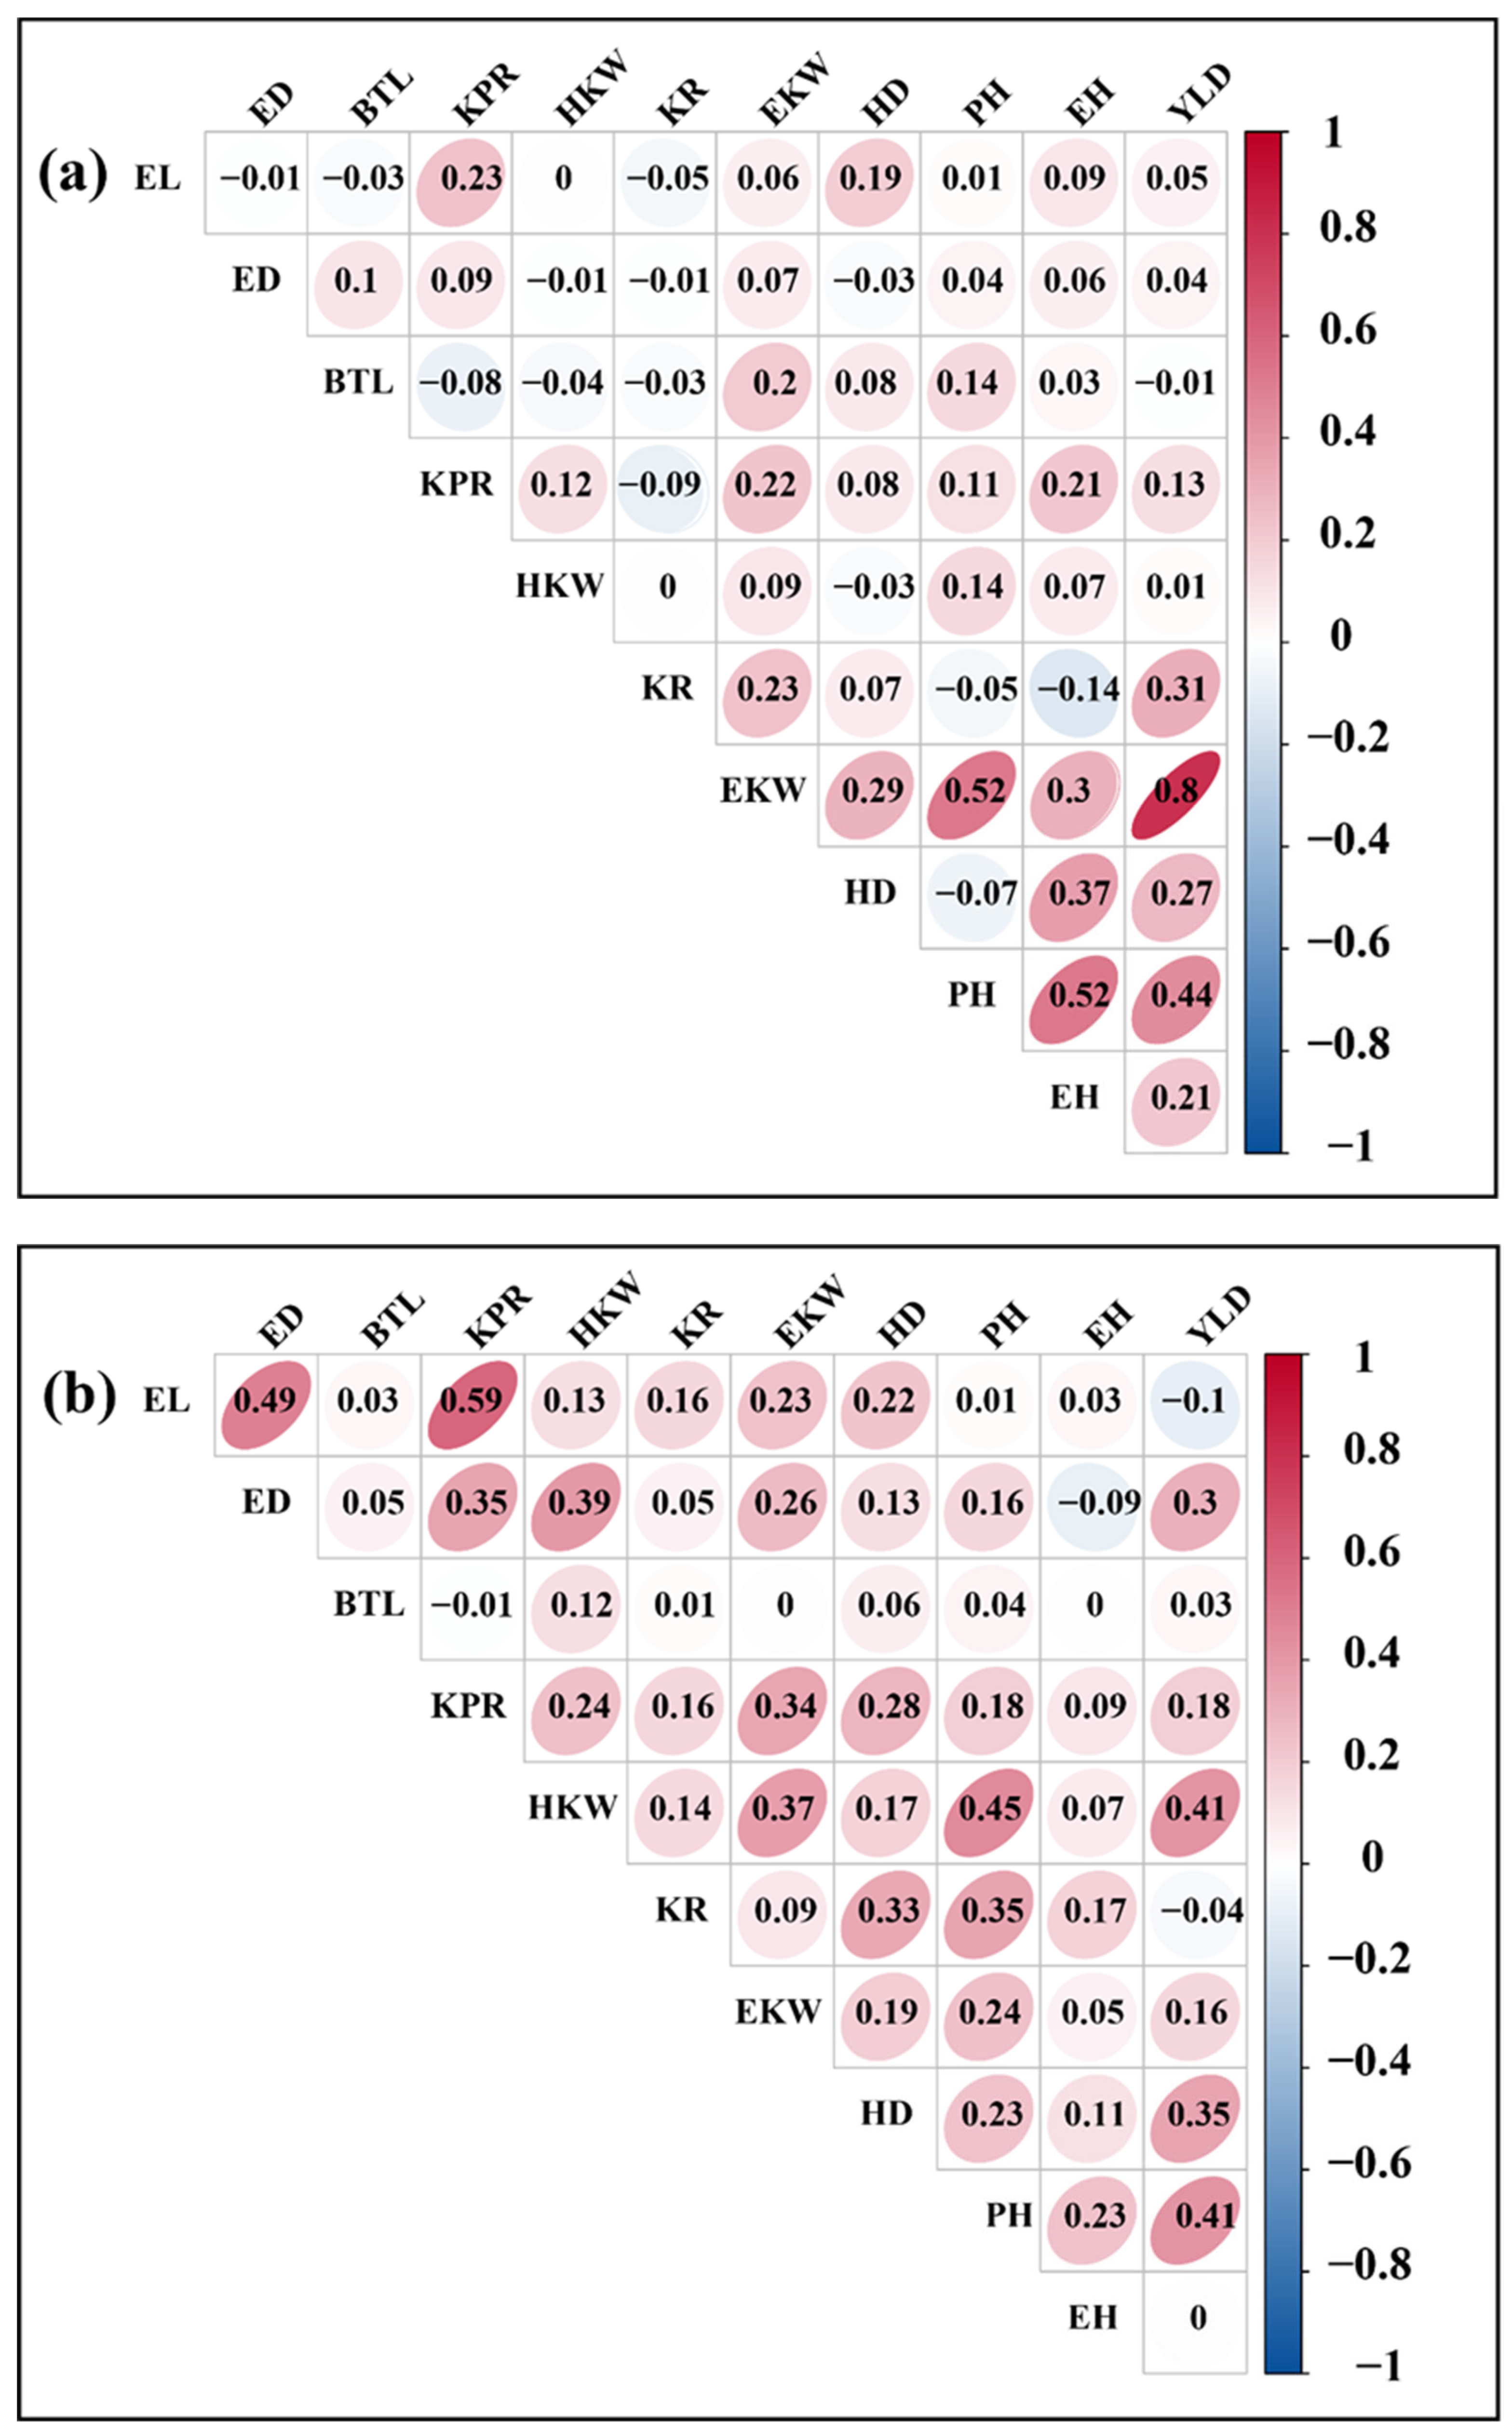
Figure 5.
Relationships among test environments revealed by GGE biplot analysis across 10 trial environments. (a) GGE biplot for 2023; (b) GGE biplot for 2024.
Figure 5.
Relationships among test environments revealed by GGE biplot analysis across 10 trial environments. (a) GGE biplot for 2023; (b) GGE biplot for 2024.
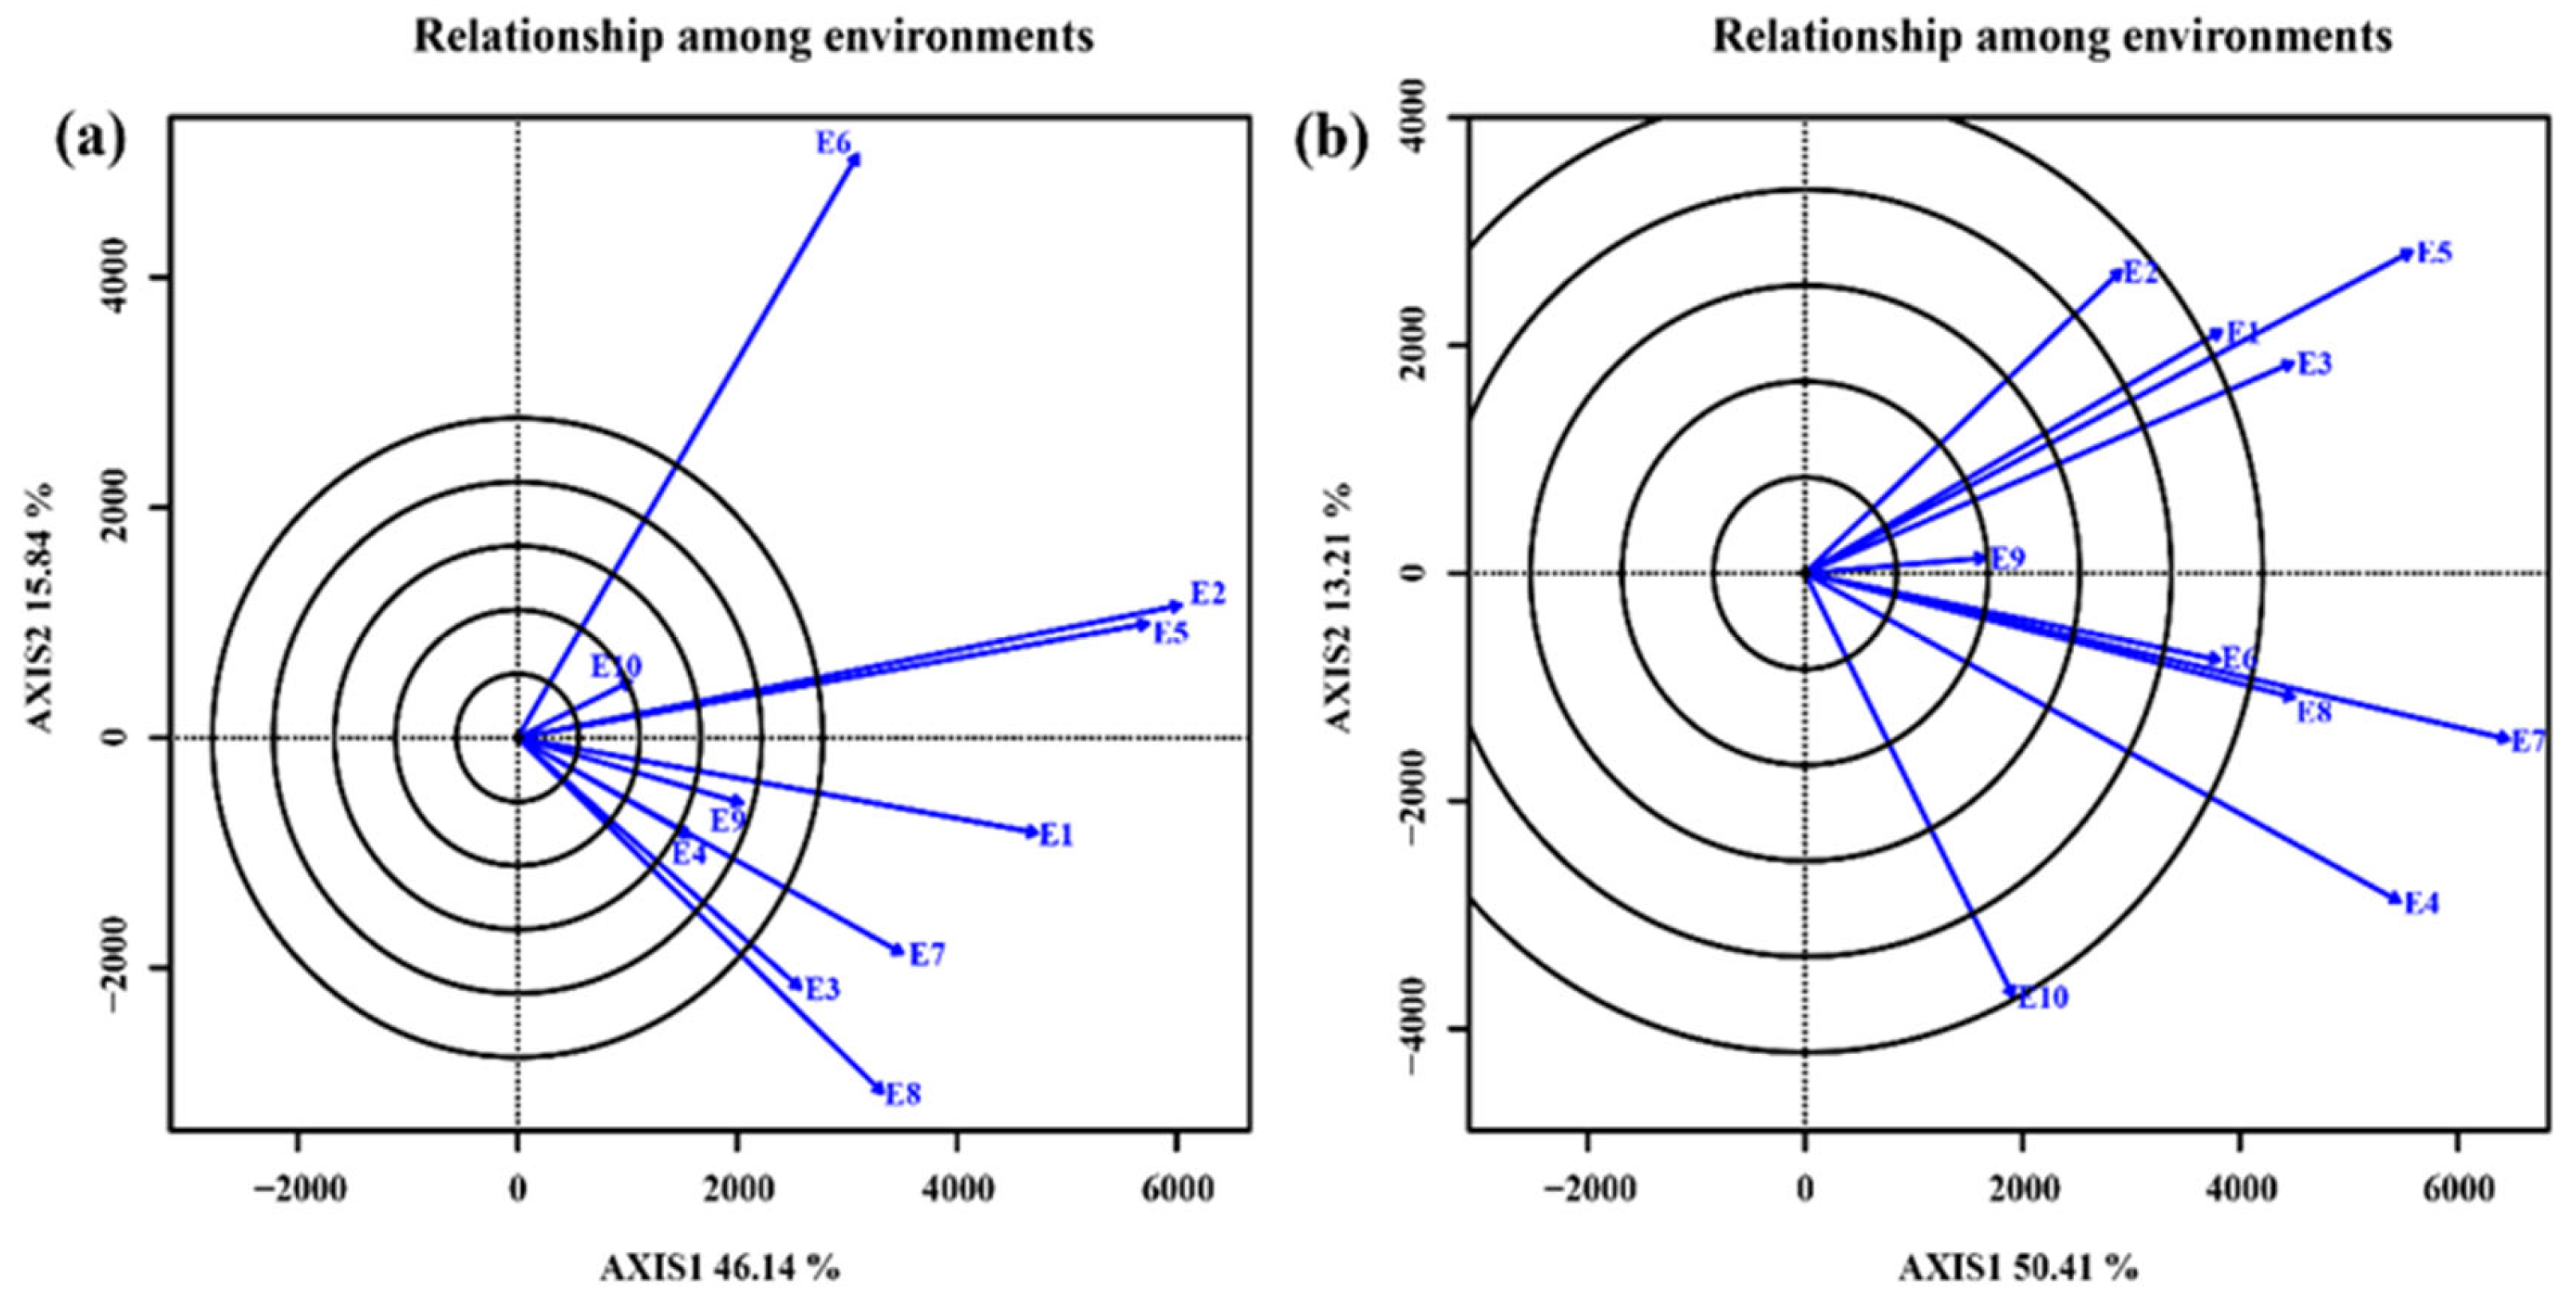
Figure 6.
GGE biplot of "Discriminating Ability vs. Representativeness" view across 10 test environments. (a) GGE biplot for 2023; (b) GGE biplot for 2024.
Figure 6.
GGE biplot of "Discriminating Ability vs. Representativeness" view across 10 test environments. (a) GGE biplot for 2023; (b) GGE biplot for 2024.

Figure 7.
GGE biplot of environmental ranking view across 10 test environments. (a) GGE biplot for 2023; (b) GGE biplot for 2024.
Figure 7.
GGE biplot of environmental ranking view across 10 test environments. (a) GGE biplot for 2023; (b) GGE biplot for 2024.
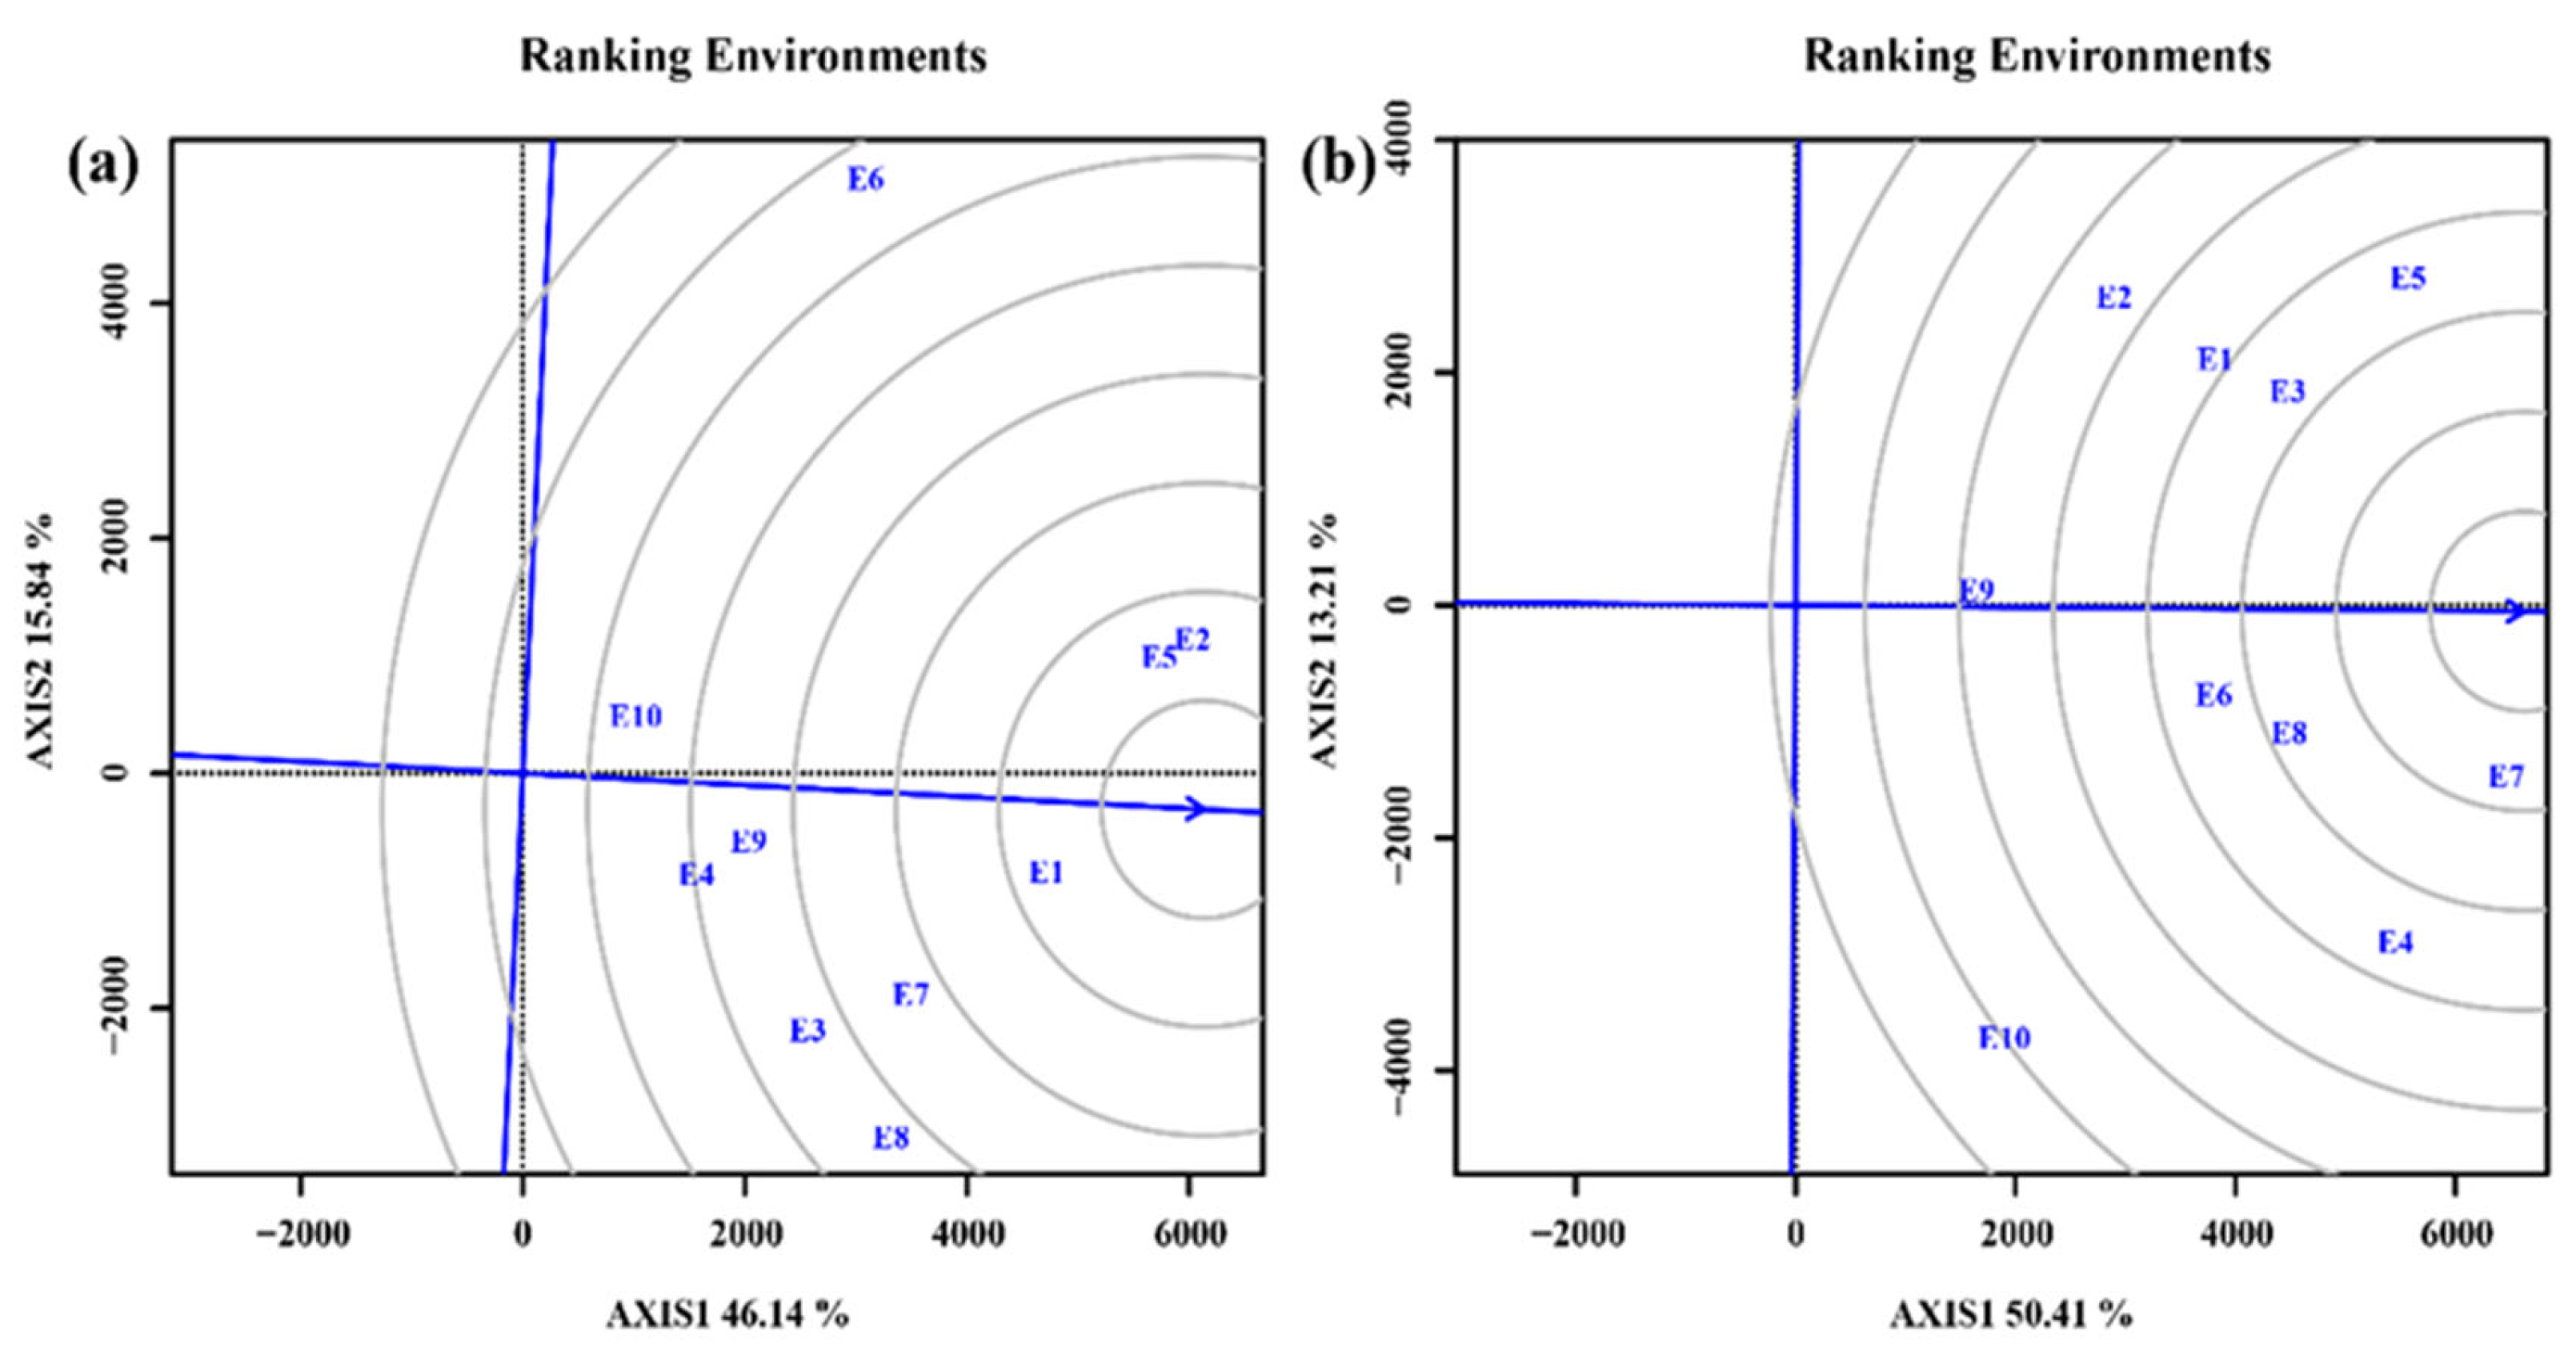
Figure 8.
GGE biplot of "Which-won-where" view among 29 maize varieties across 10 test environments. (a) GGE biplot for 2023; (b) GGE biplot for 2024.
Figure 8.
GGE biplot of "Which-won-where" view among 29 maize varieties across 10 test environments. (a) GGE biplot for 2023; (b) GGE biplot for 2024.
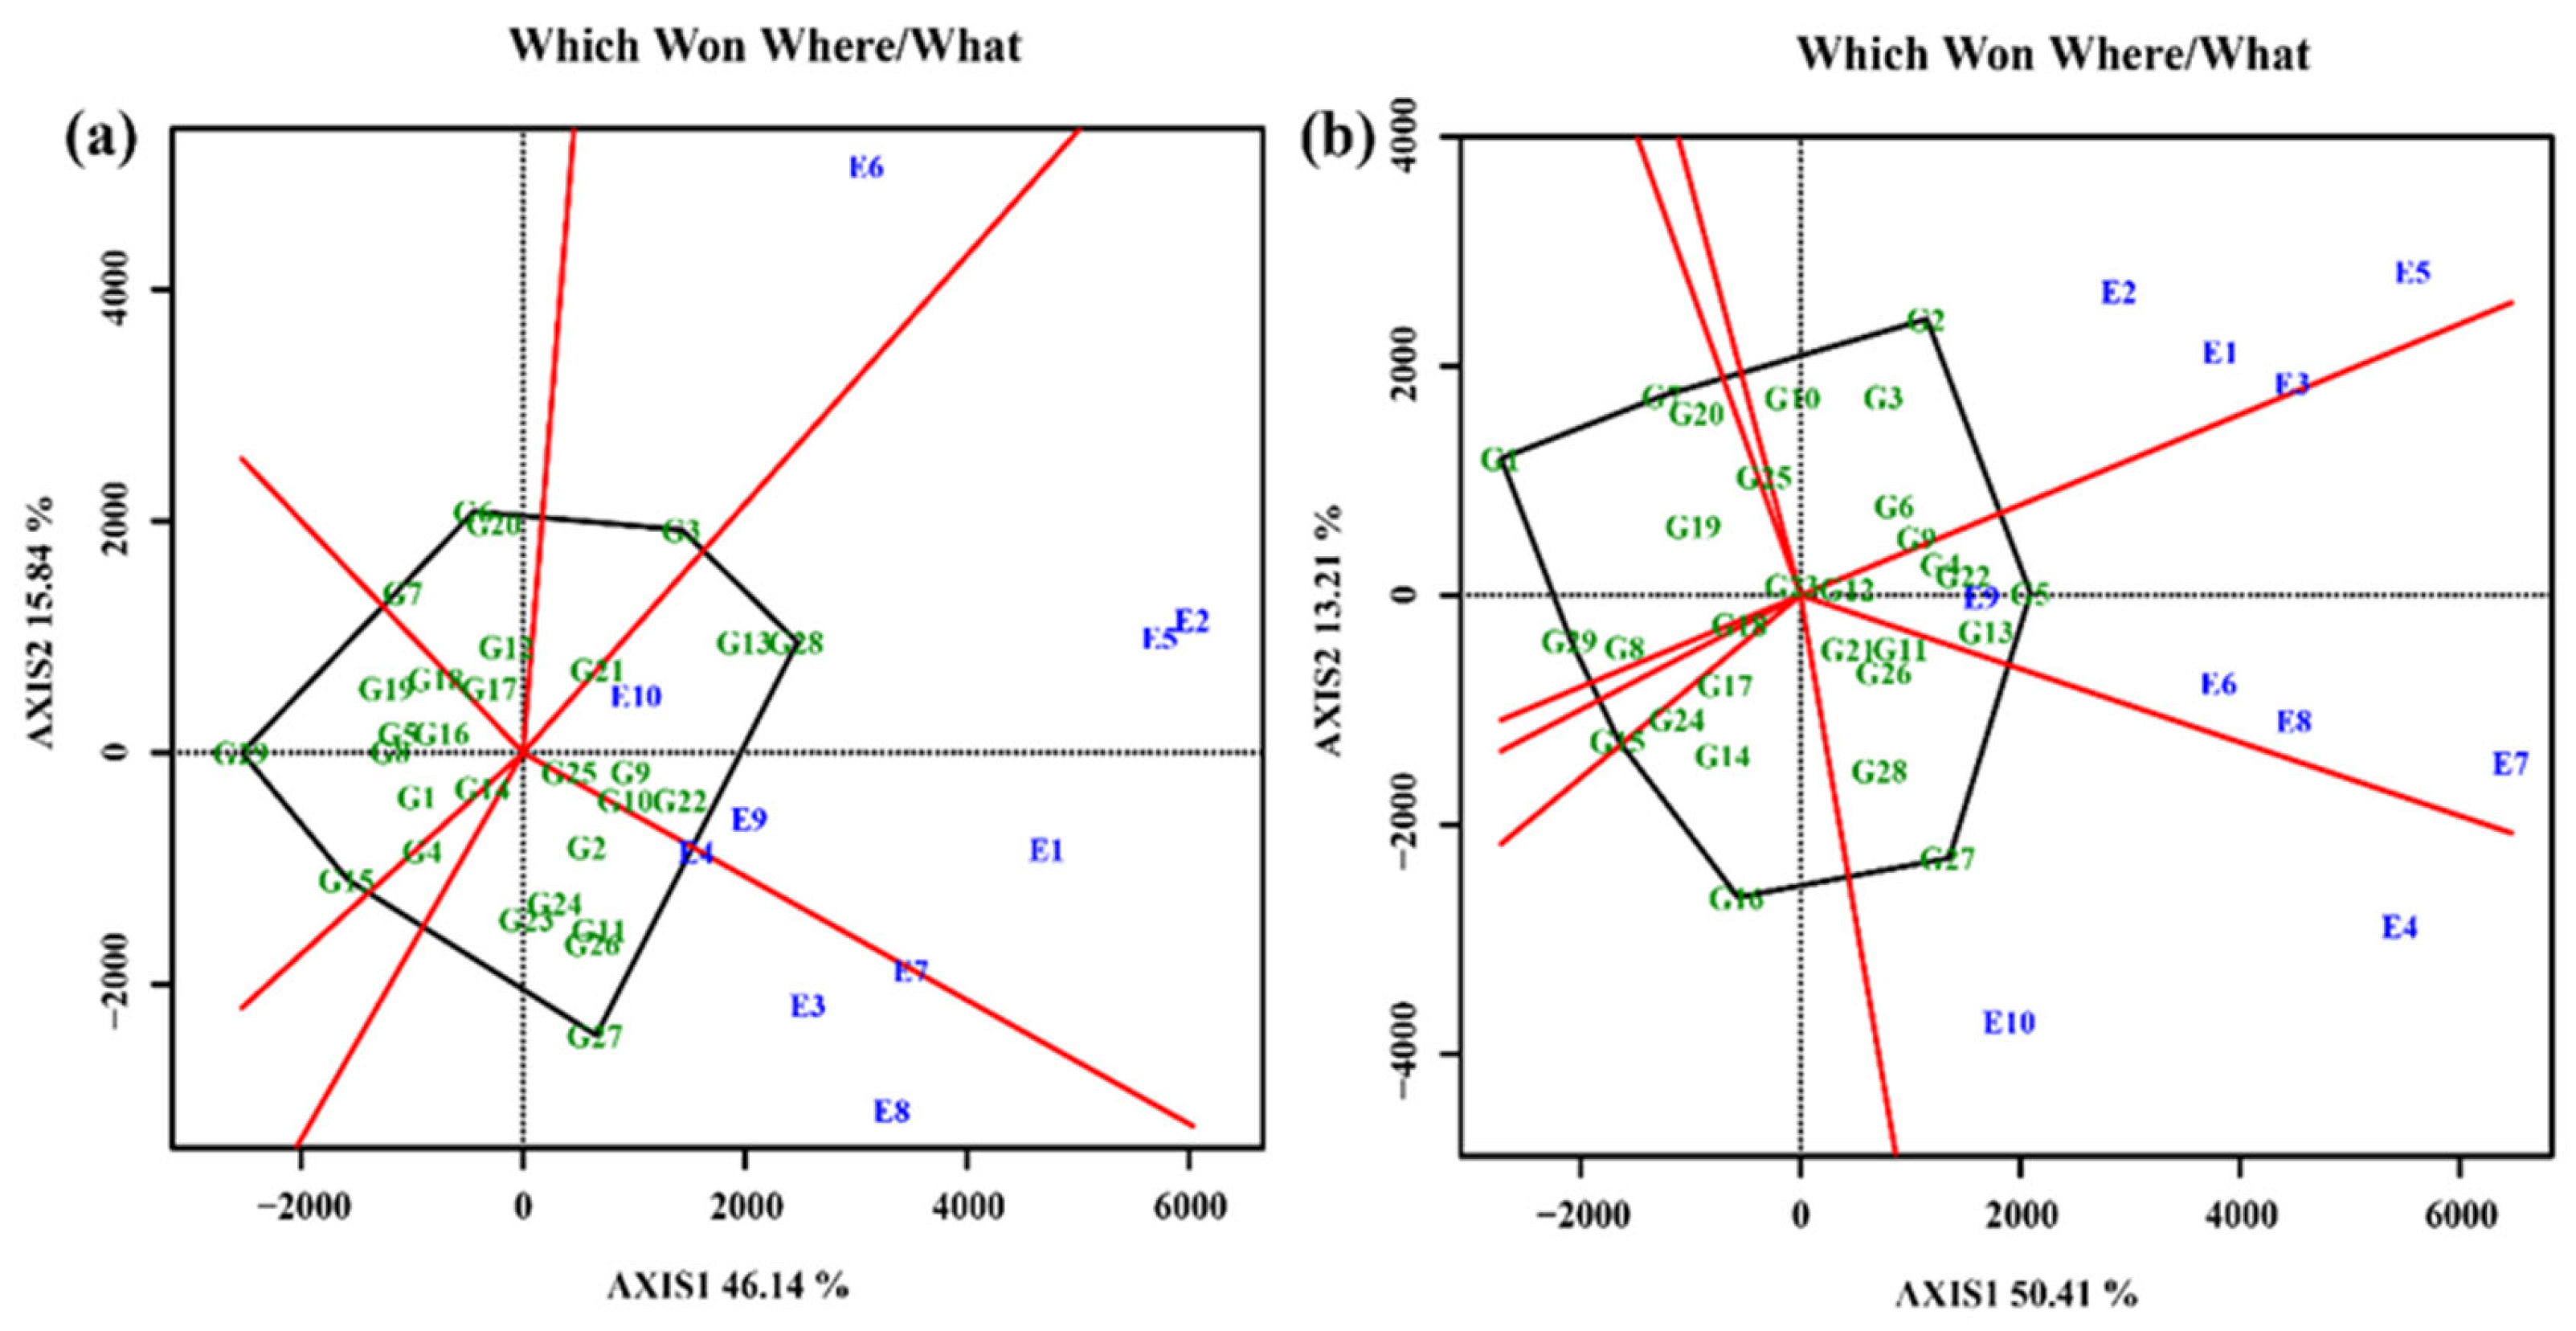
Figure 9.
GGE biplot displaying the "Means vs. Stability" view for the average yield of 29 maize varieties across 10 test environments. (a) GGE biplot of “Means and Stability” view for 2023; (b) GGE biplot of “Means and Stability” view for 2024.
Figure 9.
GGE biplot displaying the "Means vs. Stability" view for the average yield of 29 maize varieties across 10 test environments. (a) GGE biplot of “Means and Stability” view for 2023; (b) GGE biplot of “Means and Stability” view for 2024.
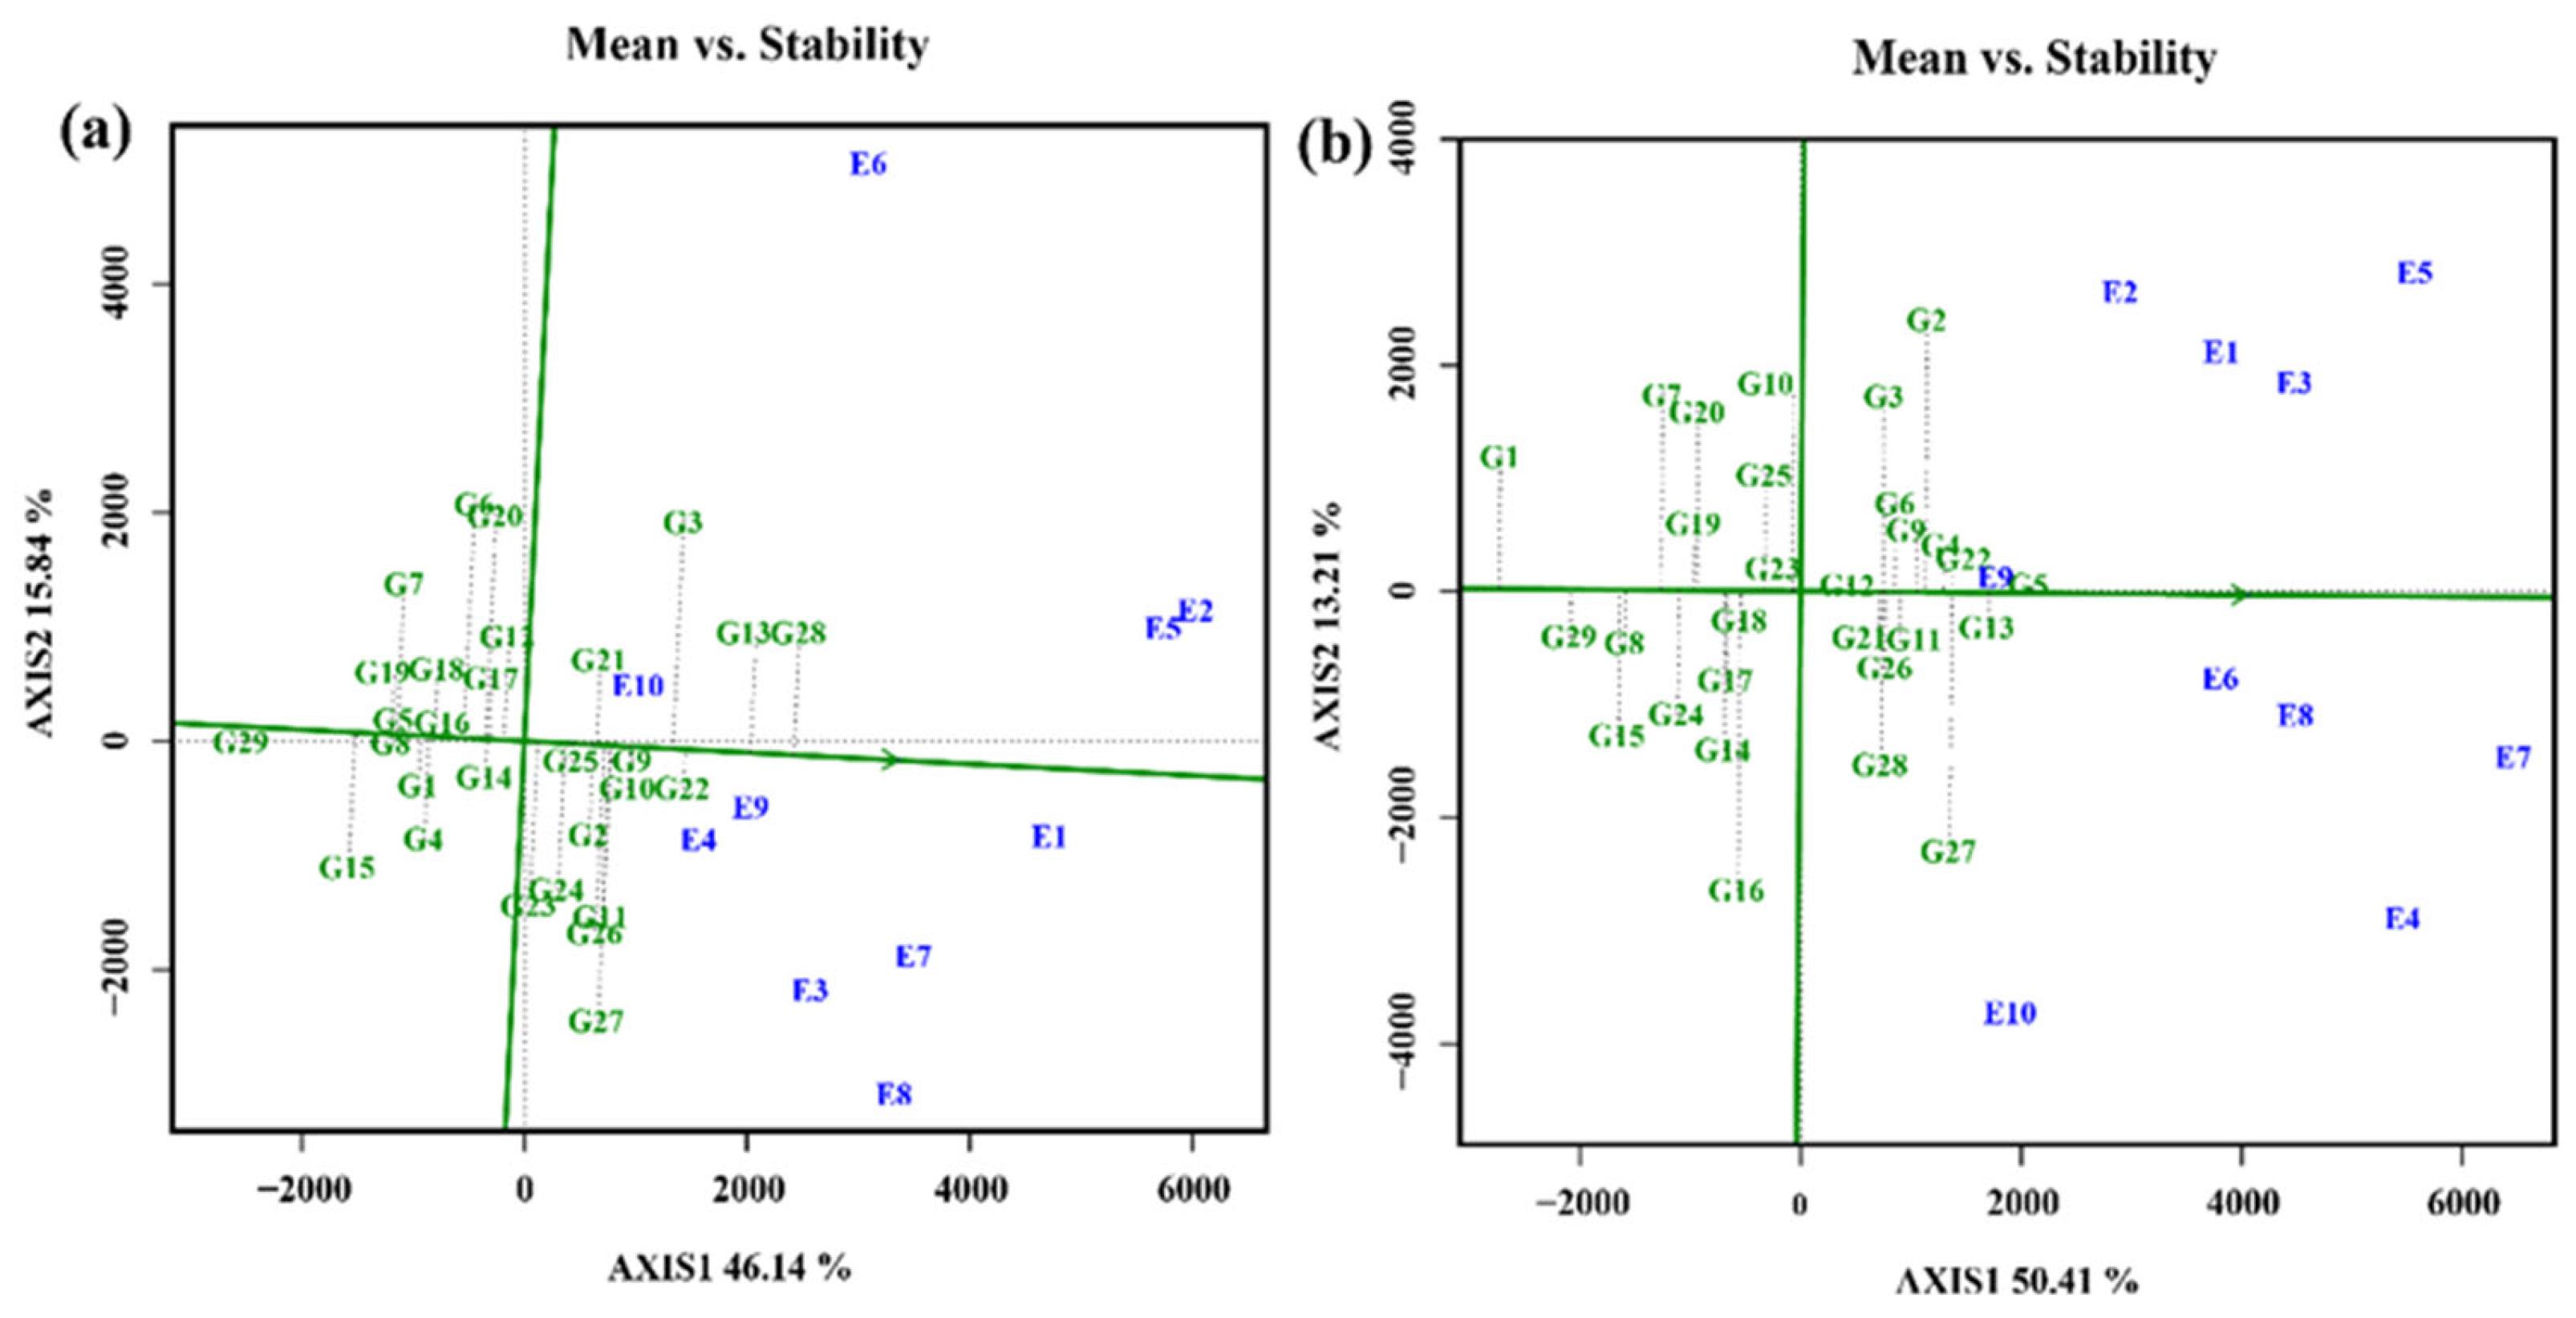
Figure 10.
GGE biplot displaying the "Ranking Genotype" view for the average yield of 29 maize varieties across 10 test environments. (a) GGE biplot of ranking genotype view for 2023; (b) GGE biplot of ranking genotype view for 2024.
Figure 10.
GGE biplot displaying the "Ranking Genotype" view for the average yield of 29 maize varieties across 10 test environments. (a) GGE biplot of ranking genotype view for 2023; (b) GGE biplot of ranking genotype view for 2024.
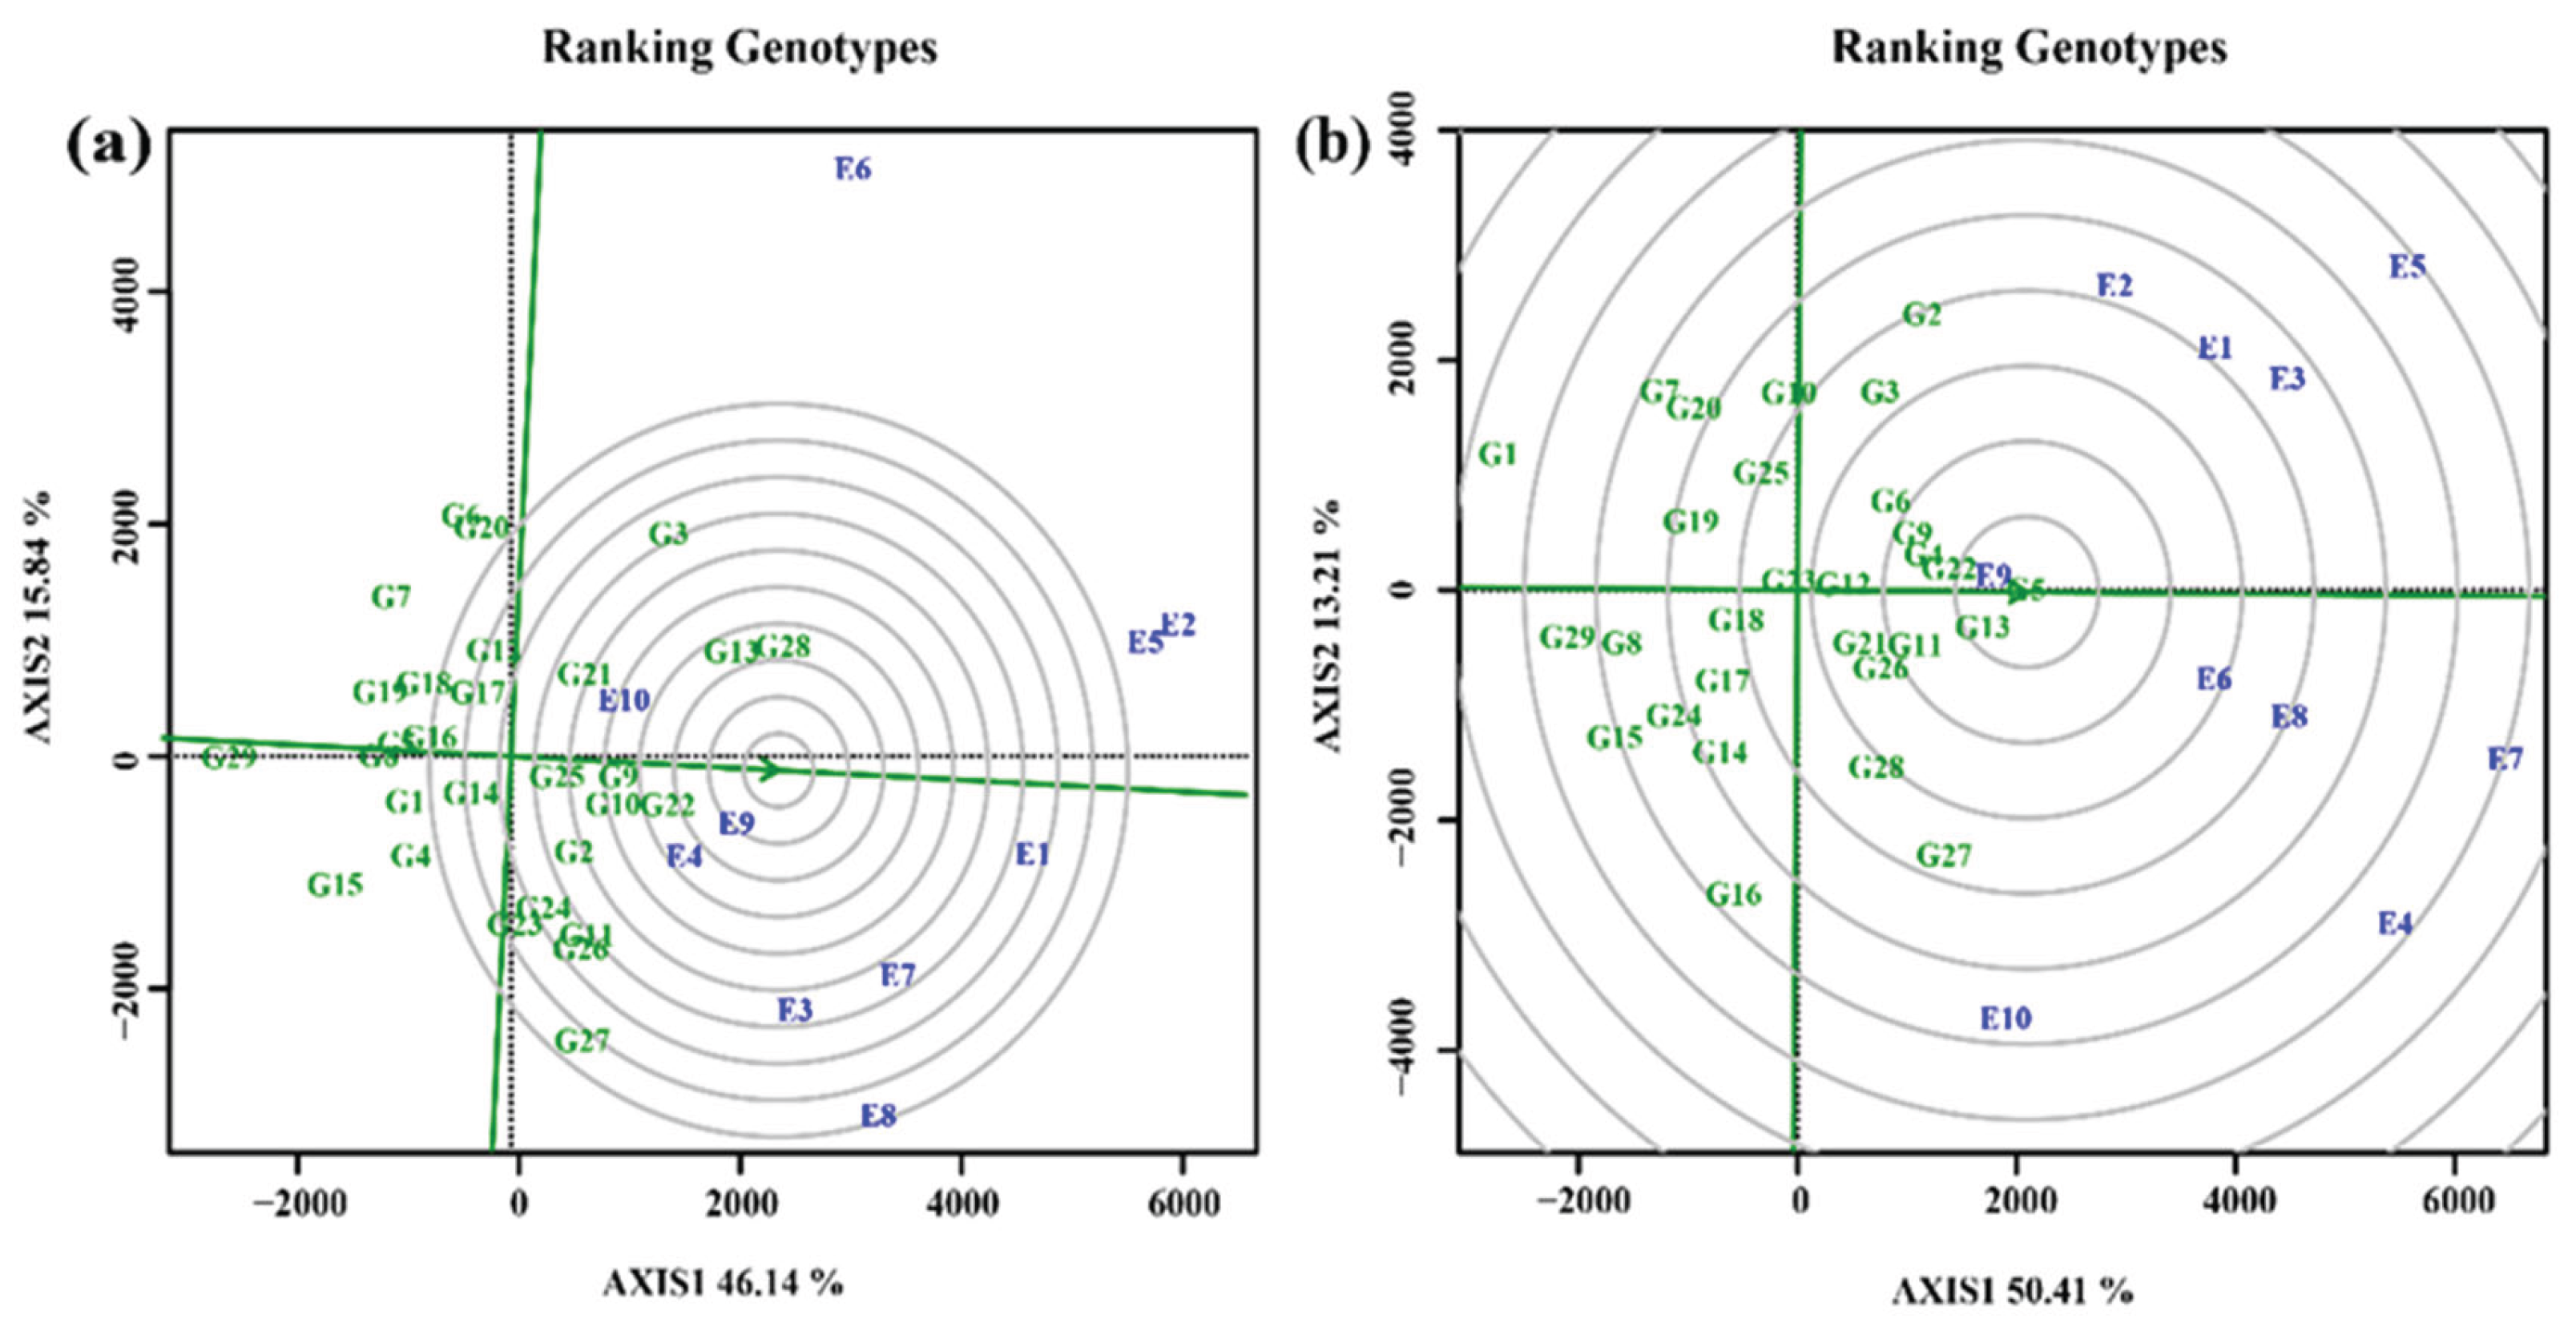

Table 1.
29 maize varieties and their codes.
| Hybrids | Code | Hybrids | Code | Hybrids | Code |
| ZHY-103 | G1 | ZF-2304 | G11 | LS-2304 | G21 |
| ZF-2302 | G2 | ZF-2305 | G12 | LS-2305 | G22 |
| ZF-2303 | G3 | YR-399 | G13 | JG-1356 | G23 |
| YR-17 | G4 | DY-801 | G14 | JG-1865 | G24 |
| YR-18 | G5 | YBY-202 | G15 | SS-2203 | G25 |
| DY-604 | G6 | SS-2201 | G16 | SS-2204 | G26 |
| YBY-201 | G7 | SS-2202 | G17 | SS-2205 | G27 |
| LS-2301 | G8 | JG-1872 | G18 | SS-2206 | G28 |
| LS-2303 | G9 | JG-1881 | G19 | WG-3861(CK) | G29 |
| MS-2301 | G10 | MS-2302 | G20 |
Table 2.
Ten test sites and their codes.
| Location | Code | Latitude (N) | Longitude (E) | Altitude (m) |
| Baoshan | E1 | 25°09′ | 99°13′ | 1592 |
| Binchuan | E2 | 25°48′ | 100°35′ | 1430 |
| ChuXiong | E3 | 25°08′ | 101°18′ | 1767 |
| Gengma | E4 | 23°74′ | 99°62′ | 1340 |
| Lijiang | E5 | 100°3′ | 26°58′ | 1819 |
| Mile | E6 | 24°27′ | 103°31′ | 1543 |
| Shilin | E7 | 24°41′ | 103°27′ | 1927 |
| Xuanwei | E8 | 26°15′ | 104°8′ | 1980 |
| Yanshan | E9 | 23°07′ | 104°34′ | 1490 |
| Zhaotong | E10 | 27°19′ | 103°42′ | 1920 |
Table 3.
Variance analysis for maize yield (kg/ha) in 2023.
| Source of | Degrees of Freedom (DF) | Sum of Squares (SS) | Mean Squares | F-Calculated | Proportion of SS (%) |
| Variation | |||||
| Environments(E) | 9 | 2386119 | 265124355.8 | 576.3844*** | 63.79 |
| Genotypes(G) | 28 | 4921447 | 17576597.05 | 38.2117*** | 13.16 |
| G×E Interaction | 252 | 5684386 | 2255708.6 | 4.9039*** | 15.2 |
| Replication | 2 | 2246726 | 22467.26 | 0.0488 | 0 |
| Residuals | 639 | 2939261 | 459978.29 | 7.86 | |
| Total | 929 | 3740651 | 100 |
Note: **, p < 0.01; ***, p < 0.001.
Table 4.
Variance analysis for maize yield (kg/ha) in 2024.
| Source of | Degrees of Freedom (DF) | Sum of Squares (SS) | Mean Squares | F-Calculated | Proportion of SS (%) |
| Variation | |||||
| Environments(E) | 9 | 2386119 | 265124355.8 | 576.3844*** | 63.79 |
| Genotypes(G) | 28 | 4921447 | 17576597.05 | 38.2117*** | 13.16 |
| G×E Interaction | 252 | 5684386 | 2255708.6 | 4.9039*** | 15.2 |
| Replication | 2 | 2246726 | 22467.26 | 0.0488 | 0 |
| Residuals | 639 | 2939261 | 459978.29 | 7.86 | |
| Total | 929 | 3740651 | 100 |
Note: **, p < 0.01; ***, p < 0.001.
Disclaimer/Publisher’s Note: The statements, opinions and data contained in all publications are solely those of the individual author(s) and contributor(s) and not of MDPI and/or the editor(s). MDPI and/or the editor(s) disclaim responsibility for any injury to people or property resulting from any ideas, methods, instructions or products referred to in the content. |
© 2025 by the authors. Licensee MDPI, Basel, Switzerland. This article is an open access article distributed under the terms and conditions of the Creative Commons Attribution (CC BY) license (http://creativecommons.org/licenses/by/4.0/).
Copyright: This open access article is published under a Creative Commons CC BY 4.0 license, which permit the free download, distribution, and reuse, provided that the author and preprint are cited in any reuse.


