
Submitted:
11 April 2025
Posted:
14 April 2025
You are already at the latest version
Abstract
Maize (Zea mays L.) is an important agricultural crop, but its yield often varies due to unfavorable climatic conditions and agrotechnical factors. The research aimed to determine the influence of climatic conditions and sowing density on the number of rows of grains per cob, the thousand kernel weight, the number of plants in the harvest and the grain yield of different maize hybrids. The experiment was conducted in Leskovac, Republic of Serbia, during four growing seasons (2014-2017) on alluvial soil. The research included six maize hybrids from three FAO ripening groups (400, 500 and 600) in three sowing densities (71.428, 57.143 and 47.619 plants per ha). The results show that the sowing density, the hybrid and the climatic conditions significantly influenced the yield components and the total grain yield. The increase in sowing density caused a decrease in the thousand kernel weight and the number of rows of grains per cob. At the same time, above-average temperatures and a deficit of precipitation negatively affected the yield, especially during 2015. The highest yield was recorded with hybrids from FAO group 500, medium sowing density. The results indicate the need for a localized approach in the selection of hybrids and adaptation of agrotechnical measures in order to mitigate the negative effects of climate change.
Keywords:
maize
; precipitation deficit
; temperature stress
; yield variability
1. Introduction
Maize (Zea mays L.) is one of the most important agricultural crops in the world, thanks to its adaptability to different agro-climatic conditions and wide application. It is used for human consumption, animal feed, industrial processing and biofuel production [1,2,3]. Maize production is carried out on more than 197 million hectares worldwide and produces more than 1.13 billion tons of grain [4,5]. In Serbia, the average yield of maize is 4.4 t ha−1, with an annual production of approximately 6.631.000 tons [6]. Despite the significant potential for yield (14.5 t ha−1), oscillations in production are often caused by unfavorable weather conditions, such as lack of rainfall, and poor distribution of rainfall, but also factors such as insufficiently prepared land, inadequate fertilization, inappropriate sowing density and sowing time [3,7,8].
The selection of hybrids that are adapted to specific agroecological conditions and optimal sowing density is of key importance for increasing yields. Yield is significantly influenced by the number of rows of grains per ear, the thousand kernel weight, and the number of plants at harvest [7,9,10]. Genetic characteristics of hybrids, together with production conditions and applied agrotechnical measures, play an important role in yield formation [11,12]. Increasing seeding density is recognized as an effective measure to achieve higher yields [13], with different genotypes showing variability at increasing density in terms of yield and yield components [14].
The number of rows of grains per cob, as a hereditary trait, can change under the influence of agrotechnical factors [15]. The thousand kernel weight varies between hybrids and depends on agrometeorological conditions and the level of applied nutrients [16]. An increase in seeding density most often leads to a statistically significant decrease in grain mass [17]. Maize yield is affected by the number of grains per cobs and grain weight, while these traits are significantly affected by weather conditions during the growing season [18].
Key factors affecting corn production include not only seeding density but also hybrid selection, temperature and rainfall. For example, climate change, temperature rise and lack of precipitation during July and August, often associated with droughts, significantly affect yield reduction [19,20,21,22,23]. Hybrids with a shorter growing season showed advantages in avoiding summer droughts, which contributes to the preservation of yields in unfavorable conditions [24].
Sowing density and its impact on yield depend on several factors, among which are the length of hybrid vegetation, morphological characteristics of the plant, moisture reserves in the soil, sowing time and fertility level [25]. The variability of sowing density depends on the genotype, agroecological conditions and applied agrotechnical measures in production [26,27]. Increasing demand for maize in livestock and industry, continued population growth, and decreasing arable land contribute to the challenge of increasing maize yield and quality [28,29]. Studying the impact of climatic factors is important for assessing the impact of climate change on crop production [30]. Considering the importance of climatic conditions and sowing density, as well as their influence on yield components, the research aimed to contribute to a better understanding of the interdependence of these factors and their influence on the number of rows of grains in the cob, the thousand kernel weight, the number of plants at harvest and maize yield.
2. Materials and Methods
2.1. Experimental
A four-year field experiment was conducted during the growing seasons of 2014-2017 at the Leskovac location (43°01'476” N, 21°56'126” E), on alluvial soil, at an altitude of 225 m. The experiment was set up on the farm of the secondary agricultural school in Leskovac (Jablanički district) under dry farming conditions. The pre-crop in all investigated years was winter wheat, which ensured a uniform starting point for the research. The trial was set up in a randomized block system with three replications. Each plot had four rows of hybrids 7 m long.
2.2. Plant Material
The experiment used six perspective maize hybrids, created at the Zemun Polje Maize Institute, Serbia and the Novi Sad Agricultural and Vegetable Institute, Serbia). Hybrids from three different FAO ripening groups were selected, to determine the influence of different hybrids on yield and yield components. 6 maize hybrids were tested: ZP 434 and NS 4023 from FAO group 400, ZP 555 and NS 5051 from FAO group 500, and ZP 666 and NS 6030 from FAO group 600. Sowing was done in mid-April every year in three sowing densities: 20×70 cm (SD I), 25×70 cm (SD II) and 30×70 cm (SD III), which target plant densities of approximately 71.428, 57.143 and 47.619 plants per hectare were achieved.
2.3. Soil Preparation and Fertilization
The basic cultivation of the soil was carried out by autumn ploughing at a depth of 30 cm, after which the mineral fertilizer NPK 16:16:16 (supplied by Elixir Zorka, Šabac, Serbia) was applied in the amount of 500 kg ha-1. In the spring, nitrogen fertilizer calcium ammonium nitrate (CAN, 27% N) was applied in two phases: 60% of the required nitrogen was applied in the 3-4 leaf phase, while the rest was applied in the 7-8 leaf phase. Weed control was carried out at the sixth leaf stage with a tank mix of Callisto WG® (mesotrione 125 g a.i. ha-1 - Syngenta, Rosentalstrasse 67, 4058 Basel, Switzerland) plus Motivell extra 6 OD® (nicosulfuron 45 g a.i. ha-1 - Certis Belchim, Technologielaan 7, 1840 Londerzeel, Belgium) was applied for postemergence weed control.
2.4. Soil Characteristics
In order to determine the pH value, the content of humus, nitrogen, phosphorus and potassium, and the presence of carbonates, an agrochemical analysis of the soil was performed before the start of the experiment. Soil acidity was measured electrometrically on a pH meter by measuring the voltage created by the activity of hydrogen ions in the soil suspension in a normal KCl solution, using the Kappen method. The humus content was measured using the Kotzman method. The nitrogen content was determined by calculation through the humus content, and it is shown in percentage. Easily accessible phosphorus and potassium were determined by the Al-method (according to Egner-Riehm), by reading the optical density of phosphorus on a spectrophotometer, and of potassium on a flame photometer, and displayed in milligrams per 100 g of soil. The soil is moderately acidic (pH in KCl 5.78 The measured humus content in the topsoil (2.65%) classifies this soil into the group of poorly supplied with humus and moderately supplied with total nitrogen (0.13%). An optimal content of phosphorus (17.56 mg P2O5 100 g-¹ of soil) and a high content of potassium (34.00 mg K2O 100 g-¹) were found, while carbonates were not found.
2.5. Meteorological Conditions
Figure 1 shows data on average monthly air temperatures (Figure 1a), amount and distribution of precipitation (Figure 1b) during the experiment and multi-year averages for the Leskovac location, which were obtained from the meteorological station in Leskovac.
Significant annual variations in climate conditions were observed both during the multi-year period (1961-2013) and during the study period. In 2015, during the growing season, 433.9 mm fell, which is 337.0 mm less than in 2014 (Figure 1a), while the average monthly temperature during the growing season was 17.0°C, which is 1.2°C higher than in 2014 that is 1.7°C compared to the multi-year average (Figure 1b). A particularly unfavorable period was during June, July and August, with 102.8 mm of precipitation and an average monthly temperature of 22.4°C during these three months, which classifies the year 2015 as extremely unfavorable for maize production. During the vegetation period in 2016, 569.8 mm fell, with an average monthly temperature of 16.4°C, while in 2017 only 434 mm fell, with an average temperature of 16.9°C.
In 2014, 2015, 2016, and 2017, the average air temperature was 0.5°C, 1.7°C, 1.1°C, and 1.6°C, which is higher than the multi-year average, especially in important periods of growth and development (Figure 1b).
2.6. Measurement and Analysis Methods
During the harvest at the technological maturity of maize, the following traits were monitored: grain yield reduced to 14% moisture, total number of plants at harvest (NPH), number of grain rows on the cob (NGR), thousand kernel weight (TKW). Samples of 12 plants from each plot were used for laboratory analyses, which were performed in the laboratory of PSSS Leskovac. The thousand kernel weight was determined by measuring on an analytical balance, while the number of rows of grains was visually counted on the cobs.
2.7. Statistical Analysis
IBM SPSS v25 [31] and GenStat 18.1 [32] were utilized. To evaluate the impact of years, hybrids, and sowing density, an analysis of variance (ANOVA) was used, with a significance level of p < 0.05. The relationship between yield components was also verified using Pearson's correlation analysis. To evaluate the relationship between the combination of year x sowing density and genotype, AMMI analysis (Additive Main Effects and Multiplicative Interaction) was employed. The hybrid stability and adaptability are seen through the use of AMMI 1 and AMMI 2 diagrams, which graphically present the results.
3. Results
3.1. Grain Yield
Figure 2 shows the average grain yield values of six maize hybrids grown at different seeding densities over four years. The highest average grain yield values were achieved in the third year of research (2016), viewed in general, as well as by values for each grown hybrid separately. The meteorological conditions that prevailed in this growing season were the most favorable for the hybrids to realize their full genetic potential. The highest performance is observed in ZP 555 (15.07 t ha-1) and NS 5051 (14.68 t ha-1) with SDI and SDII, and ZP 666 (14.85 t ha-1), with SDII and SDIII (Figure 2). Observing average values that were obtained in the first year of research (2014), the highest yield was achieved with all hybrids in the higher sowing density SD I, and the obtained values ranged from 9.96 t ha-1 (NS 4023) to 11.06 t ha-1 (NS 6030).
The lowest average values for all hybrids at different sowing densities were achieved in the second year of the study (2015). This year, in terms of climatic conditions (values of mean monthly air temperatures and the distribution and amount of precipitation) during the growing season, was significantly different compared to other years, which adversely affected the qualitative characteristic of grain yield, which is why maize is grown (Figure 2). The lowest average grain yield was achieved in the first sowing density SD I with NS 5051 (5.73 t ha-1), NS 4023 (5.79 t ha-1) and NS 6030 (5.87 t ha-1). The highest yields in conditions of high temperatures and poor distribution of precipitation are achieved with the lowest sowing density (SD III). These obtained values are significantly lower compared to the values (2016), which produced the best results are shown in Figure 2. The 2015 growing season was characterized by a rainfall deficit, with only 255.9 mm recorded compared to 569.8 mm in 2016. There was a noticeable increase in temperature in July 2015 (24°C vs. 22.8°C in 2016), which had a bad effect on pollination and grain formation, which are key phenological phases for yield formation. The decrease in yield in 2015, especially at the SD I seeding density, indicates that higher plant densities increased competition among plants for water due to limited water resources during the dry period. In 2016, when precipitation was abundant and evenly distributed (114 mm in July), competition between plants was less pronounced.
All maize hybrids and their genetic characteristics showed variations at different sowing densities, which indicates that the factors examined had a statistically significant impact, both individually and in mutual interaction. When choosing maize hybrids,these results should betaken into account, which shows at which sowing densities maize hybrids achieve the best potential in terms of yield under the influence of climatic conditions, as a decisive production factor.
Analysis of the variance of the AMMI model revealed a statistically very significant influence of genotype (G), the external environment (E) and their interaction G×E on grain yield (Table 1). At the same time, the external environment had the greatest influence on the total variation of the sample and explained 83.56% of the variability of this complex trait. The share of genotype was significantly lower and amounted to 3.53%, while the share of interaction was 12.26%.
The high share of the external environment in the total variation reflects the existence of significant differences between sowing densities and years, which caused most of the variation in the formation of maize grain yield. Analysis of the interaction revealed three main components, with all three components exhibiting statistical significance (p<0.01), which are shown in Table 1. The first principal component explained 71.57% (IPCA1) of the interaction, the second 20.73% (IPCA2) and the third 8.5% (IPCA3) of the interaction (Table 1).
In all observed environments (years-sowing densities), the highest stability of grain yield in relation to the first main component (IPCA1) was shown by hybrids ZP 555 and NS 5051, which achieved a higher average value of grain yield than the general average of the trial. The least stability and the lowest average grain yield were recorded in hybrids NS 4025 and ZP 434 (Figure 3a).
It can be seen that the highest grain yield was achieved in 2016 in I, II and III sowing density. At the same time, the tested corn hybrids achieved the highest yield in the I sowing density, while in the II and III densities they had high interaction values (Figure 2). This is explained by the fact that the yield of these densities in 2016 was very variable. Grain yields in 2014 were the highest in I and II sowing density, while the lowest yields were achieved in III density, significantly lower than the general average of the trial. At the same time, the most stable yields were achieved in I and II sowing density. During 2015 and 2017, there were very unfavorable conditions for the growth and development of maize. In the period of grain formation and pouring, in both studied years, high air temperatures and low amounts of precipitation were recorded, as a result of which the studied maize hybrids, in all three sowing densities, achieved below-average yields (Table 2, Figure 3a). However, the most stable yields in 2014 were achieved in II, and in 2015 in III sowing density.In 2017, the low rainfall in July (34 mm) and high temperature (23.5°C) during grain filling further explain the below-average yields, emphasizing the critical role of moisture availability at this stage.
A more precise explanation of the interaction, i.e. the behaviour of maize hybrids in different environmental conditions, is shown by the AMMI 2 biplot, where the first and second components (IPCA1 and IPCA2) explain 92.3% of the impact of the interaction on grain yield. According to this model, ZP 555 and NS 5051 stood out as the most stable hybrids. The greatest interaction effect, and thus the lowest stability in all studied environments, was achieved by hybrids of FAO ripening group 400 (ZP 434 and NS 4023) in Figure 3b. The examined conditions of the external environment (year-density of sowing), which are located closer to the centre, are characterized by greater stability. In this regard, 2014 stood out in I and II density, as well as 2017 in II sowing density. The highest interaction value, and thus instability, was observed in 2016 in the III density and in 2017 in the sowing density (Figure 3b).
3.2. Number of Plants in Harvest
The obtained results clearly show that all the tested maize hybrids achieved the highest values of the number of plants at harvest (NPH) when they were grown in the group of plants that was formed at the first sowing density (SD I) and this trend was observed throughout all growing seasons (Figure 4).
In the third year of research (2016), the highest achieved average values of NPH in the harvest were recorded at the sowing density SD I. In the hybrid NS 6030, NPH was 71.07, in ZP 666, 70.93 were found and in ZP 434, 70.64 plants were measured. These values are very different compared to the values achieved by the same hyrbrids in this growing season, only in other sowing densities (SD II and SD III). The first year (2014) of the research is also characterized by higher average values for NPH, which were close to those achieved in the most favorable year (2016). In 2016, hybrid ZP 434 achieved an average NPH of 70.42, with ZP 555 of 70.24 and the same number with ZP 4023 and NS 5051 (70.22) are shown in Figure 4.
A significantly lower number of plants in all six hybrids was formed at the SD III sowing density in all growing seasons. The lowest values for all maize hybrids were achieved in the second year of research (2015) at different sowing densities. The lowest number of plants was measured in SD III and was 35.76 (NS 6030), 36.93 (ZP 666) and 37.12 (NS 5051). These values show that the sowing density factor had a statistically very significant influence on the number of formed plants and, in interaction with the year, showed significant differences in the obtained values by vegetation seasons in the monitored genotypes (Figure 4, Table 2). The lower number of plants per hectare (NPH) in 2015, especially at SD III, is a consequence of extremely low rainfall in July (6 mm) and elevated temperatures (24°C). In contrast, the higher NPH in 2016 at SD I is a consequence of the field layout and the amount of precipitation in July (114 mm).
AMMI analysis of variance for NPH showed a very significant influence of genotype, external environment and G×E interaction (p<0.01), where the external environment accounts for the largest part of the sum of squares of the samples (99.37%), and significantly less for the genotype and interaction (0.07%, 0.38%). This indicates that between the studied external environments, both year and sowing density, there was a significant difference that caused most of the variations in the formation of these features. The analysis of the multivariate part revealed three main components, of which only the first showed statistical significance and explained 86.67% of the interaction (Table 2).
The AMMI 1 biplot analysis shows that in relation to the first main component, ZP 434 and NS 5051 stood out as the most stable hybrids for NPH. All studied hybrids achieved average NPH values at the level of the general average of the trial. As expected, the highest NPH in all four analyzed years was achieved in I sowing density, slightly lower in II, and the lowest in III sowing density (Figure 5).
The analyzed hybrids achieved the highest NPH stability in I and II sowing density in 2014, I sowing density in 2016 and II sowing density in 2017 (Figure 5). In the III seeding density of 2015, the greatest effect of inerrancy was manifested.
3.3. Number of Rows of Grains in a Maize Cob
Analyzing the maize yield component, the number of rows of grains in the maize cob (NGR), we can see, based on the data shown in Figure 6, that the highest average values were achieved in 2016. Maize hybrids ZP 666, NS 6030 and NS 5051 showed a statistically very significant difference in the obtained values for this trait compared to the rest of the tested hybrids. The highest average value was measured with ZP 666, NS 6030 and NS 5051, but in different sowing densities. The highest value of the number of rows of grains in the maize cob in the hybrid ZP 666 of 17.56 was found at the sowing density SD III, then in NS 6030 in the sowing density SD I (17.41) and in the hybrid NS 5051 in the density SD II (17.30). It can be clearly seen from Figure 6 that the lowest average values of the number of rows of grains in the ear of maize were achieved in the second year of the research and this is the case with all examined hybrids of maize. The increased NGR in 2016, especially in ZP 666 at SD III, corresponds to optimal temperatures (21.9°C in June, 22.8°C in July) and precipitation (63 mm and 114 mm, respectively) during silking, which had a positive effect on pollination. In contrast, the lower number of NGR at NS 4023 at SD I in 2015 is a consequence of insufficient rainfall in June (33 mm) and high temperature in July (24°C). The unfavorable conditions that prevailed during 2015 affected the functionality of pollen and grain formation.
The year factor had a statistically significant influence on this trait, both individually and in interaction with the sowing density factor shown in Figure 6. The lowest average values were at the sowing density of SD I with the hybrid NS 4023 (13.35), and then at the same sowing density with the hybrids ZP 434 (13.57) and NS 6030 (14.40). The fourth year of research (2017) is characterized by the fact that hybrids ZP 434 and NS 4023 achieved similar results in all planting densities. Average values for ZP 434 ranged from 14.32 (SD III) to 14.42 (SD I). In NS 4023, average values of 14.37 (SD III) to 14.41 (SD II) were measured. The remaining monitored hybrids (ZP 555, NS 5051, ZP 666, NS 6030) also had approximate values of the number of rows of grains in a maize cob that ranged from 15.43 to 15.66 at different sowing densities (Figure 6). Sowing density showed a statistically significant effect in interaction with year, as well as in interaction with different hybrids.
The analysis of the variance of the AMMI model showed that in NGR expression, all sources of variation, both additive (genotype, sowing density and year) and non-additive (G×E) showed high significance (Table 3). Within the main effects of the analysis of variance, the largest share of the sum of squares belongs to the external environment (50.37%) and genotype (39.24%), while the share of interaction is significantly smaller (5.34%), Figure 5A. Within the multivariate part, three main components were singled out, the first two of which showed high statistical significance (p<0.01). The first principal component explained 78.30% of the variation, the second 17.33%, and the third component only 1.67% of the variation (Table 3).
The AMMI 1 biplot shows the relationship between the first principal component (IPCA1) and the average value of NGR in three sowing densities over four years shown in Figure 7a.
In all observed environments, hybrids ZP 555 and NS 5051 exhibited the highest stability in relation to IPCA1, while the lowest stability was observed in hybrids ZP 434 and NS 4023 (Figure 7a). However, all studied hybrids achieved lower average NGR values than the general average of the trial.
Observing the studied environments, it can be seen that the highest average values of NGR were achieved in 2016 at all three sowing densities. At the same time, the highest interaction effects and thus the lowest stability were observed in these environments. The highest stability of NGR was achieved in 2014 and then in 2017, with all three sowing densities (Figure 7a). At the same time, the average values of NGR were significantly higher in 2014 compared to 2017.
In order to interpret the G×E interaction in more detail, on the manifestation of NGR, the AMMI 2 biplot is shown. According to this model, the hybrids of the FAO ripening group 500 (ZP 555 and NS 5051) in Figure 7b, were singled out as the most stable hybrids.
The lowest interaction effect and thus the highest stability of NGR was achieved in 2014 at all sowing densities, while the highest interaction effect was achieved in 2016 (I, II and III sowing density), Figure 7b. The lowest stability in all of the studied environments (year-plant density) hybrids of FAO ripening group 400 (ZP 434 and NS 4023) showed.
3.4. Thousand Kernel Weight
The average values of the thousand kernel weight (TKW) are shown in Figure 8, where we can see that the highest values were achieved in the most favorable year of the research, 2016.
All maize hybrids achieved the highest values of thousand kernel weight when grown in SD III sowing density. The highest average TKW value of 438.20 g was measured in hybrid ZP 555, followed by hybrid ZP 666 of 430.78 g and NS 5051 of 422.79 g shown in Figure 8. Analyzing the influence of the factor of seeding density, it is noticeable that at the seeding density SD I, in all investigated growing seasons, the smallest values of TKW is noticeable. It is noted that in the first growing season (2014) the average values of TKW at the sowing density SD II were the smallest differences in values between the hybrids and ranged from 372.37 g to 387.15 g. The lowest average values for all maize hybrids were recorded in the second year of the research (2015) and when growing with a sowing density of SD III. Thousand kernel weight values were 280.16 g for NS 6030, 282.90 g for ZP 666 and 286.32 g for ZP 5051 are shown in Figure 8.
The tested factors showed that there were very significant differences in the obtained values for all six hybrids. A significant increase in TKW in 2016 at SD III, especially for ZP 555, is closely related to higher precipitation in July and August (114 mm and 30 mm) and moderate temperatures (22.8°C and 21.4°C), which had a positive impact on the phenological phase of grain filling. In 2015, a drastic decrease in TKW for NS 6030 at SD III was due to drought in July (6 mm) and high temperature (24°C).
Using the analysis of variance of the AMMI model, a very significant influence of genotype and external environment (p<0.01) on TKW was determined, while the influence of the G×E interaction was not statistically significant (Table 4). In the sum of squares of the total variance, as much as 90.28% is attributed to the external environment, 2.13% to the genotype and 2.63% to the interaction.
3.5. Correlation Coefficients
Between the studied productive traits of maize hybrids, the correlation coefficients showed different values and statistical significance (Figure 9). The correlation dependence is positive and very strong between the traits NGR and GY (r=0.75**), TKW and GY (r= 0.73**), NGR and TKW (r=0.66**). A positive and weak correlation dependence was established between GY and NHP (r= 0.26), NGR and NHP (r=0.19), TKW and NPH (r= 0.12).
4. Discussion
The results of the study indicate that the seeding density, climatic conditions and their interaction significantly influence both the individual components of maize grain yield and the total yield. During the research, there were significant variations in the production of maize during the growing seasons. Hybrids reacted differently to climatic conditions, high air temperatures and unevendistribution of precipitation during the growing season. This suggests that genotype, seeding density and external environment have a significant influence on yield formation.
4.1. Influence of Sowing Density and Genotype on Grain Yield
Research indicates that sowing density, genotype and their interaction with environmental conditions significantly affect the yield of corn grains (p<0.01). This statement is proven by the AMMI analysis of variance. The highest yields were recorded in 2016, where ZP 555 and ZP 666 achieved 15.07 t ha⁻¹ and 14.85 t ha⁻¹ at SD II (57,143 plants ha⁻¹), while NS 5051 reached 14.68 t ha⁻¹ at SD I (71,428 plants ha⁻¹). These results are consistent with the research results of Raza et al. [33], Tuong et al. [34], Zhang et. al. [35], and Yang et. al. [36], who proved that optimal plant densities increase corn grain yield. In contrast, the lowest yields were achieved in 2015 (e.g. 5.73 t ha⁻¹ for NS 5051 at SD I), which indicates the sensitivity of corn hybrids to stress at different densities in unfavorable production conditions (high temperature, poor distribution and low rainfall). That climatic conditions, especially during the growing season, have a significant impact on crop yield, especially when the interaction of multiple parameters is manifested, has been established in research [37,38,39,40,41,42].
The effects of sowing density were specific for hybrids: hybrids FAO 500 (ZP 555, NS 5051) stood out at higher densities (SD I, SD II), while hybrids FAO 400 (ZP 434, NS 4023) showed weaker results at all densities under stress conditions, especially in 2015. This indicates that adjusting seeding density based on genotype is key to achieving maximum yields, which confirms the conclusions of Chen et al. [43], Liu et al [44], and Solomon et al. [45]. The optimal plant density for maximum grain yieldmustbe adapted to the conditions of the area [46]. In their research Ni and Wellend [47] point out that the density of sowing and the optimal number of plants differ significantlybecause the localities of cultivation are characterized by specific climatic conditions, primarily airtemperatures and the amount and distribution of precipitation.
4.2. Climatic Conditions And their Influence on Yield Components
The beginning, duration, and end of the growing season and the phenological phase of maize depend on weather conditions [48], including average air temperature and monthly precipitation. These two climatic indicators differed between the years studied, as well as from the multi-year average. Climatic conditions, especially temperature and precipitation during key phenological stages, had a dominant influence on grain yield and its components, explaining 83.56% of the total yield variability. In 2016, favorable conditions of evenly distributed rainfall (569.8 mm) and an average growing season temperature of 15.67°C enabled the hybrids to realize their genetic potential (12.95 t ha-¹, average for all hybrids and densities). 2016 saw the highest average yield in the four-year study 15.07 t ha-¹ (ZP 555, SD II). In contrast, 2015 was marked by a deficit of precipitation (255.9 mm) and elevated temperatures (17.06°C, 1.27°C above 2014), especially during June-August (102.2 mm, 22.36°C) when the average yield achieved for all hybrids and densities was 6.74 t ha-¹.
The yield increase in all hybrids was the least pronounced in 2015, the year with the least rainfall in the growing season. In the first and third years of the experiment, the average increase in the yield of all hybrids was higher, but the increasing tendency was also explained by the proper distribution of rainfall, especially in April, May and June. In a three-year study, Dugalić et al. [49] also found that the lowest yield increase was in the year with the lowest precipitation, which is in agreement with the results of our research.
Temperature largely controls crop phenological stages, especially flowering and maturity, which determine the growth duration length and thus grain yield [50]. During the silking and grain-filling phenological stages in July, an average temperature of 24°C was recorded, which exceeded the optimal 20-22°C for pollination [51]. This was reflected in a 61% yield reduction compared to 2016 (eg NS 5051: 5.73 t ha-¹ vs. 14.68 t ha-¹). Yang et al. [52] point out that аs ambient temperature increased, and the lengths of maize growing seasons were markedly shortened (3-14 days earlier reaching flowering and maturity) compared to the baseline data. Altogether, enhancing water use efficiency through breeding efforts, for example, by using maize hybrids resistant to drought and early ripening and managerial improvement by applying earlier sowing of maize and cover crops are warranted for moderating risk and even increasing productivity of maize in the future.
Climatic conditions affected yield components differently: number of plants at harvest (NPH), number of grain rows per ear (NGR) and thousand kernel weight (TKW).
Maize yield is significantly influenced by the number of plants in the harvest, i.e. formed cobs and grain weight, while these parameters are significantly affected by weather conditions during the growing season [52]. The highest NPH values (e.g. 71.07 for NS 6030 at SD I in 2016) were achieved in the year with optimal amounts of precipitation (114 mm in July 2016). In 2015, the lowest number of plants was achieved, 35.76 (NS 6030 at SD III) due to drought stress (6 mm in July).
The number of grain rows per ear (NGR) showed a highly significant interaction between genotype, seeding density and year. The highest number of grains was measured in 2016 (17.56 for ZP 666, SD III) with balanced moisture and moderate temperature (21.9-22.8°C, June-July). In 2015, heat stress (average temperature 24°C in July) and low rainfall (33 mm in June) negatively affected pollination, which negatively affected NGR. These results are in agreement with the results obtained by Dong et al. [53]. In the research of Moussav et al. [54] plant density had a significant effect (p<0.05) on the number of grain rows. The authors state that by increasing the number of plants from 65.000 plants ha-1 to 95.000 plants ha-1, the number of grain rows decreases and the highest number of rows was obtained at 65.000 plants ha-1 with an average of 17.95 grain rows, which is in agreement with the results of our research. The hybrids ZP 666, NS 6030 and NS 5051 showed statistically verysignificant differences in this trait, while the hybrids of FAO ripening group 400 (ZP 434 and NS 4023) achieved the lowest values.
The thousand kernel weight (TKW) has a significant role in determining the grain yield of maize, and the clarification of its basic genetic mechanisms is a challenge to improve its performance [55]. The highest values of TKW were measured in 2016 (438.20 g for ZP 555, SD III) with an optimal amount of precipitation (569.8 mm), which had a favorable effect on grain filling. In 2015, the lowest TKW values of 280.16 g (NS 6030, SD III) were measured due to a 20-day dry period in July (6 mm), which negatively affected grain formation. The negative impact of high temperatures, especially in the critical stages of maize development, has a pronounced impact on the reduction of the thousand kernel weight [56,57], which is in line with the results of our research. Our research findings indicate that drought and heat stress during silking (June-July) and grain filling (July-August) are the primary causes of yield reduction, which is consistent with Qi et al. [58].
4.3. Genotype-Environment Interaction (G×E) and Yield Stability
AMMI analysis showed that genotype-environment (G×E) interaction accounted for 12.26% of yield variability, with IPCA1 explaining 71.57% of this effect. This gradient reflects the variability of precipitation and temperature, as 2015 and 2017 (255.9 mm and 434 mm, respectively) had below-average yields, while significantly higher yields were achieved in 2014 and 2016 (770.91 mm and 569.8 mm). Hybrids ZP 555 and NS 5051 showed the greatest stability, maintaining yields above the trial average (e.g. 15.07 t ha⁻¹ and 14.68 t ha⁻¹ in 2016) despite changing conditions. Their resistance to temperatures up to 23.3°C and rainfall of only 434 mm in 2017 emphasize their suitability for the agroecological conditions of southern Serbia.
In contrast, FAO group 400 hybrids (NS 4023) showed the least stability and lowest yields (e.g. 5.79 t ha⁻¹ for NS 4023 in 2015), indicating poor adaptation to high temperatures (24°C in July 2015) and drought (6 mm in July 2015). The results of the research are in agreement with Stojiljković et al. [38], who observed the superior performance of the hybrid FAO group 500 hybridsin changing climatic conditions. Stability was highest at SD I and SD II in 2014 (770.91 mm, 15.79°C), while SD III in 2016 showed a high level of interaction between density and optimal rainfall (569.8 mm).
The dominant influence of the external environment on variability (83.56% for yield, 99.37% for NPH, 90.28% for TKW) emphasizes its influence in relation to genotypic effects (3.53% for yield, 2.13% for TKW). This research is in agreement with the research of Cvijanović et al. [16], where the authors state that thousand kernel weightvaries between hybrids and depends on agrometeorological conditions. For TKW, our results deviate from Novosad et al. [55], who emphasized a genotypic influence. In this research, external factors are dominant (e.g. 90.28% of variability) due to extreme conditions during the investigated period, which indicates that the selection of hybrids alone cannot alleviate severe stress. Ljubičić et al. [59], reported a lower proportion of the environment (58.97%), probably due to milder climate fluctuations in their study.
The distribution of precipitation showed a greater influence on the examined parameters than the total amount of precipitation. In 2017, the total precipitation during the period June-August was 73 mm, with an average temperature of 22.9°C, which resulted in a higher grain yield compared to 2016 when 207 mm of precipitation fell during the period June-August. This confirms the importance of precipitation during the phenological stages of silking-grain filling, which coincides with the period June-August. This confirms the need to align seeding density and hybrid selection with seasonal forecasts, as suggested by Djamana et al. [46].
By observing the average monthly air temperatures along with the amount and distribution of precipitation by month, during the four-year study, it can be concluded that the thermal conditions were the most favorable during the production year 2016. In this year, the period from June to August stands out as particularly favorable and is very important for the formation of yields. On the other hand, 2015 had much less precipitation and was the worst for corn production.
4.4. Practical Application and Future Directions
Adjusting seeding density to specific hybrid requirements - SD II for ZP 555, SD I for NS 5051 - can increase yield in favorable conditions (years like 2016) and mitigate losses during stress (years like 2015). Hybrids with stable yields (ZP 555, NS 5051) are recommended for the variable climate of Leskovac, characterized by acidic soils (pH 5.78) and fluctuating rainfall (255.9-770.91 mm).
5. Conclusions
The results of this research indicate a significant role of climatic conditions and sowing density in the formation of yield and yield components of maize grains. Climatic conditions in the interaction of genotype and external environment proved to be the main factor of variability. This interaction had a highly significant effect on the yield components. The highest yield wereachieved in 2016, which was characterized by optimal meteorological conditions, while unfavorable conditions in 2015 were followed by a significant decrease in the yield of the tested hybrids.
Sowing density had a significant effect on all studied parameters. Optimum values for yield and yield components depended on the specifics of the hybrid and climatic conditions. FAO group 500 hybrids ZP 555 and NS 5051 showed the highest average yields and high stability. Hybrids of FAO ripening group 400 (ZP 434 and NS 4023) achieved lower yields and worse adaptability to different climatic conditions. Hybrids of the FAO ripening group 500 (ZP 555 and NS 5051) best tolerate tight conditions during the critical phenophases of plant development and are capable of achieving a high yield even in years with pronounced climate changes, such as 2015 and 2017. As such, they can be considered widely adapted to different environmental conditions and desirable in maize breeding programs.
The dominant influence of the external environment in the total variability (over 80%) indicates the necessity of correcting agrotechnical measures, especially sowing density, and correctly choosing the hybrid. Application of the results of this research in practice can contribute to more sustainable corn production in different agroecological conditions.
Author Contributions
All authors have participated in this research. DT, VR, NĐ, VB and JS have designed and written the paper; Conceptualization, DT, VR, NĐ, VP and JS; methodology, DT, VR, NĐ, VP and JS; software, VB, BŠ, IT, DU and KL; validation, VB, BŠ, IT, DU and KL; formal analysis, VB, BŠ, IT, KL and DU; writing-review and editing, DT, VR, VP, DU, BŠ, IT and KL; visualization, NĐ, VB, VP, DU and JS; supervision, DT, VR, KL, VP and JS; funding acquisition, DT, VR, and NĐ; data curation, BŠ; investigation, IT; resources, JS; project administration, NĐ. All authors have read and approved the final manuscript.
Funding
This research was funded by Ministry of Education, Science and Technological Development of the Republic of Serbia (Grant No. 451-03-137/2025-03/200383; 451-03-136/2025-03/200216, 200032 and 200040), by the Bilateral Project between the Republic of Serbia and the Republic of Croatia (2025-2027): “Alternative and fodder plants as a source of protein and functional food”, and Project Bulgaria and Republic of Serbia (2024-2027): “Intercropping in maize growing for sustainable agriculture”.
Institutional Review Board Statement
Not applicable.
Data Availability Statement
Not applicable.
Acknowledgments
The authors thank the Institute for Field and Vegetable Crops Novi Sad and the Maize Research Institute Zemun Polje of the Republic of Serbia.
Conflicts of Interest
The funders had no role in the design of the study; in the collection, analyses, or interpretation of data; in the writing of the manuscript; or in the decision to publish the results.
References
- Szareski, V.J.; Carvalho, I.R.; Kehl, K.; Pelegrin, A.J.; Nardino, M.; Demari, G.H.; Barbosa, M.H.; Lautenchleger, F.; Smaniotto, D.; Aumonde, T.Z.; Pedó, T., Souza, V.Q. Interrelations of Characters and Multivariate Analysis in Corn. The Journal of Agricultural Science, 2018, 10(2), 187-195. https://api.semanticscholar.org/CorpusID:55968986. [CrossRef]
- Dustgeer, Z.; Seleiman, M.F.; Chattha, M.U.; Alhammad, B.A.; Jalal, R.S.; Refay, Y.; Hassan, M.U. Glycine-betaine induced salinity tolerance in maize by regulating the physiological attributes, antioxidant defense system and ionic homeostasis. Notulae Botanicae Horti Agrobotanici Cluj-Napoca 2021, 49(1), 12248-12248. [CrossRef]
- Mandić, V.; Đorđević, S.; Brankov, M.; Živković, M.; Lazarević, M.; Keškić, T.; Krnjaja, V. Response of yield formation on mayze hybrids to different planting densites. Agriculture 2024, 14, 351. [CrossRef]
- Zhao, G. Transcriptome analysis revealed the key genes and pathways involved in seed germination of maize tolerant to deep-sowing. Plants 2022, 11, 359–371. [CrossRef]
- Queenta, N.N.; Olubukola, O.B.; Mulunda, M. Aflatoxins in maize: can their occurrence be effectively managed in Africa in the face of climate change and food insecurity. Toxins 2022, 14, 574–584. [CrossRef]
- SIRS, Statistical Yearbook of the Republic of Serbia: Belgrade, Serbia, 2023.
- Assefa, Y.; Vara Prasad, P.V.; Carter, P.; Hinds, M.; Bhalla, G.; Schon, R.; Jeschke, M.; Paszkiewicz, S.; Ciampitti, I.A. Yield Response to Planting Density for US Modern Corn Hybrids: A Synthesis-Analysis. Crop Science 2016, 56, 2802–2817. [CrossRef]
- Bernhard, B.J.; Below, F.E. Plant population and row spacing effects on corn: Plant growth, phenology, and grain yield. Agronomy Journal 2020, 112, 2456–2465. [CrossRef]
- Testa, G.; Reyneri, A.; Blandino, M. Maize grain yield enhance-ment through high plant density cultivation with different inter-row and intra-row spacings. European Journal of Agronomy 2016, 72, 28–37. [CrossRef]
- Antônio, J.; Toebe, M.; Carvalho M.A.; Rodrigues de S.R.; Moraes, P.M.; Sergio Marchioro, V. Corn hybrids grain yield submitted to different sowing densities in the medium-high Uruguay region of Rio Grande do Sul. Revista Ceres 2024, 71. [CrossRef]
- Paraschivu, M.; Cotuna, O.; Paraschivu, M.; Olaru, L. Effects of interaction between abiotic stress and pathogens in cereals in the context of climate change: an overview. Annals of the University of Craiova - Agriculture, Montanology, Cadastre Series 2019, 49(2), 413-424.
- Partali, E.; Paraschivu, M. Results regarding the effect of crop rotation and fertilization on the yield and qualities at wheat and maize in South of Romania. Scientific Papers, Series A, Agronomy 2020, LXIII(2), 184-189.
- Yerlikaya, B.A., Ömezli, S.; Aydoğan, N., 2020. Climate change forecasting and modeling for the year of 2050. Environment, climate, plant and vegetation growth, Editors: Fahad, S.; Hasanuzzaman, M.; Mukhtar, A.; Ullah, H.; Saeed, M.; Khan, B.; Adnan, M. Publisher: Springer, New York, NY, 2020; Chapter 5, pp. 109–122. [CrossRef]
- Tokatlidis, I.S. Adapting maize crop to climate change. Agronomy for Sustainable Development 2013, 33, 63–79. [CrossRef]
- Abuzar, M.R.; Sandozai, G.U.; Baloch, A.A.; Shah, I.H.; Javaid, T.; Hussain, T. Effect of plant population densities on yield of maize.TheYournal of Animal and Plant Sciences 2011, 21(4), 692-695.
- Cvijanović, G.; Udvardi, I, Stepić, V.; Đurić, N.; Cvijanović, V.; Đukić, V.; Dozet, G. Masa 1000 zrna i visina prinosa kukuruza gajenog u konvencionalnoj i organskoj proizvodnji. Zbornik naučnih radova Instituta PKB Agroekonomik / Weight of 1000 grains and yield height of corn grown in conventional and organic production. Collection of scientific papers of the Institute of PKB Agroeconomics 2018, 24(1-2), 123-129.
- Shafi, M.; Bakht, J.; Ali, S.; Khan, H.; Khan, M.A.; Sharif, M. Efect of planting density on phenology, growth and yield of maize (Zea mays L.). Pakistan Journal of Botanical 2012, 44(2), 691-696.
- Yang, B.; Wu, S.; Yan, Z. Effects of Climate Change on Corn Yields: Spatiotemporal Evidence from Geographically and Temporally Weighted Regression Model. ISPRS International Journal of Geo-Information 2022, 11(8), 433-454. [CrossRef]
- Branković-Radojičić, D.; Babić, V.; Girek, Z.; Živanović, T.; Radojičić, A.; Filipović, M.; Srdić, J. Evaluation of maize grain yield and yield stability by AMMI analysis. Genetika 2018, 50(3), 1067-1080. [CrossRef]
- Hong, H.; Li, F.W.; Xu, J. Climate risks and market efficiency. Journal of Econometrics 2019, 208(1), 265-281. [CrossRef]
- Levin, K.; Waskow, D.; Gerholdt, R. (2021). 5 Big Findings from the IPCC´s 2021 Climate Report. https://www.wri.org/insights/ipcc-climate-report.
- Wang, T.X.; Li, N.; Li, Y.; Lin, H. X.; Yao, N.; Chen, X.G.; Li Liu, D.; Yu, Q.; Feng, H. Impact of climate variability on grain yields of spring and summer maize. Computers and Electronics in Agriculture 2022, 199, 107101. [CrossRef]
- Li, T.; Zhang, X. P.; Liu, Q.; Yan, P.; Liu, J.; Chen, Y. Q.; Sui, P. Yield and yield stability of single cropping maize under different sowing dates and the corresponding changing trends of climatic variables. Field Crops Research 2022, 285, 108589. [CrossRef]
- Wu, W.; Yue, W.; Bi, J.; Zhang, L.; Xu, D.; Peng, C.; Chen, X.; Wang, S. Influence of climatic variables on maize grain yield and its components by adjusting the sowing date. Frontiers in Plant Science 2024, 15, 1411009. [CrossRef]
- Djalović, I.; Prasad, P.V.V.; Akhtar, K.; Paunović, A.; Riaz, M.; Dugalić, M.; Katanski, S.; Zaheer, S. Nitrogen Fertilization and Cultivar Interactions Determine Maize Yield and Grain Mineral Composition in Calcareous Soil under Semiarid Conditions. Plants 2024, 13, 844. [CrossRef]
- Djalović, I.; Prasad P.V.V, Dunđerski, D.; Katanski, S.; Latković, D.; Kolarić, Lj. Optimal Plant Density Is Key for Maximizing Maize Yield in Calcareous Soil of the South Pannonian Basin. Plants 2024, 13(13), 1799. [CrossRef]
- Partali, E.; Oltenacu, C.V.; Petcu, V. The influence of sowing date and plant density on maize yield and quality in the context of climate change in southern Romania. Scientific Papers, Series A, Agronomy 2021, LXIV(1), 508-514. https://agronomyjournal.usamv.ro/pdf/2021/issue_1/Art67.pdf.
- Pareja-Sánchez, E.; Plaza-Bonilla, D.; Álvaro-Fuentes, J.; Cantero-Martínez, C. (2019). Is it feasible to reduce tillage and N use while improving maize yield in irrigated Mediterranean agroecosystems? European Journal of Agronomy 2019, 109, 125919. [CrossRef]
- Meng, C.; Wang, Z.; Cai, Y.; Du, F.; Chen, J.; Xiao, C. Effects of planting density and nitrogen (N) application rate on light energy utilization and yield of maize. Sustainability 2022, 14(24), 16707; [CrossRef]
- Wei, S.; Peng, A.; Huang, X.; Deng, A.; Chen, C.; Zhang, W. Contributions of Climate and Soil Properties to Wheat and Maize Yield Based on Long-Term Fertilization Experiments. Plants 2021, 10(10), 2002. [CrossRef]
- IBM SPSS v25 2022. https://www.ibm.com/support/pages/downloading-ibm-spss-statistics-25 (accessed on 15 February 2023).
- GenStat, Trial Version 18.1.0.17005. 2021. https://www.vsni.co.uk/ (accessed on 15 February 2021).
- Raza M.A.; Yang, L.F.; van der Werf, W.; Iqbal, N.; Khalid M.H.B.; Chen, Y.K.; Wasaya, A.; Ahmed, S.; Din, A.M.U.; Khan, A.; Saeed Ahmed, S.; Yang, F.; Yang W. Maize leaf-removal: A new agronomic approach to increase dry matter, flower number and seed-yield of soybean in maize soybean relay intercropping system. Scientific Reports 2019, 9(1), 13453. [CrossRef]
- Tuong, L.; Khoi, N.; Quan, D.; Thinh, B.; Chung, B.; Thanh, N. Effect of different planting densities and fertilizer rates on corn yield and yield components under Northern Vietnam growing conditions. Ecology Environment and Conservation 2019, 25(4), 1696-1702. https://hal.science/hal-03040494.
- Zhang, Y.; Xu, Z.; Li, J.; Wang, R. Optimum Planting Density Improves Resource Use Efficiency and Yield Stability of Rainfed Maize in Semiarid Climate. Frontiers in Plant Science 2021, 12, 752606. [CrossRef]
- Yang, S.; Zhao, Y.; Xu, Y.; Cui, J.; Li, T.; Hu, Y.; Qian, X.; Li, Z.; Sui, P.; Chen, Y. Yield performance response to field configuration of maize and soybean intercropping in China: A meta-analysis. Field Crops Research 2024, 306, 109235. [CrossRef]
- Božović, D.; Popović, V.; Rajičić, V.; Kostić, M.; Filipović, V.; Kolarić, L.; Ugrenović, V.; Spalević, V. Stability of the expression of the maize productivity parameters by AMMI models and GGE-biplotanalysis. Notulae Botanicae Horti Agrobotanici Cluj-Napoca 2020, 48(3), 1387-1397. [CrossRef]
- Stojiljković, J.; Rajičić, V.; Đurić, N.; Biberdžić, M. Uticaj godine na prinos kukuruza na području jablaničkog okruga. ZbornikradovaNacionalnognaučno-stručnogskupasameđunarodnimučenjem "Biotehnologija i savremenipristup u gajenju i oplemenubilja", 15. decembar 2021, Smederevska Palanka, Srbija 21-5. / Influence of the year on the yield of corn in the Jablanica district. Proceedings of the National scientific-expert meeting with international participation "Biotechnology and modern approach in growing and breeding plants", 15 December 2021, Smederevska Palanka, Serbia, 2021, 245-251.
- Petrović, G.; Ivanović, T.; Knežević, D.; Radosavac, A.; Obhođaš, I.; Brzaković, T.; Golić, Z.; Dragičević- Radičević, T. Assessment of Climate Change Impact on Maize Production in Serbia. Atmosphere 2023, 14(1), 110. [CrossRef]
- Simon, A.; Moraru,P.I.; Ceclan, A.; Russu, F.; Ghetan, F.; Bardas, M.; Popa, A, Rusu, T.; Pop, A.I.; Bogdan, E. The Impact of Climatic Factors on the Development Stages of Maize Crop in the Transylvanian Plain. Agronomy 2023, 13(6), 1612. [CrossRef]
- Mazibuko, P.; Mutengwa, C.; Magorokosho, C.; Kutywayo, D.; Kamutando, C.N. Genetic Gains of Grain Yield among the Maize Cultivars Released over a Century from the National Breeding Program of Zimbabwe. Agronomy 2024, 14, 246. [CrossRef]
- Popović, V.; Vasileva, V.; Ljubičić, N.; Rakašćan, N.; Ikanović J. Environment, Soil, and Digestate Interaction of Maize Silage and Biogas Production. Agronomy 2024, 14(11), 2612. [CrossRef]
- Chen, K.; Camberato, J.J.; Vyn, T.J. Maize grain yield and kernel component relationships to morphophysiological traits in commercial hybrids separated by four decades. Crop Science 2017, 57(3), 1641-1657. [CrossRef]
- Liu, G.; Hou, P.; Xie, R.; Ming, B.; Wang, K.; Xu, W.; Liu, W.; Yang, Y.; Li, S. Canopy characteristics of high-yield maize with yield potential of 22.5 Mg ha-1. Field Crops Research 2017, 213, 221–230. [CrossRef]
- Solomon, K. F.; Chauhan, Y.; Zeppa, A. Risks of yield loss due to variation in optimum density for different maize genotypes under variable environmental conditions. Journal of Agronomy and Crop Science 2017, 203(6), 519-527. [CrossRef]
- Djamana, K.; Allena, S.; Djamanb, D.; Koudahec, K.; Irmak, S.; Puppalae, N.; Darapuneni, M.; Angadi, S. Planting date and plant density effects on maize growth, yield and water use efficiency. Environmental Challenges 2022, 6, 100417. [CrossRef]
- Ni, M.; Vellend, M. Soil properties constrain predicted poleward migration of plants under climate change. New Phytologistic 2024 241(1), 131-141. [CrossRef]
- Wang, Y.Y.; Sheng, D.C.; Zhang, P.; Dong, X.; Yan, Y.; Hou, X.F. High temperature sensitivity of kernel formation in different short periods around silking in maize. Environmental and Experimental Botany 2021, 183, 104343. [CrossRef]
- Dugalić M.; Rakočević-Bošković Lj.; Latković D.; Rajičić V.; Terzić, D.; Životić, Lj. Effect of Lime, Mineral Fertilizer and Manure on Soil Characteristics and Yield of Four Maize Hybrids. Agronomy 2025, 15(3), 542. [CrossRef]
- Dugalić, M.; Životić, L.; Gajić, B.; Latković, D. Small Doses of Lime with Common Fertilizer Practices Improve Soil Characteristics and Foster the Sustainability of Maize Production. Agronomy 2024, 14(1), 46. [CrossRef]
- Maitah, M.; Malec, K.; Maitah, K. Influence of precipitation and temperature on maize production in the Czech Republic from 2002 to 2019. Scientific Reports 2021, 11(1), 10467. www.nature.com/articles/s41598-021-89962-2.pdf.
- Yang, X.; Menefee, D.; Cui, S.; Rajan, N. Assessing the impacts of projected climate changes on maize (Zea mays) productivity using crop models and climate scenario simulation. Crop and Pasture Science 2021, 72(12), 969-984. [CrossRef]
- Dong, X., Guan, L., Zhang, P. H., Liu, X. L., Li, S. J., Fu, Z. J., et al. (2021). Responses of maize with different growth periods to heat stress around flowering and early grain filling. Agr.For.Meteorol.303, 108378. [CrossRef]
- Moussav, M.; NiK, M.M.; Babaeian, M.; Tavassoli, A.; Asgharzade, A. (2011). Effect of plant density on yield and yield components of corn hybrids (Zea mays). Scientific Research and Essays 2011, 6(22), 4821-4825.
- Nowosad, K.; Bocianowsk, J.; Kianersi, F.; Pour-Aboughadareh, A. Analysis of Linkage on Interaction of Main Aspects (Genotype by Environment Interaction, Stability and Genetic Parameters) of 1000 Kernels in Maize (Zea mays L.). Agriculture 2023, 13(10), 2005. [CrossRef]
- Khan, F.U.; Mohammad, F.; Raziuddin, A.; Shah, Z.; Ahmad, M.; Shah, Z. Genotypic differences and genotype x nitrogen interactions for yield traits in bread wheat. Journal of Animal & Plant Sciences 2017, 27(4), 1264-1268. ISSN: 1018-7081.
- Liu, Z..; Yang, X.; Xie, R.; Lin, X.; Li, T.; Batchelor, W.D.; Zhao, J.; Zhang, Z.; Sun, S.; Zhang, F.; Huang, Q. Prolongation of the grain filling period and change in radiation simultaneously increased maize yields in China. Agricultural and Forest Meteorology 2021, 308, 108573. [CrossRef]
- Qi, Y.; Zhang, Q.; Hu, S.; Wang, R.; Wang, H.; Zhang, K, Zhao, H.; Ren, S.; Yang, Y.; Zhao, F. Effects of high temperature and drought stresses on growth and yield of summer maize during grain filling in North China. Agriculture 2022, 12, 1948. [CrossRef]
- Ljubičić, N.; Popović, V.; Kostić, M.; Pajić, M.; Buđen, M.; Gligorević, K.; Dražić, M.; Bižić, M.; Crnojević, V. Multivariate Interaction Analysis of Zea mays L. Genotypes Growth Productivity in Different Environmental Conditions. Plants 2023, 12(11), 2165. [CrossRef]
Figure 1.
The distribution of precipitation (a) and temperature (b) during the experimental periods of 2014-2017 and multi-year averages in the Leskovac location. The data for rainfall shown covers the period from 1 April to 30 October.
Figure 1.
The distribution of precipitation (a) and temperature (b) during the experimental periods of 2014-2017 and multi-year averages in the Leskovac location. The data for rainfall shown covers the period from 1 April to 30 October.
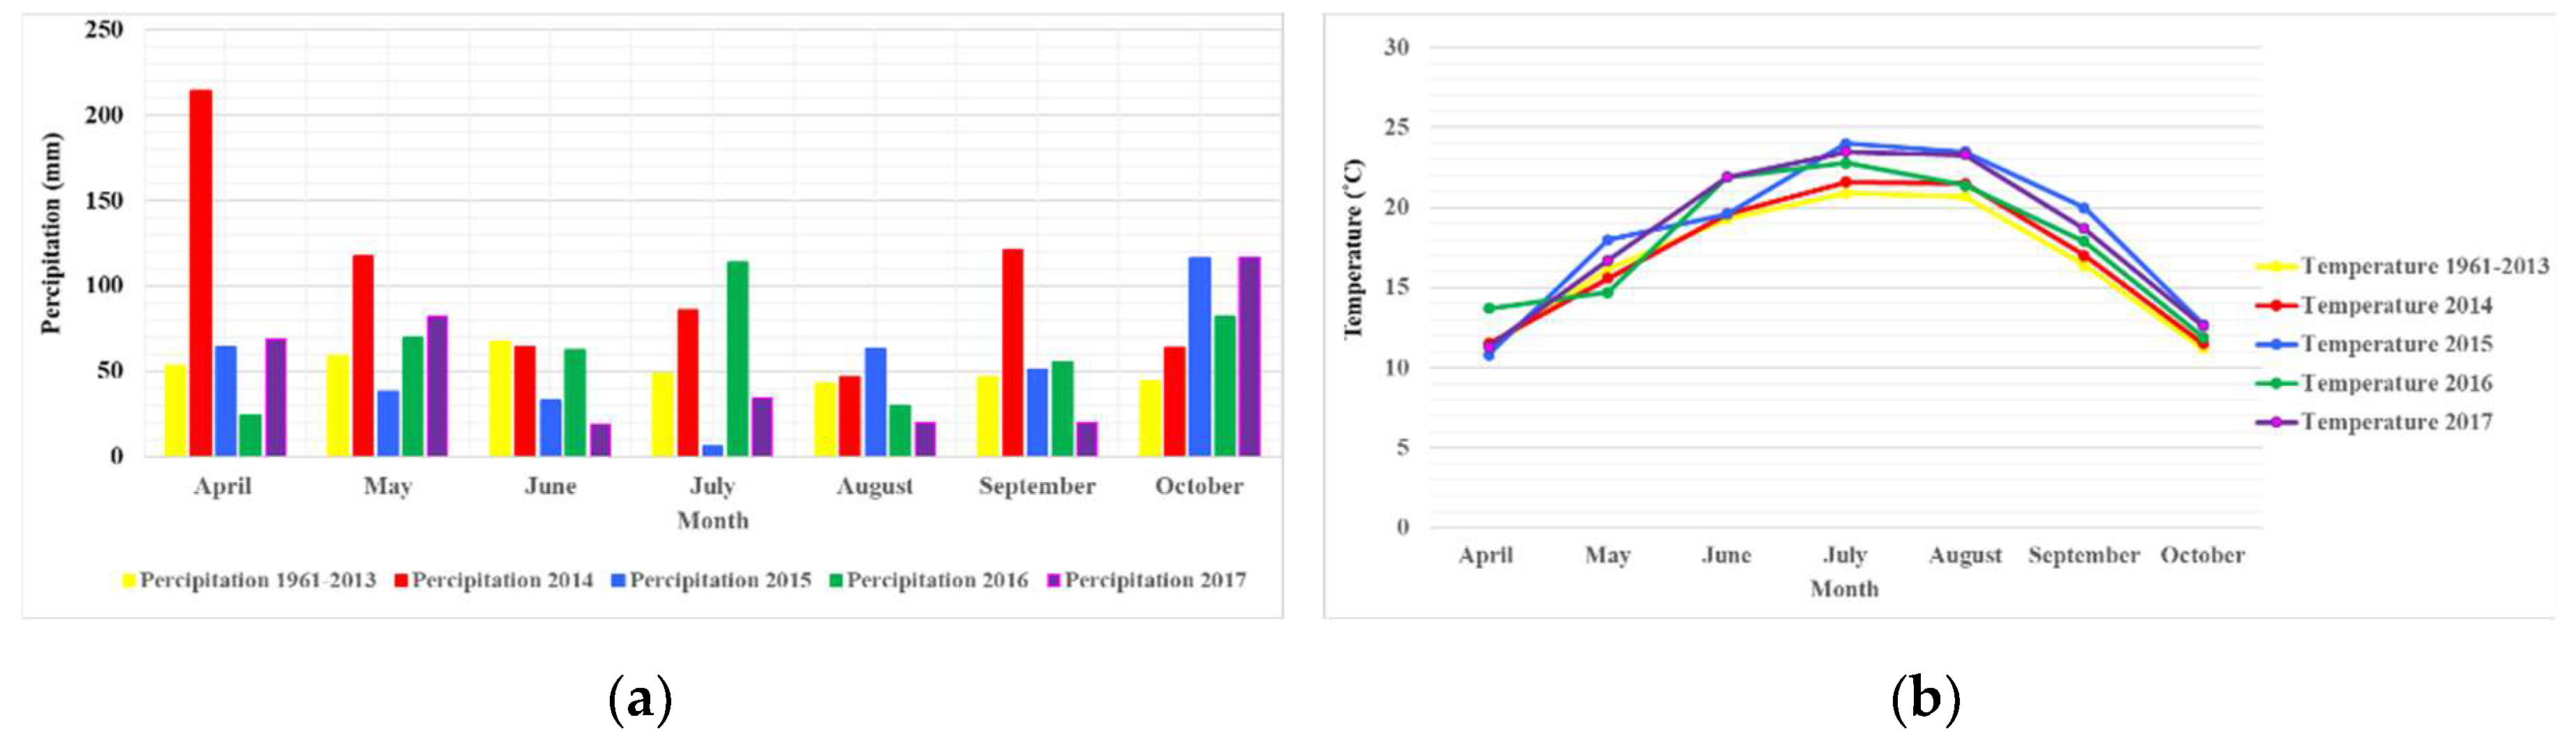
Figure 2.
Effects of different seeding densities, genotypes and years on the yield. SD I, SD II and SD III represent maize seeding densities of 20×70 cm (71.428 plants ha-1), 25×70 cm (57.143 plants ha-1) and 30×70 cm (47.619 plants ha-1), respectively. Six maize genotypes of study: ZP 434 and NS 4023 from FAO group 400, ZP 555 and NS 5051 from FAO group 500, and ZP 666 and NS 6030 from FAO group 600. 2014, 2015, 2016 and 2017 represent four years of research.
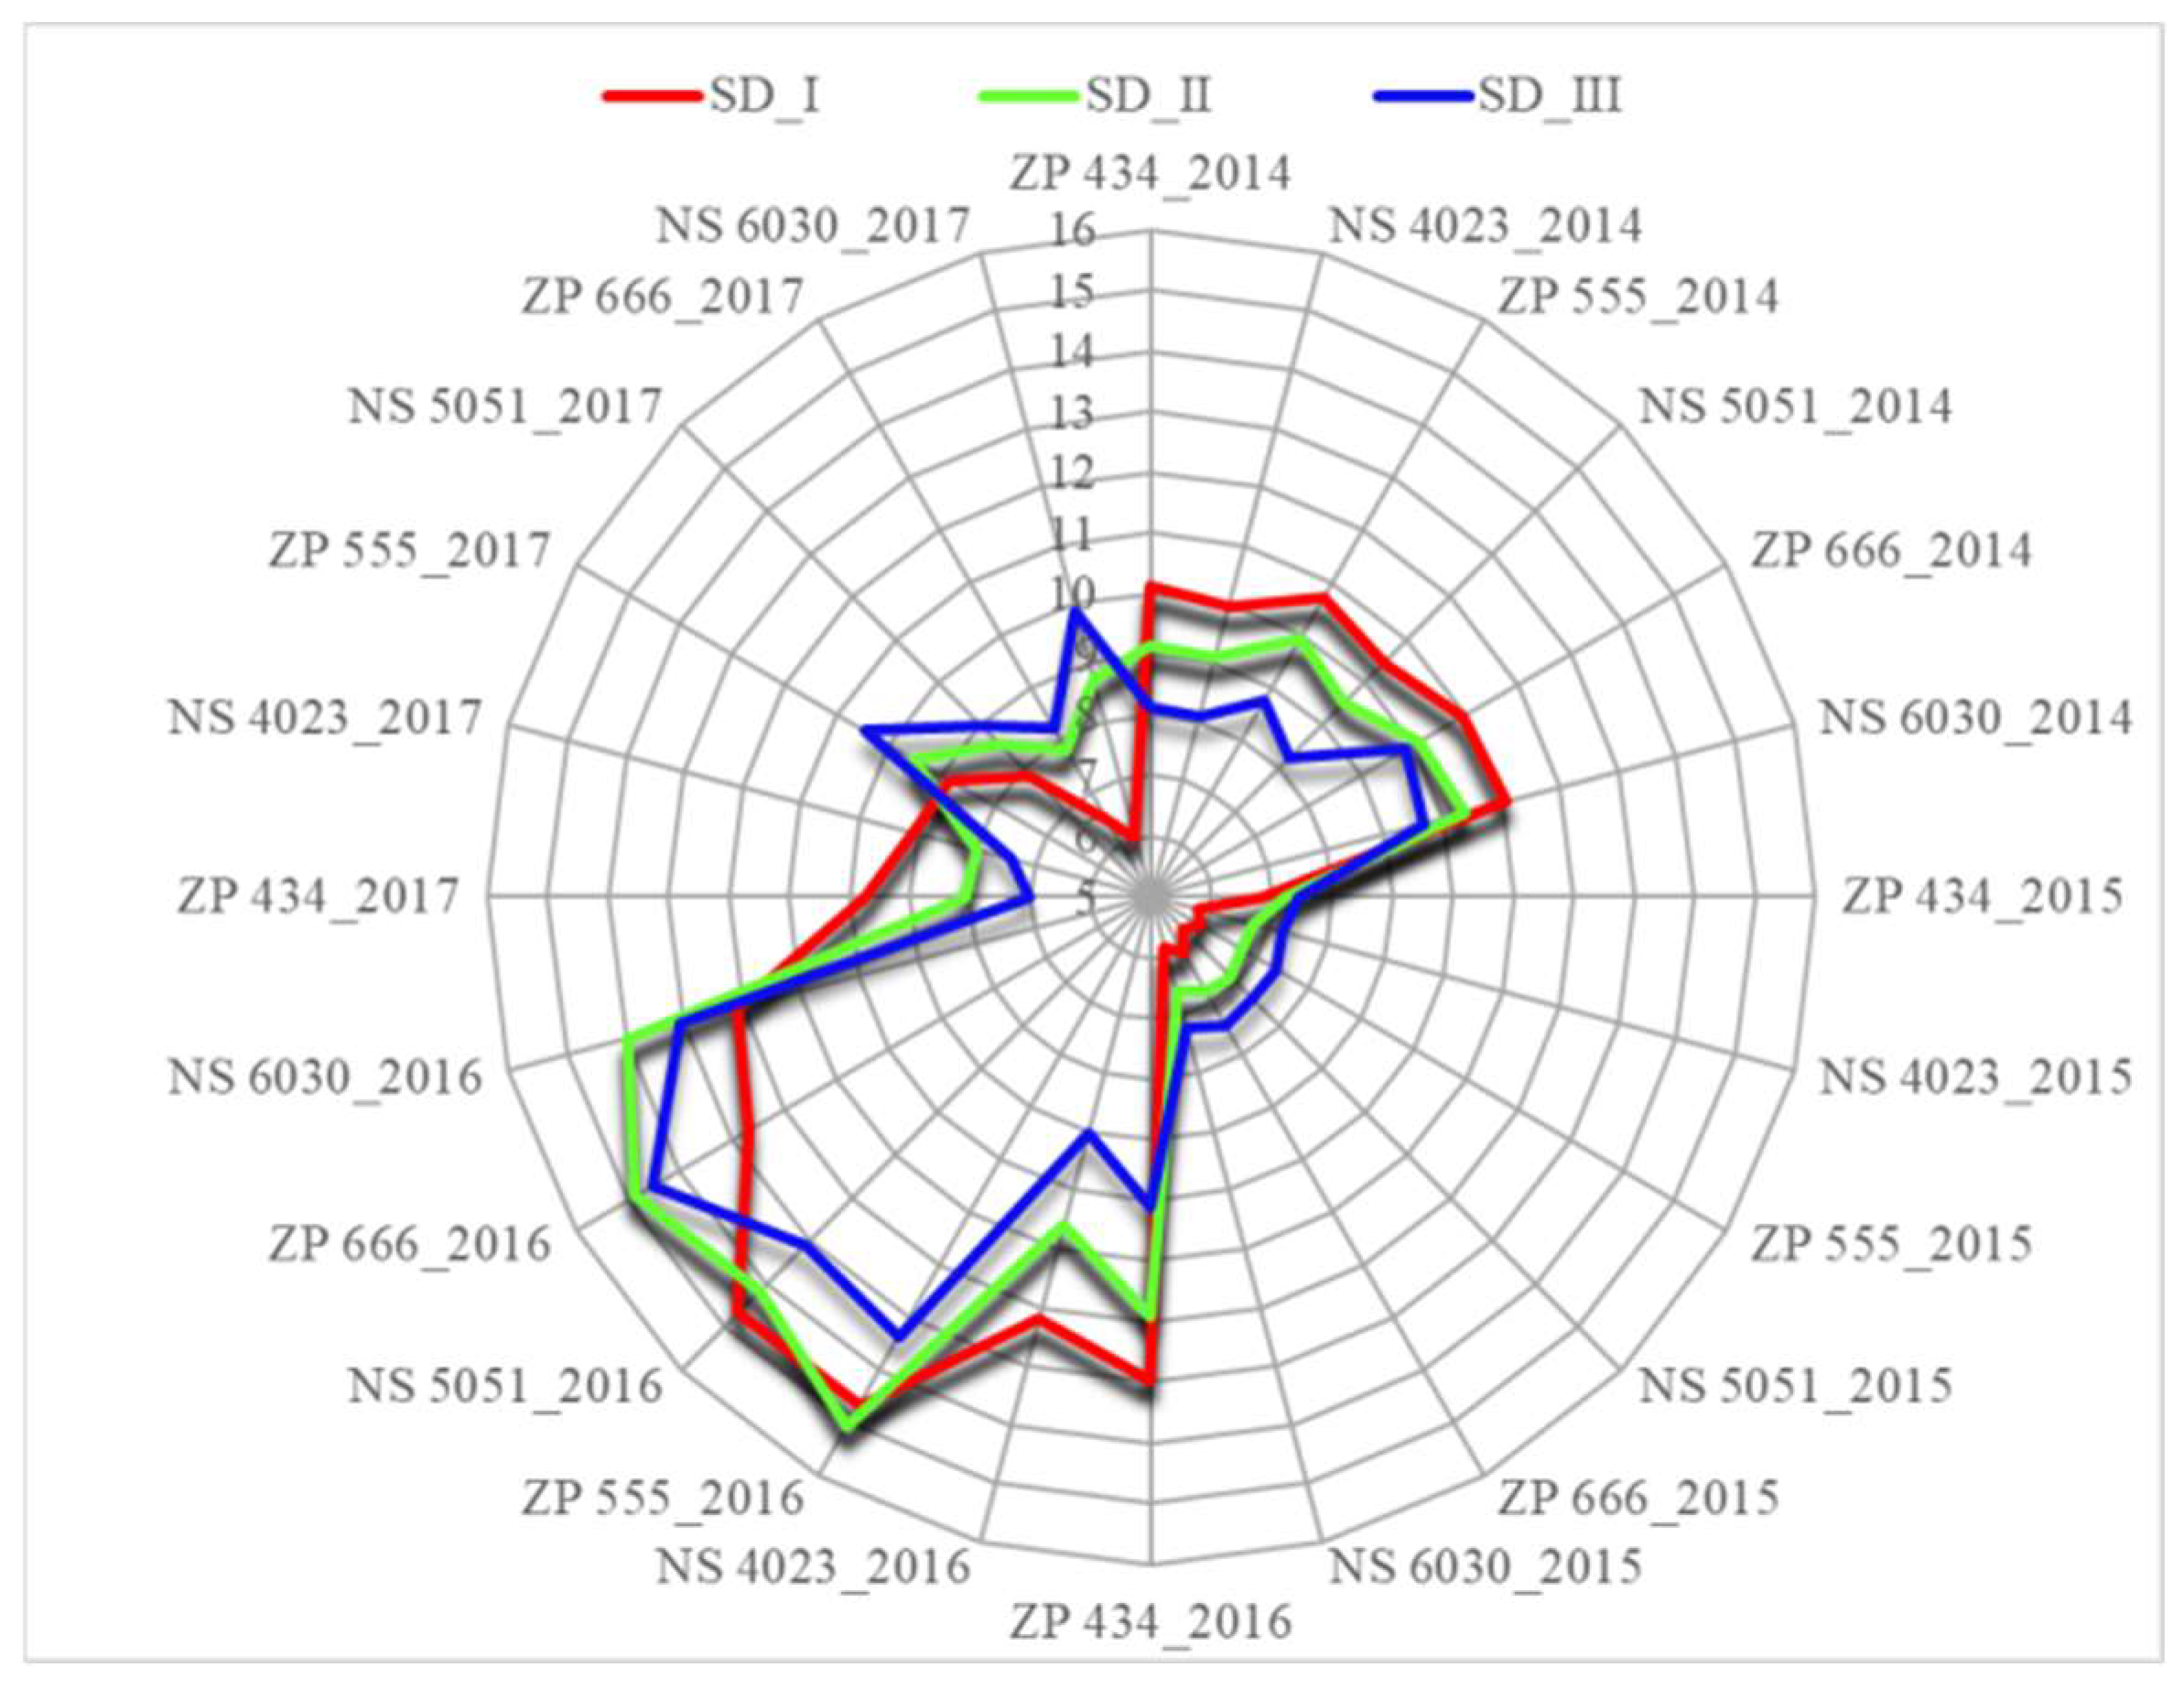
Figure 3.
AMMI 1 (a) and AMMI 2 (b) biplot analysis of yield stability in six maize hybrids in four years and three seeding densities. SD I, SD II and SD III represent maize seeding densities of 20×70 cm (71.428 plants ha-1), 25×70 cm (57.143 plants ha-1) and 30×70 cm (47.619 plants ha-1), respectively. Six maize genotypes of study: ZP 434 and NS 4023 from FAO group 400, ZP 555 and NS 5051 from FAO group 500, and ZP 666 and NS 6030 from FAO group 600. 2014, 2015, 2016 and 2017 represent four years of research.
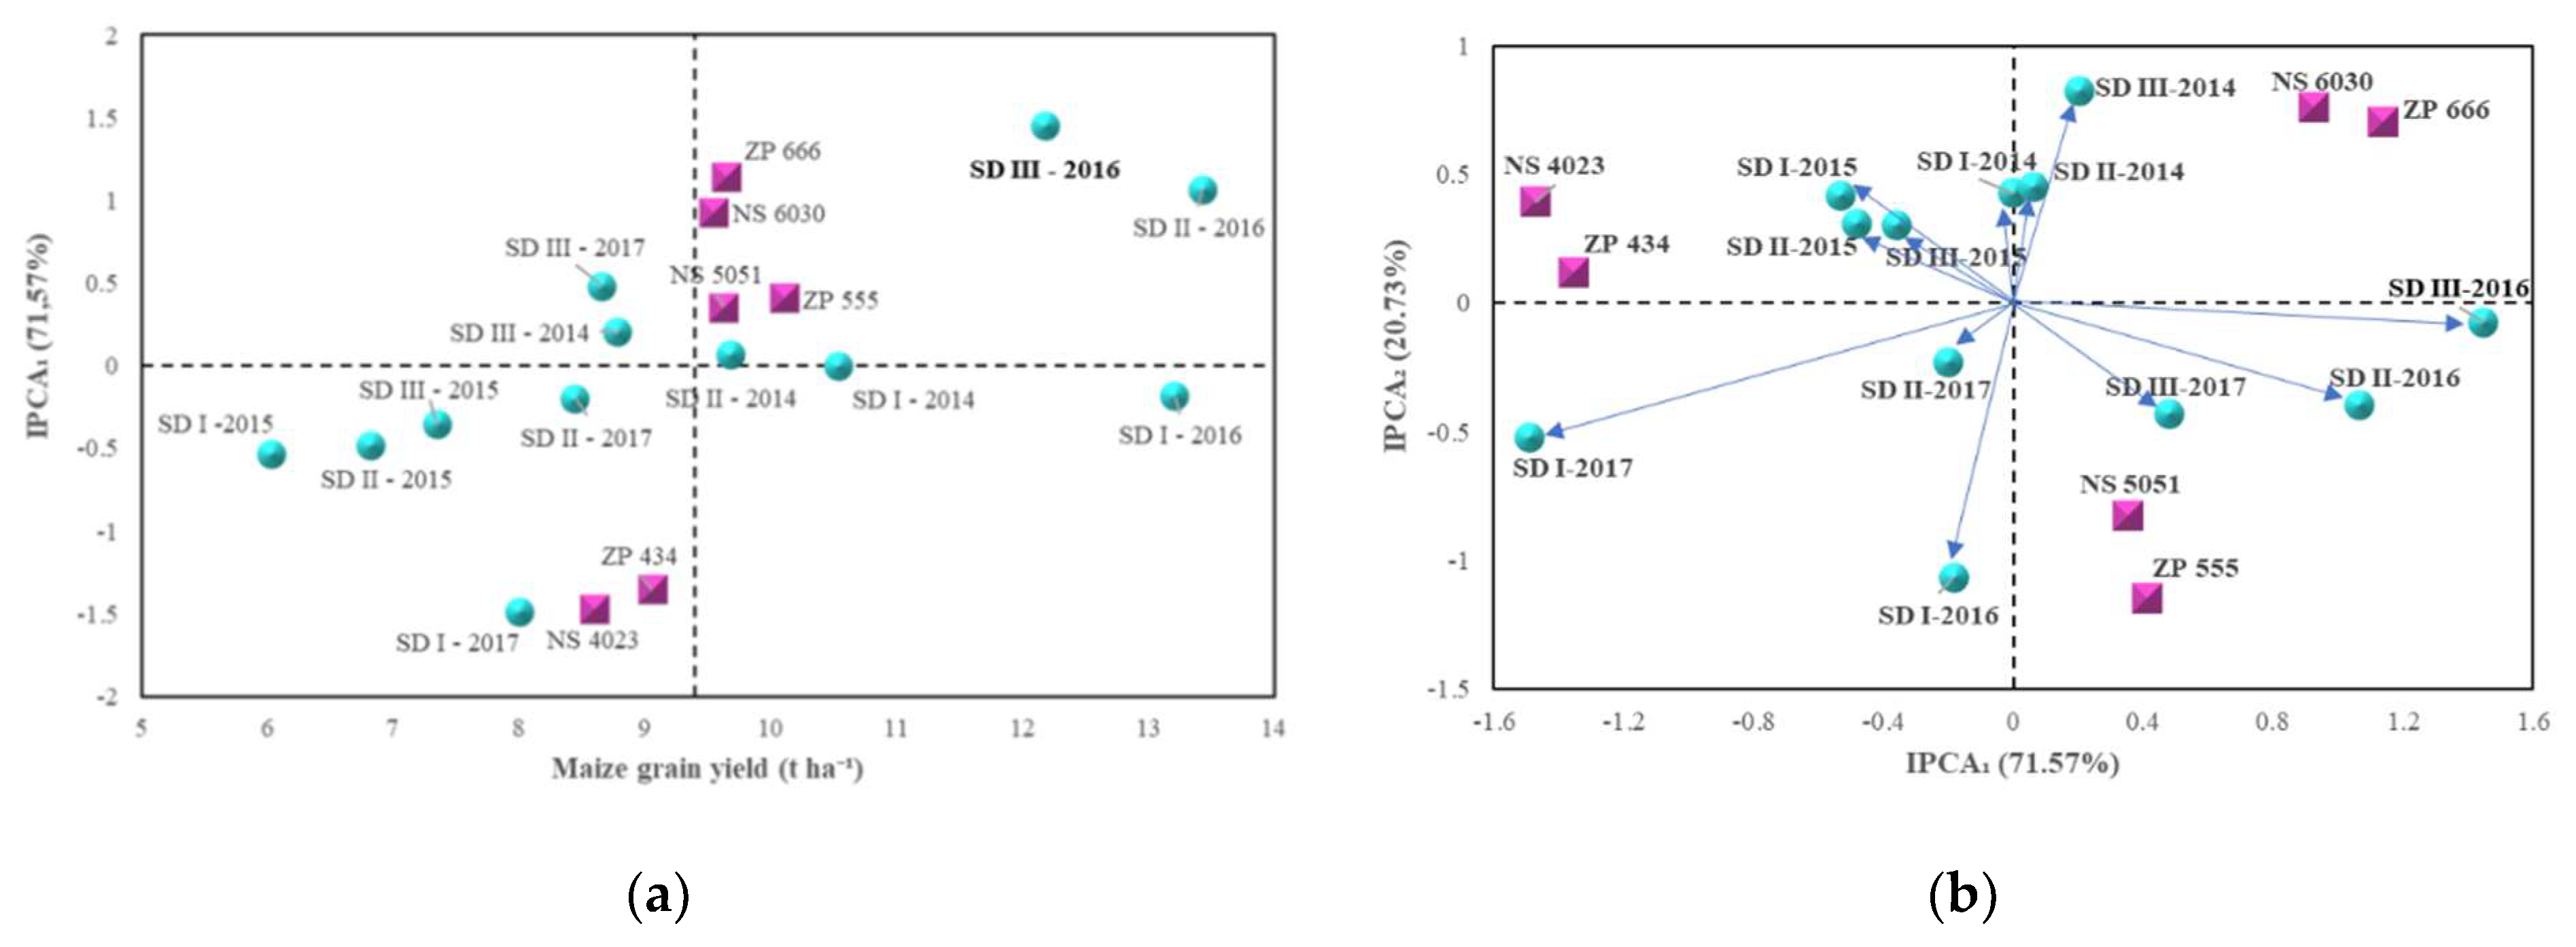
Figure 4.
Effects of different seeding densities, genotypes and years on the number of plants at harvest. SD I, SD II and SD III represent maize seeding densities of 20×70 cm (71.428 plants ha-1), 25×70 cm (57.143 plants ha-1) and 30×70 cm (47.619 plants ha-1), respectively. Six maize genotypes of study: ZP 434 and NS 4023 from FAO group 400, ZP 555 and NS 5051 from FAO group 500, and ZP 666 and NS 6030 from FAO group 600. 2014, 2015, 2016 and 2017 represent four years of research.
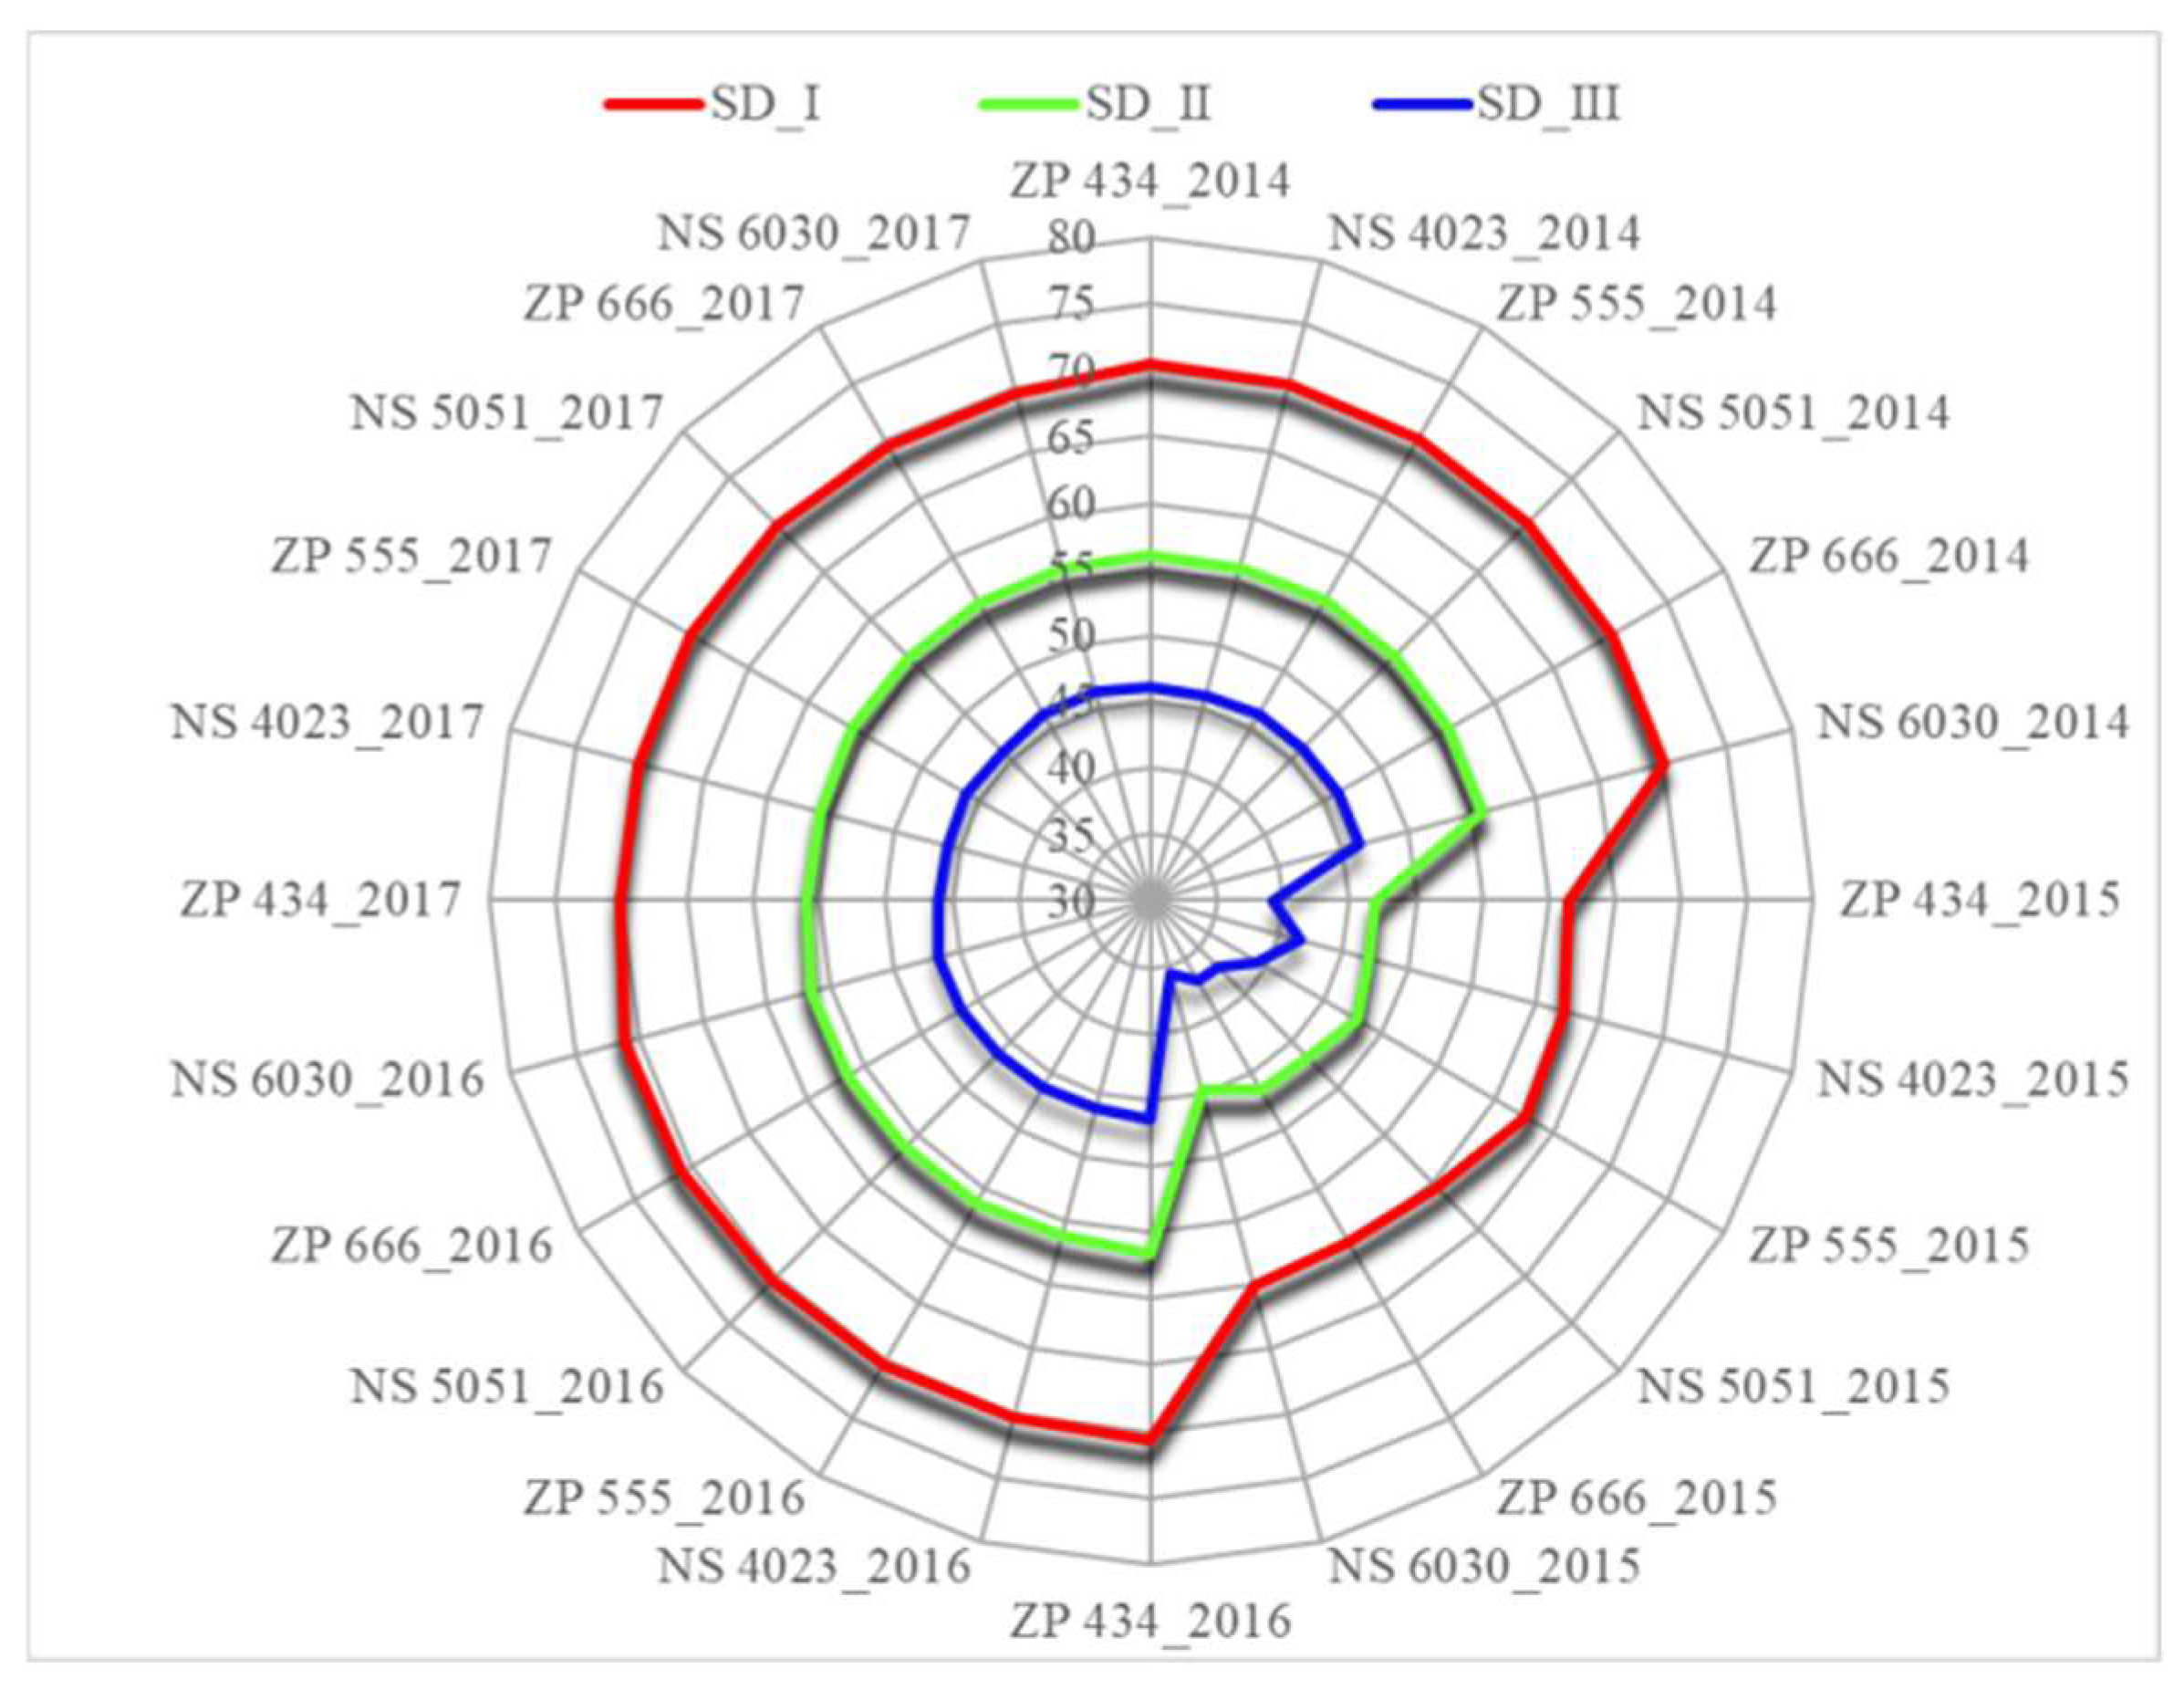
Figure 5.
AMMI 1 biplot analysis of number of plants at harvest stability in six maize hybrids in four years and three seeding densities. SD I, SD II and SD III represent maize seeding densities of 20×70 cm (71.428 plants ha-1), 25×70 cm (57.143 plants ha-1) and 30×70 cm (47.619 plants ha-1), respectively. Six maize genotypes of study: ZP 434 and NS 4023 from FAO group 400, ZP 555 and NS 5051 from FAO group 500, and ZP 666 and NS 6030 from FAO group 600. 2014, 2015, 2016 and 2017 represent four years of research.
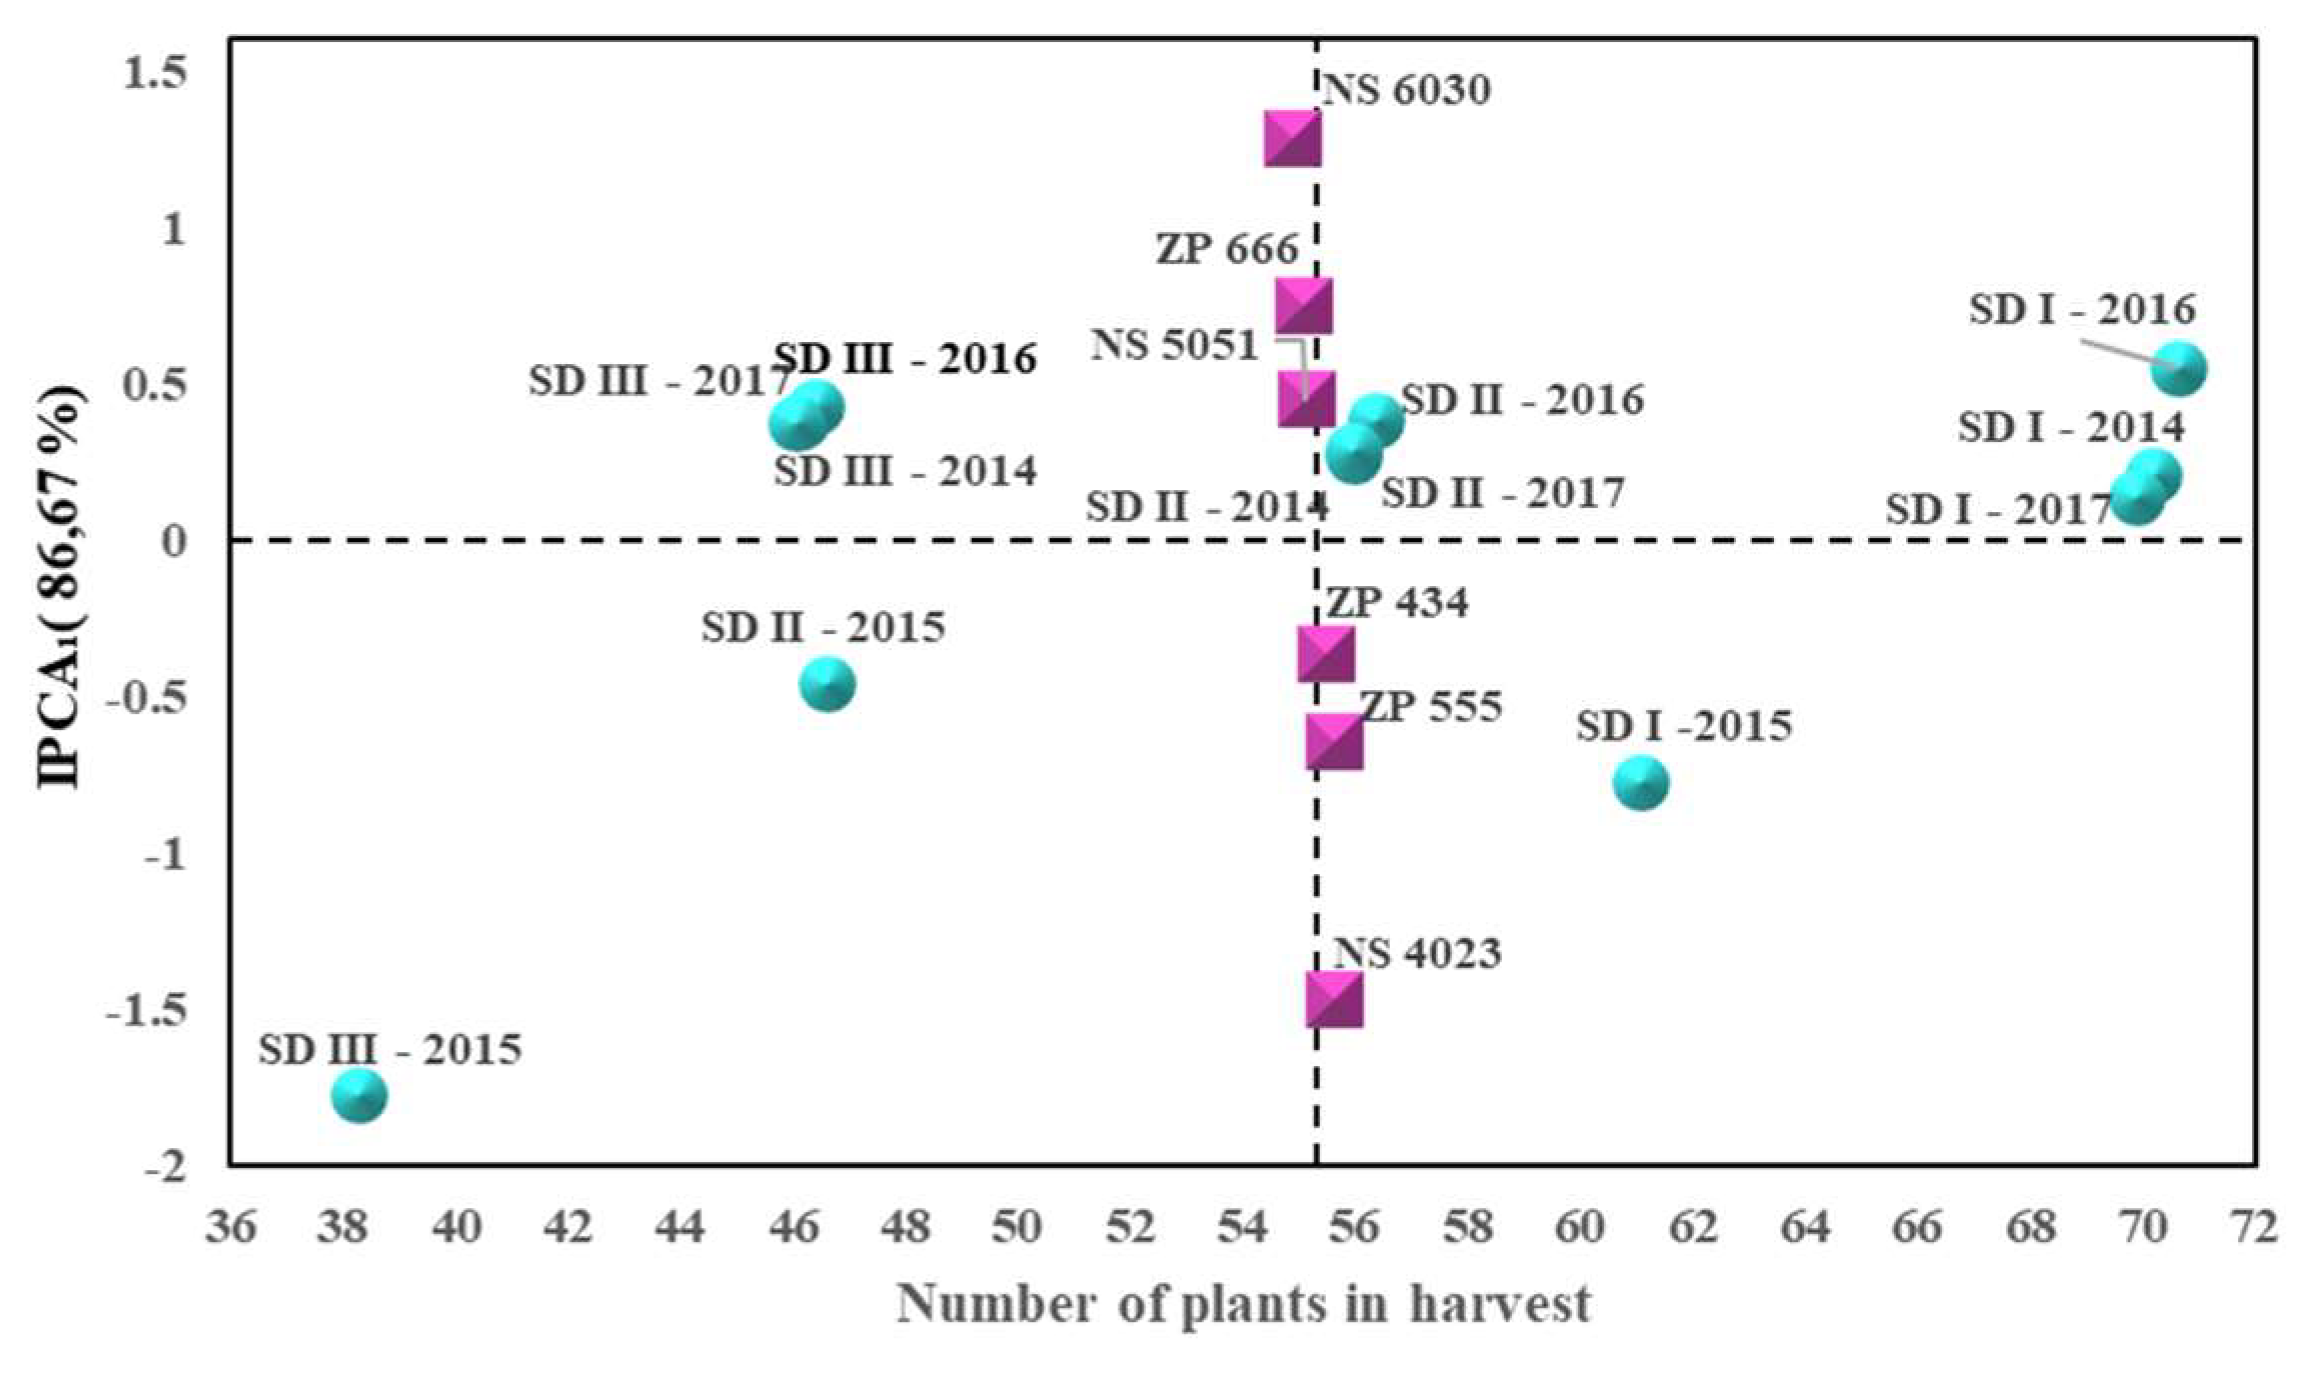
Figure 6.
Effects of different seeding densities, genotypes and years on the number of rows of grains. SD I, SD II and SD III represent maize seeding densities of 20×70 cm (71.428 plants ha-1), 25×70 cm (57.143 plants ha-1) and 30×70 cm (47.619 plants ha-1), respectively. Six maize genotypes of study: ZP 434 and NS 4023 from FAO group 400, ZP 555 and NS 5051 from FAO group 500, and ZP 666 and NS 6030 from FAO group 600. 2014, 2015, 2016 and 2017 represent four years of research.
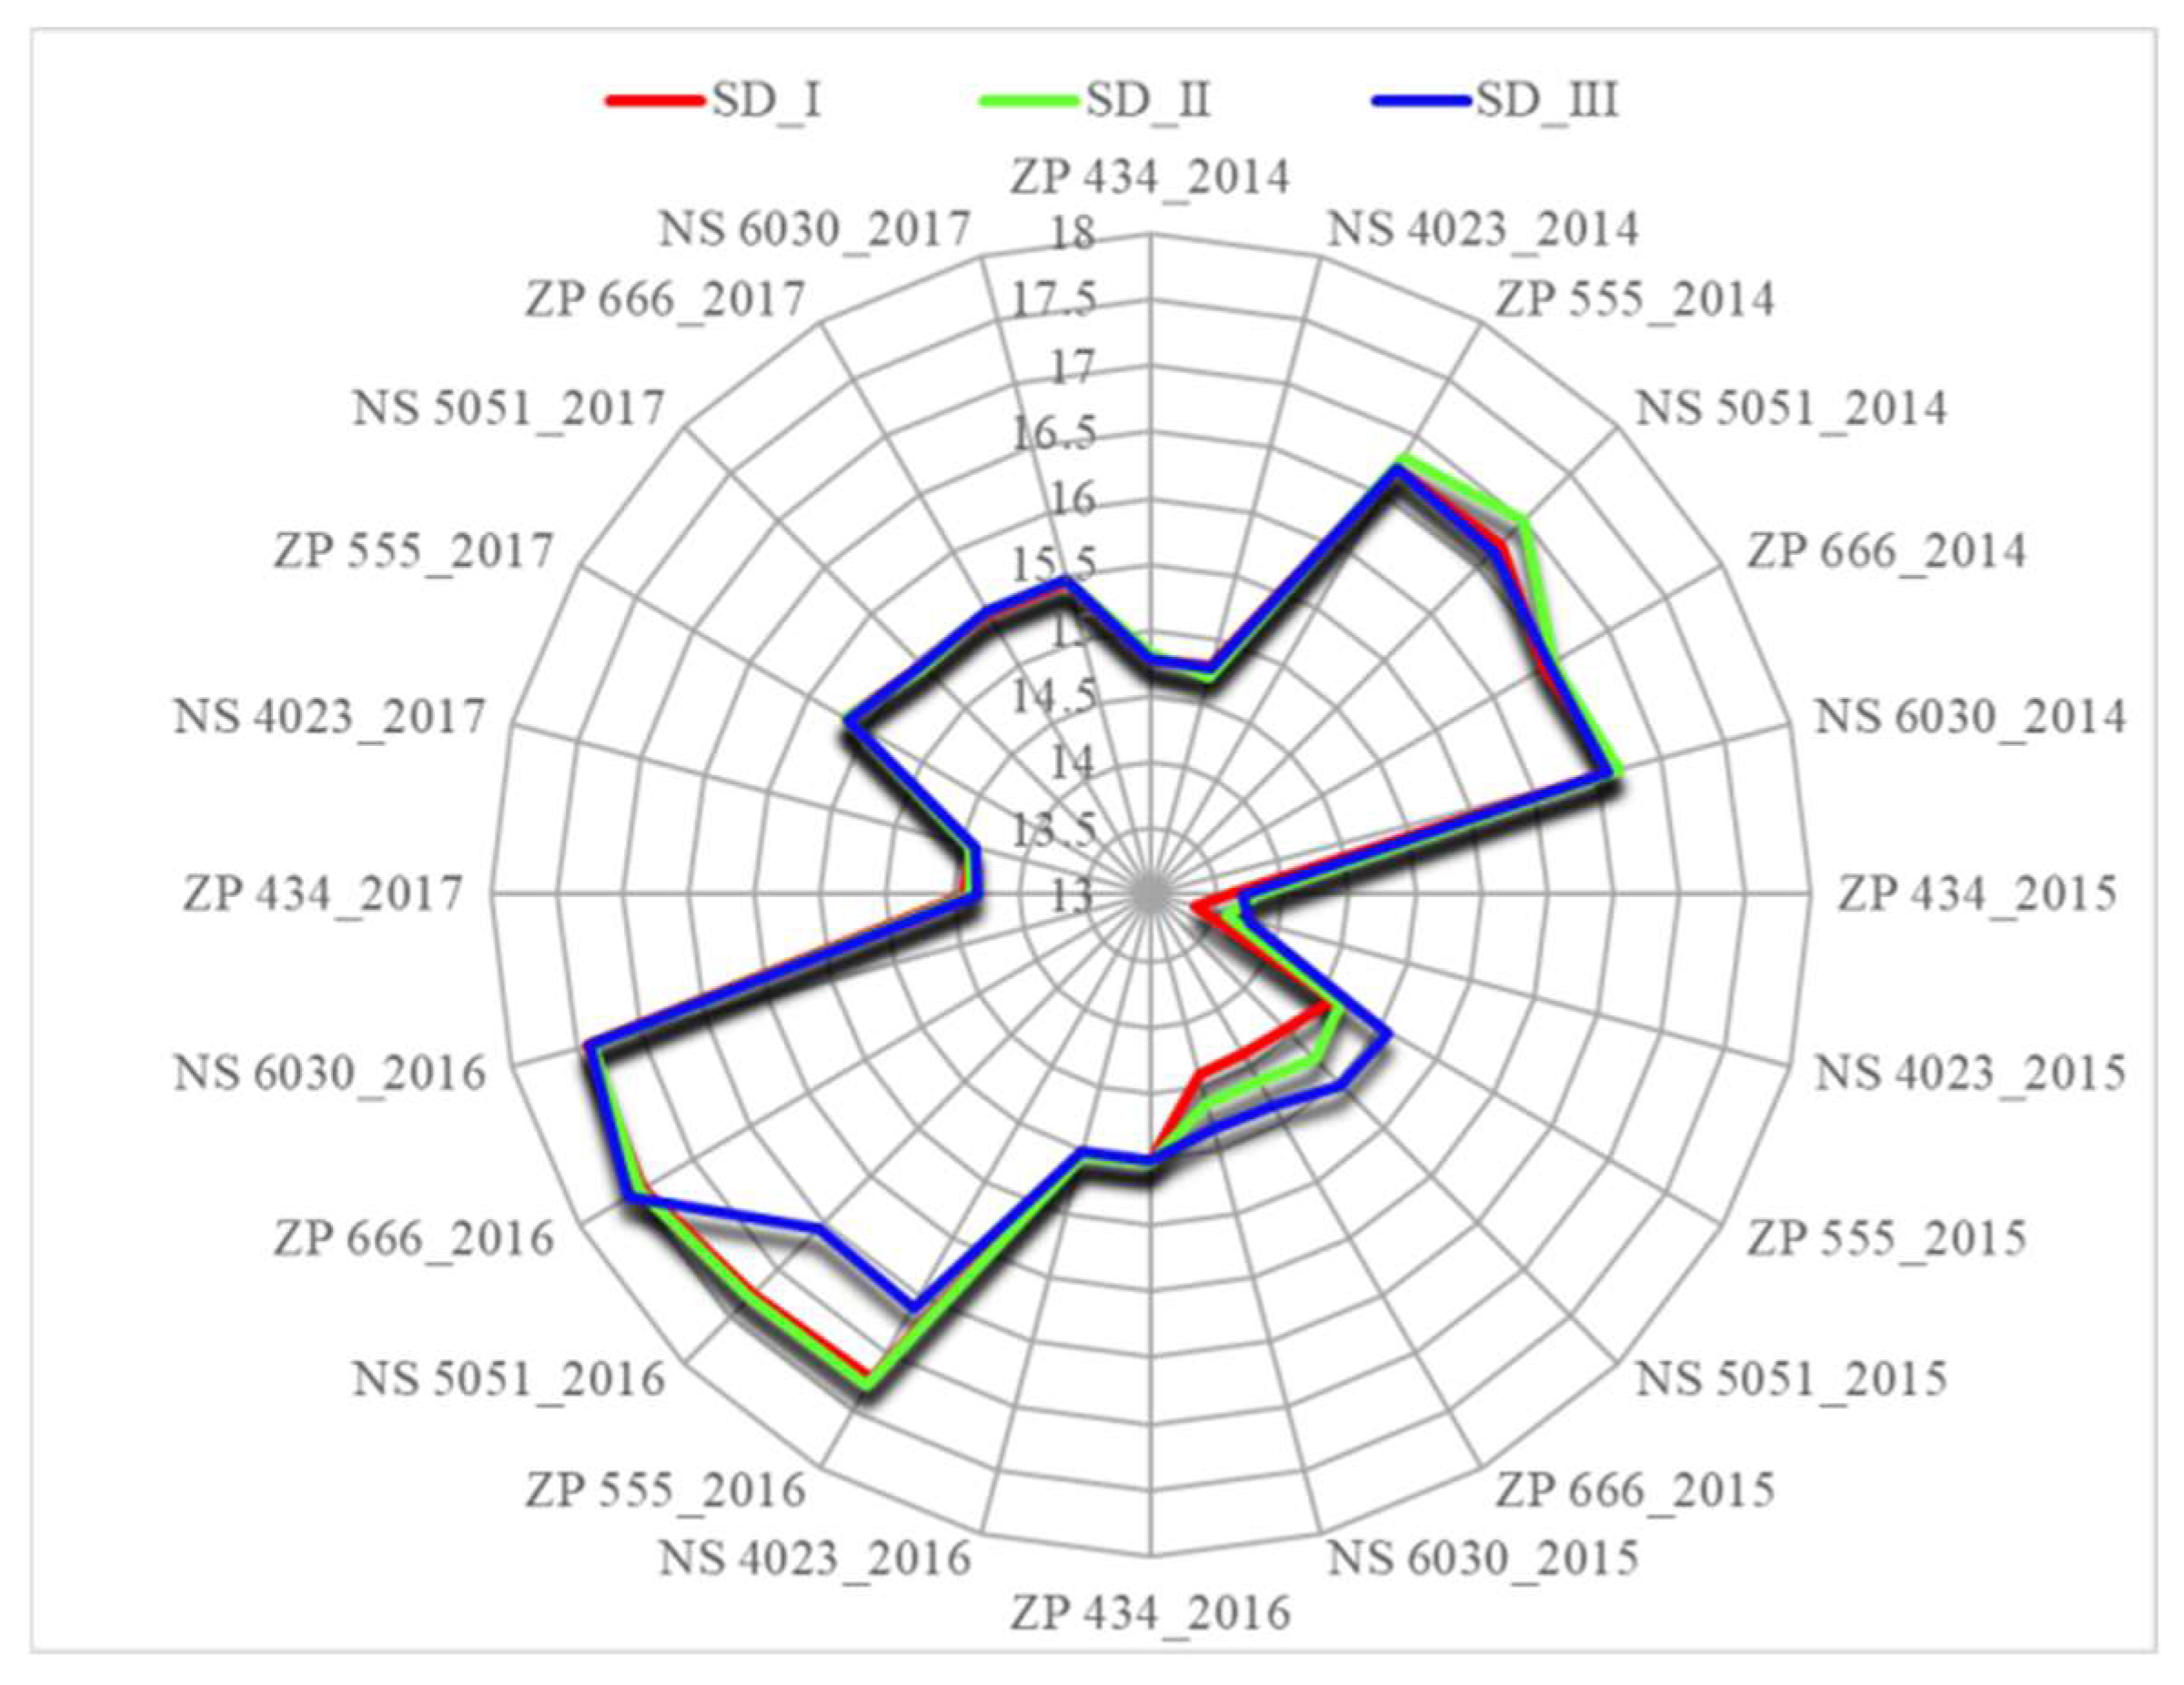
Figure 7.
AMMI 1 (a) and AMMI 2 (b) biplot analysis of the number of rows of grains in the maize cob stability in six maize hybrids in four years and three seeding densities. SD I, SD II and SD III represent maize seeding densities of 20×70 cm (71.428 plants ha-1), 25×70 cm (57.143 plants ha-1) and 30×70 cm (47.619 plants ha-1), respectively. Six maize genotypes of study: ZP 434 and NS 4023 from FAO group 400, ZP 555 and NS 5051 from FAO group 500, and ZP 666 and NS 6030 from FAO group 600. 2014, 2015, 2016 and 2017 represent four years of research.
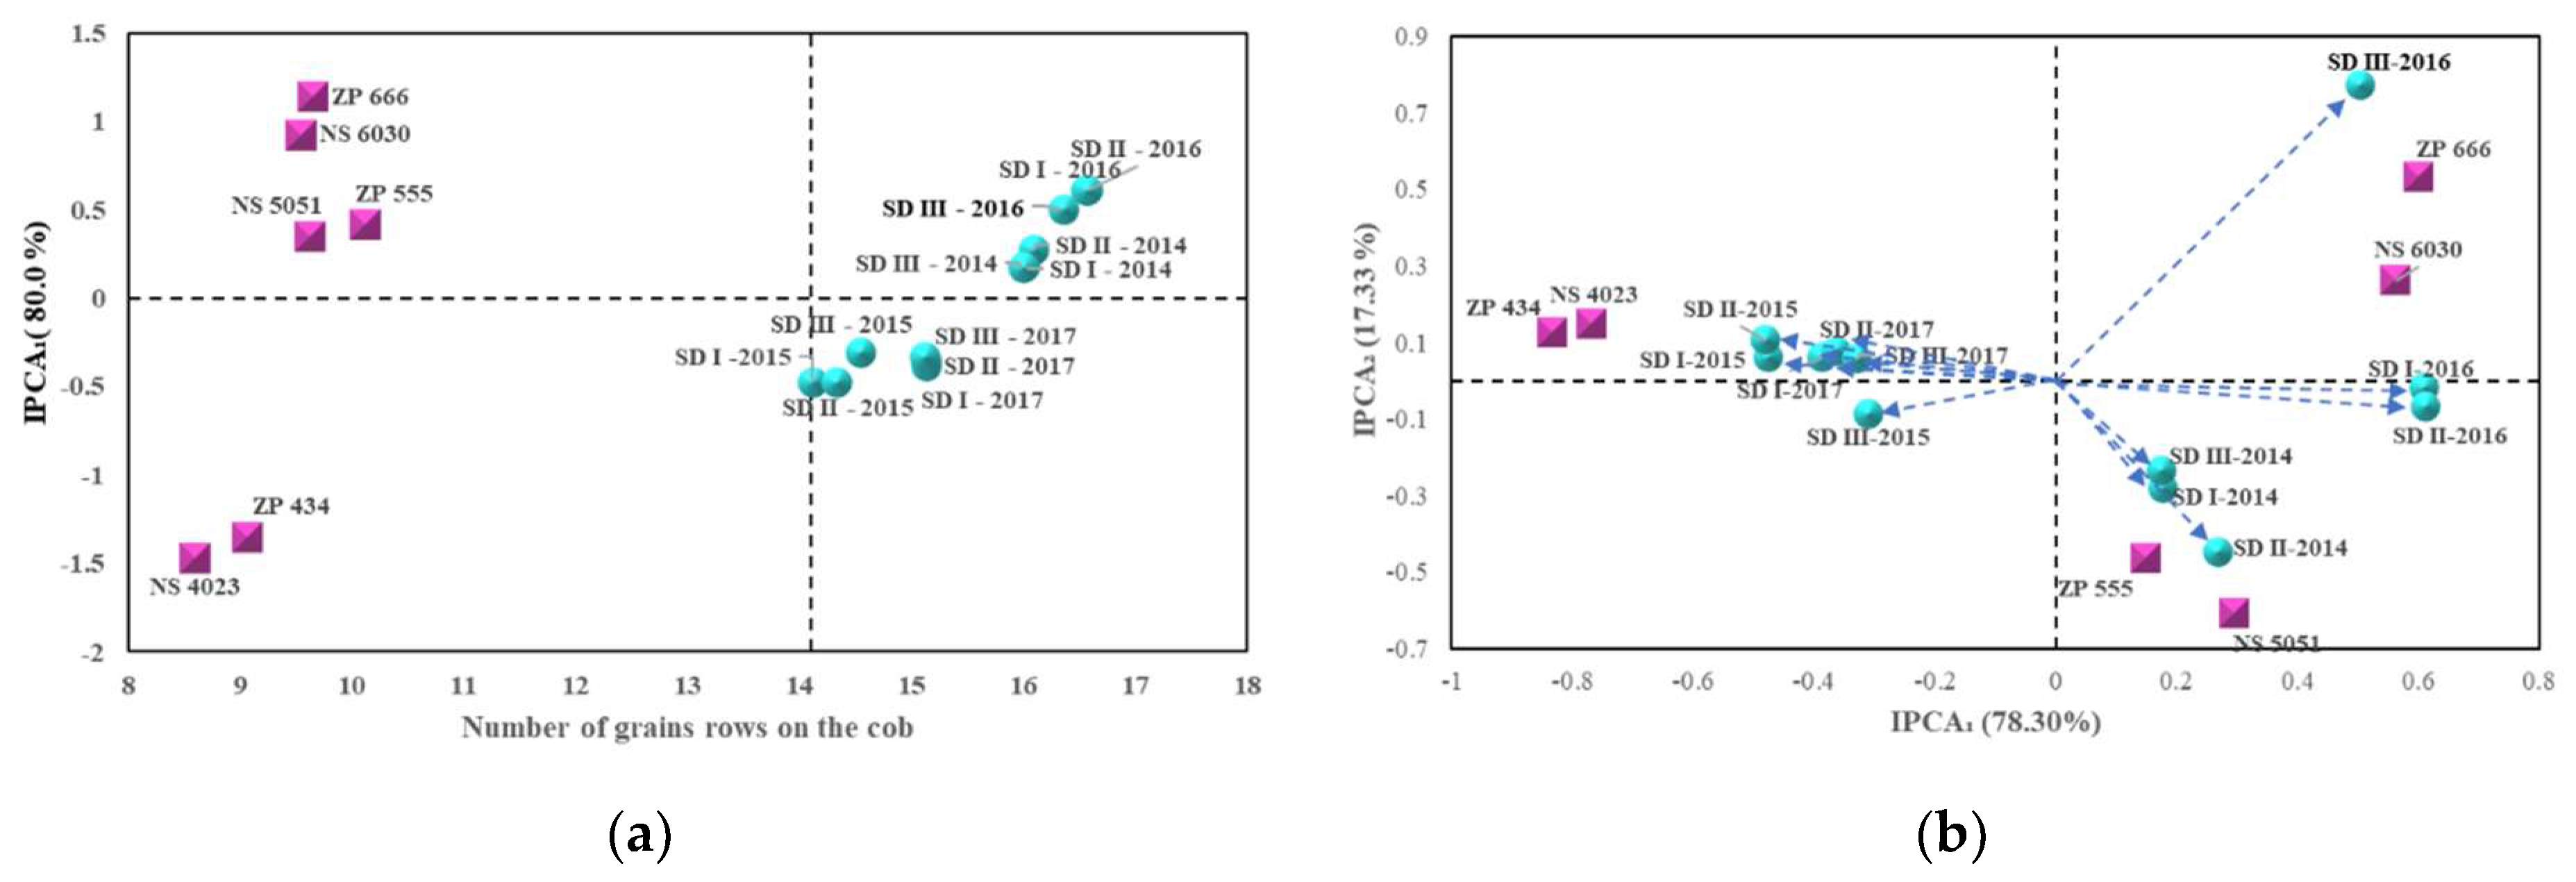
Figure 8.
Effects of different seeding densities, genotypes and years on the thousand kernel weight. SD I, SD II and SD III represent maize seeding densities of 20×70 cm (71.428 plants ha-1), 25×70 cm (57.143 plants ha-1) and 30×70 cm (47.619 plants ha-1), respectively. Six maize genotypes of study: ZP 434 and NS 4023 from FAO group 400, ZP 555 and NS 5051 from FAO group 500, and ZP 666 and NS 6030 from FAO group 600. 2014, 2015, 2016 and 2017 represent four years of research.
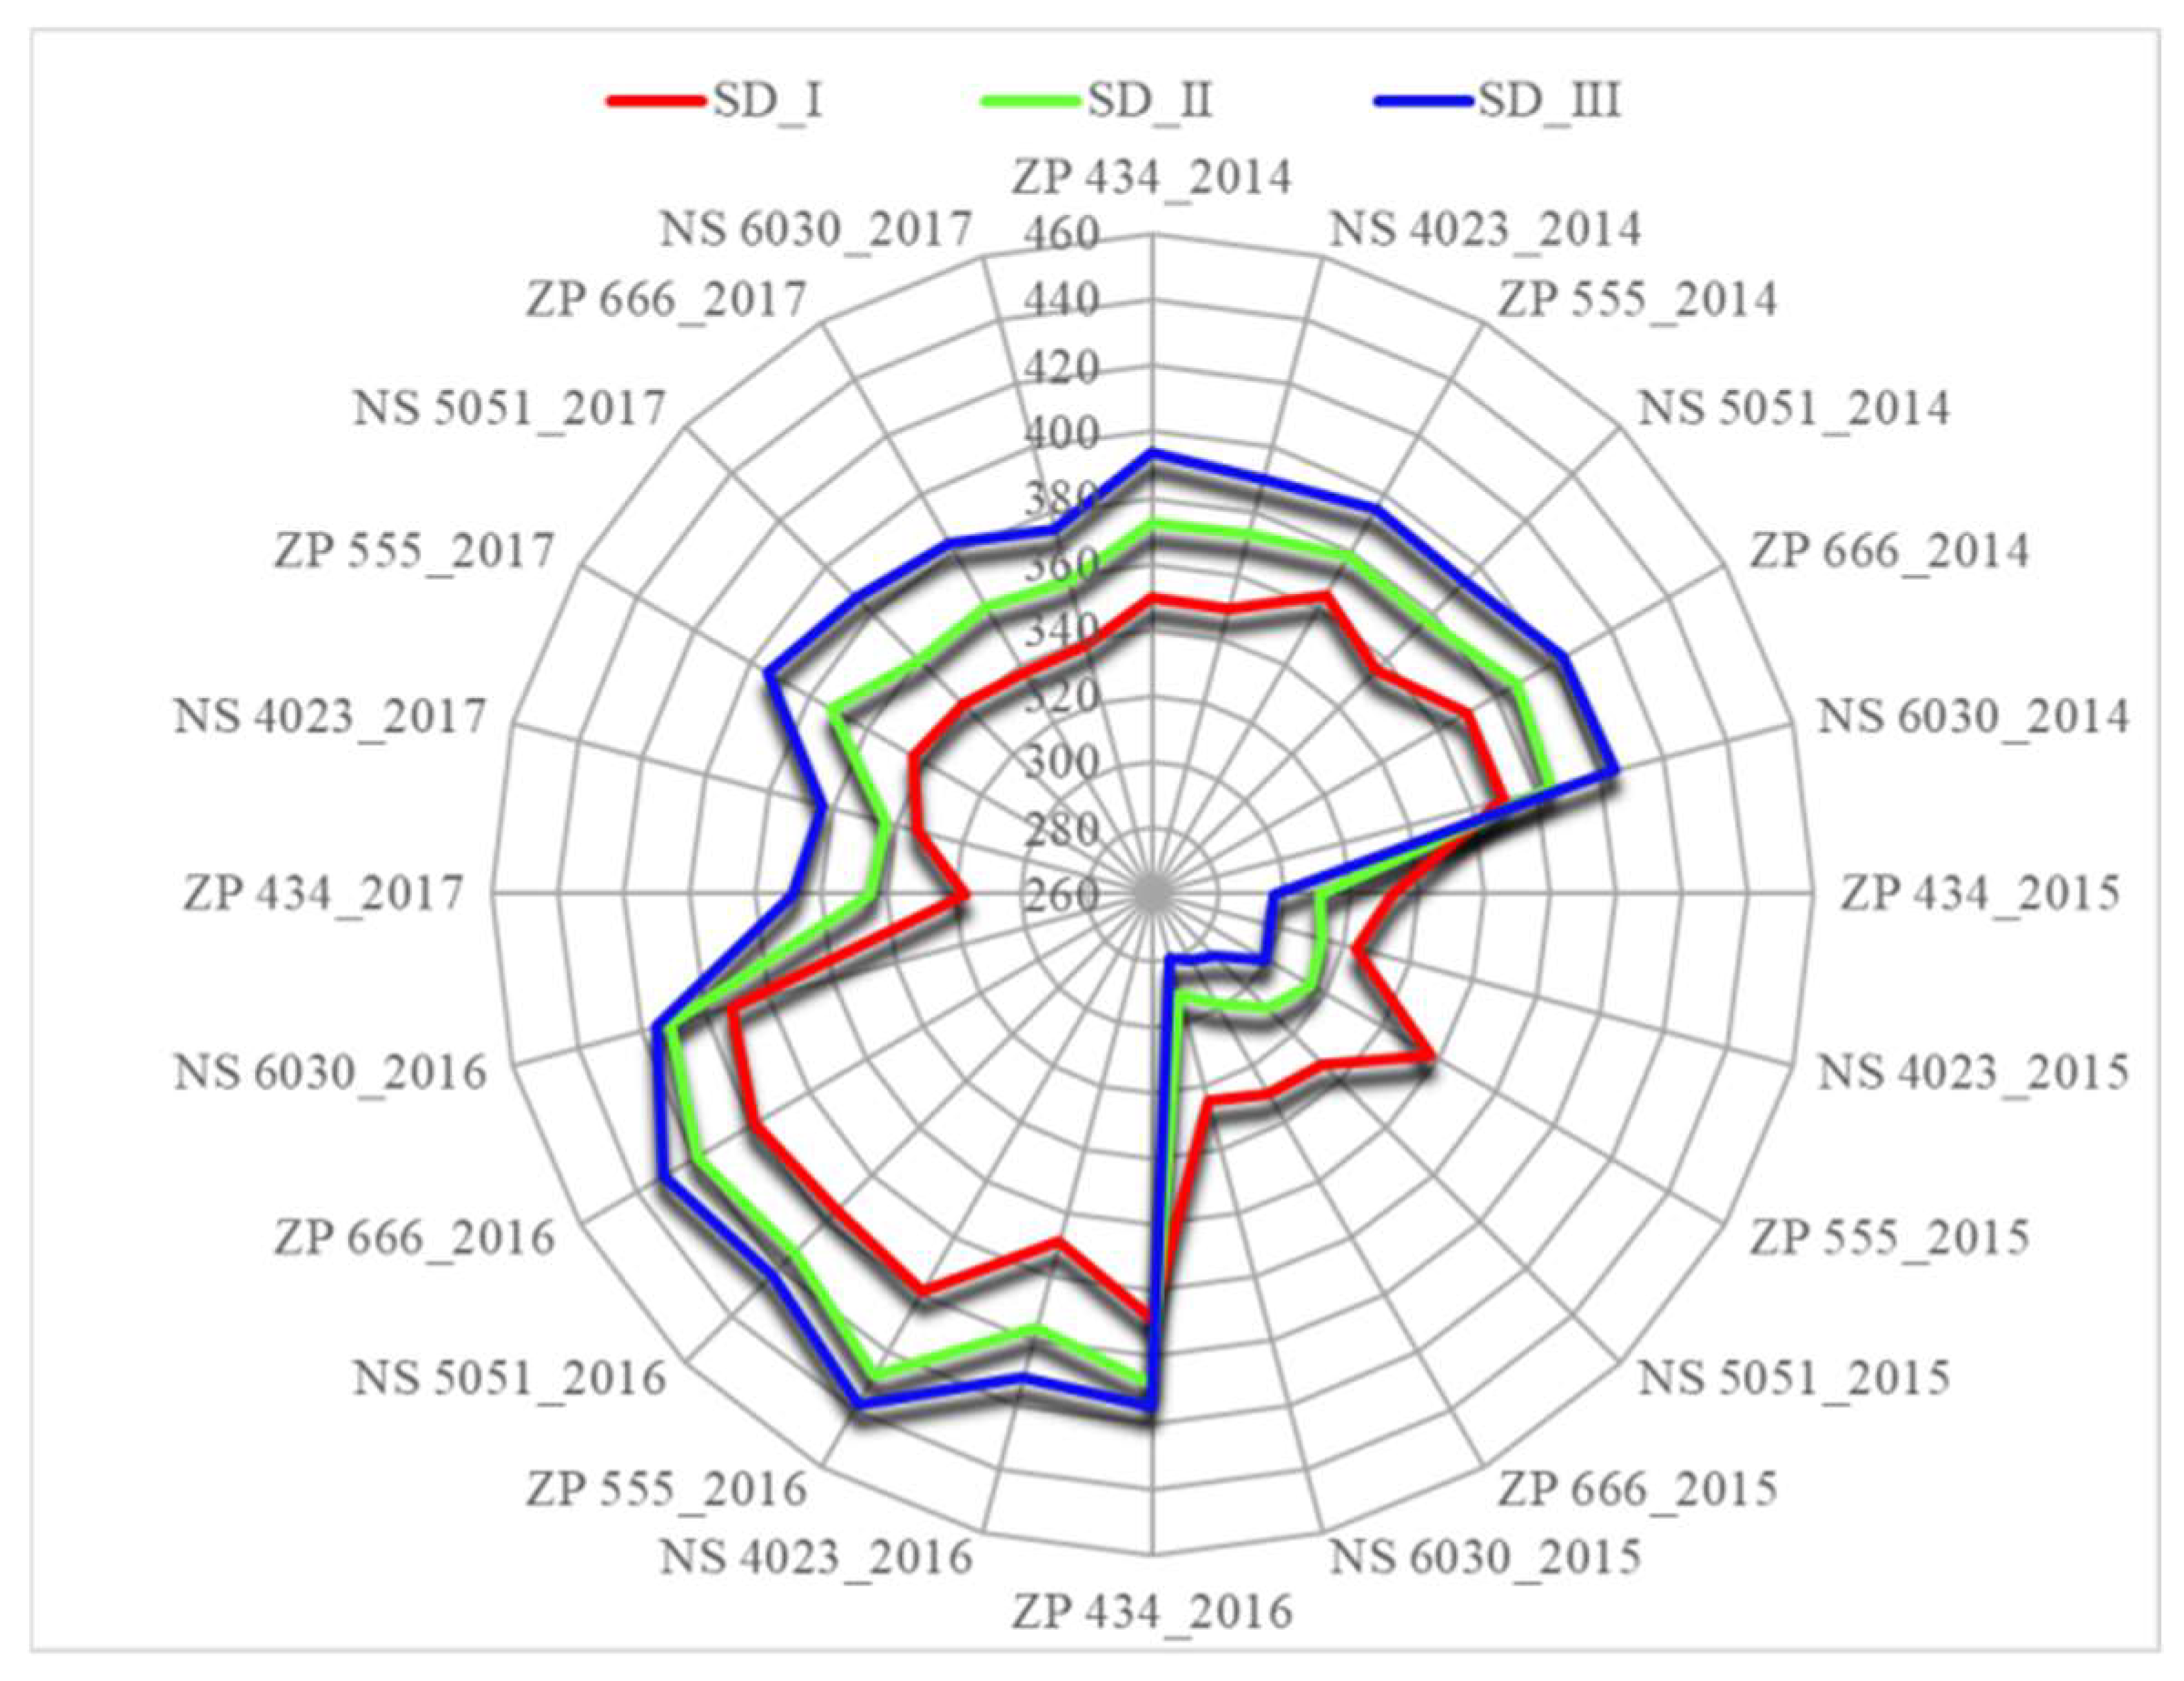
Figure 9.
Correlation coefficients between the studied productive traits of maize hybrids. GY-grain yield, NGR-number of rows of grains in the maize cob, NPH-number of plants at harvest, TKW-thousand kernel weight. Correlation is significant at the 0.01 level**.
Figure 9.
Correlation coefficients between the studied productive traits of maize hybrids. GY-grain yield, NGR-number of rows of grains in the maize cob, NPH-number of plants at harvest, TKW-thousand kernel weight. Correlation is significant at the 0.01 level**.
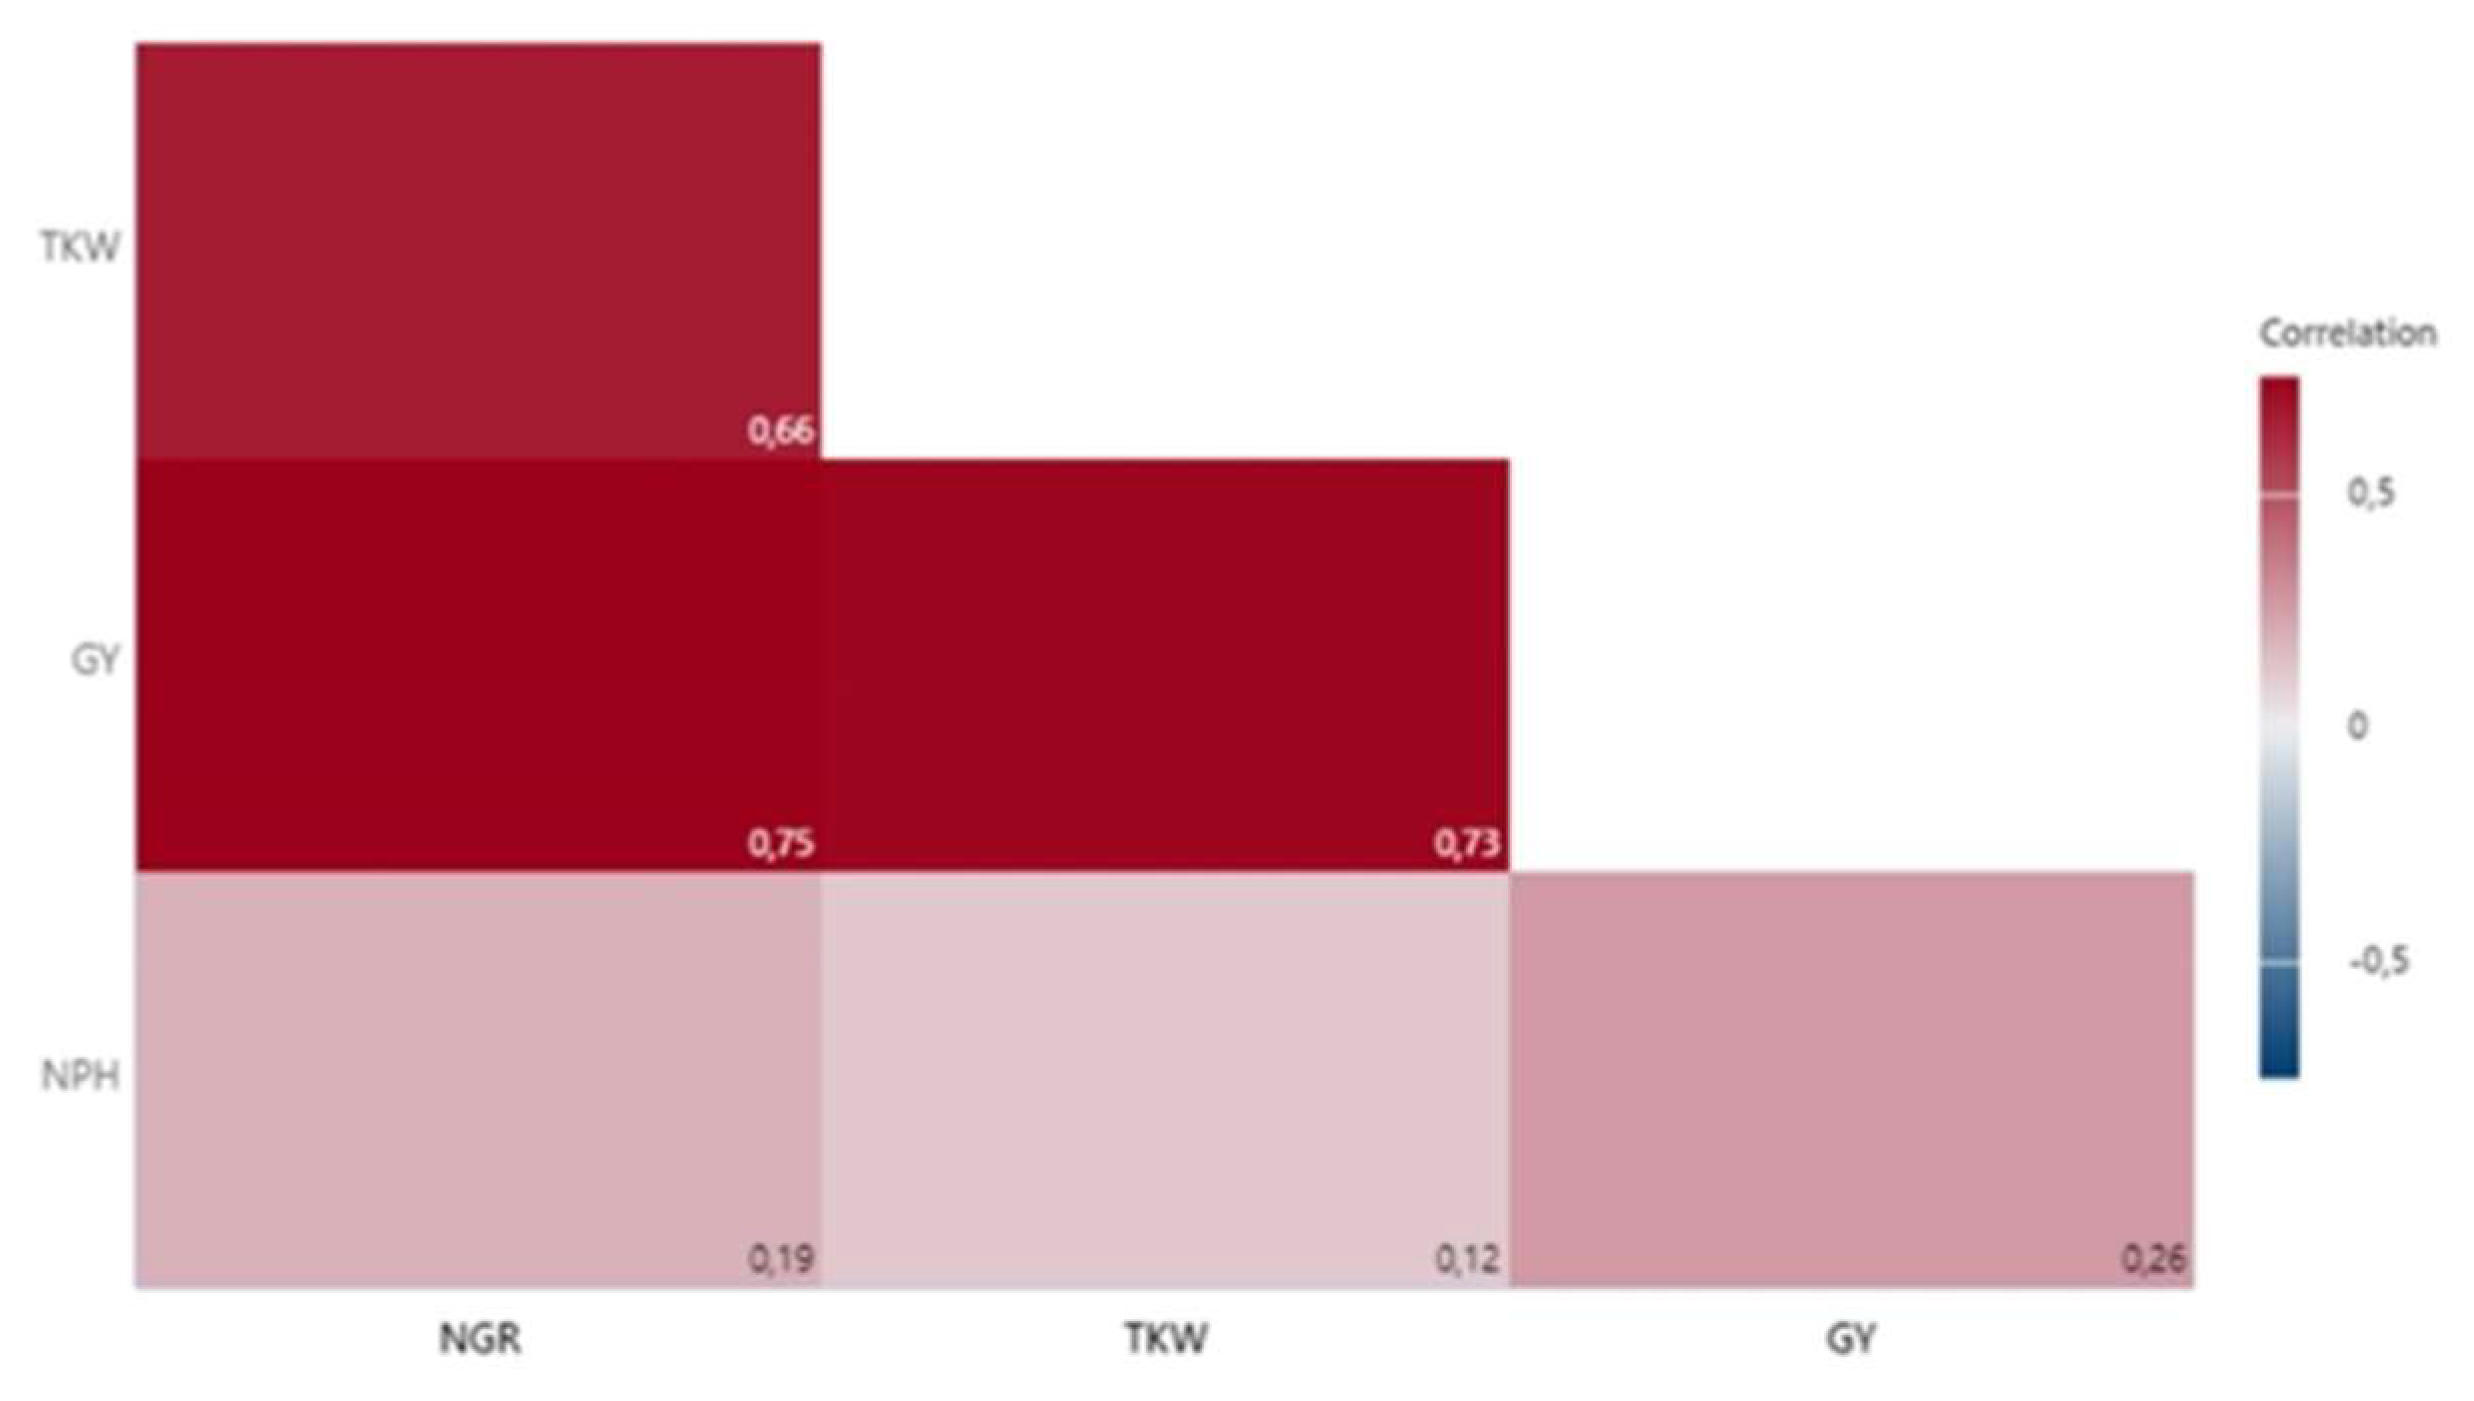

Table 1.
Variance analysis of the AMMI model for grain yield maize genotypes.
| Source of variation | df | SS | MS | F | p-level | SS (%) |
|---|---|---|---|---|---|---|
| Total | 215 | 1419.4 | 6.60 | - | - | - |
| Treatments | 71 | 1410.1 | 19.86 | 294.92** | 0.00000 | 99.34 |
| Genotypes | 5 | 50.0 | 10.00 | 148.48** | 0.00000 | 3.53 |
| Environments | 11 | 1186.1 | 107.82 | 2150.50** | 0.00000 | 83.56 |
| Block | 24 | 1.2 | 0.05 | 0.74ns | 0.79612 | 0.08 |
| Interactions | 55 | 174.1 | 3.17 | 47.00** | 0.00000 | 12.26 |
| IPCA1 | 15 | 124.6 | 8.31 | 123.36** | 0.00000 | 71.57 |
| IPCA2 | 13 | 31.6 | 2.43 | 36.08** | 0.00000 | 20.73 |
| IPCA3 | 11 | 14.8 | 1.35 | 20.01** | 0.00000 | 8.5 |
| Residuals | 16 | 3.1 | 0.19 | 2.85 | 0.00059 | 0.22 |
| Error | 120 | 8.1 | 0.07 | - | - | - |
**-Highly significant at p < 0.01 probability level; ns-Not significant at p > 0.05 level; df-Degree of freedom; SS-Sum of squares; MS-Mean Squares; F-F value calculated; p-level-p value calculated; IPCA1-The first-interaction principal components axes; IPCA2-The second-interaction principal components axes; IPCA3-The third-interaction principal components axes.
Table 2.
Variance analysis of the AMMI model for number of plants at harvest maize genotypes.
| Source of variation | df | SS | MS | F | p-level | SS (%) |
|---|---|---|---|---|---|---|
| Total | 215 | 23884 | 111.1 | - | - | - |
| Treatments | 71 | 23841 | 335.8 | 1000.36** | 0.00000 | 99.82 |
| Genotypes | 5 | 17 | 3.5 | 10.34** | 0.00000 | 0.07 |
| Environments | 11 | 23734 | 2157.7 | 24351.33** | 0.00000 | 99.37 |
| Block | 24 | 2 | 0.1 | 0.26ns | 0.99980 | 0.01 |
| Interactions | 55 | 90 | 1.6 | 4.85** | 0.00000 | 0.38 |
| IPCA1 | 15 | 78 | 5.2 | 15.54** | 0.00000 | 86.67 |
| IPCA2 | 13 | 7 | 0.5 | 1.60ns | 0.09511 | 7.78 |
| IPCA3 | 11 | 4 | 0.3 | 1.02ns | 0.43423 | 4.44 |
| Residuals | 16 | 1 | 0.0 | 0.13 | 0.99999 | 0.004 |
| Error | 120 | 40 | 0.3 | - | - | - |
**-Highly significant at p < 0.01 probability level; ns-Not significant at p > 0.05 level; df-Degree of freedom; SS-Sum of squares; MS-Mean Squares; F-F value calculated; p-level-p value calculated; IPCA1-The first-interaction principal components axes; IPCA2-The second-interaction principal components axes; IPCA3-The third-interaction principal components axes.
Table 3.
Variance analysis of the AMMI model for the number of rows of grains in the maize cob.
| Source of variation | df | SS | MS | F | p-level | SS (%) |
|---|---|---|---|---|---|---|
| Total | 215 | 302.62 | 1.408 | - | - | - |
| Treatments | 71 | 287.33 | 4.047 | 39.27** | 0.00000 | 94.95 |
| Genotypes | 5 | 118.76 | 23.752 | 230.49** | 0.00000 | 39.24 |
| Environments | 11 | 152.43 | 13.857 | 113.93** | 0.00000 | 50.37 |
| Block | 24 | 2.92 | 0.122 | 1.18ns | 0.27367 | 0.96 |
| Interactions | 55 | 16.15 | 0.294 | 2.85** | 0.00000 | 5.34 |
| IPCA1 | 15 | 12.92 | 0.861 | 8.36** | 0.00000 | 78.30 |
| IPCA2 | 13 | 2.86 | 0.220 | 2.13* | 0.01671 | 17.33 |
| IPCA3 | 11 | 0.27 | 0.024 | 0.24ns | 0.99451 | 1.67 |
| Residuals | 16 | 0.11 | 0.007 | 0.06 | 100.000 | 0.03 |
| Error | 120 | 12.37 | 0.103 | - | - | - |
**-Highly significant at p < 0.01 probability level; *-Significant at p < 0.05 probability level; ns-Not significant at p > 0.05 level; df-Degree of freedom; SS-Sum of squares; MS-Mean Squares; F-F value calculated; p-level-p value calculated; IPCA1-The first-interaction principal components axes; IPCA2-The second-interaction principal components axes; IPCA3-The third-interaction principal components axes.
Table 4.
Variance analysis of the AMMI model for thousand kernel weight of maize hybrids.
| Source of variation | df | SS | MS | F | p-level | SS (%) |
|---|---|---|---|---|---|---|
| Total | 215 | 368946 | 1716 | - | - | - |
| Treatments | 71 | 350635 | 4939 | 37.58** | 0.00000 | 95.037 |
| Genotypes | 5 | 7857 | 1571 | 11.96** | 0.00000 | 2.13 |
| Environments | 11 | 333077 | 30280 | 285.83** | 0.00000 | 90.28 |
| Block | 24 | 2542 | 106 | 0.81ns | 0.72291 | 0.69 |
| Interactions | 55 | 9701 | 176 | 1.34ns | 0.09272 | 2.63 |
| IPCA1 | 15 | 5002 | 333 | 2.54** | 0.00264 | 51.56 |
| IPCA2 | 13 | 2932 | 226 | 1.72ns | 0.06574 | 30.22 |
| IPCA3 | 11 | 1174 | 107 | 0.81ns | 0.62787 | 12.1 |
| Residuals | 16 | 593 | 37 | 0.28 | 0.99711 | 0.16 |
| Error | 120 | 15769 | 131 | - | - | - |
**-Highly significant at p < 0.01 probability level; *-Significant at p < 0.05 probability level; ns-Not significant at p > 0.05 level; df-Degree of freedom; SS-Sum of squares; MS-Mean Squares; F-F value calculated; p-level-p value calculated; IPCA1-The first-interaction principal components axes; IPCA2-The second-interaction principal components axes; IPCA3-The third-interaction principal components axes.
Disclaimer/Publisher’s Note: The statements, opinions and data contained in all publications are solely those of the individual author(s) and contributor(s) and not of MDPI and/or the editor(s). MDPI and/or the editor(s) disclaim responsibility for any injury to people or property resulting from any ideas, methods, instructions or products referred to in the content. |
© 2025 by the authors. Licensee MDPI, Basel, Switzerland. This article is an open access article distributed under the terms and conditions of the Creative Commons Attribution (CC BY) license (http://creativecommons.org/licenses/by/4.0/).
Copyright: This open access article is published under a Creative Commons CC BY 4.0 license, which permit the free download, distribution, and reuse, provided that the author and preprint are cited in any reuse.


