Submitted:
18 November 2025
Posted:
19 November 2025
You are already at the latest version
Abstract
Diffusion bonding is an excellent technology, and it is expected to open new fields of application. To further develop diffusion bonding technology, it is necessary to investigate the inter-diffusion phenomena that occur at the atomic level at the inter-face of bonded junction. Homogeneous Cu-Cu junction and heterogeneous Cu-Al junction were fabricated using the direct diffusion bonding method. Using XPS, we invest-gated the phenomena of recrystallization and inter-diffusion at the interface of the bonded junction. The Cu valence band spectrum observed using XPS measurements at the inter-face of the homogeneous Cu-Cu direct diffusion bonded junction revealed that the diffusion-induced recrystallization occurred. In a heterogeneous Cu-Al direct diffusion bonded junction, the valence band spectrum observation using XPS measurement showed that the valence bands of Cu and Al overlapped at the interface of the bonded junction. Using a heterogeneous Cu-Al direct diffusion bonded junction, we investigated the inter-diffusion at the interface of the bonded junction and found that the diffusion lengths of Al atom in the Cu region and of Cu atom in the Al region were approximately 11.8 μm and 7.85 μm, respectively.
Keywords:
direct diffusion bonding method
; Cu-Cu junction
; Cu-Al junction
; XPS measurement
; inter-diffusion
; diffusion length
1. Introduction
Diffusion bonding is a joining process in which the principal mechanism for joint formation is solid state diffusion [1]. Historically, the solid phase diffusion bonding has been developed to create lightweight aerospace components.
On the other hand, the joining process requires several strictly controlled condition: clean and smooth contacting surfaces that are free from oxides and high-temperature conditions to promote the diffusion process. In diffusion bonding, bond strength is achieved by pressure, temperature, time of contact, and surface cleanliness. The strength of the bond is primarily due to diffusion rather than plastic deformation.
Diffusion bonding has the following advantages:
1. Diffusion bonding can be used to join not only the same metal but also dissimilar metals and ceramics together. A joined body with sufficient mechanical strength can also be realized by diffusion bonding.
2. Adhesives are not used, and the joints are made in a high-vacuum furnace; therefore, there is no contamination of impurities.
3. Diffusion bonding occurs at temperatures lower than the melting point of the metal material used, preventing the thermal deformation of the bonded components.
With the advantages described above, diffusion bonding technology is expected to find further applications in areas such as the manufacture of electric vehicle components, which require further weight reduction. Diffusion bonding is also expected to be a technology for joining metal components in space [2]. Recently, the development of diffusion bonding technology using impulse pressure methods has progressed in addition to the constant pressure method [3].
In the initial stage of the diffusion bonding process, voids remain on the surface of the metal. An inter-diffusion phenomenon occurs at the bonded junction interface. For further development of diffusion bonding technology, it is important to investigate the inter-diffusion phenomenon that occurs at the bonded junction interface at the atomic level.
In this study, we fabricated homogeneous Cu-Cu and heterogeneous Cu-Al junctions using direct diffusion bonding technology and investigated the phenomena due to changes occurring at and near the interface of bonded junctions using XPS. Since assessing the diffusion length and mutual diffusion coefficient is essential for developing advanced diffusion bonding technology that improves the bonding strength and thermal conductivity of the bonded components, we further analyzed the diffusion length and diffusion coefficient of Al atoms in the Cu region, as well as those of Cu atoms in the Al region, based on the XPS measurement results.
2. Experimental
2.1. Sample Preparation
The conditions for preparing homogeneous Cu-Cu directly bonded junctions and heterogeneous Cu-Al directly bonded junctions using diffusion bonding technology are as follows:
1. The hybrid diffusion bonding machine: IHI Machinery Systems Co., Ltd., Hybrid diffusion bonding machineHHVS-30/30/35-RF. [4].
2. Oxygen-free Cu plate (C1020): 99.9% purity, length 80 mm × width 80 mm × thickness 20 mm. The plate edge surface, which is the surface of the bonded junction interface, was flattened to achieve an unevenness of 5 μm or less.
3. Aluminum plate (A1050): 99.6% purity, length 80 mm × width 80 mm × thickness 20 mm. Plate edge surface, which will be the surface of bonded junction interface, was flattened so that the unevenness was 5 μm or less.
4. Furnace vacuum: < 6.0 × 10⁻² Pa
5. Pressure condition: Constant 1.5 MPa
6. Heating conditions: The temperature was set to 530–550 °C by external heating.
7. Heating retention time: 3 hours
8. Annealing conditions: 15 hours of cooling in the furnace after the heating retention time
After removing diffusion bonded plate from the furnace at 60 °C, the samples were cut into 20 mm × 10 mm × 20 mm pieces using a wire-cutting machine. Because the interface of the homogeneous Cu-Cu direct diffusion-bonded junction became completely invisible after bonding, markings were made on both ends of the junction before the diffusion bonding process so that the position of the bonded interface could be identified.
2.2. XPS Measurement Procedure
XPS measurements were carried out using Quantera from Ulvac-Phi [https://www.ulvac-phi.com/en/?lang=en_US]. The X-ray probe employed was the characteristic X-ray AlKα with energy of 1468.6 eV and energy resolution (FWHM) of 0.49 eV or less for Ag3d5/2 spectrum. The surface of the diffusion bonded junction mounted on sample stage made of Al in the XPS instrument was initially cleaned using Ar beam sputtering since carbons and oxygen were found to be adhered to the surface of the bonded sample. The characteristic X-ray AlKα beam was subsequently irradiated onto the diffusion bonded junction. The analysis region was determined by employing SXI that is integrated into the XPS instrument.
3. Results and Discussion
3.1. XPS Measurement Results for Homogeneous Cu-Cu Direct Diffusion Bonded Junction
Figure 1 shows an optical microscope image with × 250 magnification of the region surrounding the bonded interface of a homogeneous Cu-Cu direct diffusion bonded junction. The inset shows a magnified image of an example region selected for XPS measurement using an X-ray AlKα beam with a diameter of 20 μm. The regions suitable for the XPS measurements were determined using SXI.
In Figures of the XPS measurement results in this manuscript, 0 eV corresponds to the Fermi level of Al, which is the energy reference for the energy analyzer of the XPS instrument employed. The valence band of Cu is formed by 10 electrons of 3d state. The conduction electron of Cu, a Cu4s electron is not almost observed in the valence band spectrum since the photoionization cross-section of Cu4s electron is less than one-tenth of that of Cu3d electrons as shown in Table 1 [5].
Figure 2a,b present the results of XPS analysis following irradiation with 20 μm diameter characteristic X-ray AlKα beams on the pure Cu region of a Cu-Cu direct diffusion bonded junction and the diffusion bonded junction interface region, respectively.
A comparison of Figure 2a,b reveals that the Cu valence band spectrum changes owing to the formation of a diffusion bonded junction. In polycrystalline Cu, microcrystals of various plane orientations are mixed so that the crystal potential is averaged and the energy levels near the Cu3d3/2 and Cu3d5/2 spectra peaks are degenerated, resulting in broadened spectra. Shabanova et al. reported a similar spectrum for the Cu valence band [6].
For comparison, Figure 2(c) presents the result of XPS analysis performed by irradiating a single-crystal Cu (111) surface with a 20 μm diameter characteristic AlKα X-ray beam, showing the valence band spectrum of a single-crystal Cu (111) surface. The peak near the binding energy of 1.66 eV corresponds to the Cu3d5/2 state, and the peak near 2.6 eV corresponds to the Cu3d3/2 state. The position of the valence band of the single-crystal Cu (111) surface is closer to the Fermi level than that of polycrystalline Cu in Figure 2(b) because the work function of single-crystal Cu (111) surface is 4.94 eV, which is approximately 0.25 eV larger than that of polycrystalline Cu [7]. In a single crystal, the disturbance of the crystal potential is small, and the degeneracy of the energy levels is resolved, such that the spectra near the peaks of Cu3d3/2 and Cu3d5/2 are clearly observed. At the interface of the homogeneous Cu-Cu junction shown in Figure 2(a), both Cu3d₃/₂ and Cu3d₅/₂ peaks are clearly observed, and the valence band spectrum at this interface is found to more closely resemble that of single-crystal Cu (Figure 2(c)) than that of polycrystalline Cu (Figure 2(b)). We believe that diffusion-induced recrystallization occurs at the interface formed by diffusion bonding, aligning the plane orientation [8].
3.2. XPS Measurement Results for Heterogeneous Cu-Al Direct Diffusion Bonded Junction
3.2.1. Junction Interface Region
Figure 3 shows an SEM image with × 500 magnification of the region surrounding the bonded interface of a heterogeneous Cu-Al direct diffusion bonded junction. The inset shows a magnified image of an example region selected for XPS measurement. The regions suitable for the XPS measurements were determined using SXI.
XPS analysis of heterogeneous Cu-Al direct diffusion bonded junctions was carried out by irradiating them with a characteristic AlKα X-ray beam with a diameter of 10 μm.
Figure 4a,b present the results of XPS analysis, showing the valence band spectra at the interface and in the Al region, respectively. The valence electrons of Al are two 3s state electrons and one 3p state electron, which are also the conduction electrons. In the XPS measurements, the photoionization cross-sections of the Al3s and Al3p states were small, as shown in Table 1.
In Figure 4(b), however, the Al3s spectrum can be observed between 8 eV and 11 eV, and a relatively broad Al3p spectrum can also be observed between 0 eV and 8 eV.
3.2.2. Estimation of Diffusion Length
The diffusion coefficient of the metal at a temperature just below its melting point is about 1 μm2/s so the diffusion length is estimated to be about a hundred micrometers. On the other hand, since diffusion bonding occurs at temperatures of about 50% to 80% of the metal’s melting point, metal atoms move between each other’s regions to fill voids and jump to fill atomic vacancies; as a result, the diffusion length is expected to be on the order of several micrometers.
Estimating the diffusion length during diffusion bonding is useful for achieving diffusion bonded junctions with sufficient mechanical strength. In this study, we employed a heterogeneous Cu-Al direct diffusion bonded junction and conducted XPS measurements 10 μm away from the interface on both the Cu and Al sides after irradiation with characteristic AlKα X-ray beams of 10 μm diameter.
Figure 5a,b show the XPS measurement results of Cu3p, Al2p spectra, and Al2s and Cu3s spectra, respectively, taken from the Cu region 10 μm away from the interface of the heterogeneous Cu-Al direct diffusion-bonded junction. In Figure 5(a), the spectrum from 75 eV to 77 eV corresponds to Cu3p, and the spectrum at 72.5 eV corresponds to Al2p. In Figure 5(b), the spectrum at 117.5 eV corresponds to Al2s, and the spectrum at 122.5 eV corresponds to Cu3s. These results suggest that the diffusion length of Al atom in the Cu region is about 10 μm.
Since the spectra of Cu3p and Al2p are clearly observed in Figure 5(a), we attempted to estimate the diffusion length of Al atoms in the Cu region using the XPS spectra measurement results shown in Table 2. The method we adopted below is intended to estimate the approximate diffusion length, as obtaining an accurate diffusion length through quantitative analysis based on XPS spectrum measurement is difficult.
Below, we estimated the diffusion lengths using a one-dimensional model. The x coordinate is set as follows: the interface is at x=0, x>0 is the Cu region, and x<0 is the Al region.
Similarly, when the normalized number of Al atoms () as a function of x, in the Al region sufficiently far from the interface is set to 1, is equal to 0.5 at the interface. The following equation holds for any value of x:
The numbers of Cu atoms and Al atoms in the Cu region are proportional to the numbers of photoelectrons of each atom obtained by XPS measurement. The shape of the photoelectron spectrum is precisely given by the well-known formula of Doniach-Sunjic-Shirley, but here, for simplicity, the photoelectron spectrum is approximated by the Lorentz distribution function [9]. Then, the following formula holds:
where , , , n and are the number of atoms in the analysis region, the peak height in the measured spectrum, the spectral FWHM, the number of electrons in the orbital (state), for example, n=6 in the p state, and the photoionization cross-section of the orbital, respectively.
Using Table 2, the following formula holds:
This formula represents the ratio of Al atoms to Cu atoms at a specific point. Therefore, the following result is obtained using equation (1):
This result indicates the concentration of Al atoms at the given point.
In the Cu region, the solution of the diffusion equation (Fick’s second law) is assumed to follow the formula when thermal diffusion stops after a certain time has passed since the diffusion bonding was formed:
Hererepresents the diffusion length of an Al atom in the Cu region. The diffusion length () is estimated as
μm.
Figure 6a,b show the results of the XPS measurements of Al2p, Cu3p, and Cu2p spectra in the Al region 10 μm away from the interface of the heterogeneous Cu-Al direct diffusion bonded junction, respectively. In Figure 6(a), the spectrum from 75 eV to 77 eV corresponds to Cu3p, and the spectrum at 72.5 eV corresponds to Al2p. The spectra at 933 eV and 952 eV in Figure 6(b) correspond to Cu2p3/2 and Cu2p1/2, respectively.
It is found in Figure 6(a) that the Al2p spectrum is clearly observed, while Cu3p spectrum is not clearly observed. Figure 6(b) also shows that Cu2p spectrum can be observed in the Al region, even 10 μm away from the interface. These results suggest that the diffusion length of Cu atom in the Al region is about several micrometers.
Since the spectra of Al2p and Cu2p are clearly observed in Figure 6a,b , respectively, we estimated the diffusion length () of a Cu atom in the Al region using the XPS spectra measurement results shown in Table 3 as well as.
Using Table 3, the following formula holds:
This formula represents the ratio of Cu atoms to Al atoms at a specific point. Therefore, the following result is obtained using equation (1):
This result indicates the concentration of Cu atoms at the given point.
If the following formula holds in the Al region as well as in the Cu region:
The diffusion length () is estimated as
μm.
3.2.3. Estimation of Diffusion Coefficient
Inter-diffusion between two metals is also called chemical diffusion and is theoretically considered using Gibbs free energy. The diffusion phenomenon in the chemical field occurs in the liquid or gas phase. The temperature during diffusion bonding is relatively lower than the melting point of each material, so the diffusion phenomenon does not occur in the liquid phase. The explanation for inter-diffusion between two metals using free energy is that free energy decreases when two materials diffuse into each other.
However, inter-diffusion occurs at the diffusion-bonded interface when the two materials are not in the liquid phase. The XPS analysis revealed that the diffusion length of Al into the Cu region () was 11.8 μm, and the diffusion length of Cu () into the Al region was 7.85 μm. The reason why the diffusion length () is greater than that of is qualitatively considered below.
Diffusion- bonded junctions are prepared at temperatures below the melting point of the metals used. For example, in the case of Cu-Al direct diffusion bonding, the temperature during production is at most 550 °C. As shown in Table 4, the melting points of Cu and Al are 1085 °C and 660.3 °C, respectively. Therefore, the temperature during production is lower than the melting points of both metals, and the inter-diffusion phenomenon at the bonded interface occurs in the solid phase, not in the liquid phase. At the beginning of the diffusion bonding process, voids exist at the end faces of the two metal materials used at the bonding interface, and diffusion and recrystallization occur to fill those voids. Thereafter, inter-diffusion is thought to proceed to fill lattice vacancies present in each region. The diffusion length () obtained in this study was about 50% larger than that of . The diffusion length we estimated is the value at which inter-diffusion stops after the Cu-Al direct diffusion bond is formed and the junction is cooled during annealing. It is challenging to determine the exact temperature at which inter-diffusion ceased. However, due to the rapid decrease in the diffusion coefficient of metals as temperature decreases, it is assumed that inter-diffusion halted before the temperature reached approximately 400 °C.
We will subsequently analyze the variation in thermodynamic binding energy (δH) [10]. Consider a scenario where Al atoms jump and diffuse into lattice vacancies within the Cu region. The temperature at which Cu-Al direct diffusion bonding samples are processed does not exceed 550 °C, which is below the melting points of Cu and Al as shown in Table 4, with the single vacancy mechanism being dominant. [11–13Here, an impurity-vacancy pair comprising one vacancy and one impurity atom is considered, with the interaction between the lattice vacancy of the Cu crystal and the Al impurity atom assumed to be electrostatic. Among the changes in free energy, if we focus on the change in binding energy (δH), it is proportional to the screening potential created by the impurity atoms [10]. If the Thomas-Fermi potential [11,12,13] is employed as the screening potential, the following equation applies:
Hereandare the numbers of valence electrons in the outermost shells of Cu and Al atoms, respectively. Additionally,, d , and e are the dielectric constant of vacuum, the shortest interatomic distance (jump distance), and the absolute value of the electron charge, respectively. In equation (11), λ is the Thomas-Fermi screening constant, which is given by the following equation:
Hereandare the Fermi energy and the electron density, respectively.
Table 5 presents the Fermi energy and the screening constant calculated using the free-electron model. The calculated values of binding energy (δH) are also presented in Table 5. Since the crystal structure of both Cu and Al is FCC, the shortest interatomic distance (d) is given by
Here the lattice constant is denoted as a.
In this discussion, the key point is not the precision of δH’s value, but its sign. Specifically, when Al atoms jump and diffuse as impurity atoms into lattice vacancies in the Cu region, δH becomes negative, leading to a decrease in the crystal system’s free energy, thus enhancing stability.
Cu atoms, when acting as impurity atoms, tend to have a positive change in binding energy (δH) when diffusing into lattice vacancies in the Al region, as shown in equation (11). This results in a smaller decrease in free energy compared to the diffusion of Al atoms into the Cu region. Consequently, Al atoms more readily diffuse into the Cu region, whereas Cu atoms do not easily diffuse into the Al region, resulting in a longer diffusion length () compared to.
Fujikawa, S. and Hirano, K. reported that the diffusion coefficient of Cu atom as an impurity in Al was 1.40 × 10⁻¹³ m2/s at 550 °C through precise measurements using radioactive Cu isotopes [14]. Liu, K., Yu, H., Li, X., and Wu, S fabricated a diffusion bonded Al-Cu junction at 540 °C for 48 hours and carried out experiments for the formation of intermetallic compounds between Al and Cu near the junction interface, reporting that θ(Al2Cu) grew on the Al side of the bonded interface, and γ1(Al4Cu9) grew on the Cu side [15,16]. They also reported that the inter-diffusion coefficients of θ(Al2Cu) and γ1(Al4Cu9) were 3.14 × 10⁻¹³ m2/s and 1.48 × 10⁻¹² m2/s, respectively [15].
Recently, Luu, H.T. and Merkert, N. analyzed the inter-diffusion phenomenon at the Cu-Al diffusion bonding interface using molecular dynamics simulations [17]. They found that the diffusion coefficients of Cu atom and Al atom at 577 °C are nearly the same, at approximately 2.0 × 10⁻¹⁶ m2/s. They also reported that this diffusion coefficient value agrees with the experimental results of Matsuo, N. and Oikawa, H. [18].
In our experiment, we assumed that the time from stopping heating until the inter-diffusion phenomenon stopped was τ=5 hours. We then estimated the time-average diffusion coefficient () using following equation:
Here L denotes the diffusion length.
It was found that the time-average diffusion coefficients of the Al atom in the Cu region and the Cu atom in the Al region at 550 °C are approximately 1.84 × 10⁻¹⁵ m2/s and 8.45 × 10⁻¹⁶ m2/s, respectively. The values obtained for the diffusion coefficient agree with experimentally determined diffusion coefficients of Cu-Al solid solutions that are within the order of magnitude, 10-15 m2/s, [18].
4. Conclusions
We fabricated homogeneous Cu-Cu junctions and heterogeneous Cu-Al junctions using the direct diffusion bonding method. Recrystallization and inter-diffusion phenomena occurring at the interface of bonded junctions were investigated using XPS.
As a result, the following became clear.
1. In a homogeneous Cu-Cu direct diffusion bonded junction, Cu valence band spectrum observation using XPS measurement revealed that diffusion-induced recrystallization occurred at the interface of the bonded junction.
2. In a heterogeneous Cu-Al direct diffusion bonded junction, the valence band spectrum observation using XPS measurement showed that the valence bands of Cu and Al overlapped at the interface of the bonded junction.
3. Using a heterogeneous Cu-Al direct diffusion bonded junction, we investigated the inter-diffusion at the interface of the bonded junction. It was found that the diffusion lengths of Al atoms in the Cu region and of Cu atoms in the Al region are approximately 11.8 μm and 7.85 μm, respectively. It was also found that the time-average diffusion coefficients of the Al atom in the Cu region and the Cu atom in the Al region at 550 °C are approximately 1.84 × 10⁻¹⁵ m2/s and 8.45 × 10⁻¹⁶ m2/s, respectively.
Author Contributions
All authors discussed the content, analyzed data, reviewed, edited the manuscript, and agreed to the published version of the manuscript. All authors have read and agreed to the published version of the manuscript.
Funding
This research received no external funding.
Data Availability Statement
The data presented in this study is openly available.
Conflicts of Interest
The authors declare no conflicts of interest.
Abbreviations
The following abbreviations are used in this manuscript:
| XPS | X-ray Photoelectron Spectroscopy |
| SXI | Scanning X-ray Imaging |
| FWHM | Full Width Half Maximum |
| SEM | Scanning Electron Microscope |
References
- Everett, R.K. Diffusion Bonding. In Metal Matrix Composites: Processing and Interfaces, 1st ed.; Arsenault., R.J., Everett, R.K., Eds.; Academic Press: Amsterdam, The Netherlands, 1991; 17-40; ISBN 9780323159388.
- Derby, B.; Wallach, E.R. Joining Methods in Space: a Theoretical Model for Diffusion Bonding. Acta. Astro. 1980, 7, 685-698. [CrossRef]
- AlHazaa, A.; Haneklaus, N.; Almutairi, Z. Impulse Pressure-Assisted Diffusion Bonding (IPADB): Review and Outlook. Metals 2021, 11, 323-331. [CrossRef]
- Kawai, T.; Konishi, H.; Nakanowatari, I. Development of Diffusion Bonding Process by IHI Vacuum Hot Press. IHI Eng. Rev. 2023, 56, pp.1-8. Available online: https://www.ihi.co.jp/en/technology/techinfo/contents_no/1200310_13586.html/ (accessed on 17 October 2025).
- Scofield, J.H. Hartree-Slater Subshell Photoionization Cross-Sections at 1254 and 1487 eV. J. Elec. Spec. Rel. Phenon. 1976, 8, 129-137. [CrossRef]
- Shabanova, I.N.; Kholzakov, A.V.; Kraposhin, V.S. XPS Study of Transition Metal Electronic Structure in Crystalline and Liquid States. J. Elec. Spec. Rel. Phenon. 1998, 88-91, 453-455. [CrossRef]
- Properties of Solids, Electron Work Function of the Elements. In CRC Handbook of Chemistry and Physics, Internet Version 2005, 85th ed. ; Lide, D.R., Ed.; CRC Press, Boca Raton, Florida, USA, 2005; Section 12, 124. https://www.hbcpnetbase.com/ (accessed on 17 October 2025).
- Oh, M.; Kim, H.S.; Kobayashi E.; Kajihara, M. Understanding Kirkndall Effect in Ni(W) Diffusion-Induced Recrystallization Region. J. Alloys Comp. 2024, 991, 174556-174564. [CrossRef]
- Moeini, B.; Linford, M.R.; Fairley, N.; Barlow, A.; Cumpson, P.; Morgan, D.; Fernandez, V.; Baltrusaitis, J. Definition of a New (Doniach-Sunjic-Shirley) Peak Shape for Fitting Asymmetric Signals Applied to Reduced Graphene Oxide/Graphene Oxide XPS Spectra. Surf. Inter. Analys. 2022, 54, 67-77. [CrossRef]
- Heumann, T.; Mehrer, H. Diffusion in Legierungen. In Diffusion in Metallen, 1st ed.; Springer; Berlin, Germany, 1992; 131-207. [CrossRef]
- Thomas, L.H. The Calculation of Atomic Fields. Math. Proc. Cam. Phil. Soc., 1927, 23, 542-548. [CrossRef]
- Fermi, E. Eine Statistische Methode zur Bestimmung einiger Eigenschaften des Atoms und ihre Anwendung auf die Theorie des Periodischen Systems der Elemente. Z. Phys., 1928, 48, 73-79. [CrossRef]
- Lazarus, D. Effect of Screening on Solute Diffusion in Metals. Phys. Rev. 1954, 93, 973-976. [CrossRef]
- Fujikawa, S.; Hirano, K. Impurity-Diffusion of Copper in Aluminum. Defect Diff. Forum. 1989, 66-69, 447-452. [CrossRef]
- Liu, K.; Yu, H.; Li, X.; Wu, S. Study on Diffusion Characteristics of Al-Cu Systems and Mechanical Properties of Intermetallics. J. Alloys Comp. 2021, 874, 159831-159839. [CrossRef]
- Murray, J.L. The Aluminium-Copper System. Inter. Metals Rev. 1985, 30, 211-233. [CrossRef]
- Luu, H.T.; Merkert, N. Investigation of Solid-State Diffusion Bonding Al-Cu Interfaces of Metal Joints using Molecular Dynamics Simulations. Results in Surfaces and Interfaces 2025, 20, 100574-100583. [CrossRef]
- Matsuno, N.; Oikawa, H. Interdiffusion in Copper-Base Cu-Al Solid Solution. Met. Trans. A, 1975, 6A, 2191-2194. [CrossRef]
Figure 1.
An Optical microscope image with × 250 magnification of a homogeneous Cu-Cu direct diffusion bonded junction.
Figure 1.
An Optical microscope image with × 250 magnification of a homogeneous Cu-Cu direct diffusion bonded junction.
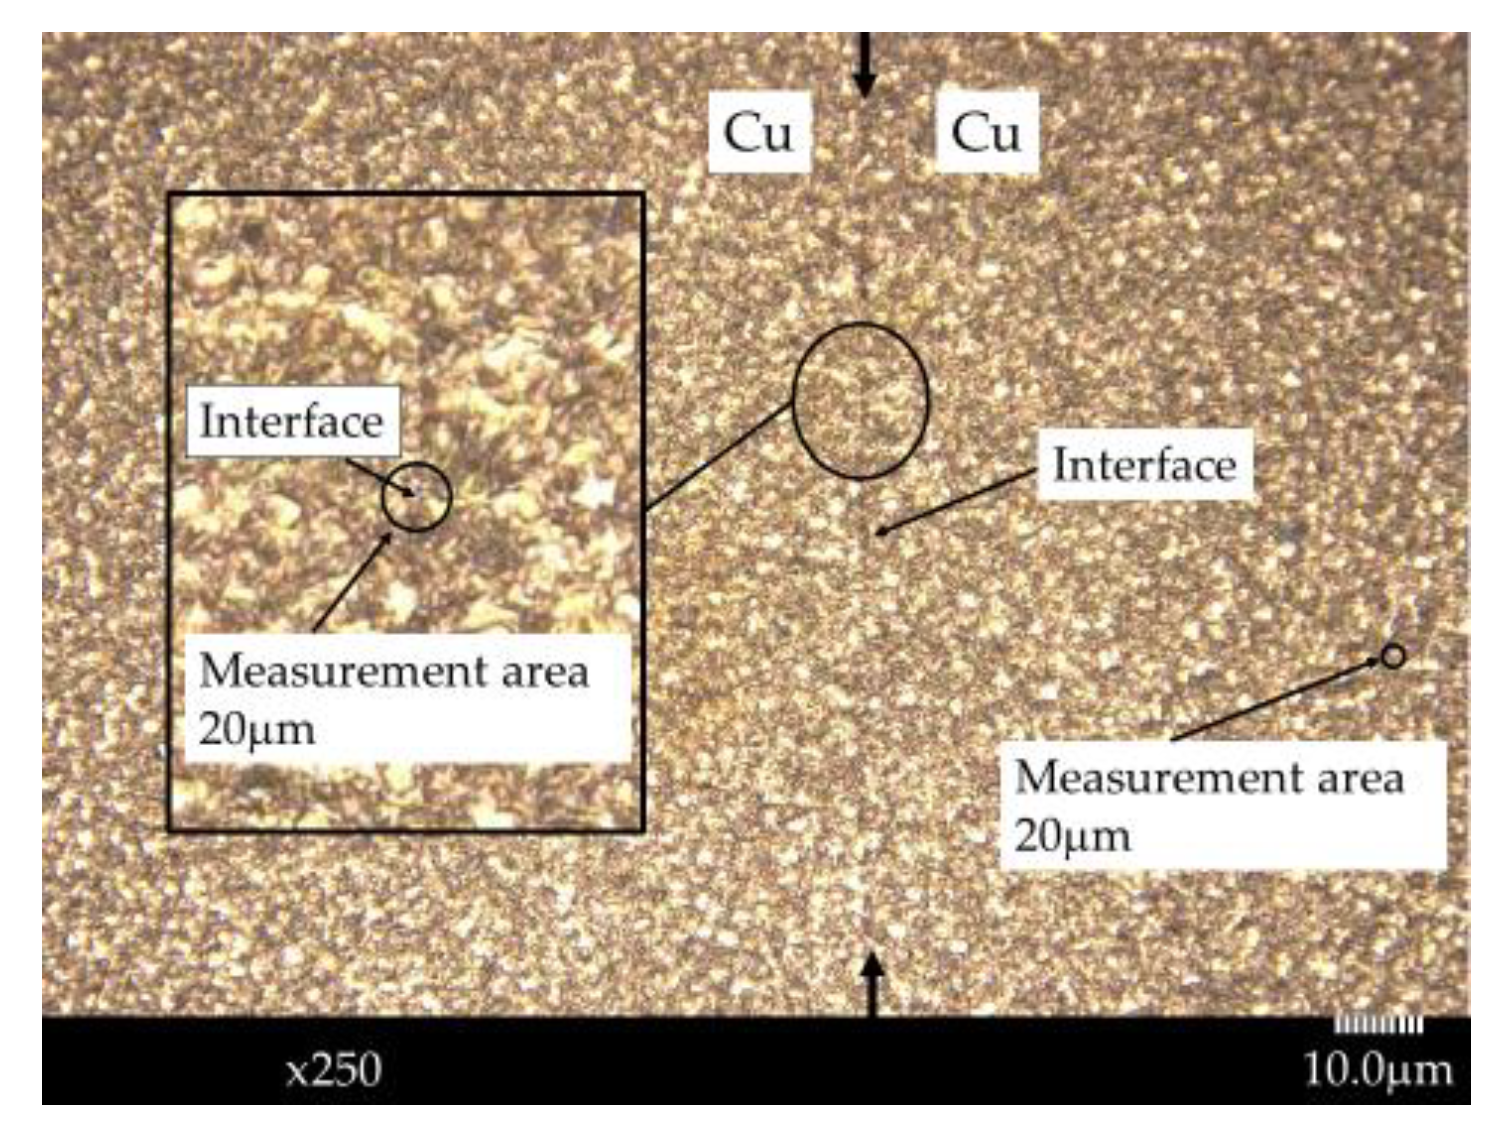
Figure 2.
(a) Cu valence band spectrum at the interface of the homogeneous Cu-Cu direct diffusion bonded junction. (b) Valence band spectrum of polycrystalline Cu. (c) Valence band spectrum of single-crystal Cu (111) surface.
Figure 2.
(a) Cu valence band spectrum at the interface of the homogeneous Cu-Cu direct diffusion bonded junction. (b) Valence band spectrum of polycrystalline Cu. (c) Valence band spectrum of single-crystal Cu (111) surface.
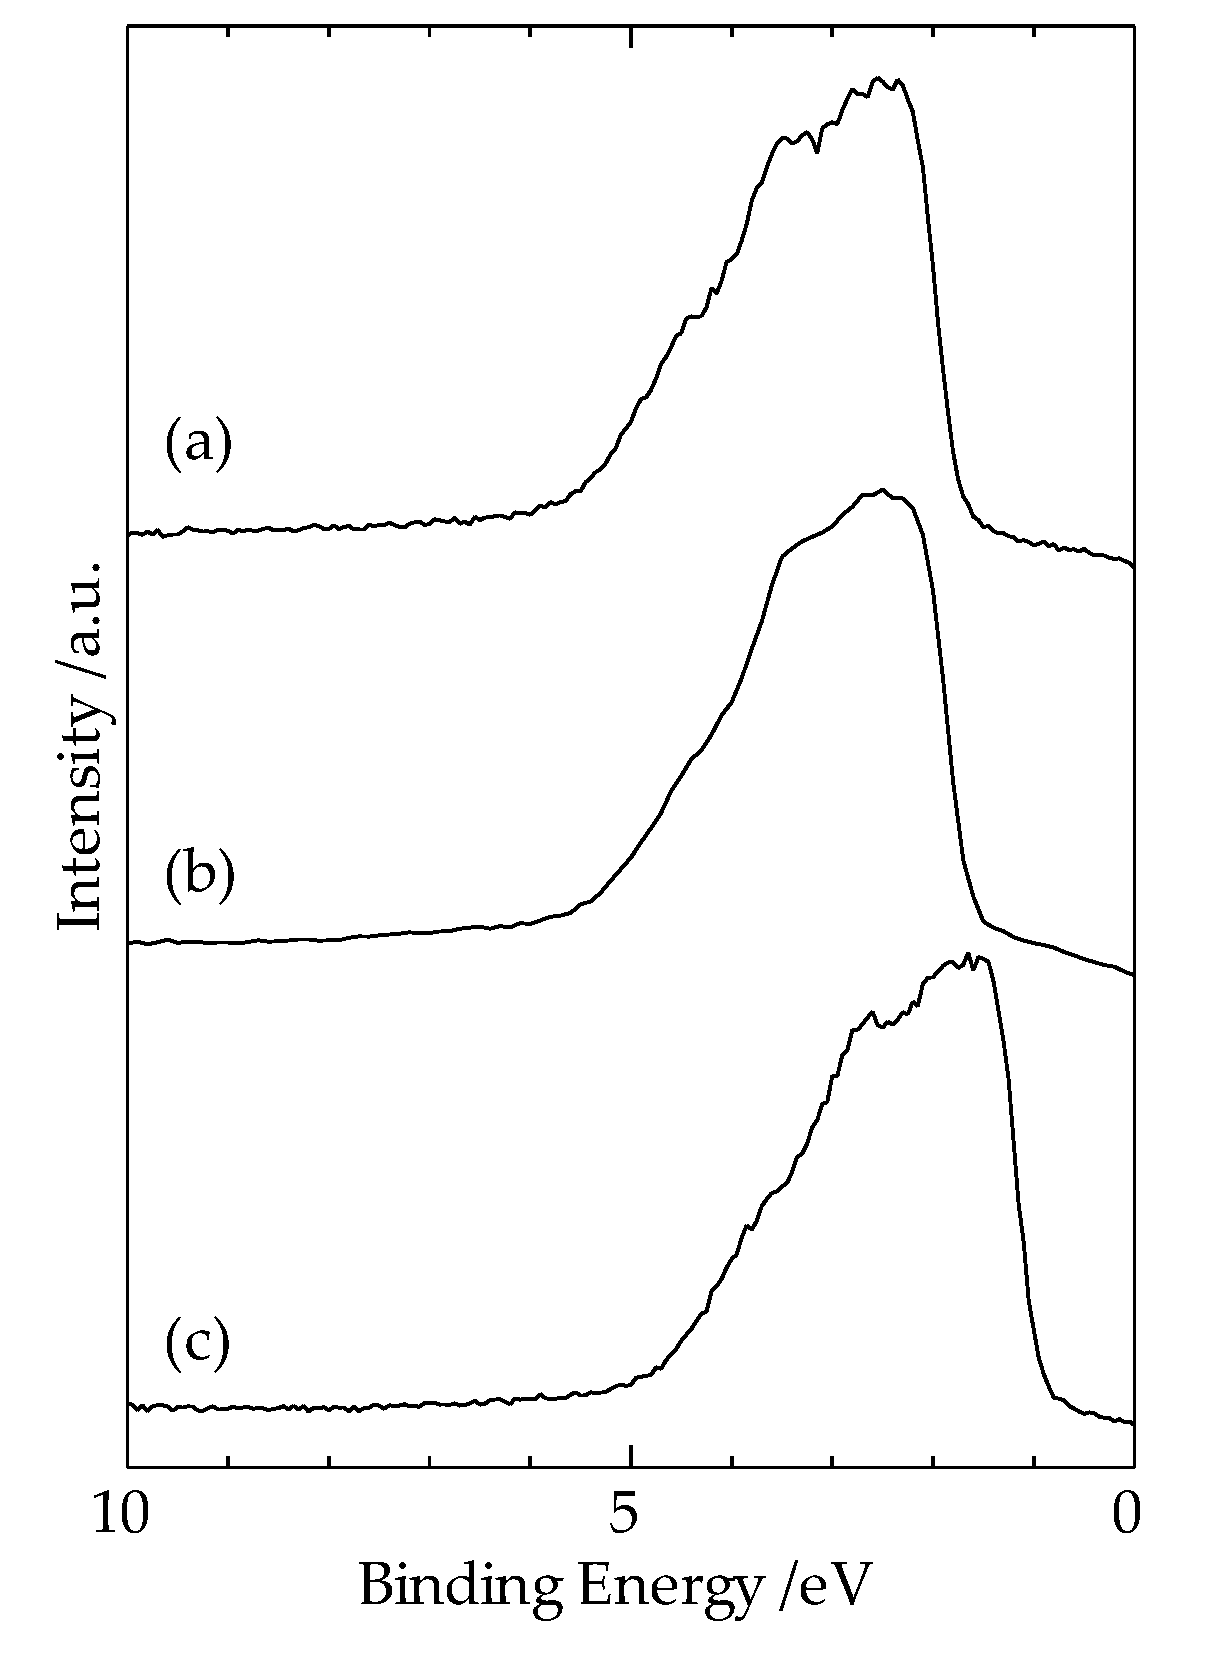
Figure 3.
An SEM image with × 500 magnification of a heterogeneous Cu-Al direct diffusion bonded junction.
Figure 3.
An SEM image with × 500 magnification of a heterogeneous Cu-Al direct diffusion bonded junction.
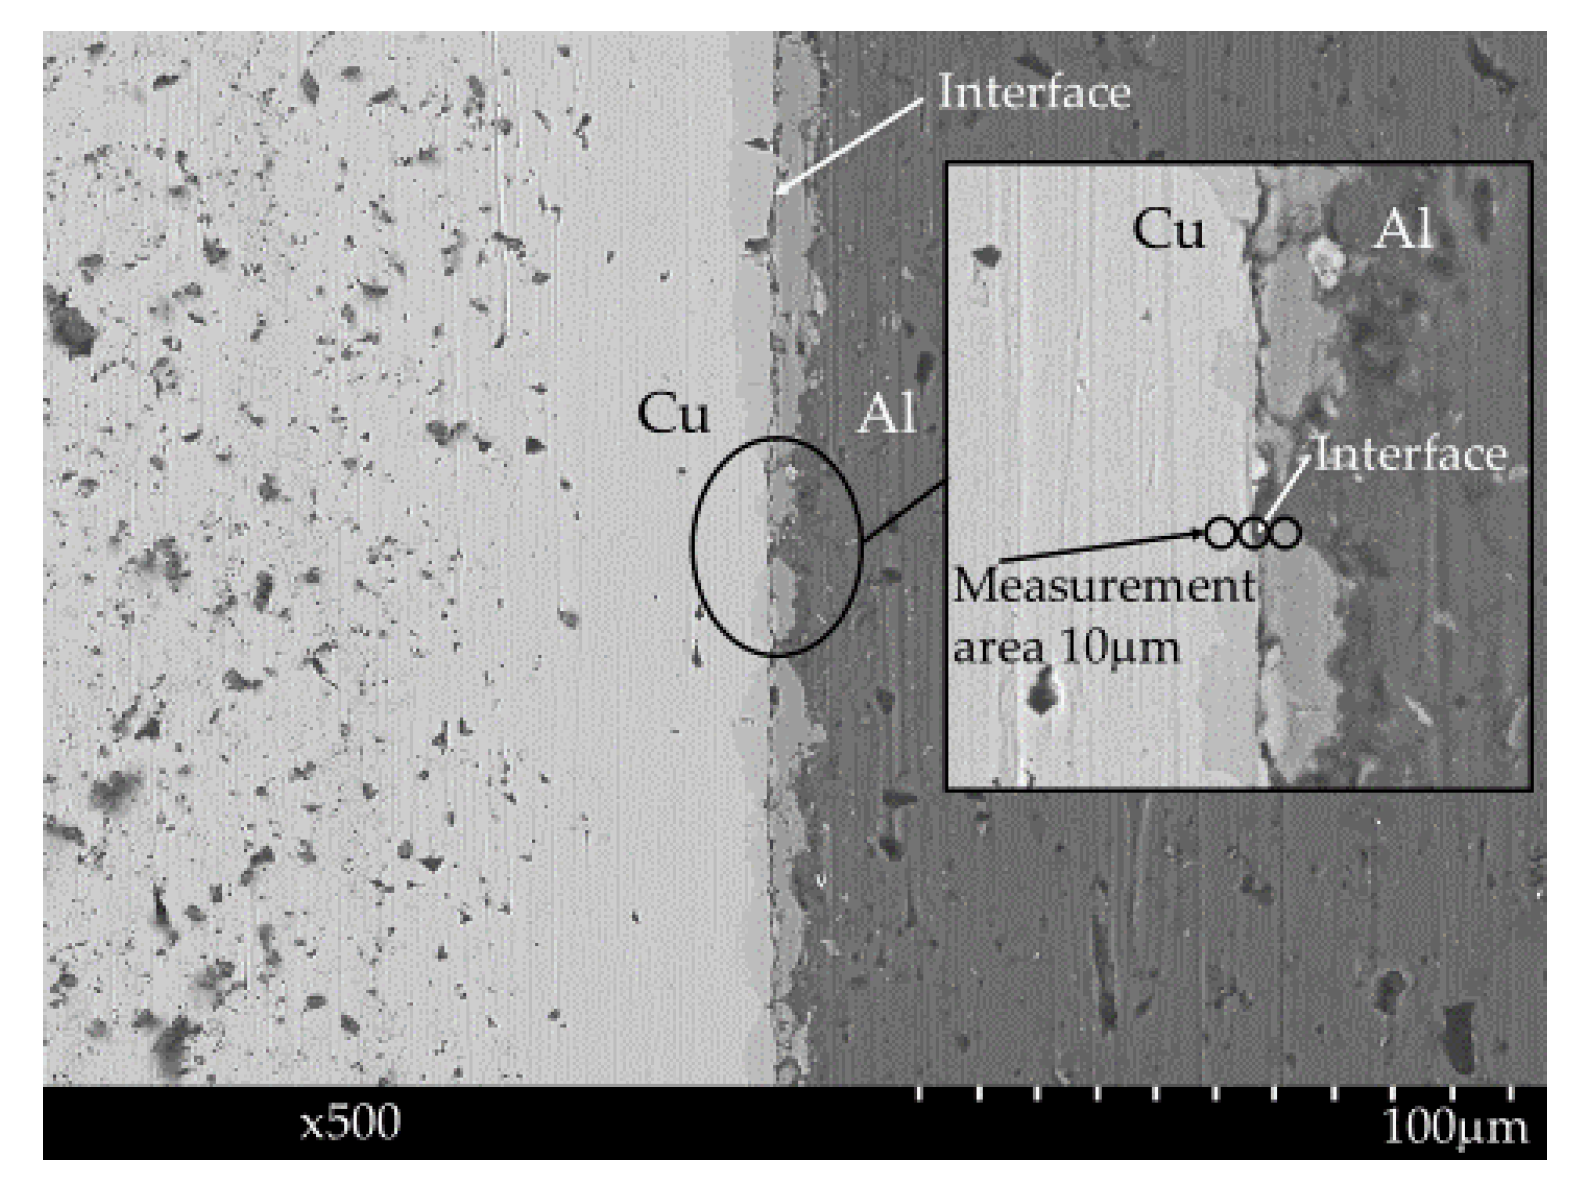
Figure 4.
(a) Valence band spectrum at the interface of the heterogeneous Cu-Al diffusion bonded junction. (b) Valence band spectrum in Al region.
Figure 4.
(a) Valence band spectrum at the interface of the heterogeneous Cu-Al diffusion bonded junction. (b) Valence band spectrum in Al region.
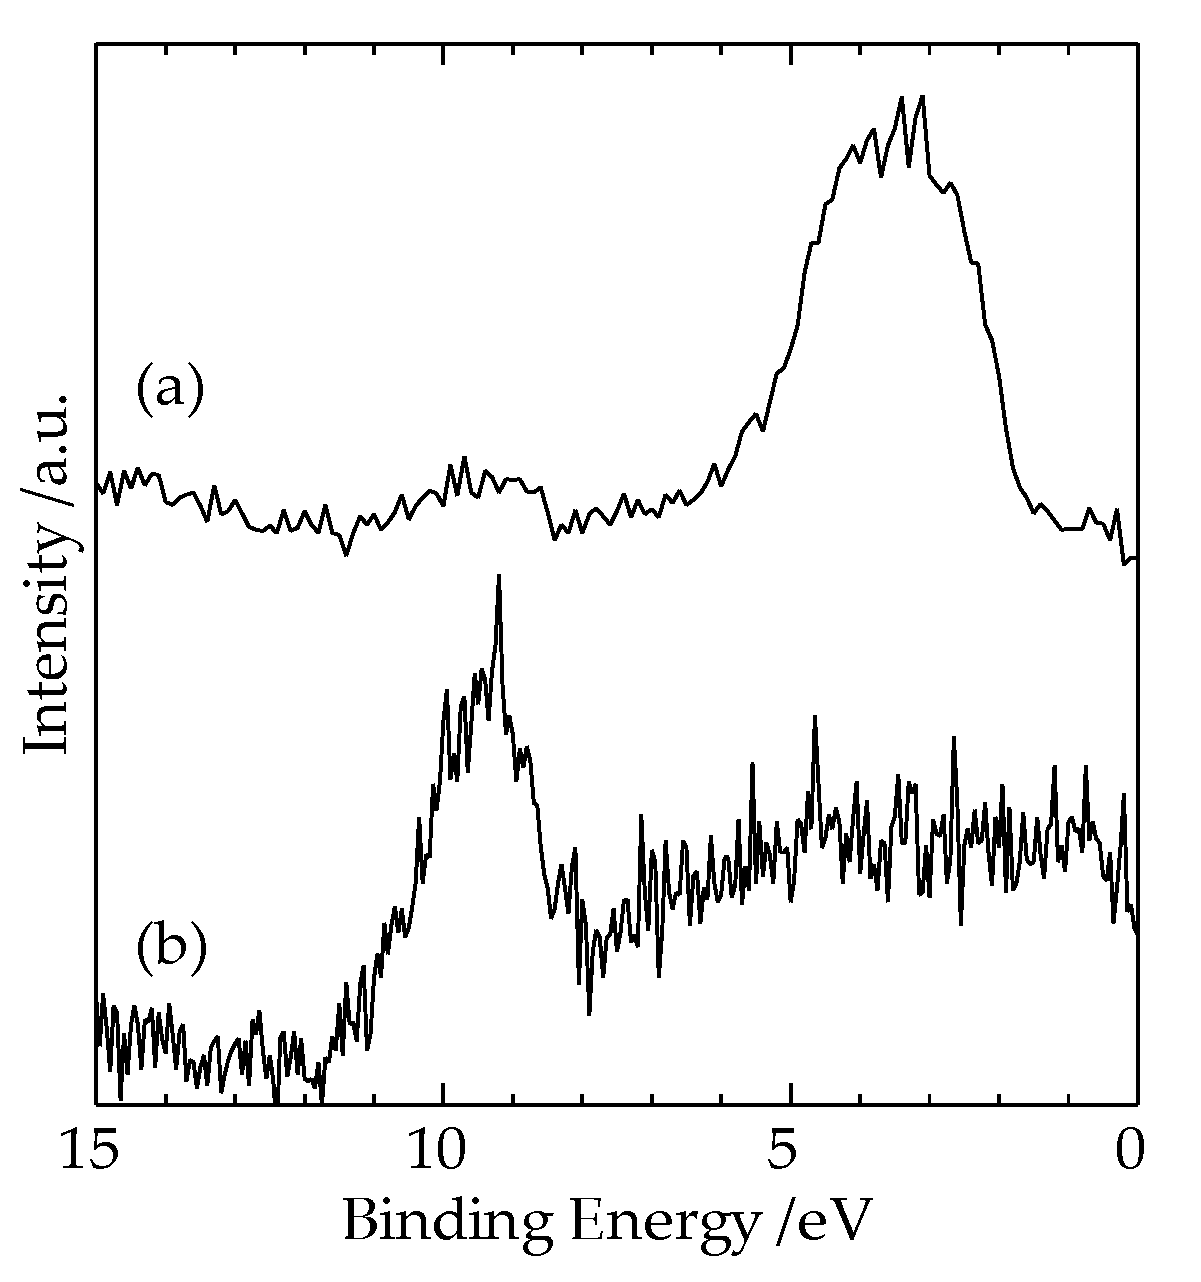
Figure 5.
XPS measurement results in the Cu region 10 μm away from the interface of the heterogeneous Cu-Al direct diffusion bonded junction. (a) Cu3p and Al2p spectra. (b) Al2s and Cu3s spectra.
Figure 5.
XPS measurement results in the Cu region 10 μm away from the interface of the heterogeneous Cu-Al direct diffusion bonded junction. (a) Cu3p and Al2p spectra. (b) Al2s and Cu3s spectra.
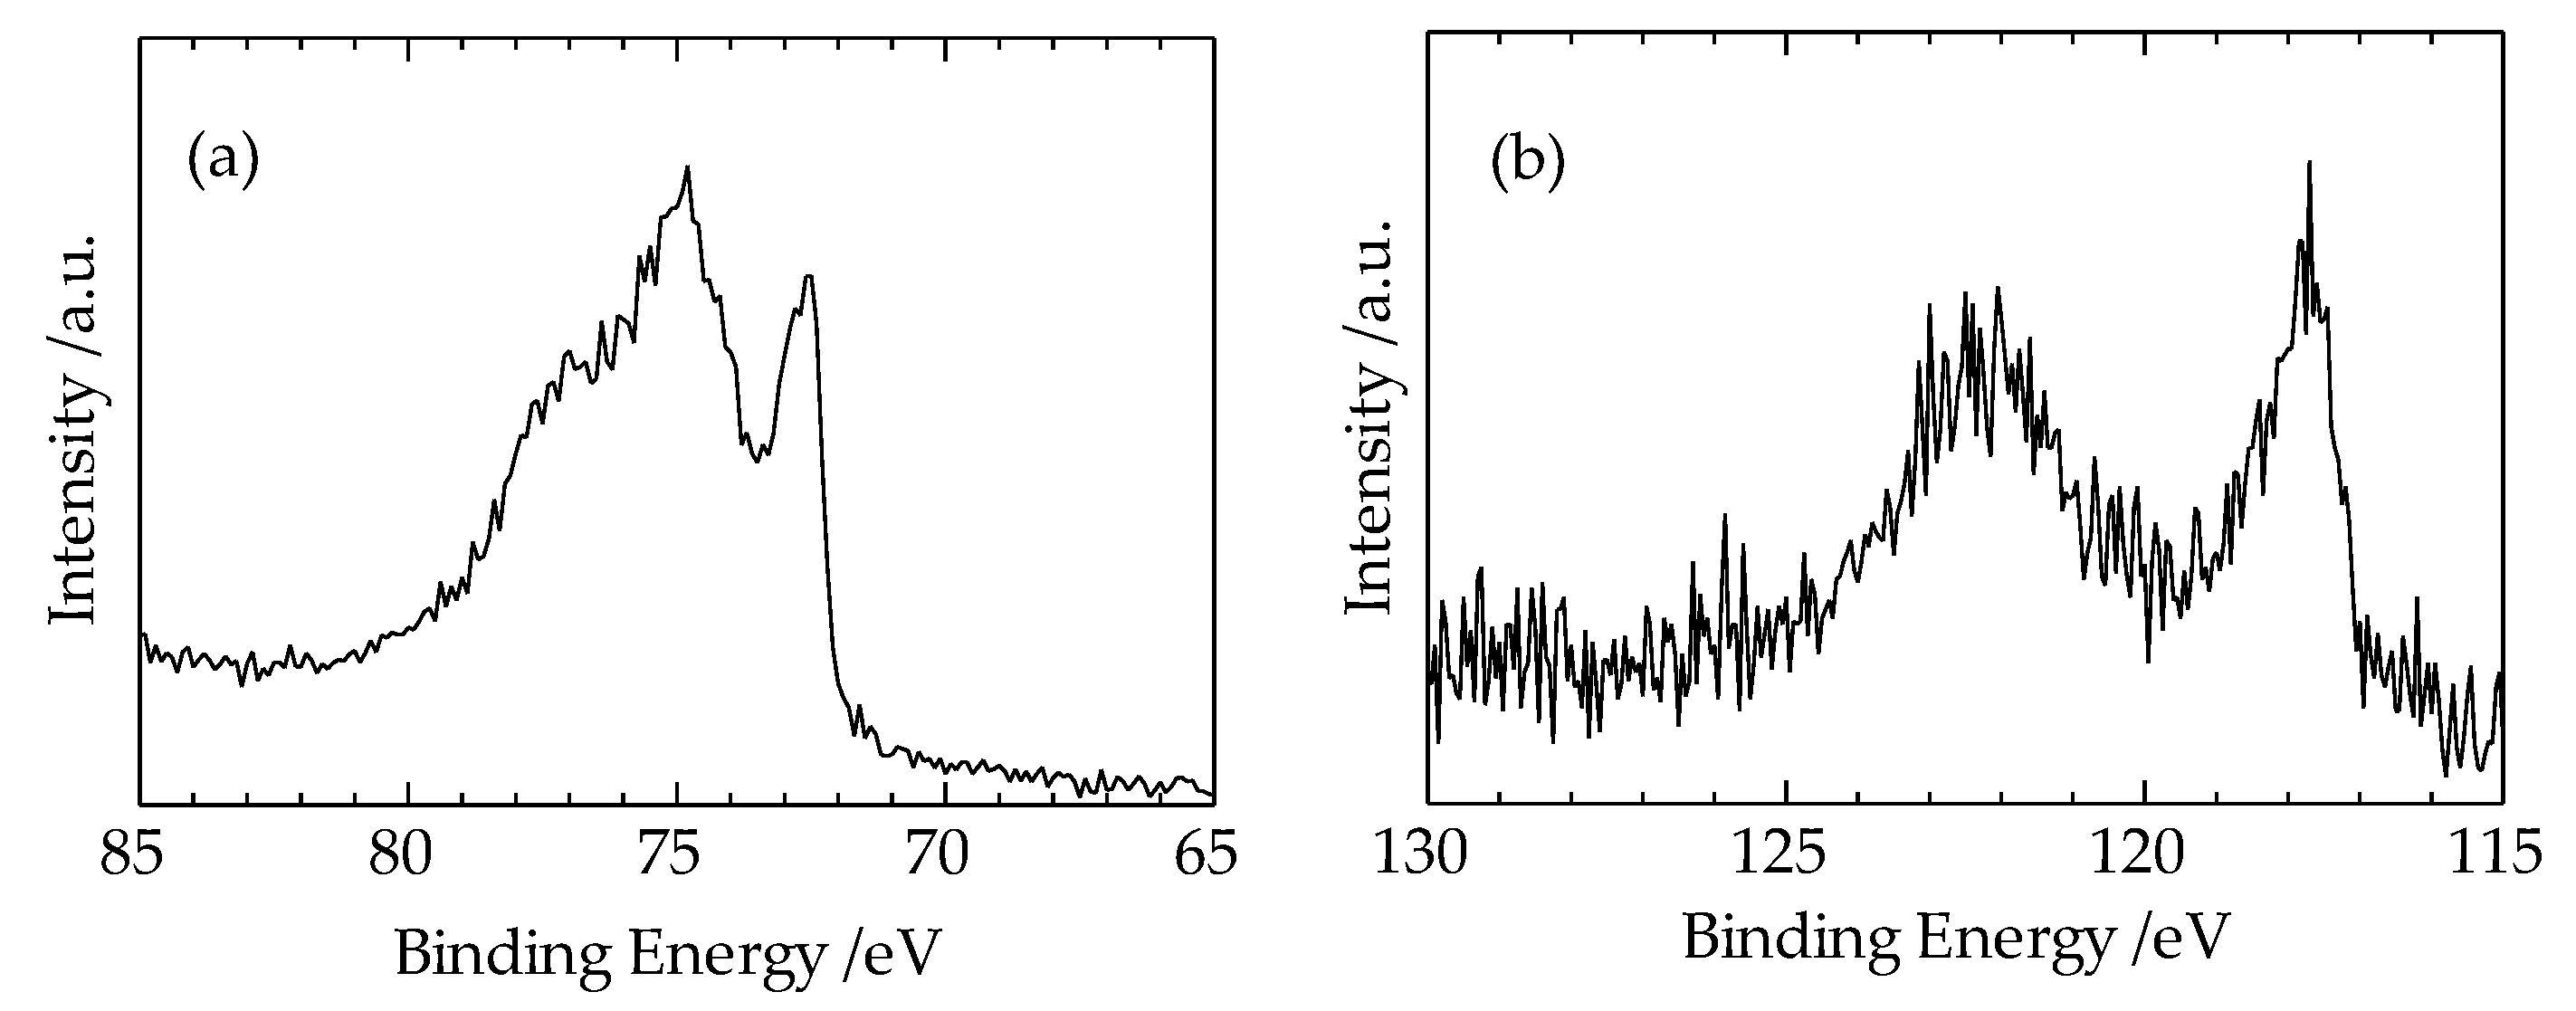
Figure 6.
XPS measurement results in the Al region 10μm away from the interface of the heterogeneous Cu-Al direct diffusion bonded junction. (a) Al2p and Cu3p spectra. (b) Cu2p spectrum.
Figure 6.
XPS measurement results in the Al region 10μm away from the interface of the heterogeneous Cu-Al direct diffusion bonded junction. (a) Al2p and Cu3p spectra. (b) Cu2p spectrum.
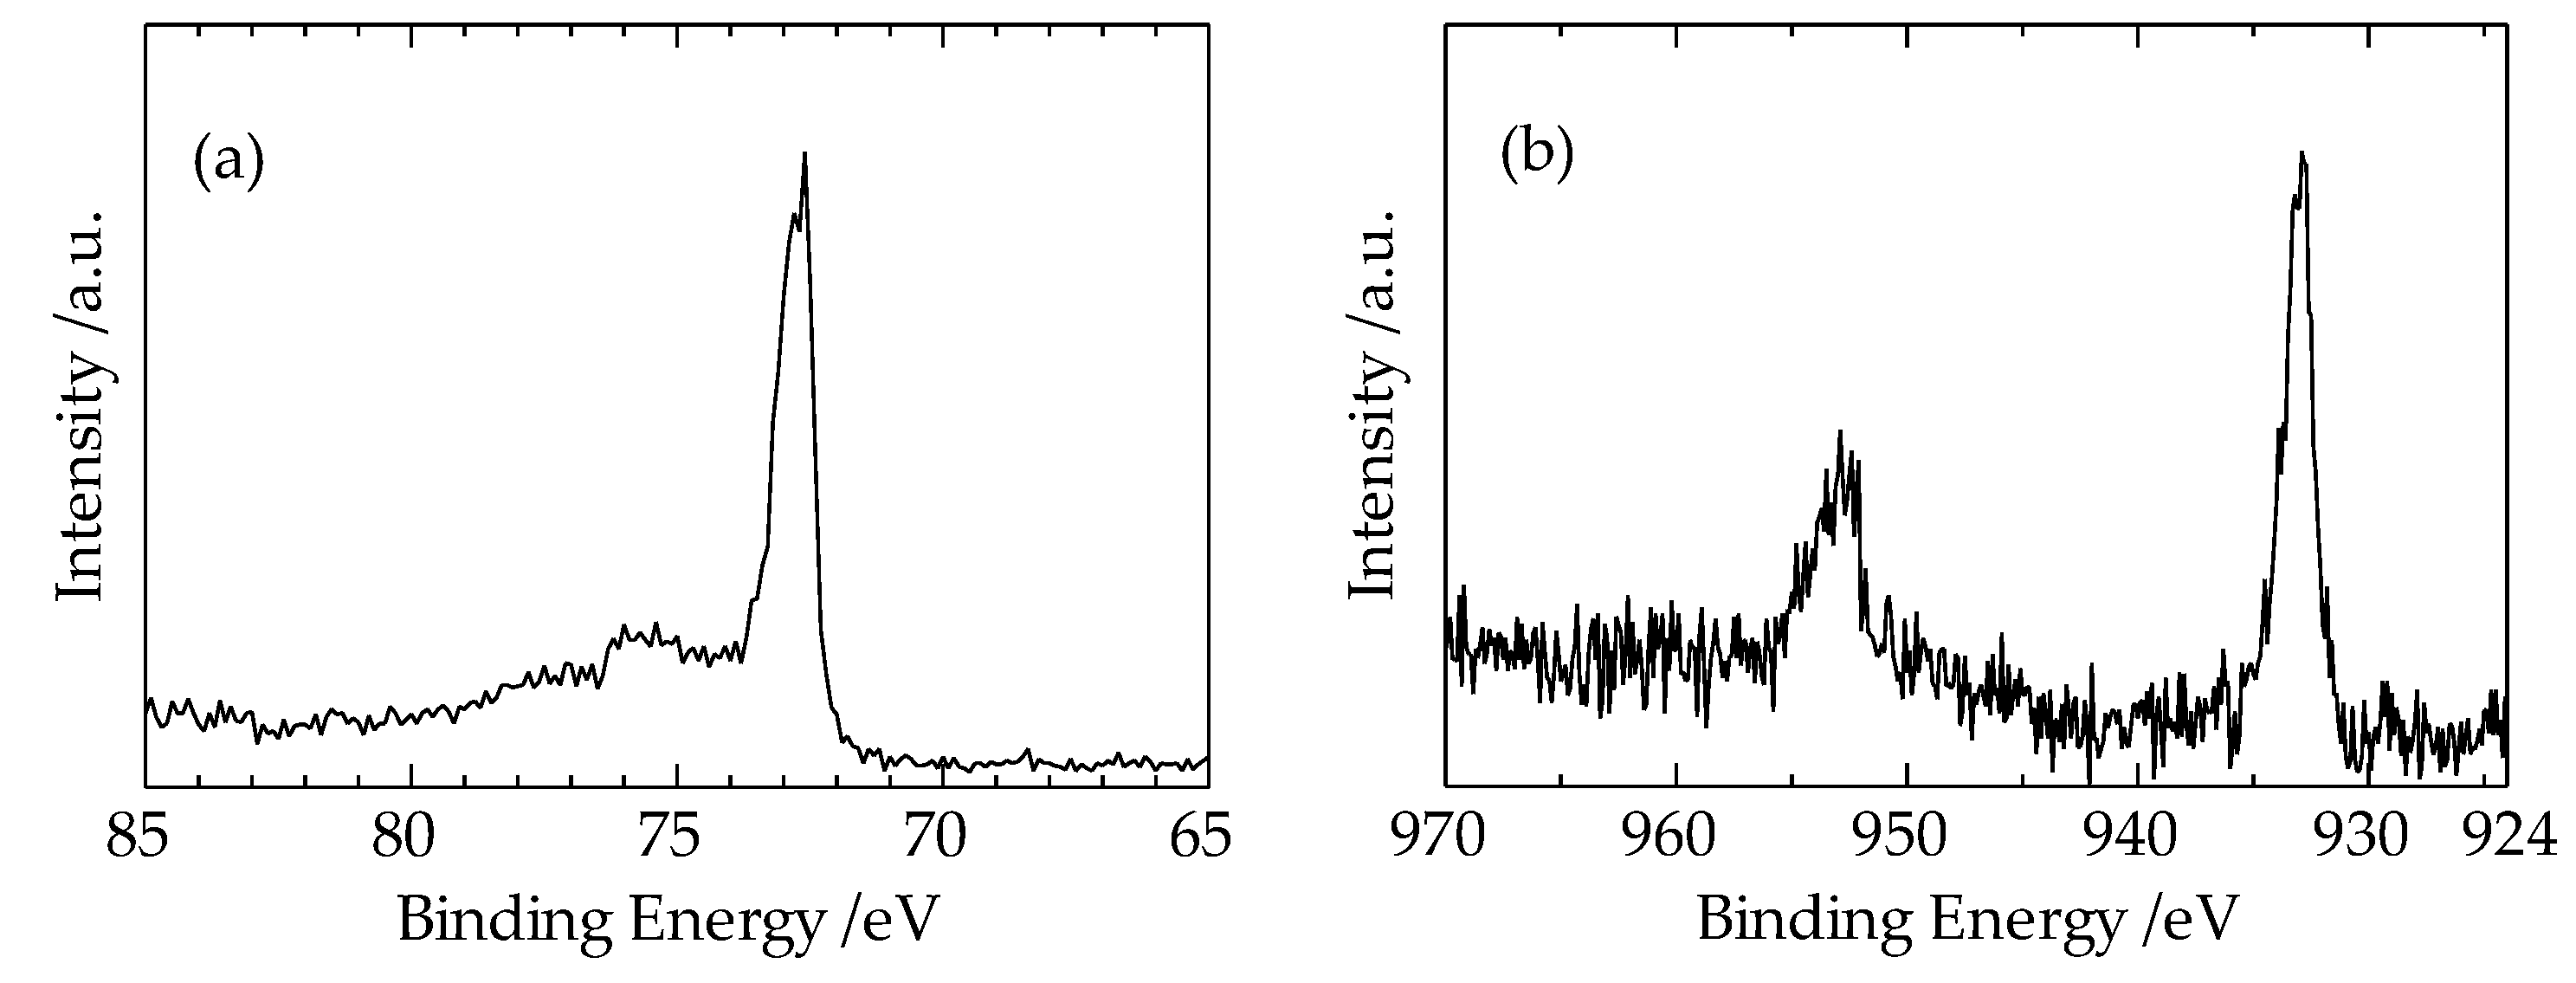

Table 1.
Photoionization cross-sections / ×10 -24 m2 of Cu and Al at 1486.6 eV [5].
Table 1.
Photoionization cross-sections / ×10 -24 m2 of Cu and Al at 1486.6 eV [5].
| Element | Atomic No. | 2s | 2p1/2 | 2p3/2 | 3s | 3p1/2 | 3p3/2 | 3d3/2 | 3d5/2 | 4s |
| Cu | 29 | 7.426 | 11.78 | 22.71 | 1.302 | 1.153 | 2.217 | 0.326 | 0.475 | 0.030 |
| Al | 13 | 1.024 | 0.246 | 0.484 | 0.073 | 0.0015 | 0.003 |
Table 2.
XPS spectra measurement results in Figure 5(a).
Table 2.
XPS spectra measurement results in Figure 5(a).
| Spectrum | Peak height / count/s | Spectral FWHM / eV | Photoionization cross- section /×10 -24 m2 |
| Cu3p 1 | 635.9 | 5.18 | 3.37 |
| Al2p 1 | 377.8 | 0.61 | 0.73 |
1 There are 6 electrons in the p state per atom.
Table 3.
XPS spectra concerned with Figure 6a,b .
Table 3.
XPS spectra concerned with Figure 6a,b .
| Spectrum | Peak height / count/s | Spectral FWHM / eV | Photoionization cross- section /×10 -24 m2 |
| Al2p 1 | 1293.3 | 0.84 | 0.73 |
| Cu2p1/2 2 | 359.8 | 1.15 | 11.78 |
| Cu2p3/2 2 | 882.6 | 1.19 | 22.71 |
1 There are 6 electrons in Al2p state per atom. 2 There are 3 electrons in Cu2p1/2 and Cu2p3/2 per atom, respectively.
Table 4.
Crystal data of Cu and Al.
| Element | Crystal structure | Atomic radius / nm | Lattice constant / nm | Melting point / °C |
| Cu | FCC | 0.128 | 0.361 | 1085 |
| Al | FCC | 0.143 | 0.405 | 660.3 |
Table 5.
Electronic properties of Cu and Al calculated using the free-electron model.
| Element | Valence spectrum | Electron density / m-3 | Fermi energy / eV | Screening constant / m-1 | Binding energy / eV/atom |
| Cu | 4s1 | 8.502 × 1028 | 7.05 | 1.81 × 10¹⁰ | - 0.111 |
| Al | 3s2p1 | 1.806 × 1029 | 11.64 | 2.05 × 10¹⁰ | 0.028 |
Disclaimer/Publisher’s Note: The statements, opinions and data contained in all publications are solely those of the individual author(s) and contributor(s) and not of MDPI and/or the editor(s). MDPI and/or the editor(s) disclaim responsibility for any injury to people or property resulting from any ideas, methods, instructions or products referred to in the content. |
© 2025 by the authors. Licensee MDPI, Basel, Switzerland. This article is an open access article distributed under the terms and conditions of the Creative Commons Attribution (CC BY) license (http://creativecommons.org/licenses/by/4.0/).
Copyright: This open access article is published under a Creative Commons CC BY 4.0 license, which permit the free download, distribution, and reuse, provided that the author and preprint are cited in any reuse.


