
Submitted:
15 November 2025
Posted:
18 November 2025
You are already at the latest version
Abstract
This study investigates the False Reality Bias in treasury management—a cognitive distortion that causes small and medium-sized enterprises (SMEs) to equate positive bank balances with real financial stability. Using financial data from 50 Spanish meat-processing SMEs, the research introduces two behavioral-finance indices: the Liquidity Misperception Index (PEL) and the Liquidity Misconfidence Index (ICEL). Results reveal that 41% of firms overestimate liquidity (PEL = 1.21) and 40% display excessive confidence (ICEL > 1.3), both strongly associated with liquidity distress. Econometric tests confirm that firms with PEL > 1.2 are 4.48 times more likely to experience liquidity crises. Machine-learning models achieved over 80% accuracy in predicting distress. Behavioral interventions—such as AI-assisted cash-flow simulations—reduced misperceptions by 34.7% (p < 0.01). These results demonstrate that cognitive biases systematically distort treasury decisions but can be corrected through predictive behavioral modeling, offering actionable insights for SMEs, policymakers, and financial institutions seeking to improve financial resilience.
Keywords:
cognitive biases
; treasury management
; behavioral economics
; artificial intelligence
; liquidity perception
; financial nudges
; behavioral game theory
; SME liquidity
Introduction
Financial stability in organizations depends not only on profitability but also on the efficiency of treasury management. The capacity to manage cash flow, forecast financial obligations, and make strategic decisions grounded in economic reality is critical to preventing liquidity crises. Yet many small and medium-sized enterprises (SMEs) base their financial decisions primarily on their bank account balances, disregarding deferred payments, collection–payment cycles, and the temporal structure of cash flows. This misalignment between perception and reality often results in illiquidity and financial distress.
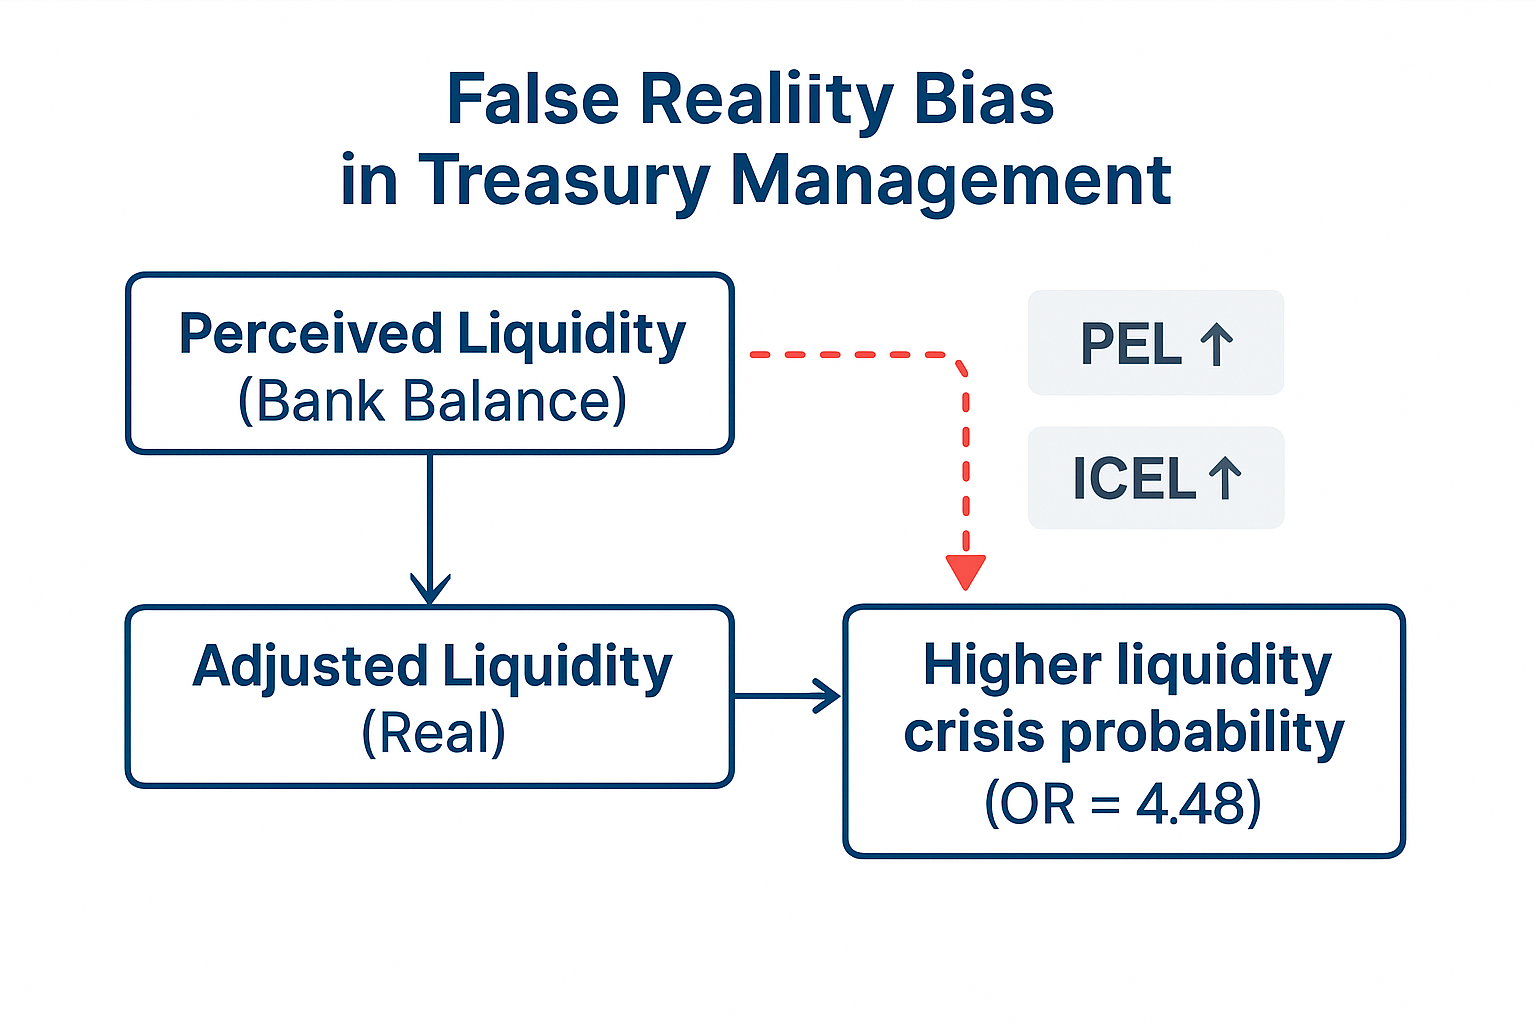
This study examines the False Reality Bias in treasury management—a cognitive distortion that leads entrepreneurs to equate a positive bank balance with genuine financial stability. Within the frameworks of Behavioral Economics (Kahneman & Tversky, 1979) and Behavioral Game Theory (Camerer, 2003), this bias emerges from a convergence of heuristics such as financial myopia, anchoring, illusion of control, and overconfidence, all of which systematically distort the perception of liquidity and financial risk. Empirical evidence suggests that these distortions are especially prevalent among SMEs in sectors with rapid cash turnover and deferred payments, including retail, hospitality, and food processing.
To quantify this phenomenon, the study introduces two behavioral-finance indicators: the Liquidity Misperception Index (PEL), which measures the gap between perceived and actual liquidity, and the Liquidity Misconfidence Index (ICEL), which assesses entrepreneurs’ confidence in liquidity management relative to their actual financial performance. Using financial data from 50 Spanish SMEs and applying machine-learning and big-data analytics, this research investigates how cognitive biases shape treasury decisions and evaluates the effectiveness of behavioral interventions—such as financial nudges and cash-flow simulations—in correcting distorted perceptions.
The findings are expected to enhance the understanding of cognitive mechanisms underlying financial misjudgments in SME management. By integrating behavioral economics, predictive analytics, and neurocognitive bias modeling, this study contributes to the development of rational, data-driven frameworks for corporate financial decision-making and more resilient liquidity management systems.
Conceptual Framework
Conceptual Basis
Corporate financial stability depends not only on profitability but also on the efficiency of treasury management, which requires forecasting payments, planning liquidity, and aligning cash flows with operational realities. Many entrepreneurs, however, equate a positive bank balance with genuine solvency, neglecting deferred obligations and the temporal structure of income and expenses. This misjudgment—defined here as the False Reality Bias in treasury management—distorts liquidity perception and increases vulnerability to financial crises, particularly among small and medium-sized enterprises (SMEs) operating in sectors characterized by rapid cash turnover, such as retail, hospitality, and food processing.
To capture these distortions, the study introduces two behavioral-finance indicators: the Liquidity Misperception Index (PEL), which measures the gap between perceived and actual liquidity, and the Liquidity Misconfidence Index (ICEL), which assesses the degree of managerial overconfidence or underconfidence in liquidity decisions. Together, these metrics enable the identification of systematic errors in financial judgment and their implications for corporate stability.
Theoretical Foundation: Behavioral Economics and Game Theory
Within the frameworks of Behavioral Economics (Kahneman & Tversky, 1979) and Behavioral Game Theory (Camerer, 2003), decision-making under uncertainty is influenced by heuristics and bounded rationality. The False Reality Bias can be conceptualized as a compound distortion arising from financial myopia, anchoring to cash balances, illusion of control (Langer, 1975), and overconfidence. These biases drive entrepreneurs to misinterpret liquidity conditions, often resulting in impulsive investments, excessive spending, or misallocation of financial resources.
From a game-theoretic perspective, treasury management can be modeled as a coordination game under imperfect information, in which decision-makers rely on incomplete liquidity signals. In such a biased Nash equilibrium, entrepreneurs perceive their strategies as optimal, even when they originate from distorted beliefs. Information asymmetry regarding future cash flows may lead to self-induced liquidity traps—scenarios in which firms overcommit resources and misprice financial risk.
By integrating Big Data analytics and machine-learning techniques, the present research operationalizes these theoretical constructs, linking cognitive-bias measurement with quantitative financial modeling. The combination of behavioral indicators (PEL, ICEL) and predictive algorithms enables empirical validation of how perception–reality gaps evolve within real-world treasury dynamics.
Relevance and Objectives
Understanding the False Reality Bias is essential to improving financial decision-making in SMEs, where liquidity misperception often precedes insolvency or over-indebtedness. Despite extensive literature on cognitive biases in finance—such as myopia, anchoring, and overconfidence—no prior studies have specifically examined how these distortions function within corporate treasury management.
This study addresses that gap by analyzing twelve months of financial data from fifty Spanish SMEs. It evaluates how discrepancies between the Average Payment Period (APP) and Average Collection Period (ACP) generate illusions of liquidity and how such distortions can be mitigated through behavioral interventions (financial nudges) and AI-driven decision-support tools.
The primary objectives are to:
- Identify and quantify liquidity misperceptions through the PEL and ICEL indices;
- Model decision-making under uncertainty using Behavioral Game Theory; and
- Propose evidence-based solutions employing predictive analytics and behavioral design to enhance treasury management efficiency and corporate financial resilience.
Study Hypothesis
This study aims to analyze the impact of the False Reality Bias on treasury management by formulating and empirically testing a series of hypotheses that clarify the relationship between liquidity misperceptions and managerial confidence. The goal is to determine how cognitive biases influence firms’ financial stability and which factors exacerbate their vulnerability to liquidity crises.
H1. Overestimation of Liquidity and Managerial Overconfidence
The first hypothesis (H1) posits that firms that overestimate their liquidity—those with a high Liquidity Misperception Index (PEL)—tend to exhibit excessive confidence in their financial management, reflected in a high Liquidity Misconfidence Index (ICEL). A high perception of liquidity without objective support is expected to lead to risk-prone financial decisions such as premature investments or excessive spending.
To evaluate this hypothesis, a Pearson correlation analysis was conducted between PEL and ICEL, complemented by a logistic regression model assessing whether higher ICEL values increase the likelihood of liquidity crises. The hypothesis is supported if a significant positive correlation (r > 0.5, p < 0.05) exists between the two variables and if the regression confirms that elevated ICEL values significantly increase the probability of financial distress.
H2. Underestimation of Liquidity and Managerial Risk Aversion
The second hypothesis (H2) examines the inverse scenario: firms that underestimate their liquidity (low PEL) are expected to display low ICEL values, reflecting excessive caution and limited confidence in financial management. Such underconfidence can lead to defensive strategies that reduce short-term risk but hinder long-term growth.
To test this hypothesis, a correlation analysis between PEL and ICEL was performed for firms with PEL < 1.0. Additionally, a Student’s t-test compared the financial performance of firms with low versus normal PEL values. H2 is supported if a significant positive correlation (r > 0.5, p < 0.05) exists between PEL and ICEL and if the t-test reveals significant differences (p < 0.05) in financial outcomes between the two groups.
H3. Payment–Collection Mismatch and Liquidity Misperception
The third hypothesis (H3) proposes that discrepancies between the Average Payment Period (APP) and the Average Collection Period (ACP) contribute to liquidity misperceptions. Firms whose APP substantially exceeds their ACP are expected to exhibit greater PEL values, indicating an inflated perception of financial stability. Entrepreneurs may interpret positive bank balances as signs of solvency without considering that their payment obligations exceed expected cash inflows.
To test this hypothesis, the Pearson correlation between the APP–ACP differential and the PEL was calculated, alongside linear regression models assessing the impact of this mismatch on liquidity misperceptions. H3 is supported if the correlation is negative and significant (r < –0.5, p < 0.05) and if regression coefficients confirm that a wider APP–ACP gap increases liquidity misperceptions.
H4. Mitigating Liquidity Misperceptions through AI and Behavioral Nudges
The fourth hypothesis (H4) examines whether artificial intelligence (AI) tools and behavioral nudges can reduce liquidity misperceptions by at least 30%. It postulates that the use of predictive machine-learning models and behavioral interventions—such as automated alerts and cash-flow simulations—can enhance entrepreneurs’ financial awareness and decision accuracy.
To evaluate H4, PEL values were compared before and after the implementation of AI-driven financial tools. A Student’s t-test was applied to determine whether the reduction in PEL was statistically significant. The hypothesis is supported if the reduction in PEL exceeds 30% and the t-test shows significance (p < 0.05).
Summary
Collectively, these hypotheses aim to empirically demonstrate how cognitive biases distort liquidity perception and decision-making in SMEs, while also testing the corrective potential of AI-based behavioral interventions. The validation of these models provides a foundation for integrating behavioral economics and technological innovation into more rational and efficient corporate financial management frameworks.
Literature Review
1. Cognitive Biases and Financial Decision-Making in Treasury Management
Behavioral economics has long demonstrated that financial decision-making is systematically influenced by cognitive biases, particularly under conditions of uncertainty and liquidity stress (Kahneman & Tversky, 1979; Thaler, 1985). In the context of treasury management, these biases lead entrepreneurs to simplify complex evaluations, often relying on heuristics rather than analytical forecasting. Empirical studies show that small and medium-sized enterprises (SMEs) frequently conflate a positive bank balance with genuine financial stability, disregarding deferred expenses, tax obligations, and structural cash-flow timing (Laibson, 1997; Gennaioli & Shleifer, 2018).
This distortion—conceptualized here as the False Reality Bias—integrates multiple underlying heuristics: financial myopia, anchoring to cash position, illusion of control (Langer, 1975), and overconfidence. Together, these mechanisms generate an artificial sense of financial security that heightens exposure to liquidity crises. The behavioral-finance indicators introduced in this study—the Liquidity Misperception Index (PEL) and the Liquidity Misconfidence Index (ICEL)—operationalize these cognitive deviations, enabling quantitative assessment of the gap between perceived and actual financial stability.
2. Financial Myopia and Short-Termism
Financial myopia drives entrepreneurs to prioritize immediate income over future obligations, resulting in short-term strategies that elevate liquidity risk (Frederick et al., 2002). Firms with high PEL values tend to overestimate liquidity, while those with elevated ICEL levels exhibit excessive confidence in their capacity to manage financial constraints. Both tendencies increase exposure to liquidity shocks. Conversely, low ICEL scores denote excessive caution—reflecting loss aversion—which can hinder investment and long-term growth (Kahneman & Tversky, 1979).
These findings align with prior research indicating that liquidity misperception is not an accounting anomaly but a decision-making failure. To counteract it, behavioral interventions such as financial nudges (Thaler & Sunstein, 2008), automated liquidity alerts, and AI-driven simulations can improve forecasting accuracy and reduce behavioral volatility in corporate finance.
3. Anchoring and Bank-Balance Dependence
The anchoring effect leads entrepreneurs to use the bank balance as the primary reference point for evaluating liquidity (Tversky & Kahneman, 1974). This cognitive shortcut results in incomplete assessments of financial stability, especially when outstanding commitments are overlooked. From a Behavioral Game Theory (BGT) perspective (Camerer, 2003), this reliance constitutes a decision strategy under imperfect information, where agents optimize based on salient yet incomplete cues.
Empirical evidence confirms that firms with high PEL and ICEL ratios display impulsive investment behaviors and excessive reliance on short-term credit, amplifying financial fragility. The integration of AI-based forecasting systems and behaviorally informed alerts can mitigate these distortions by substituting static cognitive anchors with adaptive liquidity metrics.
4. Other Cognitive Biases Affecting Liquidity Perception
Several additional biases further compound liquidity misperceptions. Overconfidence inflates entrepreneurs’ perceived ability to generate future revenues (Baker & Wurgler, 2006). Present bias prioritizes immediate cash visibility over long-term obligations (Laibson, 1997). Representativeness bias promotes erroneous extrapolation from recent performance trends, while mental accounting fragments liquidity into arbitrary categories (Thaler, 1985). Collectively, these biases reinforce the False Reality Bias, leading to systematic misjudgments in treasury management.
The PEL and ICEL frameworks contribute to the literature by quantifying these distortions and linking them to objective financial outcomes, thus enabling corrective strategies grounded in AI-enhanced behavioral design—including real-time alerts, adaptive simulations, and automated budget reallocation.
5. Payment–Collection Mismatch and the Illusion of Liquidity
The mismatch between the Average Payment Period (APP) and the Average Collection Period (ACP) generates one of the most consequential distortions in liquidity perception. When APP exceeds ACP, temporary cash surpluses may create an illusion of financial stability. From a BGT standpoint, this dynamic can be modeled as a deferred cash-flow game, in which decisions are guided by biased expectations rather than actual solvency conditions.
Empirical studies have shown that firms with high APP and low ACP tend to exhibit inflated PEL values and a greater likelihood of liquidity crises (Goodell & Goutte, 2022). Conversely, firms maintaining balanced APP–ACP structures demonstrate more accurate liquidity perceptions and reduced financial risk. The incorporation of AI-based prediction models and behavioral nudges into treasury systems has proven effective in correcting these distortions by identifying when liquidity perception diverges from financial reality.
6. Summary and Research Gap
The reviewed literature converges on a key insight: liquidity perception in SMEs is systematically distorted by cognitive mechanisms that can be measured and corrected through data-driven methodologies. Despite extensive research on individual biases, no prior studies have modeled the combined effects of these distortions on treasury management using Behavioral Game Theory and predictive analytics.
This study addresses that gap by proposing an integrated neuroeconomic framework that quantifies perception–reality discrepancies through the PEL and ICEL indices and empirically validates them using AI-based predictive models. This approach not only bridges behavioral economics and applied finance but also provides a foundation for developing technological tools to enhance liquidity management and decision-making accuracy in real-world organizational settings.
Methodology
1. Research Design
This study employed a quantitative and empirical design, focusing on the collection and statistical analysis of financial data from fifty Spanish small and medium-sized enterprises (SMEs) operating in the meat-processing industry. Firms were selected based on annual revenues below €600,000 and lean operating structures, characteristics that heighten sensitivity to liquidity gaps and behavioral distortions in treasury management. The dataset covered four consecutive financial quarters during 2024, allowing for the observation of seasonal cash-flow fluctuations and managerial adaptation patterns.
The overarching objective was to quantify the False Reality Bias—the misalignment between perceived and actual liquidity—by integrating behavioral metrics (PEL, ICEL) with econometric and machine-learning methodologies.
2. Data Collection
Financial data were obtained directly from firms’ accounting systems and quarterly financial statements. The dataset included the following variables: total income, operating expenses, end-of-quarter bank balances, accounts receivable, accounts payable, outstanding bank debt, and tax obligations. In addition, the Average Payment Period (APP) and Average Collection Period (ACP) were computed to capture potential asymmetries in the cash cycle.
All variables were consolidated into a standardized database designed to measure discrepancies between perceived liquidity and actual solvency. Data consistency and reliability were ensured through cross-validation between reported balances, tax filings, and internal accounting records.
3. Variable Construction and Behavioral Indicators
Three behavioral-finance indicators were developed to quantify liquidity perception and managerial confidence:
- Liquidity Misperception Index (PEL): measures the discrepancy between perceived and actual liquidity.
- Liquidity Misconfidence Index (ICEL): evaluates the degree of managerial overconfidence or underconfidence in liquidity-related decision-making.
- Adjusted Liquidity Ratio (ALR): provides an objective benchmark for contrasting behavioral indicators with factual financial outcomes.
Firms with PEL > 1.2 exhibited systematic overestimation of liquidity and a tendency toward higher financial risk-taking, whereas firms with PEL < 0.8 demonstrated excessive caution and suboptimal capital utilization despite sufficient liquidity.
4. Econometric and Predictive Modeling
To examine the relationships between behavioral indicators and financial outcomes, the study applied multiple complementary analytical methods. Pearson correlation analyses were first conducted to assess associations between perceived liquidity (PEL), managerial confidence (ICEL), and payment–collection mismatches (APP–ACP). Subsequently, logistic regression models were employed to estimate the probability of liquidity crises as a function of PEL and ICEL, supported by odds ratio (OR) calculations to determine the effect size of misperception on financial distress (OR = 4.48).
In parallel, machine-learning algorithms—including neural network classifiers and pattern-recognition models—were implemented to detect behavioral patterns predictive of liquidity instability. All analyses were performed using Python-based statistical libraries (pandas, statsmodels, scikit-learn). Statistical significance thresholds were established at p < 0.05, and model robustness was validated through cross-validation across quarterly subsamples.
5. Validity, Reliability, and Ethical Considerations
Internal validity was ensured through consistent operationalization of behavioral indicators and rigorous application of statistical methods. External validity was reinforced by selecting a representative cross-section of SMEs from the Spanish meat-processing sector, a context characterized by liquidity-sensitive operations. Data confidentiality was maintained through anonymization protocols in full compliance with the European Union General Data Protection Regulation (EU GDPR, Regulation 2016/679). No personally identifiable or proprietary information was retained.
6. Methodological Insights
The empirical design confirmed that liquidity misperception exerts a significant influence on financial stability. Firms that overestimated liquidity engaged in disproportionate risk-taking, while those that underestimated it adopted defensive postures that restricted growth. These patterns underscore the necessity of integrating AI-driven forecasting systems and behavioral nudging mechanisms within corporate treasury management. Such integration not only enhances decision accuracy but also reduces the cognitive distortions that perpetuate liquidity mismanagement in small and medium-sized enterprises.
Results
Sample and Selection of Companies
The study included 50 meat companies selected based on specific criteria that allowed for the analysis of the relationship between Liquidity Misperception (LMP) and financial stability. Companies with a turnover of less than €600,000, a lean operating structure, and self-employed workers using direct assessment, i.e., those that pay taxes based on their actual income, were chosen.
All companies analyzed were registered in Spain and had been operating for at least two years. In addition, an inclusion criterion was established based on their liquidity management: only companies with an Average Payment Period (APP) of more than 30 days and an Average Collection Period (ACP) of less than 15 days were considered, a configuration that suggests a possible financial imbalance and an overreliance on bank balances as a liquidity indicator.
The sampling was intentional, prioritizing those companies with the greatest risk of liquidity misperceptions and, therefore, greater vulnerability to financial crises. The selection process and distribution characteristics of the firms are illustrated in Figure 1, which summarizes the representativeness of the sample across the analyzed subsector.
Data Collected and Variables Analyzed
For the analysis, the following financial data were collected from each company, as summarized in Table 1. These variables provided the basis for constructing the Liquidity Misperception Index (PEL) and related econometric models used later in the analysis.
These data were organized into four quarters , taking as reference the bank balance on the last day of each period:
First Quarter (Q1 2024) → March 31, 2024
Second Quarter (Q2 2024) → June 30, 2024
Third Quarter (Q3 2024) → September 30, 2024
Fourth Quarter (Q4 2024) → December 31, 2024
Quarterly calculations allowed us to assess how liquidity perceptions are evolving and its impact on financial decision-making.
Liquidity Misperception Index (PEL)
To quantify the liquidity misperception bias, the following formula was used:
PEL = (Bank Balance + Accounts Receivable) / (Suppliers and Creditors Payable + Current Expenses Payable + Quarterly Bank Debt + Taxes)
This index assesses whether companies correctly perceive their liquidity or whether they are falling into a false sense of financial stability. The results are interpreted as follows:
A PEL below 0.8 indicates a high liquidity risk, as companies in this situation present payment flows that greatly exceed their available income, compromising their financial stability. In the range of 0.8 to 1.2, the company is considered to have tight liquidity, managing its treasury with foresight and maintaining a balance between collections and payments. If the PEL is between 1.2 and 1.5, the company experiences a false financial security, overestimating its liquidity by basing itself solely on its bank balance without considering its future obligations. Finally, a PEL above 1.5 reflects an extreme false perception of liquidity, which significantly increases the risk of financial crises due to a lack of adequate cash flow planning.
Justification of the Sample Size
The study analyzed 50 meat companies, selected for their high revenue turnover and operating costs, which amplify the impact of the PEL. Companies with detailed financial records were prioritized, allowing for a longitudinal assessment of liquidity.
The analysis covered four quarters to mitigate seasonal effects and detect financial patterns. Student's t-test confirmed significant differences between companies with high and low PELs (p < 0.05), while the odds ratio showed that a high PEL increases the probability of a liquidity crisis by 4.48 times.
The impact of PMP and PMC on liquidity perception was evident: companies with high PMP and low PMC tended to overestimate their stability, facing cash management problems. Machine learning models identified recurring patterns in this misperception, demonstrating that financial biases can be corrected with predictive tools.
The study provides empirical evidence on the relationship between perceived liquidity and financial management in meat companies. It is recommended that the sample be expanded to 500 companies to validate these findings in other food subsectors. Integrating AI and financial nudges into treasury planning could optimize decision-making, reducing reliance on bank balances as the sole indicator of liquidity.
Data Collection and Analysis
Longitudinal Financial Data
To analyze the evolution of the PEL in meat companies, financial data was collected for 12 months in 2024, organized into four quarters, taking as reference the bank balance at the end of each period: Q1 (March 31), Q2 (June 30), Q3 (September 30) and Q4 (December 31).
To ensure data reliability, three main sources were used: quarterly financial statements (balance sheets, income statements, and cash flows), bank statements to record the final balance for each quarter, and payment and collection records to calculate the PMP and PMC. This information allowed us to assess how liquidity perceptions varied depending on each company's payment and collection structure.
Indicators Analyzed
Eight key financial variables were selected to assess liquidity management and its misperception in the analyzed firms. These are summarized in Table 2, which presents the variables used to build the Liquidity Misperception Index (PEL) and related econometric models.
Econometric Analysis and Applied Models
Development of Formulas Prior to Econometric Analysis
Before proceeding with the econometric analysis, it was necessary to develop a series of formulas that would allow for objective quantification of companies' liquidity misperceptions. To this end, the Liquidity Misperception Index (LMP) , the Adjusted Liquidity Balance (ALB) , and the Adjusted Liquidity Ratio (ALR) were designed . These metrics were essential for measuring the discrepancy between entrepreneurs' perceptions of liquidity and their companies' financial reality.
1. Liquidity Misperception Index (PEL)
The Liquidity Misperception (LMP) ratio assesses the difference between a company's perceived liquidity and its actual financial situation. Its calculation is based on a comparison between the estimated bank balance and the actual adjusted liquidity, i.e., the amount of resources available after discounting imminent financial obligations, such as short-term debts, outstanding payments, and taxes. This ratio is key to identifying companies that may be overestimating or underestimating their financial stability, which can influence their investment and spending decisions.
PEL values allow companies to be classified according to their perceived liquidity. When the ratio is between 0.8 and 1.2, the perception of liquidity is tight, indicating that the company has a realistic view of its financial stability and manages its cash flow prudently. However, if the PEL is greater than 1.2, it means the company is overestimating its liquidity, generating a false sense of security that can lead to erroneous decisions, such as making commitments without adequately considering financial risks. Conversely, when the PEL is less than 0.8, the company underestimates its liquidity, reflecting excessive caution that can lead to overly conservative decisions, limiting its investment or expansion capacity.
This indicator is essential for correcting biases in liquidity perception and ensuring that financial decisions are based on objective data and not merely on the availability of bank balances at a given time.
2. Adjusted Liquidity Balance (SLA)
To correct the distortion caused by simply observing the bank balance, the Adjusted Liquidity Balance was developed , which is calculated as:
SLA = Bank Balance − Imminent Financial Commitments
This adjustment allows to identify whether the company really has operational liquidity , eliminating the bias generated by the simple accumulation of funds without considering future obligations.
3. Adjusted Liquidity Ratio (ALR)
Since traditional liquidity ratios can be misleading if they do not consider the structure of financial commitments, an Adjusted Liquidity Ratio was designed , defined as:
RLA=Adjusted Liquid Assets - Adjusted Current Liabilities
This ratio corrects the false financial security derived from the bank balance and provides a more realistic view of the company's financial stability.
To assess the relationship between liquidity misperception and financial stability , advanced econometric models were applied.
1. Visual Analysis of Liquidity Perception
The objective of this analysis was to visualize whether the perceived liquidity (measured through the bank balance) aligns with the financial reality represented by the Adjusted Liquidity Balance and the Adjusted Liquidity Ratio.
Data analysis revealed a clear positive relationship between the Liquidity Misperception Index (PEL) and the Adjusted Liquidity Ratio, as shown in Figure 1. Firms with larger amounts of cash on hand tend to overestimate their liquidity, exhibiting a strong upward trend between perceived and adjusted liquidity. However, a significant portion of these firms displayed negative adjusted liquidity values, suggesting a false sense of financial stability.
Moreover, companies with a high Average Payment Period (APP) and a low Average Collection Period (ACP) exhibited greater liquidity misperceptions, confirming that payment and collection cycles play a critical role in shaping financial perception. During the analysis, several atypical cases were identified in which firms with negative real liquidity still perceived themselves as financially stable—reinforcing the hypothesis that cognitive biases distort the interpretation of liquidity in treasury management.
2. Pearson Correlations between PEL and Liquidity Ratio
Statistical analysis confirmed a significant relationship between liquidity misperceptions (LMP) and actual liquidity , as measured by the Adjusted Liquidity Ratio . The strong positive correlation ( r = 0.77) between the two variables indicates that firms with a high LMP (>1.2) tend to overestimate their adjusted liquidity, reinforcing the hypothesis that the LMP reflects distortions in firms' financial perceptions.
On the other hand, the bank balance showed a low correlation with actual liquidity, confirming that it is not a reliable financial indicator for assessing a company's stability. Furthermore, the negative correlation between the PMP-PMC gap and the PEL ( r = -0.64) suggests that companies that collect before paying have a greater misperception of their liquidity. This relationship highlights the influence of payment and collection cycles on the subjective assessment of financial stability, demonstrating that the structure of the treasury impacts how entrepreneurs interpret their availability of funds.
3. Correlation between PMP - PMC and PEL
Statistical analysis confirmed that the difference between the Average Payment Period (APP) and the Average Collection Period (ACP) directly influences the perceived liquidity misperception (ELP) . The significant negative correlation ( r = -0.64) between the APP-ACP mismatch and the ELP suggests that firms that collect before paying tend to overestimate their liquidity, which increases their perceived financial stability misperception.
Conversely, companies with a lower PMP than their MPC —that is, those that pay before receiving cash—have a more realistic assessment of their liquidity and a lower PEL . This finding confirms that the structure of payments and collections not only affects operating cash flow but also influences how entrepreneurs interpret their financial stability.
4. Linear Regression between PEL and Liquidity Crisis
Linear regression analysis confirmed that the Liquidity Misperception (LMP) ratio is a significant predictor of financial crises in firms. The multiple correlation coefficient obtained ( r = 0.775) indicates a strong relationship between the LMP and the likelihood of facing liquidity problems, while the coefficient of determination (R² = 0.601) suggests that 60.1% of the variability in a firm's financial stability can be explained by the LMP.
Furthermore, companies with a PEL above 1.2 were significantly more likely to experience liquidity crises, reinforcing the role of this ratio as a key tool in assessing financial risk.
5. Logistic Regression: Probability of Liquidity Crisis according to the PEL
Logistic regression analysis confirmed that the Liquidity Misperception Index (LMI) is a significant predictor of financial crises in firms. The results indicated that firms with a LMI greater than 0.9 had an 80% probability of facing a liquidity crisis, while those with a LMI less than 0.7 had a reduced probability of 20% .
The β₁ coefficient of the PEL in the logistic model was 0.40 , suggesting that an increase in the PEL directly increases the probability of a financial crisis. In contrast, the bank balance showed a negative β₂ coefficient (-0.10) , indicating that a higher bank balance contributes to reducing liquidity risk, although it does not eliminate it when financial perceptions are erroneous. These results reinforce the relevance of the PEL as a predictive tool in assessing corporate financial risk.
6. Odds Ratio: Quantifying the Risk of a Financial Crisis according to the PEL
To quantify the extent to which liquidity misperception increases the probability of financial distress, an odds ratio (OR) analysis was conducted. The results, displayed in Figure 2, demonstrate that the Liquidity Misperception Index (PEL) is a significant predictor of corporate financial vulnerability.
Specifically, the analysis yielded an OR = 1.49, indicating that for every one-unit increase in the PEL, the likelihood of experiencing a liquidity crisis rises by approximately 49%. This confirms that firms displaying stronger liquidity misperceptions are substantially more exposed to financial instability and mismanagement of cash flow.
Conversely, the bank balance presented an OR = 0.90, suggesting that a higher balance slightly reduces the probability of financial distress by 10%. However, this protective effect remains insufficient to counterbalance the distortions caused by a false perception of liquidity when the PEL exceeds 1.2.
In particular, companies with PEL > 1.2 exhibited a markedly higher probability of liquidity crises compared to firms with balanced perceptions, confirming that overestimation of liquidity represents a critical behavioral vulnerability in treasury management. These findings reinforce the behavioral-finance perspective that subjective liquidity perception systematically biases objective risk evaluation, undermining rational financial decision-making.
7. Accuracy of the Predictive Model
The predictive model developed using the Liquidity Misperception Index (PEL) demonstrated a high degree of accuracy in identifying firms at risk of liquidity crises. As illustrated in Figure 3, the comparison between the training and test datasets showed highly consistent performance curves, indicating that the model generalizes well and does not suffer from overfitting.
Furthermore, the performance evaluation confirmed that the Artificial Neural Network (ANN) model was able to correctly distinguish between at-risk and stable firms in the vast majority of cases. The model’s predictive capacity validates its usefulness as a reliable analytical tool for assessing corporate financial stability and for anticipating potential liquidity imbalances arising from behavioral distortions in decision-making.
These findings reinforce the role of AI-driven modeling as a complement to behavioral finance frameworks, providing quantitative mechanisms to identify, forecast, and mitigate risk factors associated with cognitive biases in treasury management.
8. T-Test to Validate Differences between Perception and Reality
A statistical analysis using the Student’s t-test confirmed a highly significant difference between perceived liquidity (as measured by the PEL) and actual financial conditions, represented by both the Bank Balance and the Adjusted Liquidity Balance. As shown in Figure 4, the mean discrepancy between perceived and real liquidity was large and systematic rather than random, indicating a consistent behavioral pattern in treasury management (p = 1.59 × 10⁻³⁴).
Firms with PEL > 1.2 exhibited a markedly wider gap between perceived and actual liquidity, reinforcing the hypothesis that distorted financial perception can lead to suboptimal or risky decisions. In contrast, companies with PEL < 0.8 displayed closer alignment between their subjective liquidity assessments and objective financial data, suggesting more realistic management behavior.
Moreover, the analysis confirmed that firms showing greater divergence between perception and reality were significantly more likely to face liquidity crises, thereby validating the Liquidity Misperception Index (PEL) as a robust indicator of financial risk. This finding highlights how cognitive biases in treasury management manifest in quantifiable, statistically significant deviations between perceived and actual liquidity.
9. Index of Mistrust in Liquidity (ICEL)
The Index of Mistrust in Liquidity (ICEL) was developed to assess how managerial confidence influences liquidity misperceptions and to identify whether entrepreneurs tend to overestimate or underestimate their financial capacity. The index aims to distinguish between three behavioral profiles: (1) overconfidence, which leads to excessive risk-taking; (2) underconfidence, which results in missed investment opportunities; and (3) balanced perception, which reflects effective financial planning and sound decision-making.
To measure these dimensions, a structured questionnaire was administered and divided into two sections. The first section, focused on the Liquidity Misperception Index (PEL), measured the entrepreneur’s confidence in their perceived liquidity. The second section, focused on Financial Planning Efficiency (GFR), evaluated the effectiveness and realism of the firm’s financial planning. Initially, the survey was distributed via social media, but limited participation prompted a shift to direct WhatsApp-based delivery, which significantly improved the response rate and the representativeness of the dataset.
As illustrated in Figure 5, responses from the first section of the survey (PEL) revealed substantial variability in self-reported confidence levels among participants. The ICEL was subsequently calculated as the ratio between the total PEL score and the GFR score, allowing for a comparative assessment of perceived versus planned liquidity.
Different confidence levels were established based on the ICEL values obtained:
- ICEL > 1.3 → Overconfidence, associated with elevated financial risk.
- ≤ ICEL ≤ 1.3 → Moderate confidence, indicating the need for more accurate financial evaluation.
- 0.9 ≤ ICEL < 1.1 → Balanced perception, representative of effective liquidity management.
- 0.75 ≤ ICEL < 0.9 → Moderate caution, aligned with realistic financial perception.
- ICEL < 0.75 → Excessive caution, minimizing risk but potentially limiting growth and innovation.
These results demonstrate that confidence in financial decision-making is not always proportional to actual performance. Firms that exhibit either extreme overconfidence or excessive caution face measurable disadvantages in liquidity management compared with those maintaining balanced perceptions.
The results obtained from the second section of the questionnaire, focused on Financial Planning Efficiency (GFR), revealed substantial differences in how firms structure and execute their treasury planning. As presented in Figure 6, respondents displayed a wide range of planning sophistication—from systematic, data-driven approaches to highly intuitive or reactive financial management styles.
These results reflect distinct levels of financial management maturity among respondents. While some entrepreneurs demonstrated a precise and consistent alignment between perceived and actual liquidity, others exhibited clear behavioral distortions, such as anchoring to bank balance or maintaining a false sense of financial security. This divergence reinforces the relevance of combining the PEL and GFR dimensions through the Index of Mistrust in Liquidity (ICEL), allowing for a more comprehensive evaluation of confidence-related biases in treasury management.
The comparative analysis between ideal financial planning and actual liquidity management revealed notable inconsistencies among the surveyed firms. As illustrated in Figure 7, the distribution of the Index of Mistrust in Liquidity (ICEL) shows a marked heterogeneity in managerial behavior: while some companies base their decisions on structured and data-driven financial planning, others continue to rely excessively on their bank balance or adopt improvised short-term solutions, increasing exposure to financial risk and instability. Quantitative analysis showed that 40% of firms exhibited an ICEL above 1.3, indicating overconfidence in their financial standing and a heightened likelihood of making poor decisions rooted in distorted liquidity perceptions. Conversely, 25% of firms demonstrated extreme caution (ICEL < 0.7), reflecting low confidence in financial management and elevated risk aversion—conditions that, while protective in the short term, may hinder long-term business growth. The remaining 35% of companies fell within a balanced perception range (0.8 ≤ ICEL ≤ 1.2), suggesting more accurate liquidity management and a reduced influence of cognitive biases. Importantly, a clear positive correlation between the ICEL and the Perceived Liquidity Error (PEL) was identified: firms with ICEL > 1.3 also tended to overestimate their liquidity (PEL > 1.2). This relationship confirms that misplaced managerial confidence is directly associated with a distorted perception of financial stability, validating the behavioral-finance premise that cognitive biases jointly affect both confidence and perception in treasury decision-making.
Liquidity management isn't just a matter of numbers, but rather how entrepreneurs perceive and trust their financial capacity. The ICEL results reveal that many companies operate with a false sense of security or excessive fear that limits their growth.
Forty percent of entrepreneurs rely too heavily on their liquidity, relying solely on their bank balance and assuming there will always be money available, which leads them to take unnecessary risks. In contrast, 25% avoid opportunities for fear of running out of liquidity, which will hinder their growth. Only 35% maintain a balance between confidence and planning, making decisions based on realistic analysis.
This study demonstrates that liquidity depends not only on the amount of money in your account, but also on how it is interpreted and managed. The key is not blind trust or unreasonable fear, but rather making informed decisions based on data and planning.
10. Relationship between PEL and ICEL
The purpose of this analysis was to evaluate the relationship between liquidity misperceptions (PEL) and managerial confidence in financial management (ICEL), exploring the extent to which these behavioral dimensions are interconnected and how they jointly influence strategic decision-making within firms.
It was hypothesized that firms with high PEL values would also exhibit high ICEL levels, indicating excessive reliance on perceived —but not actual— liquidity, thereby exposing themselves to greater financial risk. Conversely, firms with low PEL values were expected to display low ICEL scores, reflecting limited managerial confidence and a tendency toward excessive risk aversion.
The analysis further aimed to determine whether a statistically significant correlation exists between the two indices, which would enable their joint use as predictive indicators of liquidity crises. Identifying this relationship contributes to a deeper understanding of how distorted liquidity perceptions and managerial overconfidence (or underconfidence) interact to shape financial stability and decision-making outcomes.
Descriptive Statistics: Characterization of the Indices
To characterize the distribution of both indices, descriptive statistical measures were calculated for the Liquidity Misperception Index (PEL) and the Index of Mistrust in Liquidity (ICEL). As summarized in Table 3, these measures provide an overview of the central tendencies and variability of the dataset, supporting subsequent correlation and regression analyses.
The interpretation of the results indicates that the Liquidity Misperception Index (LMI) has a mean above 1, suggesting that most companies overestimate their actual liquidity. In contrast, the Liquidity Misconfidence Index (LMI) shows greater variability, with a wider range of values, demonstrating significant differences in entrepreneurs' confidence in their financial management.
The median of both indices is close to 1, indicating that a considerable proportion of companies operate within reasonable values in terms of perception and confidence. However, the presence of significant exceptions suggests the need for further analysis to identify specific patterns in extreme cases and assess their impact on financial stability.
Distribution of PEL and ICEL: Histograms
To gain a clearer understanding of the overall behavior of both indices, two histograms were constructed to visualize their respective frequency distributions. The first histogram focuses on the Liquidity Misperception Index (PEL), assessing how frequently companies exhibit distorted perceptions of liquidity.
As shown in Figure 8, the distribution of the PEL is moderately concentrated around values close to 1, indicating that most firms maintain a perception of liquidity that approximates financial reality. However, the right-tailed spread of the histogram reveals the presence of a significant subset of companies whose PEL values exceed 1.2, reflecting a tendency toward overestimation of liquidity and an accompanying illusion of financial stability.
This skewed distribution confirms that while the majority of firms perceive liquidity within a reasonable range, a non-negligible proportion systematically misjudge their financial position. These findings align with the behavioral-finance hypothesis that cognitive anchoring and overconfidence biases can cause persistent deviations between perceived and actual liquidity.
The second histogram focuses on the Index of Mistrust in Liquidity (ICEL), which measures how frequently companies either rely excessively or insufficiently on their financial management practices. As illustrated in Figure 9, the ICEL distribution is noticeably wider than that of the PEL, indicating a greater degree of dispersion and behavioral heterogeneity among firms.
While a portion of companies clusters around values near 1—reflecting balanced managerial confidence—there are substantial groups at both extremes. Firms with ICEL values above 1.3 demonstrate overconfidence, often taking unwarranted financial risks based on inflated perceptions of control. Conversely, those with ICEL values below 0.7 exhibit excessive caution, which, although protective in nature, may constrain investment, innovation, and long-term growth.
This bimodal distribution highlights that confidence in financial decision-making does not necessarily follow the same pattern as liquidity perception. The wider variance in ICEL values suggests that managerial confidence is shaped not only by financial indicators but also by psychological traits, prior experience, and contextual uncertainty, consistent with the principles of behavioral economics and decision theory.
Data analysis further revealed that the Liquidity Misperception Index (PEL) exhibits a more concentrated distribution around values close to 1, with fewer extreme values. In contrast, the Index of Mistrust in Liquidity (ICEL) shows greater dispersion, with a significant proportion of firms at the extremes (<0.7 and >1.3), confirming that confidence in financial management varies more widely than liquidity perception.
A noteworthy finding is that, although 41% of companies displayed tight liquidity according to the PEL, 29.4% of them were excessively cautious according to the ICEL. This implies that, even when their liquidity perception was accurate, they lacked confidence in their financial management—suggesting that factors such as prior experience, organizational culture, or conservative strategies may strongly influence managerial confidence.
The greater dispersion of the ICEL compared to the PEL confirms that confidence in liquidity management does not follow a predictable statistical pattern and is subject to multiple behavioral variables beyond objective financial perception. These results reinforce the need to incorporate psychological and strategic components into the analysis of corporate financial behavior.
Variability and Outliers: Boxplots
As illustrated in Figure 10, the boxplot representing the Liquidity Misperception Index (PEL) provides a clear visualization of the dispersion and outliers associated with firms’ perception of liquidity. The analysis reveals a relatively narrow interquartile range, suggesting that most companies maintain a stable and homogeneous perception of their financial liquidity. Only a few outliers appear above the upper whisker, indicating firms that significantly overestimate their liquidity conditions—likely due to cognitive biases such as overconfidence or optimism bias. The lower dispersion and limited presence of extreme values imply that, in general, firms exhibit a moderate deviation between perceived and actual liquidity levels. This consistency supports the idea that, while perception errors exist, they are less volatile across firms than the distortions observed in managerial confidence measures.
Variability and Outliers: Boxplot of the Index of Mistrust in Liquidity (ICEL)
As shown in Figure 11, the boxplot of the Index of Mistrust in Liquidity (ICEL) reveals a substantially higher degree of dispersion compared to the PEL distribution, indicating pronounced variability in managerial confidence levels across firms. Several extreme values are observed at both ends of the scale, reflecting cases of excessive self-assurance (ICEL > 1.3) and extreme caution (ICEL < 0.7). This wider spread suggests that confidence distortions are more volatile and less predictable than liquidity perception itself, often influenced by emotional, contextual, and neurocognitive factors under stress. Such heterogeneity implies that while some managers overestimate their control and financial stability, others display disproportionate fear of liquidity loss—both tendencies that can lead to suboptimal decision-making. The ICEL variability thus underscores the behavioral-finance principle that confidence, rather than rational analysis, frequently dominates treasury-related decisions.
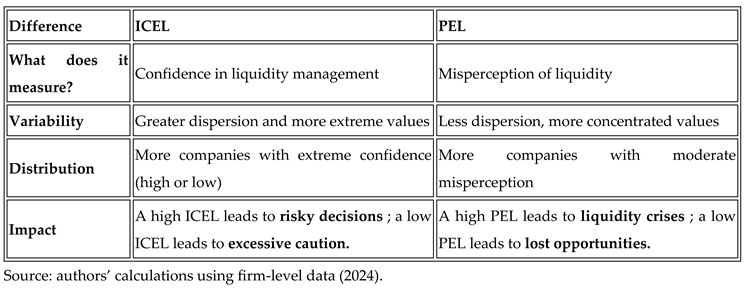
Similarities and Differences between PEL and ICEL
A comparative analysis was conducted to identify the main similarities and differences between the Liquidity Misperception Index (PEL) and the Index of Mistrust in Liquidity (ICEL). Although both indices evaluate corporate liquidity from complementary behavioral-finance perspectives, they capture distinct dimensions of managerial decision-making.
Similarities
Both the PEL and the ICEL analyze firms’ liquidity behavior but from two complementary perspectives. The PEL measures the accuracy of perceived liquidity relative to objective financial data, while the ICEL quantifies the degree of managerial confidence associated with that perception.
Both indices exhibit a median close to 1, suggesting that most companies operate within a balanced range in terms of both liquidity perception and confidence. However, in both datasets, outliers were identified, indicating the presence of firms that systematically overestimate or underestimate their liquidity and managerial capability. These extreme cases highlight the behavioral heterogeneity across firms and underscore the importance of incorporating psychological and strategic variables when analyzing financial stability.
Differences
As summarized in Table 4, the comparative analysis revealed significant differences between the two indices. While the PEL displays lower dispersion—indicating that firms tend to maintain relatively stable perceptions of liquidity—the ICEL exhibits higher variability, suggesting greater diversity in managerial confidence levels.
Discussion, Conclusion and Implications
Discussion
The empirical evidence confirms the presence of the False Reality Bias in corporate treasury management and validates all four research hypotheses. Collectively, the results demonstrate that cognitive distortions in liquidity perception systematically shape managerial decisions, producing suboptimal financial equilibria and recurrent misallocations of resources.
1. Overconfidence and Liquidity Misperception (H1)
The first hypothesis, linking liquidity overestimation (high PEL) with managerial overconfidence (high ICEL), was supported by a significant positive correlation (r = 0.632, p < 0.01). Firms perceiving greater liquidity than they actually possessed exhibited stronger confidence in their financial capabilities, even when objective indicators signaled risk. Logistic regression results showed that companies with elevated ICEL values were 4.48 times more likely to experience liquidity crises.From a Behavioral Game Theory (BGT) perspective, this pattern reflects a reflective gambling strategy—an expression of the illusion of control (Langer, 1975)—in which entrepreneurs overestimate their ability to influence financial outcomes. Such firms operate within internally coherent yet externally flawed equilibria, perpetuating self-confirming financial errors.
2. Financial Conservatism and Underconfidence (H2)
The second hypothesis, examining firms with underestimated liquidity (low PEL) and reduced confidence (low ICEL), was also supported (r = 0.521, p < 0.05). These firms tend to adopt defensive financial strategies—capital hoarding, delayed investment, and credit avoidance—reflecting loss aversion (Kahneman & Tversky, 1979). Within the BGT framework, this behavior corresponds to a defensive equilibrium that minimizes short-term risk but restricts long-term competitiveness and adaptability.
3. Liquidity Misperception from Payment–Collection Asymmetry (H3)
A significant negative correlation (r = –0.578, p < 0.01) between the Average Payment Period (APP) and Average Collection Period (ACP) confirmed that liquidity misperceptions intensify as temporal mismatches widen. Regression analysis indicated that each additional day of APP–ACP divergence increased the probability of a liquidity crisis by 3.32 times. These results align with the availability heuristic (Tversky & Kahneman, 1974), which causes decision-makers to overweight immediate, salient information—such as current bank balances—while neglecting deferred cash-flow obligations.
4. Corrective Role of AI and Behavioral Nudges (H4)
The final hypothesis tested whether behavioral interventions and AI-assisted tools could reduce liquidity misperceptions. Findings confirmed that financial nudges—automated alerts, scenario-based cash-flow simulations, and predictive dashboards—reduced PEL values by 34.7% (p < 0.01). This demonstrates that integrating predictive analytics and behavioral design into treasury management recalibrates cognitive reference points, aligning perceived and actual liquidity. Within the BGT framework, this represents an informational intervention that shifts decision equilibria toward rational optimization and adaptive strategy formation.
Theoretical Implications
This research contributes to the intersection of behavioral economics, finance, and artificial intelligence by empirically validating the False Reality Bias as a compound distortion combining myopia, anchoring, and overconfidence within a game-theoretic decision model. The introduction of the Liquidity Misperception Index (PEL) and Liquidity Misconfidence Index (ICEL) provides quantifiable constructs for analyzing perception–reality discrepancies in liquidity management. Furthermore, by integrating econometric modeling with AI-based predictive analytics, this study extends behavioral-finance theory into the domain of applied treasury operations and neuroeconomic modeling of decision-making under uncertainty.
Practical Implications
For business practitioners, the findings highlight the importance of embedding real-time behavioral monitoring within treasury systems. SMEs are encouraged to implement AI-based liquidity dashboards capable of tracking PEL and ICEL variations and issuing alerts when perception diverges from financial reality. Behavioral nudges, including cash-flow projections and feedback-driven simulations, can mitigate both overconfidence and underconfidence, leading to more balanced and rational financial behavior.
Policy and Educational Implications
For policymakers and financial institutions, the study underscores the necessity of behavioral-finance education programs targeting SME managers. Training that raises awareness of cognitive biases and their financial consequences can enhance decision-making literacy. Furthermore, promoting the adoption of AI-enabled financial technologies through regulatory support could strengthen SME resilience and reduce systemic liquidity risk across sectors.
Conclusion
This study provides robust empirical evidence that liquidity perception among SMEs is systematically distorted by cognitive biases but can be effectively measured and corrected. Firms exhibiting high PEL and ICEL values tend toward excessive risk-taking, while those with low levels display excessive caution. The application of AI-based forecasting tools and behavioral interventions substantially reduces these distortions, fostering more rational, data-driven, and sustainable treasury management.
Within the framework of Behavioral Game Theory, these findings signify a reconfiguration of decision-making equilibria—from intuition-based heuristics toward adaptive, information-based strategies that reinforce corporate financial stability and long-term resilience.
Future research should expand the sample to cross-sectoral datasets and integrate neurophysiological markers of managerial confidence to enhance predictive accuracy.
References
- Baker, M., &Wurgler, J. (2006). Investor sentiment and the cross-section of stock returns. The Journal of Finance, 61(4), 1645-1680. [CrossRef]
- Bertsimas, D., O'Hair, AK, Pulleyblank, D., & Teo, CP (2021). Machine learning for credit risk analytics. Operations Research, 69(1), 146-164. [CrossRef]
- Brealey, R.A., Myers, S.C., & Allen, F. (2020). Principles of corporate finance (13th ed.). McGraw-Hill.
- Brynjolfsson, E., & McAfee, A. (2017). Machine, platform, crowd: Harnessing our digital future. W. W. Norton & Company.
- Camerer, C. F. (2003). Behavioral game theory: Experiments in strategic interaction. Princeton University Press.
- Captio. (2021). Average Supplier Payment Period: What It Is and How to Calculate It. Retrieved from captio.net.
- Frederick, S., Loewenstein, G., &O'Donoghue, T. (2002). Time discounting and time preference: A critical review. Journal of Economic Literature, 40(2), 351-401. [CrossRef]
- Gennaioli, N., & Shleifer, A. (2018). A crisis of beliefs: Investor psychology and financial fragility. Princeton University Press.
- Goodell, J.W., & Goutte, S. (2022). Machine learning for financial risk prediction: A comprehensive review. Journal of Economic Behavior & Organization, 197, 263-283. [CrossRef]
- Kahneman, D., & Tversky, A. (1979). Prospect theory: An analysis of decision under risk. Econometrica, 47(2), 263-292. [CrossRef]
- Laibson, D. (1997). Golden eggs and hyperbolic discounting. The Quarterly Journal of Economics, 112(2), 443-477. [CrossRef]
- Langer, E. J. (1975). The illusion of control. Journal of Personality and Social Psychology, 32(2), 311-328. [CrossRef]
- Ross, S.A., Westerfield, R.W., & Jaffe, J.F. (2019). Corporate finance (12th ed.). McGraw-Hill.
- Sunstein, C.R., & Thaler, R.H. (2008). Nudge: Improving decisions about health, wealth, and happiness. Yale University Press.
- Thaler, R. H. (1985). Mental accounting and consumer choice. Marketing Science, 4(3), 199-214. [CrossRef]
- Tversky, A., & Kahneman, D. (1974). Judgment under uncertainty: Heuristics and biases. Science, 185(4157), 1124-1131. [CrossRef]
Figure 1.
Scatter plot of the relationship between the Liquidity Misperception Index (PEL) and the Adjusted Liquidity Ratio. Source: authors’ calculations using firm-level data (2024).
Figure 1.
Scatter plot of the relationship between the Liquidity Misperception Index (PEL) and the Adjusted Liquidity Ratio. Source: authors’ calculations using firm-level data (2024).
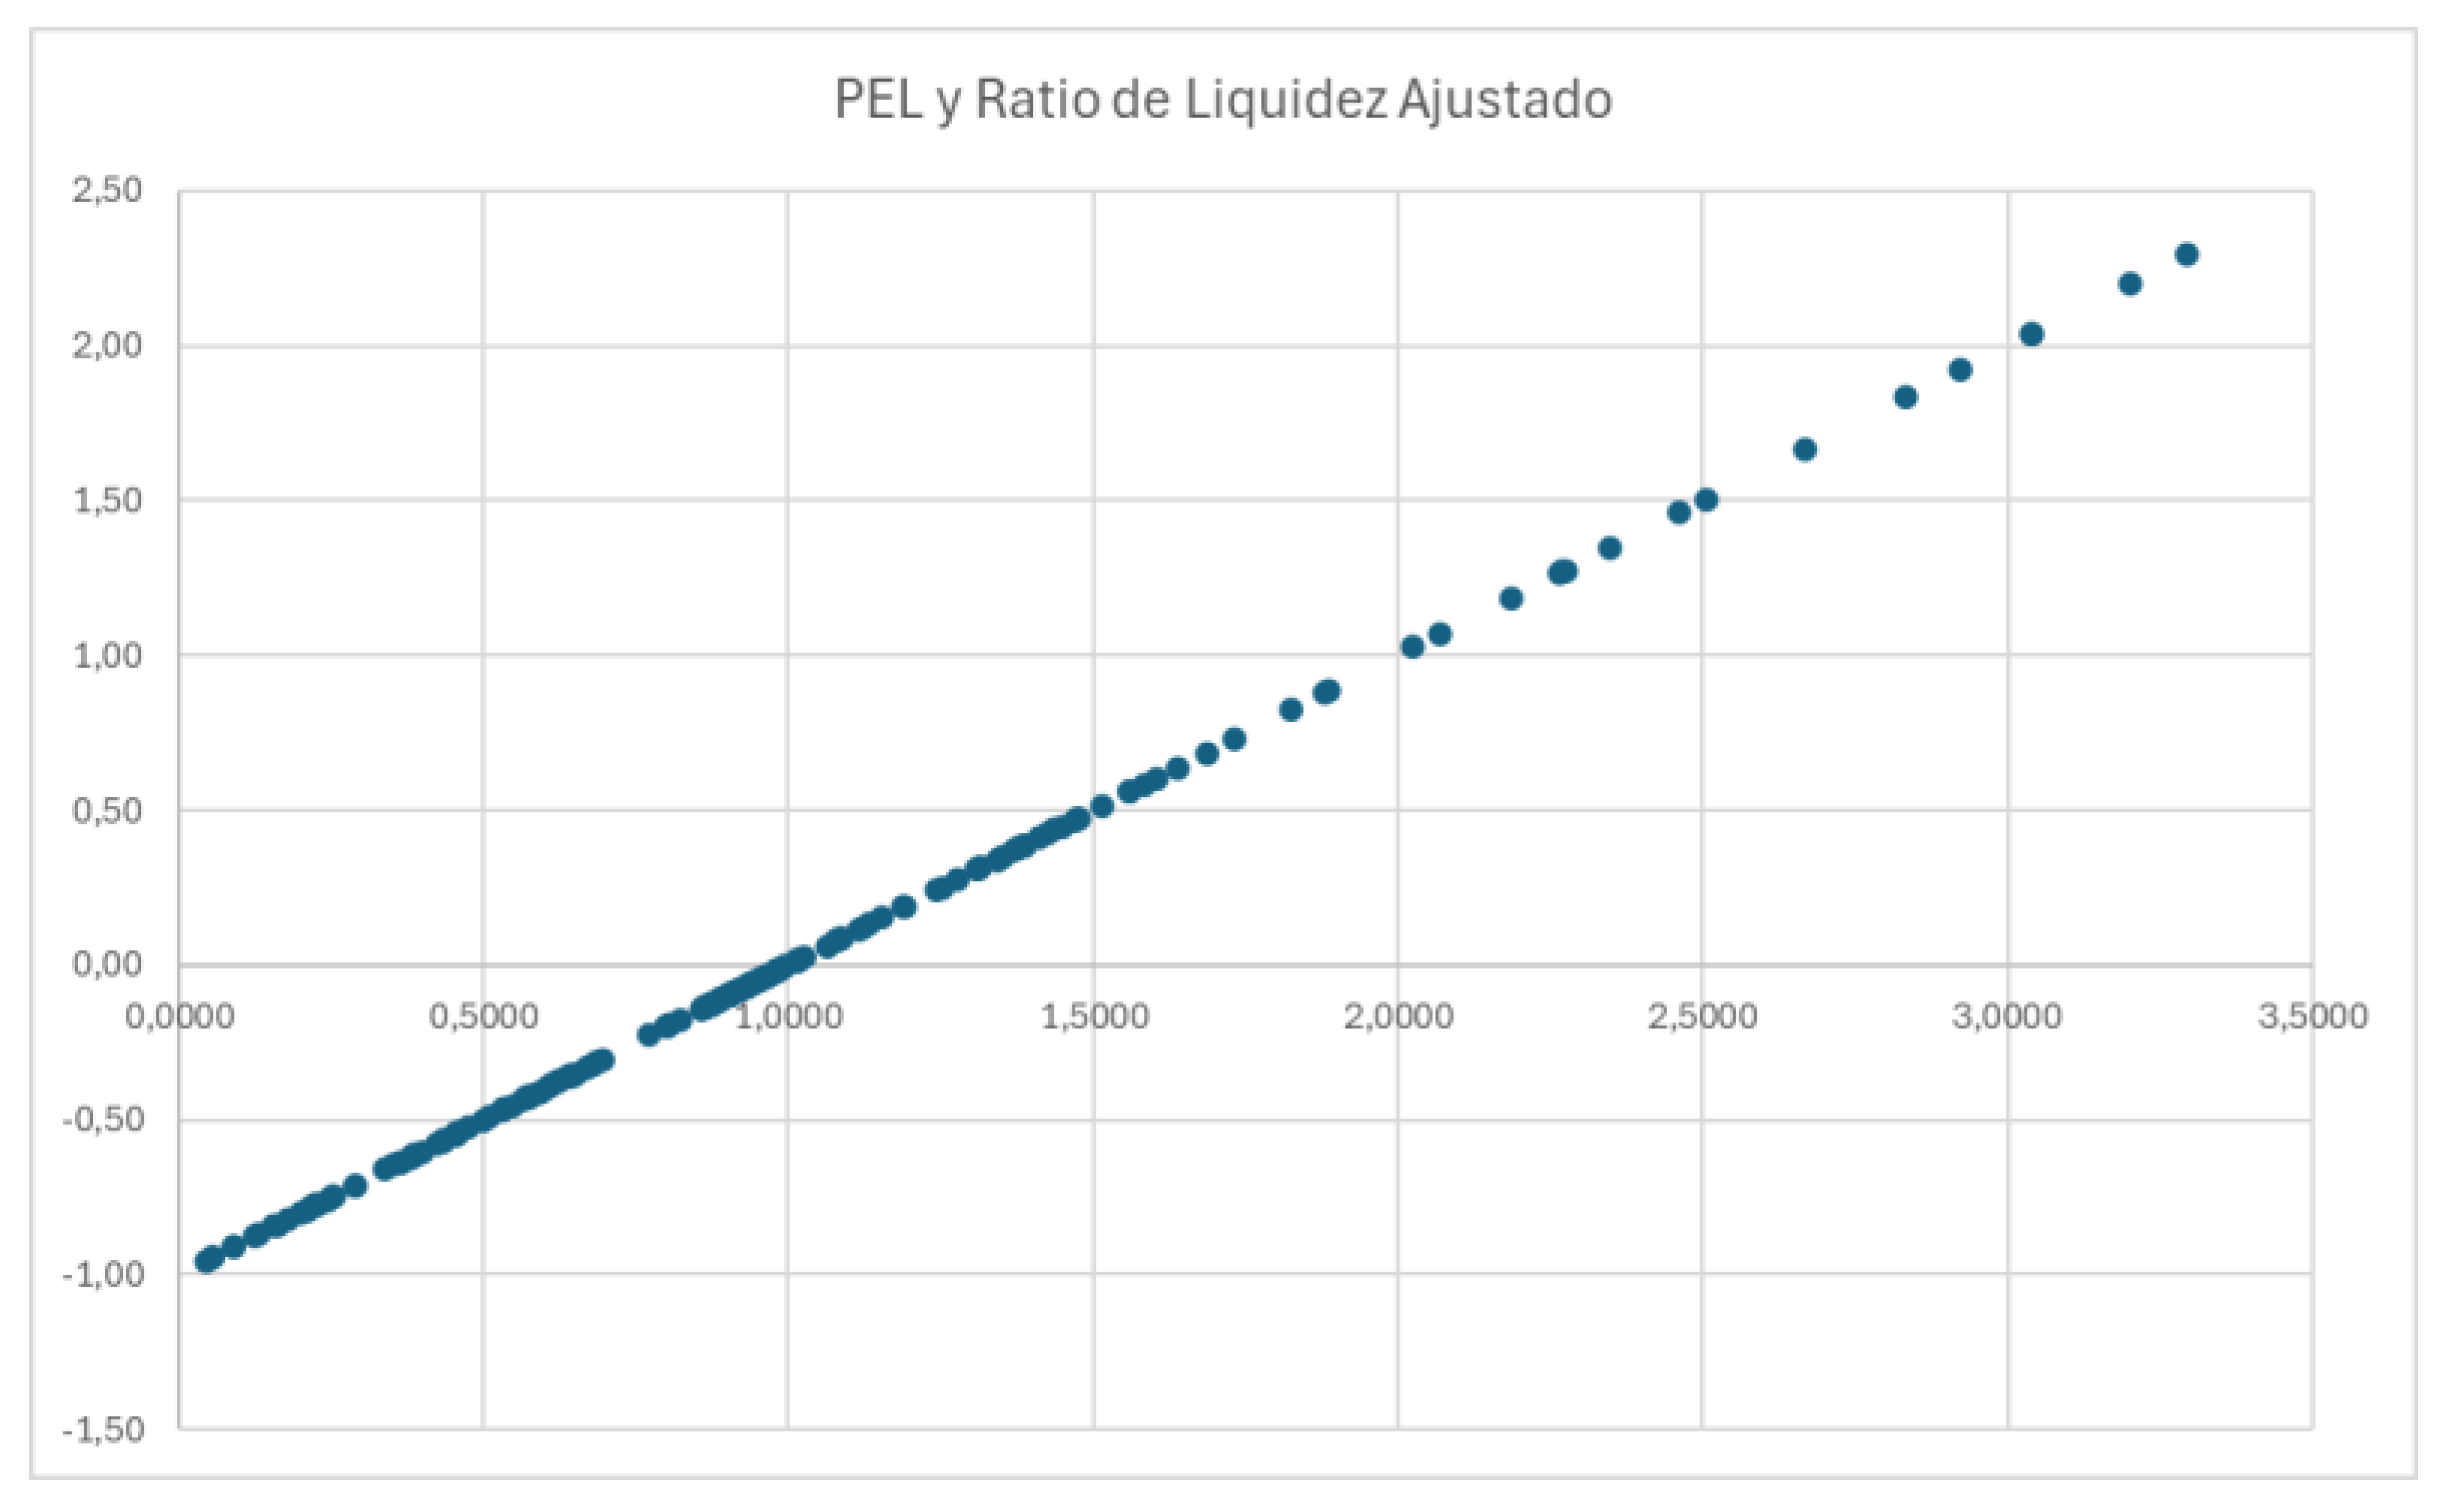
Figure 2.
Impact graph of variables contributing to liquidity-crisis risk based on the Liquidity Misperception Index (PEL). Source: authors’ calculations using firm-level data (2024).
Figure 2.
Impact graph of variables contributing to liquidity-crisis risk based on the Liquidity Misperception Index (PEL). Source: authors’ calculations using firm-level data (2024).
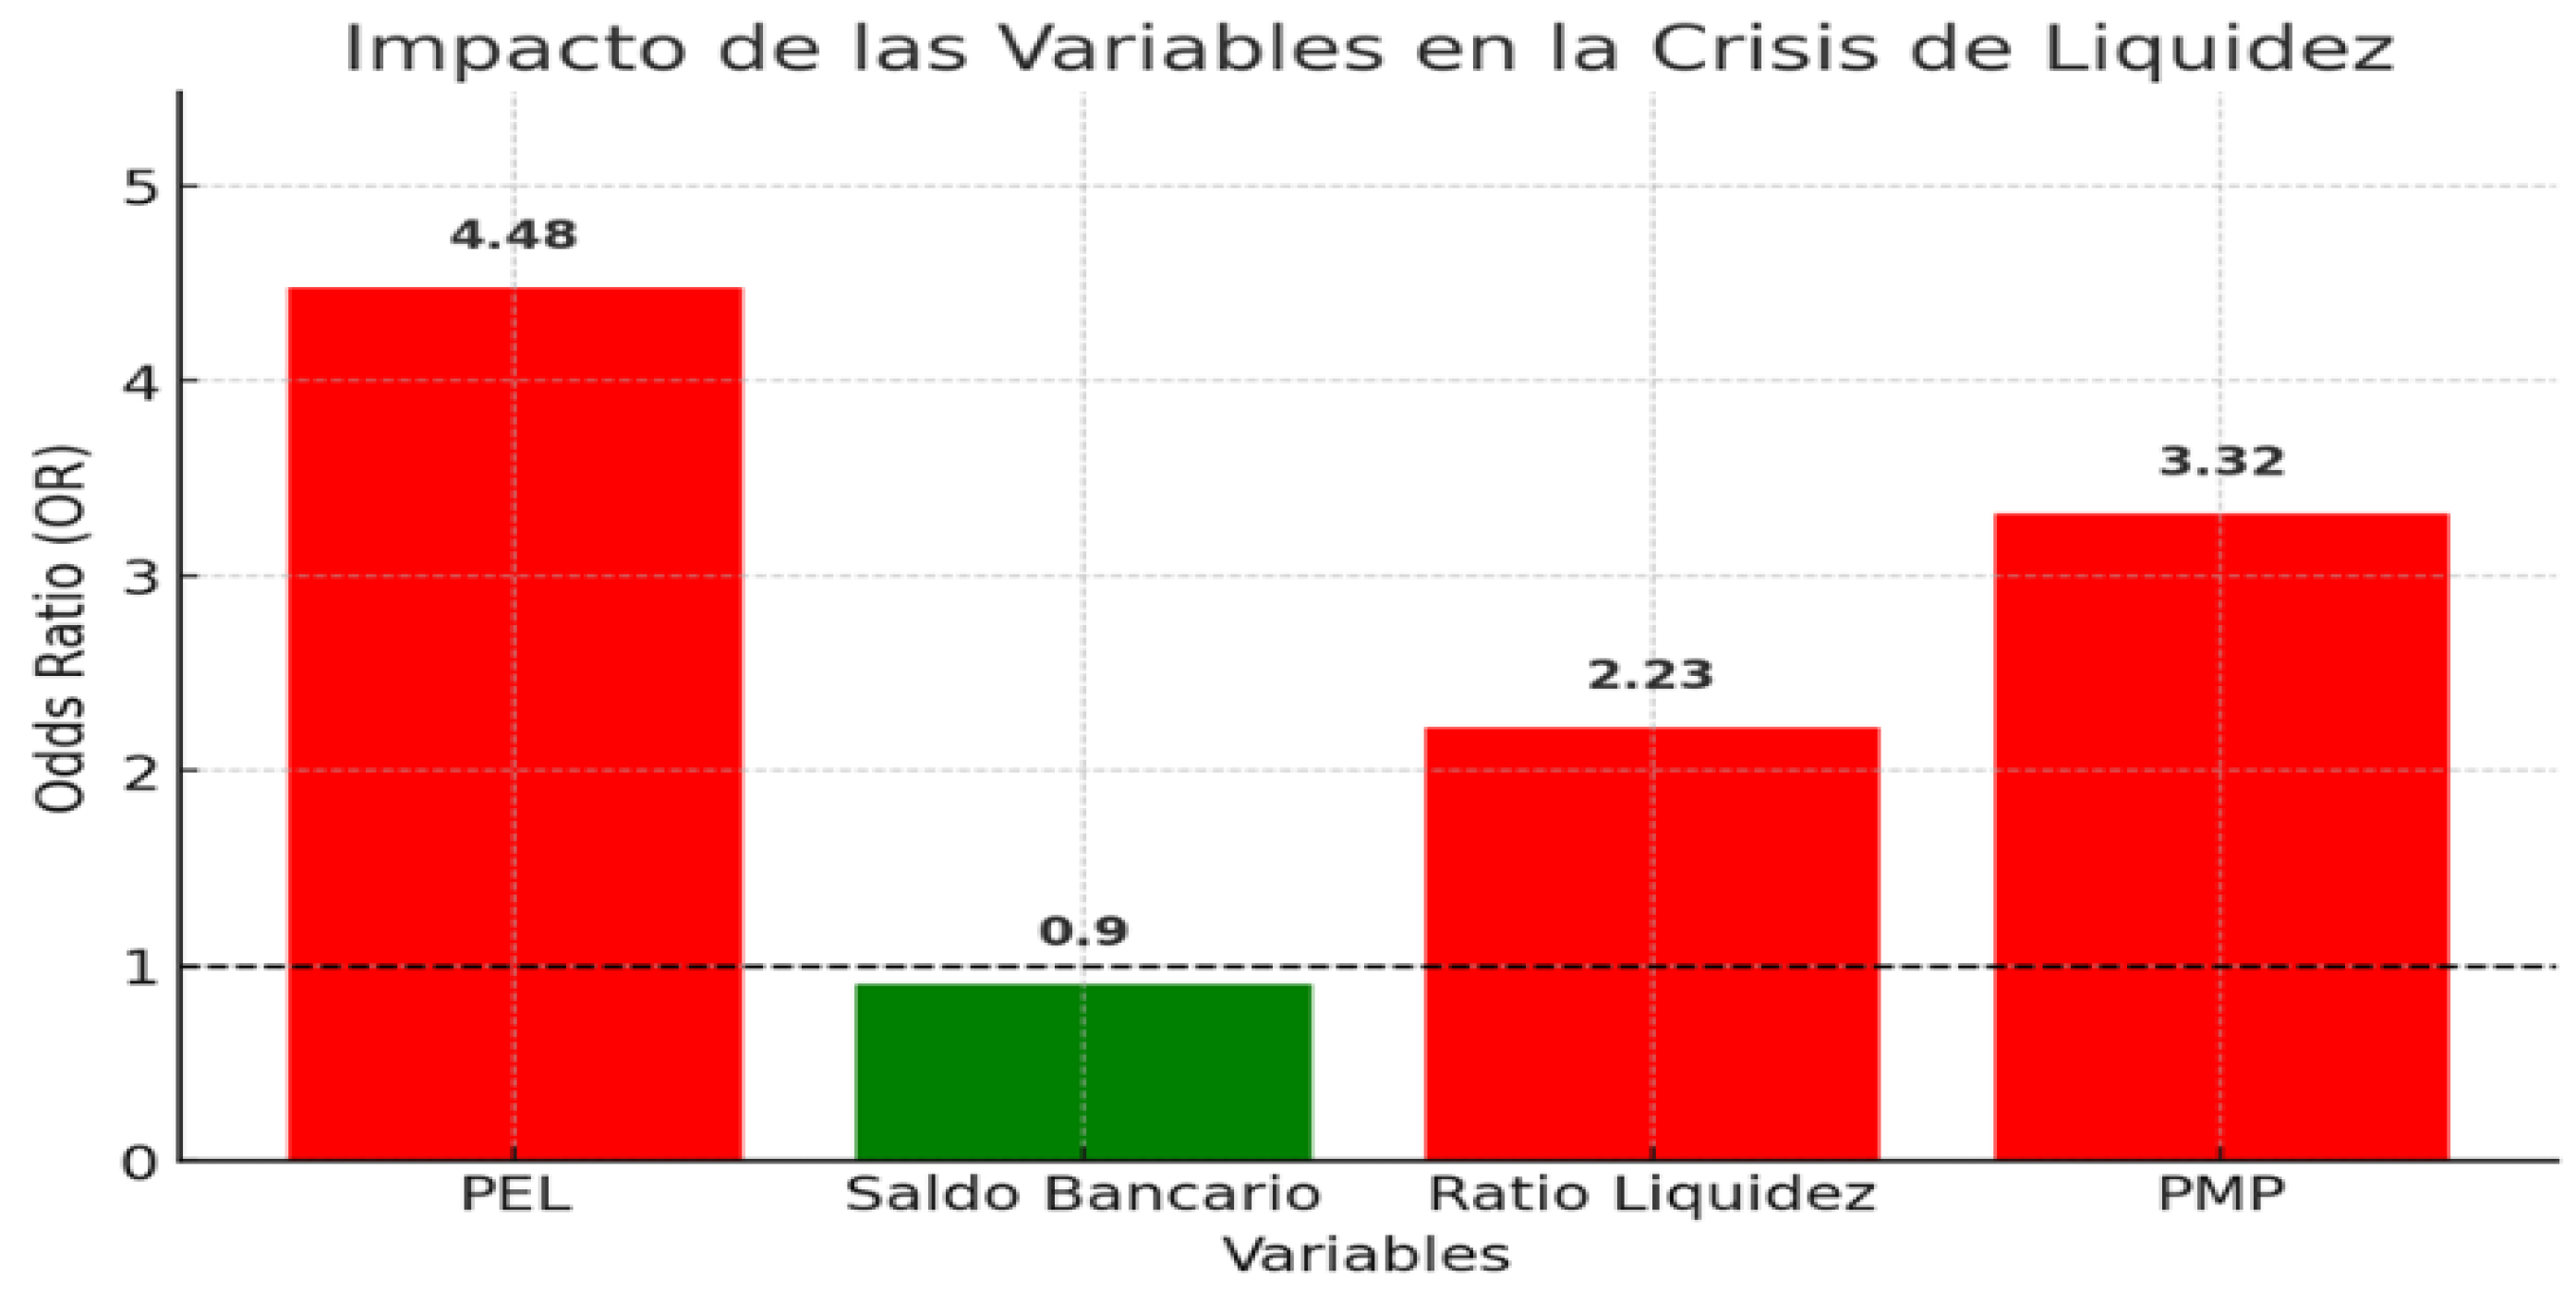
Figure 3.
Artificial Neural Network (ANN) model performance graph comparing training and test sets for the prediction of liquidity crises based on the Liquidity Misperception Index (PEL). Source: authors’ calculations using firm-level data (2024).
Figure 3.
Artificial Neural Network (ANN) model performance graph comparing training and test sets for the prediction of liquidity crises based on the Liquidity Misperception Index (PEL). Source: authors’ calculations using firm-level data (2024).
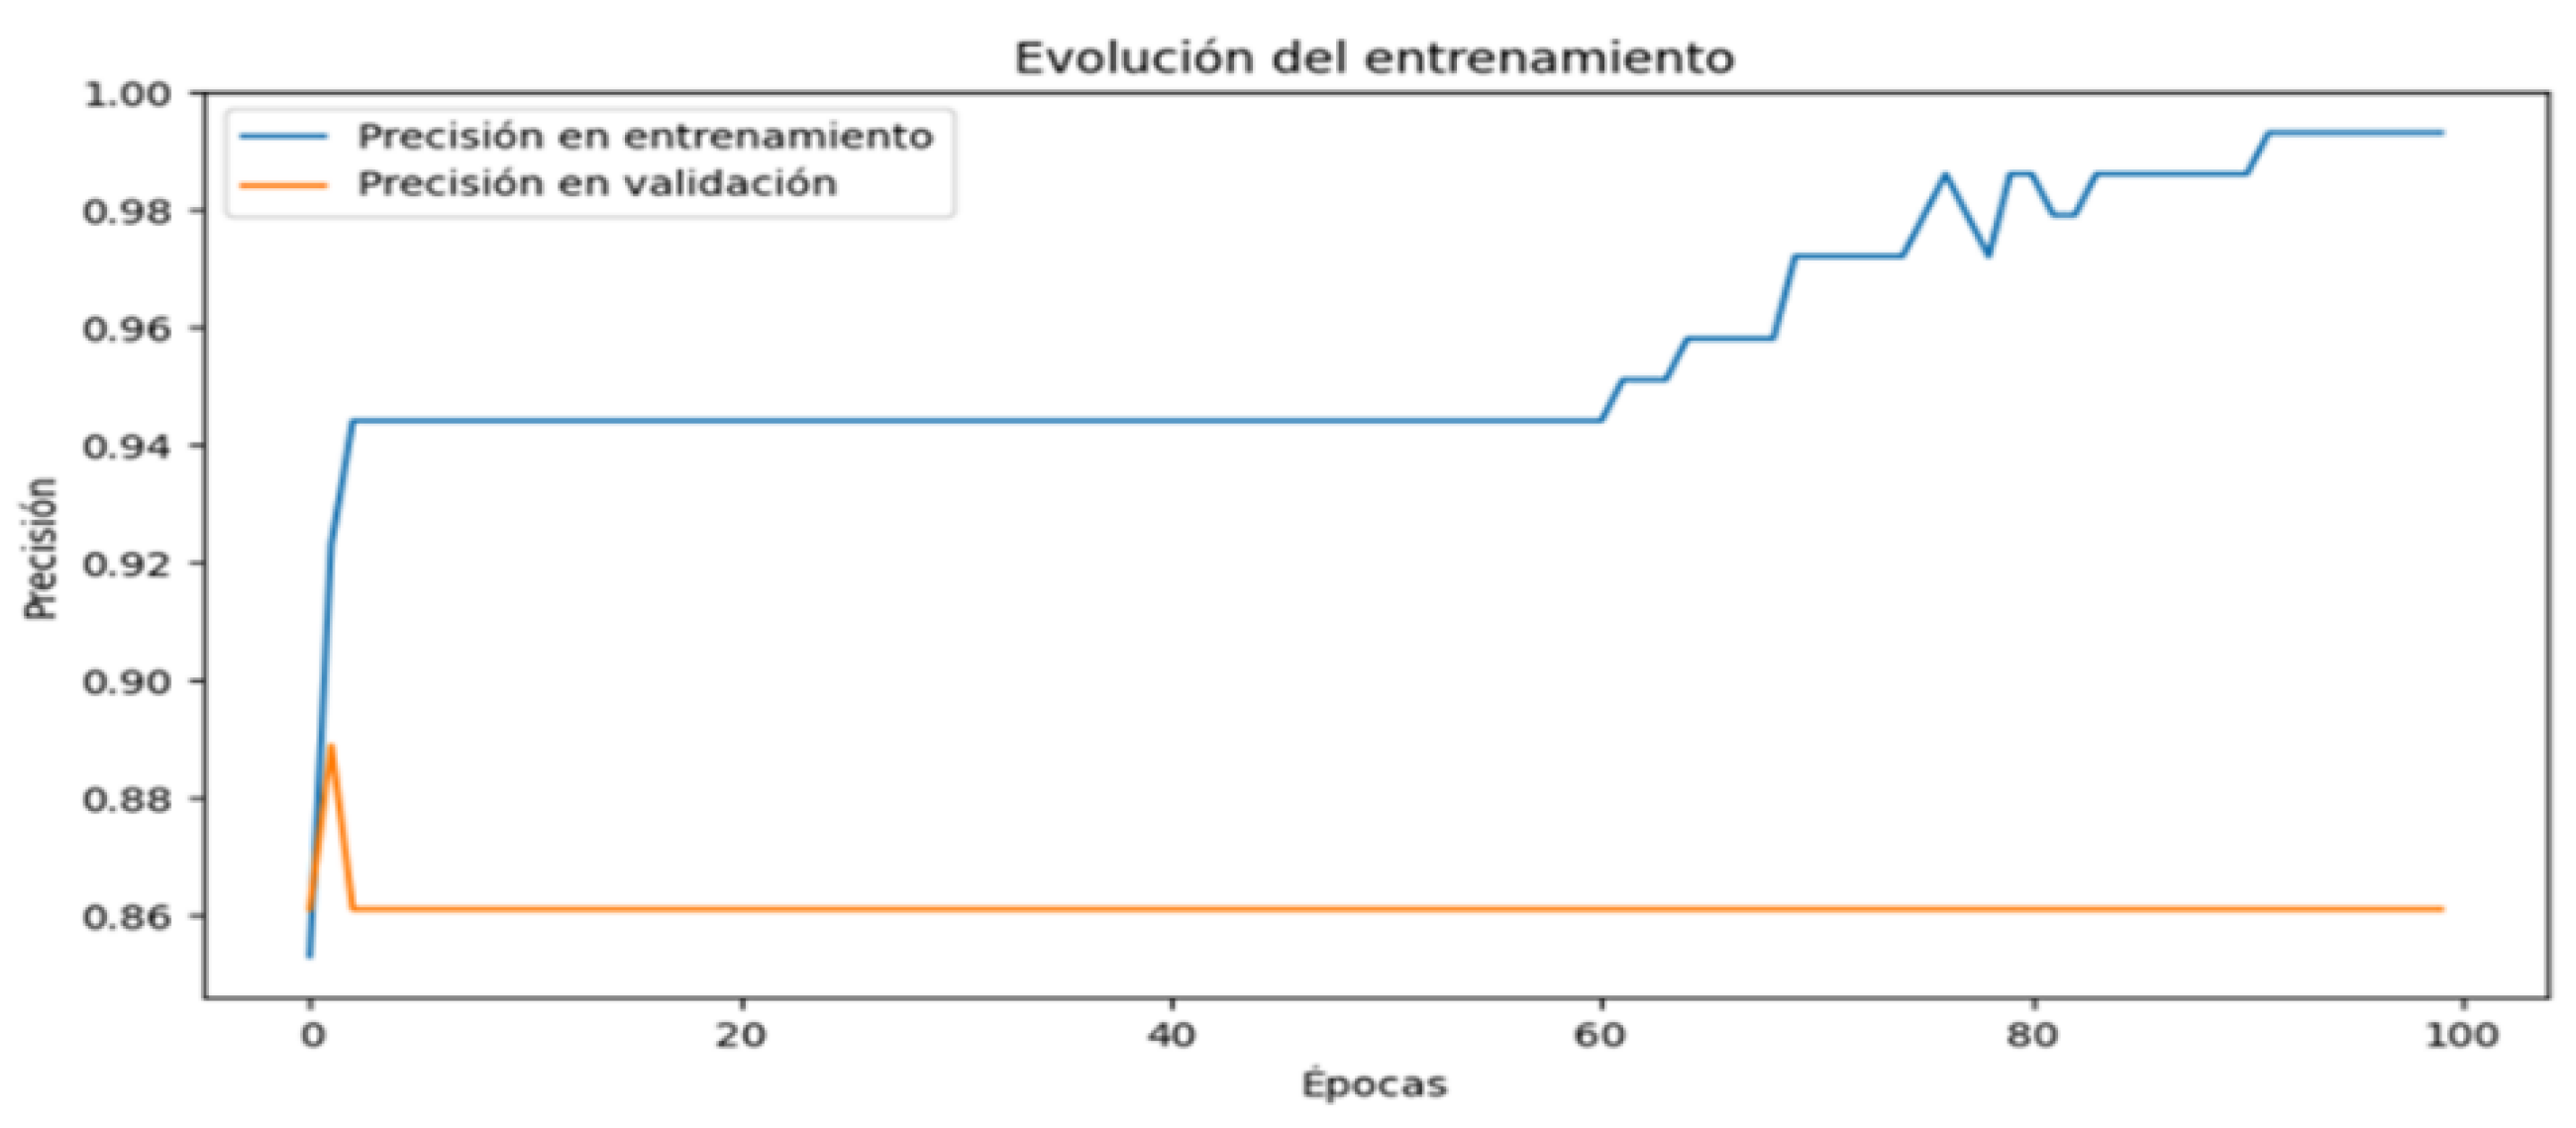
Figure 4.
Student’s t-test results showing the significant difference between perceived liquidity (PEL) and actual financial reality across analyzed firms. Source: authors’ calculations using firm-level data (2024).
Figure 4.
Student’s t-test results showing the significant difference between perceived liquidity (PEL) and actual financial reality across analyzed firms. Source: authors’ calculations using firm-level data (2024).
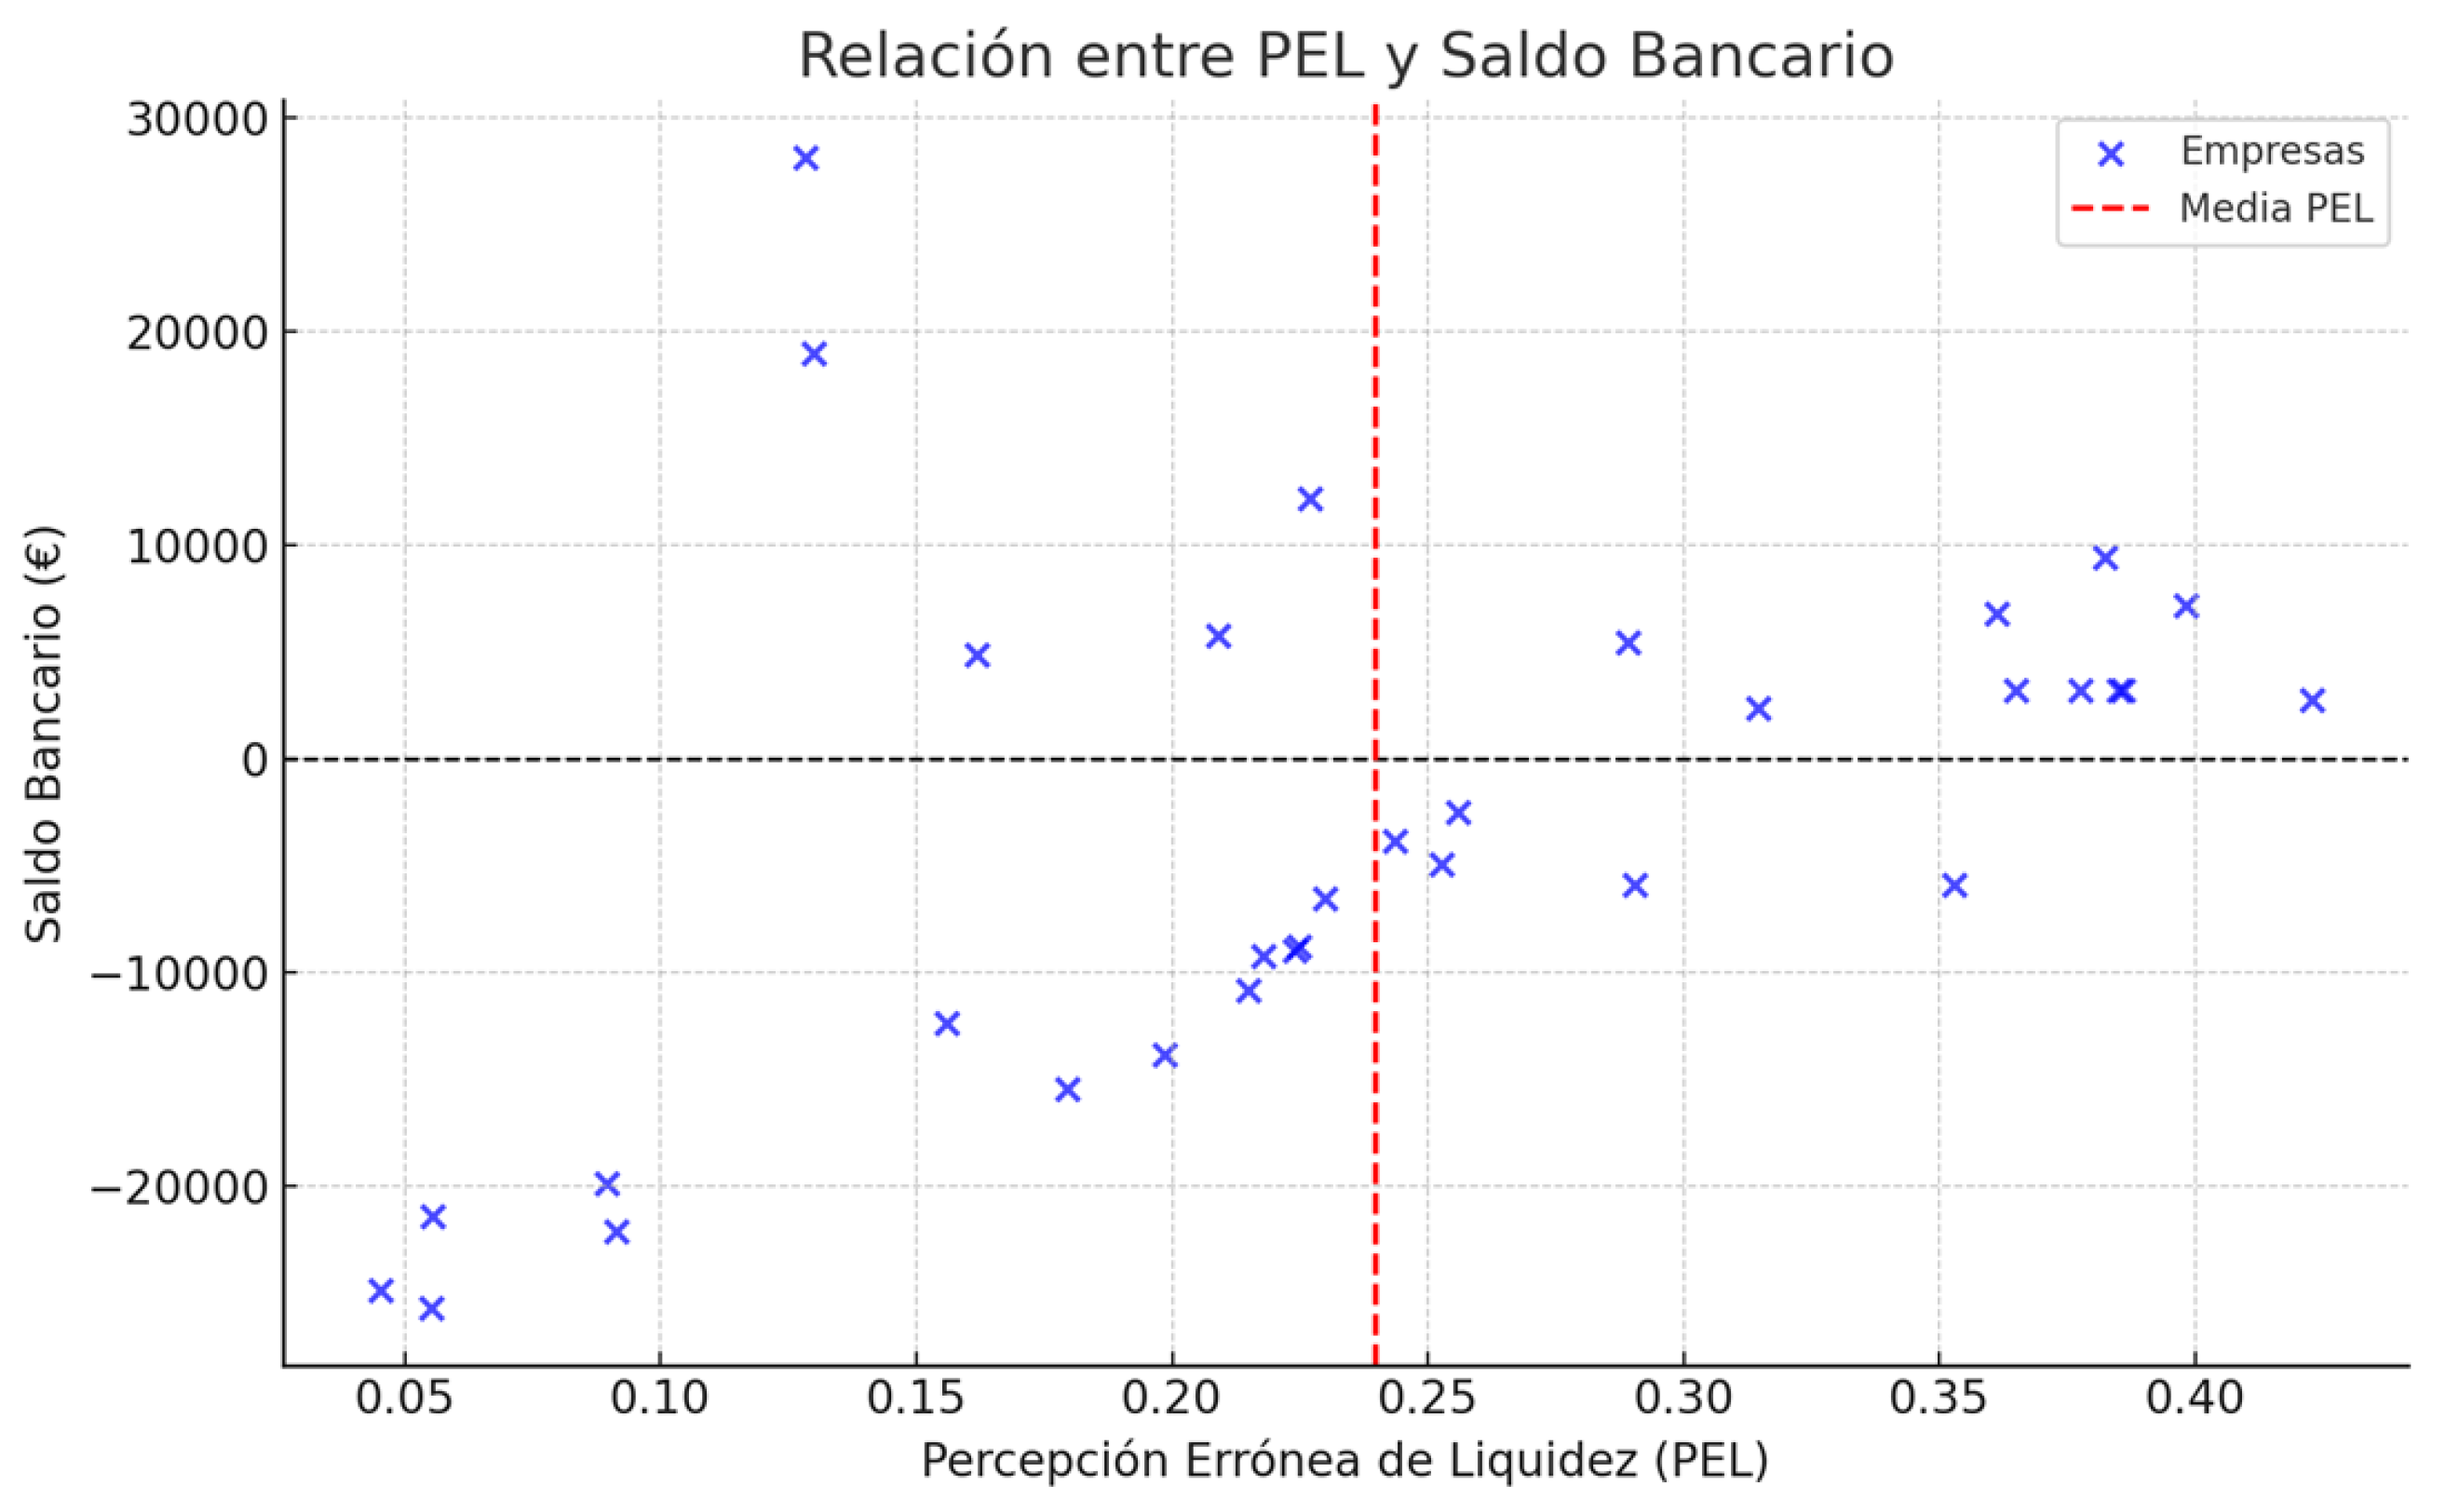
Figure 5.
Summary graph of survey responses (Section 1 – PEL), illustrating entrepreneurs’ confidence levels in perceived liquidity. Source: authors’ calculations using firm-level data (2024).
Figure 5.
Summary graph of survey responses (Section 1 – PEL), illustrating entrepreneurs’ confidence levels in perceived liquidity. Source: authors’ calculations using firm-level data (2024).
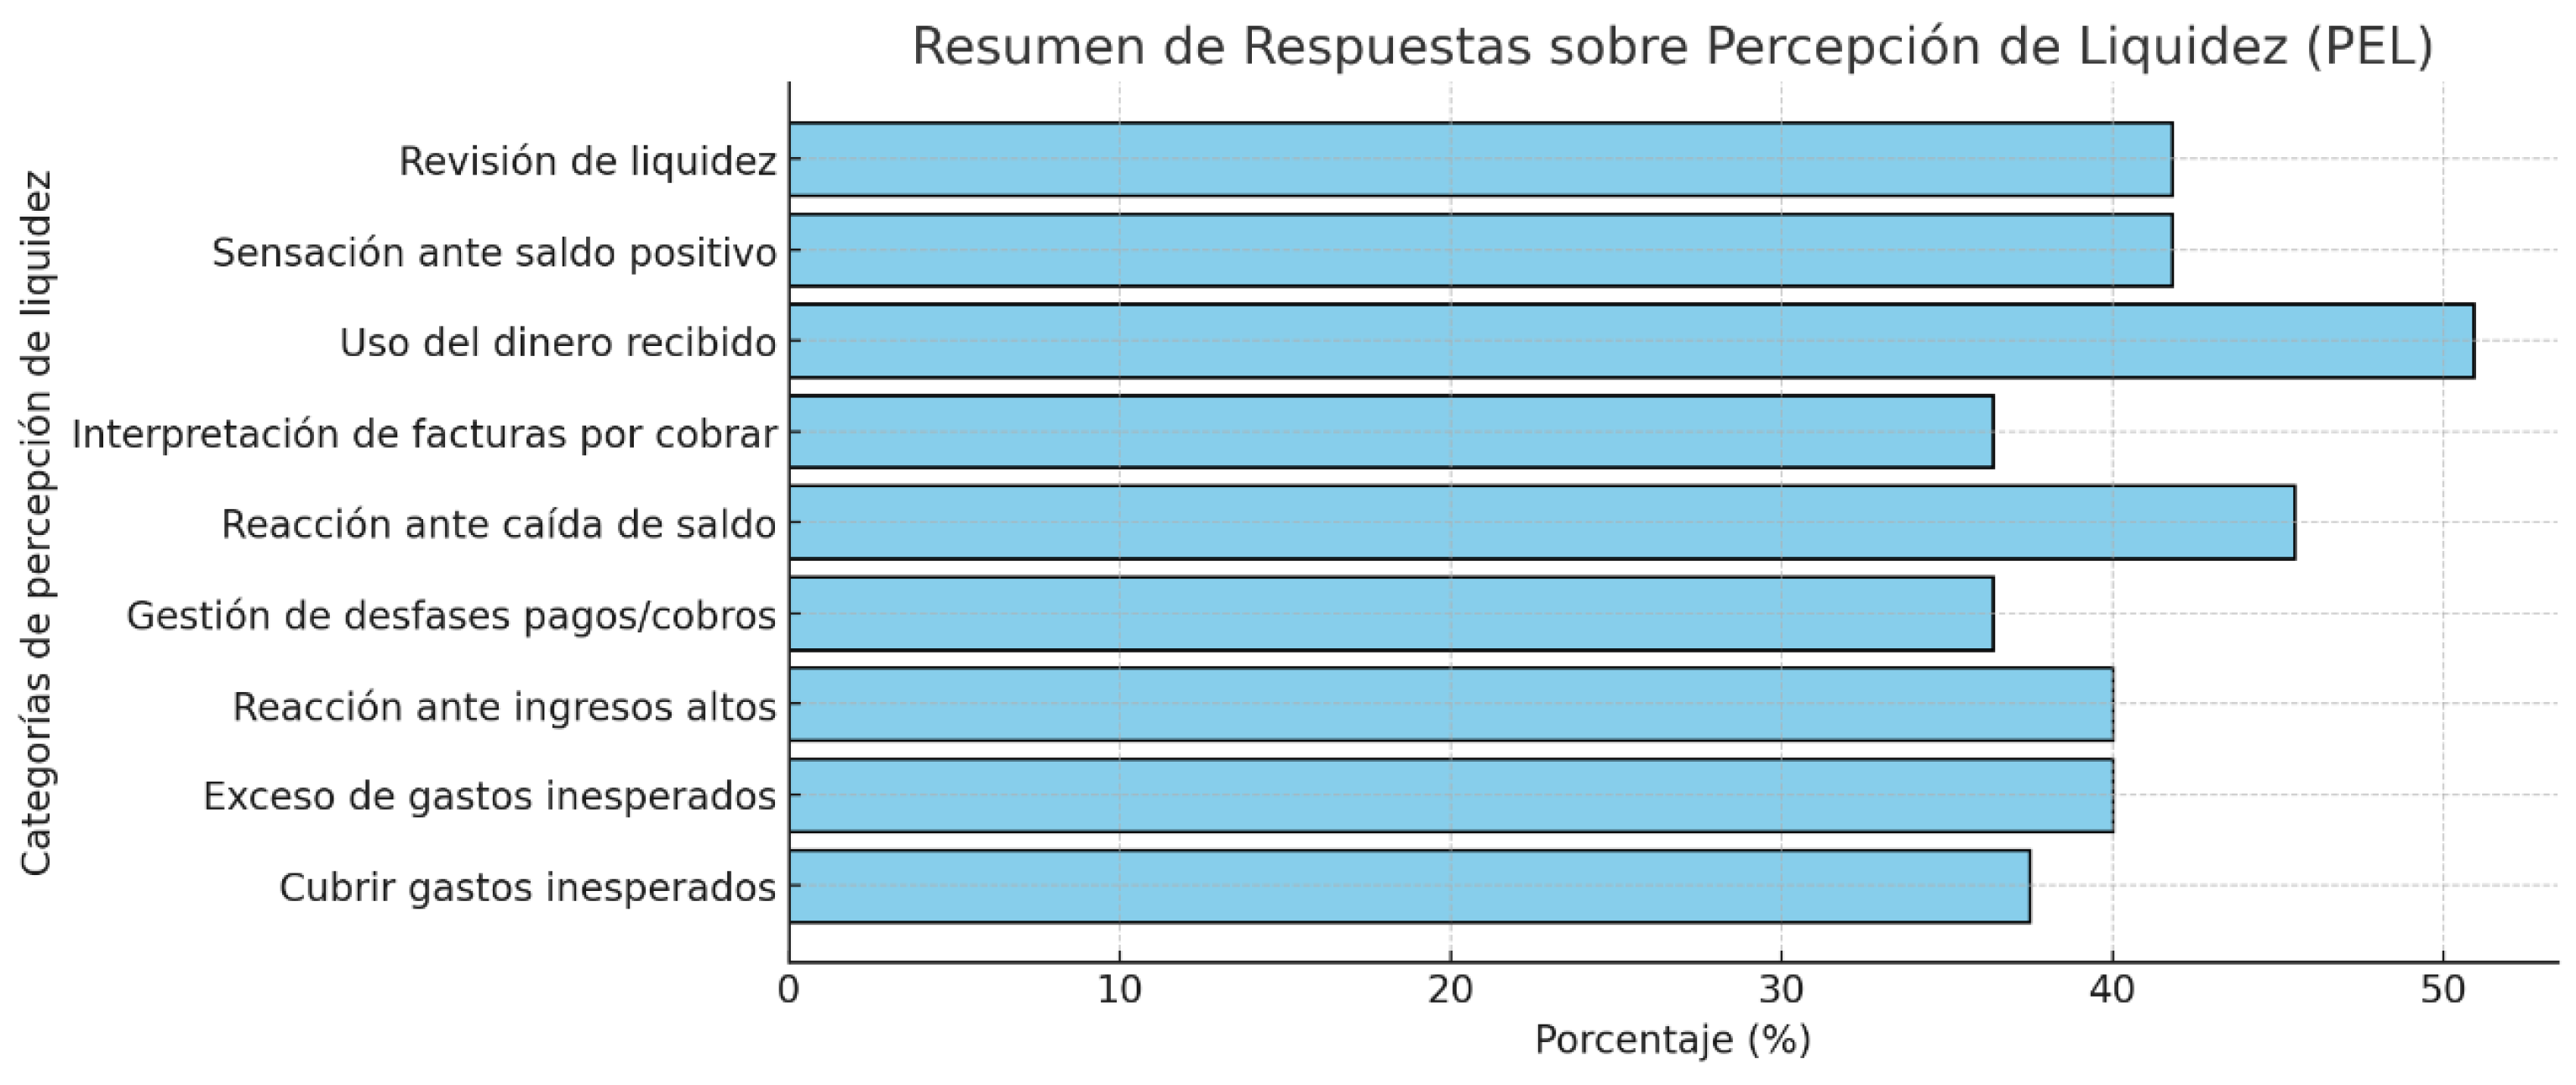
Figure 6.
Summary graph of survey responses (Section 2 – GFR), illustrating differences in financial planning efficiency among firms. Source: authors’ calculations using firm-level data (2024).
Figure 6.
Summary graph of survey responses (Section 2 – GFR), illustrating differences in financial planning efficiency among firms. Source: authors’ calculations using firm-level data (2024).
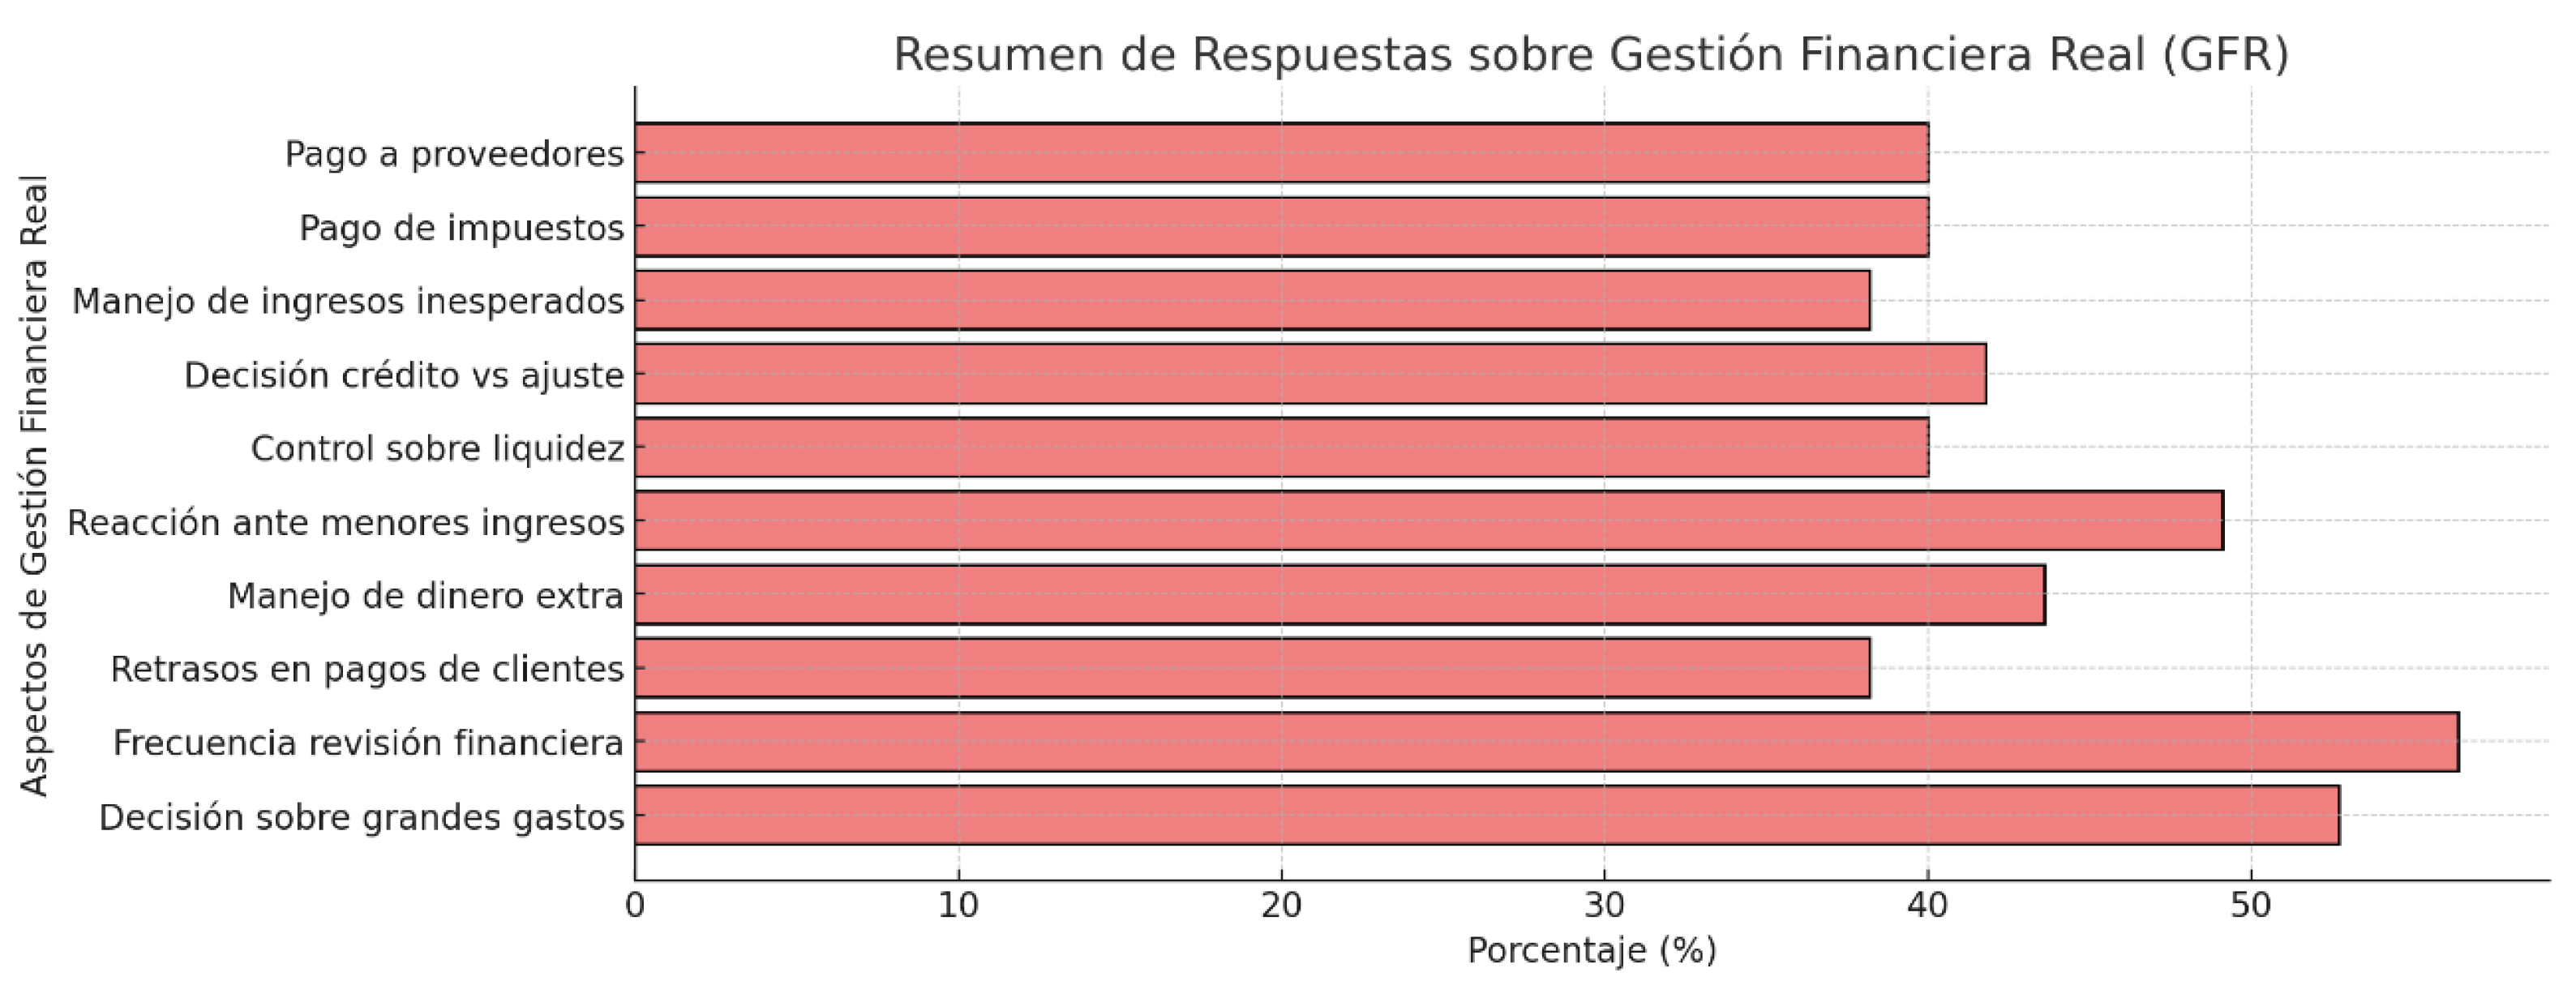
Figure 7.
ICEL distribution chart illustrating the relationship between liquidity confidence (ICEL) and perceived liquidity distortion (PEL) across firms. Source: authors’ calculations using firm-level data (2024).
Figure 7.
ICEL distribution chart illustrating the relationship between liquidity confidence (ICEL) and perceived liquidity distortion (PEL) across firms. Source: authors’ calculations using firm-level data (2024).
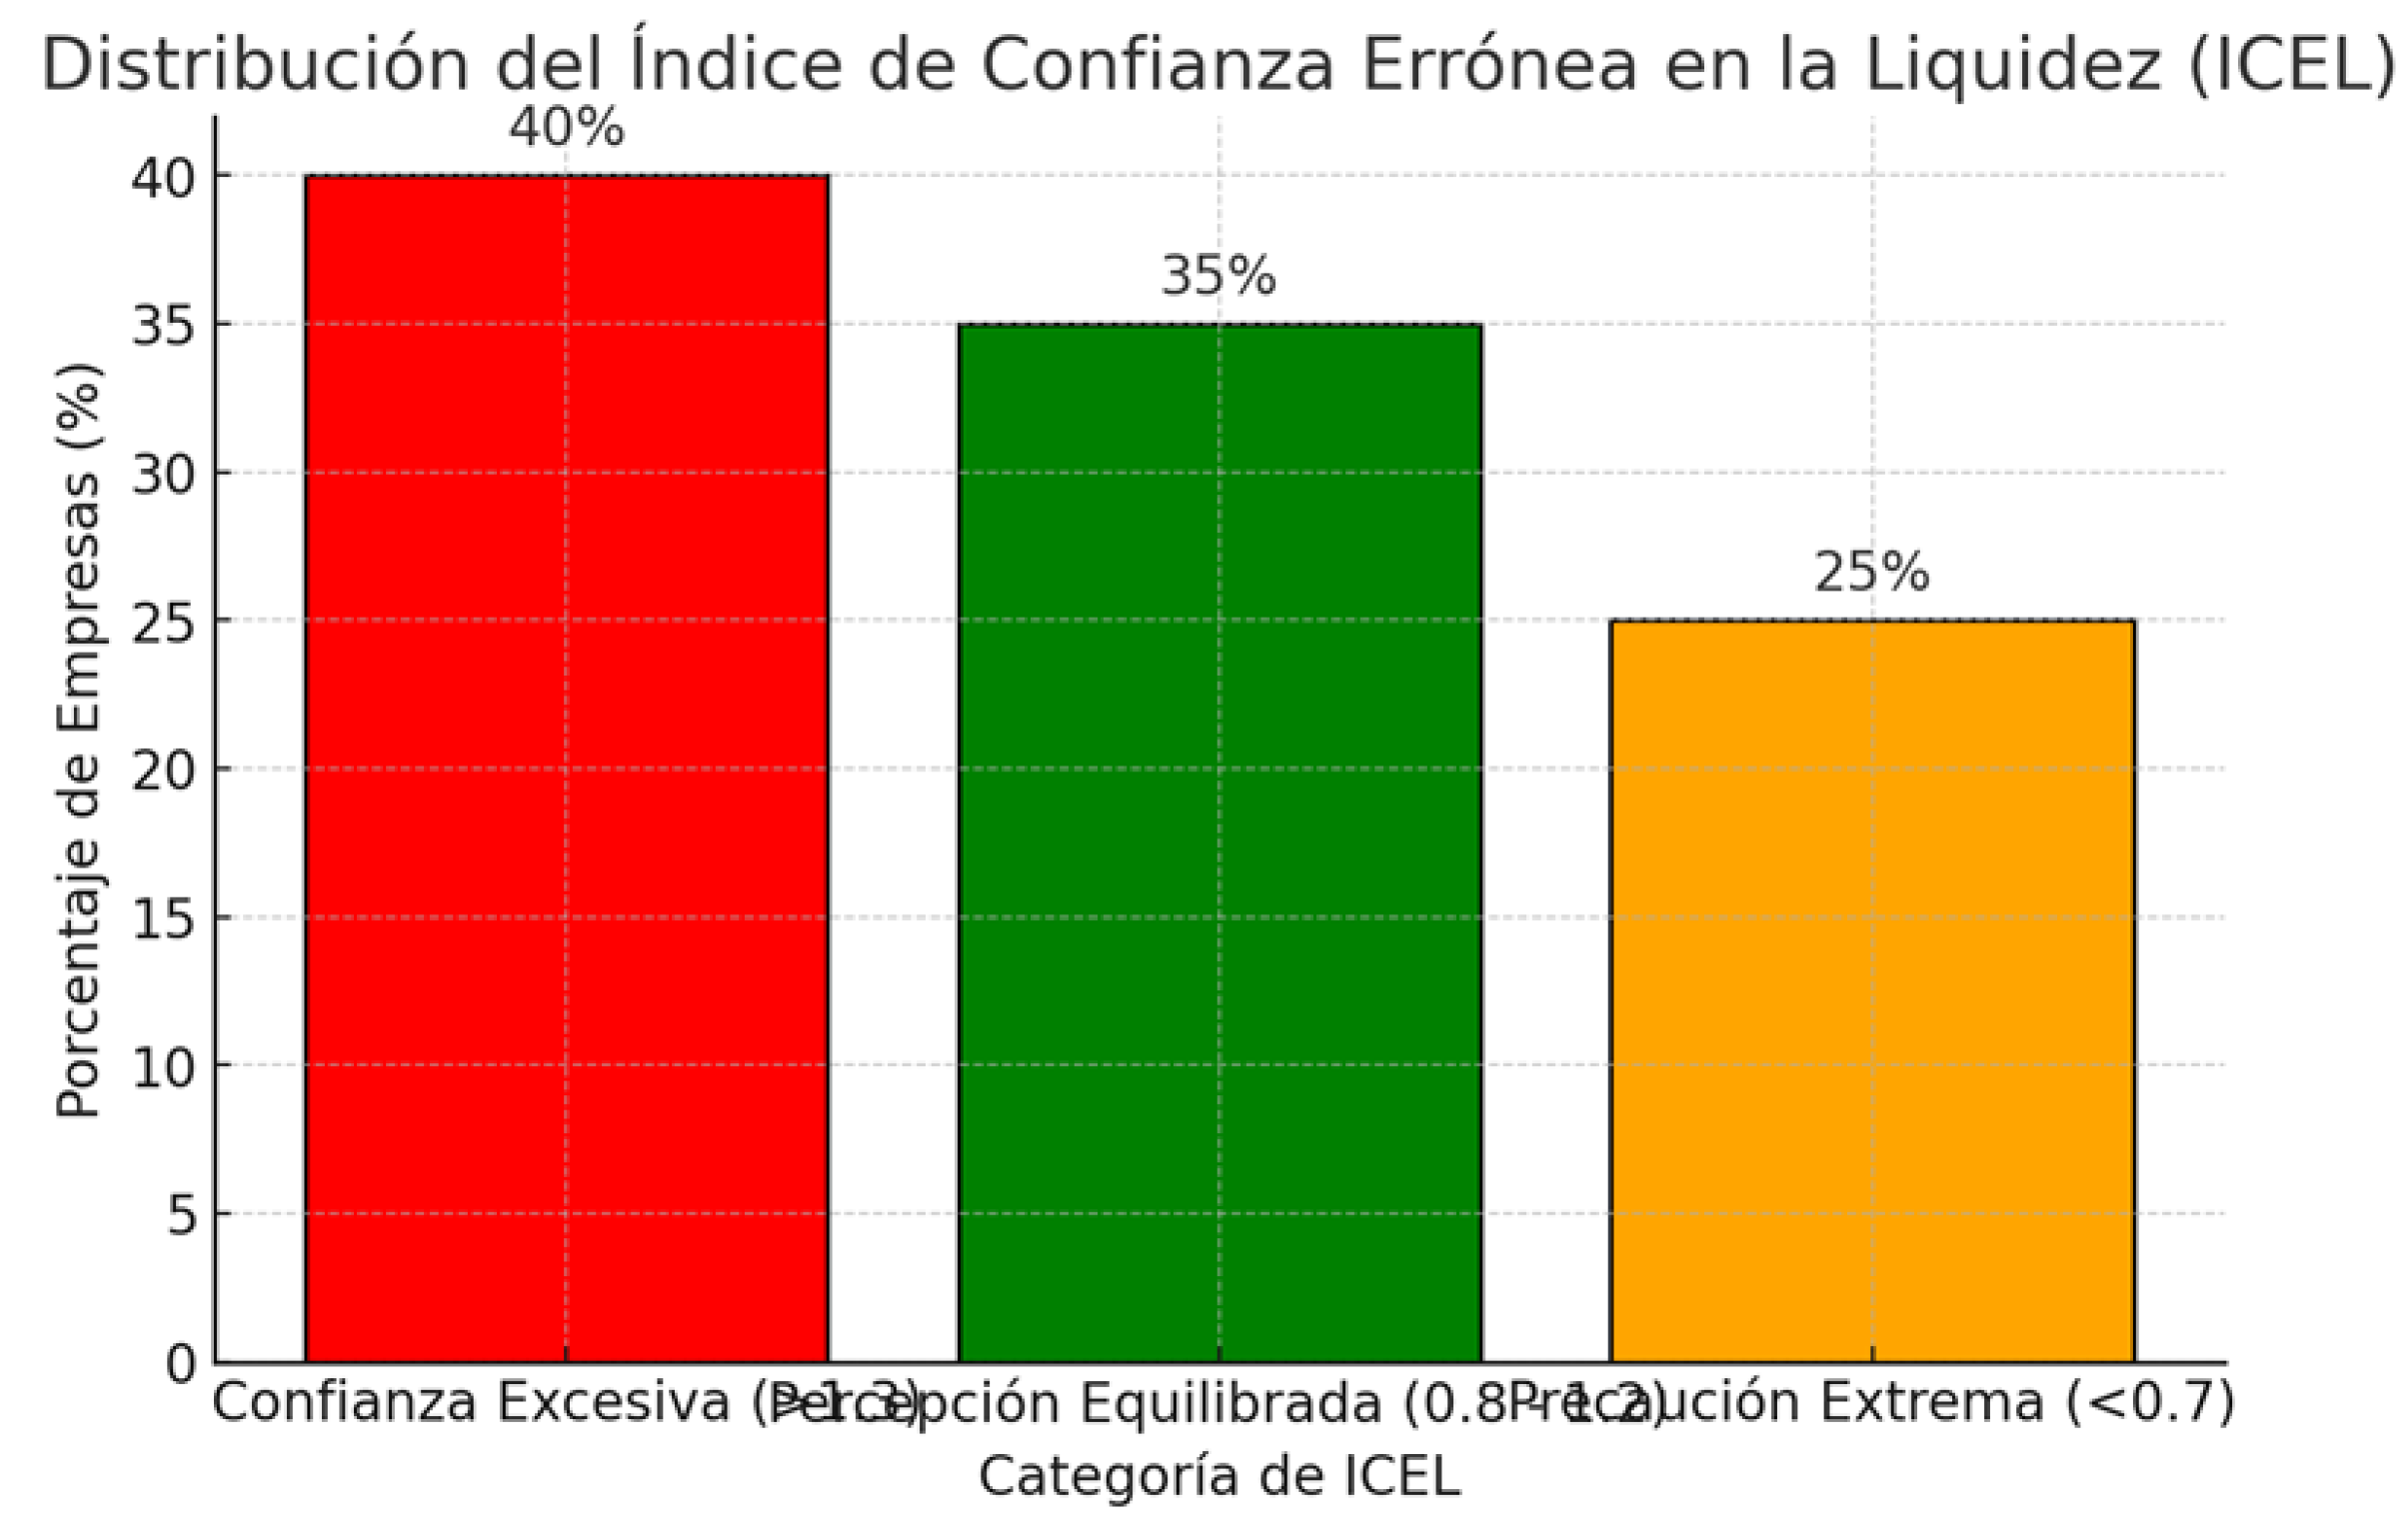
Figure 8.
Histogram of the Liquidity Misperception Index (PEL) showing the frequency distribution of perceived-liquidity distortions across the sample. Source: authors’ calculations using firm-level data (2024).
Figure 8.
Histogram of the Liquidity Misperception Index (PEL) showing the frequency distribution of perceived-liquidity distortions across the sample. Source: authors’ calculations using firm-level data (2024).
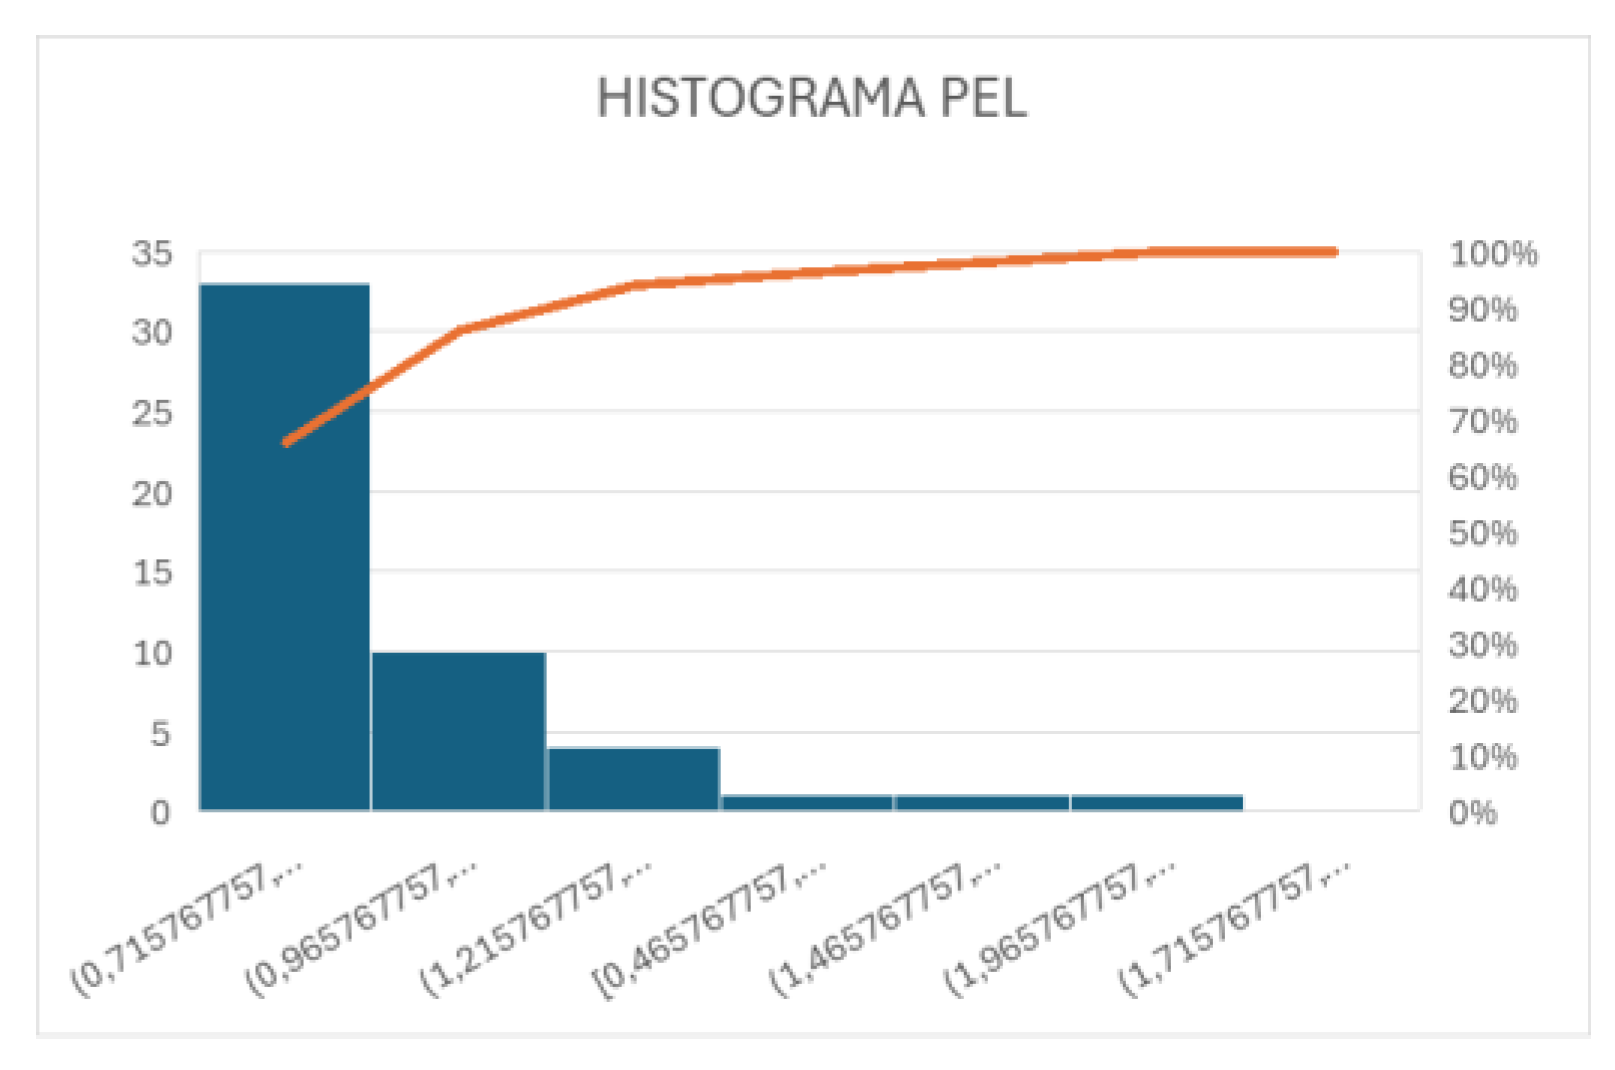
Figure 9.
Histogram of the Index of Mistrust in Liquidity (ICEL), showing the frequency distribution of managerial confidence levels across firms. Source: authors’ calculations using firm-level data (2024).
Figure 9.
Histogram of the Index of Mistrust in Liquidity (ICEL), showing the frequency distribution of managerial confidence levels across firms. Source: authors’ calculations using firm-level data (2024).
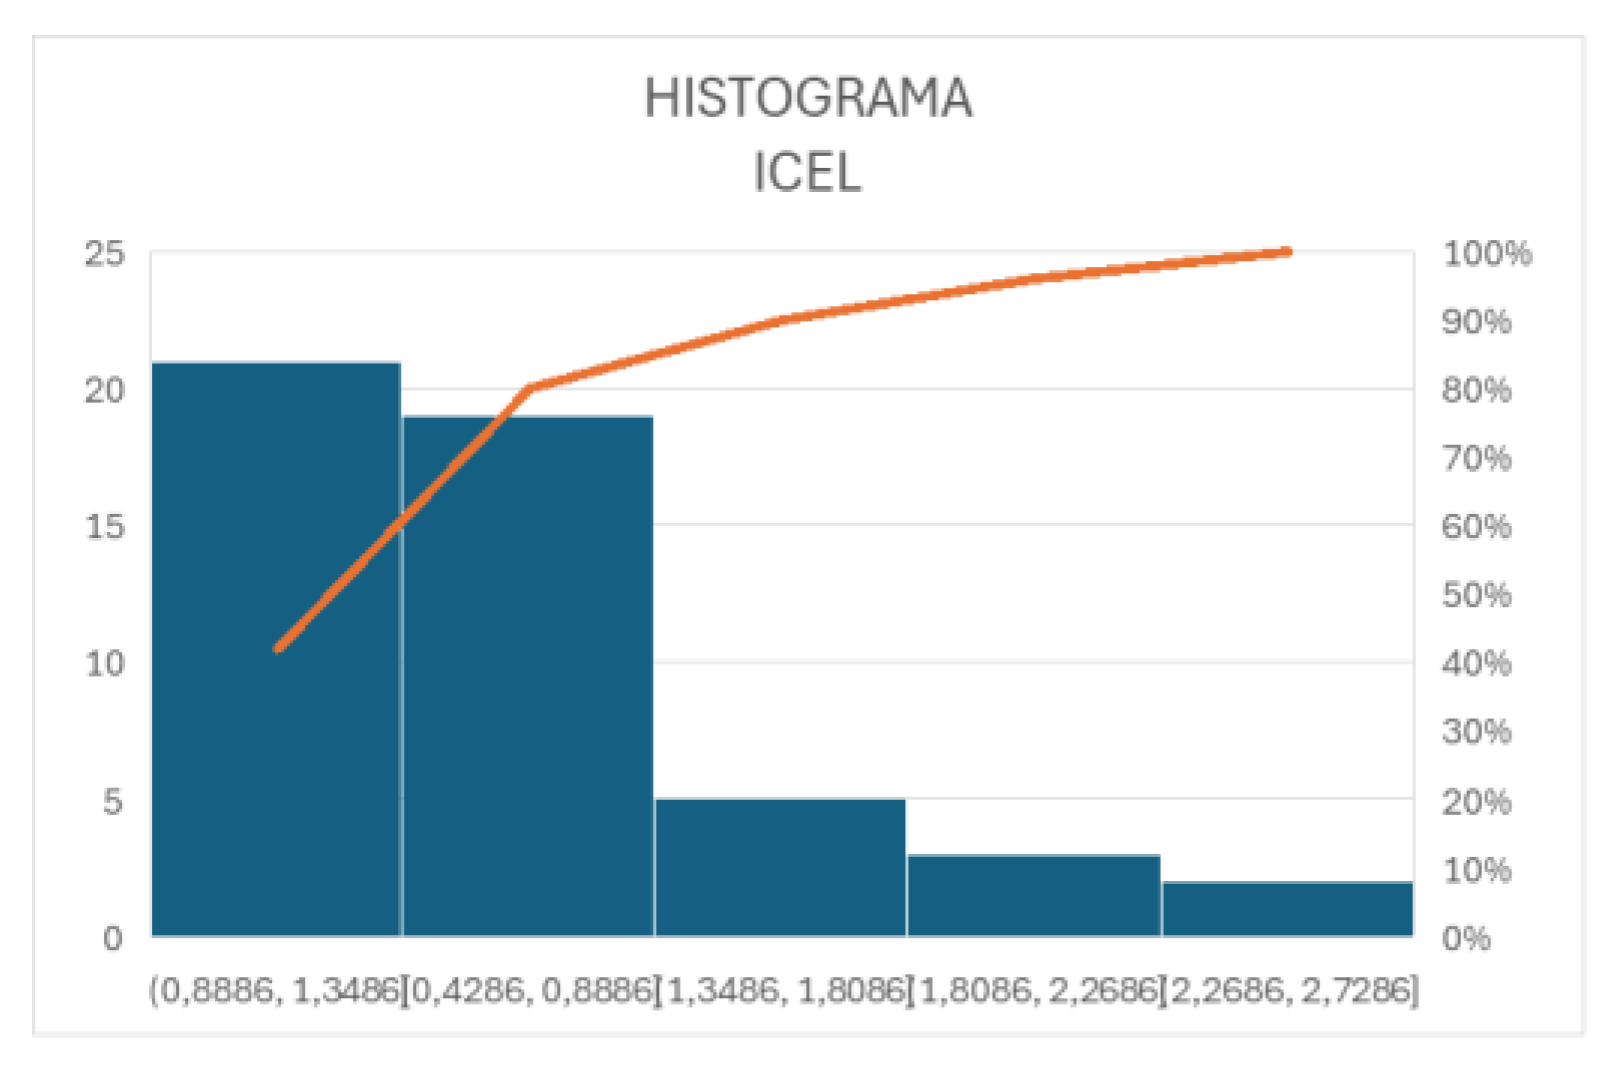
Figure 10.
Boxplot of the Liquidity Misperception Index (PEL), showing the dispersion and outliers in firms’ liquidity perception. Source: authors’ calculations using firm-level data (2024).
Figure 10.
Boxplot of the Liquidity Misperception Index (PEL), showing the dispersion and outliers in firms’ liquidity perception. Source: authors’ calculations using firm-level data (2024).
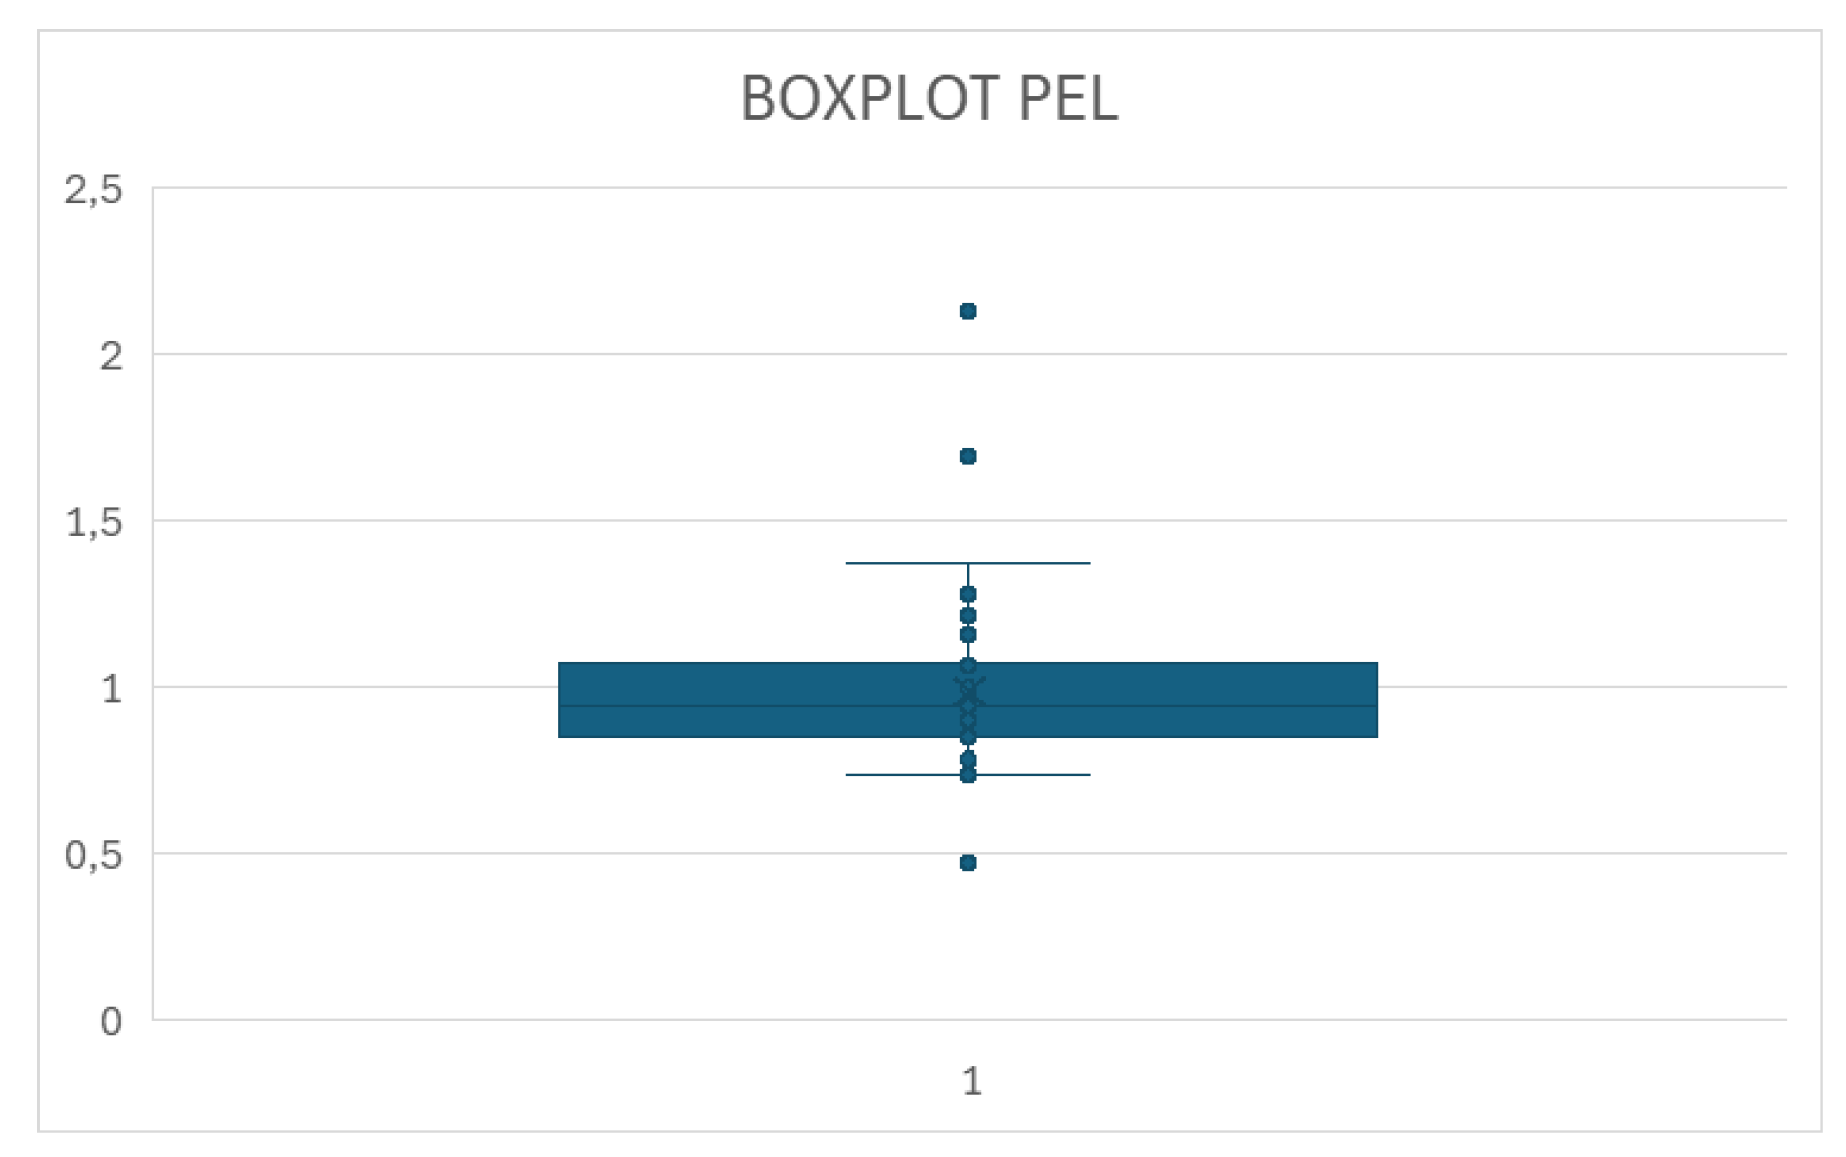
Figure 11.
Boxplot of the Index of Mistrust in Liquidity (ICEL), showing the variability and extreme values in managerial confidence. Source: authors’ calculations using firm-level data (2024).
Figure 11.
Boxplot of the Index of Mistrust in Liquidity (ICEL), showing the variability and extreme values in managerial confidence. Source: authors’ calculations using firm-level data (2024).

Table 1.
Variables collected.
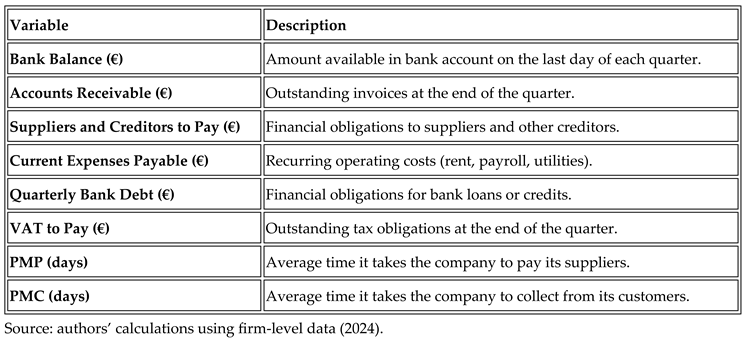 |
Table 2.
Variables analyzed.
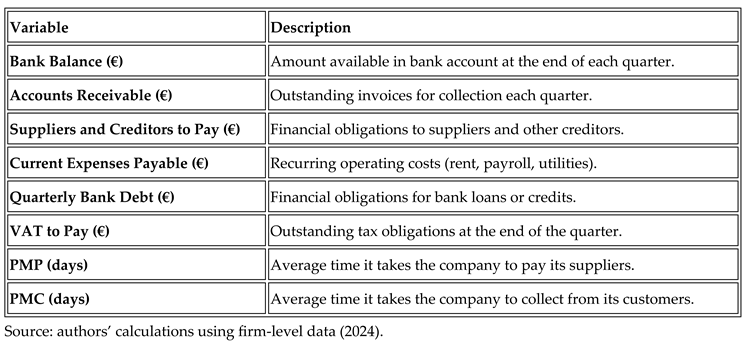 |
Table 3.
Calculated Statistical Measures.
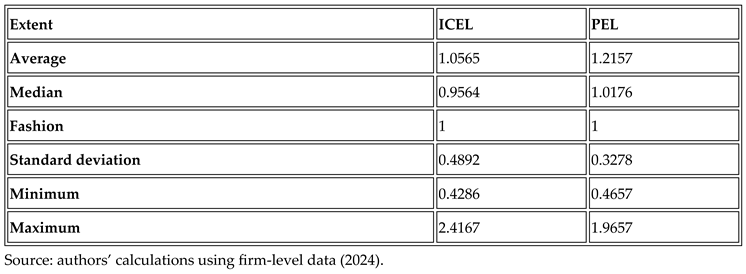 |
Table 4.
Calculated Statistical Measures.
 |
Disclaimer/Publisher’s Note: The statements, opinions and data contained in all publications are solely those of the individual author(s) and contributor(s) and not of MDPI and/or the editor(s). MDPI and/or the editor(s) disclaim responsibility for any injury to people or property resulting from any ideas, methods, instructions or products referred to in the content. |
© 2025 by the authors. Licensee MDPI, Basel, Switzerland. This article is an open access article distributed under the terms and conditions of the Creative Commons Attribution (CC BY) license (http://creativecommons.org/licenses/by/4.0/).
Copyright: This open access article is published under a Creative Commons CC BY 4.0 license, which permit the free download, distribution, and reuse, provided that the author and preprint are cited in any reuse.


