
Submitted:
14 November 2025
Posted:
17 November 2025
You are already at the latest version
Abstract
Tic spectrum disorder (TSD), including Tourette syndrome and chronic tic disorder, is a childhood-onset neurodevelopmental condition with complex genetic and environmental contributions. To investigate environmentally driven mechanisms, we analyzed peripheral blood from eleven monozygotic twin pairs either discordant or concordant for TSD using RNA sequencing and DNA methylation analysis. Differential expression analysis identified a dozen differentially expressed genes between TSD and non TSD individuals, most of which were long non-coding RNAs or pseudogenes. Expression of the small RNA gene RNY1 was significantly associated with tic severity, suggesting involvement of immune-related processes. DNA methylation (DNAm) analysis revealed no genome-wide significant loci but ~30,000 probes with p < 0.05 before multiple testing correction. Expression quantitative trait methylation (eQTM) analysis identified 236 methylation-associated genes. Gene set enrichment analysis demonstrated broad downregulation in TSD individuals of pathways related to translation, RNA processing, and neurobiological functions, with Kyoto Encyclopedia of Genes and Genomes (KEGG) pathways including ribosome, nucleocytoplasmic transport, pluripotency signaling, and nicotine addiction. These results suggest that environmentally influenced epigenetic regulation contributes to TSD pathogenesis through repression of gene expression and dysregulation of immune and neuronal pathways. Despite a small sample size, the monozygotic twin design provides strong control for genetic background and identifies significant differences that contribute to the understanding of the underlying molecular mechanisms of TSD.
Keywords:
DNA methylation
; epigenetics
; gene expression
; GTS
; tic spectrum disorder
; tics
; Tourette syndrome
; RNA sequencing
1. Introduction
Tourette syndrome (TS) is a childhood-onset multifactorial disorder characterized by motor and vocal tics [1,2,3]. Chronic tic disorder (CTD) differs from TS in that patients have either vocal or motor tics. As no clinical or genetic evidence exists to suggest that TS and CTD are distinct disorders, the term tic spectrum (TSD) disorder has been proposed to cover both [4].
Initial symptom presentation typically occurs between the ages of 3 and 8 years, starting with simple motor tics followed by phonic tics. Symptom severity commonly peaks at ages 8 to 12 years, and by adulthood most patients will experience symptom attenuation or even complete remission [1,3]. In a recent longitudinal follow-up study of 314 individuals with TSD, only 18% of patients experienced a complete remission after the age of 16 years, 60% still experienced some mild to moderate tics, and the remaining 23% had moderate to severe tics [5]. The reported prevalence of TSD varies from 0.1-6% with a male-to-female ratio of 4:1 [3,6]. Most individuals with TSD have comorbidities, of which the most frequent are obsessive-compulsive disorder (OCD) and attention-deficit hyperactivity disorder (ADHD), with as many as 70% of individuals affected by TSD having either disorder. Other common comorbidities include autism spectrum disorder (ASD), anxiety, depression, sleep disorders, migraine, and self-injurious behavior [1,3].
Large population-based and genome-wide association studies have suggested a heritability of TSD between 0.21-0.77 [7,8], with most of the genetic heritability explained by evolutionarily conserved SNPs [8]. It is largely accepted that TSD has a multifactorial etiology where genetic and environmental factors interact leading to neurobiological vulnerability [9]. Despite research advances, many gaps in knowledge about TSD etiology remain, including but not limited to understanding the environmental contribution to the development of the disorder. In this study, we investigated gene expression and DNA methylation data from eleven monozygotic twins either discordant or concordant for TSD to assess how environmental components contribute to altered gene regulation and the development of the disorder.
2. Materials and Methods
2.1. Monozygotic Twin TSD Cohort
Cross-linking of The Danish Twin Register and The Danish Psychiatric Central Register with subsequent genetic testing and interview-based diagnosis using DSM-5 led to the identification of fourteen monozygotic twin pairs where at least one twin had TSD, as previously described [10], resulting in a final cohort consisting of five twins discordant for TSD, four twins concordant for TSD, and two asymptomatic twins (Table S1 and Figure S1).
2.2. RNA Sequencing
Total RNA was isolated from PAXgene tubes. RNA sequencing was done using TruSeq Stranded Total RNA Library Prep Kit (Illumina, San Diego, CA, USA) and libraries were paired-end sequenced (2x125 bp) on a HiSeq 2500 sequencing system (Illumina).
Reads were mapped to GRCh38.p13 (GCA_000001405.28) using STAR [11]. The resulting count data served as input for downstream pre-processing and differential expression analysis using the edgeR [12] and limma [13] R packages. Raw counts were transformed into counts per million (CPM) and log-transformed (LCPM), genes with low expression were filtered using the filterByExpr function, and samples were normalized using the calcNormFactors function from the edgeR package with default settings. Heteroscedasticity was accounted for using voom from limma.
2.3. DNA Methylation
Genomic DNA was extracted from peripheral blood and subsequently subjected to bisulfite treatment using standard protocols. Bisulfite-converted DNA was analyzed on Infinium MethlationEPIC v1 arrays (Illumina) according to the manufacturer’s instructions. The data was analyzed using the R package minfi [14]. Exclusion criteria for probes were detection p-values > 0.01, SNPs at CpG sites, known cross-reactivity, and location on sex chromosomes. Samples were normalized using a stratified quantile normalization. Counts were converted to β values (β = M/M + U) and M-values (log2(M/U)) where M is the methylated intensity and U is the unmethylated intensity. β values were used for methylation quantification, and M-values were used for statistical analyses.
2.4. Identification of Differentially Expressed Genes and Differentially Methylated Probes
For both gene expression (RNA sequencing) and DNA methylation data, covariates were identified using principal component analysis (PCA), and quantile-quantile plots were used to assess differences between TSD and non-TSD individuals as well as to assess deviations from expected data trends and thus potential needs for model adjustment. To adjust for unwanted variation in the data such as cell type composition, batch effects, and library size, surrogate variables were identified and estimated using the sva R package [15].
Linear models were fitted using limma to assess differences between TSD and non-TSD individuals and to identify associations with Yale Global Tic Severity Scale (YGTSS) scores, incorporating monozygotic twin pair and surrogate variables as covariates. Correction for multiple testing was performed using the Benjamini-Hochberg method [16]. Two models were fitted for RNA-seq data; one compared TSD cases and controls, and the other tested the association of gene expression levels with YGTSS scores for all samples with YGTSS scores > 0, including concordant twins and asymptomatic controls. For the DNA methylation data, a single model was fitted to compare TSD cases and controls.
2.5. Expression Quantitative Trait Methylation (eQTM)
Expression quantitative trait methylation (eQTM) analysis was performed using the R package MatrixEQTL [17]. Gene expression input from RNA sequencing was represented as log2-transformed CPM values with an unadjusted p-value threshold of < 0.05. For DNA methylation, M-values for probes with unadjusted p-values < 0.005 were used. The analysis used a simple t-test and a linear (additive) model adjusted for monozygotic twin pair status. The p-value threshold for gene-CpG pairs was set to 0.05, and the analysis was run in cis with a maximum distance of 1x10⁶ base pairs.
2.6. Gene Set Enrichment Analysis (GSEA)
Gene set enrichment analysis (GSEA) was conducted on the results from the differential expression analysis using the clusterProfiler R package [18] to identify Gene Ontology (GO) and Kyoto Encyclopedia of Genes and Genomes (KEGG) terms associated with TSD. Log2-transformed fold changes was used as input. The geneSet size range was set to 3-800, all subontologies were included, p-value threshold was set to 0.05, correction for multiple testing was carried out using the Benjamini-Hochberg method, the seed parameter was set to TRUE, and the fast gene enrichment analysis was applied [19].
3. Results
3.1. Data Exploration and Statistical Model Generation
Principal component analyses (PCA) were carried out to explore technical variability in the RNA sequencing and DNA methylation data (Figures S2A and S3A), and quantile-quantile (Q-Q) plots were used to assess how the results of the linear models matched the expected null distribution and to identify biases in the results (Figures S2B and S3B). When adjusted for surrogate variables, a close approximation of linearity was achieved in the RNA sequencing data results, with p-values deviating from null only at the high end of the distribution, indicating true positive results (Figure S2B). The DNA methylation data showed a linear but deflated distribution of p-values which was partially corrected after surrogate variable adjustment (Figure S3B).
3.2. Differential Expression and Methylation Analyses
Seven genes were found to be differentially expressed in TSD compared to controls (FDR < 0.05, Figure 1A and Table S2). The fold changes of the seven genes ranged between a threefold to an eightfold change in expression (Table S2). When a less stringent FDR was applied (< 0.2), a total of 15 DEGs was detected (Table S2). Gene annotation for the 15 genes with FDR < 0.2 is shown in Table S3. None of the DNA methylation probes reached genome-wide significance (Figure 1A), however 29,868 probes had p-values < 0.05, and 1,981 had p-values < 0.005. The expression of one gene, RNY1, was found to be significantly associated with YGTSS score (FDR < 0.05, Table S4).
3.3. Expression Quantitative Trait Methylation (eQTM) Analysis
To identify methylation-regulated DEGs in TSD, an expression quantitative trait methylation (eQTM) analysis was performed based on LCPM and M-values. A total of 1,201 genes (unadjusted p < 0.05) and 1,981 probes (unadjusted p < 0.005) were included in the analysis. The eQTM analysis resulted in the identification of 236 potentially methylation-regulated genes with p-values < 0.05 (Table S6). The top 20 eQTMs have been characterized in Table S7. Gene expression and DNA methylation levels for the top 12 most significant eQTMs are visualized in Figure 1B. All eQTMs plotted had an unadjusted p-value < 2.5e-4. In all cases except one, the correlation between gene expression and DNA methylation was observed in all samples, and the average methylation changes ranged from 1.8% to 10.0% (Figure 1B).
3.4. Gene Set Enrichment Analysis (GSEA)
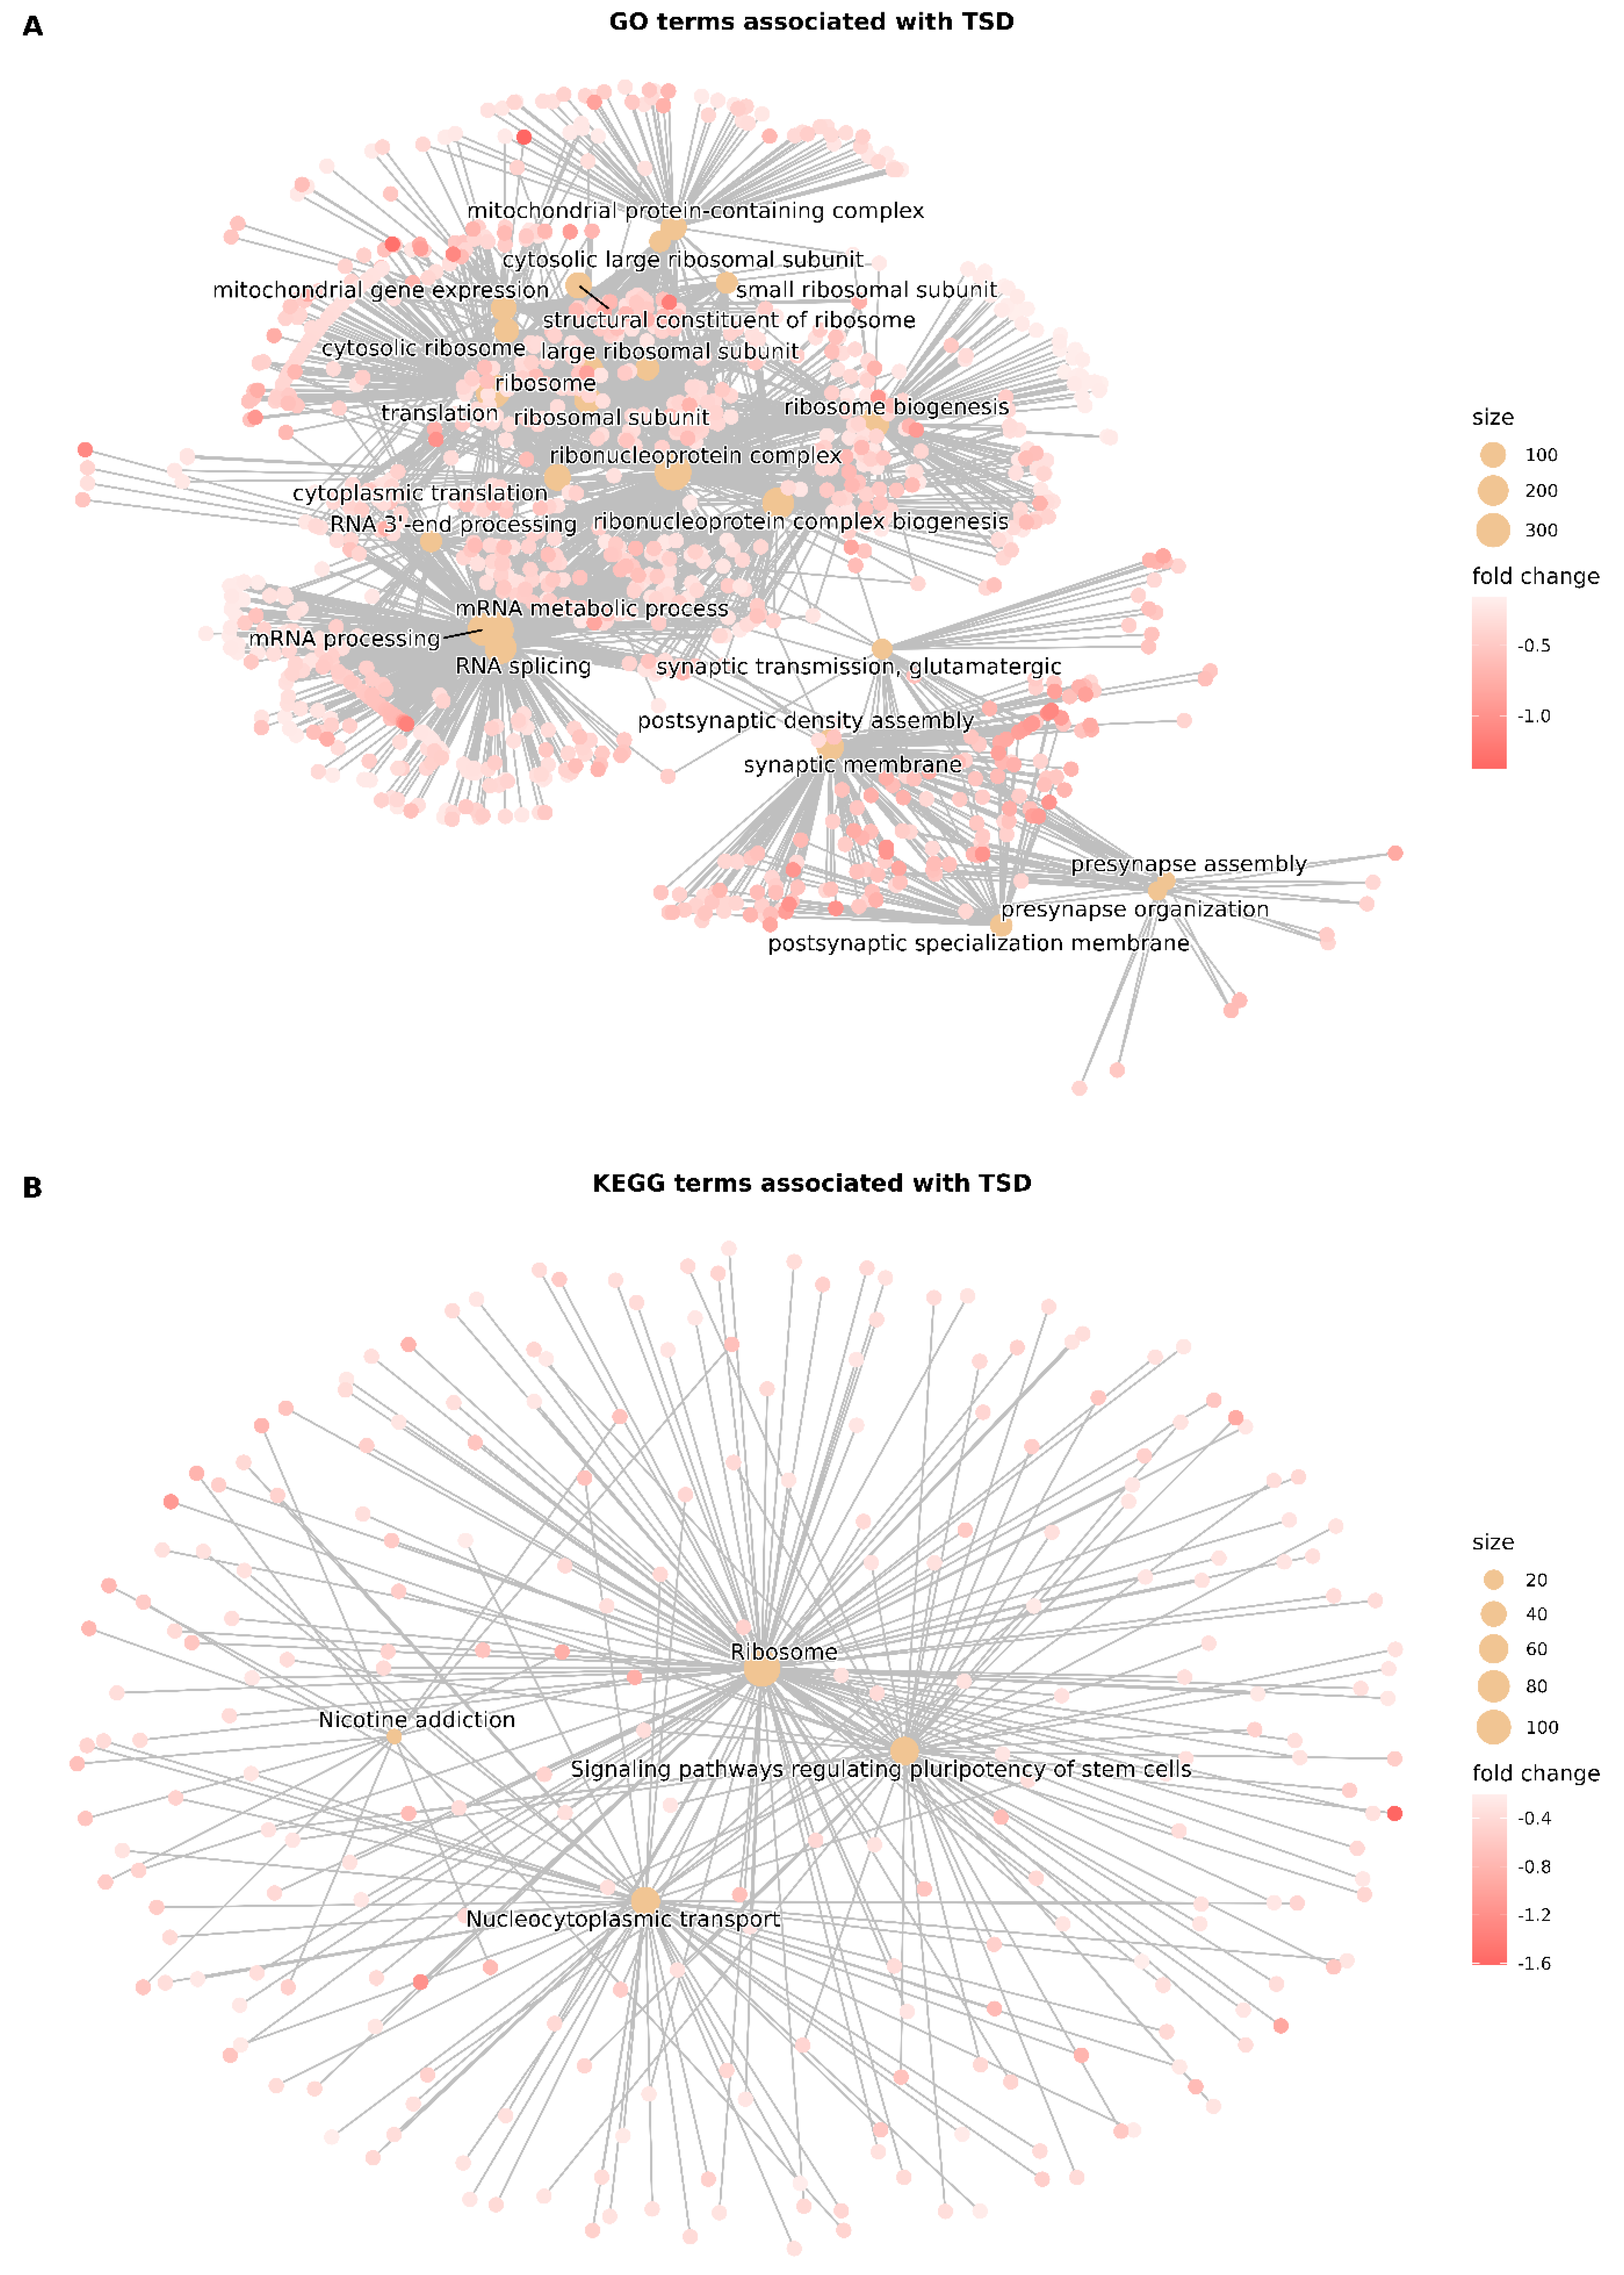
Gene set enrichment analysis (GSEA) was conducted to identify differentially regulated ontologies and pathways in TSD compared to non-TSD individuals. We identified 24 GO terms associated with TSD, of which 75% were pathways related to translation and mRNA processing while 25% were neurological GO terms (Table S8). As shown in the category net plot in Figure 2A, all the significantly altered pathways were downregulated, indicating that the effect on gene expression for TSD is mainly repressive. As for KEGG terms, four terms associate significantly with TSD (Figure 2B) – ribosome, nicotine addiction, nucleocytoplasmic transport, and signaling pathways regulating pluripotency of stem cells. If correction for multiple testing is omitted, 26 KEGG terms are identified (Table S9).
4. Discussion
In the present study, we included 11 twins (five twins discordant for TSD, four twins concordant for TSD, and two asymptomatic twins) and analyzed gene expression and DNA methylation data from five monozygotic twin pairs discordant for TSD. Studying discordant monozygotic twins allows us to investigate environmental or other non-genetic factors underlying disease susceptibility, as these individuals share nearly identical genetic backgrounds. We identified seven DEGs with FDR < 5% and 15 DEGs with FDR < 20% (Figure 1A, Table S2). Of the 15 DEGs, 11 were lncRNAs and pseudogenes, and most of them were at the time of writing poorly characterized (Table S3) [20,21,22]. To complement the TSD/non-TSD analysis, we investigated associations between gene expression and YGTSS score in 13 individuals affected by TSD. Of the top 20 DEGs associated with YGTSS score, 10 genes were involved in regulating immune responses [23,24,25,26,27,28,29,30,31,32,33,34,35,36,37,38,39], and four could be linked to neurological phenotypes [40,41,42,43,44]. Annotation for the YGTSS-associated DEGs can be found in Table S5 [45,46,47,48,49,50,51,52,53,54,55,56,57,58,59,60,61,62,63,64,65,66,67]. Immune abnormalities have been suggested in the pathogenesis of several movement and psychiatric disorders [68]. Association between immune-based mechanisms and tic exacerbation has been suggested [69]. Furthermore, an association between TSD and autoimmune disorders has previously been reported [3,70,71], and first-degree relatives to TSD patients have been shown to have an increased prevalence of autoimmune disorders such as systemic lupus erythematous (SLE) [70]. SLE patients are also 10-15 times more likely to have OCD, a common comorbidity of TSD [71]. The only gene that achieved genome-wide significance in the YGTSS analysis was RNY1, where an inverse relationship between RNY1 expression and YGTSS score was observed. RNY1 is a regulator of the protein Ro60, which is a common autoantigen in both SLE and Sjögren’s syndrome [23]. The earliest detectable autoantibodies in SLE are against Ro60, and autoantibodies precede symptoms, making it a clinically important biomarker [23]. Ro60 seems to have a protective effect against SLE, as Ro60 knockout mice models develop an SLE-like syndrome (Xue et al., 2003). As RNY1 assists Ro60 in its function, depletion of RNY1 might attenuate the protective effect of Ro60 and be an indication of autoimmunity. Further studies with larger cohorts are necessary to validate this hypothesis. Among the top twenty most significant DEGs associated with YGTSS we identified RNU4-2, BATF2, DUX4L26, and MIR4718, all which have been associated with neurodevelopmental or neurodegenerative phenotypes [73,74,75,76]. The DEG RP42 Homolog (RP42) Pseudogene (RP1-121G13.3) has been linked to ADHD, a common comorbidity for TSD patients [77] (Supplementary Table S7).
To identify DEGs regulated in cis by DNA methylation, we performed an eQTM analysis, from which we identified 12 cis eQTMs (Figure 1B). The most significant expression-methylation association was between chymotrypsin C (CTRC) and cg24014317. Chymotrypsin C is a protease with chymotrypsin-like specificity. The enzyme is also involved in calcium homeostasis and regulation of digestive enzymes such as trypsin and some carboxypeptidases [78,79]. Like its isozyme chymotrypsin, it is highly and almost exclusively expressed in the pancreas. Studies have shown that 60-65% of individuals with ASD have low levels of chymotrypsin, as well as low levels of circulating amino acids, suggesting that increased protease activity might be beneficial [80,81,82]. Pancreatic replacement therapy has recently been investigated as a treatment for ASD [83].
Finally, we identified dysregulated gene ontologies and pathways through gene set enrichment analysis (Figure 2). Most of the detected GO terms were related to translation and mRNA processing, with a select few being related to neurological processes, as one might expect from a neurological disorder (Supplementary Table S8). The identified KEGG terms were related to translation, general cell biology, stem cells, and addiction (Supplementary Table S9). The latter may reflect the ADHD comorbidity, as between 20-50% of individuals with ADHD have been reported to have a substance-use disorder [84,85]. Interestingly, all genes belonging to the significantly detected GO or KEGG terms were downregulated in TSD patients relative to controls, suggesting an overall gene repressive effect in the disorder.
A limitation of the present study was its small sample size, although the monozygotic twin setup was designed to increase the strength by limiting non-disease specific genetic variation and to allow for the identification of causative factors rooted in environmentally induced changes in gene expression and DNA methylation. Our study design thus ensured almost identical genetic background, such that significant changes in gene expression and/or DNA methylation can be attributed to non-genetic contributions to the pathology.
Supplementary Materials
The following supporting information can be downloaded at the website of this paper posted on Preprints.org. Table S1. Metadata table containing patient and sample information. Table S2. Differential expression analysis results table containing analysis results for the 26,618 genes tested for the discordant (TSD vs. non-TSD) monozygotic twins. Table S3. Differential expression analysis annotation table containing gene annotation information on the top 15 most significantly dysregulated genes (TSD vs. non-TSD). All information has been drawn from www.genecards.org and www.gtexportal.org unless a direct link to a different source has been provided in the table. Table S4. Differential expression analysis results table containing analysis results for the 27,262 genes tested for the YGTSS analysis. Table S5. Differential expression analysis annotation table containing gene annotation information on the top 20 most YGTSS-associated genes. All information has been drawn from www.genecards.org and www.gtexportal.org unless a direct link to a different source has been provided in the table. Table S6. Expression quantitative trait loci (eQTL) results table containing analysis results for the 236 gene-probe associations with unadjusted p-values below 0.05. Table S7. Expression quantitative trait loci (eQTL) annotation table containing gene annotation information on the top 20 most significant associations. All information has been drawn from www.genecards.org and www.gtexportal.org unless a direct link to a different source has been provided in the table. Table S8. Gene set enrichment analysis (GSEA) table containing analysis results for the 1138 GO terms with unadjusted p-values below 0.05. The results are based on a single iteration with seed parameter set to TRUE in the gseGO() function. Table S9. Gene set enrichment analysis (GSEA) table containing analysis results for the 29 KEGG terms with unadjusted p-values below 0.05. The results are based on a single iteration with seed parameter set to TRUE in the gseKEGG() function. Figure S1. Study design. 22 monozygotic twins participated in this study, including five pairs of twins discordant for TSD, four pairs concordant for TSD, and two asymptomatic pairs. Figure S2. Quality control and data exploration for the RNA sequencing data. A) Principal component analysis revealing trends in the data. In the top plot, the samples are labelled by sex (M = male, F = female) and colored by library size. In the bottom plot, they are labelled by twin set (Table S1) and colored by TSD status. PC1 accounts for 55% of the total variance and is mainly driven by differences in library size. The second principal component accounts for 14% of the total variance and seems to be driven solely by sex differences. B) Quantile-quantile plots of p-values from linear models with different adjustments – unadjusted (left) and adjusted for surrogate variables (right). The results from the unadjusted model deviated from linearity. A close approximation of linearity without p-value deflation was achieved when the model was adjusted for surrogate variables where unwanted sources of variation was removed to amplify target differences (TSD vs. non-TSD). Figure S3. Quality control and data exploration for the DNA methylation array data. A) Principal component analysis revealing trends in the data. In the left plot, the samples are labelled by batch and colored by sex. In the right plot, they are labelled by twin set and colored by TSD status. PC1 accounts for 27% of the total variance and appears to be driven by batch effect, with sex differences seemingly being responsible for the 24% variance represented by PC2. B) Quantile-quantile plots of p-values for different adjustment settings – unadjusted (left) and adjusted for surrogate variables (right). Due to the degrees of freedom requirement of linear models and the low sample size of the present study, it was not possible to include batch effect as a categorical covariate in the model. Instead, a surrogate variable analysis was conducted to correct for the batch effect and any other unwanted sources of variation. The quantile-quantile plots are very linear with a slight p-value deflation, possibly because the differences between monozygotic twins are smaller than one would expect at random, and the effect size of TSD is mall. This deflation is slightly corrected after surrogate variable adjustment.
Author Contributions
Conceptualization: Z.T., Methodology: M.H, Q.T., and Z.T., Data curation and preparation: N.M.D., F.O.B. and M.H., Data analysis: J.D., Visualization: J.D., Supervision: M.H., Q.T., and Z.T., Writing – original draft: J.D., Writing – reviewing: All authors.
Funding
This research was funded by Lundbeck Fonden (R100-2011-9332, to Z.T.), and Region Hovedstadens Forskningsfond til Sundhedsforskning (2024-0059, to M.H.).
Informed Consent Statement
Informed consent was obtained from the family.
Ethics Statement
The present study has been conducted in accordance with the tenets of the Declaration of Helsinki and was approved by the ethical committee of the Capital Region of Denmark (H-3-2014-081).
Data Availability Statement
The raw data generated in this study cannot be made public due to ethical and legal considerations.
Acknowledgments
We would like to thank the families for their participation in this study.
Conflicts of Interest
The authors declare no conflicts of interest.
Abbreviations
| Abbreviation | Meaning |
| ADHD | Attention-deficit hyperactivity disorder |
| ASD | Autism spectrum disorder |
| CPM | Counts per million |
| CTD | Chronic tic disorder |
| DEG | Differentially expressed gene |
| DMP | Differentially methylated probe |
| DNAm | DNA methylation |
| DSM-5 | Diagnostic and Statistical Manual of Mental Disorders, Fifth Edition |
| eQTM | Expression quantitative trait methylation |
| FDR | False discovery rate |
| GO | Gene Ontology |
| GSEA | Gene set enrichment analysis |
| GTS | Gilles de la Tourette syndrome |
| KEGG | Kyoto Encyclopedia of Gens and Genomes |
| LCPM | Log-transformed counts per million |
| OCD | Obsessive-compulsive disorder |
| PCA | Principal component analysis |
| Q-Q | Quantile-quantile |
| SNP | Single-nucleotide polymorphism |
| TS | Tourette syndrome |
| TSD | Tic spectrum disorder |
| YGTSS | Yale Global Tic Severity Scale |
References
- Johnson, K.A.; Worbe, Y.; Foote, K.D.; Butson, C.R.; Gunduz, A.; Okun, M.S. Tourette Syndrome: Clinical Features, Pathophysiology, and Treatment. Lancet Neurol 2023, 22, 147–158. [Google Scholar] [CrossRef] [PubMed]
- Martino, D.; Dale, R.C.; Gilbert, D.L.; Giovannoni, G.; Leckman, J.F. Immunopathogenic Mechanisms in Tourette Syndrome: A Critical Review. Movement Disorders 2009, 24, 1267–1279. [Google Scholar] [CrossRef]
- Hsu, C.-J.; Wong, L.-C.; Lee, W.-T. Immunological Dysfunction in Tourette Syndrome and Related Disorders. Int J Mol Sci 2021, 22, 853. [Google Scholar] [CrossRef]
- Müller-Vahl, K.R.; Sambrani, T.; Jakubovski, E. Tic Disorders Revisited: Introduction of the Term “Tic Spectrum Disorders. ” Eur Child Adolesc Psychiatry 2019, 28, 1129–1135. [Google Scholar] [CrossRef]
- Groth, C.; Mol Debes, N.; Rask, C.U.; Lange, T.; Skov, L. Course of Tourette Syndrome and Comorbidities in a Large Prospective Clinical Study. J Am Acad Child Adolesc Psychiatry 2017, 56, 304–312. [Google Scholar] [CrossRef] [PubMed]
- Garcia-Delgar, B.; Servera, M.; Coffey, B.J.; Lázaro, L.; Openneer, T.; Benaroya-Milshtein, N.; Steinberg, T.; Hoekstra, P.J.; Dietrich, A.; Morer, A.; et al. Tic Disorders in Children and Adolescents: Does the Clinical Presentation Differ in Males and Females? A Report by the EMTICS Group. Eur Child Adolesc Psychiatry 2022, 31, 1539–1548. [Google Scholar] [CrossRef]
- Mataix-Cols, D.; Isomura, K.; Pérez-Vigil, A.; Chang, Z.; Rück, C.; Johan Larsson, K.; Leckman, J.F.; Serlachius, E.; Larsson, H.; Lichtenstein, P. Familial Risks of Tourette Syndrome and Chronic Tic Disorders. A Population-Based Cohort Study. JAMA Psychiatry 2015, 72, 787–793. [Google Scholar] [CrossRef] [PubMed]
- Yu, D.; Sul, J.H.; Tsetsos, F.; Nawaz, M.S.; Huang, A.Y.; Zelaya, I.; Illmann, C.; Osiecki, L.; Darrow, S.M.; Hirschtritt, M.E.; et al. Interrogating the Genetic Determinants of Tourette’s Syndrome and Other Tic Disorders Through Genome-Wide Association Studies. Am J Psychiatry 2019, 176, 217–227. [Google Scholar] [CrossRef]
- Swain, J.E.; Scahill, L.; Lombroso, P.J.; King, R.A.; Leckman, J.F. Tourette Syndrome and Tic Disorders: A Decade of Progress. J Am Acad Child Adolesc Psychiatry 2007, 46, 947–968. [Google Scholar] [CrossRef] [PubMed]
- Hildonen, M.; Levy, A.M.; Hansen, C.S.; Bybjerg-Grauholm, J.; Skytthe, A.; Debes, N.M.; Tan, Q.; Tümer, Z. EWAS of Monozygotic Twins Implicate a Role of MTOR Pathway in Pathogenesis of Tic Spectrum Disorder. Genes (Basel) 2021, 12, 1510. [Google Scholar] [CrossRef]
- Dobin, A.; Davis, C.A.; Schlesinger, F.; Drenkow, J.; Zaleski, C.; Jha, S.; Batut, P.; Chaisson, M.; Gingeras, T.R. STAR: Ultrafast Universal RNA-Seq Aligner. Bioinformatics 2013, 29, 15–21. [Google Scholar] [CrossRef] [PubMed]
- Robinson, M.D.; McCarthy, D.J.; Smyth, G.K. EdgeR: A Bioconductor Package for Differential Expression Analysis of Digital Gene Expression Data. Bioinformatics 2010, 26, 139–140. [Google Scholar] [CrossRef] [PubMed]
- Ritchie, M.E.; Phipson, B.; Wu, D.; Hu, Y.; Law, C.W.; Shi, W.; Smyth, G.K. Limma Powers Differential Expression Analyses for RNA-Sequencing and Microarray Studies. Nucleic Acids Res 2015, 43, e47–e47. [Google Scholar] [CrossRef] [PubMed]
- Aryee, M.J.; Jaffe, A.E.; Corrada-Bravo, H.; Ladd-Acosta, C.; Feinberg, A.P.; Hansen, K.D.; Irizarry, R.A. Minfi: A Flexible and Comprehensive Bioconductor Package for the Analysis of Infinium DNA Methylation Microarrays. Bioinformatics 2014, 30, 1363–1369. [Google Scholar] [CrossRef]
- Leek, J.T.; Johnson, W.E.; Parker, H.S.; Jaffe, A.E.; Storey, J.D. The Sva Package for Removing Batch Effects and Other Unwanted Variation in High-Throughput Experiments. Bioinformatics 2012, 28, 882–883. [Google Scholar] [CrossRef]
- Benjamini, Y.; Hochberg, Y. Controlling the False Discovery Rate: A Practical and Powerful Approach to Multiple Testing. J R Stat Soc Series B Stat Methodol 1995, 57, 289–300. [Google Scholar] [CrossRef]
- Shabalin, A.A. Matrix EQTL: Ultra Fast EQTL Analysis via Large Matrix Operations. Bioinformatics 2012, 28, 1353–1358. [Google Scholar] [CrossRef]
- Yu, G.; Wang, L.-G.; Han, Y.; He, Q.-Y. ClusterProfiler: An R Package for Comparing Biological Themes Among Gene Clusters. OMICS 2012, 16, 284–287. [Google Scholar] [CrossRef]
- Korotkevich, G.; Sukhov, V.; Budin, N.; Shpak, B.; Artyomov, M.N.; Sergushichev, A. Fast Gene Set Enrichment Analysis. 2016. [Google Scholar] [CrossRef]
- Filomena, E.; Picardi, E.; Tullo, A.; Pesole, G.; D’Erchia, A.M. Identification of Deregulated LncRNAs in Alzheimer’s Disease: An Integrated Gene Co-Expression Network Analysis of Hippocampus and Fusiform Gyrus RNA-Seq Datasets. Front Aging Neurosci 2024, 16, 1437278. [Google Scholar] [CrossRef]
- Claus, C.; Slavin, M.; Ansseau, E.; Lancelot, C.; Bah, K.; Lassche, S.; Fiévet, M.; Greco, A.; Tomaiuolo, S.; Tassin, A.; et al. The Double Homeodomain Protein DUX4c Is Associated with Regenerating Muscle Fibers and RNA-Binding Proteins. Skeletal Muscle 2023 13:1 2023, 13, 1–30. [Google Scholar] [CrossRef] [PubMed]
- Ronchetti, D.; Agnelli, L.; Taiana, E.; Galletti, S.; Manzoni, M.; Todoerti, K.; Musto, P.; Strozzi, F.; Neri, A. Distinct LncRNA Transcriptional Fingerprints Characterize Progressive Stages of Multiple Myeloma. Oncotarget 2016, 7, 14814. [Google Scholar] [CrossRef]
- Boccitto, M.; Wolin, S.L. Ro60 and Y RNAs: Structure, Functions and Roles in Autoimmunity. Crit Rev Biochem Mol Biol 2019, 54, 133. [Google Scholar] [CrossRef]
- Chen, H.; Yang, K.; Pang, L.; Fei, J.; Zhu, Y.; Zhou, J. ANKRD22 Is a Potential Novel Target for Reversing the Immunosuppressive Effects of PMN-MDSCs in Ovarian Cancer. J Immunother Cancer 2023, 11, e005527. [Google Scholar] [CrossRef] [PubMed]
- FCGR1A - High Affinity Immunoglobulin Gamma Fc Receptor I - Homo Sapiens (Human) | UniProtKB | UniProt. Available online: https://www.uniprot.org/uniprotkb/P12314/entry#function (accessed on 31 October 2025).
- Le, D.T.; Florez, M.A.; Kus, P.; Tran, B.T.; Kain, B.; Zhu, Y.; Christensen, K.; Jain, A.; Malovannaya, A.; King, K.Y. BATF2 Promotes HSC Myeloid Differentiation by Amplifying IFN Response Mediators during Chronic Infection. iScience 2023, 26, 106059. [Google Scholar] [CrossRef]
- Roy, S.; Guler, R.; Parihar, S.P.; Schmeier, S.; Kaczkowski, B.; Nishimura, H.; Shin, J.W.; Negishi, Y.; Ozturk, M.; Hurdayal, R.; et al. Batf2/Irf1 Induces Inflammatory Responses in Classically Activated Macrophages, Lipopolysaccharides, and Mycobacterial Infection. J Immunol 2015, 194, 6035–6044. [Google Scholar] [CrossRef]
- Van Der Geest, R.; Penaloza, H.F.; Xiong, Z.; Gonzalez-Ferrer, S.; An, X.; Li, H.; Fan, H.; Tabary, M.; Nouraie, S.M.; Zhao, Y.; et al. BATF2 Enhances Proinflammatory Cytokine Responses in Macrophages and Improves Early Host Defense against Pulmonary Klebsiella Pneumoniae Infection. https://doi.org/10.1152/ajplung.00441.2022 2023, 325, L604–L616. [CrossRef]
- Tinkey, R.A.; Smith, B.C.; Habean, M.L.; Williams, J.L. BATF2 Is a Regulator of Interferon-γ Signaling in Astrocytes during Neuroinflammation. Cell Rep 2025, 44, 115393. [Google Scholar] [CrossRef]
- Li, C.; Liu, M.; Liu, K.; Li, M.; Liu, Y.; Li, T.; Wei, Y.; Long, Y.; He, W.; Shi, X.; et al. BATF2 Balances the T Cell-Mediated Immune Response of CADM with an Anti-MDA5 Autoantibody. Biochem Biophys Res Commun 2021, 551, 155–160. [Google Scholar] [CrossRef] [PubMed]
- Zong, Y.; Chang, Y.; Huang, K.; Liu, J.; Zhao, Y. The Role of BATF2 Deficiency in Immune Microenvironment Rearrangement in Cervical Cancer - New Biomarker Benefiting from Combination of Radiotherapy and Immunotherapy. Int Immunopharmacol 2024, 126. [Google Scholar] [CrossRef] [PubMed]
- Zhang, X.; Liu, Y.; Dai, L.; Shi, G.; Deng, J.; Luo, Q.; Xie, Q.; Cheng, L.; Li, C.; Lin, Y.; et al. BATF2 Prevents Glioblastoma Multiforme Progression by Inhibiting Recruitment of Myeloid-Derived Suppressor Cells. Oncogene 2021 40:8 2021, 40, 1516–1530. [Google Scholar] [CrossRef]
- Yu, X.; Tian, J.; Wang, Y.; Su, N.; Luo, J.; Duan, M.; Shi, N. The Pseudogene GBP1P1 Suppresses Influenza A Virus Replication by Acting as a Protein Decoy for DHX9. J Virol 2024, 98. [Google Scholar] [CrossRef]
- Kanemaru, H.; Yamane, F.; Fukushima, K.; Matsuki, T.; Kawasaki, T.; Ebina, I.; Kuniyoshi, K.; Tanaka, H.; Maruyama, K.; Maeda, K.; et al. Antitumor Effect of Batf2 through IL-12 P40 up-Regulation in Tumor-Associated Macrophages. Proc Natl Acad Sci U S A 2017, 114, E7331–E7340. [Google Scholar] [CrossRef] [PubMed]
- Huang, F.; Fan, H.; Yang, D.; Zhang, J.; Shi, T.; Zhang, D.; Lu, G. Ribosomal RNA-Depleted RNA Sequencing Reveals the Pathogenesis of Refractory Mycoplasma Pneumoniae Pneumonia in Children. Mol Med Rep 2021, 24, 761. [Google Scholar] [CrossRef]
- Cheng, J.; Zhou, X.; Feng, W.; Jia, M.; Zhang, X.; An, T.; Luan, M.; Pan, Y.; Zhang, S.; Zhou, Z.; et al. Risk Stratification by Long Non-coding RNAs Profiling in COVID-19 Patients. J Cell Mol Med 2021, 25, 4753. [Google Scholar] [CrossRef]
- Xiao, X.Y.; Guo, Q.; Tong, S.; Wu, C.Y.; Chen, J.L.; Ding, Y.; Wan, J.H.; Chen, S.S.; Wang, S.H. TRAT1 Overexpression Delays Cancer Progression and Is Associated with Immune Infiltration in Lung Adenocarcinoma. Front Oncol 2022, 12. [Google Scholar] [CrossRef]
- Guo, Q.; Wang, S. hua; Ji, Y. mei; Tong, S.; Li, D.; Ding, X. chao; Wu, C. yan The Roles and Mechanisms of TRAT1 in the Progression of Non-Small Cell Lung Cancer. Curr Med Sci 2022, 42, 1186–1200. [Google Scholar] [CrossRef]
- Delesque-Touchard, N.; Pendaries, C.; Volle-Challier, C.; Millet, L.; Salel, V.; Hervé, C.; Pflieger, A.M.; Berthou-Soulie, L.; Prades, C.; Sorg, T.; et al. Regulator of G-Protein Signaling 18 Controls Both Platelet Generation and Function. PLoS One 2014, 9. [Google Scholar] [CrossRef]
- Greene, D.; Thys, C.; Berry, I.R.; Jarvis, J.; Ortibus, E.; Mumford, A.D.; Freson, K.; Turro, E. Mutations in the U4 SnRNA Gene RNU4-2 Cause One of the Most Prevalent Monogenic Neurodevelopmental Disorders. Nat Med 2024, 30, 2165–2169. [Google Scholar] [CrossRef] [PubMed]
- De Jonghe, J.; Kim, H.C.; Adedeji, A.; Leitão, E.; Dawes, R.; Chen, Y.; Blakes, A.J.; Simons, C.; Rius, R.; Alvi, J.R.; et al. Saturation Genome Editing of RNU4-2 Reveals Distinct Dominant and Recessive Neurodevelopmental Disorders. medRxiv 2025. [Google Scholar] [CrossRef]
- Zsurka, G.; Appel, M.L.T.; Nastaly, M.; Hallmann, K.; Hansen, N.; Nass, D.; Baumgartner, T.; Surges, R.; Hartmann, G.; Bartok, E.; et al. Loss of the Immunomodulatory Transcription Factor BATF2 in Humans Is Associated with a Neurological Phenotype. Cells 2023, 12. [Google Scholar] [CrossRef]
- Shmookler Reis, R.J.; Atluri, R.; Balasubramaniam, M.; Johnson, J.; Ganne, A.; Ayyadevara, S. “Protein Aggregates” Contain RNA and DNA, Entrapped by Misfolded Proteins but Largely Rescued by Slowing Translational Elongation. Aging Cell 2021, 20, e13326. [Google Scholar] [CrossRef]
- Ramos, E.I.; Bien-Willner, G.A.; Li, J.; Hughes, A.E.O.; Giacalone, J.; Chasnoff, S.; Kulkarni, S.; Parmacek, M.; Cole, F.S.; Druley, T.E. Genetic Variation in MKL2 and Decreased Downstream PCTAIRE1 Expression in Extreme, Fatal Primary Human Microcephaly. Clin Genet 2013, 85, 423. [Google Scholar] [CrossRef]
- Qiu, Y.; Yang, S.; Pan, T.; Yu, L.; Liu, J.; Zhu, Y.; Wang, H. ANKRD22 Is Involved in the Progression of Prostate Cancer. Oncol Lett 2019, 18, 4106–4113. [Google Scholar] [CrossRef]
- Yin, J.; Fu, W.; Dai, L.; Jiang, Z.; Liao, H.; Chen, W.; Pan, L.; Zhao, J. ANKRD22 Promotes Progression of Non-Small Cell Lung Cancer through Transcriptional up-Regulation of E2F1. Scientific Reports 2017 7:1 2017, 7, 1–11. [Google Scholar] [CrossRef]
- Wang, R.; Wu, Y.; Zhu, Y.; Yao, S.; Zhu, Y. ANKRD22 Is a Novel Therapeutic Target for Gastric Mucosal Injury. Biomedicine & Pharmacotherapy 2022, 147, 112649. [Google Scholar] [CrossRef]
- Jafari, S.; Ravan, M.; Karimi-Sani, I.; Aria, H.; Hasan-Abad, A.M.; Banasaz, B.; Atapour, A.; Sarab, G.A. Screening and Identification of Potential Biomarkers for Pancreatic Cancer: An Integrated Bioinformatics Analysis. Pathol Res Pract 2023, 249. [Google Scholar] [CrossRef]
- Liu, J.; Wu, J.; Wang, R.; Zhong, D.; Qiu, Y.; Wang, H.; Song, Z.; Zhu, Y. ANKRD22 Drives Rapid Proliferation of Lgr5+ Cells and Acts as a Promising Therapeutic Target in Gastric Mucosal Injury. CMGH 2021, 12, 1433–1455. [Google Scholar] [CrossRef]
- Berhane, T.; Holm, A.; Karstensen, K.T.; Petri, A.; Ilieva, M.S.; Krarup, H.; Vyberg, M.; Løvendorf, M.B.; Kauppinen, S. Knockdown of the Long Noncoding RNA PURPL Induces Apoptosis and Sensitizes Liver Cancer Cells to Doxorubicin. Sci Rep 2022, 12. [Google Scholar] [CrossRef] [PubMed]
- Savinovskaya, Y.I.; Nushtaeva, A.A.; Savelyeva, A. V.; Morozov, V. V.; Ryabchikova, E.I.; Kuligina, E. V.; Richter, V.A.; Semenov, D. V. Human Blood Extracellular Vesicles Activate Transcription of NF-KB-Dependent Genes in A549 Lung Adenocarcinoma Cells. Curr Issues Mol Biol 2022, 44, 6028–6045. [Google Scholar] [CrossRef]
- Jaskiewicz, K.; Maleszka-Kurpiel, M.; Matuszewska, E.; Kabza, M.; Rydzanicz, M.; Malinowski, R.; Ploski, R.; Matysiak, J.; Gajecka, M. The Impaired Wound Healing Process Is a Major Factor in Remodeling of the Corneal Epithelium in Adult and Adolescent Patients With Keratoconus. Invest Ophthalmol Vis Sci 2023, 64, 22. [Google Scholar] [CrossRef]
- Mohebifar, H.; Sabbaghian, A.; Farazmandfar, T.; Golalipour, M. Construction and Analysis of Pseudogene-Related CeRNA Network in Breast Cancer. Sci Rep 2023, 13, 21874. [Google Scholar] [CrossRef]
- Shi, H.; Pan, M.; Sheng, Y.; Jia, E.; Wang, Y.; Dong, J.; Tu, J.; Bai, Y.; Cai, L.; Ge, Q. Extracellular Cell-Free RNA Profile in Human Large Follicles and Small Follicles. Front Cell Dev Biol 2022, 10, 940336. [Google Scholar] [CrossRef]
- Berhane, T.; Holm, A.; Karstensen, K.T.; Petri, A.; Ilieva, M.S.; Krarup, H.; Vyberg, M.; Løvendorf, M.B.; Kauppinen, S. Knockdown of the Long Noncoding RNA PURPL Induces Apoptosis and Sensitizes Liver Cancer Cells to Doxorubicin. Sci Rep 2022, 12. [Google Scholar] [CrossRef]
- Hara, T.; Meng, S.; Tsuji, Y.; Arao, Y.; Saito, Y.; Sato, H.; Motooka, D.; Uchida, S.; Ishii, H. RN7SL1 May Be Translated under Oncogenic Conditions. Proc Natl Acad Sci U S A 2024, 121. [Google Scholar] [CrossRef]
- Gómez-Matas, J.; Duran-Sanchon, S.; Lozano, J.J.; Ferrero, G.; Tarallo, S.; Pardini, B.; Naccarati, A.; Castells, A.; Gironella, M. SnoRNA Profiling in Colorectal Cancer and Assessment of Non-Invasive Biomarker Capacity by DdPCR in Fecal Samples. iScience 2024, 27, 109283. [Google Scholar] [CrossRef]
- Ramos, E.I.; Veerapandian, R.; Das, K.; Chacon, J.A.; Gadad, S.S.; Dhandayuthapani, S. Pathogenic Mycoplasmas of Humans Regulate the Long Noncoding RNAs in Epithelial Cells. Noncoding RNA Res 2023, 8, 282. [Google Scholar] [CrossRef]
- Zhang, T.; Nie, Y.; Xia, H.; Zhang, Y.; Cai, K.; Chen, X.; Li, H.; Wang, J. Identification of Immune-Related Prognostic Genes and LncRNAs Biomarkers Associated With Osteosarcoma Microenvironment. Front Oncol 2020, 10, 1109. [Google Scholar] [CrossRef]
- Itami-Matsumoto, S.; Hayakawa, M.; Uchida-Kobayashi, S.; Enomoto, M.; Tamori, A.; Mizuno, K.; Toyoda, H.; Tamura, T.; Akutsu, T.; Ochiya, T.; et al. Circulating Exosomal MiRNA Profiles Predict the Occurrence and Recurrence of Hepatocellular Carcinoma in Patients with Direct-Acting Antiviral-Induced Sustained Viral Response. Biomedicines 2019, 7. [Google Scholar] [CrossRef] [PubMed]
- Quintanilha, J.C.F.; Cursino, M.A.; Borges, J.B.; Torso, N.G.; Bastos, L.B.; Oliveira, J.M.; Cobaxo, T.S.; Pincinato, E.C.; Hirata, M.H.; Geraldo, M. V.; et al. MiR-3168, MiR-6125, and MiR-4718 as Potential Predictors of Cisplatin-Induced Nephrotoxicity in Patients with Head and Neck Cancer. BMC Cancer 2021, 21, 575. [Google Scholar] [CrossRef]
- She, J.; Tan, K.; Liu, J.; Cao, S.; Li, Z.; Peng, Y.; Xiao, Z.; Diao, R.; Wang, L. The Alteration of M6A Modification at the Transcriptome-Wide Level in Human Villi During Spontaneous Abortion in the First Trimester. Front Genet 2022, 13, 861853. [Google Scholar] [CrossRef]
- Claus, C.; Slavin, M.; Ansseau, E.; Lancelot, C.; Bah, K.; Lassche, S.; Fiévet, M.; Greco, A.; Tomaiuolo, S.; Tassin, A.; et al. The Double Homeodomain Protein DUX4c Is Associated with Regenerating Muscle Fibers and RNA-Binding Proteins. Skeletal Muscle 2023 13:1 2023, 13, 1–30. [Google Scholar] [CrossRef]
- Kumar, S.; Shih, C.M.; Tsai, L.W.; Dubey, R.; Gupta, D.; Chakraborty, T.; Sharma, N.; Singh, A.V.; Swarup, V.; Singh, H.N. Transcriptomic Profiling Unravels Novel Deregulated Gene Signatures Associated with Acute Myocardial Infarction: A Bioinformatics Approach. Genes (Basel) 2022, 13, 2321. [Google Scholar] [CrossRef]
- Alsugair, Z.; Perrot, J.; Descotes, F.; Lopez, J.; Champagnac, A.; Pissaloux, D.; Castain, C.; Onea, M.; Céruse, P.; Philouze, P.; et al. Characterization of a Molecularly Distinct Subset of Oncocytic Pleomorphic Adenomas/Myoepitheliomas Harboring Recurrent ZBTB47-AS1::PLAG1 Gene Fusion. Am J Surg Pathol 2024, 48, 551–561. [Google Scholar] [CrossRef]
- Meng, Y.; Qiu, S.Q.; Wang, Q.; Zuo, J.L. Regulator of G Protein Signalling 18 Promotes Osteocyte Proliferation by Activating the Extracellular Signal-regulated Kinase Signalling Pathway. Int J Mol Med 2024, 53. [Google Scholar] [CrossRef] [PubMed]
- Su, C.; Li, H.; Peng, Z.; Ke, D.; Fu, H.; Zheng, X. Identification of Plasma RGS18 and PPBP MRNAs as Potential Biomarkers for Gastric Cancer Using Transcriptome Arrays. Oncol Lett 2019, 17, 247–255. [Google Scholar] [CrossRef] [PubMed]
- Dale, R.C.; Merheb, V.; Pillai, S.; Wang, D.; Cantrill, L.; Murphy, T.K.; Ben-Pazi, H.; Varadkar, S.; Aumann, T.D.; Horne, M.K.; et al. Antibodies to Surface Dopamine-2 Receptor in Autoimmune Movement and Psychiatric Disorders. Brain 2012, 135, 3453–3468. [Google Scholar] [CrossRef]
- Addabbo, F.; Baglioni, V.; Schrag, A.; Schwarz, M.J.; Dietrich, A.; Hoekstra, P.J.; Martino, D.; Buttiglione, M.; Anastasiou, Z.; Apter, A.; et al. Anti-Dopamine D2 Receptor Antibodies in Chronic Tic Disorders. Dev Med Child Neurol 2020, 62, 1205–1212. [Google Scholar] [CrossRef]
- Fernández de la Cruz, L.; Mataix-Cols, D. General Health and Mortality in Tourette Syndrome and Chronic Tic Disorder: A Mini-Review. Neurosci Biobehav Rev 2020, 119, 514–520. [Google Scholar] [CrossRef]
- Murphy, T.K.; Storch, E.A.; Turner, A.; Reid, J.M.; Tan, J.; Lewin, A.B. Maternal History of Autoimmune Disease in Children Presenting with Tics and/or Obsessive-Compulsive Disorder. J Neuroimmunol 2010, 229, 243–247. [Google Scholar] [CrossRef]
- Xue, D.; Shi, H.; Smith, J.D.; Chen, X.; Noe, D.A.; Cedervall, T.; Yangt, D.D.; Eynon, E.; Brash, D.E.; Kashgarian, M.; et al. A Lupus-like Syndrome Develops in Mice Lacking the Ro 60-KDa Protein, a Major Lupus Autoantigen. Proc Natl Acad Sci U S A 2003, 100, 7503–7508. [Google Scholar] [CrossRef] [PubMed]
- Shmookler Reis, R.J.; Atluri, R.; Balasubramaniam, M.; Johnson, J.; Ganne, A.; Ayyadevara, S. “Protein Aggregates” Contain RNA and DNA, Entrapped by Misfolded Proteins but Largely Rescued by Slowing Translational Elongation. Aging Cell 2021, 20, e13326. [Google Scholar] [CrossRef]
- Zsurka, G.; Appel, M.L.T.; Nastaly, M.; Hallmann, K.; Hansen, N.; Nass, D.; Baumgartner, T.; Surges, R.; Hartmann, G.; Bartok, E.; et al. Loss of the Immunomodulatory Transcription Factor BATF2 in Humans Is Associated with a Neurological Phenotype. Cells 2023, 12, 227. [Google Scholar] [CrossRef]
- Chen, Y.; Dawes, R.; Kim, H.C.; Ljungdahl, A.; Stenton, S.L.; Walker, S.; Lord, J.; Lemire, G.; Martin-Geary, A.C.; Ganesh, V.S.; et al. De Novo Variants in the RNU4-2 SnRNA Cause a Frequent Neurodevelopmental Syndrome. Nature 2024, 632, 832. [Google Scholar] [CrossRef]
- Ramos, E.I.; Bien-Willner, G.A.; Li, J.; Hughes, A.E.O.; Giacalone, J.; Chasnoff, S.; Kulkarni, S.; Parmacek, M.; Cole, F.S.; Druley, T.E. Genetic Variation in MKL2 and Decreased Downstream PCTAIRE1 Expression in Extreme, Fatal Primary Human Microcephaly. Clin Genet 2013, 85, 423. [Google Scholar] [CrossRef]
- Karlsson Linnér, R.; Mallard, T.T.; Barr, P.B.; Sanchez-Roige, S.; Madole, J.W.; Driver, M.N.; Poore, H.E.; de Vlaming, R.; Grotzinger, A.D.; Tielbeek, J.J.; et al. Multivariate Analysis of 1.5 Million People Identifies Genetic Associations with Traits Related to Self-Regulation and Addiction. Nat Neurosci 2021, 24, 1367. [Google Scholar] [CrossRef]
- Nemoda, Z.; Sahin-Tóth, M. Chymotrypsin C (Caldecrin) Stimulates Autoactivation of Human Cationic Trypsinogen. J Biol Chem 2006, 281, 11879–11886. [Google Scholar] [CrossRef] [PubMed]
- Szmola, R.; Bence, M.; Carpentieri, A.; Szabó, A.; Costello, C.E.; Samuelson, J.; Sahin-Tóth, M. Chymotrypsin C Is a Co-Activator of Human Pancreatic Procarboxypeptidases A1 and A2. J Biol Chem 2010, 286, 1819. [Google Scholar] [CrossRef] [PubMed]
- Arnold, G.L.; Hyman, S.L.; Mooney, R.A.; Kirby, R.S. Plasma Amino Acids Profiles in Children with Autism: Potential Risk of Nutritional Deficiencies. J Autism Dev Disord 2003, 33, 449–454. [Google Scholar] [CrossRef] [PubMed]
- Pearson, D.A.; Arnold, L.E.; Bostrom, S.; Aman, M.G. 2017 International Meeting for Autism Research: Chymotrypsin: Evidence of a Novel Pancreatic Insufficiency in Children with ASD? Available online: https://insar.confex.com/imfar/2017/webprogram/Paper23908.html (accessed on 24 April 2025).
- Heil, M.; Pearson, D.A.; Fallon, J. 2014 International Meeting for Autism Research: Low Endogenous Fecal Chymotrypsin: A Possible Biomarker for Autism? Available online: https://www.researchgate.net/publication/268131323_Low_Endogenous_Fecal_Chymotrypsin_A_Possible_Biomarker_for_Autism (accessed on 24 April 2025).
- Pearson, D.A.; Hendren, R.L.; Heil, M.F.; McIntyre, W.R.; Raines, S.R. Pancreatic Replacement Therapy for Maladaptive Behaviors in Preschool Children With Autism Spectrum Disorder. JAMA Netw Open 2023, 6, e2344136. [Google Scholar] [CrossRef]
- Sullivan, M.A.; Rudnik-Leven, F. Attention Deficit/Hyperactivity Disorder and Substance Abuse. Ann N Y Acad Sci 2001, 931, 251–270. [Google Scholar] [CrossRef]
- Srichawla, B.S.; Telles, C.C.; Schweitzer, M.; Darwish, B. Attention Deficit Hyperactivity Disorder and Substance Use Disorder: A Narrative Review. Cureus 2022. [Google Scholar] [CrossRef]
Figure 1.
Analysis of RNA sequencing and DNA methylation data. A) Volcano plots showing negative log10-transformed P-values (y-axis) and log2-transformed fold changes per gene/probe (x-axis) for RNA-sequencing (left) and DNA methylation (right). Significant findings are highlighted. B) Pairwise correlation plots showing gene expression versus methylation levels for the top 12 results from the expression quantitative trait methylation (eQTM) analysis. Each twin pair is represented with a distinct color, and the TSD twin shown as a triangle while the asymptomatic twin is indicated by a filled circle.
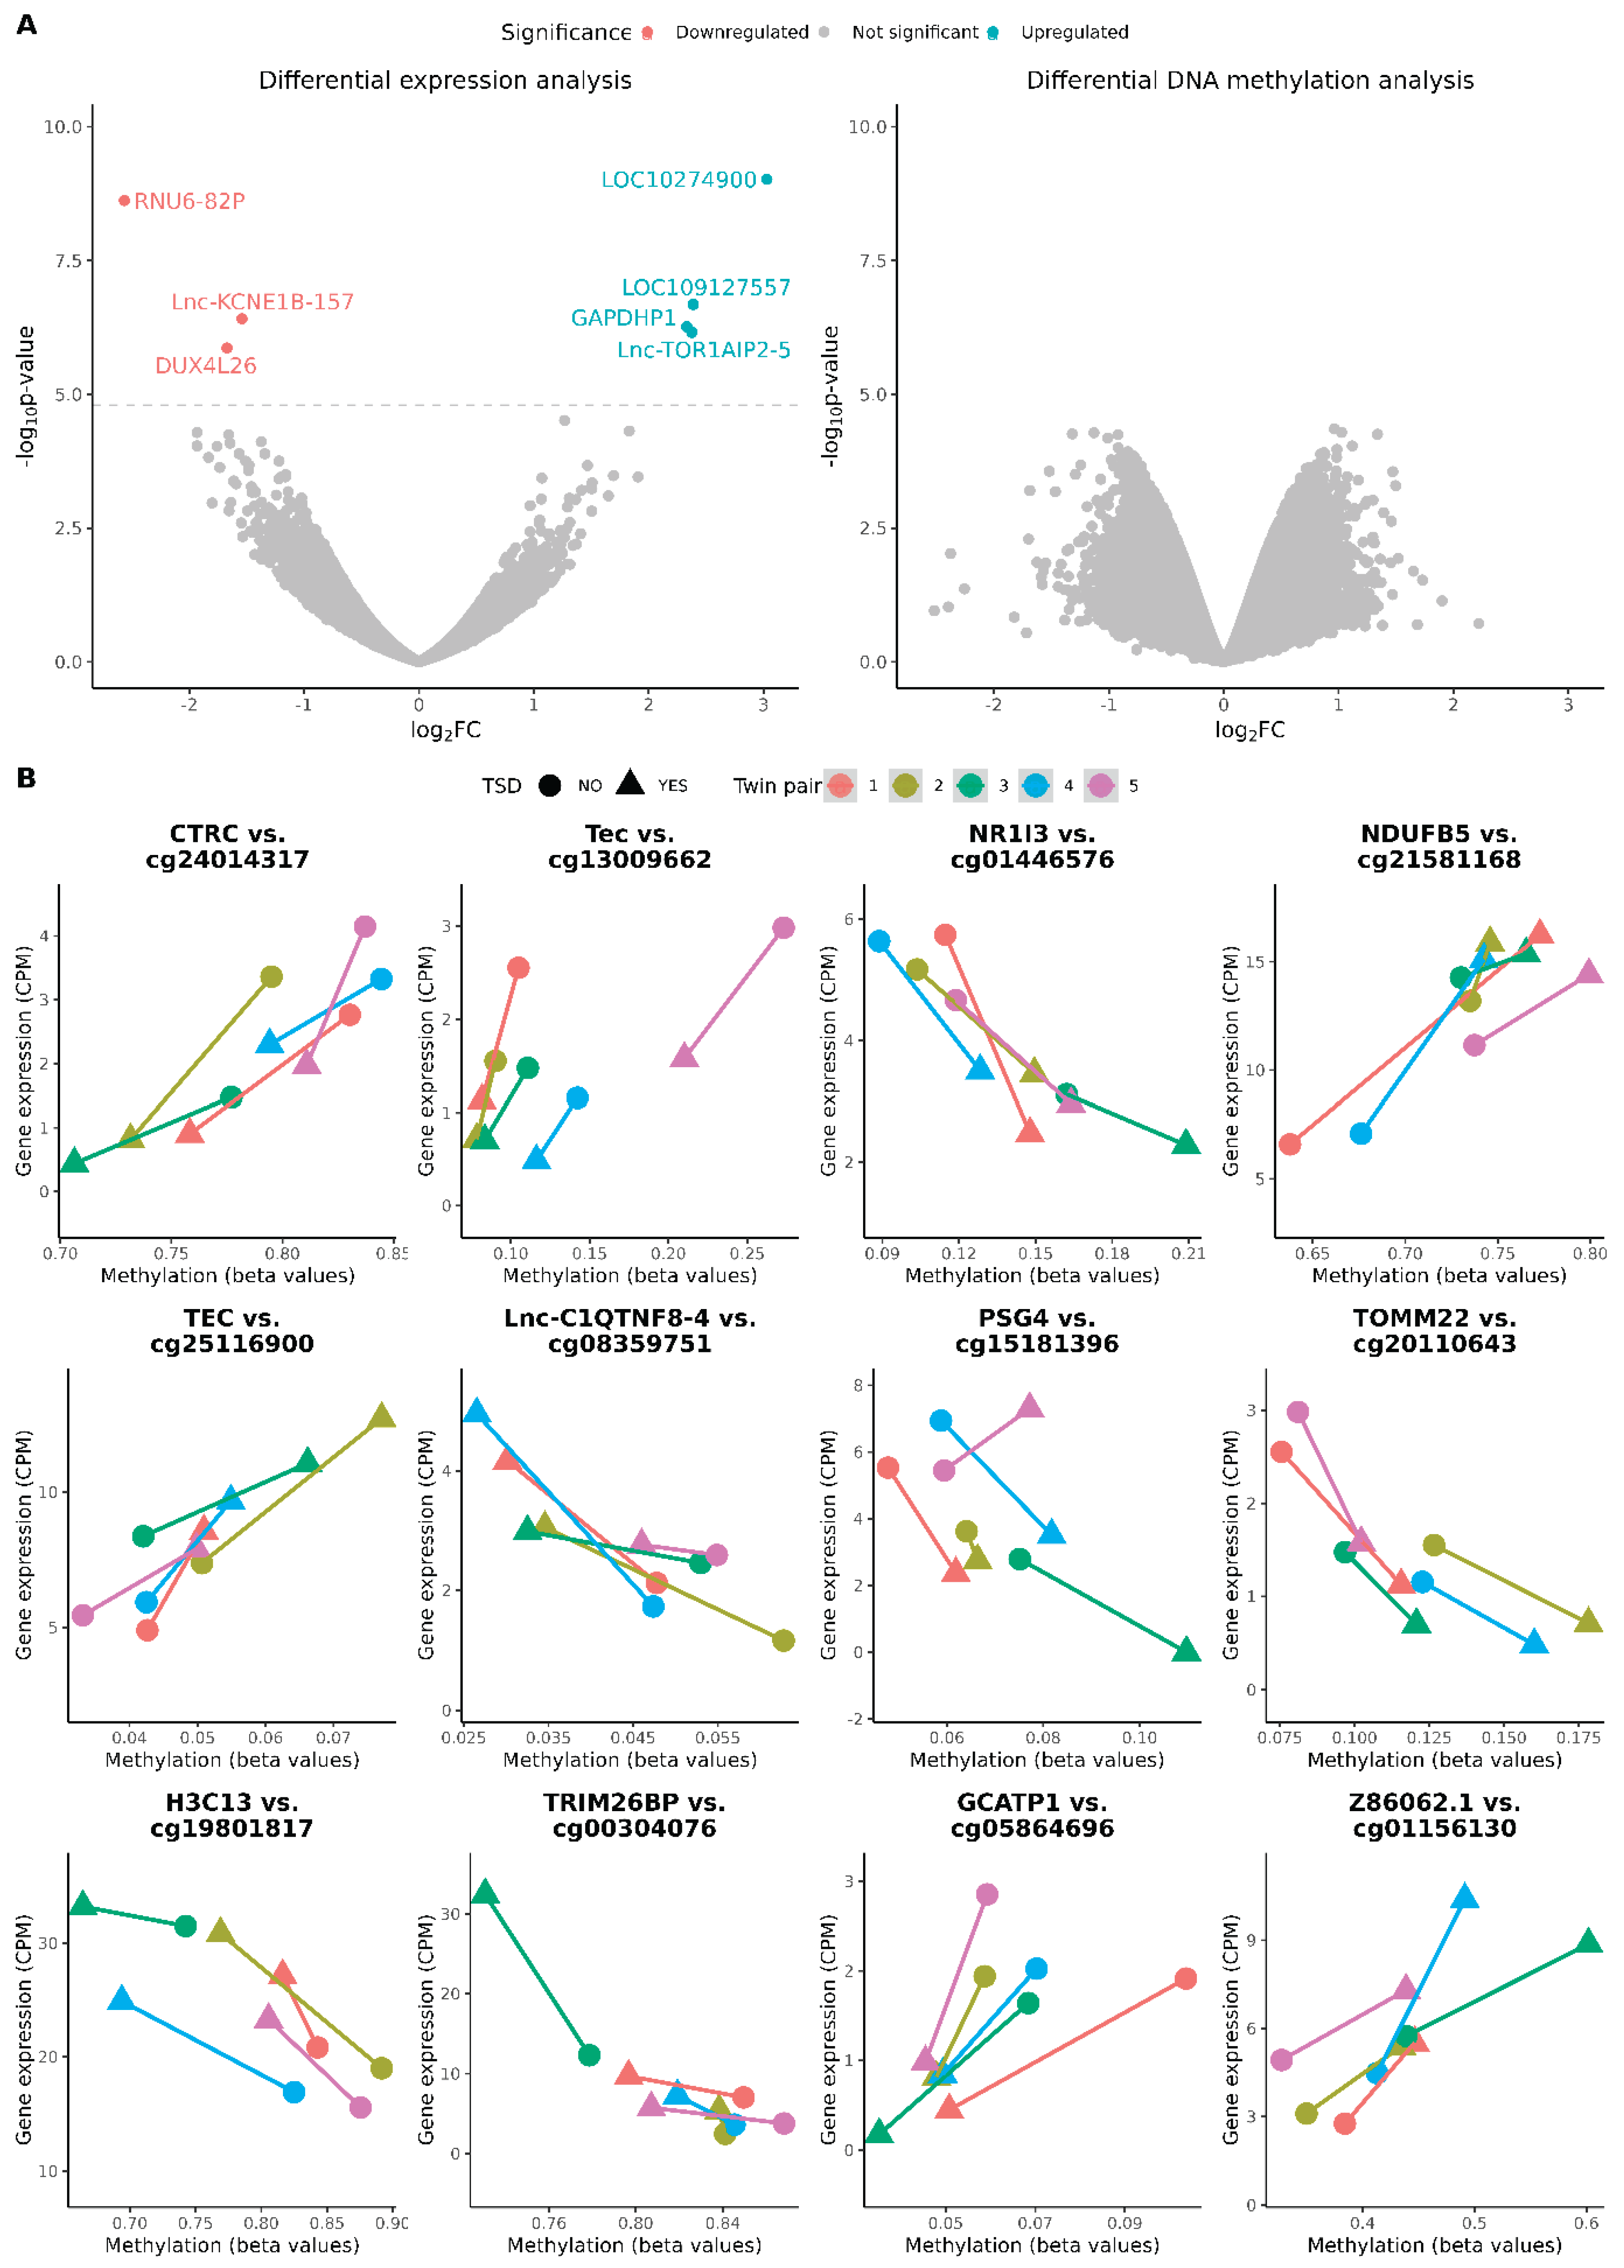
Figure 2.
Category net plots for the terms identified in the gene set enrichment analysis for the case-control study. Genes are shown as red dots, fold change is indicated by color intensity, and the number of genes associated with a term is shown as the size of the beige dot. A) Gene ontology (GO) terms. B) KEGG terms.
Disclaimer/Publisher’s Note: The statements, opinions and data contained in all publications are solely those of the individual author(s) and contributor(s) and not of MDPI and/or the editor(s). MDPI and/or the editor(s) disclaim responsibility for any injury to people or property resulting from any ideas, methods, instructions or products referred to in the content. |
© 2025 by the authors. Licensee MDPI, Basel, Switzerland. This article is an open access article distributed under the terms and conditions of the Creative Commons Attribution (CC BY) license (http://creativecommons.org/licenses/by/4.0/).
Copyright: This open access article is published under a Creative Commons CC BY 4.0 license, which permit the free download, distribution, and reuse, provided that the author and preprint are cited in any reuse.


