
Submitted:
20 August 2024
Posted:
21 August 2024
You are already at the latest version
Abstract
Major depressive disorder (MDD) is a prevalent mental health condition with substantial social and economic consequences. This study focuses on the interplay between genetic and environmen-tal factors in MDD, with particular emphasis on epigenetic mechanisms such as stochastic epige-netic mutations (SEMs), epigenetic age acceleration, and epigenetic drift. We conducted a meta-analysis of DNA methylation patterns across six datasets (n=1125 MDD cases, 398 controls in whole blood; n=95 MDD cases, 96 controls in brain tissues) from the Gene Expression Omnibus. The analysis did not reveal significant global methylation differences between MDD cases and controls. However, a brain-specific probe (cg25801113) near the SHF gene consistently exhibited hypomethylation, suggesting its potential relevance to MDD. SEMs were assessed, revealing a dis-tinct burden at the gene level in MDD cases, though no significant findings emerged for epigenetic age acceleration, indicating it may not play a central role in MDD. The study also identified rare epivariations in specific genes unique to MDD cases. In blood tissue, 51 genes were associated with these unique epivariations, while 1 gene was highlighted in the brain tissue. These results un-derscore the importance of exploring rare epivariations in understanding the molecular mecha-nisms underlying MDD and offer potential targets for further investigation.
Keywords:
MDD
; Epigenetic drift
; Rare epivariations
; Epigenetics
1. Introduction
Major depressive disorder (MDD) is part of mood disorders and is characterized by at least one depressive episode without a history of other mood disorder episodes [1]. It is a clinically heterogeneous disease, involving a series of clinical pictures determined by precise neurotransmitter alterations between two extremes: mania and depression. The latter refers to an actual psychiatric syndrome. MDD constitutes a widespread disorder in the population involving as many as 20% of the population. The term "mood disorders" triggers can be divided into biological, genetic, and psychosocial, but this division is often artificial as the three realities tend to interact with each other [2].
As for the genetic nature of MDD, several genes, including transporters, neurotransmitters, and neurotrophins that may predispose individuals to MDD. However, significant gaps remain in our understanding of MDD, such as the precise regulatory mechanisms governing the clinical spectrum, the interaction between genetic and environmental factors and the reasons for variability in treatment responses.
Exploring the field of epigenetics may offer promising insights into the complex etiology of MDD and potential advancements in therapeutic strategies, as evidenced by recent studies investigating DNA methylation changes in both brain and blood tissues [3,4,5,6,7,8].
Studies exploring genome-wide DNA methylation in MDD have identified significant associations with the disorder [9,10]. However, excluding the study by Jovanova et al. (2018) [11] conducted on whole blood which involved a large and heterogeneous sample, the other studies, particularly those analyzing brain tissue DNA, are characterized by a smaller sample size. This limitation, along with the lack of replication across studies and a limited understanding of the functional implications of the identified associations, raises important questions about the generalizability and biological relevance of these findings. This highlights the need for further research with improved statistical power to clarify the role of epigenetic modifications in MDD. Previous studies have also investigated other aspects of epigenetic regulation, including differences in age acceleration, in MDD patients. However, also in this case there is a lack of uniform agreement in the results with some studies observing no significant differences in age acceleration [12] and others highlighting differences between cases and controls [13,14,15].
Furthermore, previous studies have largely neglected other intriguing aspects of epigenetic regulation such as epigenetic drift and rare epigenetic variations (epivariations), two underexplored areas of DNA methylation variability. These aspects are increasingly recognized as fundamental for describing the epigenetic landscape involved in phenotype modulation and have been described in various physiological and pathological conditions. Epigenetic drift refers to the gradual accumulation of stochastic epigenetic changes, over an individual's lifespan. The gradual changes in the epigenome can lead to dysregulation of key genes and pathways, potentially increasing susceptibility to psychiatric illnesses and influencing the course of the disease [16,17].
2. Materials and Methods
2.1. Selection of Datasets
To carry out this project, a search in databases was performed, using the keywords Major depressive disorder, methylation, case-control in the Gene Expression Omnibus (GEO) data repository and EWAS Data Hub platform until January 2024. To be included, studies should be case-control studies, reporting data using the Illumina HumanMethylation450 or Infinium MethylationEPIC platforms, in blood tissue or in brain districts. Only public data was included.
2.2. Methylation Quality Control Data Preprocessing and Differential Methylation Analysis
Each dataset was analyzed separately with the same procedure. First, data quality control was performed at both the sample and probe levels. This involved identifying technical and biological biases, errors in sampling, and other confounders. Probes with high or low fluorescence and those with insignificant β values compared to the background were discarded, along with probes that hybridized at the sex chromosome level and sites containing SNPs and known natural C/T polymorphisms. Conversion efficiency index was checked for each sample, and samples with a low index were excluded. Outliers and samples with non-bimodal methylation levels or less than 99.5% of CpG sites determined successfully were also excluded. Putative homozygous deletion regions were identified and removed. Differential methylation analyses were conducted using Champ [18] and limma [19] packages. Before proceeding in the differential analysis, data underwent Single Value Decomposition (SVD) [18], applied with the prcomp function, for taking into account batch effect emerging from sample's Illumina Sentrix ID and its position during the array experiment. If present, such errors were adjusted using the ComBat method [20].
Principal Component Analysis (PCA) was employed to reduce the complexity of cellular components estimates. This solution enabled us to utilize the PCs as covariates in comparative models between the two groups, effectively sidestepping collinearity issues. The estimation of cellular components was conducted using the epidish package [21].
After normalizing to address batch effects, differential methylation analyses were performed at both site and genomic region levels using hierarchical linear models implemented in the limma package, adjusting for potential confounders such as age, sex, batch effect and PCs. False discovery rate (FDR) was adopted to address the problem of multiple tests. The pipeline was entirely performed in R Studio, version R version 4.4.1 (2024-06-14).
2.3. Age Acceleration Analysis
Epigenetic aging was assessed using the GrimAge clock, which calculates age acceleration by integrating DNA methylation-based surrogates for various proteins, biological markers and self-reported smoking history [22]. These measures were derived from DNA methylation data using the dnaMethyAge package [23] with the PCGrimage clock. To examine the association between the GrimAge clock and MS, a general linear model was employed under the null hypothesis of no effect of MS on the mean difference between epigenetic age and chronological age, adjusting for sex and the principal components of cellular compositions.
2.4. Epigenetic Drift and Stochastic Epigenetic Mutations Analysis (SEMs)
Stochastic epigenetic mutations (SEMs) refer to infrequent, random, and inconsistent alterations in DNA methylation. These changes are determined through the examination of DNA methylation data, as outlined by Gentilini et al. [24] Upon identification of extreme outliers in CpG probe methylation levels within a population, outliers are determined as methylation levels surpassing three times the interquartile range (IQR), as described in the formula:
Q1-(3 × IQR) and Q3 + (3 × IQR)
Additionally, following the approach by Yan et al. (2020) [25], SEMs were utilized to evaluate epigenetic drift in each subject, generating two epimutation load (EML) scores. These scores aim to quantify the overall burden of SEM counts across the entire genome (Global-EML) and at the gene level (Gene-EML). To explore the relationship between Global-EML and MDD, a logistic regression model was employed, incorporating the same covariates used in the EWAS step. The burden of SEMs was log-transformed and compared between cases and controls. The sequence kernel association test (SKAT) was adopted to explore associations between MDD and Gene-EML (i.e., Gene-specific epigenetic drift scores). SEM calls at each methylation probe were treated as the variants of interest, following the approach outlined by Chen et al. (2022) [26]. The RVTEST, initially designed for mapping a contiguous set of rare variants to a specific trait, was extended to accommodate other measures like copy number variants (CNV) and methylation counts. This extension operated under the assumption that a cluster of variations in adjacent sites could be relevant to the trait. SKAT enhanced the statistical power to identify associations with the burden of SEMs by considering the joint effect of multiple rare epigenetic variants. The analyses were conducted on both blood and brain tissue, and the results obtained from each study, depending on the tissue, were aggregated using Fisher's method [27].
2.5. Epigenetic Variation Analysis
The identification of epigenetic variations followed a validated approach outlined by Gentilini et al. (2023) [28] and [29]. This method involved scrutinizing genomic regions with a significant enrichment of SEMs. A sliding window method of a predefined size was used on the annotated genome to assess significant SEM enrichment regions employing a hypergeometric distribution. The algorithm systematically tested each window by sliding it (one site at a time), generating p-values associated with each window. The concept of epivariations encompasses regions with abnormal methylation patterns and a notable increase in epimutations, as detailed by Garg et al. and Gentilini et al. [30,31]. These variations in DNA methylation states can arise from various origins. Primary epivariations result from random errors during the establishment or maintenance of the epigenome, especially during cellular differentiation. These errors are sporadic and not necessarily linked to changes in the DNA sequence. Additionally, genetic factors like CNVs, CGG repeats, and single nucleotide variations (SNVs) can influence the epigenome, leading to epivariations. Understanding these sources is key to uncovering the underlying molecular mechanisms. To identify epivariations, we used a method validated by Gentilini et al. (2018) [31], involving the detection of over-representation of epimutated probes for each subject through a sliding window approach. This method assessed the build-up of epimutations using the hypergeometric cumulative function, with each epivariation represented by a p-value indicating the likelihood of epimutation enrichment in the specified genomic region.
2.6. Meta-Analysis
The meta-analysis was performed to combine results from differential methylation analyses for both tissues. This synthesis was conducted separately for blood and brain samples to ensure comprehensive analysis. In the context of brain differential methylation analysis, separate investigations were carried out for different brain areas. However, the individual findings from these separate studies were later combined and summarized together in a meta-analysis. The meta-analyses aimed to provide a more comprehensive and integrated understanding of the overall differential methylation patterns across various brain regions, offering valuable insights into the epigenetic differences that may be associated with specific brain functions or conditions. The software METAL, which is a specific tool to perform meta-analysis at genome-wide and epigenome-wide level, was used [32]. Moreover, the same approach was applied to gather information on age acceleration analysis and epigenetic drift for both tissues. A mixed- effects model was applied, in which the hypothesis is that the observed differences could be due to differences between studies. The goal was to obtain a summary estimate for the effect size. This analysis was conducted through the metafor, which provided in addition to pooled estimates, statistics regarding heterogeneity such as the Q statistic and the I2 statistic [33].
2.7. Gene Set Enrichment Analysis and Gene Prioritization Analysis
To perform the over-representation analysis (ORA) on epivariations, a prioritization was firstly performed, to highlight the most interesting genes associated with epivariations. Priority was given to genes detected in three cases or more but not in controls across both brain and blood tissues. Subsequently, we refined our gene selection by excluding those already identified in a previous study involving 23,116 subjects from the general population [30]. The filtered genes’ list underwent additional investigation using the Genotype-Tissue Expression (GTEx) project [34] to identify genes expressed in the brain. Additionally, the VarElect tool [35] was employed to spotlight genes already recognized for their involvement in MDD.
3. Results
3.1. Datasets and Differential Methylation Meta-Analyses
We included only studies with a sample size greater than 20. After the application of the previous criteria, datasets from 6 studies were eligible and included in the analyses (GSE113725, GSE201287, GSE125105, GSE198904 obtained from blood tissues while GSE88890 and GSE41826 obtained from brain tissues). The studies referred to brain tissue contained information on different areas of the brain. Specifically, GSE41826 was divided into Glia and Neurons and GSE88890 into area BA11, located in the orbitofrontal cortex, and BA25, a region of the cerebral cortex. Main information about selected datasets and respective publications [3,4,5,6,7,8] is presented in the following table (Table 1).
The analysis was performed on 4 datasets for blood, for a total of 1125 MDD cases and 398 controls, and 2 datasets for brain tissues, involving two areas each. for a total of 95 MDD cases and 96 controls.
The exploratory analyses, conducted separately in each dataset for both blood and brain tissues, aimed to identify overarching differences in methylation between cases and controls, as well as to detect batch effects and hidden confounders. These analyses did not reveal any significant distinctions between the groups analyzed. After normalizing to account for batch effects, differential methylation analysis was performed at the probe level, considering potential confounding factors detailed in the methodology section. The results from these analyses were then systematically integrated using a meta-analytic approach. The findings from the meta-analyses are depicted in Manhattan plots for blood and brain tissues, as illustrated in Figure 1 (Panels A and B) respectively, where unadjusted p-values distributions are shown. After applying the FDR multiple testing correction in the meta-analysis of blood tissue, no probes showed significant differential methylation (FDR<0.05). In contrast, in the meta-analysis of brain tissue, one specific probe (cg25801113) consistently exhibited significant differential methylation across multiple studies, even after the multiple testing correction. This significant probe is in the region of interest associated with the SHF gene. The comprehensive meta-analysis results for blood and brain tissues are respectively shown in Supplementary Tables S1, S2.
ORA was conducted for both blood and brain tissues using nominal significance to consolidate significant findings and identify biochemical pathways potentially involved in depression. This approach enables the exploration of biological trends and functional pathways that may not reach statistical significance post multiple testing corrections, enhancing sensitivity to uncover subtle but meaningful associations. ORA uncovered enrichment in various gene ontology Biological Processes, particularly highlighting neurogenesis and positive regulation of gene expression. Moreover, analysis at the KEGG pathway level indicated significant enrichment in neurotrophins’ signaling and the Hippo signaling pathway. Detailed findings from the ORA analysis performed on whole blood tissue are available in Supplementary Table S3.
Regarding brain tissues, the most interesting results of ORA considering Biological Process were locomotion, neurogenesis and the regulation of cell differentiation. The complete list of results obtained from ORA analysis in Brain is shown in Supplementary Table S4.
3.2. Age Acceleration
Epigenetic age was assessed in all participants with available chronological age data, with the exception of those in study GSE201287, which did not provide chronological age information. Age acceleration was evaluated using various epigenetic clocks across both brain and blood samples, but no differences were identified between cases and controls. The results from the GrimAge clock are reported here, as it is considered a second-generation epigenetic clock, offering advanced insights into age-related changes. However, no significant difference in age acceleration was observed between the groups, with mean differences of -0.65 [95% CI: -1.89;0.59] for brain samples and 0.08 [95% CI: -0.56; 0.72] for blood tissue. A forest plot illustrating these findings is provided in Figure 2.
3.3. SEM Analysis and Epimutation Load
The examination of epigenetic drift encompassed both global and gene-specific levels, utilizing two distinct metrics: Global-EML, which spans the entire genome, and Gene-EML, focusing on individual genes. These metrics allow for the assessment of cumulative SEM counts across the genome and at the gene level, offering a comprehensive evaluation of the overall SEM burden for everyone. The Global-EML scores were log-transformed and then compared between groups within each study using a multiple regression model, which accounted for crucial covariates including gender, age, and cellular components. These analyses were conducted separately for each study, and the results were later integrated through meta-analysis to achieve a pooled estimation. After combining the results, the analysis found no significant effect of the epimutation load on the risk of developing MDD in either whole blood (OR=0.91, CI=[0.58-1.42]) or brain tissues (OR=0.84, CI=[0.58-1.21]). A comprehensive display of the meta-analysis results regarding Global-EML is presented in Figure 3.
Gene-EML scores were analysed using a sequence kernel association test (SKAT) within each dataset, to evaluate differences in epigenetic drift at the gene level between cases and controls. In both brain and blood tissues, Fisher's method was then used to combine results from the SKAT tests and detect genes displaying significant differences in epigenetic drift between cases and controls across all studies. The comprehensive results for Gene-EML are available in the Supplementary Table S5.
The ORA was performed to uncover biological elements that could be implicated or influenced by the observed epigenetic drift. The investigation into Gene Ontology (GO) terms and pathways in blood uncovered significant associations with MDD. Noteworthy findings included the involvement of the Wnt signaling pathway and cell-cell signaling by Wnt in biological processes, as well as KEGG pathways linked to mTOR signaling, neurodegeneration, and inflammation. In brain tissue, significant associations were found with KEGG pathways such as the adipocytokine signaling pathway, glycerophospholipid metabolism, and regulation of lipolysis in adipocytes, alongside biological processes related to regulation of neurotrophins’ production, nerve growth factor production, and positive regulation of response to extracellular stimulus. Detailed results are shown respectively and are available in Supplementary Tables S6, S7.
3.4. Epigenetic Variation Analysis Results
We broadened our investigation to highlight genes potentially implicated in MDD within the framework of epivariations. Distinct regions with significant enrichment in SEMs were prioritized both in blood and brain tissues. The selection was performed considering genes’ regions from all studies, where epivariations did not appear in controls and appeared in at least 3 or more cases. Based on the criteria just established, 192 genes were identified in whole blood and 1 in the brain.
Subsequently, we refined our gene prioritization by excluding those already identified in a previous study by Garg and colleagues (2020) [30] involving more than 23,000 subjects from the general population, as described in the methods section. The Venn diagram describes the filtering approach used. This analysis identified 51 genes from blood tissues and 1 gene emerged from the brain. These genes underwent further investigation using GTEx to explore their expression profiles in brain and blood tissues, to see whether expressions in the two tissues might appear similar. A focused examination was then conducted on the genes with the highest expression levels in brain tissue using GTEx, and the results are illustrated in Figure 5 (B). The expression was quantified by transcript per million (TPM), which is a method used to normalize gene expression data to account for differences in gene length and sequencing depth.
4. Discussion
Exploring the epigenetic landscape of MDD led us to comprehensively evaluate the interplay between genetic and environmental factors contributing to this widespread disorder. Implementing a meta-analytical approach, the aim was to pool results of methylation patterns and MDD from different studies to increase the power and explore heterogeneity among studies. finding methylation similarities from different studies already investigating the MDD’ epigenetics, alongside the age acceleration and rare epigenetic variations. The analysis involved 1125 MDD cases and 398 controls in blood tissue, along with 95 MDD cases and 96 controls in brain tissue. In the differential meta-analysis of whole blood, no probes showed significant differential methylation between cases and controls after FDR correction. This finding aligns with a recent study involving 9 population cohorts with over 10,000 subjects, which identified only 3 significantly associated probes [11]. Unfortunately, we could not confirm these associations in the present study as the relevant probes were not included in the samples analyzed here. Given the large sample size and statistical power of the Jovanova et al. study, it is not surprising that no significant genome-wide results emerged in our analysis. The lack of clear epigenetic signatures for MDD may reflect the disorder's heterogeneity, suggesting that MDD may involve a complex and varied set of underlying mechanisms. Conversely, in the analysis of the brain tissue, a particular probe (cg25801113) consistently demonstrated significant hypomethylation across multiple studies, even after FDR correction. This finding highlights the substantial hypomethylation of the probe, situated within the region of interest linked to the SHF gene, particularly interesting in the depression context, since its neurobiological implications have already been studied in Alzheimer's disease (AD). The SHF protein is expressed in the brain, including the hippocampal formation, amygdala, basal ganglia, midbrain, spinal cord, cerebral cortex, cerebellum, hypothalamus, choroid plexus, mostly linked to emotional regulation and neurobiological processes [36]. An integrated analysis of human genetic association study and mouse transcriptome suggests that the SHF gene is a novel susceptible gene for amyloid-beta (Aβ) [37].
The ORA was conducted on probes reporting a suggestive significance, i.e., p-value <10-5 [38], both for blood and brain tissues. ORA in whole blood highlighted several enriched biological processes (BP) terms, among which the most interesting were neurogenesis and positive regulation of gene expression, while KEGG pathways showed a significant enrichment in neurotrophin signaling and Hippo signaling. The association of the Hippo signaling pathway with bipolar disorder (BD) and its positive transcriptional regulation might characterize its involvement. Perturbations in this pathway may result in abnormalities in neural progenitor cell maintenance and asymmetric division, crucial for generating cortical neurons, potentially influencing mood regulation and the onset of depressive symptoms [39,40]. Moreover, the observed enrichment in neurogenesis and positive regulation of gene expression holds significant relevance to depression [41,42]. These findings align with the recent study by Jovanova et al., [11], which reached similar conclusions.
As for brain tissue, the most significant pathways are referred to locomotion and neurogenesis. The involvement of all these processes in depression may offer potential targets for intervention and further our understanding of the molecular mechanisms underlying the condition.
THE assessment of epigenetic drift and SEMs were investigated, both globally and at the gene level. While Global-EML did not indicate an elevated drift, the Gene-EML, which depicted a notably distinct SEM burden at gene level between cases and controls, revealed a catalog of 50 genes in the blood and 10 genes in the brain. The findings revealed a significant accumulation of mutations in the methylation patterns of specific genes. Notably, in blood the ORA highlighted several significantly enriched pathways, including the mTOR signaling pathway (FDR=0.01), neurodegeneration-multiple diseases (FDR=0.006), and carbohydrate digestion and absorption (FDR=0.004). The mTOR pathway, a key regulator of homeostasis, impacts protein synthesis, autophagy, and metabolism. Dysregulation of mTOR signaling has been directly associated with MDD, and pharmacological modulation of this pathway shows promise as a treatment for depression [43]. The PI3K/Akt/mTOR signaling pathway has been associated with neurodegenerative diseases and is involved in regulating a wide range of upstream molecules, including those related to inflammation and oxidative stress [44]. In the context of depression, the interplay between stress, inflammation, and immune dysregulation has been shown to contribute to atrophy and loss of neurons and glia, which are central to the pathophysiology of the disorder [45]. In line with recent studies, the association between sugar malabsorption and depressive symptoms in adult women has been reported [46]. Incompletely absorbed carbohydrates may form nonabsorbable complexes with tryptophan, decreasing its availability and leading to serotonin depletion, which could contribute to depression [47].
In the brain tissue, while no significant pathway was found from ORA analysis, significant and interesting biological processes linked to relationship between MDD and digestive system emerged, e.g, positive regulation of appetite (FDR=0.039), positive regulation of response to nutrient levels (FDR=0.039). Moreover, emerged the pathway of regulation of neurotrophin production (FDR=0.039).
An additional level of analysis focused on rare epivariations, which are regions displaying abnormal methylation patterns and are characterized by a notable increase in epimutations, rare epivariations have been linked to various neurological conditions such as ALS [48] and autism spectrum disorder [17], their potential role in MDD has yet to be fully explored. This analysis identified 959 distinct genes with epivariations found exclusively in blood tissue from MDD cases, and a separate set of 180 unique genes with epivariations observed solely in brain tissue from MDD cases. These epivariations were specific to MDD and were not present in control subjects. To prioritize the most compelling findings, we selected genes with epivariations in at least 3 cases and absent in controls for both tissues. To further refine our list, we excluded genes that were identified in a study by Garg et al. [30], which involved over 23,000 subjects from the general population. This approach yielded a list of epivariations unique to MDD cases. This selection highlighted 1 gene in the brain and 51 genes in blood. The identified genes were initially prioritized by reviewing those previously studied in the context of MDD. To further refine this gene list, we employed a method similar to the approach used in exome sequencing analysis with VarElect tool. This approach allowed us to focus on genes with a higher likelihood of being relevant by filtering out less significant findings and homing in on those with substantial epivariations specifically associated with MDD. Particularly interesting were the two genes directly linked to MDD, i.e., GRIA4, the protein-coding gene for the subunit 4 of the AMPA glutamate receptor, involved in glutamate signaling and neuroplasticity [49], which may be implicated in psychiatric disorders, together with GRIA1 and GRIA2 genes [50]. the other relevant gene was GAS5, a lncRNA gene, which was investigated for being a biomarker for type 2 diabetes, might be also involved in MDD progression [51], through mRNA regulation. In mice models, GAS5 was studied for depression-like behaviors, and its downregulation was found to alleviate hippocampal neuronal damage [52]. This list of unique epivariations, was furtherly investigated in order to obtain their expression profiles in blood and brain tissues. Among genes not directly associated to MDD, there were genes involved in immune system reactions and autophagy (CD4, HLA-C, ATG14), proteins implicated in the phosphorylation process and with the role of kinases (DYRK1A, RIPK1), and transferase (CAT1, GALNT2). GALNT2 appeared to be upregulated in the striatum but decreased in the hippocampus of MDD patients, suggesting they may have different functions in different brain regions in MDD progression [53].
5. Conclusion
In conclusion this study explores the epigenetic regulation of MDD, focusing on rare epivariations and stochastic epigenetic mutations, areas previously underexamined. The research offers new insights into the molecular mechanisms of MDD, highlighting the potential role of epigenetic modifications in the disorder's onset and progression. Despite the strengths of a meta-analytical approach, limitations include variability in sample sizes and genetic diversity, which could underestimate heterogeneity and complicate the identification of consistent epigenetic markers, particularly in blood and brain tissues. The lack of detailed phenotypic data further restricts the depth of analysis. While no specific epigenetic signature, accelerated aging, or significant epigenetic drift was found, the study did reveal potentially important rare epivariations in MDD. Future research with larger, diverse cohorts is necessary to confirm these findings and improve the understanding of MDD’s epigenetic landscape, contributing to more effective diagnostic and therapeutic approaches.
Supplementary Materials
The following supporting information can be downloaded at the website of this paper posted on Preprints.org.
Author Contributions
Conceptualization, GNB, RC and DG; methodology, GNB, RC, LCalzari and DS; software, GNB and RC; formal analysis GNB and RC; investigation, GNB and RC; resources, GNB and RC; data curation, GNB and RC; writing—original draft preparation, GNB and RC; writing—review and editing, GNB, RC, LCalzari, DS, LCostantino, FF and DG; visualization, GNB and RC; supervision, DG. All authors have read and agreed to the published version of the manuscript.
Funding
The publication fee has been supported by Ricerca Corrente from Italian Ministry of Health.
Data Availability Statement
The datasets presented in this study can be found in the online repository GEO (Gene Expression Omnibus) with the study accession numbers declared in Supplementary Table 1.
Conflicts of Interest
The authors declare no conflicts of interest.
References
- Greenberg, J.; Tesfazion, A.A.; Col, M.;; Robinson, C.S. Screening, Diagnosis, and Treatment of Depression; 2012; Vol. 177.
- Rybak, Y.E.; Lai, K.S.P.; Ramasubbu, R.; Vila-Rodriguez, F.; Blumberger, D.M.; Chan, P.; Delva, N.; Giacobbe, P.; Gosselin, C.; Kennedy, S.H.; et al. Treatment-Resistant Major Depressive Disorder: Canadian Expert Consensus on Definition and Assessment. Depress Anxiety 2021, 38, 456–467. [Google Scholar] [CrossRef] [PubMed]
- Crawford, B.; Craig, Z.; Mansell, G.; White, I.; Smith, A.; Spaull, S.; Imm, J.; Hannon, E.; Wood, A.; Yaghootkar, H.; et al. DNA Methylation and Inflammation Marker Profiles Associated with a History of Depression. Hum Mol Genet 2018, 27, 2840–2850. [Google Scholar] [CrossRef] [PubMed]
- Li, Q.S.; Morrison, R.L.; Turecki, G.; Drevets, W.C. Meta-Analysis of Epigenome-Wide Association Studies of Major Depressive Disorder. Sci Rep 2022, 12. [Google Scholar] [CrossRef] [PubMed]
- Xiu, J.; Li, J.; Liu, Z.; Wei, H.; Zhu, C.; Han, R.; Liu, Z.; Zhu, W.; Shen, Y.; Xu, Q.; et al. Elevated BICD2 DNA Methylation in Blood of Major Depressive Disorder Patients and Reduction of Depressive-like Behaviors in Hippocampal Bicd2-Knockdown Mice. 2022. [CrossRef]
- Moore, S.R.; Halldorsdottir, T.; Martins, J.; Lucae, S.; Müller-Myhsok, B.; Müller, N.S.; Piechaczek, C.; Feldmann, L.; Freisleder, F.J.; Greimel, E.; et al. Sex Differences in the Genetic Regulation of the Blood Transcriptome Response to Glucocorticoid Receptor Activation. Transl Psychiatry 2021, 11. [Google Scholar] [CrossRef]
- Murphy, T.M.; Crawford, B.; Dempster, E.L.; Hannon, E.; Burrage, J.; Turecki, G.; Kaminsky, Z.; Mill, J. Methylomic Profiling of Cortex Samples from Completed Suicide Cases Implicates a Role for PSORS1C3 in Major Depression and Suicide. Transl Psychiatry 2017, 7. [Google Scholar] [CrossRef] [PubMed]
- Guintivano, J.; Aryee, M.J.; Kaminsky, Z.A. A Cell Epigenotype Specific Model for the Correction of Brain Cellular Heterogeneity Bias and Its Application to Age, Brain Region and Major Depression. Epigenetics 2013, 8, 290–302. [Google Scholar] [CrossRef]
- Li, Q.S.; Morrison, R.L.; Turecki, G.; Drevets, W.C. Meta-Analysis of Epigenome-Wide Association Studies of Major Depressive Disorder. Sci Rep 2022, 12. [Google Scholar] [CrossRef]
- Zhu, Y.; Strachan, E.; Fowler, E.; Bacus, T.; Roy-Byrne, P.; Zhao, J. Genome-Wide Profiling of DNA Methylome and Transcriptome in Peripheral Blood Monocytes for Major Depression: A Monozygotic Discordant Twin Study. Transl Psychiatry 2019, 9. [Google Scholar] [CrossRef]
- Jovanova, O.S.; Nedeljkovic, I.; Spieler, D.; Walker, R.M.; Liu, C.; Luciano, M.; Bressler, J.; Brody, J.; Drake, A.J.; Evans, K.L.; et al. DNA Methylation Signatures of Depressive Symptoms in Middle-Aged and Elderly Persons: Meta-Analysis of Multiethnic Epigenome-Wide Studies. JAMA Psychiatry 2018, 75, 949–959. [Google Scholar] [CrossRef]
- Beydoun, M.A.; Hossain, S.; Chitrala, K.N.; Tajuddin, S.M.; Beydoun, H.A.; Evans, M.K.; Zonderman, A.B. Association between Epigenetic Age Acceleration and Depressive Symptoms in a Prospective Cohort Study of Urban-Dwelling Adults. J Affect Disord 2019, 257, 64–73. [Google Scholar] [CrossRef]
- Shindo, R.; Tanifuji, T.; Okazaki, S.; Otsuka, I.; Shirai, T.; Mouri, K.; Horai, T.; Hishimoto, A. Accelerated Epigenetic Aging and Decreased Natural Killer Cells Based on DNA Methylation in Patients with Untreated Major Depressive Disorder. npj Aging 2023, 9. [Google Scholar] [CrossRef] [PubMed]
- Huynh, J.L.; Garg, P.; Thin, T.H.; Yoo, S.; Dutta, R.; Trapp, B.D.; Haroutunian, V.; Zhu, J.; Donovan, M.J.; Sharp, A.J.; et al. Epigenome-Wide Differences in Pathology-Free Regions of Multiple Sclerosis-Affected Brains. Nat Neurosci 2014, 17, 121–130. [Google Scholar] [CrossRef] [PubMed]
- Han, L.K.M.; Dinga, R.; Hahn, T.; Ching, C.R.K.; Eyler, L.T.; Aftanas, L.; Aghajani, M.; Aleman, A.; Baune, B.T.; Berger, K.; et al. Brain Aging in Major Depressive Disorder: Results from the ENIGMA Major Depressive Disorder Working Group. Mol Psychiatry 2021, 26, 5124–5139. [Google Scholar] [CrossRef]
- Ptak, C.; Petronis, A. Epigenetic Approaches to Psychiatric Disorders. Dialogues Clin Neurosci 2010, 12, 25–35. [Google Scholar] [CrossRef] [PubMed]
- Davide, G.; Rebecca, C.; Irene, P.; Luciano, C.; Francesco, R.; Marta, N.; Miriam, O.; Natascia, B.; Pierluigi, P. Epigenetics of Autism Spectrum Disorders: A Multi-Level Analysis Combining Epi-Signature, Age Acceleration, Epigenetic Drift and Rare Epivariations Using Public Datasets. Curr Neuropharmacol 2023, 21, 2362–2373. [Google Scholar] [CrossRef]
- Tian, Y.; Morris, T.J.; Webster, A.P.; Yang, Z.; Beck, S.; Feber, A.; Teschendorff, A.E. ChAMP: Updated Methylation Analysis Pipeline for Illumina BeadChips. Bioinformatics 2017, 33, 3982–3984. [Google Scholar] [CrossRef]
- Ritchie, M.E.; Phipson, B.; Wu, D.; Hu, Y.; Law, C.W.; Shi, W.; Smyth, G.K. Limma Powers Differential Expression Analyses for RNA-Sequencing and Microarray Studies. Nucleic Acids Res 2015, 43, e47. [Google Scholar] [CrossRef]
- Johnson, W.E.; Li, C.; Rabinovic, A. Adjusting Batch Effects in Microarray Expression Data Using Empirical Bayes Methods. Biostatistics 2007, 8, 118–127. [Google Scholar] [CrossRef]
- Zheng, S.C.; Breeze, C.E.; Beck, S.; Dong, D.; Zhu, T.; Ma, L.; Ye, W.; Zhang, G.; Teschendorff, A.E. EpiDISH Web Server: Epigenetic Dissection of Intra-Sample-Heterogeneity with Online GUI. Bioinformatics 2020, 36, 1950–1951. [Google Scholar] [CrossRef]
- McCrory, C.; Fiorito, G.; Hernandez, B.; Polidoro, S.; O’Halloran, A.M.; Hever, A.; Ni Cheallaigh, C.; Lu, A.T.; Horvath, S.; Vineis, P.; et al. GrimAge Outperforms Other Epigenetic Clocks in the Prediction of Age-Related Clinical Phenotypes and All-Cause Mortality. Journals of Gerontology - Series A Biological Sciences and Medical Sciences 2021, 76, 741–749. [Google Scholar] [CrossRef]
- Horvath, H.; Horvath, S. DNA Methylation Age of Human Tissues and Cell Types; 2013; Vol. 14.
- Aging-V7i8-100792.
- Aging-V12i18-103950.
- Chen, P.; Shi, W.; Liu, Y.; Cao, X. Slip Rate Deficit Partitioned by Fault-Fold System on the Active Haiyuan Fault Zone, Northeastern Tibetan Plateau. J Struct Geol 2022, 155. [Google Scholar] [CrossRef]
- Grolaux, R.; Hardy, A.; Olsen, C.; Van Dooren, S.; Smits, G.; Defrance, M. Identification of Differentially Methylated Regions in Rare Diseases from a Single-Patient Perspective. Clin Epigenetics 2022, 14. [Google Scholar] [CrossRef] [PubMed]
- Gentilini, D.; Somigliana, E.; Pagliardini, L.; Rabellotti, E.; Garagnani, P.; Bernardinelli, L.; Papaleo, E.; Candiani, M.; Di Blasio, A.M.; Viganò, P. Multifactorial Analysis of the Stochastic Epigenetic Variability in Cord Blood Confirmed an Impact of Common Behavioral and Environmental Factors but Not of in Vitro Conception. Clin Epigenetics 2018, 10. [Google Scholar] [CrossRef] [PubMed]
- Spada, E.; Calzari, L.; Corsaro, L.; Fazia, T.; Mencarelli, M.; Di Blasio, A.M.; Bernardinelli, L.; Zangheri, G.; Vignali, M.; Gentilini, D. Epigenome Wide Association and Stochastic Epigenetic Mutation Analysis on Cord Blood of Preterm Birth. Int J Mol Sci 2020, 21, 1–14. [Google Scholar] [CrossRef]
- Garg, P.; Jadhav, B.; Rodriguez, O.L.; Patel, N.; Martin-Trujillo, A.; Jain, M.; Metsu, S.; Olsen, H.; Paten, B.; Ritz, B.; et al. A Survey of Rare Epigenetic Variation in 23,116 Human Genomes Identifies Disease-Relevant Epivariations and CGG Expansions. Am J Hum Genet 2020, 107, 654–669. [Google Scholar] [CrossRef]
- Gentilini, D.; Somigliana, E.; Pagliardini, L.; Rabellotti, E.; Garagnani, P.; Bernardinelli, L.; Papaleo, E.; Candiani, M.; Di Blasio, A.M.; Viganò, P. Multifactorial Analysis of the Stochastic Epigenetic Variability in Cord Blood Confirmed an Impact of Common Behavioral and Environmental Factors but Not of in Vitro Conception. Clin Epigenetics 2018, 10. [Google Scholar] [CrossRef]
- Willer, C.J.; Li, Y.; Abecasis, G.R. METAL: Fast and Efficient Meta-Analysis of Genomewide Association Scans. Bioinformatics 2010, 26, 2190–2191. [Google Scholar] [CrossRef]
- Viechtbauer, W. Conducting Meta-Analyses in R with the Metafor Package; 2010; Vol. 36.
- Aguet, F.; Brown, A.A.; Castel, S.E.; Davis, J.R.; He, Y.; Jo, B.; Mohammadi, P.; Park, Y.S.; Parsana, P.; Segrè, A. V.; et al. Genetic Effects on Gene Expression across Human Tissues. Nature 2017, 550, 204–213. [Google Scholar] [CrossRef]
- Stelzer, G.; Plaschkes, I.; Oz-Levi, D.; Alkelai, A.; Olender, T.; Zimmerman, S.; Twik, M.; Belinky, F.; Fishilevich, S.; Nudel, R.; et al. VarElect: The Phenotype-Based Variation Prioritizer of the GeneCards Suite. BMC Genomics 2016, 17. [Google Scholar] [CrossRef]
- Fries, G.R.; Saldana, V.A.; Finnstein, J.; Rein, T. Molecular Pathways of Major Depressive Disorder Converge on the Synapse. Mol Psychiatry 2023, 28, 284–297. [Google Scholar] [CrossRef]
- Fries, G.R.; Saldana, V.A.; Finnstein, J.; Rein, T. Molecular Pathways of Major Depressive Disorder Converge on the Synapse. Mol Psychiatry 2023, 28, 284–297. [Google Scholar] [CrossRef] [PubMed]
- Hammond RK, Pahl MC, Su C, Cousminer DL, Leonard ME, Lu S, Doege CA, Wagley Y, Hodge KM, Lasconi C, Johnson ME, Pippin JA, Hankenson KD, Leibel RL, Chesi A, Wells AD, Grant SF. Biological constraints on GWAS SNPs at suggestive significance thresholds reveal additional BMI loci. Elife. 2021 Jan 18;10:e62206. [CrossRef] [PubMed]
- Yamaguchi-Kabata, Y.; Morihara, T.; Ohara, T.; Ninomiya, T.; Takahashi, A.; Akatsu, H.; Hashizume, Y.; Hayashi, N.; Shigemizu, D.; Boroevich, K.A.; et al. Integrated Analysis of Human Genetic Association Study and Mouse Transcriptome Suggests LBH and SHF Genes as Novel Susceptible Genes for Amyloid-β Accumulation in Alzheimer’s Disease. Hum Genet 2018, 137, 521–533. [Google Scholar] [CrossRef]
- Liu, Y.; Gu, H.Y.; Zhu, J.; Niu, Y.M.; Zhang, C.; Guo, G.L. Identification of Hub Genes and Key Pathways Associated With Bipolar Disorder Based on Weighted Gene Co-Expression Network Analysis. Front Physiol 2019, 10. [Google Scholar] [CrossRef] [PubMed]
- Wei, X.; Huang, G.; Liu, J.; Ge, J.; Zhang, W.; Mei, Z. An Update on the Role of Hippo Signaling Pathway in Ischemia-Associated Central Nervous System Diseases. Biomedicine and Pharmacotherapy 2023, 162. [Google Scholar] [CrossRef] [PubMed]
- Anacker, C.; Cattaneo, A.; Luoni, A.; Musaelyan, K.; Zunszain, P.A.; Milanesi, E.; Rybka, J.; Berry, A.; Cirulli, F.; Thuret, S.; et al. Glucocorticoid-Related Molecular Signaling Pathways Regulating Hippocampal Neurogenesis. Neuropsychopharmacology 2013, 38, 872–883. [Google Scholar] [CrossRef] [PubMed]
- Lipton, J.O.; Sahin, M. The Neurology of MTOR. Neuron 2014, 84, 275–291. [Google Scholar] [CrossRef] [PubMed]
- Iranpanah, A.; Kooshki, L.; Moradi, S.Z.; Saso, L.; Fakhri, S.; Khan, H. The Exosome-Mediated PI3K/Akt/MTOR Signaling Pathway in Neurological Diseases. Pharmaceutics 2023, 15. [Google Scholar] [CrossRef]
- Duman, R.S.; Voleti, B. Signaling Pathways Underlying the Pathophysiology and Treatment of Depression: Novel Mechanisms for Rapid-Acting Agents. Trends Neurosci 2012, 35, 47–56. [Google Scholar] [CrossRef]
- Varea, V.; Martín de Carpi, J.; Puig, C.; Angel Alda, J.; Camacho, E.; Ormazabal, A.; Artuch, R.; Gómez, L. Malabsorption of Carbohydrates and Depression in Children and Adolescents.
- Zhang, N.; Li, J.; Dong, Z.; Hu, Y.; Zhong, Z.; Gong, Q.; Kuang, W. The Digestion and Dietary Carbohydrate Pathway Contains 100% Gene Mutations Enrichment among 117 Patients with Major Depressive Disorder. Front Psychiatry 2024, 15. [Google Scholar] [CrossRef]
- Brusati, A.; Peverelli, S.; Calzari, L.; Tiloca, C.; Casiraghi, V.; Sorce, M.N.; Invernizzi, S.; Carbone, E.; Cavagnola, R.; Verde, F.; et al. Exploring Epigenetic Drift and Rare Epivariations in Amyotrophic Lateral Sclerosis by Epigenome-Wide Association Study. Front Aging Neurosci 2023, 15. [Google Scholar] [CrossRef]
- Zhou, H.; Cheng, Z.; Bass, N.; Krystal, J.H.; Farrer, L.A.; Kranzler, H.R.; Gelernter, J. Genome-Wide Association Study Identifies Glutamate Ionotropic Receptor GRIA4 as a Risk Gene for Comorbid Nicotine Dependence and Major Depression. Transl Psychiatry 2018, 8. [Google Scholar] [CrossRef] [PubMed]
- Chiesa, A.; Crisafulli, C.; Porcelli, S.; Han, C.; Patkar, A.A.; Lee, S.J.; Park, M.H.; Jun, T.Y.; Serretti, A.; Pae, C.U. Influence of GRIA1, GRIA2 and GRIA4 Polymorphisms on Diagnosis and Response to Treatment in Patients with Major Depressive Disorder. Eur Arch Psychiatry Clin Neurosci 2012, 262, 305–311. [Google Scholar] [CrossRef] [PubMed]
- Czarny, P.; Białek, K.; Ziółkowska, S.; Strycharz, J.; Barszczewska, G.; Sliwinski, T. The Importance of Epigenetics in Diagnostics and Treatment of Major Depressive Disorder. J Pers Med 2021, 11, 1–32. [Google Scholar] [CrossRef] [PubMed]
- Gao, H.; Ma, H.; Gao, M.; Chen, A.; Zha, S.; Yan, J. Long Non-Coding RNA GAS5 Aggravates Myocardial Depression in Mice with Sepsis via the MicroRNA-449b/HMGB1 Axis and the NF-ΚB Signaling Pathway. Biosci Rep 2021, 41. [Google Scholar] [CrossRef] [PubMed]
- Zilmer, M.; Edmondson, A.C.; Khetarpal, S.A.; Alesi, V.; Zaki, M.S.; Rostasy, K.; Madsen, C.G.; Lepri, F.R.; Sinibaldi, L.; Cusmai, R.; et al. Novel Congenital Disorder of O-Linked Glycosylation Caused by GALNT2 Loss of Function. Brain 2020, 143, 1114–1126. [Google Scholar] [CrossRef] [PubMed]
Figure 1.
Manhattan plots of meta-analyzed differential methylation analyses, divided by results observed in blood tissue (A) and brain tissue (B). In both graphs, the x-axis represents the chromosomes where the probes are located. The y-axis represents the negative base-10 logarithm of the association p-value, with a red horizontal line indicating the threshold for significant unadjusted p-value (suggestive significance threshold shown with the blue line at 10-5). Few reached the suggestive threshold, while only two probes cg21812670 in blood and cg2580113 in the brain, went even beyond the 10-7 (orange line). Note that the only probe still significant (FDR<0.05) after the multiple testing correction was the cg25801113.
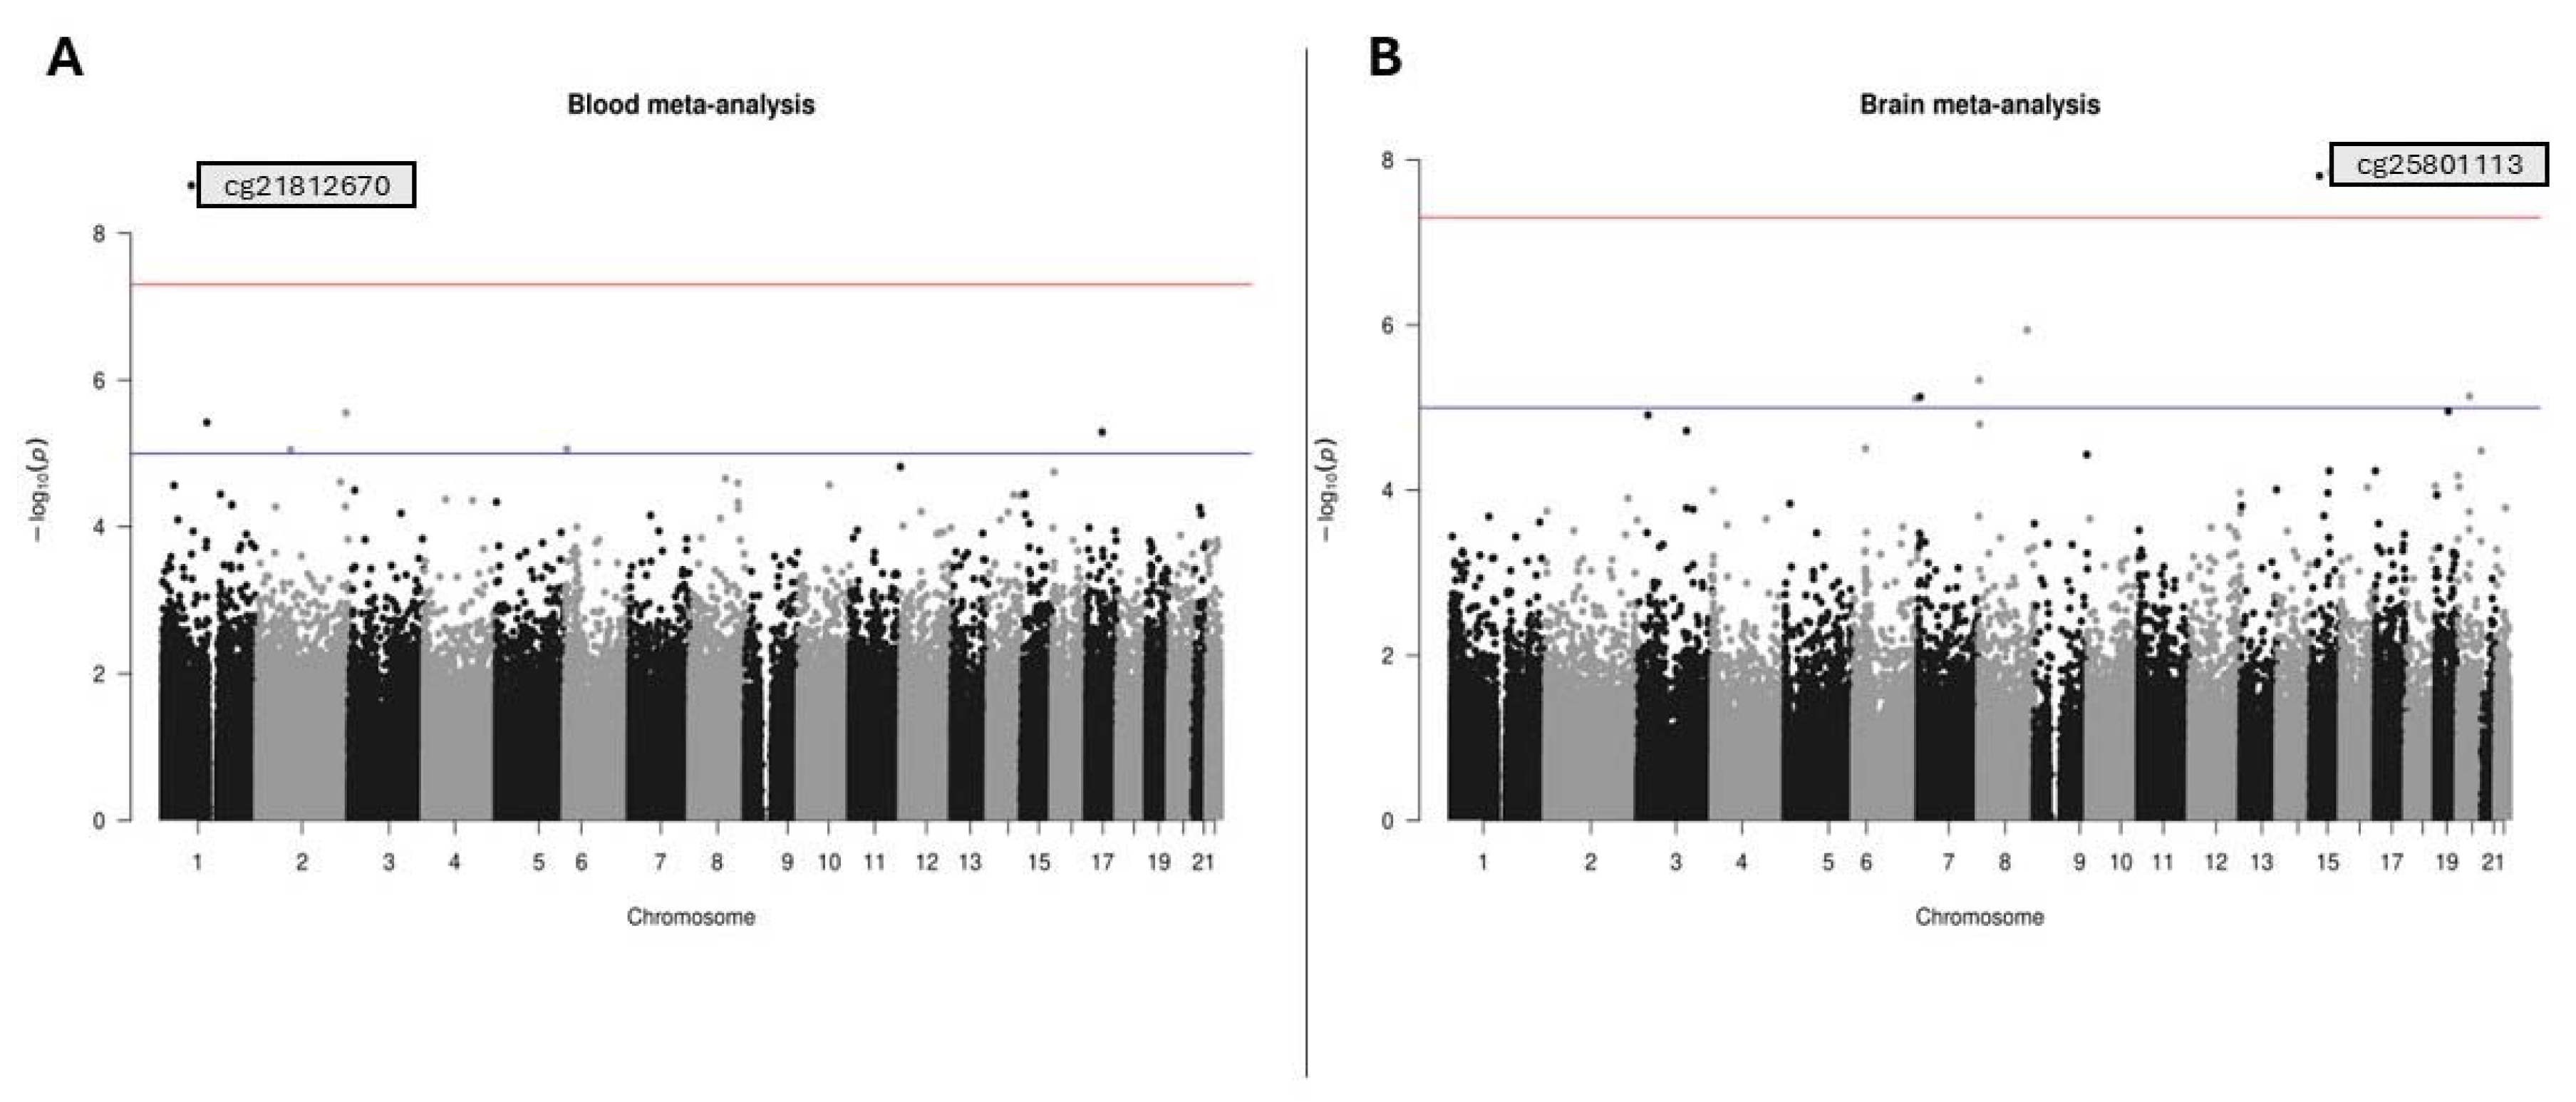
Figure 2.
Forest plot of age acceleration in brain and blood samples, with individual study results on the y-axis, excluding study GSE201287. The forest plot displays the observed outcomes as mean differences on the x-axis and the 95% confidence intervals resulting from the analysis of the association between age acceleration Grim and depression, based on a linear regression model. The vertical line highlights the area of no effect (mean difference = 0), with the size of each square proportional to the study's influence on the overall estimate.
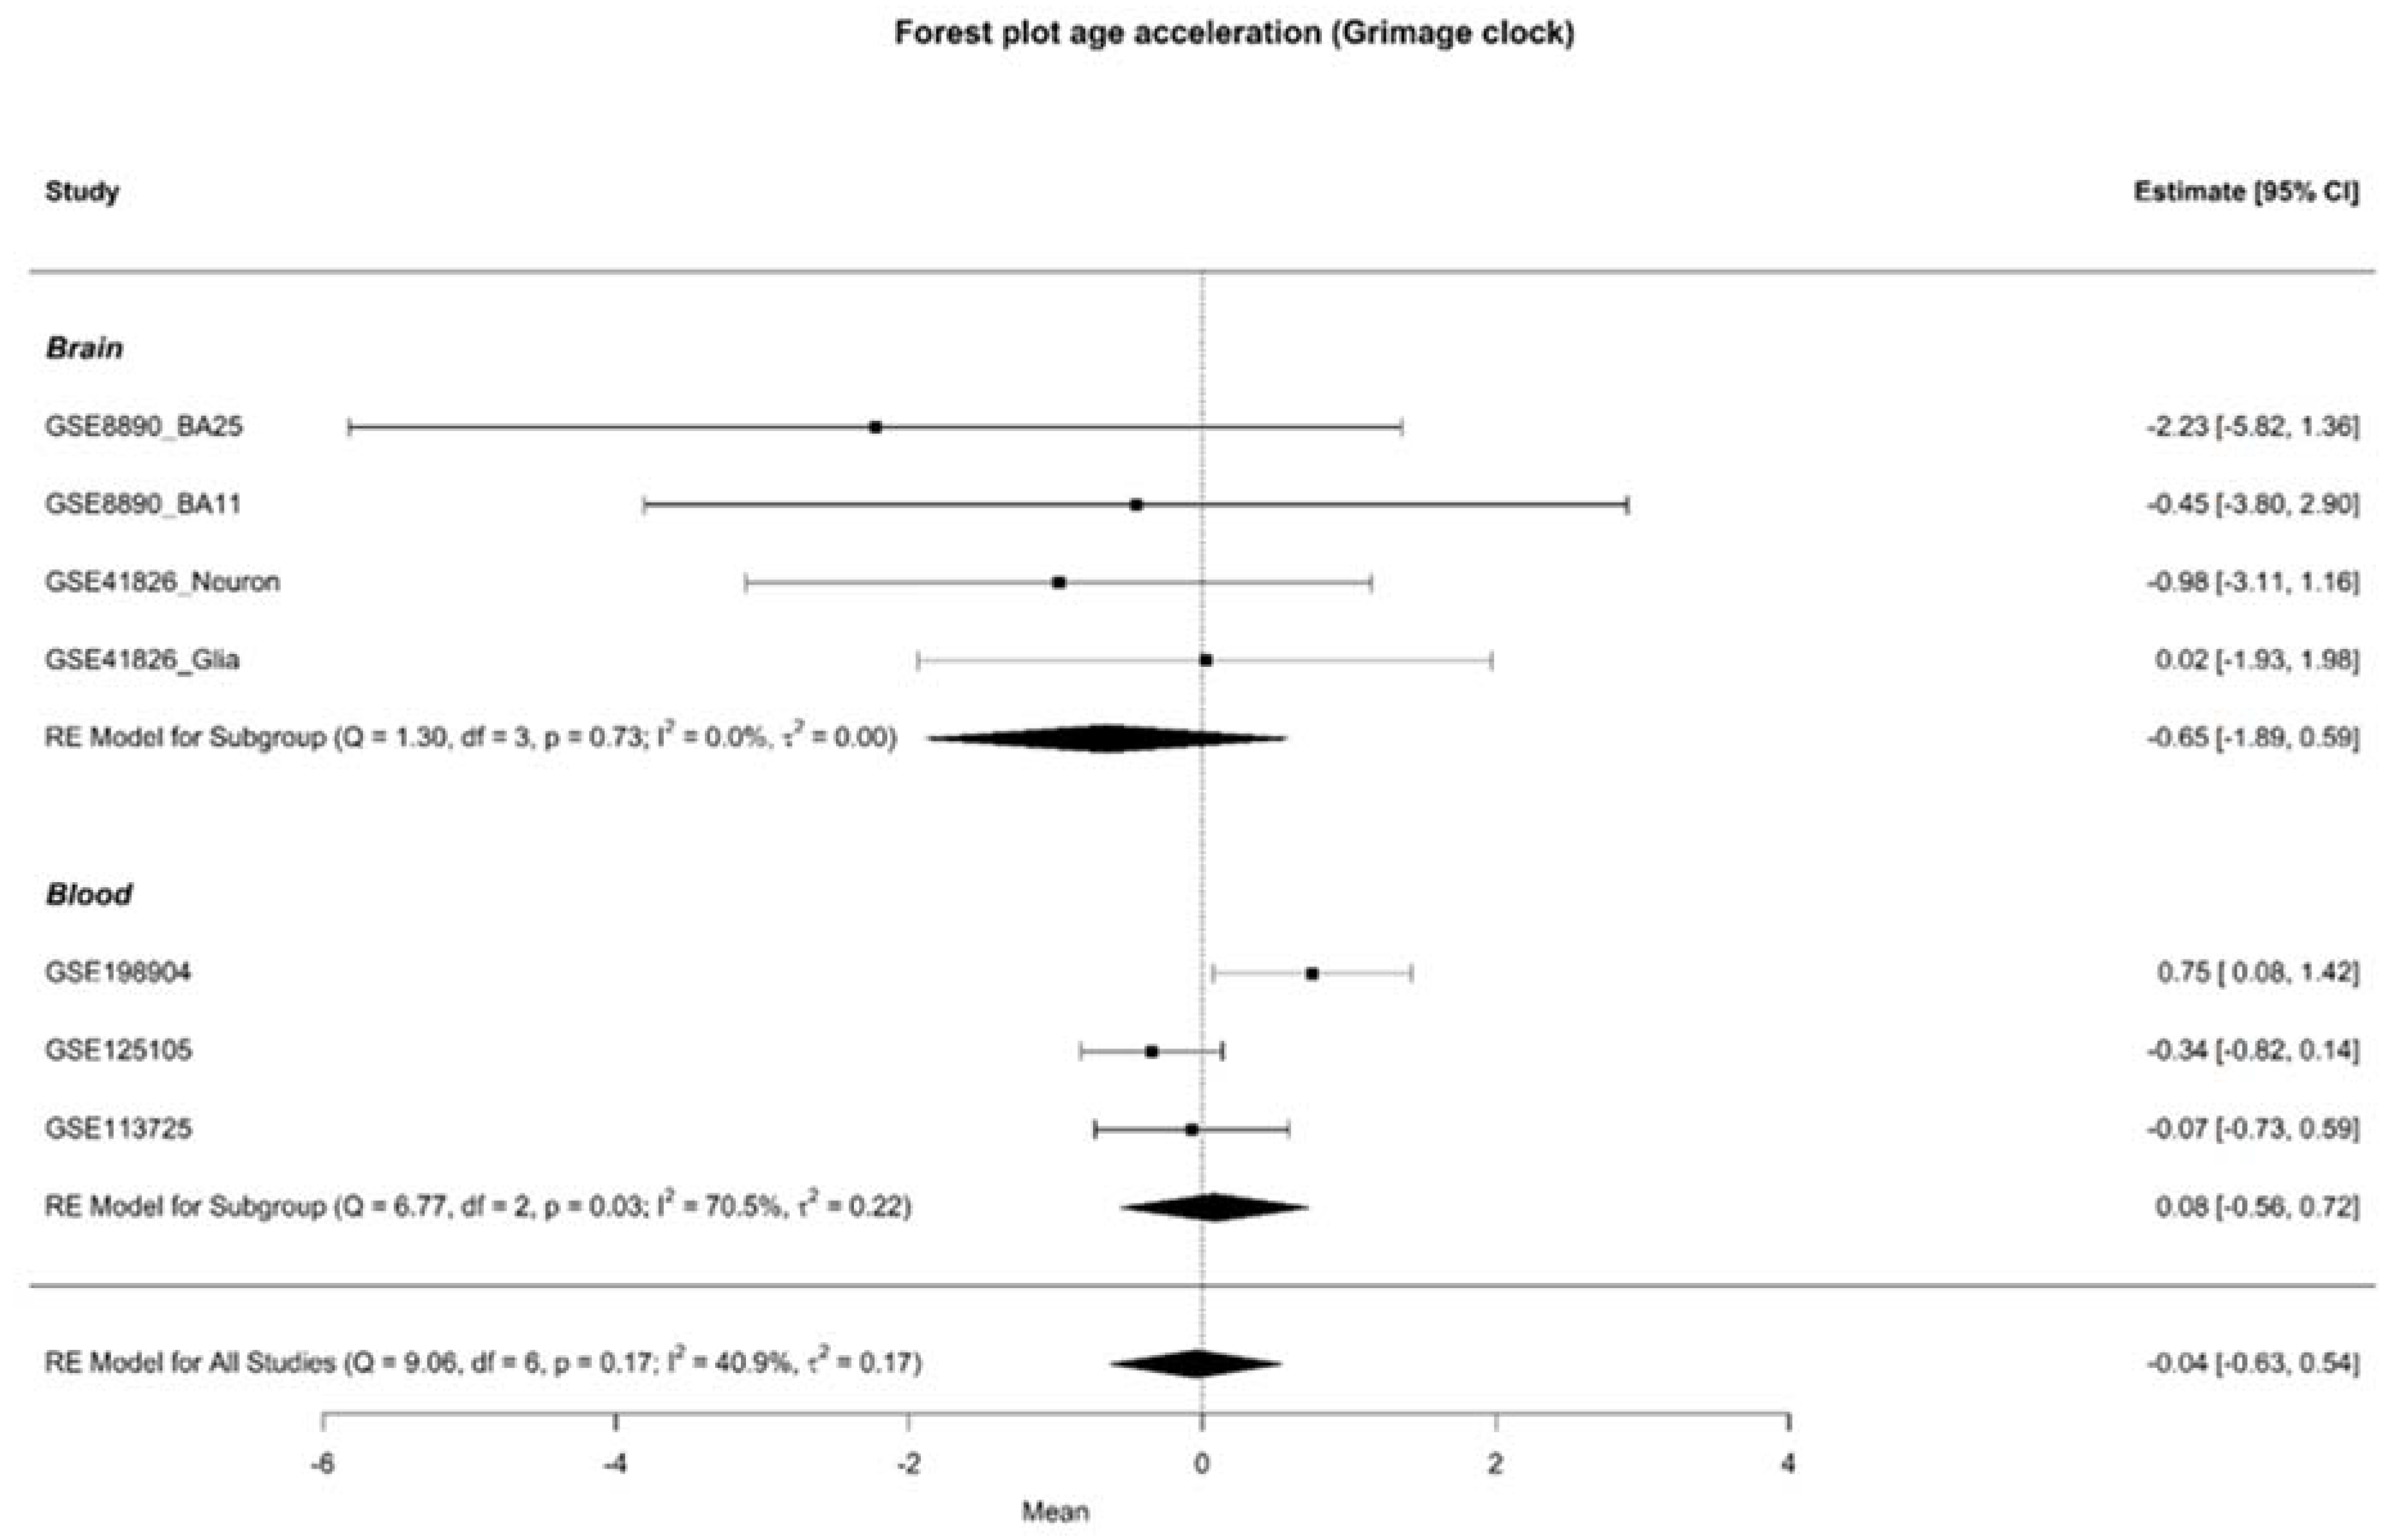
Figure 3.
The forest plot displays the observed outcomes as odds ratios on the x-axis and the 95% confidence intervals resulting from the analysis of the association between epigenetic drift and depression, based on a logistic regression model. The vertical line highlights the area of no effect (OR=1), with the size of each square proportional to the study's influence on the overall estimate.
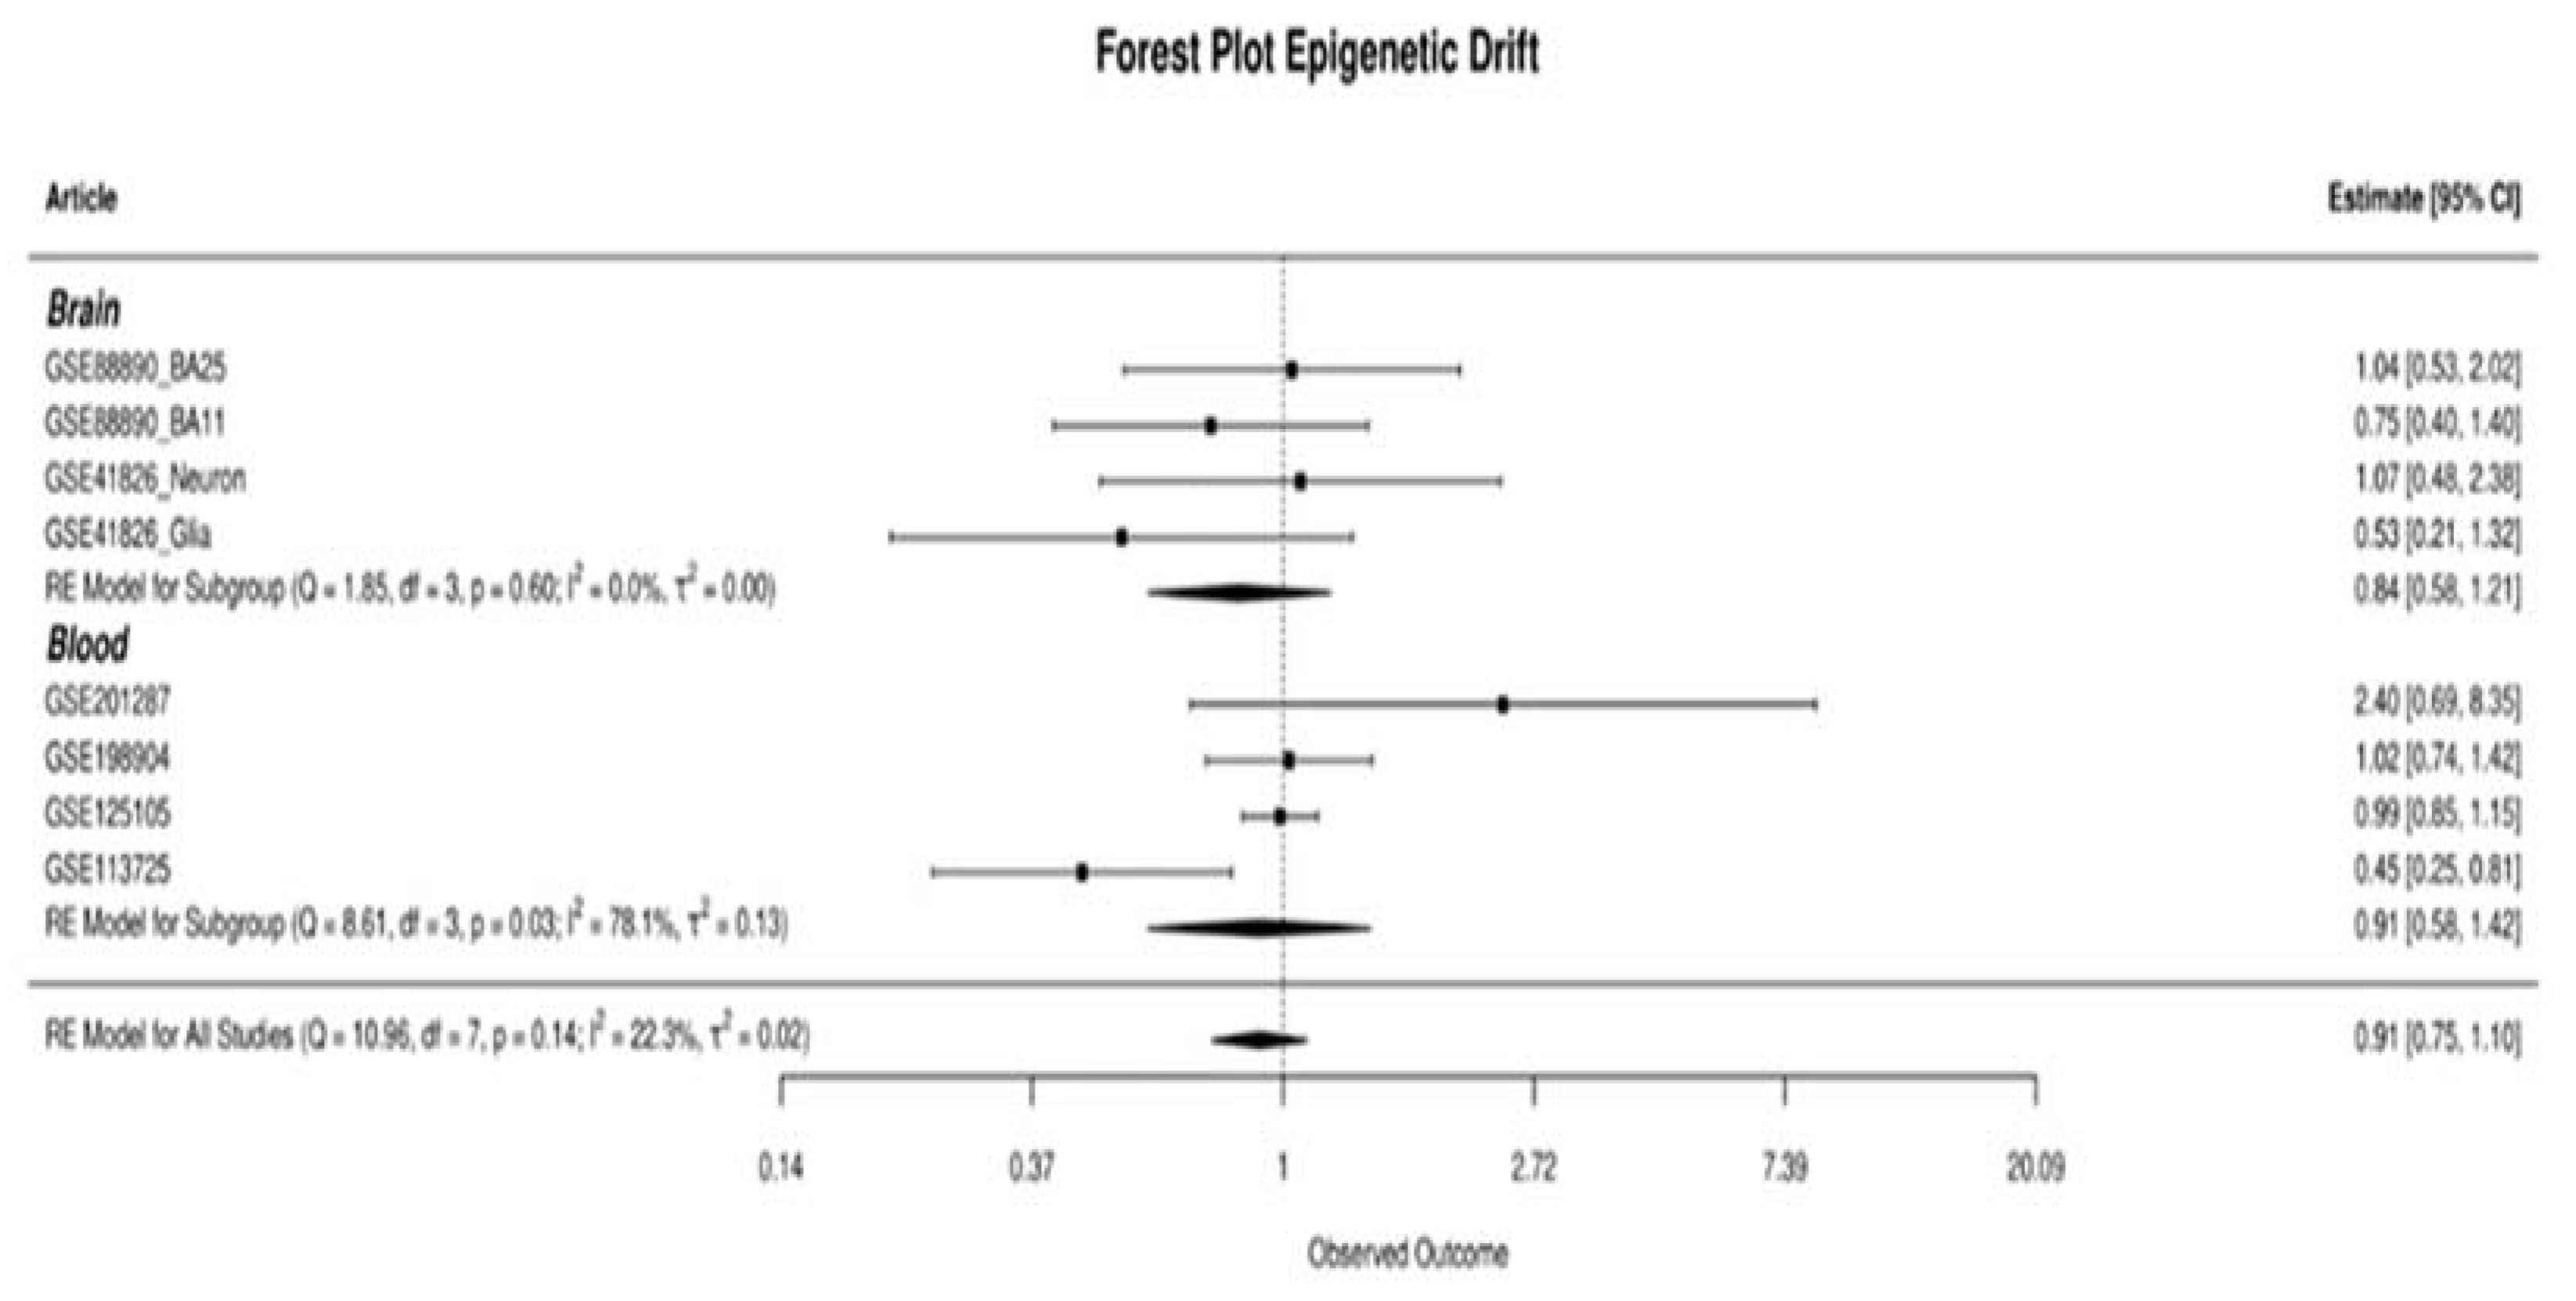
Figure 4.
(A) Venn’s diagram in describing the intersection of genes’ lists. From epivariation we identified 51 genes from blood tissues and 1 gene emerged from the brain. An intersection was performed with the list of genes involved in epivariations in blood, the list with genes epivariated in brain and the list with epivariations provided by Garg et al. (2020) [30]; (B) Expression of the genes found epivariated in brain and blood. The expression of the epivariated genes (present in 0 controls and in more than 3 cases) was analyzed with GTEX. Expression is quantified by transcript per million (TPM), which is the ratio of number of transcripts per gene over the total number of transcripts in the sample multiplied by 106.
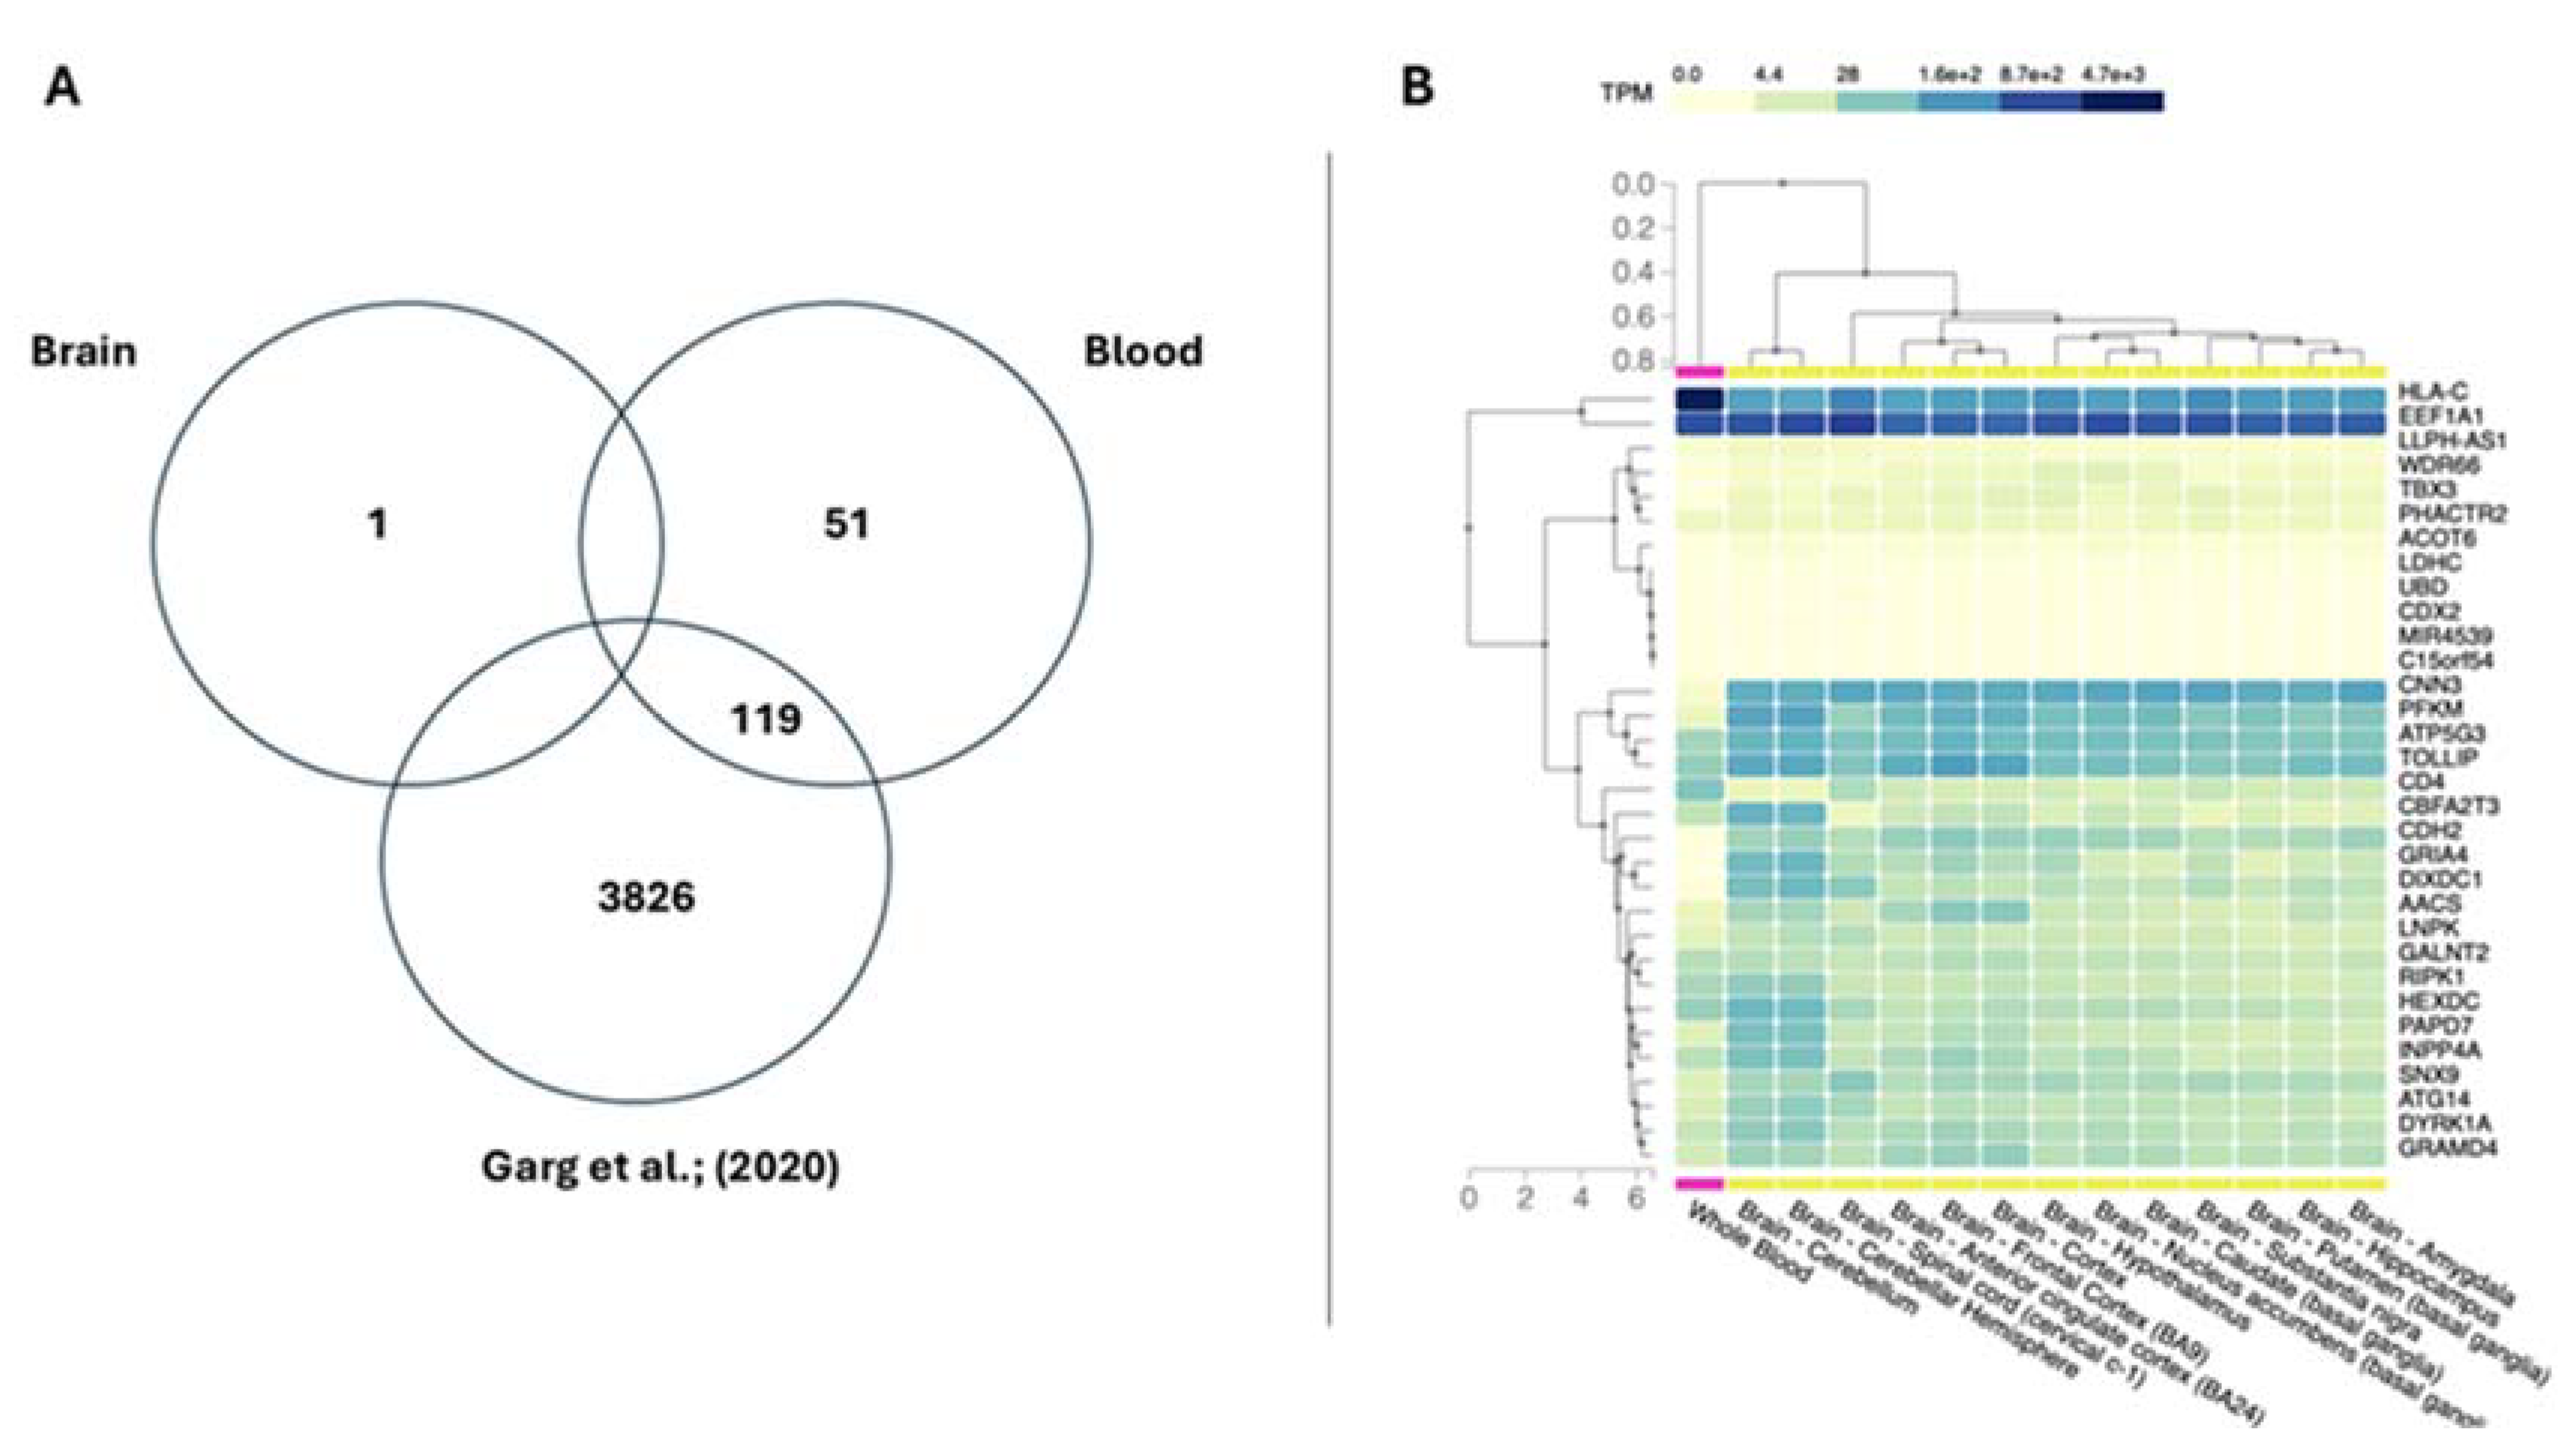

Table 1.
Dataset included in the analysis. The table describes the selected studies downloaded from GEO Database with main information about GSE code, tissue of methylated data extraction, number of cases and controls per each study, array type, Country, publication year, and DOI of reference.
Table 1.
Dataset included in the analysis. The table describes the selected studies downloaded from GEO Database with main information about GSE code, tissue of methylated data extraction, number of cases and controls per each study, array type, Country, publication year, and DOI of reference.
| GSE Accession |
Tissue | Number of cases | Number of controls | Array Type | Country | Publication Year | Study DOI |
| GSE113725 [3] | Blood | 48 | 48 | Illumina 450K | UK | 2018 | 10.1093/hmg/ddy199 |
| GSE198904 [4] | Blood | 548 | 100 | Illumina 850K | USA | 2022 | 10.1038/s41598-022-22744-6 |
| GSE201287 [5] | Blood | 40 | 40 | Illumina 450K | China | 2022 | 10.1073/pnas.2201967119 |
| GSE125105 [6] | Blood | 489 | 210 | Illumina 450K | Germany | 2019 | 10.1038/s41398-021-01756-2 |
| GSE88890(BA2) [7] | Brain | 17 | 18 | Illumina 450K | UK | 2017 | 10.1038/tp.2016.249 |
| GSE88890(BA11) [7] | Brain | 20 | 20 | Illumina 450K | UK | 2017 | 10.1038/tp.2016.249 |
| GSE41826(Glia) [8] | Brain | 29 | 29 | Illumina 450K | USA | 2013 | 10.4161/epi.23924 |
| GSE41826(Neuron) [8] | Brain | 29 | 29 | Illumina 450K | USA | 2013 | 10.4161/epi.23924 |
Disclaimer/Publisher’s Note: The statements, opinions and data contained in all publications are solely those of the individual author(s) and contributor(s) and not of MDPI and/or the editor(s). MDPI and/or the editor(s) disclaim responsibility for any injury to people or property resulting from any ideas, methods, instructions or products referred to in the content. |
© 2024 by the authors. Licensee MDPI, Basel, Switzerland. This article is an open access article distributed under the terms and conditions of the Creative Commons Attribution (CC BY) license (http://creativecommons.org/licenses/by/4.0/).
Copyright: This open access article is published under a Creative Commons CC BY 4.0 license, which permit the free download, distribution, and reuse, provided that the author and preprint are cited in any reuse.


