
Submitted:
14 November 2025
Posted:
17 November 2025
You are already at the latest version
Abstract
The article analyses the direction and intensity of changes occurring in agriculture in mountain areas in Europe between 2000 and 2022. For the calculations, the ESA CCI Land Cover global land-use map set was used. This dataset was established by the European Space Agency (ESA) through the classification of satellite images obtained from the following data sources: MERIS, AVHRR, SPOT, PROBA, and Sentinel-3. In the next step, the organisational features and economic performance of farms located in mountain areas of the European Union were determined for the period 2004–2022. For this purpose, data from the European Farms Accountancy Data Network (FADN-FSDN) were used. Subsequently, using Poland as a case study, the capacity of mountain agriculture to implement key environmental interventions (eco-schemes, organic farming, and agri-environment-climate measures) under the Common Agricultural Policy (CAP) 2023-2027 was assessed. The results highlight the varying directions and intensity of organisational changes occurring in mountain agriculture across Europe. They also show that farms can operate successfully in these areas, although their economic situation varies between EU countries. The findings indicate the need for further adaptation of CAP instruments to better reflect the ecological and economic conditions of mountain areas. Strengthening support mechanisms for these regions within the current and future CAP is of crucial importance for protect biodiversity, promoting sustainable land use, and maintaining the socio-environmental functions of rural mountain landscapes.
Keywords:
agriculture
; mountains areas
; farms
; sustainability
; income
; eco-schemes
; institutions
; organic farming
; agri-environment-climate interventions
; EU CAP 2023-2027
1. Introduction
According to The Global Risks Report 2025, published as part of the annual World Economic Forum in Davos, one of the most significant global threats is the continuing degradation of natural resources [64]. A key natural resource is soil, whose good condition plays a crucial role in protecting biodiversity, combating climate change, and ensuring food security. For example, in the European Union (EU), approximately 60–70% of soils are in an unsatisfactory condition due to unsustainable land use [18]. These soils are increasingly degraded as a result of erosion, compaction, pollution, salinisation, desertification, and the loss of organic matter and biodiversity [19,20,21]. Agriculture has a major impact on this situation: when mismanaged, it leads on the one hand to excessive exploitation of agricultural land with favourable natural conditions, and on the other to the abandonment of land of lower agricultural value, which had previously often been used extensively [1,28,46,58]. As a result of these processes, EU soils lose around one billion tonnes of organic matter annually [18]. This situation is concerning in the context of improving soil retention and absorption capacity, as well as its mitigation and adaptation potential in relation to climate change. Lower soil fertility reduces land productivity and crop yields, affecting agricultural output, food security, international agri-food markets, and the global economy [59]. Consequently, this condition entails not only high environmental costs but also additional negative social consequences [5].
In Europe, additional measures are urgently needed to enhance soil protection beyond the current level. This is particularly important in mountain areas, where agricultural land is characterised by poor soil quality, low natural organic matter content, and a high risk of erosion. Moreover, European mountain agriculture plays a major role from environmental, cultural-historical, aesthetic, economic, and social perspectives. These areas cover 36% of Europe’s total surface area, accounting for 18% of all farms and 15% of the agricultural labour force in the EU. They also include 43% of all Natura 2000 sites and produce one-third of all geographical indications registered in the EU. However, a major weakness of these areas is their low agricultural productivity, which is around 40% lower than in other regions of Europe [16]. These regions thus face challenges that significantly limit the viability of profitable agricultural activity. In European agriculture as a whole, a fundamental problem is that labour costs (wages) in the national economy and prices of agricultural inputs are rising faster than the selling prices of agricultural products, resulting in a decline in the unit profitability of agricultural production [47]. This process has particularly adverse implications for agriculture in mountain areas.
The aim of this paper is to determine the direction and intensity of changes occurring in agriculture in mountain areas in Europe between 2000 and 2022. An equivalent objective is to identify the organisational and economic characteristics of farms in these areas across the EU. Another important aim is to assess the extent to which farms in mountain areas of Poland are inclined to implement institutional environmental measures under the Common Agricultural Policy (CAP) 2023-2027. It should be emphasised that the international literature lacks up-to-date analyses in this field. This study therefore seeks to fill this research gap.
2. The Importance of Agriculture in Mountain Areas – Literature Review
In Europe, agriculture in mountain areas faces a number of constraints that adversely affect the viability of economically justified agricultural production. These include low soil quality, unfavourable climatic conditions limiting the growing season of crops, and terrain with elevations and steep slopes, as well as the frequent fragmentation and remoteness of agricultural plots [26,32]. Other challenges include depopulation and the ageing of the farming population, the small average size of mountain farms—often operated by part-time owners—and the increasing share of non-agricultural income, particularly from tourism and trade in mountain regions [31,35,39]. Limited access to a wide range of agricultural infrastructure and services, which are often scattered, is also a key factor contributing to the abandonment of farming in mountain areas. In other words, these regions are increasingly affected, on the one hand, by factors related to the ageing of farm owners and the lack of successors, and on the other, by the growing attractiveness and diversity of alternative lifestyles [43].
Across many European mountain regions, the process of agricultural land abandonment is progressing. The main causes should be sought primarily in biophysical factors such as unfavourable soil properties, topography, and climate, as well as in economic and demographic drivers [54,63]. This process leads to the loss of the traditional mountain landscape, which constitutes a unique cultural heritage characterised by diversity, rich biodiversity, and extensive livestock farming based on permanent grasslands [16,34]. In many European mountain areas, the area of extensively managed permanent grasslands is declining, even though, given the difficult terrain and climatic conditions, this should remain a key agricultural activity. In many such regions, a process of deanimalisation is taking place, leading to a reduced number and density of ruminants, particularly cattle. This is a highly unfavourable trend, as supporting ruminant grazing should be considered an important method of protecting semi-natural meadows and pastures in mountain areas [48,49]. The absence of livestock farming in these regions triggers natural vegetation succession, leading to the spread of shrubs and forests, which quickly become the dominant vegetation type [2]. Another issue is the succession of invasive species. In Poland, around 75% of abandoned agricultural land is affected by varying degrees of invasion by plant species such as goldenrod (Solidago), common walnut (Juglans regia), and box elder (Acer negundo). As these species become more prevalent, the abundance of wild pollinators—including butterflies—declines [3,41]. Consequently, the diversity of flora and fauna that thrives in a varied landscape of fields and meadows is diminishing [7].
A way to counteract the adverse processes occurring in mountain areas may be to establish dedicated sustainable development strategies aimed at more effectively promoting environmental protection, social justice, and production growth [61,65]. However, such measures must be diversified at the regional level and adapted to the local specificities of agriculture. It should be noted that mountain agriculture is often characterised by contrasts: these are not only regions prone to the abandonment of marginal land, but also areas where farming is successfully practised in topographically and climatically favourable locations, with intensified livestock production on productive pastures in mountain valleys and the development of permanent crops, including vineyards [25,30].
Carefully designed strategies for agriculture in mountain areas can foster the consumption of food with distinctive and valuable health-promoting qualities, produced in a diverse and environmentally rich landscape. Indeed, consumers are becoming increasingly aware of the environmental consequences of their choices, as reflected in the growing attention paid to the origin of purchased products. In other words, rising environmental awareness and increasing demand for environmentally friendly food products may serve as an important incentive for producers in mountain areas to adopt sustainable production techniques, provided that potential consumers are simultaneously informed about these practices [53]. The multifunctionality of mountain agriculture and the provision of ecosystem services to society on a broad scale may thus become an important driver of its development [13]. At the same time, agritourism activities and the production of regional goods, including those of animal origin, should play a key role in increasing farm income [37]. To achieve satisfactory income levels from agricultural activity in these regions, support policies are of critical importance. In the EU, such policies primarily focus on the development of agri-environment-climate programmes, though these are not the only relevant instruments. Equally significant is the support for agricultural investment and, in some cases—such as in Italy—public investment aimed at building and maintaining local dairies and transport infrastructure in mountain areas.
One of the fundamental means of improving management, producing high-quality food, and protecting ecosystem services in mountain areas should be the presence of institutions that operate effectively in the interests of both farmers and society. In these regions, institutional rules and mechanisms are essential to regulate and financially motivate farmers to engage in behaviour that meets societal expectations—namely, the provision of food with high nutritional and sensory value, as well as a wide range of environmental public goods [51,62]. It is crucial to establish institutional conditions not only in the form of subsidies, but also through easier access to new technologies, including specialised agricultural machinery and services [11,40]. Effective advisory systems and local associations are also needed, as they often play a practical role in shaping farmers’ knowledge and attitudes towards management practices and the provision of ecosystem services [6]. In the European Union, all these functions are supported by the Common Agricultural Policy (CAP), which is revised every few years and is becoming increasingly responsive to societal demands regarding its environmental orientation [38]. Institutional measures aimed at protecting the natural environment play a significant role in the EU CAP 2023–2027, thereby supporting the implementation of the European Green Deal objectives [74]. The CAP supports the EU’s mountain regions through financial assistance, the promotion of sustainable farming practices, and contributions to social cohesion [15]. Among these measures, particular importance should be attached to the eco-schemes under Pillar I, and to the organic farming and agri-environment-climate interventions under Pillar II of the current EU CAP [52,57,75]. These instruments can sustain profitable agricultural activity and preserve traditional rural landscapes in mountain areas. However, in order to disseminate these practices more widely, ongoing training campaigns are required at the regional level, tailored to the local agricultural context. Such initiatives should encourage farmers to adopt the practices that best match their capacities, needs, and operating conditions. Before implementing them, farmers should receive professional guidance to determine whether, and which, practices can be introduced on their farms so that, under specific conditions, they effectively contribute to environmental protection while also delivering tangible economic benefits.
3. Materials and Methods
The analysis of the direction and intensity of land-use changes in Europe’s mountain areas over the long term was based on: 1) a qualitative spatial assessment of the variation in the share of agricultural land (cropland and orchards), grassland, and urban areas, as well as the rate of change in their surface area, and 2) a quantitative attempt to explain the shares and rates of change through spatial variables representing the drivers of land-use diversity and transformation identified in the literature. For the purpose of calculating the surface area of agricultural and built-up land and its changes, the ESA CCI Land Cover global land-use dataset was used [8,10]. This dataset was produced by the European Space Agency (ESA) through the classification of satellite images from multiple sources (MERIS, AVHRR, SPOT, PROBA, and Sentinel-3). It consists of raster layers with a spatial resolution of 300 metres (at the equator) and an annual temporal resolution (currently covering the years 1992–2022). Land use in the ESA CCI Land Cover layers is assigned to 22 classes of the Land Cover Classification System (LCCS) developed by the Food and Agriculture Organization of the United Nations (FAO) [12]. Since the agricultural land types of interest—cropland and grassland—are represented across several LCCS classes, their values were aggregated with appropriate weighting. Both the shares and rates of change in surface area were calculated in all cases using linear regression parameters describing the relationship between the natural logarithm of the surface area of a given land type and the year. In this model, the intercept represented the share of a given land type in the year 2000, while the slope indicated the average rate of change in surface area between 2000 and 2022 (Table 1).
Due to the limited availability of other data useful for the planned analysis (income and population data), the study used the ESA CCI Land Cover layers for the years 2000–2022, covering the entire European continent (including the whole area of Turkey). The scope of the analysis was then further restricted to mountain areas, as defined by the extent of the Global Mountain Biodiversity Assessment (GMBA) vector layer [60]. Next, the smallest administrative units were selected for which income and population data were available. Within the EU, these were NUTS 3 units, and outside the EU, their equivalents at the NUTS 2 or NUTS 1 level. For EU administrative units, the official vector boundary layer was used [23], whereas for non-EU regions, a publicly available global vector boundary dataset was applied [50]. In total, the database comprised N = 920 records, corresponding to administrative units located within Europe’s mountain regions. In addition to the aforementioned income and population data, the administrative units were supplemented with information on natural conditions in the designated mountain areas: the average slope, climatic humidity measured by the Aridity Index [67], and average annual temperature (Table 2). To identify potential institutional influences, two additional variables were included: the population of the country to which the region belongs (CPOP) and the number of years of its membership in the EU or its predecessors (EUy).
Both the land-use and natural condition data were extracted from several raster layers and averaged within administrative units. The calculations were performed using the Google Earth Engine cloud service [27,70] by running custom scripts developed for the analysis directly through a web browser.
To quantitatively represent the state and changes in land use, the study employed the classical machine learning method Random Forest (RF) [4]. As an ensemble of decision trees, this algorithm not only reduces the risk of overfitting but also captures complex, non-linear relationships within the data. RF is often considered the method of first choice in machine learning due to its high predictive accuracy, even when default model parameters are applied.
The construction of the RF model, its validation, and the graphical presentation of results were carried out using R Statistical Software [55] and the relevant packages: randomForest [42], caret [36], and ggplot2 [68]. The RF model was trained using the package’s default settings (ntree = 500; mtry = number of variables/3). For each RF model, the impact of explanatory variables on model error was visualised using a horizontal bar chart of feature importance, where explanatory variables were ranked in descending order according to the ratio between the mean absolute error of the model with the variable randomly permuted ten times (MAEpermut) and the mean absolute error of the model with the original variable (MAEorg). For every RF model, Partial Dependence Plots (PDPs) were also generated to visualise the effect of individual explanatory variables on the dependent variable. The black, semi-transparent points on these plots represent the original data, while the red lines depict the function that the RF model would use to compute the dependent variable based on the selected explanatory variable, assuming that all other explanatory variables remain constant. The predictive performance of the RF model was evaluated by calculating the mean values of several commonly used model error metrics — RMSE, MAE, and R² — under 5-fold cross-validation (Table 2).
In the next analytical section of the study, the organisational structures and economic performance of farms located in mountain areas of EU countries were examined. This approach followed the widely accepted view in the literature that farm data collected within the European Farm Accountancy Data Network (FADN-FSDN) system provide a comprehensive dataset on agriculture in the EU Member States [66,71]. Based on these data, the organisational and economic conditions of farms located in mountain areas classified as Areas facing Natural and other specific Constraints (ANCs) were assessed in an international context, using average values for the years 2004–2022. For this purpose, data published by the European Commission on its official FADN-FSDN website were used [24].
The subsequent part of the study focused on assessing the condition of agriculture in mountain areas of Poland, particularly regarding the tendency of farms to implement environmental measures under the Common Agricultural Policy (CAP) 2023-2027. These include eco-schemes, which are part of the first pillar of the EU CAP 2023-2027. While eco-schemes are mandatory for all Member States, their implementation by farmers is voluntary. They are fully financed from EU funds and do not require national co-financing. Eco-schemes constitute a form of additional direct support compensating farmers for extra costs or income losses incurred in providing society with environmental benefits, including maintaining a diverse crop structure. However, the analysis also included other types of interventions—organic farming and agri-environment-climate measures—implemented under Pillar II of the EU CAP 2023-2027. The overarching objective of these three measures is to support farm incomes while simultaneously improving environmental conditions and increasing the provision of public goods. The inclination to implement these measures was examined across municipalities differentiated by the share of mountain agricultural land in their total utilised agricultural area (UAA): 100%, 25–99.9%, and below 25%, and compared with other municipalities (Figure 1).
4. Results
4.1. Direction and Intensity of Changes in Agriculture in Europe’s Mountain Areas
In the first part of the results section, an analysis was conducted of the processes affecting land use in Europe’s mountain areas between 2000 and 2022. The study began with a qualitative spatial assessment of the variation in the share of cropland (arable land and orchards), grassland, and urban areas, as well as the rate of change in their surface area.
The highest shares of cropland (above 17%) were recorded in the mountains of south-eastern Europe: the Apennines, Dinaric Alps, Hellenides, Pontic Mountains, and the Anatolian and Armenian Plateaus. The lowest shares of cropland (below 3%) occurred in the Alps, the western Caucasus, and the northern mountain regions of Europe — including Iceland, the Caledonian Mountains, the Scandinavian Mountains, and the Urals (Figure 2). The rate of change in area was strongly variable at the local level; however, a general pattern could be observed — a predominance of cropland area reduction in the mountains surrounding the Mediterranean basin, and their expansion in the mountains of central and northern Europe, except for the northern parts of the Scandinavian Mountains and the Urals (Figure 3).
The highest shares of grassland (above 19%) were found in the mountains of north-western Europe — Iceland, the Caledonian Mountains, Jura Mountains, Alps, Massif Central, and the northern Pyrenees — as well as in south-eastern Europe, including the Anatolian and Armenian Plateaus, the Crimean Mountains, and the eastern Caucasus (Figure 4). The lowest shares of grassland (below 4%) were recorded in the mountains of southern central Europe, including parts of the Apennines, the northern Dinaric Alps, the southern Carpathians, the Balkan Mountains, the Rhodopes, and the Pontic Mountains (Figure 4). The rate of change in grassland area showed even greater local variation than that of cropland. A predominance of grassland reduction was observed in the Caledonian Mountains, Apennines, Armenian Plateau, and eastern Caucasus, while increases were most pronounced in the Galician Massif, Cantabrian Mountains, southern Scandinavian Mountains, eastern Alps, northern Carpathians, southern Hellenides, eastern Anatolian Plateau, Pontic Mountains, Taurus Mountains, and northern Urals (Figure 5).
The highest shares of urbanised areas (above 0.85%) were found in the mountain ranges of south-central Europe — the Alps, Carpathians, and Apennines — as well as in the south-western Scandinavian Mountains. The lowest shares of urbanised areas (below 0.06%) were noted in the northern, western, and eastern parts of Europe, particularly in the northern Urals and sections of the northern Scandinavian Mountains (Figure 6). The rate of change in urbanised area was also locally variable, but a clear trend was evident: stagnation or even reduction of urban land in the northernmost parts of Europe, contrasted with expansion in southern Europe (Figure 7).
The Random Forest (RF) model for the initial (year 2000) share of cropland area in the surface area of mountain regions (pCropl) produced cross-validation test predictions with an RMSE of approximately 8 percentage points and R² = 0.59 (Table 3). The variables that had the strongest influence on model accuracy were mean annual air temperature (TEMP), Aridity Index (AI), and the GDP per capita of a region expressed as a percentage of the EU average (pGDPpc). The share of cropland area increases with higher TEMP, but decreases with rising AI and pGDPpc (Figure 8 and Figure 9).
The RF model for the rate of change in cropland area (crpCropl) produced cross-validation predictions with an RMSE of approximately 1 percentage point and R² = –0.17 (Table 3). The negative R² value indicates that the model’s predictions are worse than those of a baseline model predicting an average rate of change across all regions. This property disqualifies the model; therefore, it will not be discussed further.
The RF model for the initial share of grassland in the surface area of mountain regions (pGrasl) yielded cross-validation test predictions with an RMSE of approximately 10 percentage points and R² = 0.50 (Table 3). The strongest predictors were mean annual air temperature (TEMP), Aridity Index (AI), and the population of the country to which the mountain region belongs (CPOP). The share of grassland decreases with increasing TEMP, and increases with rising AI and CPOP (Figure 10 and Figure 11).
The RF model for the rate of change in grassland area (crpGrassl) produced cross-validation predictions with an RMSE of approximately 0.8 percentage points and R² = –0.08 (Table 3). As in the case of crpCropl, this negative R² value disqualifies the model, and it will not be discussed further.
The RF model for the initial share of urbanised areas in the surface area of mountain regions (pUrban) produced cross-validation test predictions with an RMSE of approximately 3 percentage points and R² = 0.36 (Table 3). The most influential variables for model accuracy were population density (POPd) and GDP per capita relative to the EU average (pGDPpc). The share of urbanised areas increases with both POPd and pGDPpc (Figure 12).
The RF model for the rate of change in urbanised areas (crpUrban) yielded cross-validation test predictions with an RMSE of approximately 2 percentage points and R² = 0.40 (Table 3). The variables with the strongest impact on model performance were the initial share of urbanised areas (pUrban), mean annual temperature (TEMP), and the rate of change in regional population density (crPOPd). The rate of urban expansion decreases with higher pUrban, but increases with rising TEMP and crPOPd (Figure 13).
The influence of the variables CPOP and EUy on model accuracy was not decisive for any of the models. The population of the country to which the region belongs (CPOP) had the greatest importance for the models of grassland share (pGrassl) (3rd position), cropland share (pCropl) (4th position), and urbanised area share (pUrban) (6th position). In all three cases, the surface shares increased with rising CPOP. The length of EU membership (EUy) had the greatest influence on the pUrban (3rd position) and pCropl (5th position) models. The share of urbanised areas (pUrban) increased with longer EU membership, while the share of cropland (pCropl) decreased as EU membership duration grew.
4.2. Organisational Implications for Agriculture in Mountain Areas of the EU
One of the reasons for the declining productive role of mountain agriculture is its low competitiveness, resulting from unfavourable natural conditions for agricultural production, a low level of intensity, and low efficiency of input use. Under such circumstances, it is justified to ask what organisational and economic characteristics define the farms located in mountain areas of the EU Member States included in the European FADN-FSDN database. The analysis therefore focused on the most economically viable farms in these regions—those that demonstrate the potential for continued existence and development.
The analysis used data from groups of farms located in mountain areas of the EU Member States monitored by the European FADN-FSDN system. For ten countries, data covered the years 2004–2022; for Austria, the period 2004–2021; and for Bulgaria, Germany, and Romania, the years 2007–2022.
The figures presented in Figure 14 show that the most economically robust farms in mountain areas are found in Czechia, Sweden, France, and Finland. In the first two countries, the average farm generated a standard output of €155.4 thousand and €113.9 thousand, respectively. Conversely, farms with the lowest economic potential were mainly located in the new Member States—Romania, Poland, Bulgaria, and Slovenia—as well as in Greece and Portugal, where the average standard output ranged between €9.0 thousand and €22.5 thousand.
Table 4 presents indicators characterising agricultural holdings located in mountain areas of selected the EU Member States. The first indicator refers to the average farm area. The average utilised agricultural area (UAA) available to a farm ranged, during the analysed period, from 7.8 ha in Romania to 207.7 ha in Czechia. In Poland, the average area of a farm in mountain regions covered by the FADN-FSDN system was 11.2 ha, which was more than twice the average size of all farms in mountain areas of the country.
There are also notable differences among the EU Member States regarding labour input per farm and capital resources. The total labour input per farm ranged from 1.24 Annual Work Units (AWU) in Greece and Italy to 5.22 AWU in Czechia. In Poland, the average labour input amounted to 1.65 AWU, a value lower than that observed in France, Bulgaria, and Czechia. The average capital value per farm in Poland during the analysed period was €51.2 thousand; lower values were recorded only in Romania, Bulgaria, and Portugal. Among the remaining countries, the highest average capital value was found in Czechia and Austria.
The structure of arable land represents the organisation of crop production on a farm and refers to the percentage share of particular crops or crop groups within the utilised arable land area. The selection of crops grown on farms in mountain areas depends on multiple factors, primarily soil quality, climatic conditions, topography, and the individual decisions of farmers. Poland, similarly to Czechia, Spain, Germany, Greece, and Romania, belongs to the group of countries where cereals account for at least 50% of the arable land area (Figure 15). The lowest share of cereals (below 25.0%) in the cropping structure is recorded in the mountain farms of Portugal, Sweden, and France.
In farms located in mountainous areas, livestock production plays a very important role — both as a branch of agricultural activity and as a source of household income. On average, the livestock density in the analysed EU mountain farms amounted to 108.3 LU per 100 ha of UAA. Farms in Greece had a livestock density more than three times higher than Polish farms (91.6 LU/100 ha), while slightly higher values were observed in Germany’s mountain regions (132.9 LU/100 ha), as well as in Bulgaria, Finland, Romania, and Slovenia. The lowest livestock density was noted in the mountain farms of Czechia and Sweden, with 58.0 and 68.3 LU/100 ha, respectively.
4.3. Economic Implications of Agriculture in Mountain Areas of the EU
The efficiency of production factors in farms was determined using indicators of productivity and profitability. Productivity was assessed by relating the value of production to the inputs of individual production factors: land (total output per 1 ha of UAA), labour (total output per 1 total AWU). Profitability, on the other hand, was determined by establishing the relationship between farm family income and the inputs of land (farm family income per 1 ha of UAA) and own labour (farm family income per 1 FWU).
Figure 16 presents partial productivity indicators—for land and labour—in farms located in mountain areas of Poland compared with selected the EU Member States. The land productivity in Poland during the period 2004–2022 amounted to €1.2 thousand per hectare, which indicates a weak competitive position of Polish farms in this respect. This figure represented only 50.0% of land productivity in Italy and barely 44.5% of that achieved by producers in Germany. Other Member States such as Czechia, Bulgaria, Portugal, and Spain also showed a weak competitive position in terms of the efficiency of land use.
Labour productivity, measured as output per one full-time worker, exhibited significant variation among EU countries. The highest competitive position in this respect was achieved during the study period by farmers in the Scandinavian countries—Sweden and Finland—where labour productivity was ten times higher than in Polish farms. In Poland, this indicator was the lowest, at €8.4 thousand per AWU, similar to values recorded in Romania and Bulgaria. This should be associated with an unfavourable agrarian structure and significantly lower technical equipment levels in agriculture within mountain areas of these countries.
The EU Member States differ in terms of farm income levels, which result from a combination of factors, primarily structural differences such as farm size, production type, ownership conditions, and the initial state of agriculture at the time of EU accession, as well as the propensity to implement environmental measures. Polish farms located in mountain areas, alongside those in Romania and Slovenia, recorded the lowest farm income, amounting to €6.4 thousand per farm. The highest average farm incomes were observed in Czechia (€36.1 thousand) and Germany (€34.5 thousand).
Profitability reflects the relationship between the income generated by a farm and the inputs of land and labour. The profitability of labour, expressed as farm family income per family work unit (FWU), showed considerable variation across the EU (Table 5). During 2004–2022, this indicator ranged from €4.1 thousand/FWU in Romania to €27.4 thousand/FWU in Czechia. In Poland, the average annual income earned by a farmer or a member of their family amounted to €4.2 thousand, which was almost seven times lower than that achieved by agricultural producers in Czechia. High levels of labour profitability were also recorded in Germany, Spain, and Finland, where the indicator exceeded €22.0 thousand/FWU. A clear disparity can be observed between the ‘old EU’ Member States and the countries that joined the EU later. With the exception of Czechia, none of the countries that acceded in or after 2004 recorded a labour profitability indicator higher than €7.0 thousand/FWU.
The profitability of land also varied considerably across EU countries. In Poland, land profitability was higher than the average in Czechia, Sweden, France, and Finland, yet more than twice lower than in Greece and Italy (Table 5).
4.4. Agriculture in Mountain Areas in Poland versus the Propensity to Implement Environmental Interventions Under the EU CAP 2023–2027
In Poland, agricultural land in mountain areas accounts for 1.7% of the total potential utilised agricultural area. Among the country’s 2,477 municipalities, 62 have mountain agricultural land constituting 100% of their total agricultural area, 24 have a share ranging from 25% to less than 100%, and 31 have a share below 25%. In 2023, municipalities with varying levels of mountain agricultural land hosted 46.4 thousand farms, cultivating 274.5 thousand hectares. More than half of these farms operated in fully mountain municipalities, managing 120.5 thousand hectares of agricultural land (Figure 17).
In Poland’s mountain areas, the share of farms willing to implement environmental measures remains unsatisfactory. In municipalities with varying degrees of mountain land coverage, the proportion of farms participating in eco-schemes was significantly lower than in lowland municipalities. The same pattern applied to the share of agricultural land in farms supported by this measure within the total utilised agricultural area. The differences were smaller in the case of organic farming interventions. However, across all analysed municipalities—regardless of local farming conditions—the share of beneficiary farms under organic farming remained marginal, as did the share of land managed under organic farming relative to total agricultural land. Conversely, farms located in municipalities with mountain areas showed greater participation in agri-environment-climate interventions compared to lowland areas. In these cases, the share of beneficiary farms ranged from 10.2% to 23.7%, while the share of land covered by such interventions ranged from 20.2% to 37.9% of the total agricultural area. In contrast, in lowland municipalities, these shares were only 5.8% and 7.7%, respectively (Table 6 and Table 7; Figure 18).
5. Discussion and Conclusions
In the first results section, spatial analysis revealed a clear differentiation in the share of cropland, grassland, and urban areas across Europe’s mountain regions. High shares of cropland in the mountains of southern and south-eastern Europe (e.g. the Apennines, Hellenides, Anatolian Plateau) indicate a strong linkage between agriculture and the climatic and cultural conditions of these areas. In contrast, low shares in the Alps and Scandinavian Mountains may result from environmental constraints, such as cold climate and difficult terrain.
Similarly, grasslands dominate in cooler and more humid regions of north-western Europe, which may stem from traditional pasture-based systems and natural limitations on intensive farming. Conversely, their low share in southern Europe likely reflects urban pressure or agricultural intensification.
Although urban areas account for a small proportion of mountain land, they are concentrated in the Alps, Carpathians, and Apennines, reflecting the development of tourism infrastructure, settlements, and transport accessibility in these regions.
Observed trends point to an overall decline in arable land in southern regions (e.g. around the Mediterranean Basin), likely driven by climate change—particularly increasing aridity, urbanisation pressure, and structural transformations in agriculture. Conversely, in the northern and central regions of Europe, an increase in the area of arable land has been observed, which may be associated with improving climatic conditions, as the rise in global air temperature favours cultivation at higher latitudes, while also shifting upwards the altitude limits at which crop production is possible in mountain areas.
Changes in grassland areas are even more locally heterogeneous, suggesting the strong influence of regional factors, such as agricultural policies, demographic shifts, or economic transitions. In some regions, the increase in grassland area may reflect a shift from intensive to extensive land use systems.
Urbanisation patterns reveal a clear north–south divide, with expansion in southern Europe and reductions in the north. This may reflect population movements, tourism development, and changes in settlement structure.
The Random Forest (RF) models for the initial shares of land-use types showed moderate predictive accuracy (R² ranging from 0.36 to 0.59), indicating that such values can be partially explained by environmental and socio-economic variables. The most significant predictors were air temperature (TEMP), Aridity Index (AI), population density (POPd), and relative GDP per capita (pGDPpc). The observed relationships are consistent with established knowledge: higher temperatures favour agriculture, a higher AI constrains land use (as excessive rainfall promotes soil erosion and nutrient loss), while higher GDP and population density correlate with urbanisation. An interesting finding is the negative relationship between the share of arable land and pGDPpc, suggesting that wealthier mountain regions are more likely to abandon agriculture in favour of alternative land uses.
By contrast, the RF models for the rates of change (crpCropl, crpGrassl) proved ineffective (negative R² values), indicating that land-use change processes are complex and highly localised, making them difficult to capture with predictive modelling.
Despite the failure in constructing the crpCropl model, particularly in terms of its predictive capability, the pCropl model provides valuable insights into potential directions of land-use change in mountain regions. The first significant finding is the relationship between the mean annual air temperature (TEMP) and the Aridity Index (AI). In light of projected climate change—namely, rising temperatures and shifts in AI values—one may expect improved thermal conditions for crop cultivation in northern mountain regions and deteriorating ones in the south. The second key factor in the pCropl model is the relative GDP per capita (pGDPpc). As a result of EU policy, including direct financial transfers to newer Member States, accelerated economic convergence is occurring, leading to a decline in pGDPpc in currently wealthier north-western European countries and an increase in pGDPpc in southern and eastern regions. Since pCropl decreases with rising pGDPpc, the expected growth of pGDPpc in the south and east translates into a declining share of arable land in these areas. The changes anticipated by the pCropl model therefore correspond to observed qualitative patterns: a reduction in arable land in southern and eastern European mountain areas and an increase in north-western mountain regions.
The influence of institutional variables (CPOP, EUy) on model accuracy was limited but noticeable. National population size (CPOP) exerted some influence on the share of land-use types, possibly reflecting demographic pressure. EU membership duration (EUy) was associated with increased urbanisation and a decline in arable land share, which may result from integration into the Common Agricultural Policy (CAP) and access to structural funds.
The second results section demonstrated that farms located in the EU’s mountain areas constitute a relatively small yet economically and environmentally significant group of holdings. These farms largely determine both the production potential of mountain agriculture and the condition of the natural environment in these areas. It should be emphasised that the potential withdrawal of these farms from agricultural production in ecologically valuable mountain regions could lead to environmental degradation.
The third results section provided evidence that agriculture should play a fundamental role in mountain areas, as—when functioning properly—it can supply consumers with high-quality agricultural products while simultaneously ensuring the provision of valuable environmental public goods. However, it is essential to emphasise that the continuous, stable and adequate delivery of such goods by mountain agriculture requires the presence of institutional mechanisms capable of regulating and incentivising agricultural activity in a socially desirable direction. Since 2023, the Common Agricultural Policy (CAP) 2023–2027 has allowed farms in the EU to apply for support under various environmental measures, including eco-schemes, organic farming, and agri-environment-climate interventions. The development of these instruments in mountain areas represents an important opportunity to sustain agricultural production there, bringing benefits to the surrounding natural environment. A key prospect for such farms lies in developing production systems where losses in income, resulting from unfavourable natural conditions, are at least compensated through payments for environmentally beneficial practices and through price premiums from the sale of certified regional products, including organic produce.
The analyses indicate that institutional environmental measures can operate successfully within mountain agriculture. However, the example of Poland’s mountain areas demonstrates a limited implementation of eco-schemes and organic farming interventions. By contrast, agri-environment-climate measures are more widely adopted in these regions.
For agriculture in Europe’s mountain areas to function effectively and sustainably, it is crucial to ensure adequate financial support for farm incomes, thereby encouraging farmers to maintain high environmental standards. Achieving this goal would allow society to improve the condition of natural resources in these regions in the future, while simultaneously guaranteeing stable production of high-quality food. The current and future CAP should play a central role in this process.
Author Contributions
Conceptualization, M.Z., A.Ł; methodology, M.Z, A.Ł., P.K. software, M.Z, A.Ł, P.K, J.S.; validation, M.Z., A.Ł.,P.K, J.S., S.J., W.J.; formal analysis, M.Z., A.Ł.,P.K, J.S., S.J., W.J.; investigation, M.Z., A.Ł.,P.K, J.S., S.J., W.J.; resources, M.Z., A.Ł.,P.K, J.S., S.J., W.J.; data curation, M.Z., A.Ł.,P.K, J.S., S.J., W.J.; writing—original draft preparation, M.Z., A.Ł.,P.K, J.S., S.J., W.J.; writing—review and editing, M.Z., A.Ł.,P.K, J.S., S.J., W.J.; visualization, M.Z., A.Ł.,P.K, J.S., S.J., W.J.; supervision, M.Z., A.Ł.,P.K, J.S., S.J., W.J.; project administration, M.Z., A.Ł. All authors have read and agreed to the published version of the manuscript.
Funding
This research was funded by Institute of Agricultural and Food Economics—National Research Institute, Poland; Institute of Soil Science and Plant Cultivation, State Research Institute
References
- Aranzabal, I., Schmitz, M.F., Aquilera, P., Pineda, F.D. (2008) Modelling of landscape changes derived from the dynamics of socio-ecological systems—A case of study in a semiarid Mediterranean landscape. Ecological Indicators. Volume 8, issue 5. [CrossRef]
- Azevedo, J.C., Moreira, C., Castro, J.P., Laureiro, C. (2011). Agriculture Abandonment, Land-use Change and Fire Hazard in Mountain Landscapes in Northeastern Portugal. In. Li ,Ch., Lafortezza, R., Chen, J., (Editors) Landscape Ecology in Forest Management and Conservation. Challenges and Solutions for Global Change. Springer. https://link.springer.com/chapter/10.1007/978-3-642-12754-0_14.
- Barkmann, F., Tasser, E., Tappeiner, U., Huemer, P., Schattanek-Wiesmair, B., Lechner, K., Ortner, A., Rudisse, J. (2025). Mapping butterfly species richness and abundance in mountain grasslands-spatial application of a biodiversity indicator. Diversity and Distributions, Willey. Volume 31, issue 2. [CrossRef]
- Breiman L., 2001. Random Forests. Machine Learning, 45, 5–32. [CrossRef]
- Bruno D., Sorando R., Álvarez-Farizo B, Castellano C., Céspedes V., Gallardo B., Jiménez J., Victoria López M., López-Flores R., Moret-Fernández D., Navarro E., Picazo F., Sevilla-Callejo M., Tormo J., Vidal-Macua J.J., Nicolau J., Comín F. (2021). Depopulation impacts on ecosystem services in Mediterranean rural areas, Ecosystem Services,V olume 52,101369. [CrossRef]
- Canessa, C., Ait-Sidhoum, A., Wunder ,S., Sauer, J., (2024). What matters most in determining European farmers participation in agri-environmental measures? Asystematic review of the quantitative literature. Land Use Policy 140.107094. [CrossRef]
- Charles, D. (2025). After abandonment. Science, volume 387, issue 6729. American Association for the Advancement of Science. https://www.science.org/doi/epdf/10.1126/science.adv6039.
- Copernicus Climate Change Service, Climate Data Store, (2019): Land cover classification gridded maps from 1992 to present derived from satellite observation. Copernicus Climate Change Service (C3S) Climate Data Store (CDS). https://doi.org/10.24381/cds.006f2c9a (Accessed on 01.09-2025 as GEE image collection: ‘projects/sat-io/open-datasets/ESA/C3S-LC-L4-LCCS’).
- Czudec A., Poziom intensywności a efektywność nakładów w rolnictwie Karpackiego Regionu Górskiego, Zesz. Nauk AR, 169: 91-93, Kraków 1992.
- Defourny, P., Lamarche, C., Bontemps, S., De Maet, T., Van Bogaert, E., Moreau, I., Brockmann, C., Boettcher, M., Kirches, G., Wevers, J., Santoro, M., Ramoino, F., & Arino, O. (2017). Land Cover Climate Change Initiative - Product User Guide v2. Issue 2.0.. https://maps.elie.ucl.ac.be/CCI/viewer/download/ESACCI-LC-Ph2-PUGv2_2.0.pdf.
- Deng, X., Lian, P., Zeng, M., Xu, D., Qi, Y. (2021). Does farmland abandonment harm agricultural productivity in hilly and mountainous areas? evidence from China. Journal of Land Use Science, 16(4), 433–449. [CrossRef]
- Di Gregorio A., Jansen L.J.M. (2000). Land Cover Classification System (LCCS): Classification Concepts and User manual. FAO, Rome, 179 p. ISBN 92-5-104216-0. https://www.fao.org/4/x0596e/x0596e00.htm.
- Duglio, S.; Salotti, G.; Mascadri, G. (2023) Conditions for Operating in Marginal Mountain Areas: The Local Farmer’s Perspective. Societies, 13, 107. [CrossRef]
- EU (2025). An official website of the European Union. https://european-union.europa.eu/principles-countries-history/eu-countries_en.
- EU CAP Network. (2023). The importance of mountain development in the EU. Policy insights. https://eu-cap-network.ec.europa.eu/publications/policy-insight-importance-mountain-development-eu_en#section--resources.
- Euromontana 2025. Open letter to Commissioner Christophe Hansen. https://www.euromontana.org/open-letter-to-commissioner-christophe-hansen/.
- European Commission. (2020). Mapping and Assessment of Ecosystems and their Services: An EU ecosystem assessment. JRC Science for Policy Report, https://op.europa.eu/en/publication-detail/-/publication/afac1162-0f58-11eb-bc07-01aa75ed71a1/language-en.
- European Commisssion (2021). Communication from The Commission to the European Parliament, The European Council, The Council, The European Economic and Social Committee and the Committee of the Regions, EU Soil Strategy for 2030. Reaping the benefits of healthy soils for people, food, nature and climate. COM(2021) 699 final. https://eur-lex.europa.eu/legal-content/EN/TXT/?uri=celex%3A52021DC0699.
- European Court of Auditors. (2018). Combating desertification in the EU: a growing threat in need of more action https://www.eca.europa.eu/en/publications?did=48393.
- European Environment Agency. (2019). The European environment-state and outlook 2020. Knowledge for transition to a sustainable Europe. https://www.eea.europa.eu/soer/2020.
- Eurostat (2025a). Gross domestic product (GDP) at current market prices by NUTS 3 region. https://ec.europa.eu/eurostat/databrowser/product/page/nama_10r_3gdp (Accessed on 01.09-2025 as spreadsheed).
- Eurostat (2025b). Average annual population to calculate regional GDP data (thousand persons) by NUTS 3 region. https://ec.europa.eu/eurostat/databrowser/view/nama_10r_3popgdp/default/table?lang=en (Accessed on 01.09-2025 as spreadsheed).
- Eurostat-GISCO. © EuroGeographics. (2025). NUTS – Nomenclature of Territorial Units for Statistics. https://ec.europa.eu/eurostat/web/gisco/geodata/statistical-units/territorial-units-statistics.
- FADN-FSDN 2025. https://circabc.europa.eu/ui/group/befb6055-ab0c-4305-84fe-0c80c1c0553d/library/7c68c459-6dca-4795-bab6-a045721e4395?p=2&n=10 &sort=modified_DESC (dostęp 5.02.2025).
- Flury C., Huber R., Tasser E. (2013). Future of Mountain Agriculture in the Alps In. S. Mann (ed.), The Future of Mountain Agriculture, Springer Geography, https://doi.org/10.1007/978-3-642-33584-6_8, _ Springer-Verlag Berlin Heidelberg 20.
- Fraschetti, L.; Cardillo, C.; Fantappiè, M.; Lupia, F.; Pesce, A.; Storti, D.2025. Fine-Tuning Biophysical Parameters: Italy’s Methodological Approach to Redefining Areas with Natural Constraints. Sustainability, 17, 151. [CrossRef]
- Gorelick N.; Hancher M., Dixon M., Ilyushchenko S., Thau D., Moore R., 2017, Google Earth Engine: Planetary Scale Geospatial Analysis for Everyone. Remote Sens. Environ., 202, 18–27. [CrossRef]
- Heiβ, I., Stegmann, F., Wolf, M., Volk, M., Kaim, A. 2025. Supporting the spatial allocation of management practices to improve ecosystem services-An opportunity map approach for agricultural landscapes. Ecological Indicators. Vol 172.113212. [CrossRef]
- Hijmans, R.J., S.E. Cameron, J.L. Parra, P.G. Jones and A. Jarvis, (2005). Very High Resolution Interpolated Climate Surfaces for Global Land Areas. International Journal of Climatology 25: 1965-1978. https://doi.org/10.1002/joc.1276 (Accessed on 01.09-2025 as GEE image: 'WORLDCLIM/V1/BIO', layer: 'bio01').
- Huber, R., Rigling, A., Bebi, P., Brand, F. S., Briner, S., Buttler, A., Elkin, C., Gillet, F., Grêt-Regamey, A., Hirschi, C., Lischke, H., Scholz, R. W., Seidl, R., Spiegelberger, T., Walz, A., Zimmermann, W., & Bugmann, H. (2013). Sustainable Land Use in Mountain Regions Under Global Change: Synthesis Across Scales and Disciplines. Ecology and Society, 18(3). http://www.jstor.org/stable/26269376.
- Imai, N., Otokawa, H., Okamoto, A., Yamazaki, K., Tamura, T., Sakagami, T., Ishizaka, S., Shimojima, H. (2023). Abandonment of Cropland and Seminatural Grassland in a Mountainous Traditional Agricultural Landscape in Japan. Sustainability, 15(10), 7742. [CrossRef]
- Imbrechts, L., Azevedo, J.C. Verburg, P. (2024) Trajectories and drivers signaling the end of agricultural abandonment in Trás-os-Montes, Portugal. Regional Environmental Change, volume 24, 159. [CrossRef]
- Kata R., Sytuacja ekonomiczno-finansowa gospodarstw rolnych położonych w regionie górskim. W:Czynniki kształtujące konkurencyjność regionu górskiego (na przykładzie polskich Karpat); red.: Czudec A., Wyd. UR Rzeszów, ss. 121-148, Rzeszów 2010.
- Keenleyside, C., Tucker, G., McConville, A. (2010). Farmland Abandonment in the EU: an Assessment of Trends and Prospects. Institute for European Environmental Policy, London. https://ieep.eu/publications/farmland-abandonment-in-the-eu-an-assessment-of-trends-and-prospects/.
- Kerckhof, A, Spalevic, V, Van Eetvelde, V, Nyssen, J. (2016). Factors of land abandonment in mountainous Mediterranean areas: the case of Montenegrin settlements. Springerplus.5:485. [CrossRef]
- Kuhn M. 2008. Building Predictive Models in R Using the caret Package. Journal of Statistical Software, 28(5), 1–26. [CrossRef]
- Kutkowska, B., Berbeka, T. (2013). The meaning of agriculture in development of mountain areas of the example of Sudety region. Annals of the Polish Association of Agricultural and Agribusiness Economists (Annals PAAAE), XV, 3, https://bazekon.uek.krakow.pl/rekord/171338997.
- Lampkin, N., Jahrl, I., Reinecke, S. (2025). Achieving the EU Farm-to-Fork 25% Organic Target: How Can Policy Support This Goal In. Willer H., Trávníček J., Schlatter B. (ed.) The World of Organic Agriculture Statistics and Emerging Trends 2025. Research Institute of Organic Agriculture FiBL IFOAM – Organics International. http://www.organic-world.net/yearbook/yearbook-2025.html.
- Lasanta, T., Arnáez, J., Pascual, N., Ruiz-Flaño, P., Errea, M.P., Lana-Renault, N.(2017). Space–time process and drivers of land abandonment in Europe, Catena, 149. [CrossRef]
- Latacz-Lohmann, U., Breustedt, G. (2019). Using choice experiments to improve the design of Agri-environmental schemes. European Review of Agricultural Economics 46 (3). [CrossRef]
- Lenda, M., Skórka, P., Possingham, H.P., Knops, M.H. (2023). Abandoned land: Linked to biological invasions. Science, volume 381, issue 6655, American Association for the Advancement of Science, https://www.science.org/doi/epdf/10.1126/science.adi7833.
- Liaw A., Wiener M. (2002). Classification and Regression by randomForest. R News, 2(3), 18-22. https://journal.r-project.org/articles/RN-2002-022/RN-2002-022.pdf https://cran.r-project.org/web/packages/randomForest/index.html.
- Lieskovský, J.; Bezák, P.; Špulerová, J.; Lieskovský, T.; Koleda, P.; Dobrovodská, M.; Bürgi, M.; Gimmi, U. (2015). The Abandonment of Traditional Agricultural Landscape in Slovakia: Analysis of Extent and Driving Forces. Journal of Rural Studies, 37. [CrossRef]
- Mazzocchi, C., Orsi, L., Sali, G. (2021). Consumers’ Attitudes for Sustainable Mountain Cheese. Sustainability, 13(4), 1743. [CrossRef]
- Mazzocchi, C., Orsi, L., Sali, G. (2021). Consumers’ Attitudes for Sustainable Mountain Cheese. Sustainability, 13(4), 1743. [CrossRef]
- Mijatović, D., Van Oudenhoven, F., Eyzaguirre, P., Hodgkin, T. (2012). The role of agricultural biodiversity in strengthening resilience to climate change: towards an analytical framework. International Journal of Agricultural Sustainability, 11(2), 95–107. [CrossRef]
- Mirkowska, Z., Ziętara, W. (2024). Place and role of large-scale farms in Polish agriculture. Problems of Agricultural Economics, 381(4). [CrossRef]
- Musiał, K., Szewczyk, W., Grygierzec, B. (2015). The effect of ceasing of use on the flora and plant associations in meadows and pastures of selected parts of the Western Carpathians. Fragmenta Agronomica 32 (4), https://open.icm.edu.pl/handle/123456789/17561.
- Musiał, W., Musiał, K. (2019). Procesy dezanimalizacji Karpat Polskich – Aspekty produkcyjno-ekonomiczne i ekologiczne. Annals of the Polish Association of Agricultural and Agribusiness Economists (Annals PAAAE), XXI(4). [CrossRef]
- Natural Earth (2025). Free vector and raster map data. 1:10m Cultural Vectors (version 5.1.1), ne_10m_admin_1_states_provinces. https://www.naturalearthdata.com/downloads/10m-cultural-vectors/.
- O’Rourke, E. ,Charbonneau, M., Poinsot, Y. (2016). High nature value mountain farming systems in Europe: Case studies from the Atlantic Pyrenees, France and the Kerry Uplands, Ireland, Journal of Rural Studies, volume 46. [CrossRef]
- Ober, C., Canessa, C., Frick, F., Sauer, J. (2025). The role of behavioural factors in accepting agri-environmental contracts – Evidence from a Q-method and thematic analysis in Germany. Ecological Economics, 231. 108544. [CrossRef]
- Pecher, C., Bacher, M., Tasser, E., Tappeiner, U. (2018). Agricultural landscapes between intensification and abandonment: The expectations of the public in a Central – Alpine cross – border region. Landscape Research. 43. [CrossRef]
- Plieninger, T, Draux, H, Fagerholm, N, Bieling, C, Bürgi, M. (2016) The driving forces of landscape change in Europe: a systematic review of the evidence. Land Use Policy. 57 https://doi. org/10.1016/j.landusepol.2016.04.040.
- R Core Team (2023). R: A language and environment for statistical computing. R Foundation for Statistical Computing, Vienna, Austria. https://www.R-project.org/.
- Review of the EU Agricultural Promotion Policy a Tool for the Promotion of Sustainable Farming from Mountain Areas . Euromontana. 2021. Available online: https://www.euromontana.org/review-of-the-eu-agricultural-promotion-policy-a-tool-for-thepromotion-of-sustainable-farming-from-mountain-areas/ (accessed on 12 May 2024).
- Runge, T., Latacz-Lohmann, U., Schaller, L., Todorova, K., Daugbjerg, C., Termansen, M., Liira, J., Le Gloux, F., Dupraz, P., Leppanen, J., Fogarasi, J., Vigh, E.Z., Bradfield, T., Hennessy, T., Targetti, S., Viaggi, D., Berzina, I., Schulp, C., Majewski, E., Velazquez, F.J.B. (2022). Implementation of eco-schemes in fifteen European Union member states. Euro Choices 21 (2). [CrossRef]
- Santos-Martín, F., Zorrilla-Miras, P., García-Llorente, M., Quintas-Soriano, C., Montes, C., Rey-Benayas J. (2019). Identifying win–win situations in agricultural landscapes: an integrated ecosystem services assessment for Spain. Landscape Ecology, 34 (7), https://doi.org/10.1007/s10980-019-00852-5(0123456789().,-volV)( 01234567.
- Sartori M., Ferrari E., M’barek R., Philippidis G., Boysen-Urban K., Borrelli P., Montanarell L., Panagos P. (2024) Remaining Loyal to Our Soil: A Prospective Integrated Assessment of Soil Erosion on Global Food Security. Ecological Economics. Vol.219.108103. [CrossRef]
- Snethlage, M.A., Geschke, J., Ranipeta, A. et al. (2022). A hierarchical inventory of the world’s mountains for global comparative mountain science. Sci Data 9, 149. [CrossRef]
- Soulis, K. X., Kalivas, D. P., Apostolopoulos, C. (2018). Delimitation of Agricultural Areas with Natural Constraints in Greece: Assessment of the Dryness Climatic Criterion Using Geostatistics. Agronomy, 8 (9), 161. [CrossRef]
- Stauder, J., Meimberg, H., Kriechbaum, M. (2023). An Exploration of Drivers for Abandonment or Continuation of Summer Pasture Grazing in South Tyrol, Italy. Sustainability, 15, 7355.
- Terres, J-M., Scacchiafchi, L.,N., Wania, A., Ambar, M., Anguiano, E. (2015) Farmland abandonment in Europe: identification of drivers and indicators, and development of a composite indicator of risk. Land Use Policy 49. https://doi.org/10.1016/j.landu sepol.2015.06.009.
- The World Economic Forum 2025. The global risks report 2025. 20th Edition. Insight report. World Economic Forum. https://www.weforum.org/publications/ global-risks-report-2025/.
- Tognon, A., Gretter, A., Andreola, M., Betta, A. (2022). Mountain Farming in the Making: Approaches to Alpine Rural Agro-food Challenges in Trentino. Revue de géographie alpine. https://journals.openedition.org/rga/10544.
- Uehleke, R., Petrick, M. i Huttel, S. (2022). Evaluations of agri-environmental schemes based on ob-servational farm data: The importance of covariate selection. Land Use Policy, 114, 1–15. [CrossRef]
- Vicente-Serrano, S. M., N. G. Pricope, A. Toreti, E. Morán-Tejeda, J. Spinoni, A. Ocampo-Melgar, E. Archer, A. Diedhiou, T. Mesbahzadeh, N. H. Ravindranath, R. S. Pulwarty and S. Alibakhshi (2024). The Global Threat of Drying Lands: Regional and global aridity trends and future projections. A Report of the Science-Policy Interface. United Nations Convention to Combat Desertification (UNCCD). Bonn, Germany. ISBN 978-92-95128-17-0 https://www.unccd.int/sites/default/files/2024-12/aridity_report.pdf.
- Wickham, H. (2016). ggplot2: Elegant graphics for data analysis (version 3.4.0). [CrossRef]
- Yamazaki D., D. Ikeshima, R. Tawatari, T. Yamaguchi, F. O'Loughlin, J.C. Neal, C.C. Sampson, S. Kanae & P.D. Bates. (2017). A high accuracy map of global terrain elevations. Geophysical Research Letters, vol.44, pp.5844-5853. https://doi.org/10.1002/2017GL072874 (Accessed on 01.09-2025 as GEE image: ‘MERIT/DEM/v1_0_3’, layer: ‘dem’).
- Zhao, Q., Yu, L., Li, X., Peng, D., Zhang Y., Gong P. (2021). Progress and Trends in the Application of Google Earth and Google Earth Engine. Remote Sens., 13, 3778. [CrossRef]
- Zimmermann, A. i Britz, W. (2016). European farms participation in agri-environmental measures. Land Use Policy, 50, 214–228. [CrossRef]
- Zomeni, M., Martinou, A. F., Stavrinides, M. C. i Vogiatzakis, I. N. (2018). High nature value farmlands: challenges in identification and interpretation using Cyprus as a case study. Natu-re Conservation, 31, 53–70. [CrossRef]
- Zomer, R.J.; Xu, J.; Trabuco, A. (2022). Version 3 of the Global Aridity Index and Potential Evapotranspiration Database. Scientific Data 9, 409. https://www.nature.com/articles/s41597-022-01493-1 (Accessed on 01.09-2025 as GEE image: ‘projects/sat-io/open-datasets/global_ai/global_ai_yearly’).
- Wrzaszcz W, Prandecki K. ROLNICTWO A EUROPEJSKI ZIELONY ŁAD. Zagadnienia Ekonomiki Rolnej. 2020;365 (Special Issue 4):156–179. [CrossRef]
- Zieliński, M.; Wrzaszcz, W.; Sobierajewska, J.; Adamski, M. Development and Effects of Organic Farms in Poland, Taking into Account Their Location in Areas Facing Natural or Other Specific Constraints. Agriculture 2024, 14, 297. [Google Scholar] [CrossRef]
Figure 1.
1. Scheme of agricultural analysis. 2. Share of mountain agricultural in municipalities with varying saturation of land in total utilised agricultural area in mountain agricultural land municipalities in Poland.
Figure 1.
1. Scheme of agricultural analysis. 2. Share of mountain agricultural in municipalities with varying saturation of land in total utilised agricultural area in mountain agricultural land municipalities in Poland.
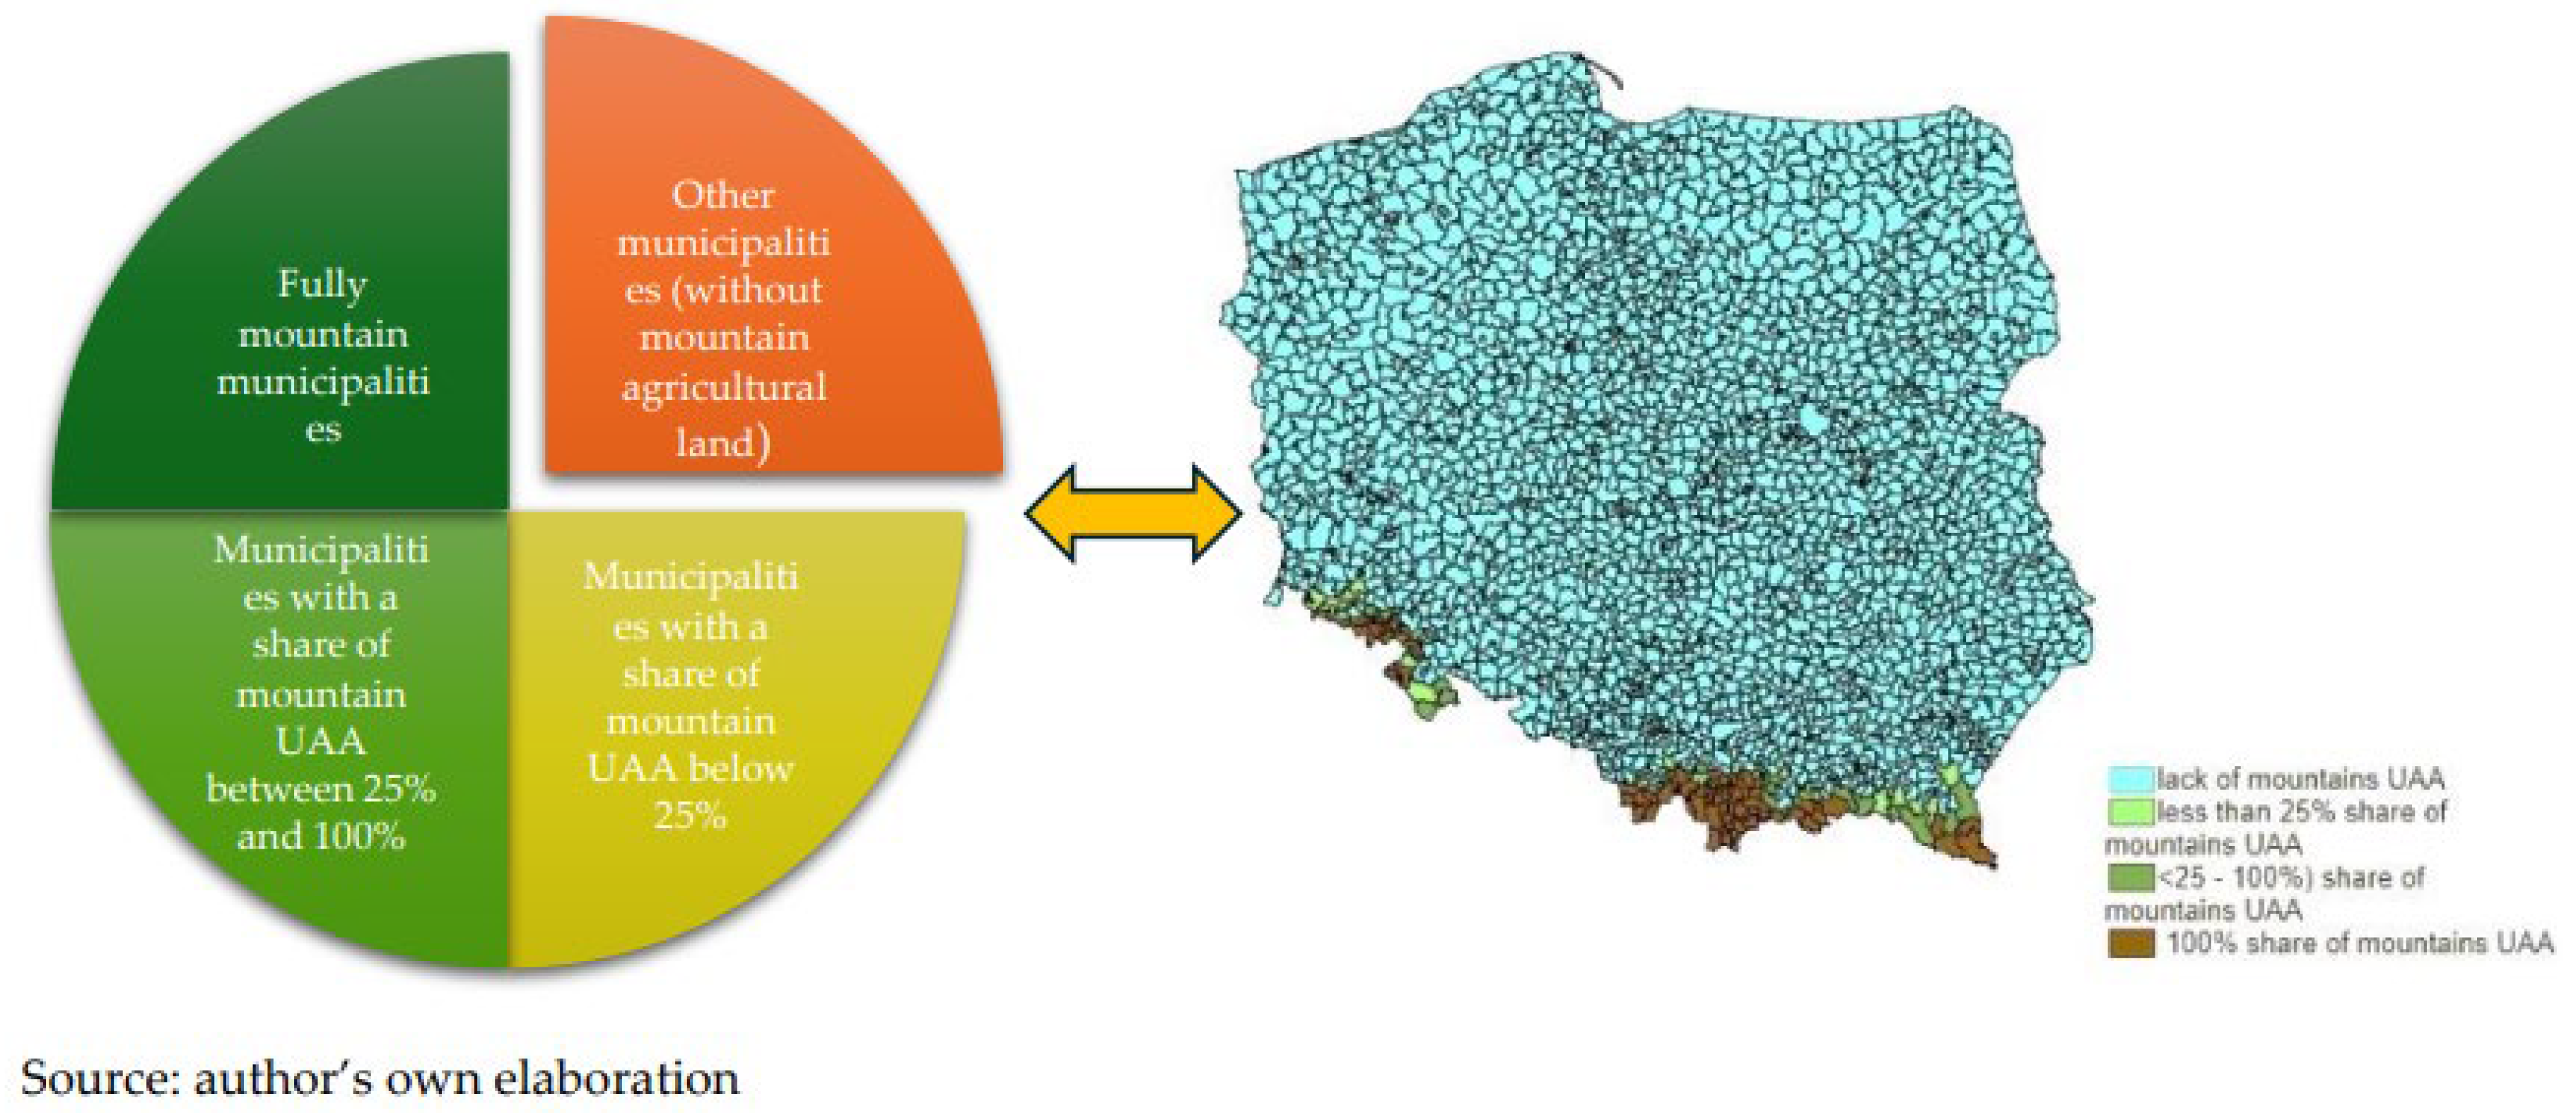
Figure 2.
Share of cropland in the surface area of mountain regions.
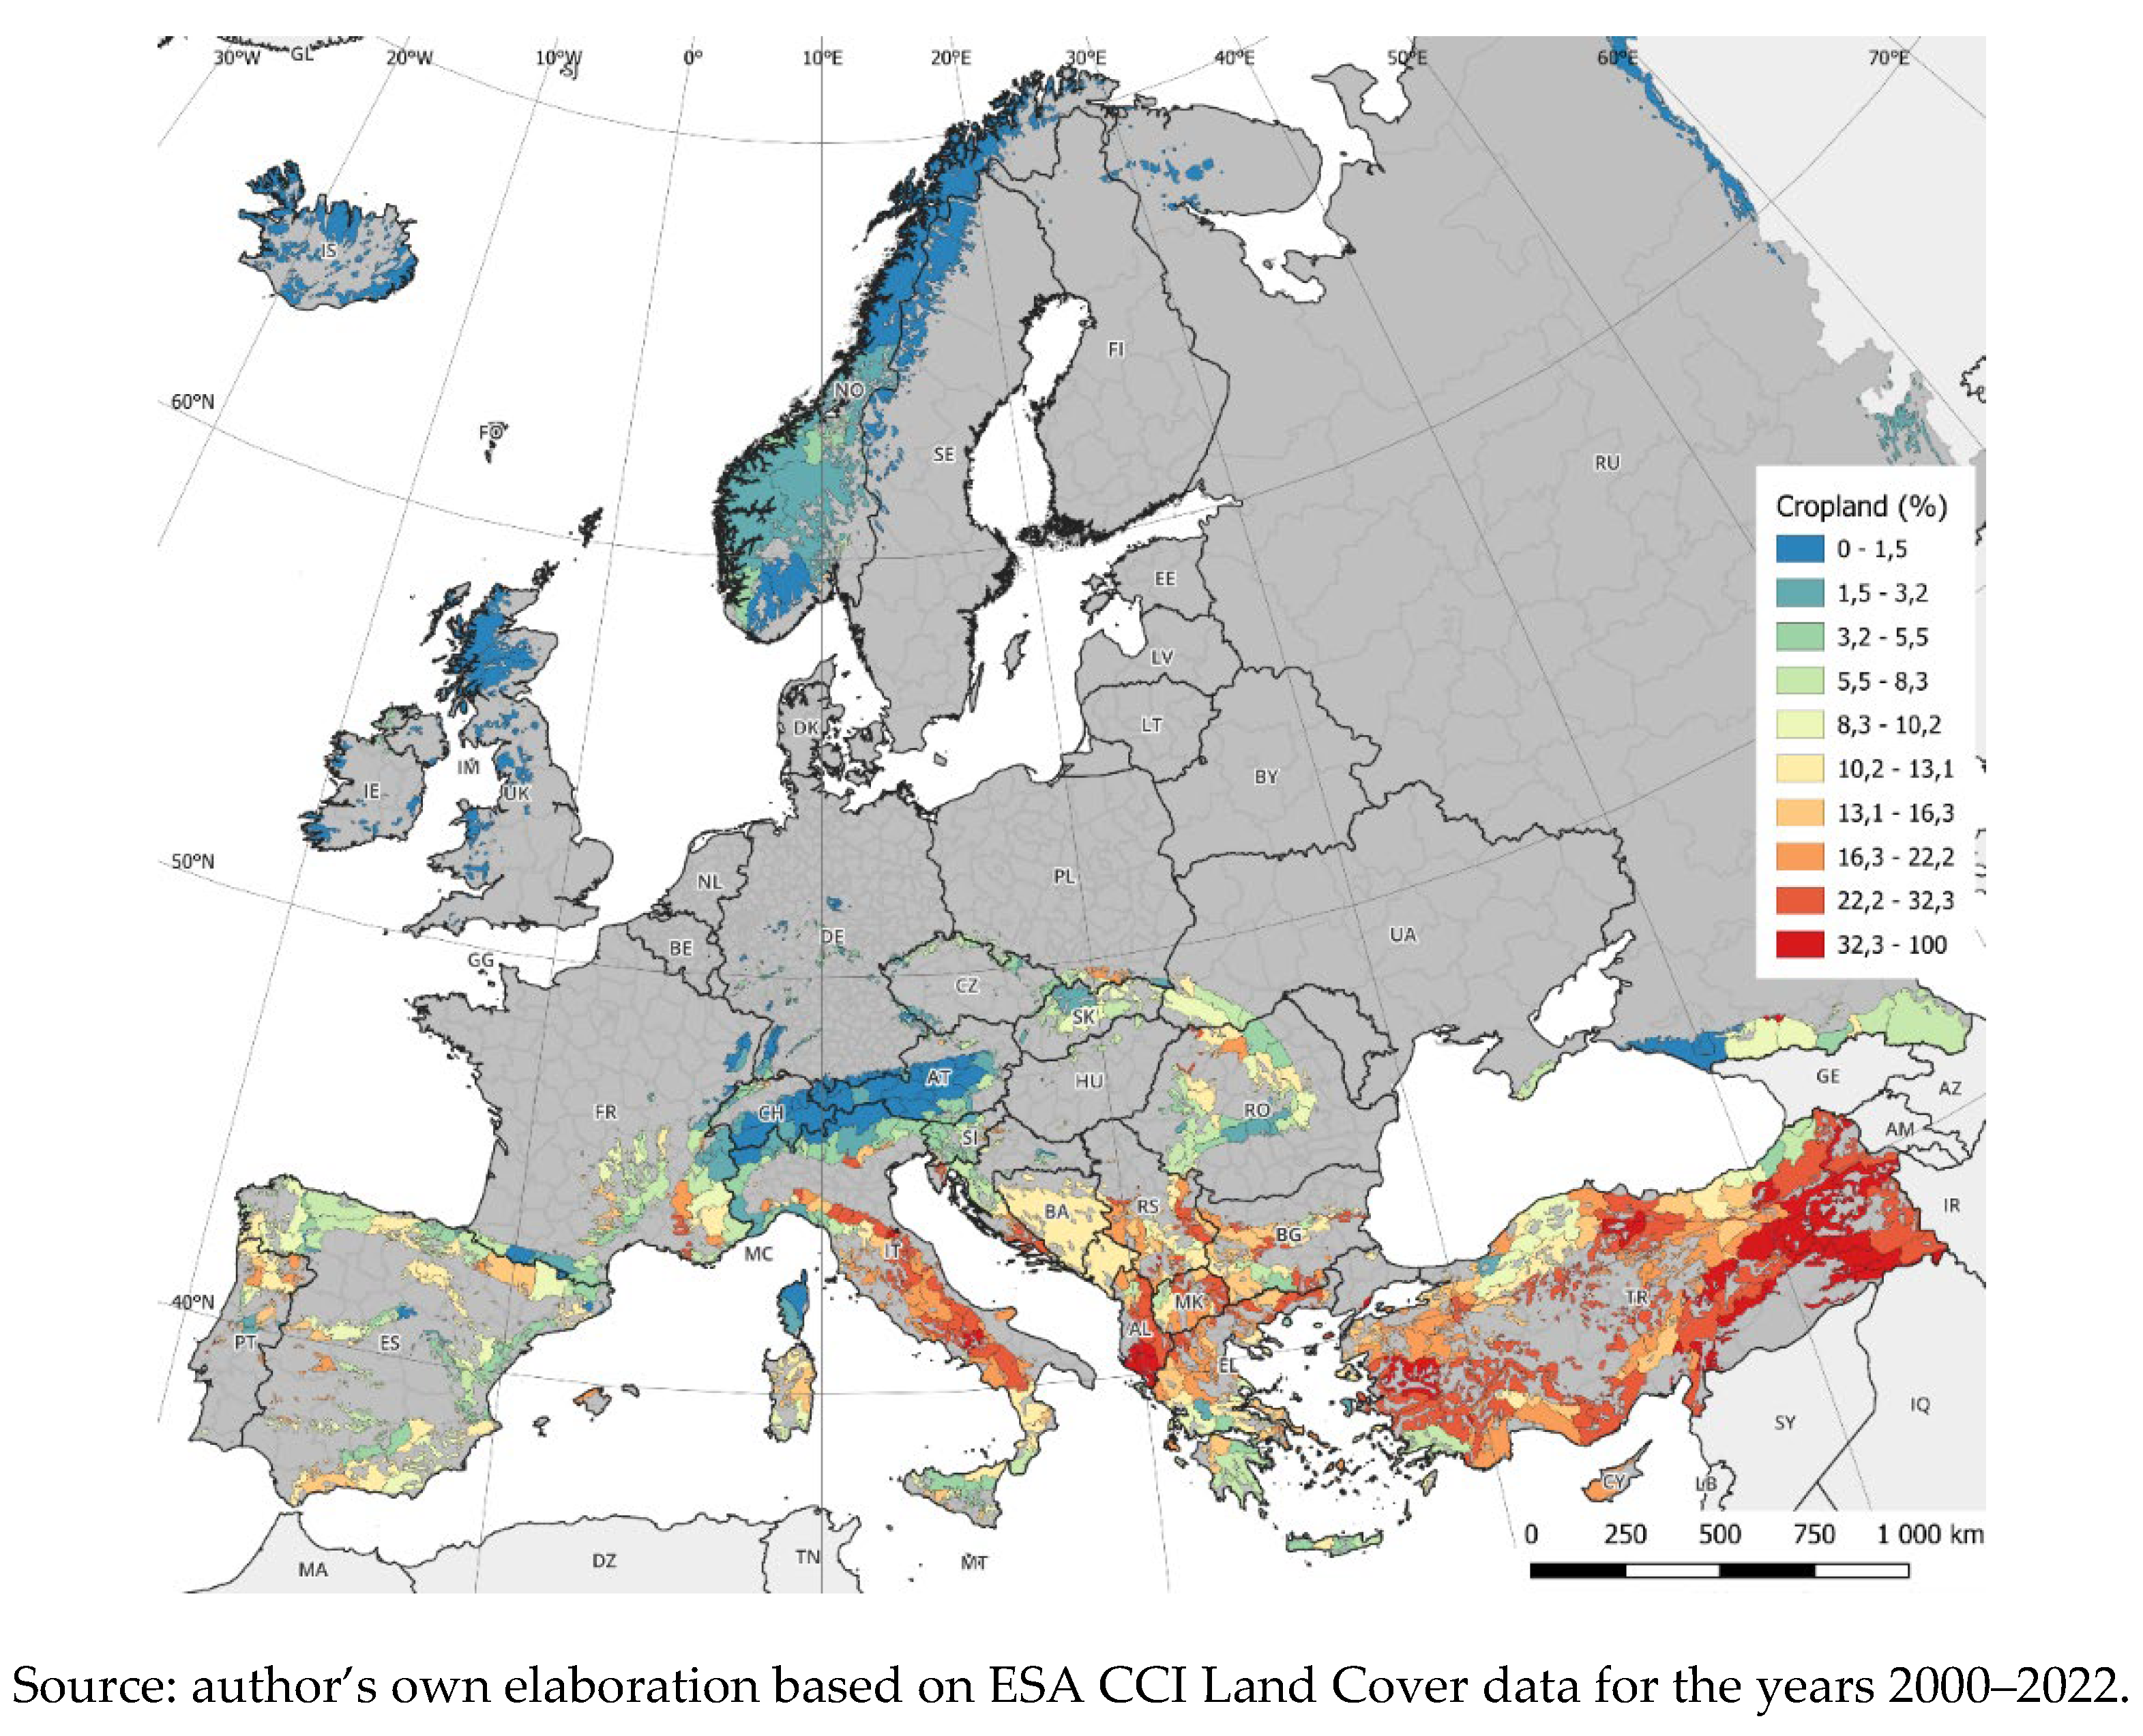
Figure 3.
Rate of change in the share ofcropland in the surface area of mountain regions.
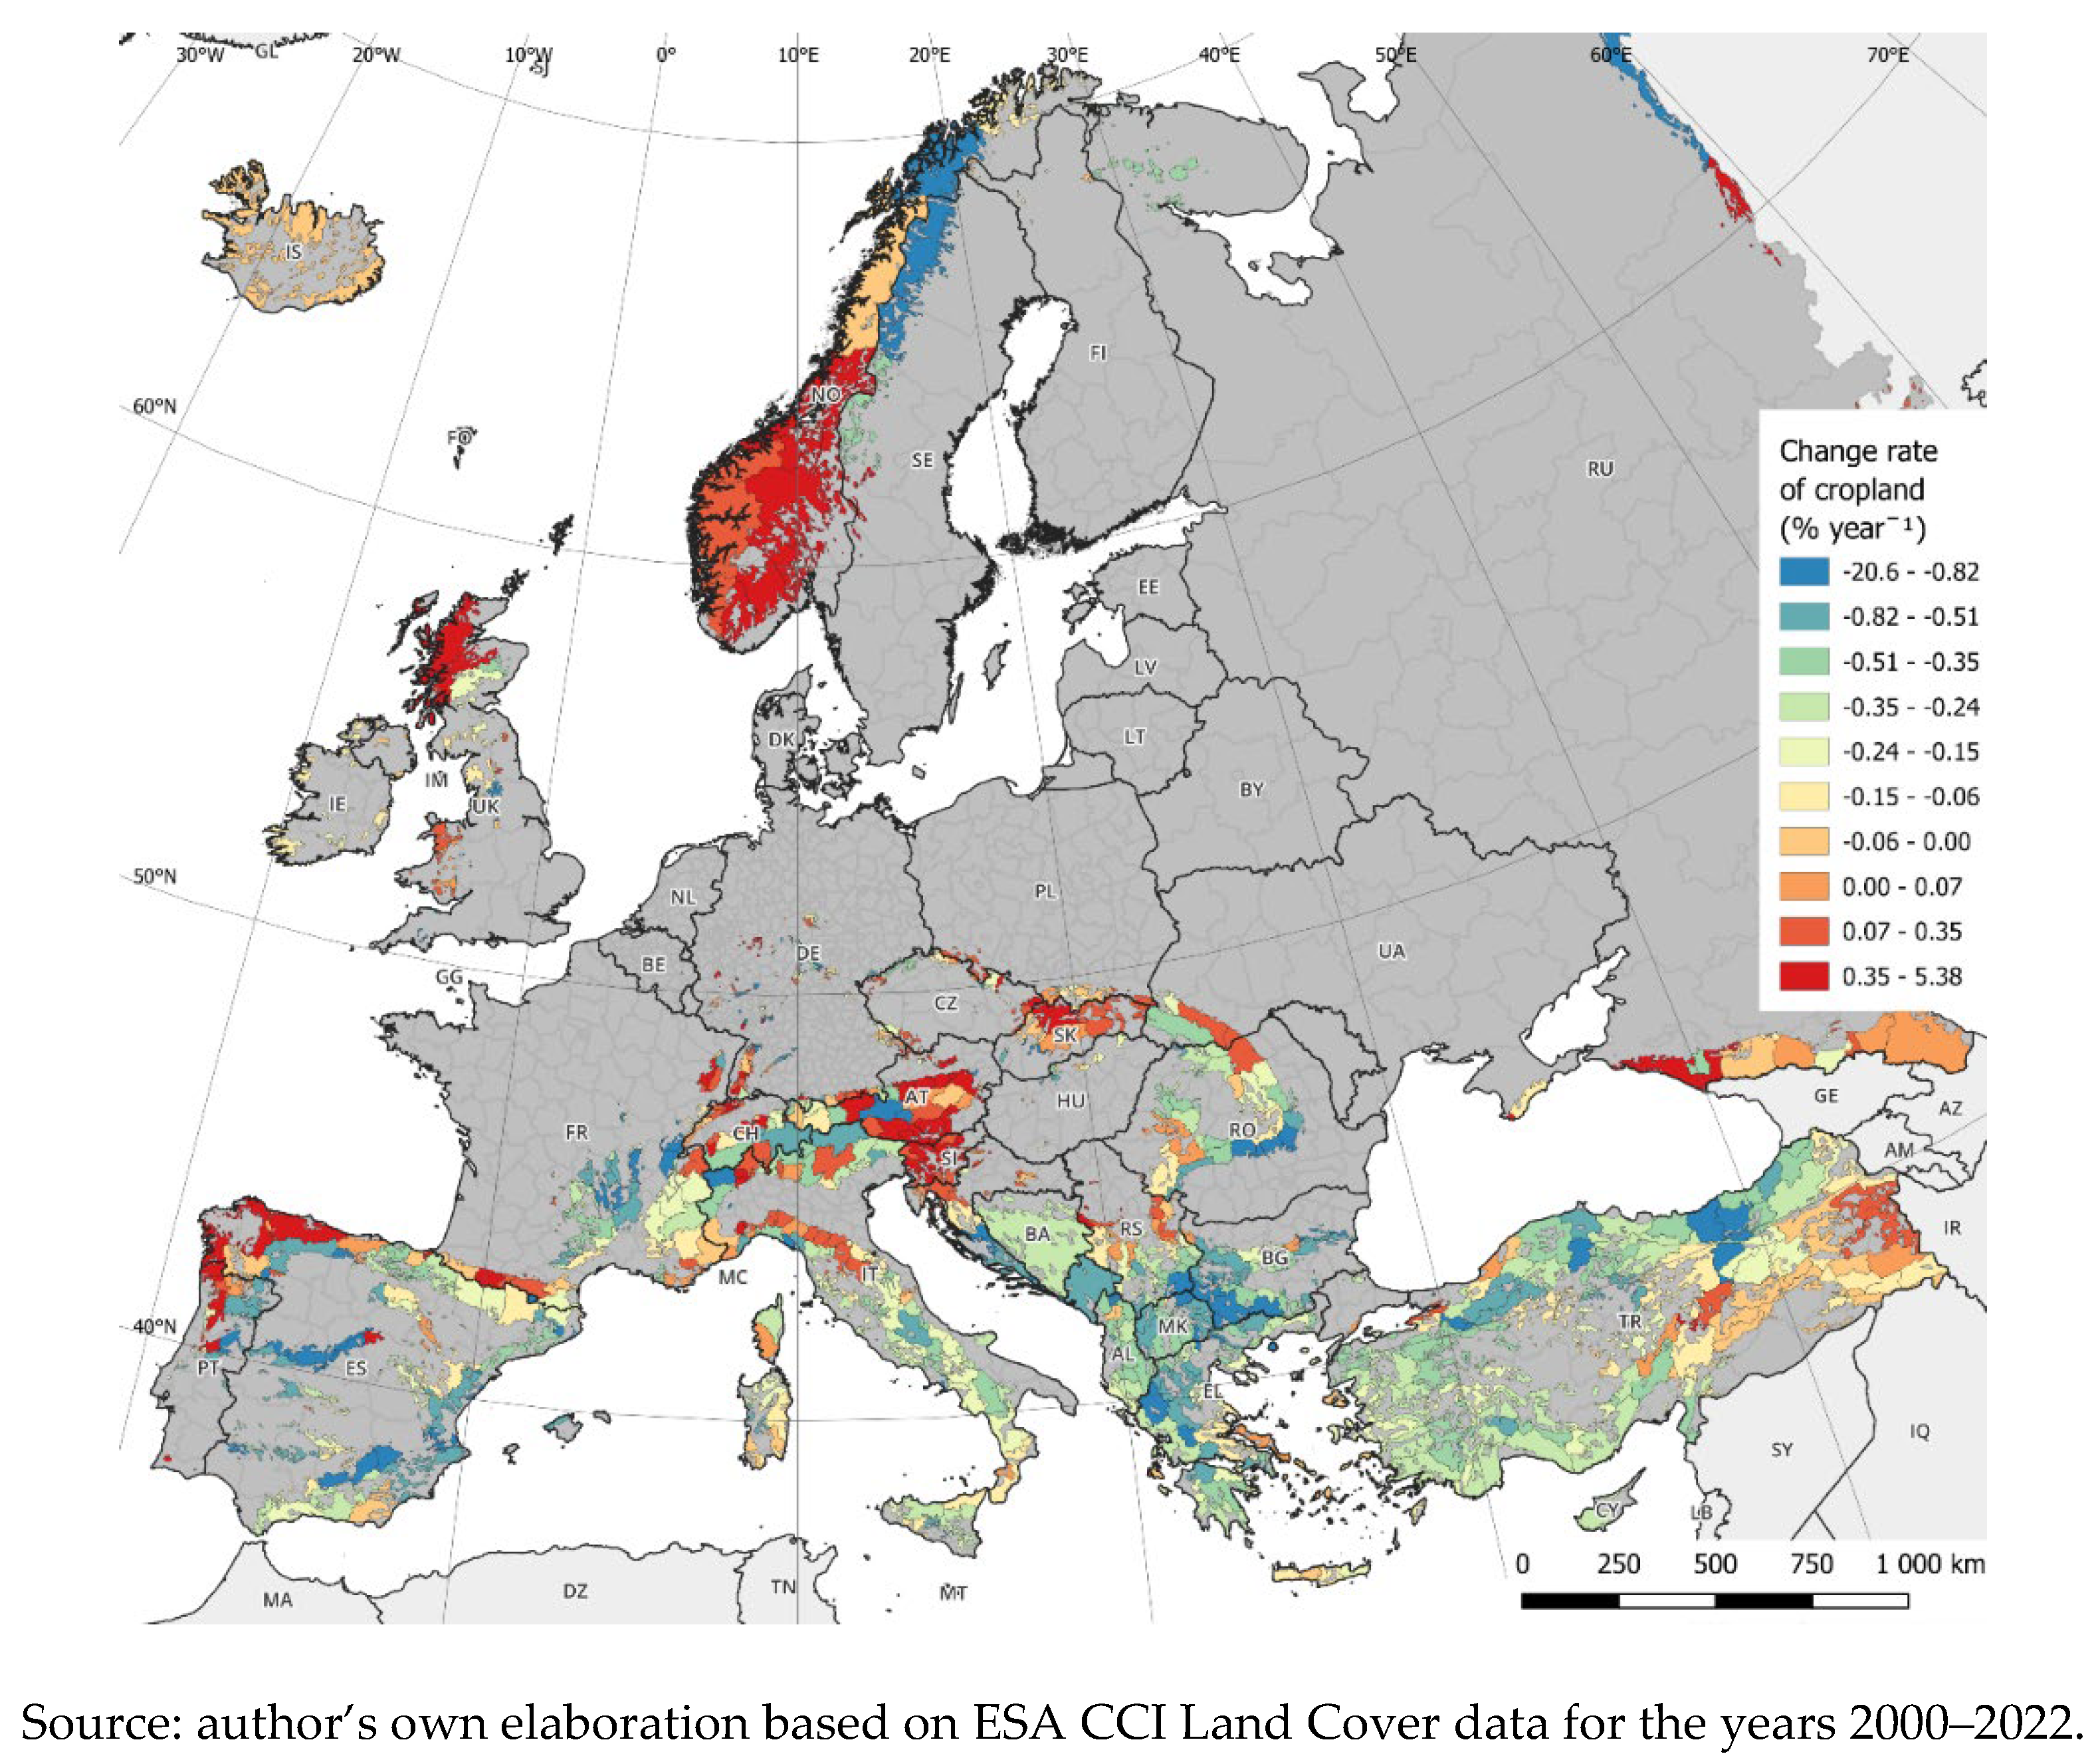
Figure 4.
Share of grassland in the surface area of mountain regions.
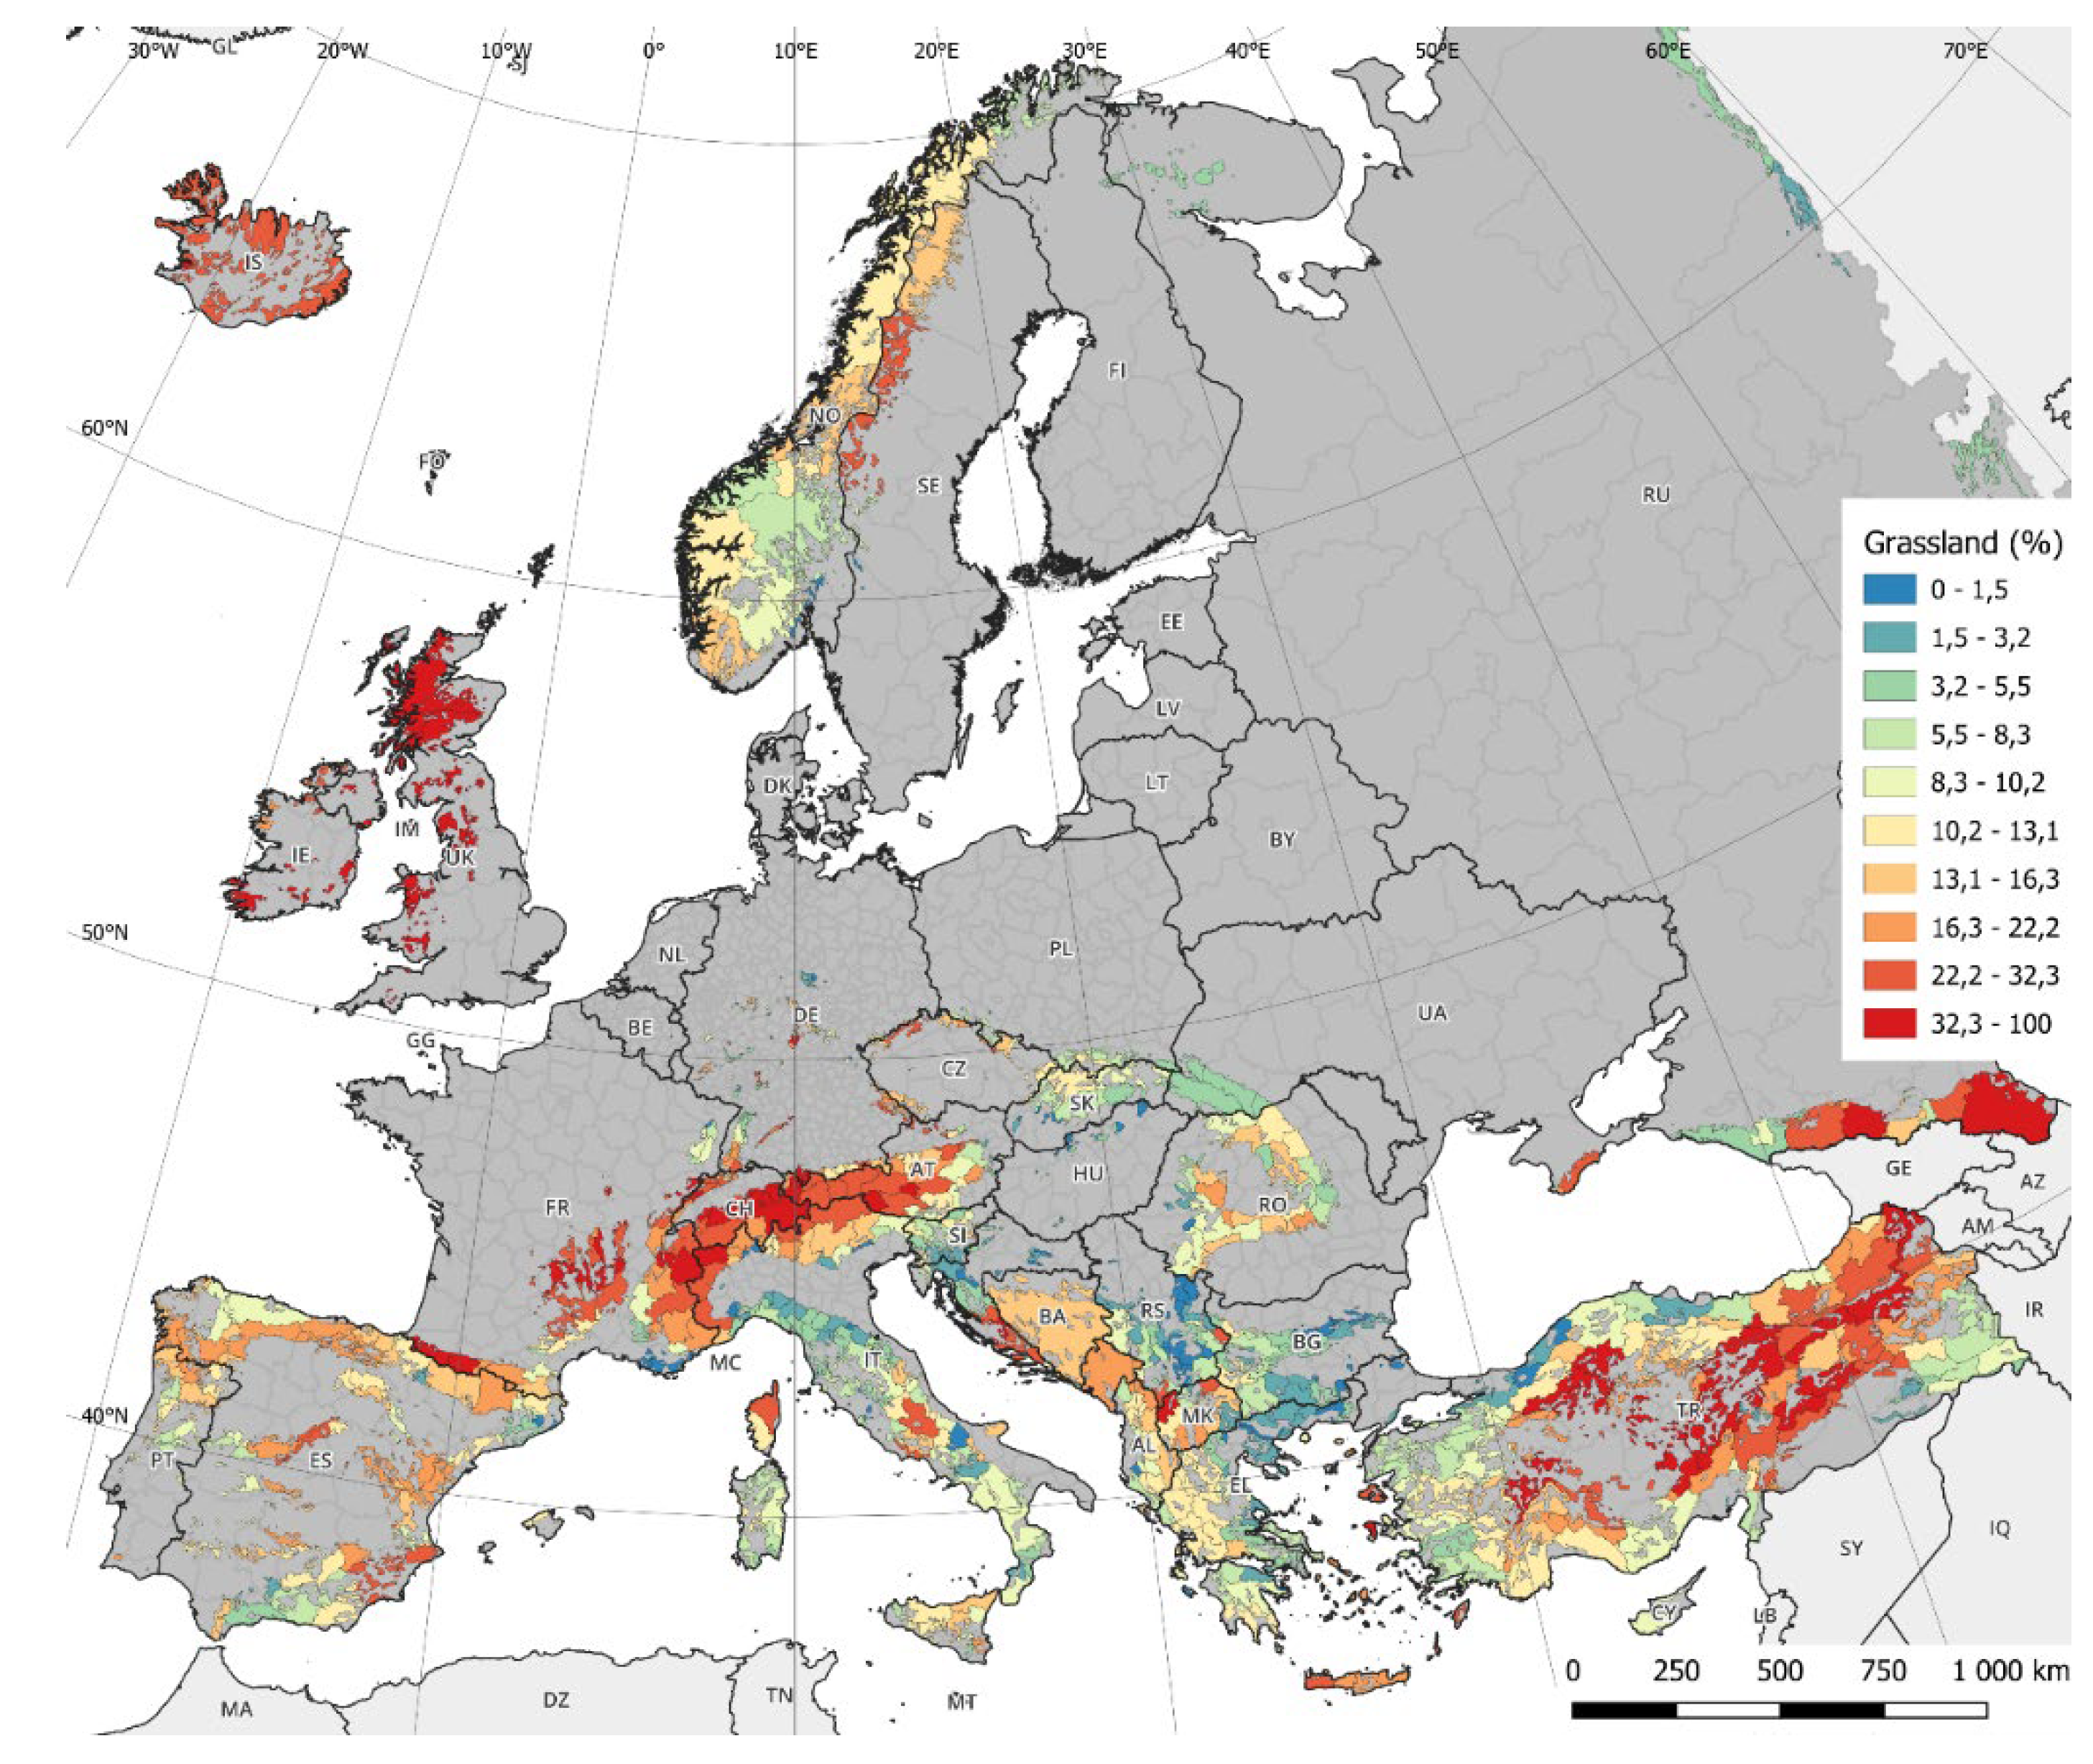
Figure 5.
Rate of change in the share of grassland in the surface area of mountain regions.
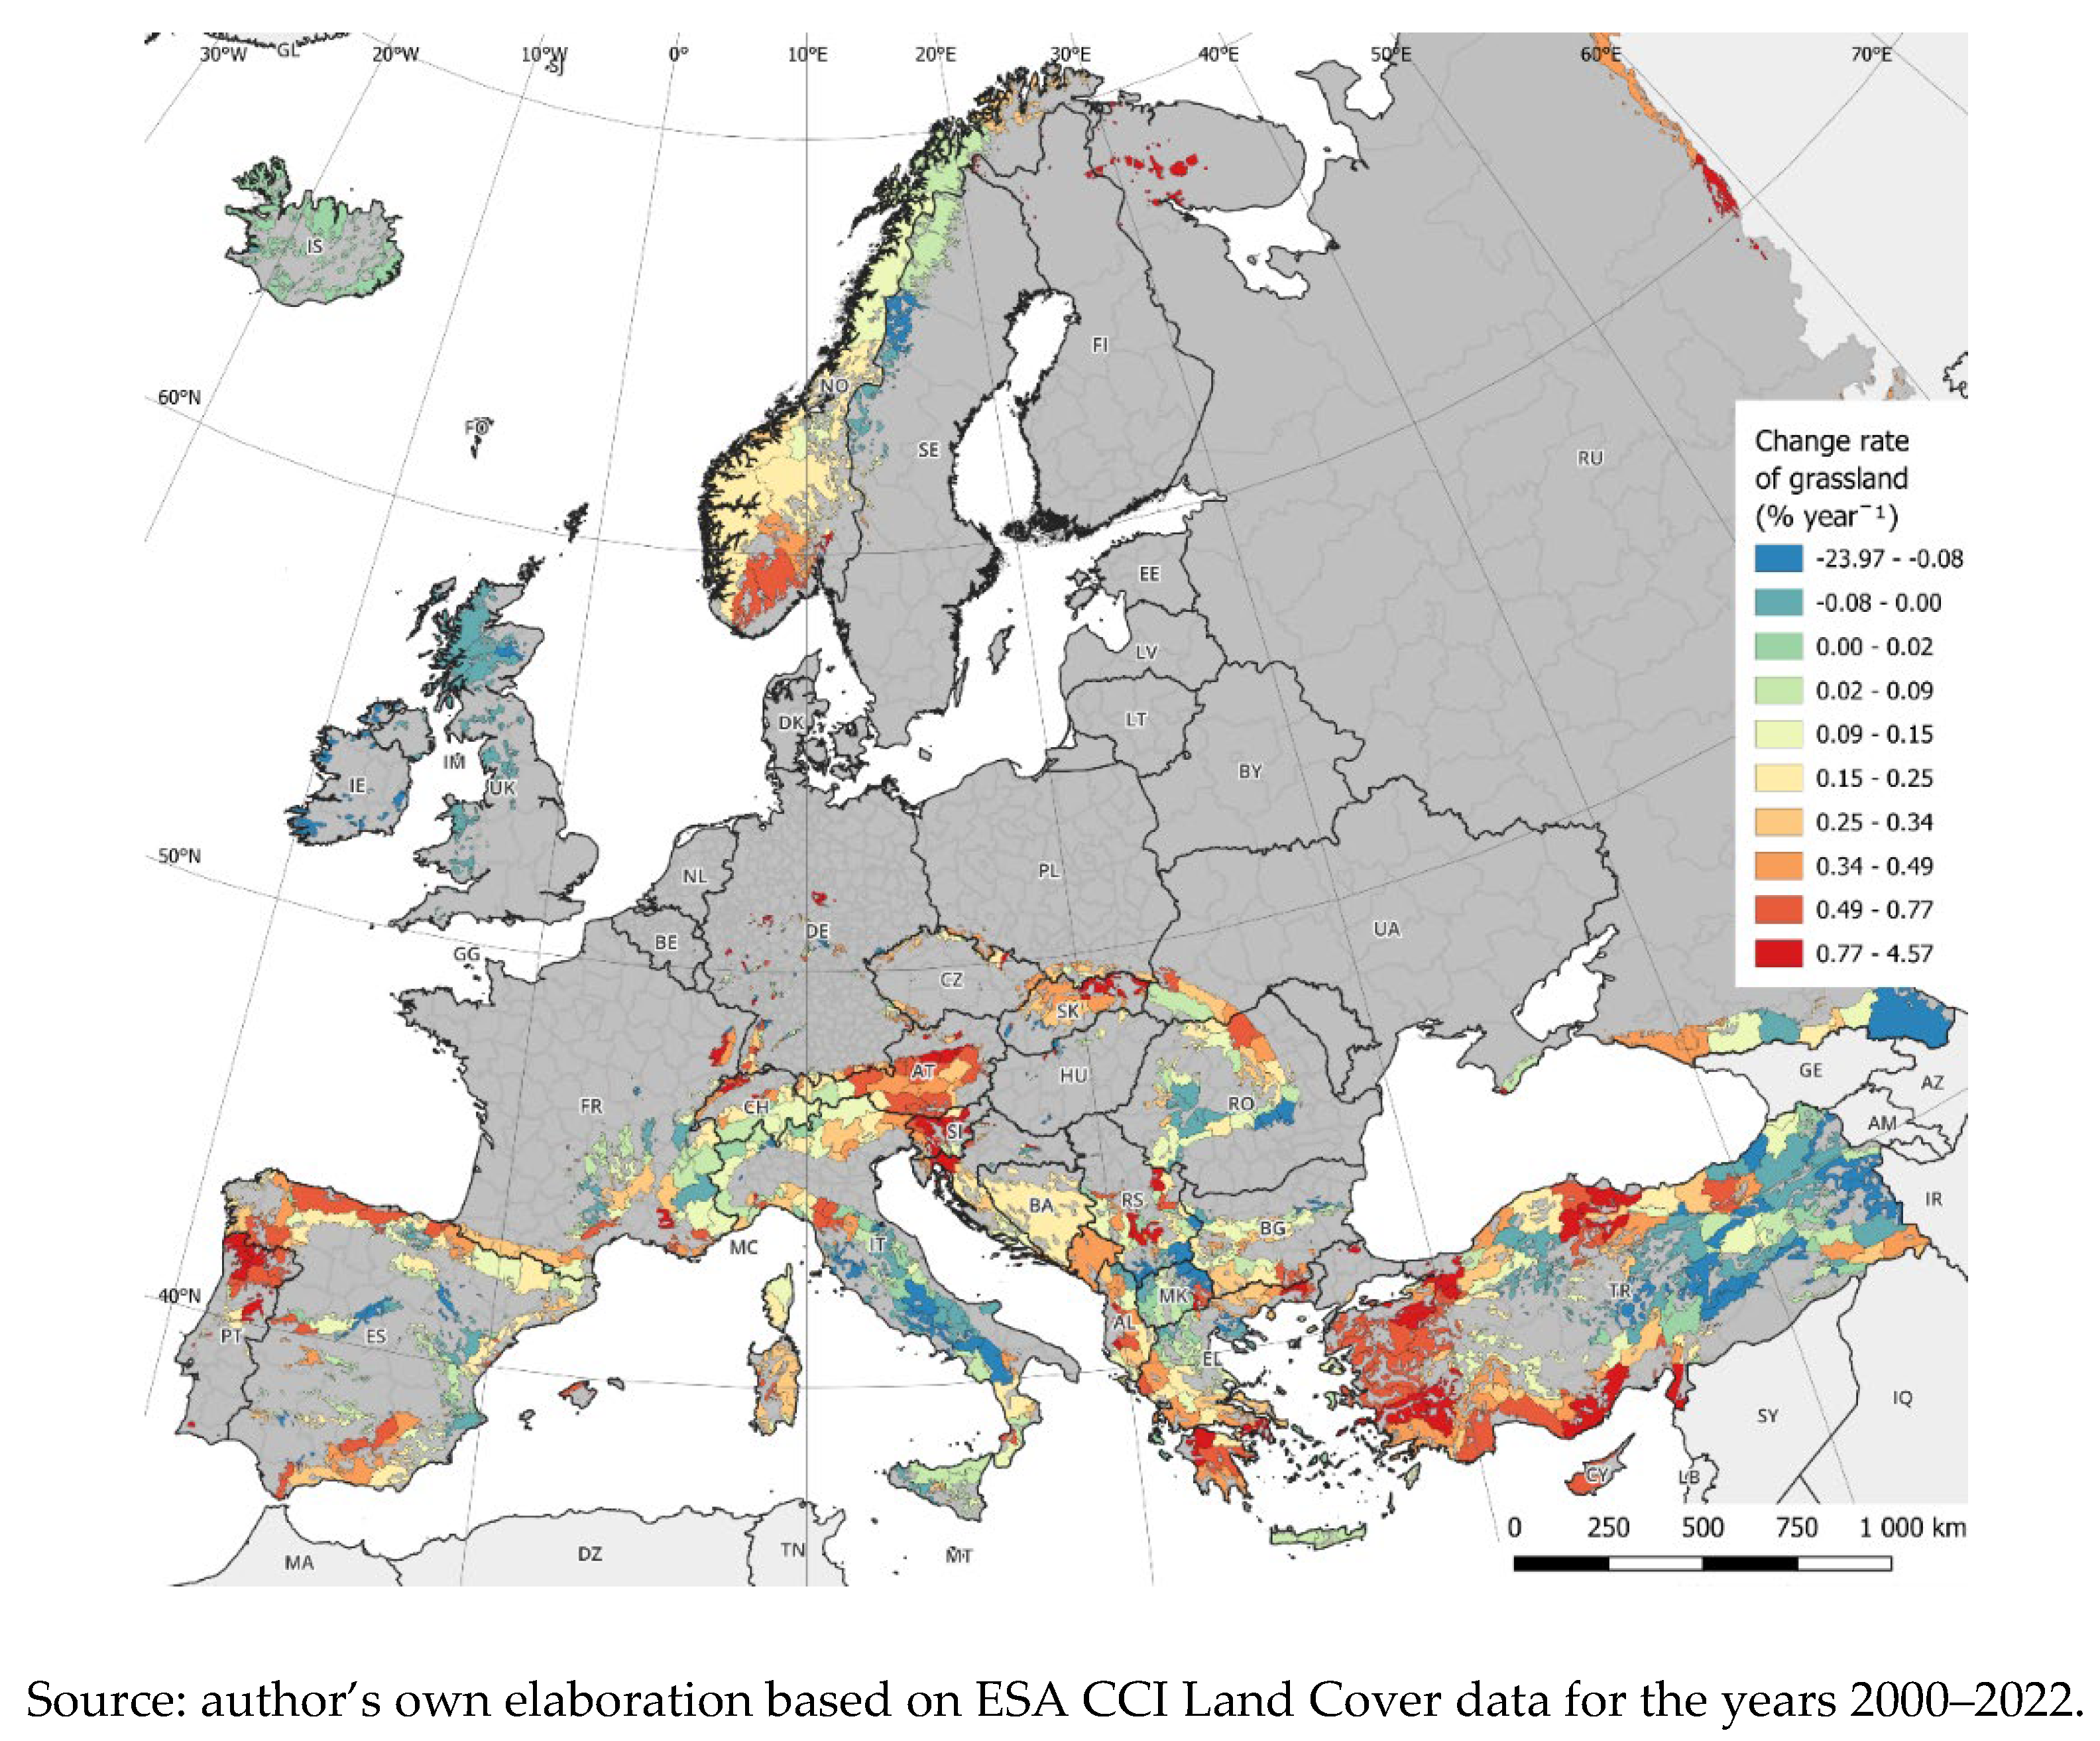
Figure 6.
Share of urbanised areas in the surface area of mountain regions.
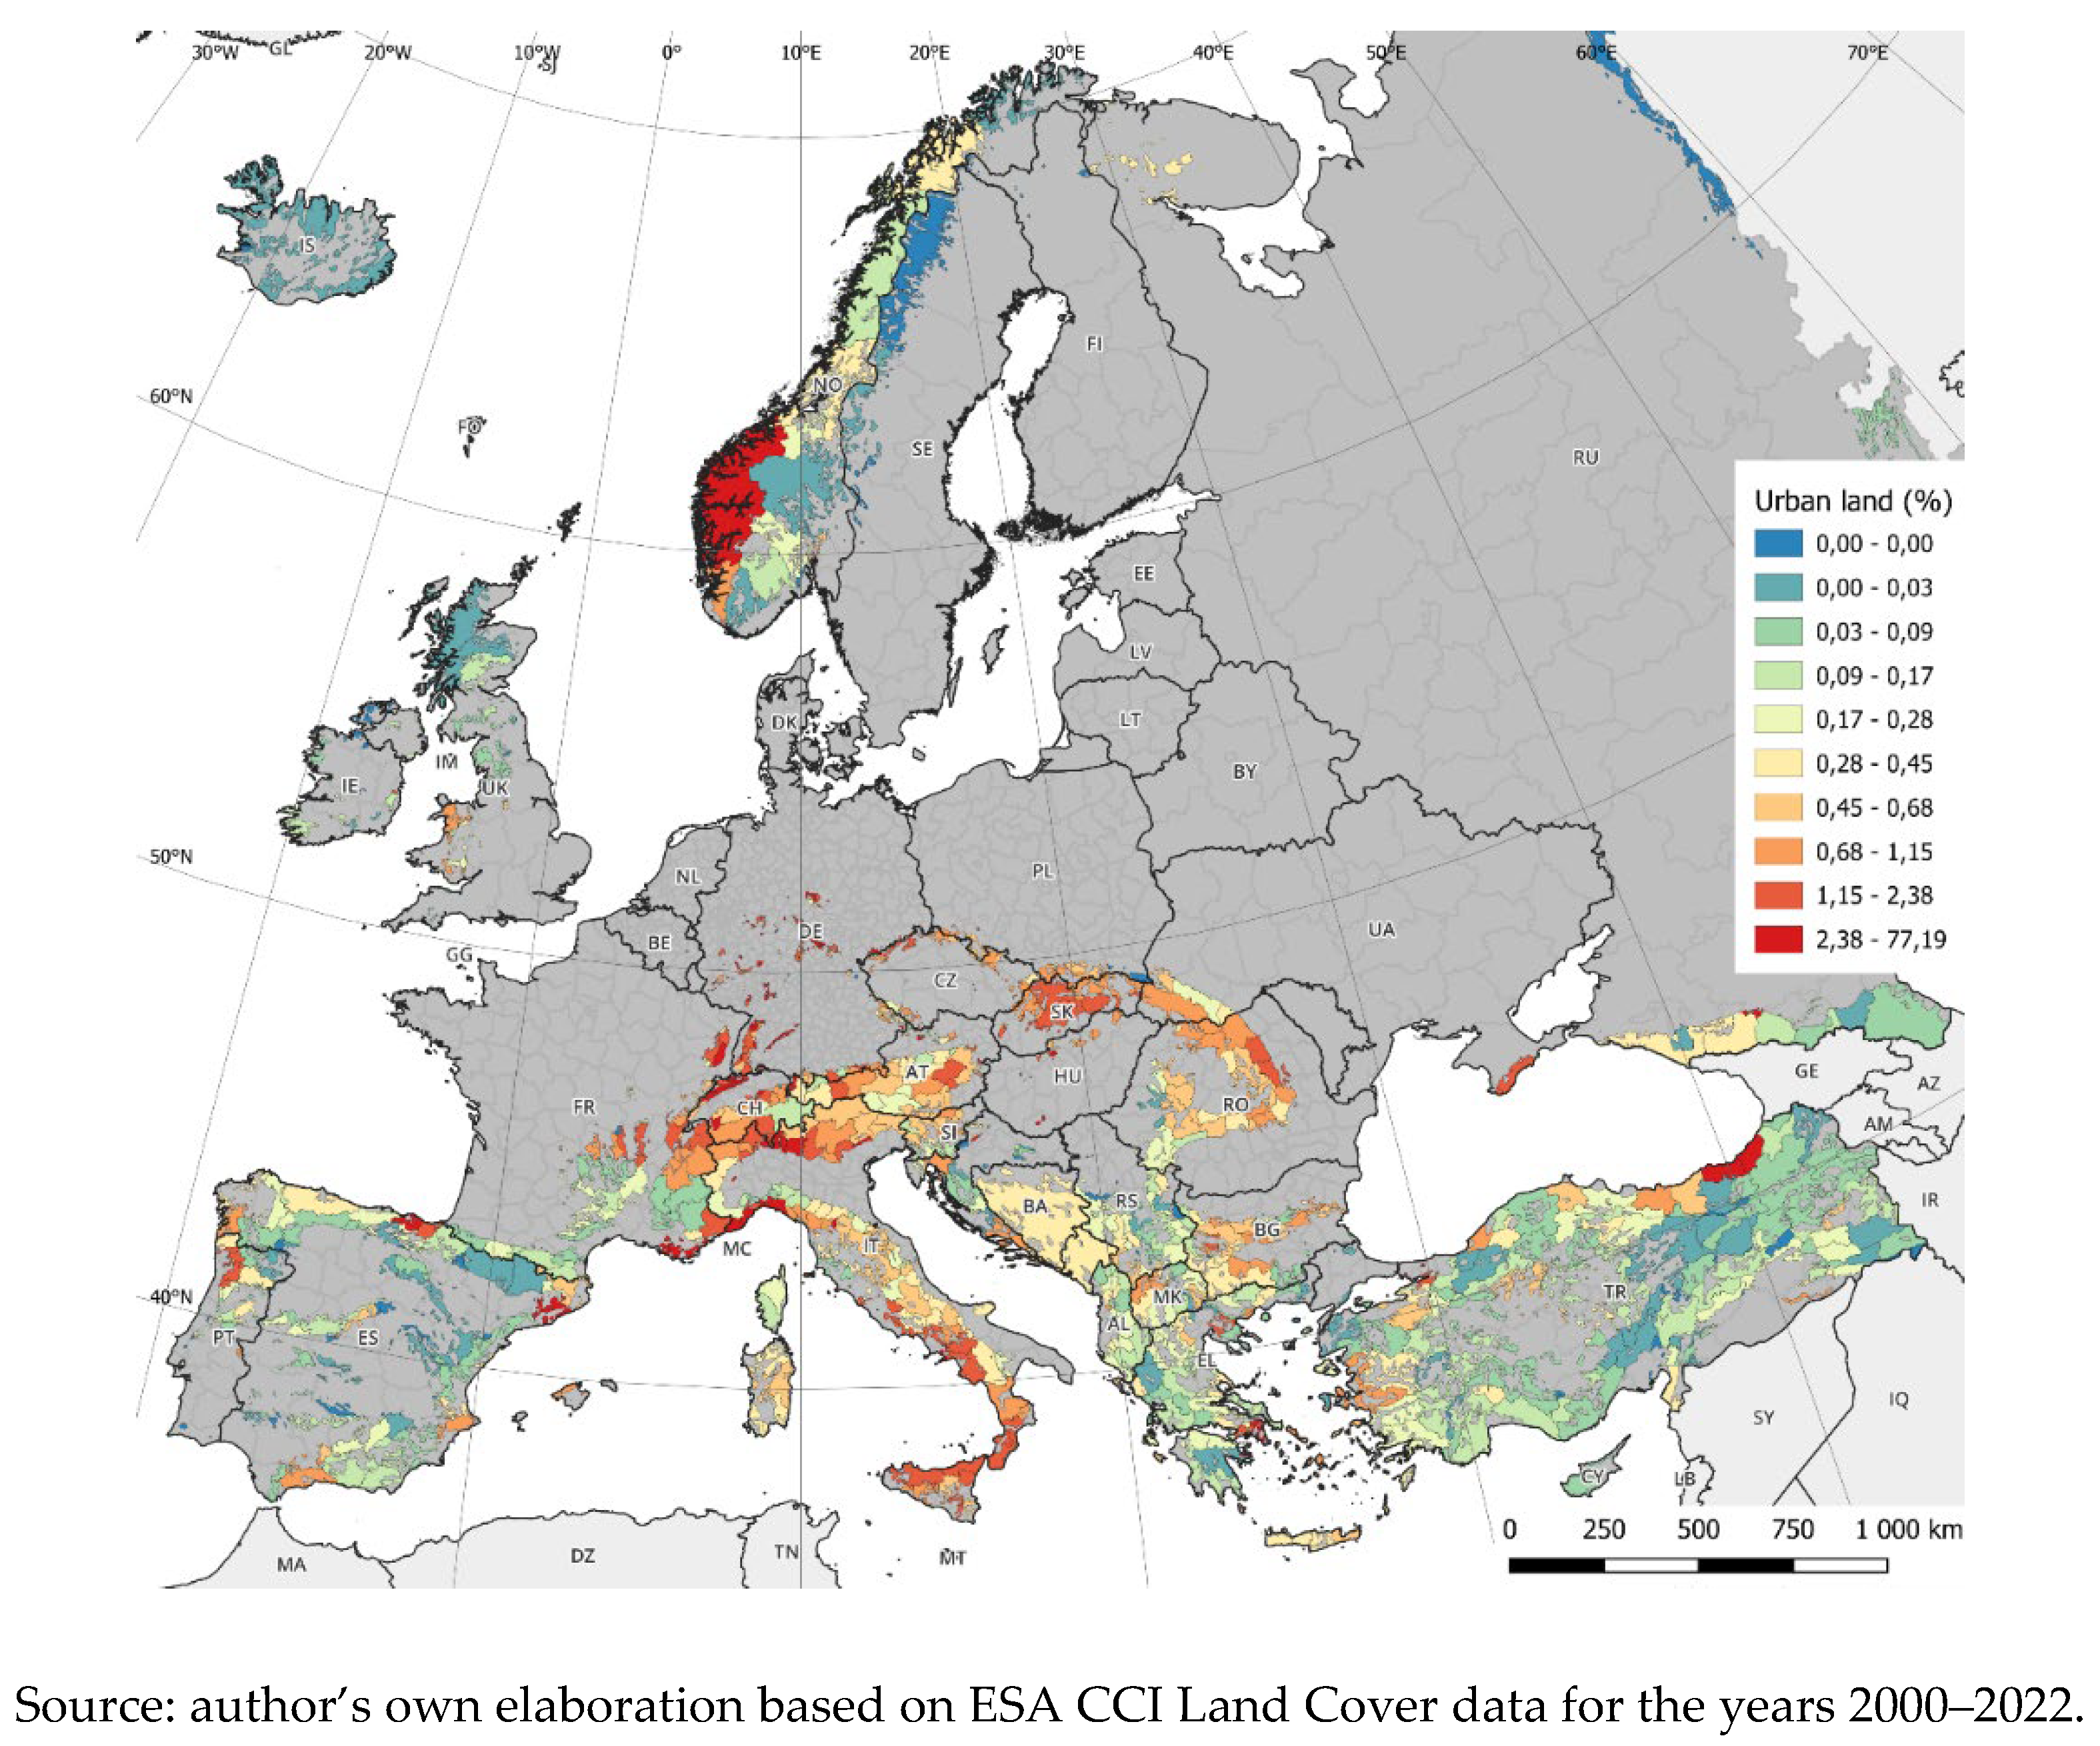
Figure 7.
Rate of change in the share of urbanised areas in the surface area of mountain regions.

Figure 8.
Effect of selected variables on the share of cropland area in mountain regions.
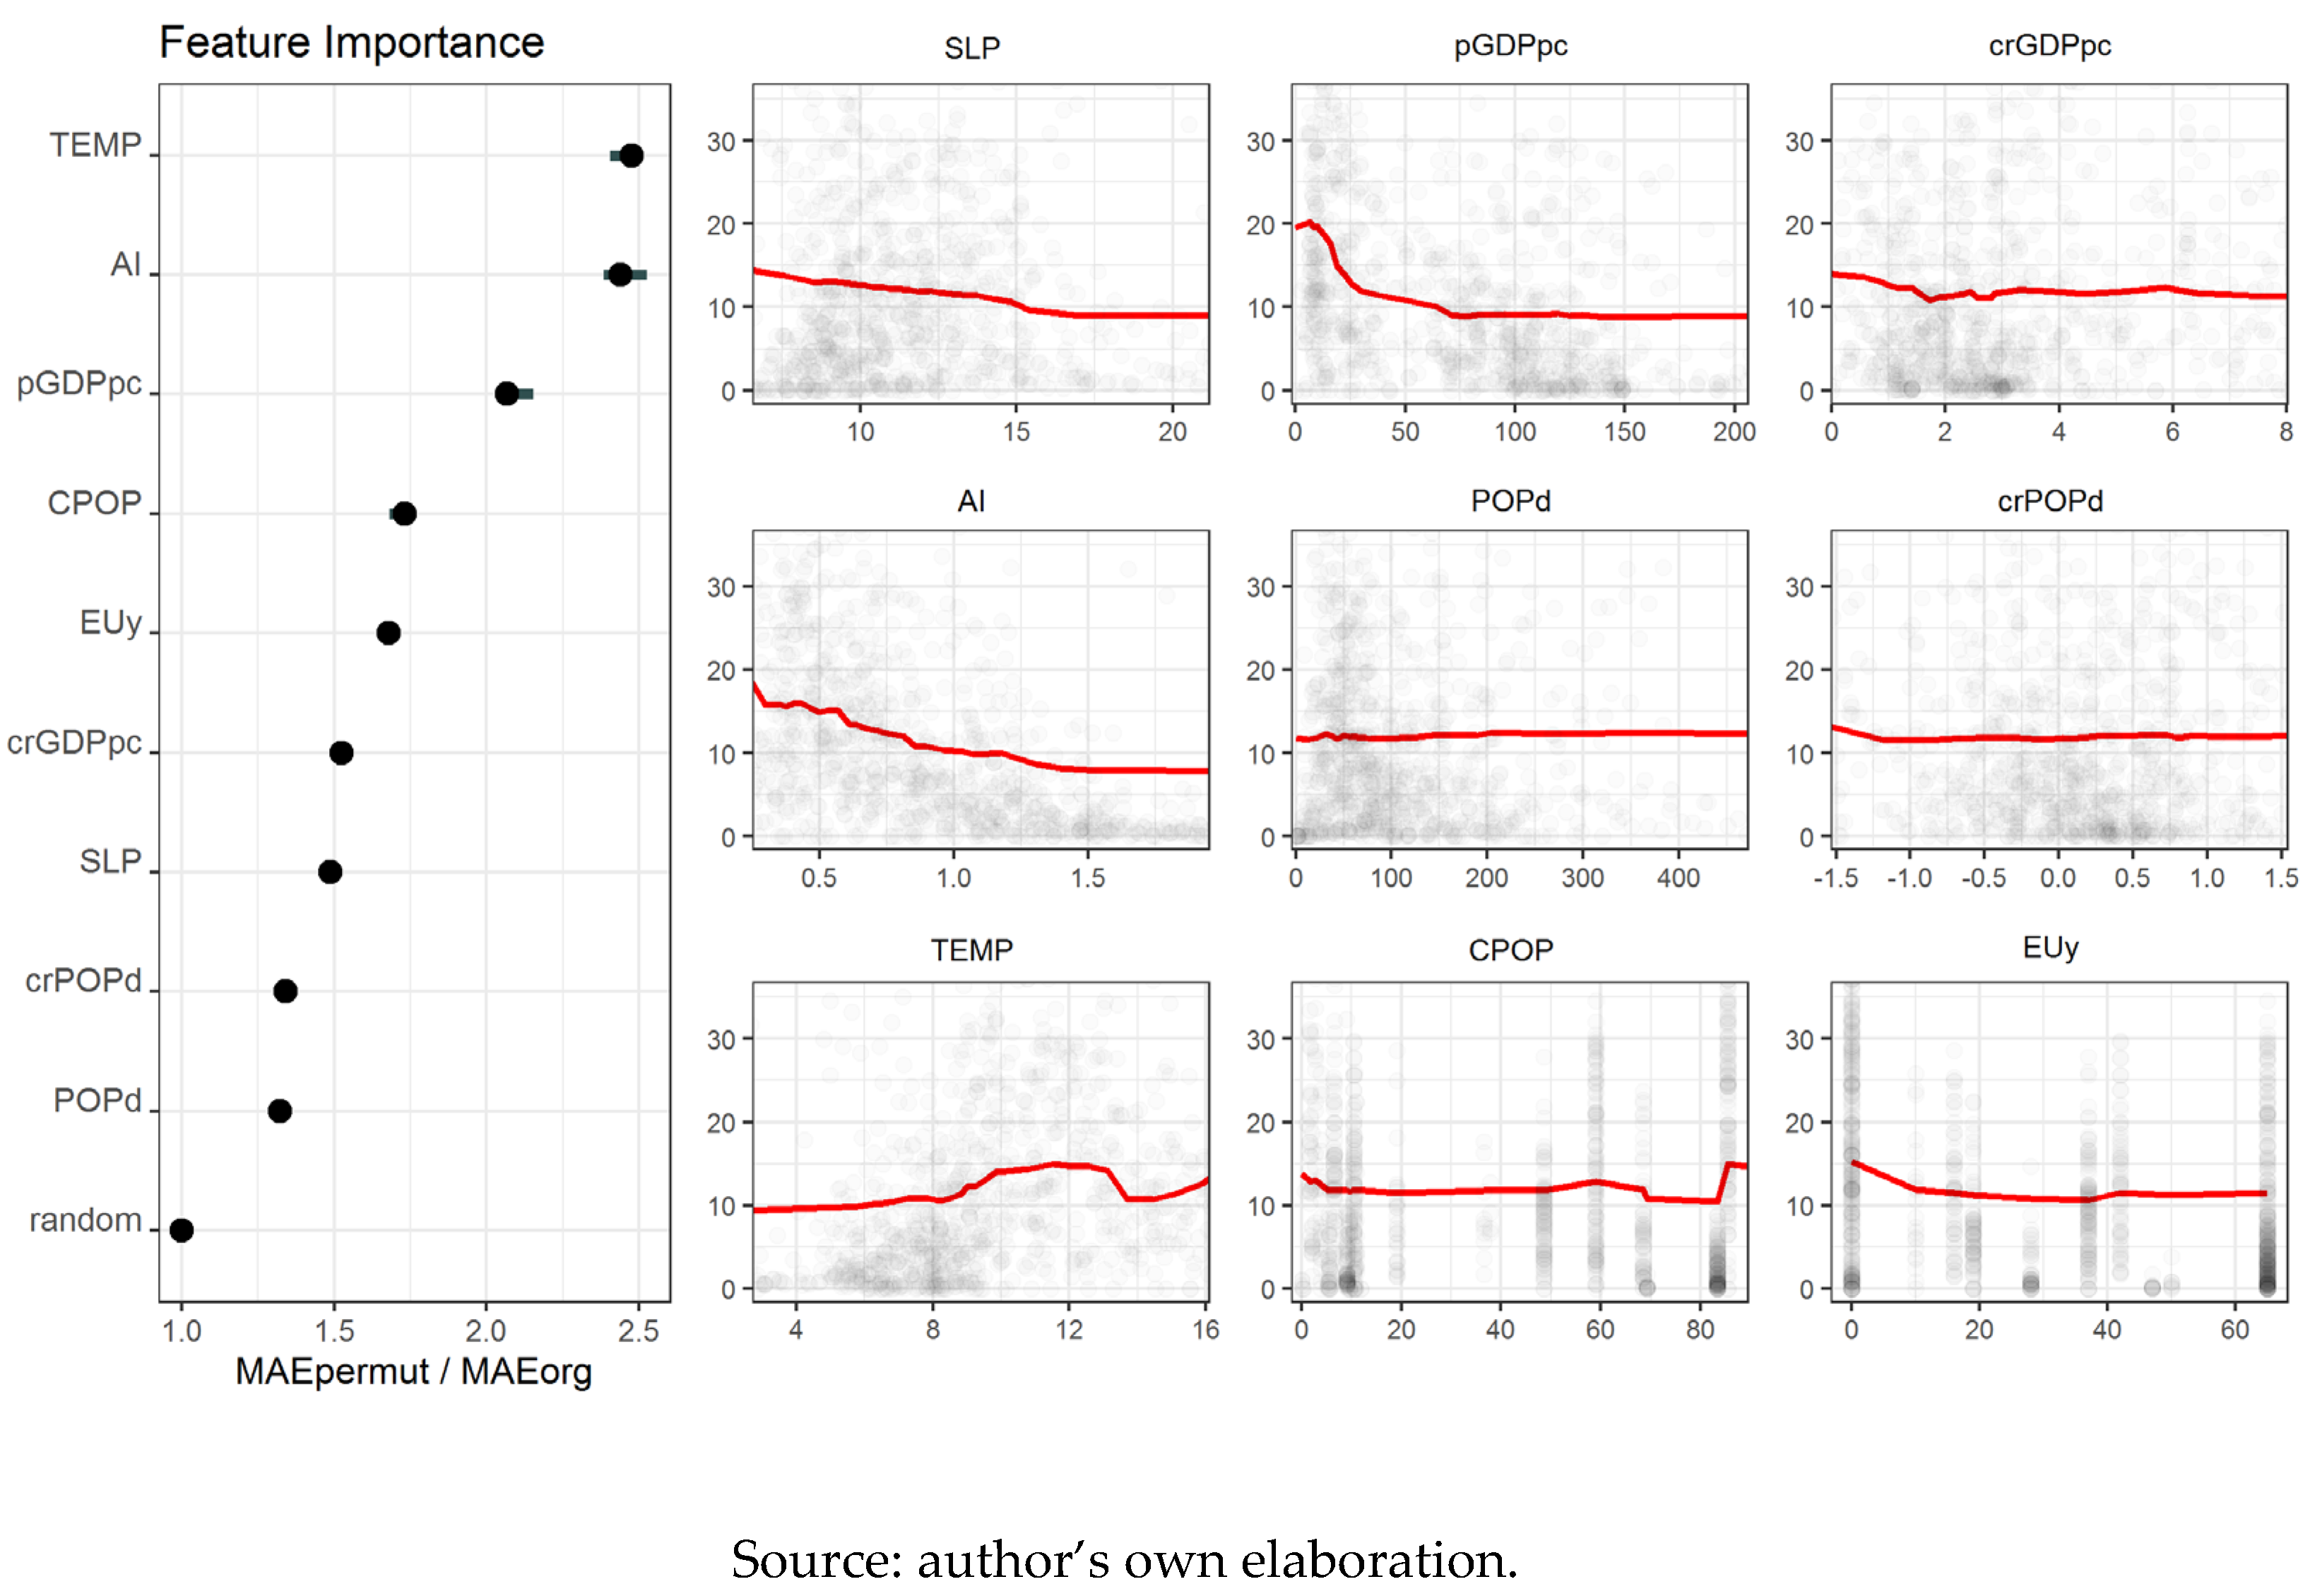
Figure 9.
Effect of selected variables on the rate of change in cropland area in mountain regions.
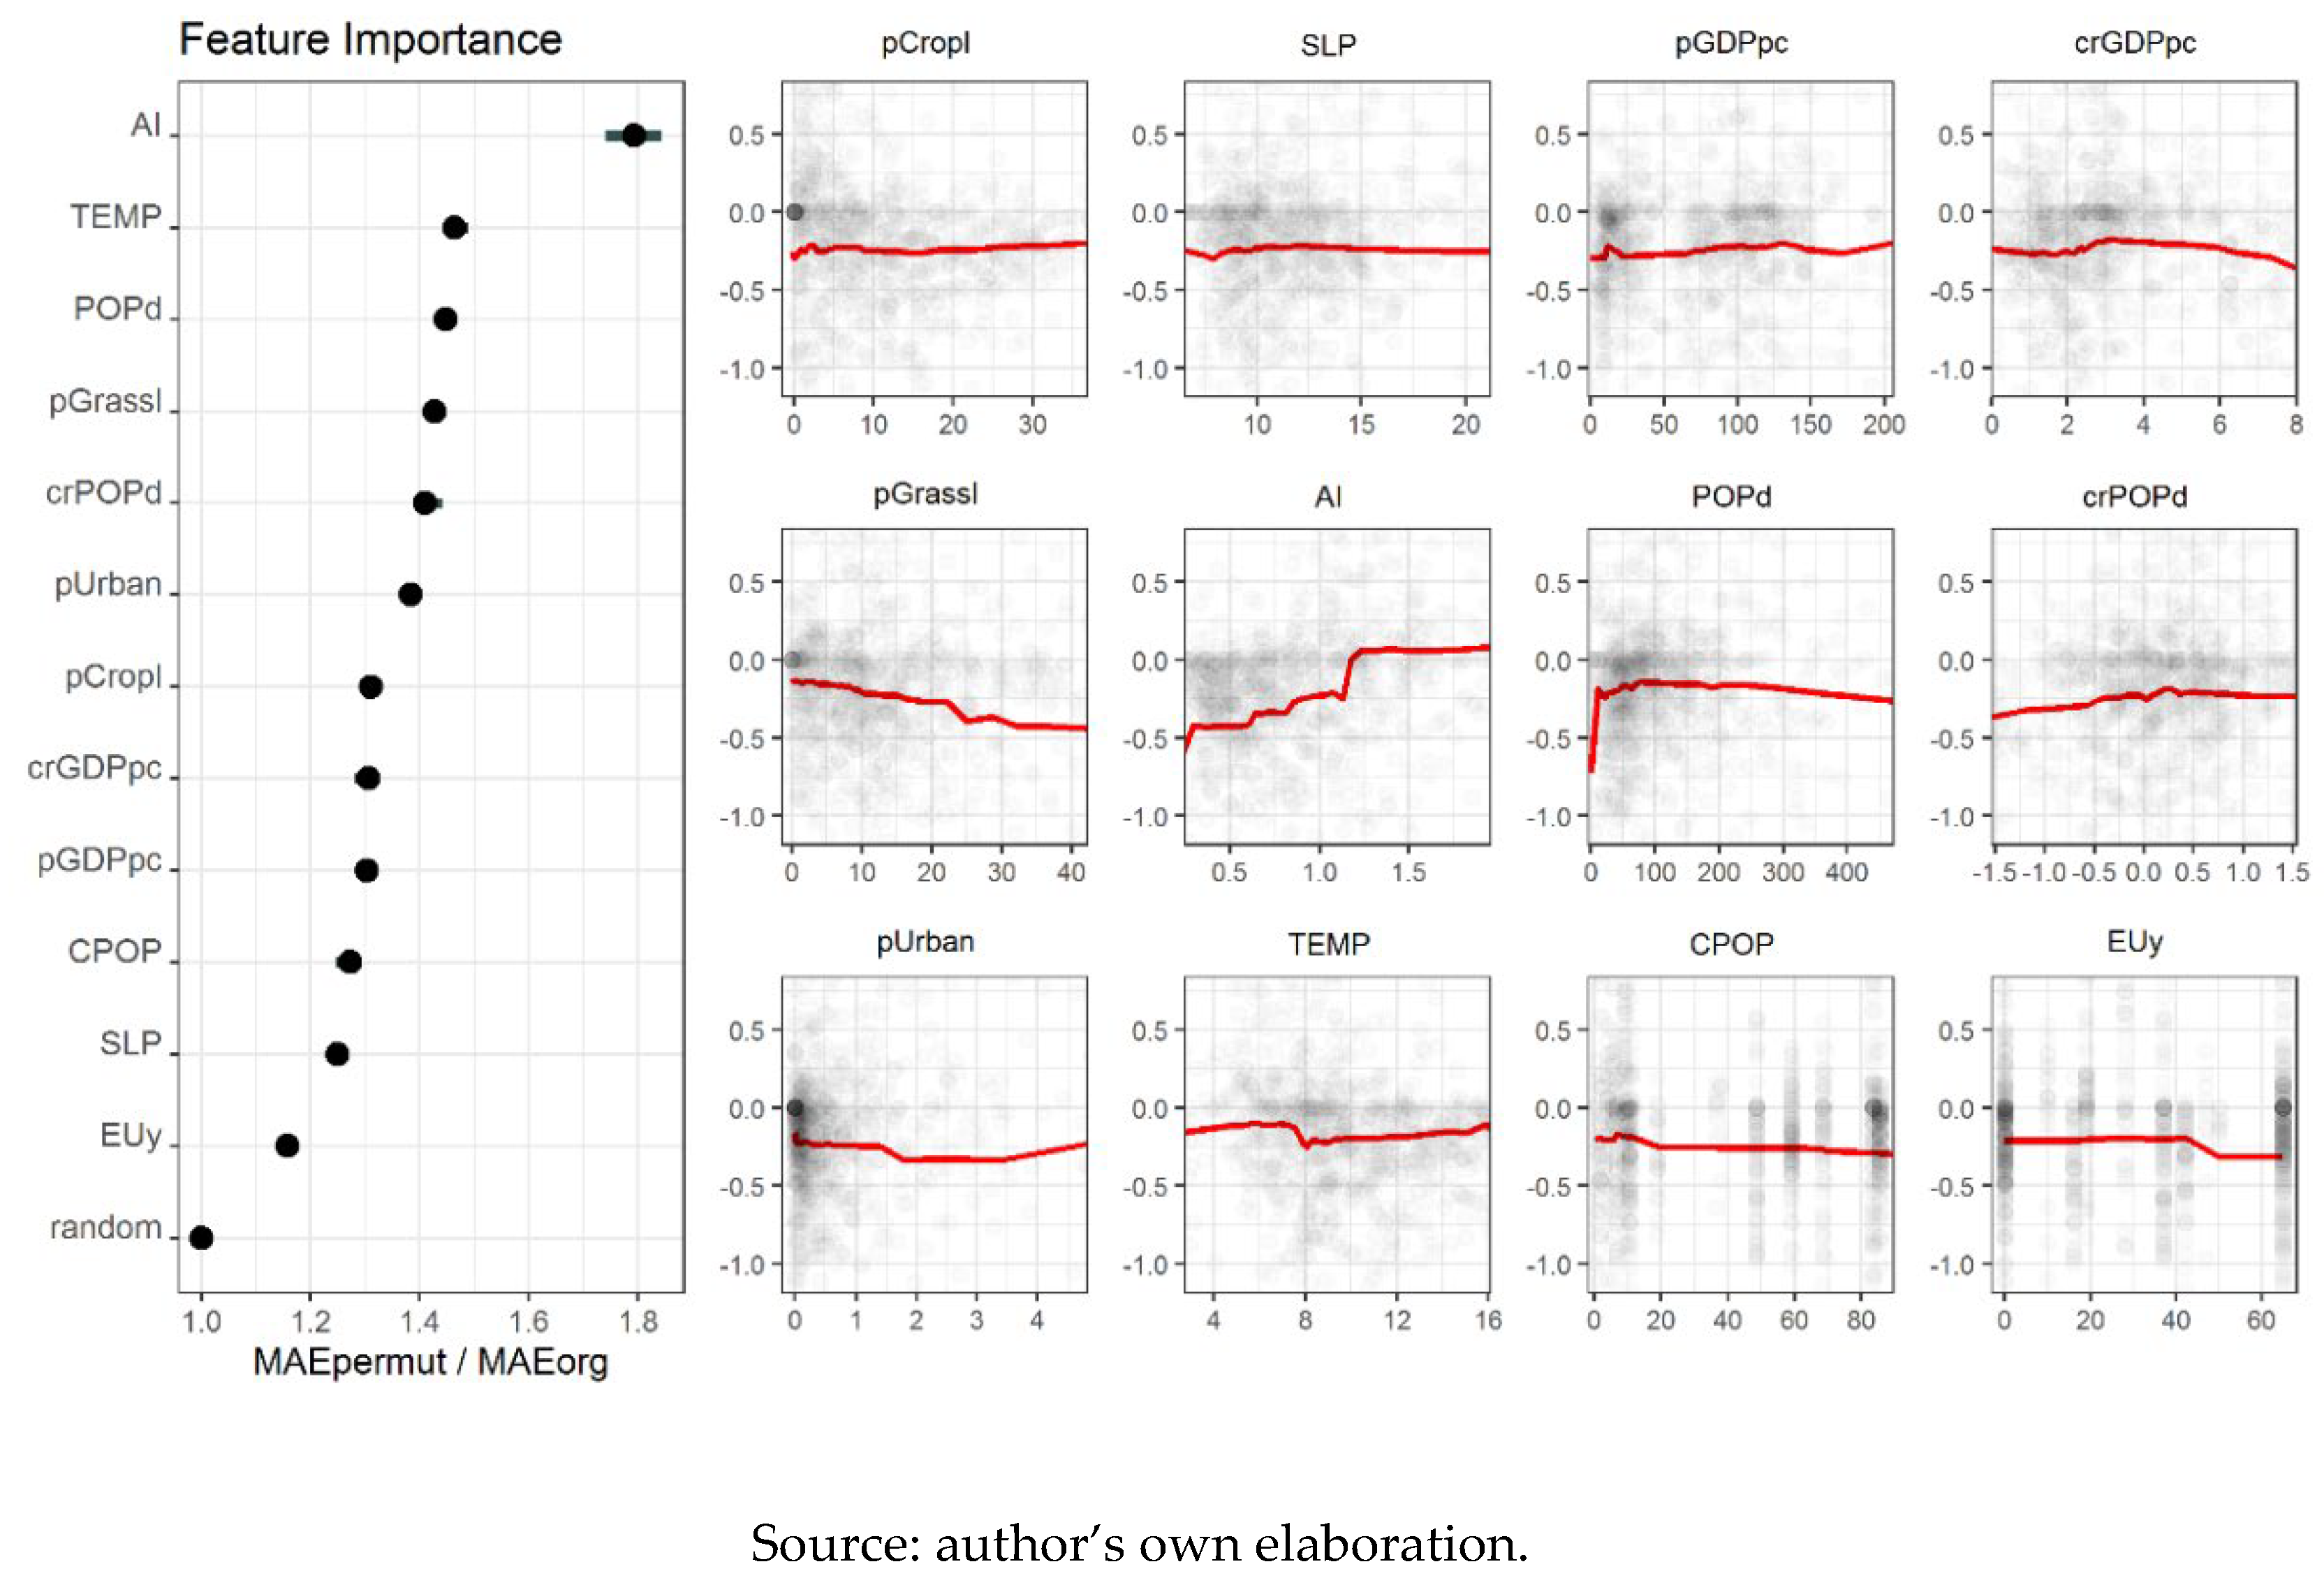
Figure 10.
Effect of selected variables on the share of grassland in mountain regions.
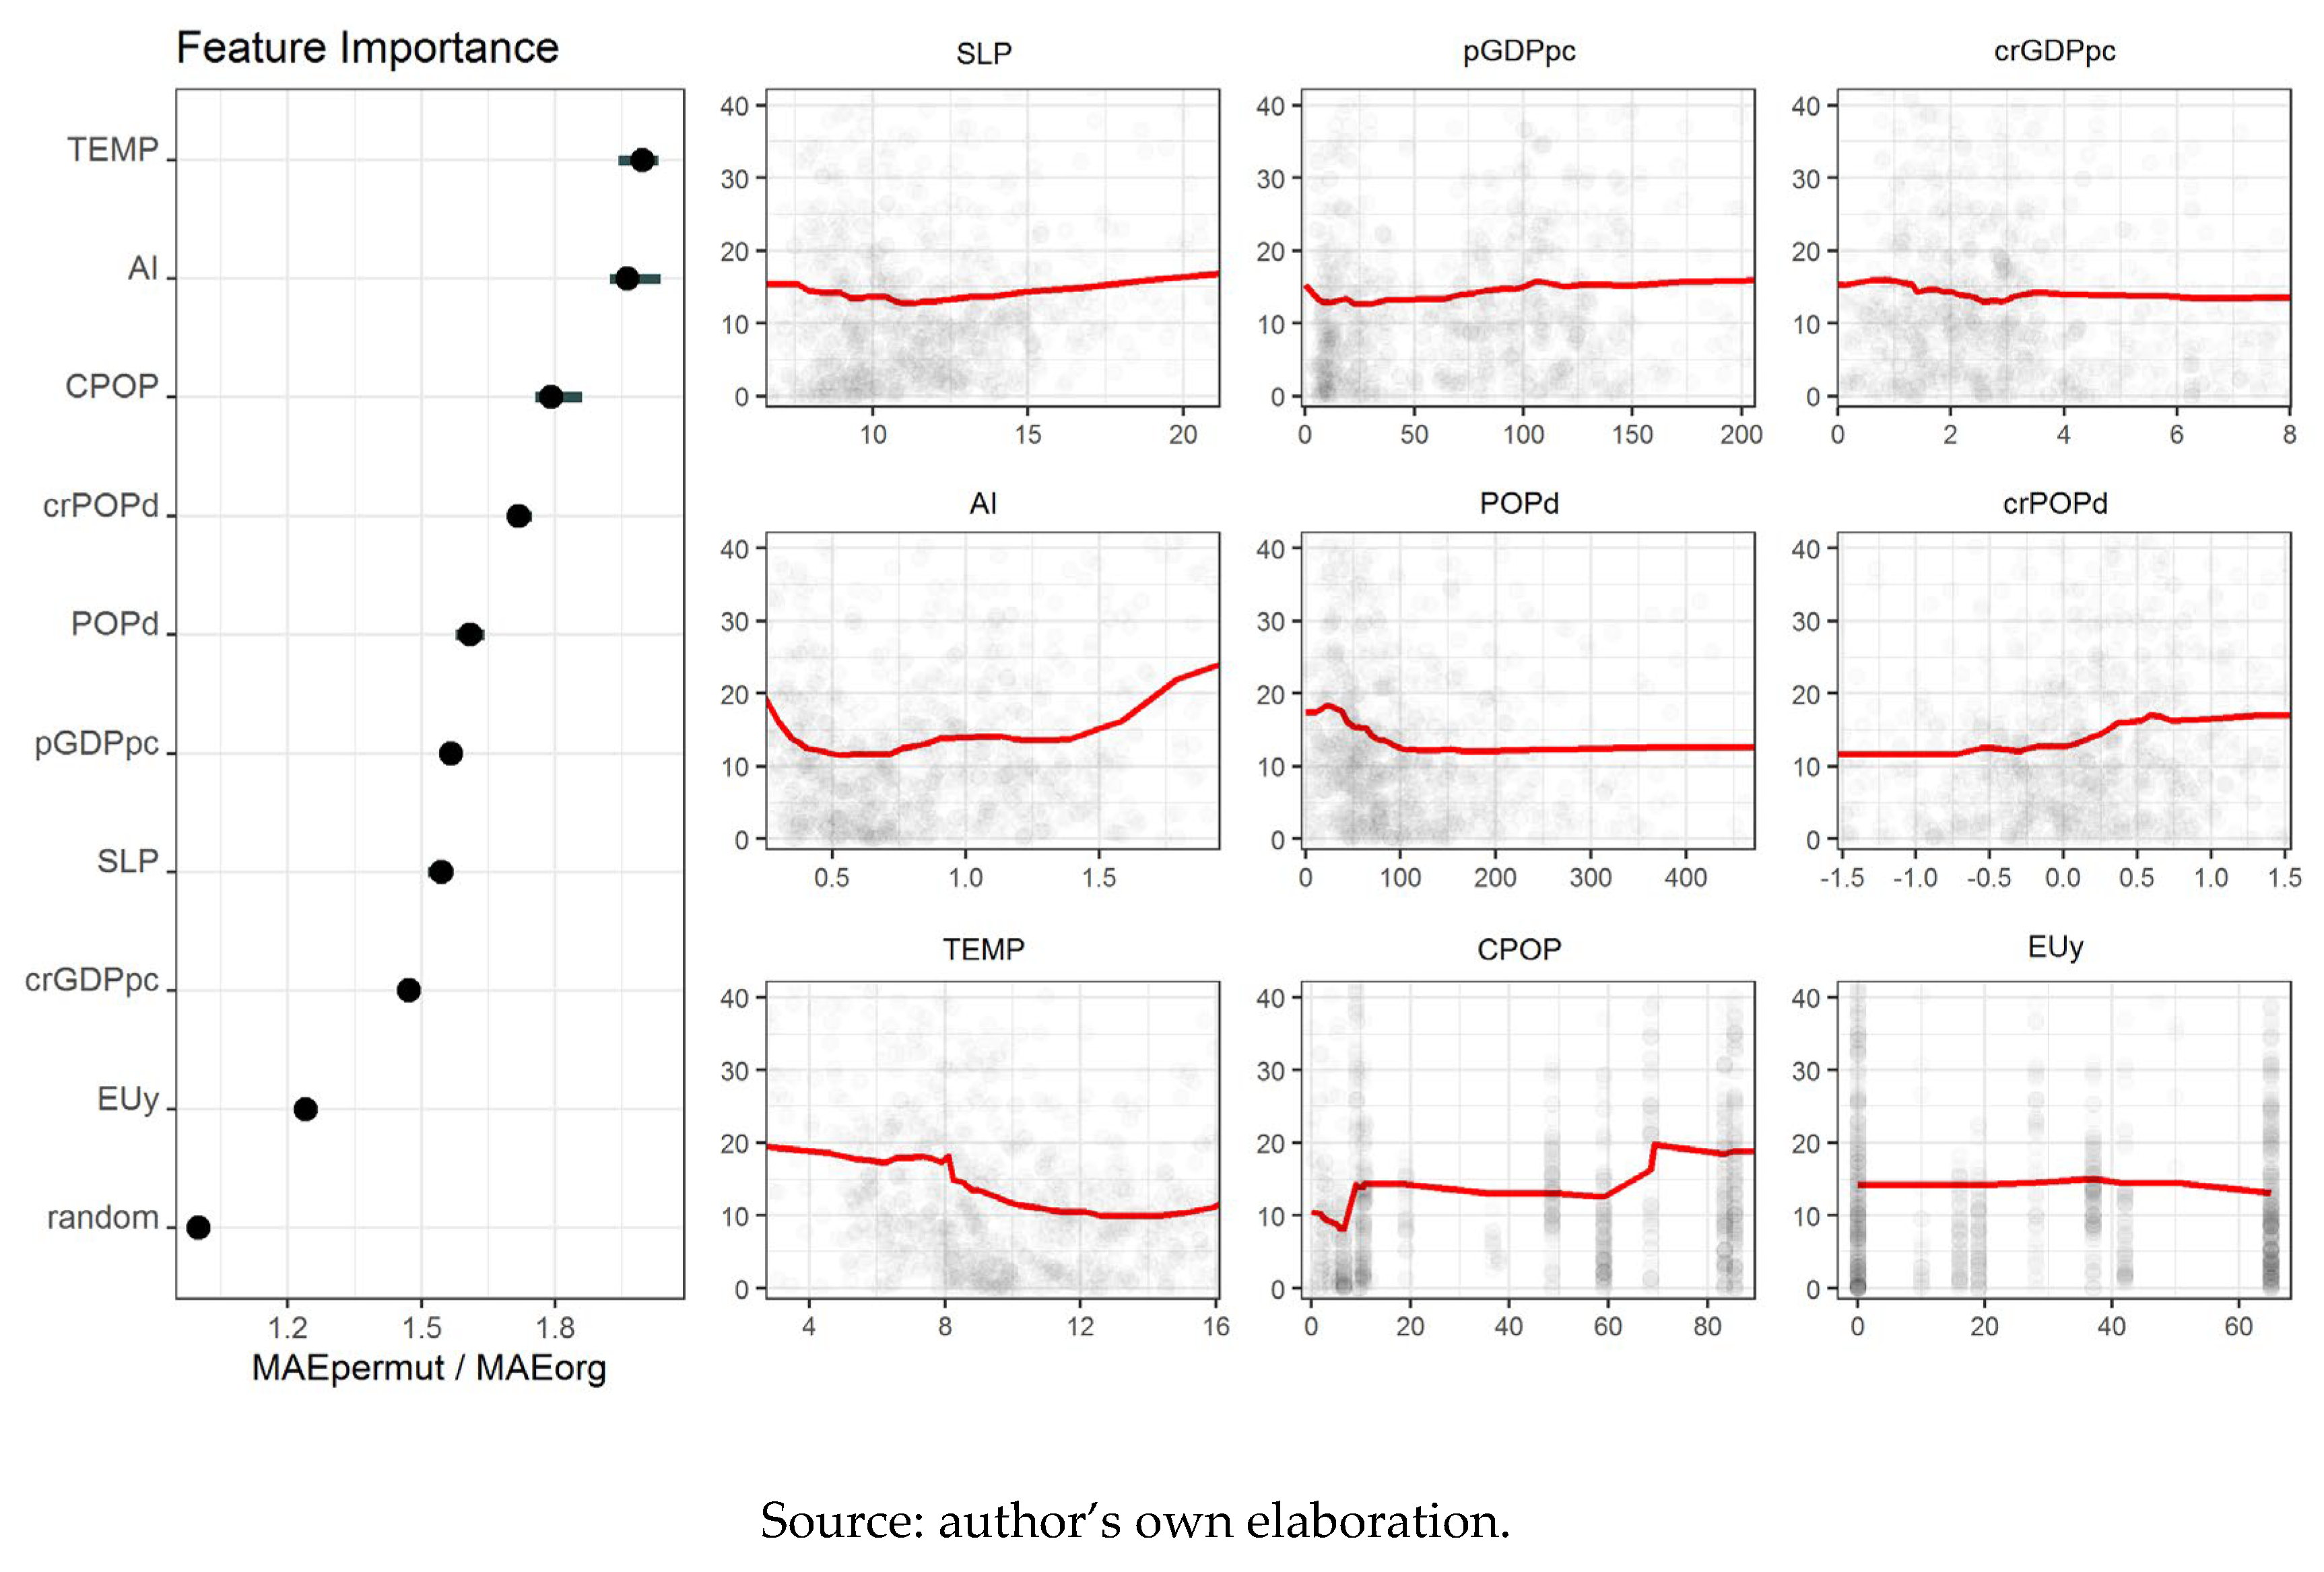
Figure 11.
Effect of selected variables on the rate of change in grassland in mountain regions.
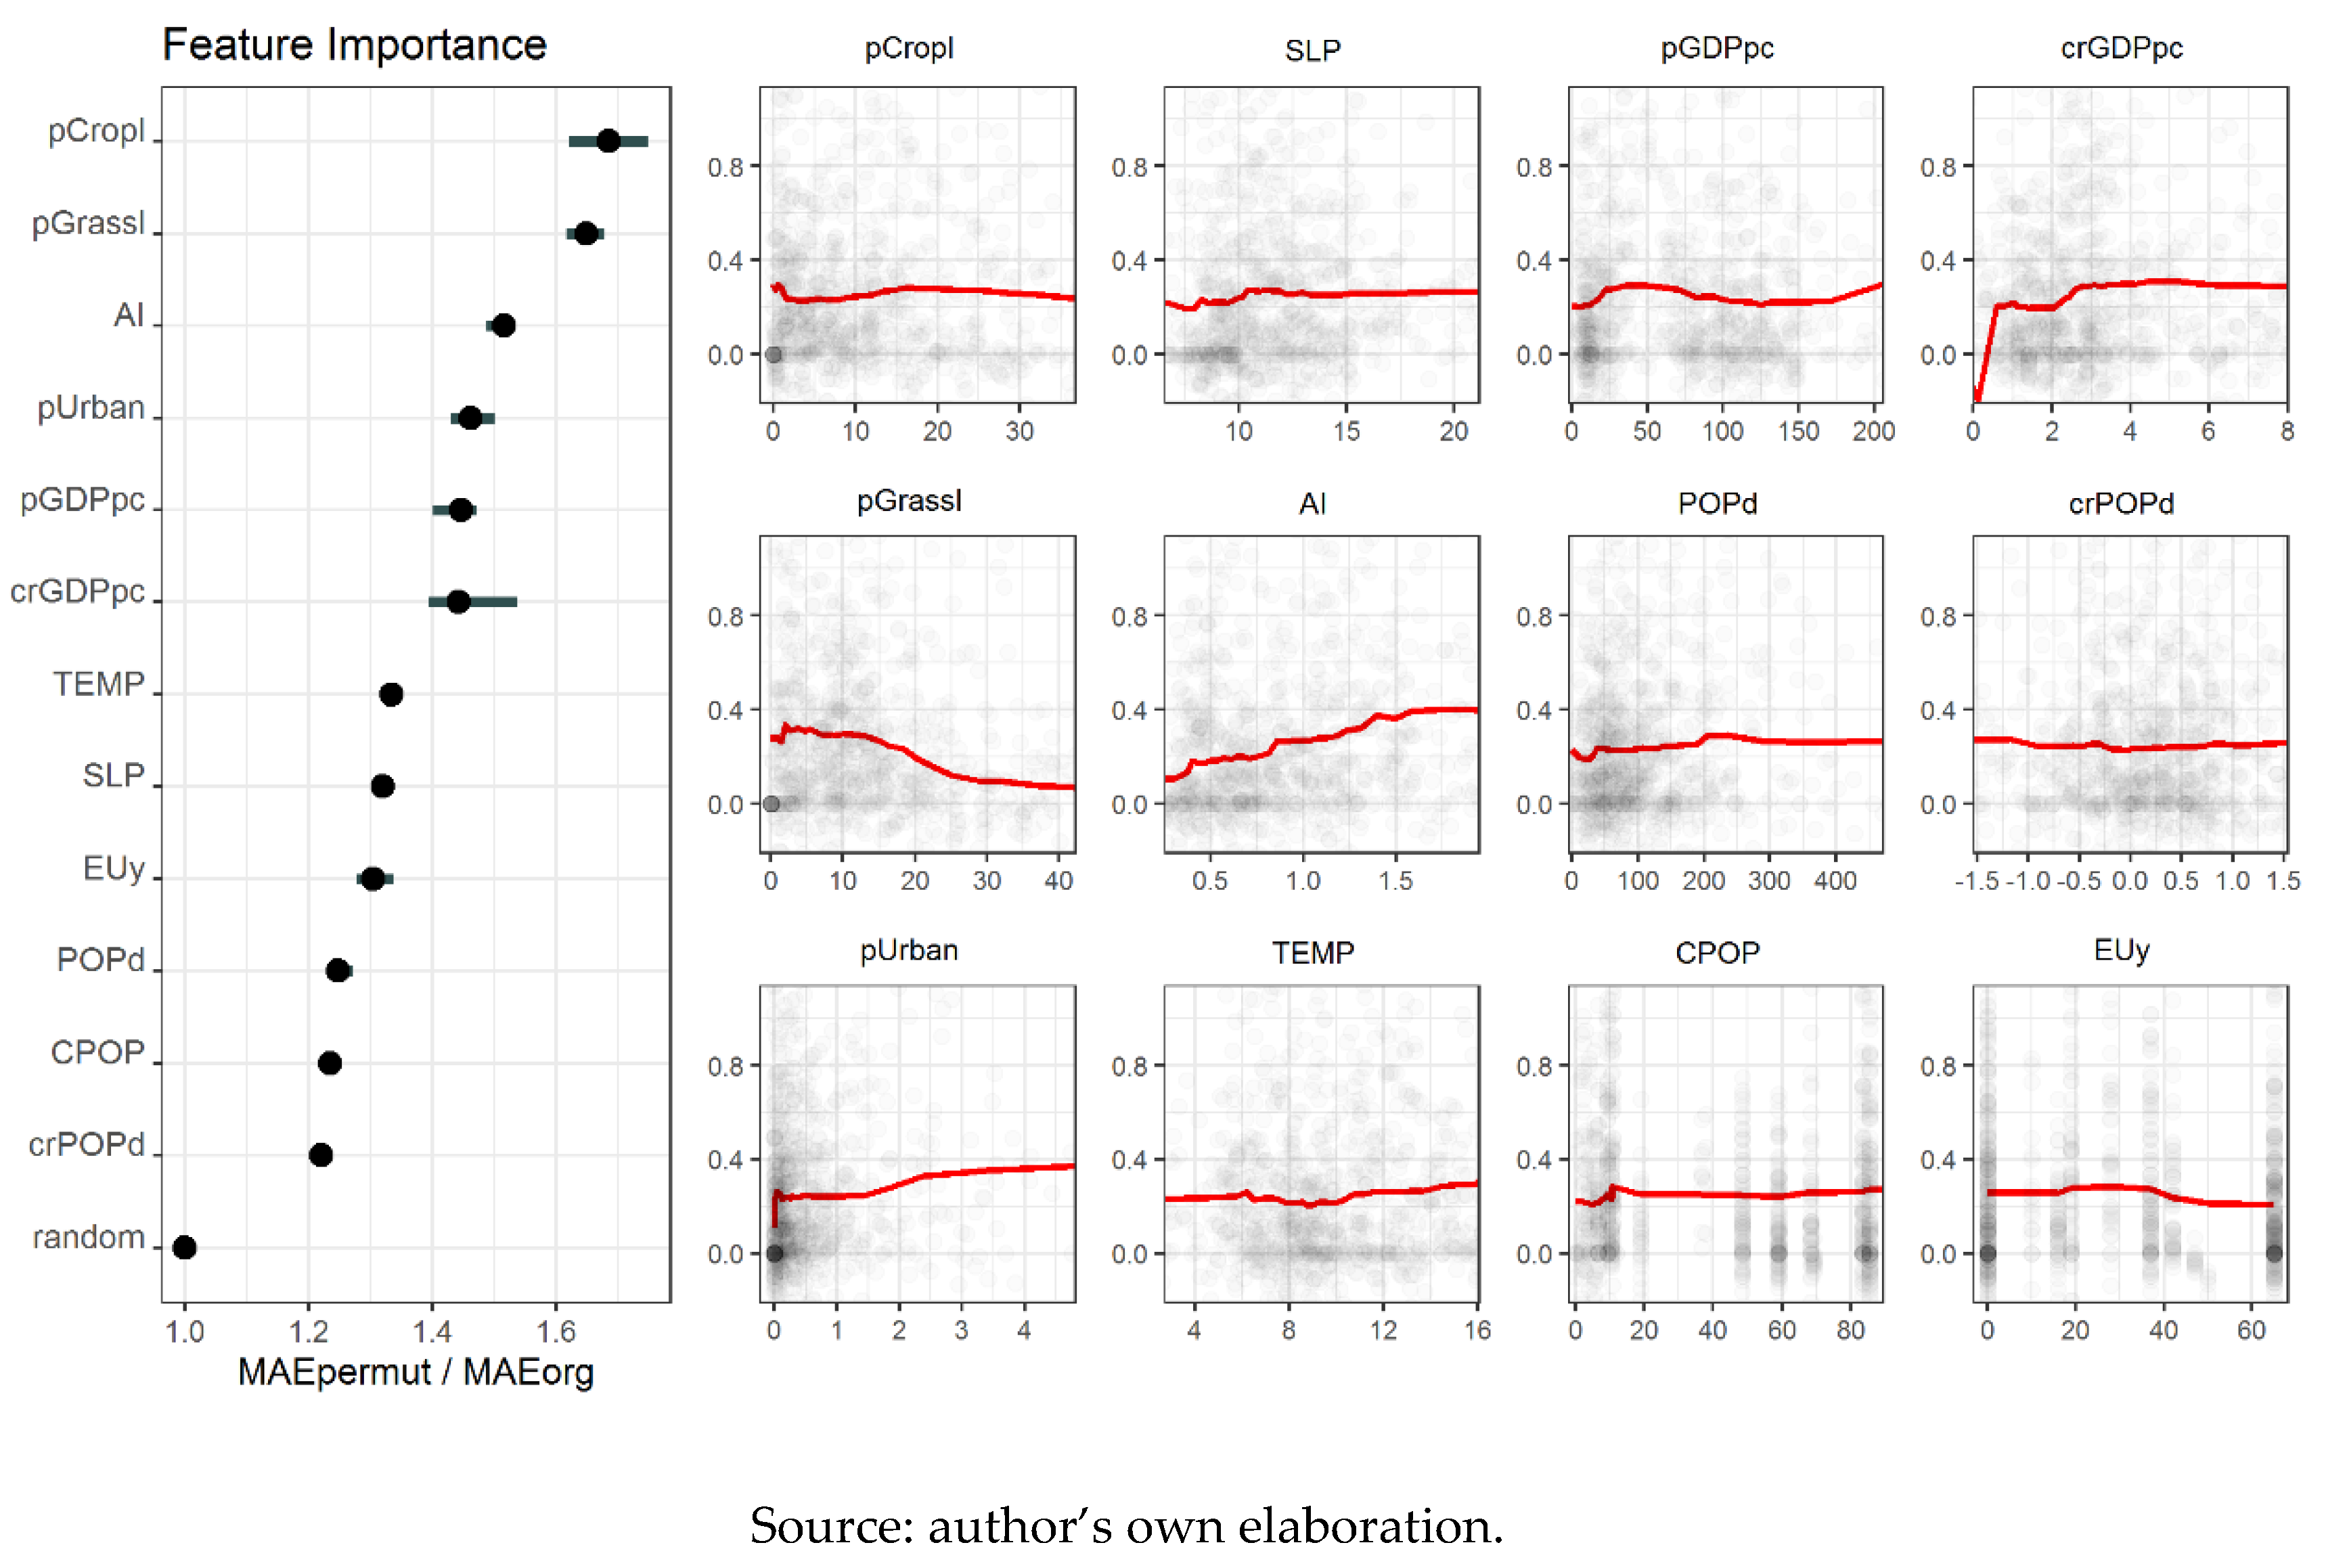
Figure 12.
Effect of selected variables on the share of urbanised areas in mountain regions.
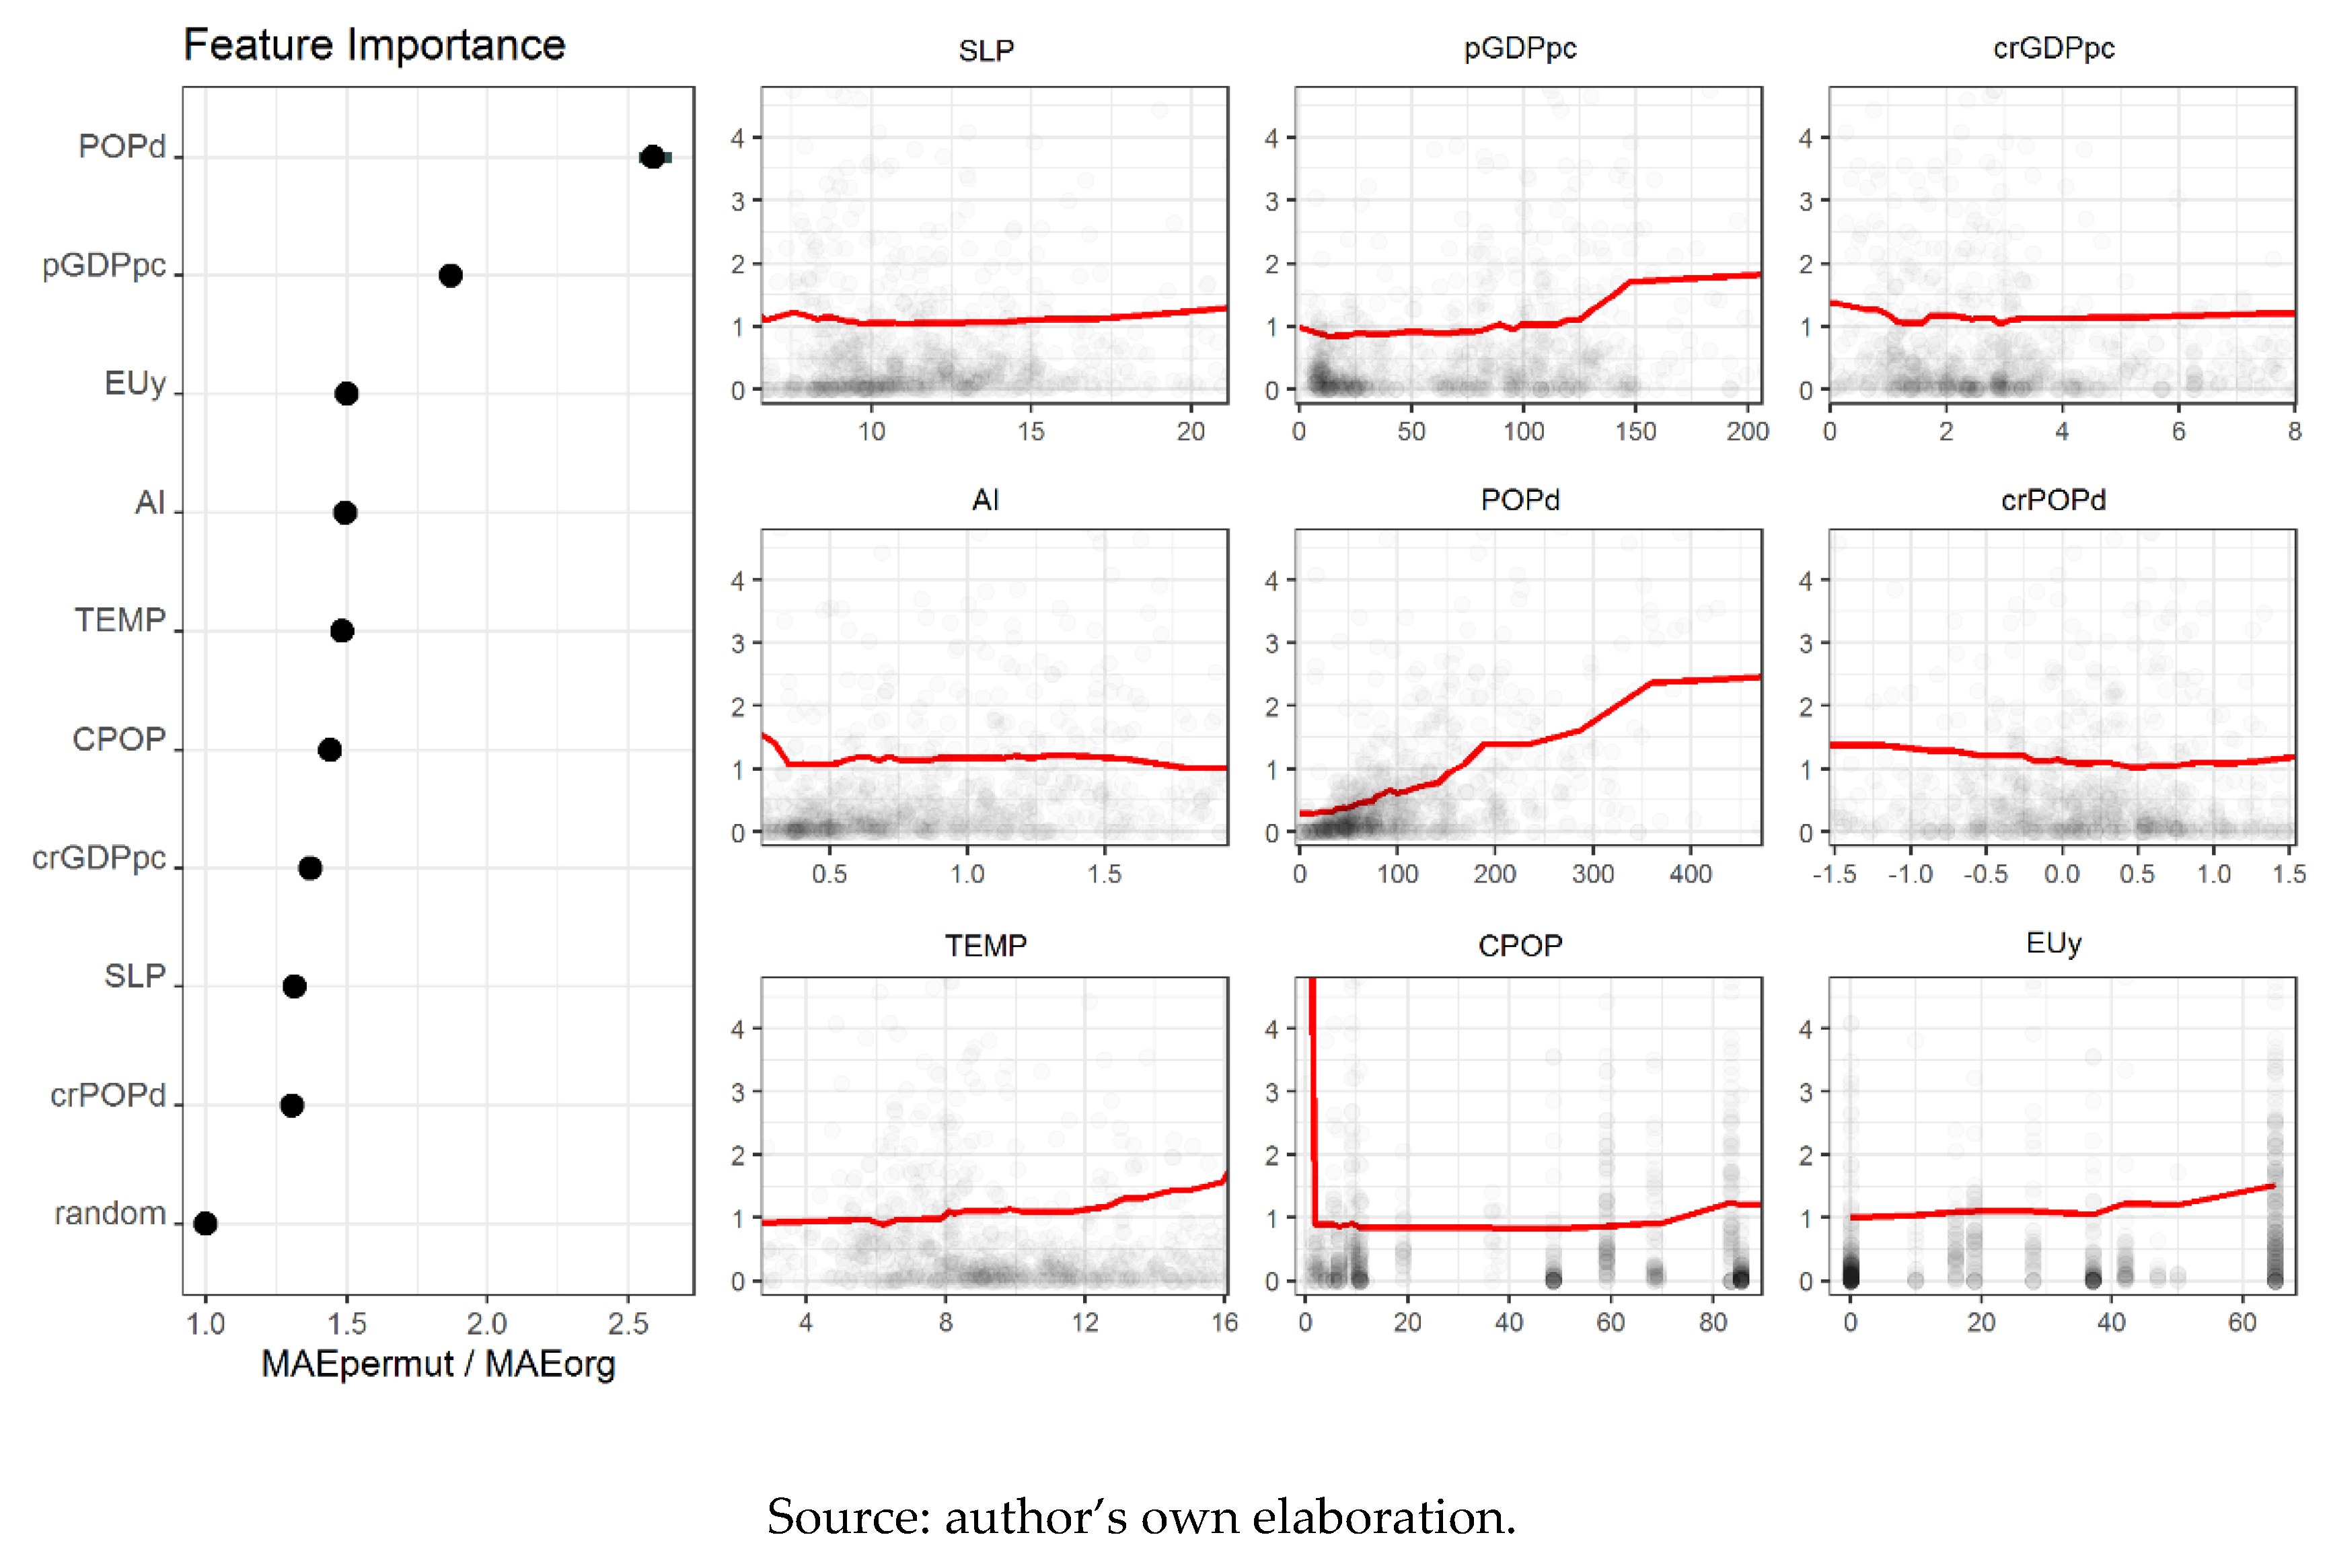
Figure 13.
Effect of selected variables on the rate of change in urbanised areas in mountain regions.
Figure 13.
Effect of selected variables on the rate of change in urbanised areas in mountain regions.
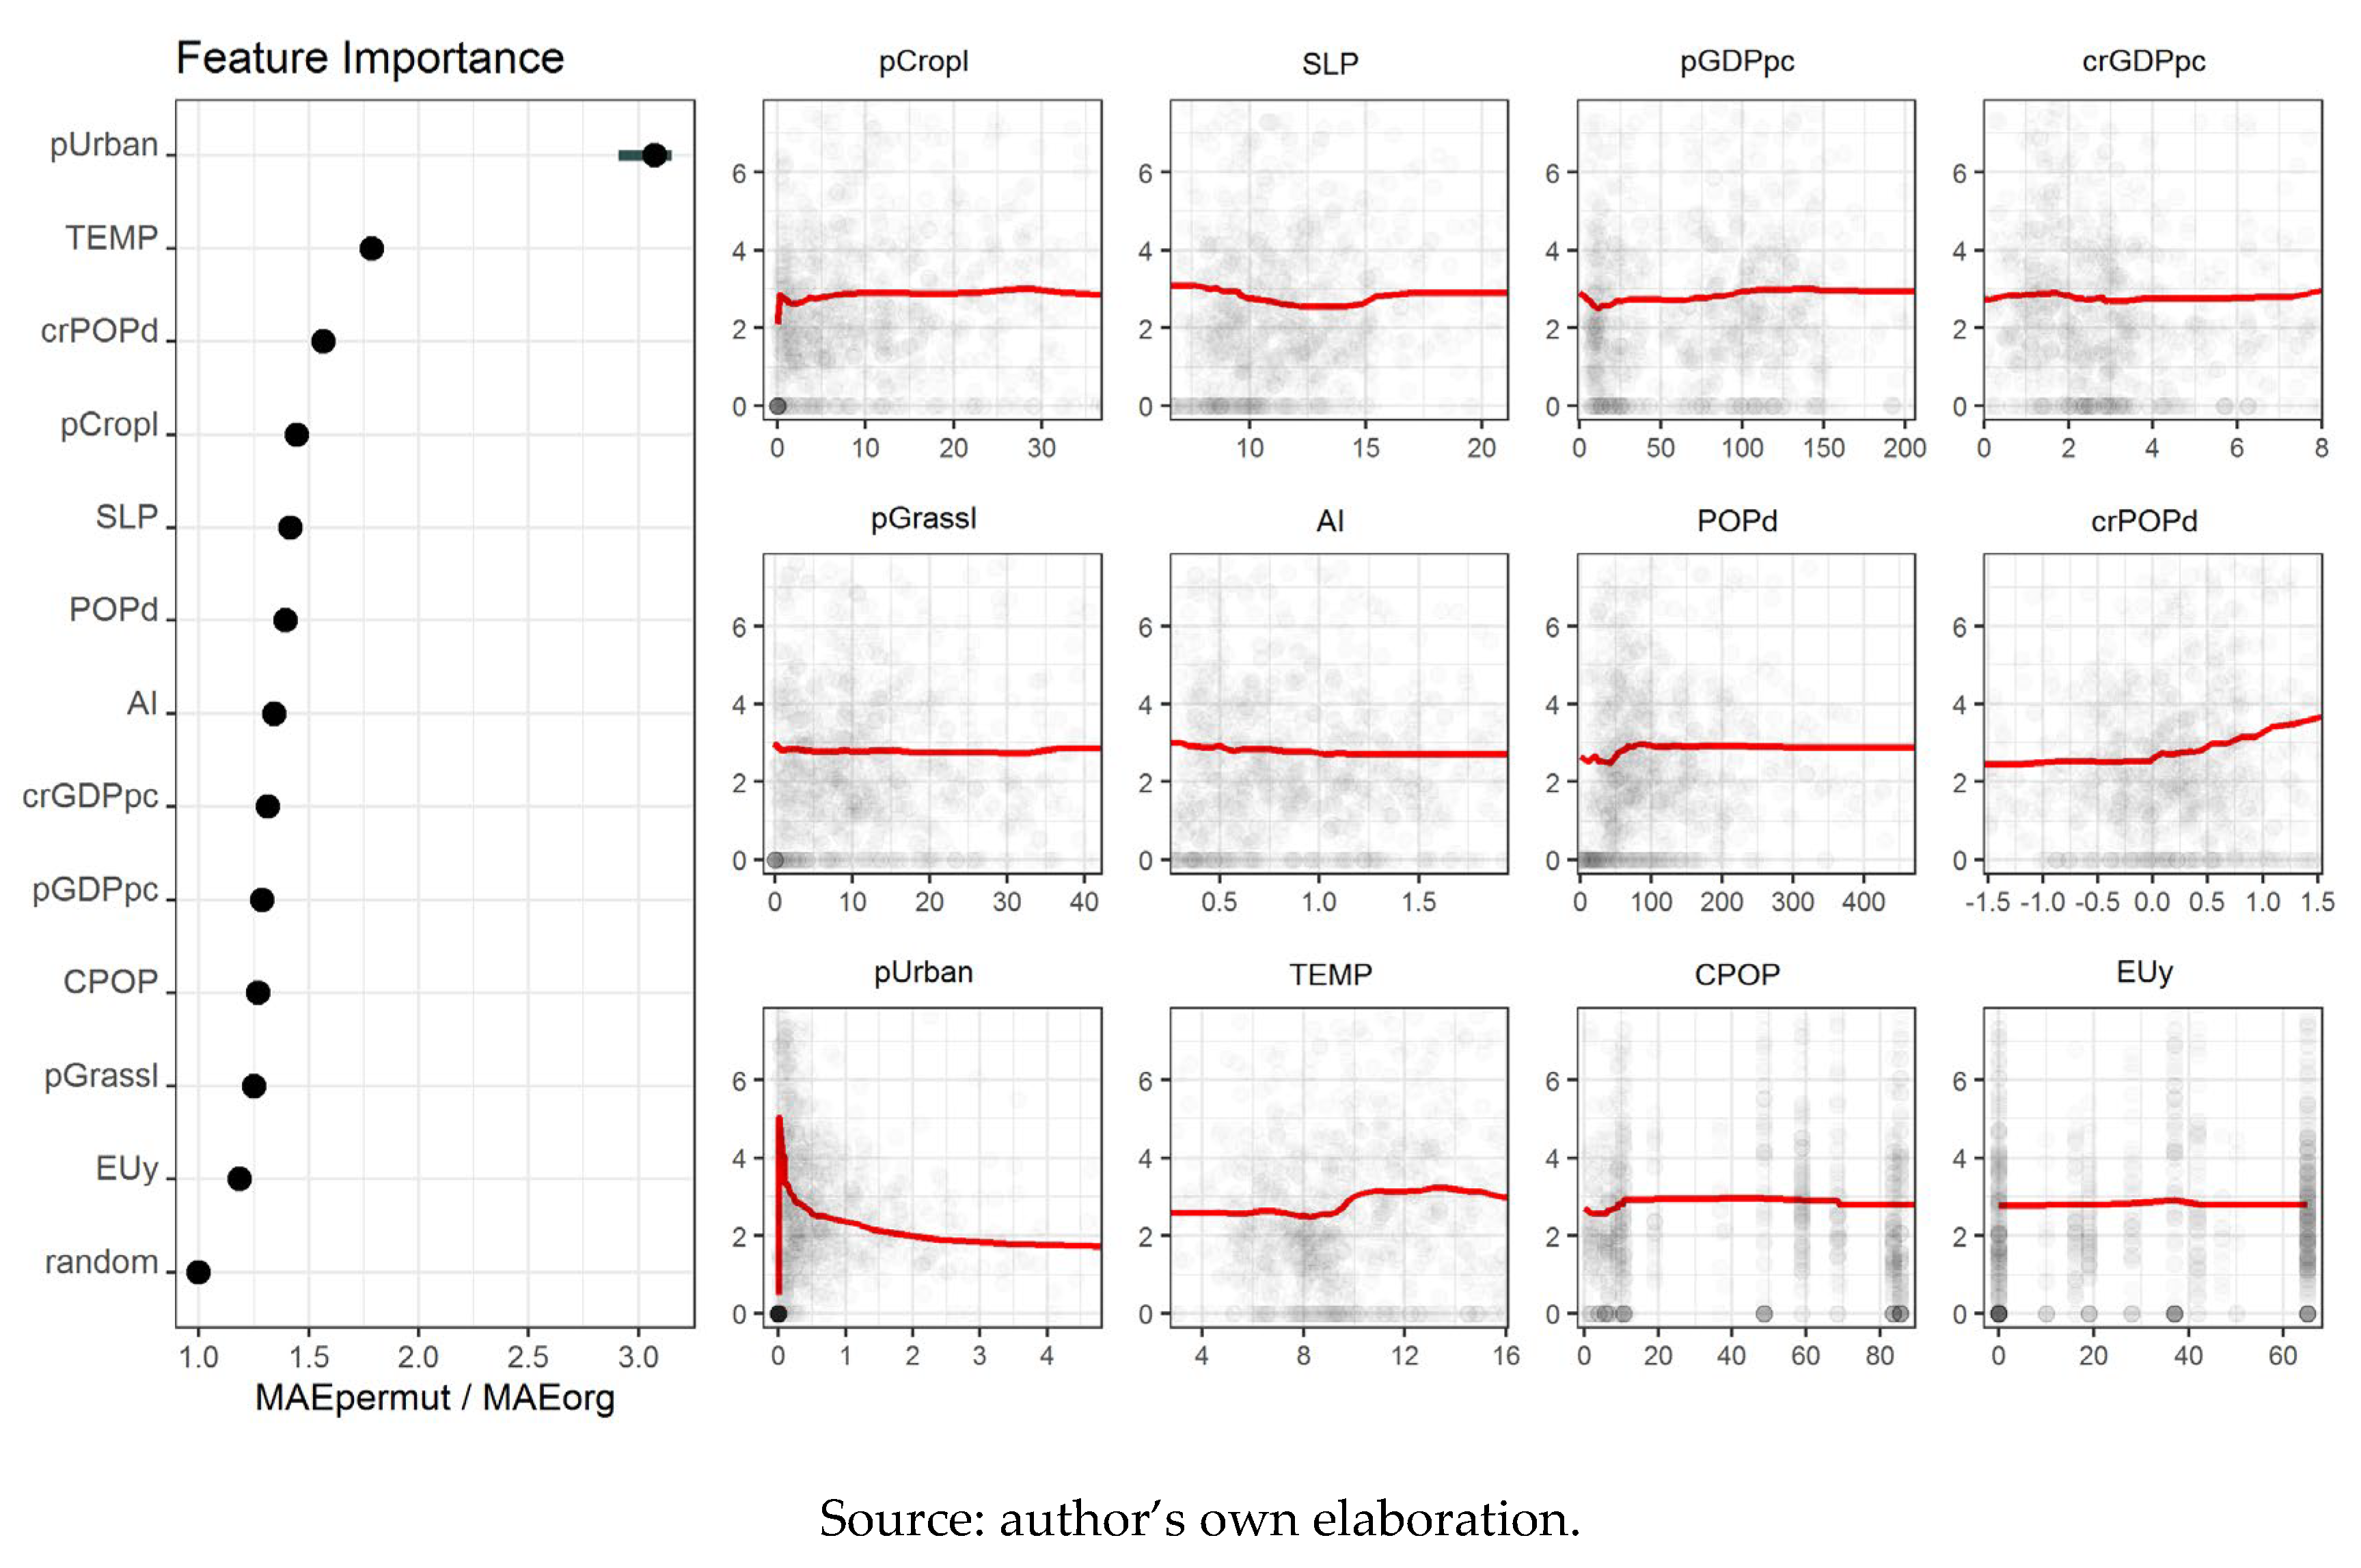
Figure 14.
Economic size (thousand euros SO) of commercial farms in mountain areas of EU countries (average for 2004–2022, in thousand euros).
Figure 14.
Economic size (thousand euros SO) of commercial farms in mountain areas of EU countries (average for 2004–2022, in thousand euros).
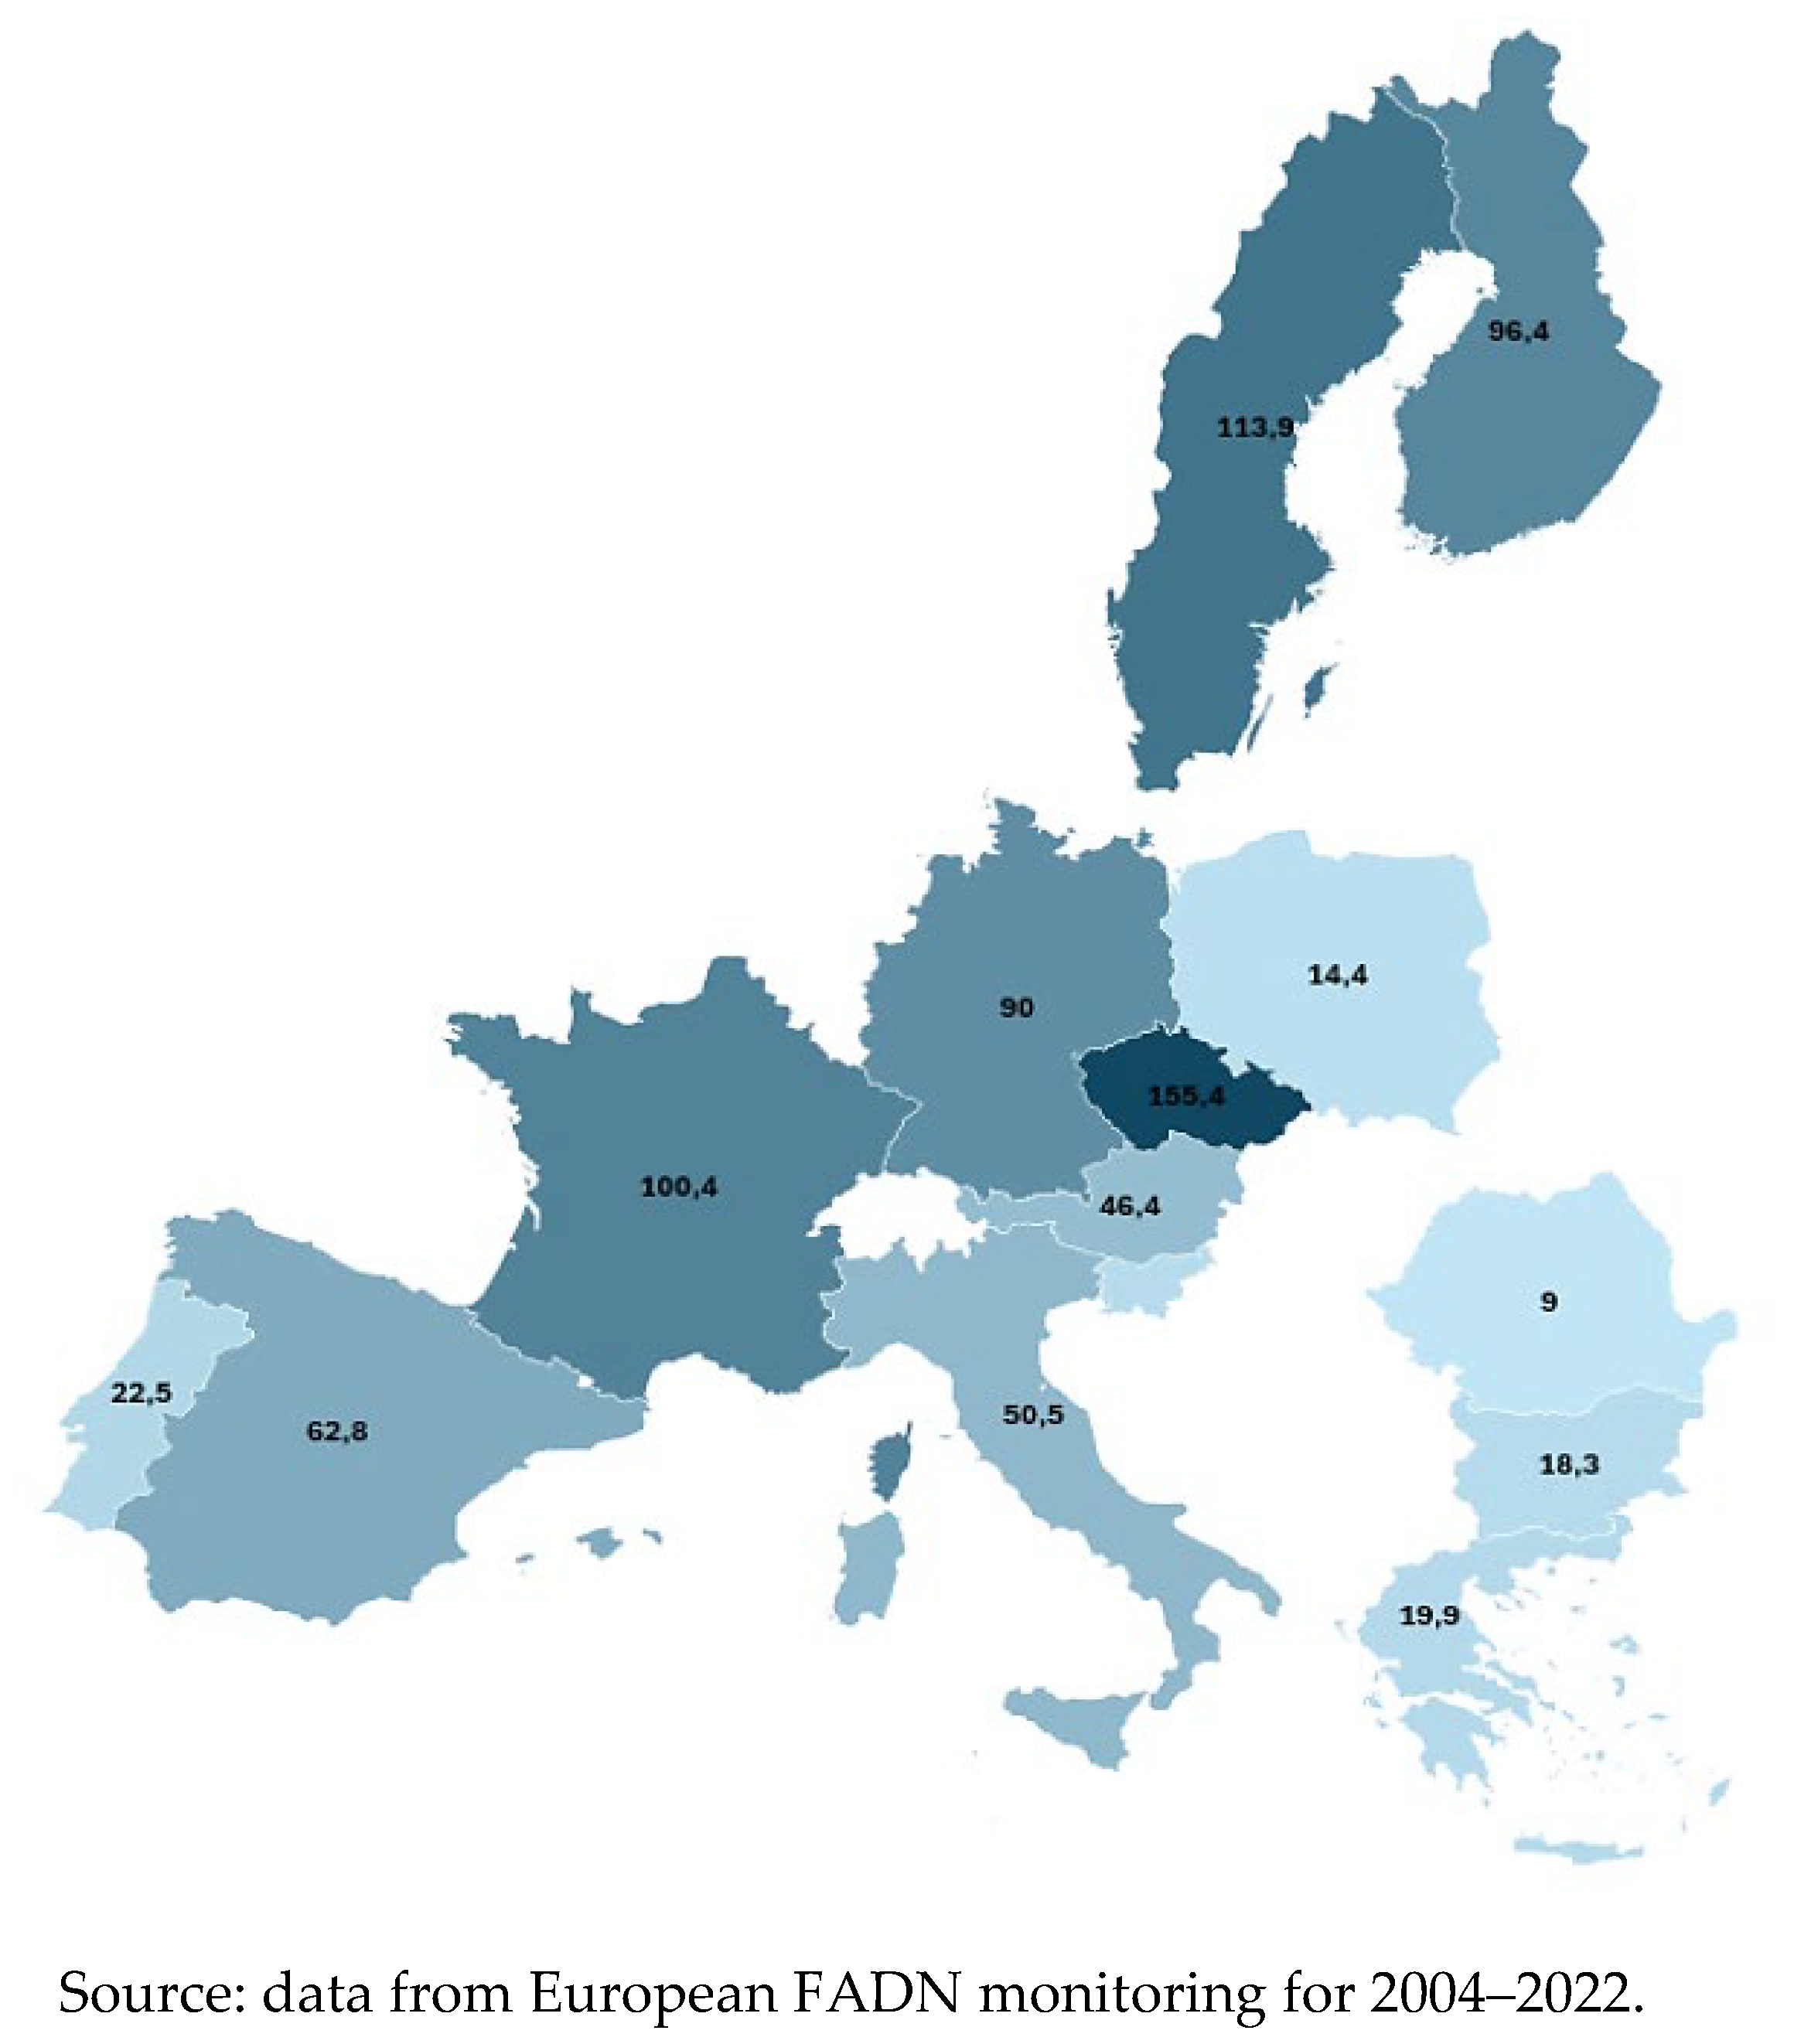
Figure 15.
Share of cereals in arable land (%) and livestock density (LU1/100 ha UAA) in commercial farms in mountain areas of selected EU countries (average for 2004–2022).
Figure 15.
Share of cereals in arable land (%) and livestock density (LU1/100 ha UAA) in commercial farms in mountain areas of selected EU countries (average for 2004–2022).
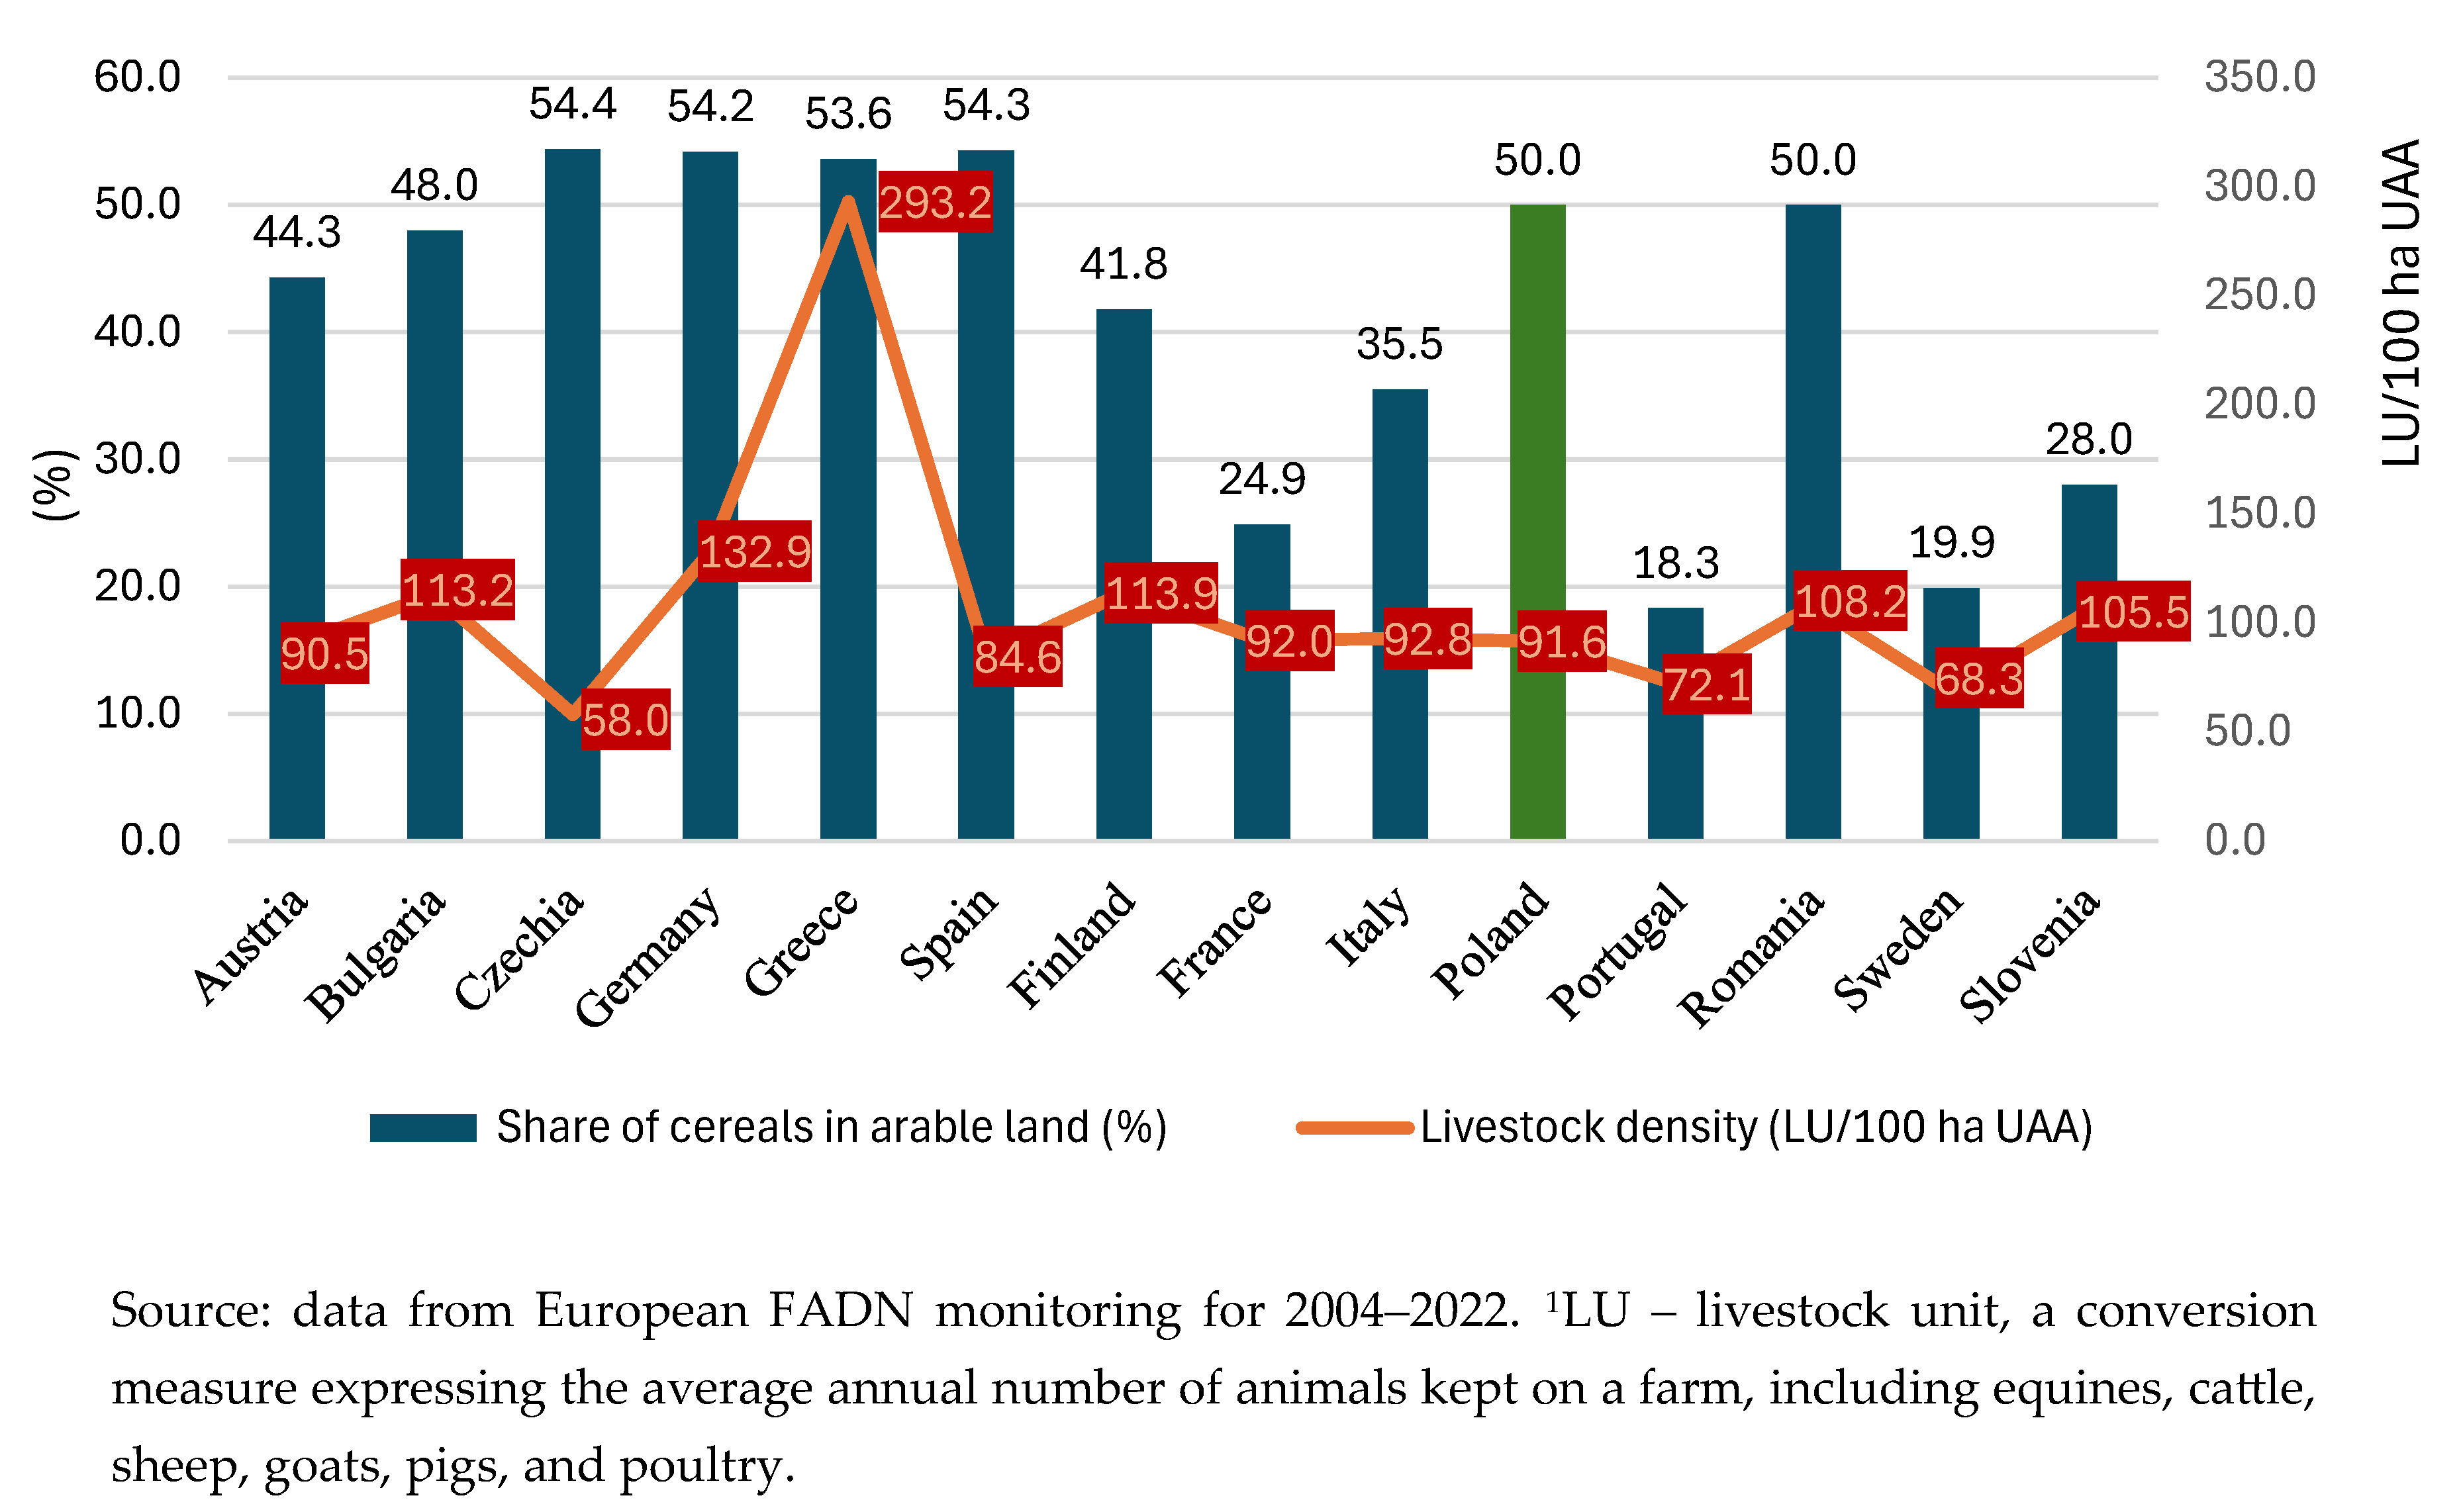
Figure 16.
Land and labour productivity indicators in farms in mountain areas of selected the EU Member States (average for 2004–2022).
Figure 16.
Land and labour productivity indicators in farms in mountain areas of selected the EU Member States (average for 2004–2022).
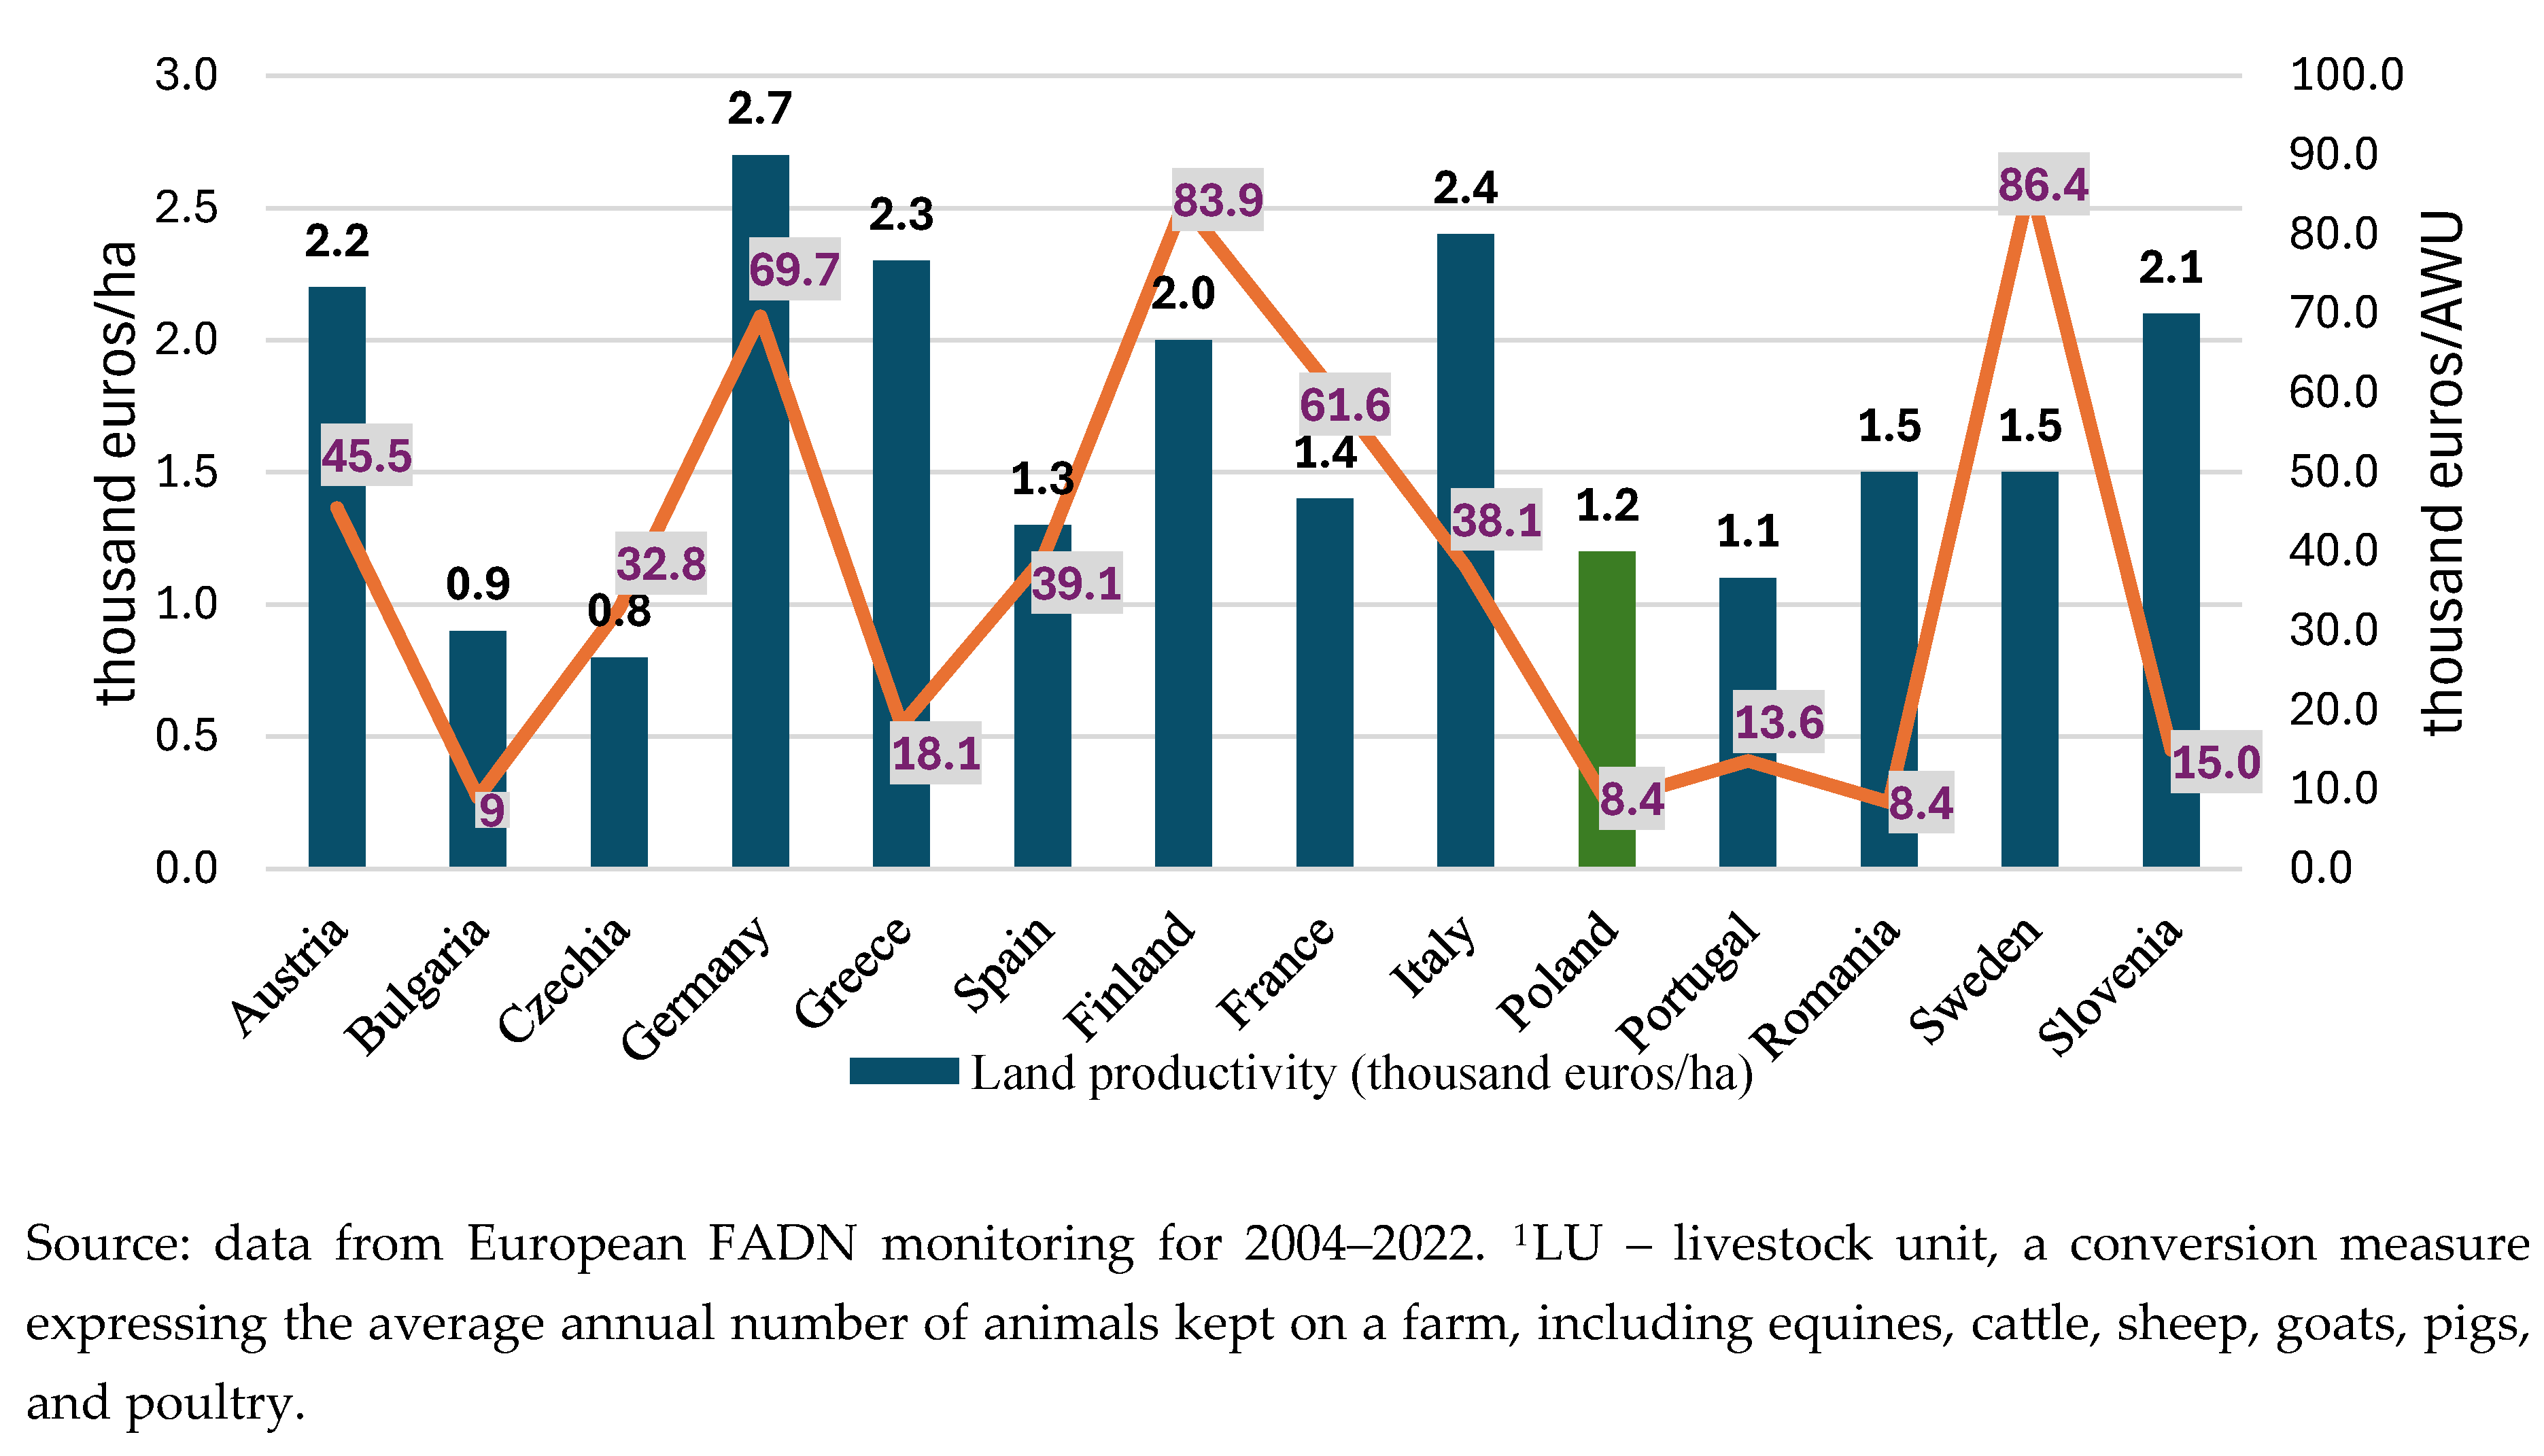
Figure 17.
Area (1) and share (2) of agricultural land in mountain areas in the total utilised agricultural area at the municipal level in Poland in 2023.
Figure 17.
Area (1) and share (2) of agricultural land in mountain areas in the total utilised agricultural area at the municipal level in Poland in 2023.
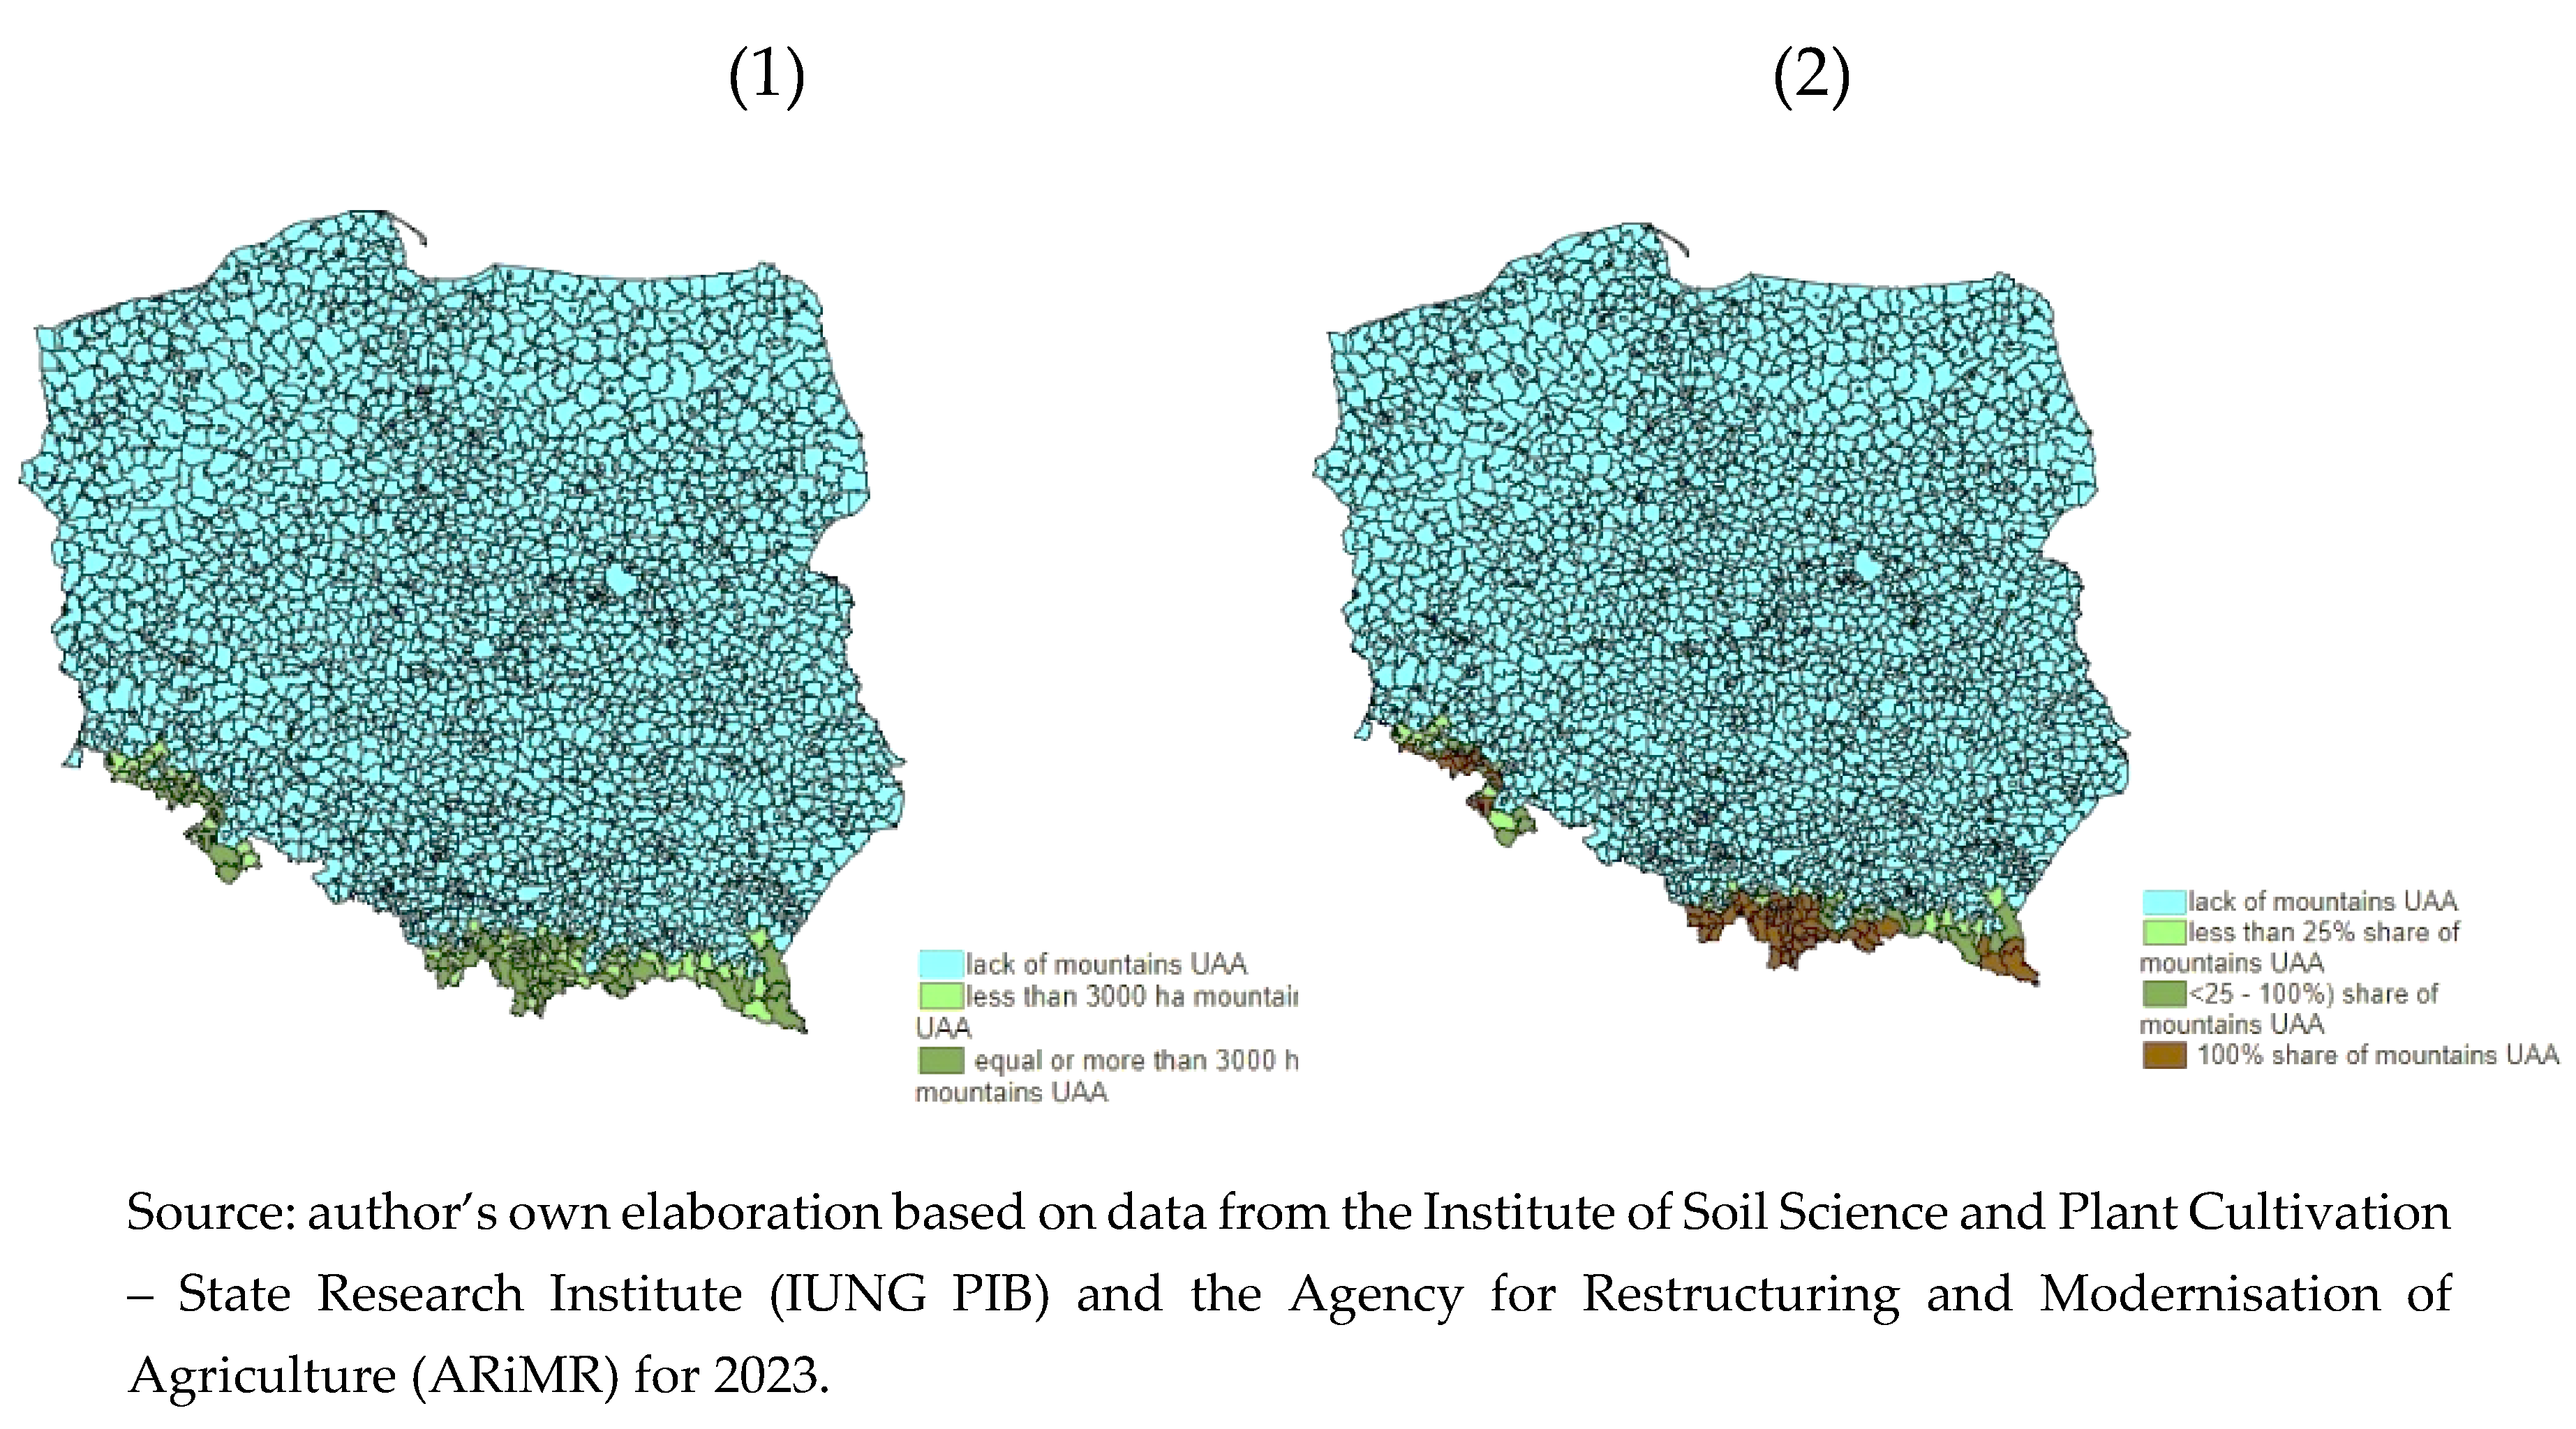
Figure 18.
Share of farms implementing eco-schemes (1), organic farming interventions (2), and agri-environment-climate interventions (3) in the total number of farms at the municipal level in Poland in 2023.
Figure 18.
Share of farms implementing eco-schemes (1), organic farming interventions (2), and agri-environment-climate interventions (3) in the total number of farms at the municipal level in Poland in 2023.
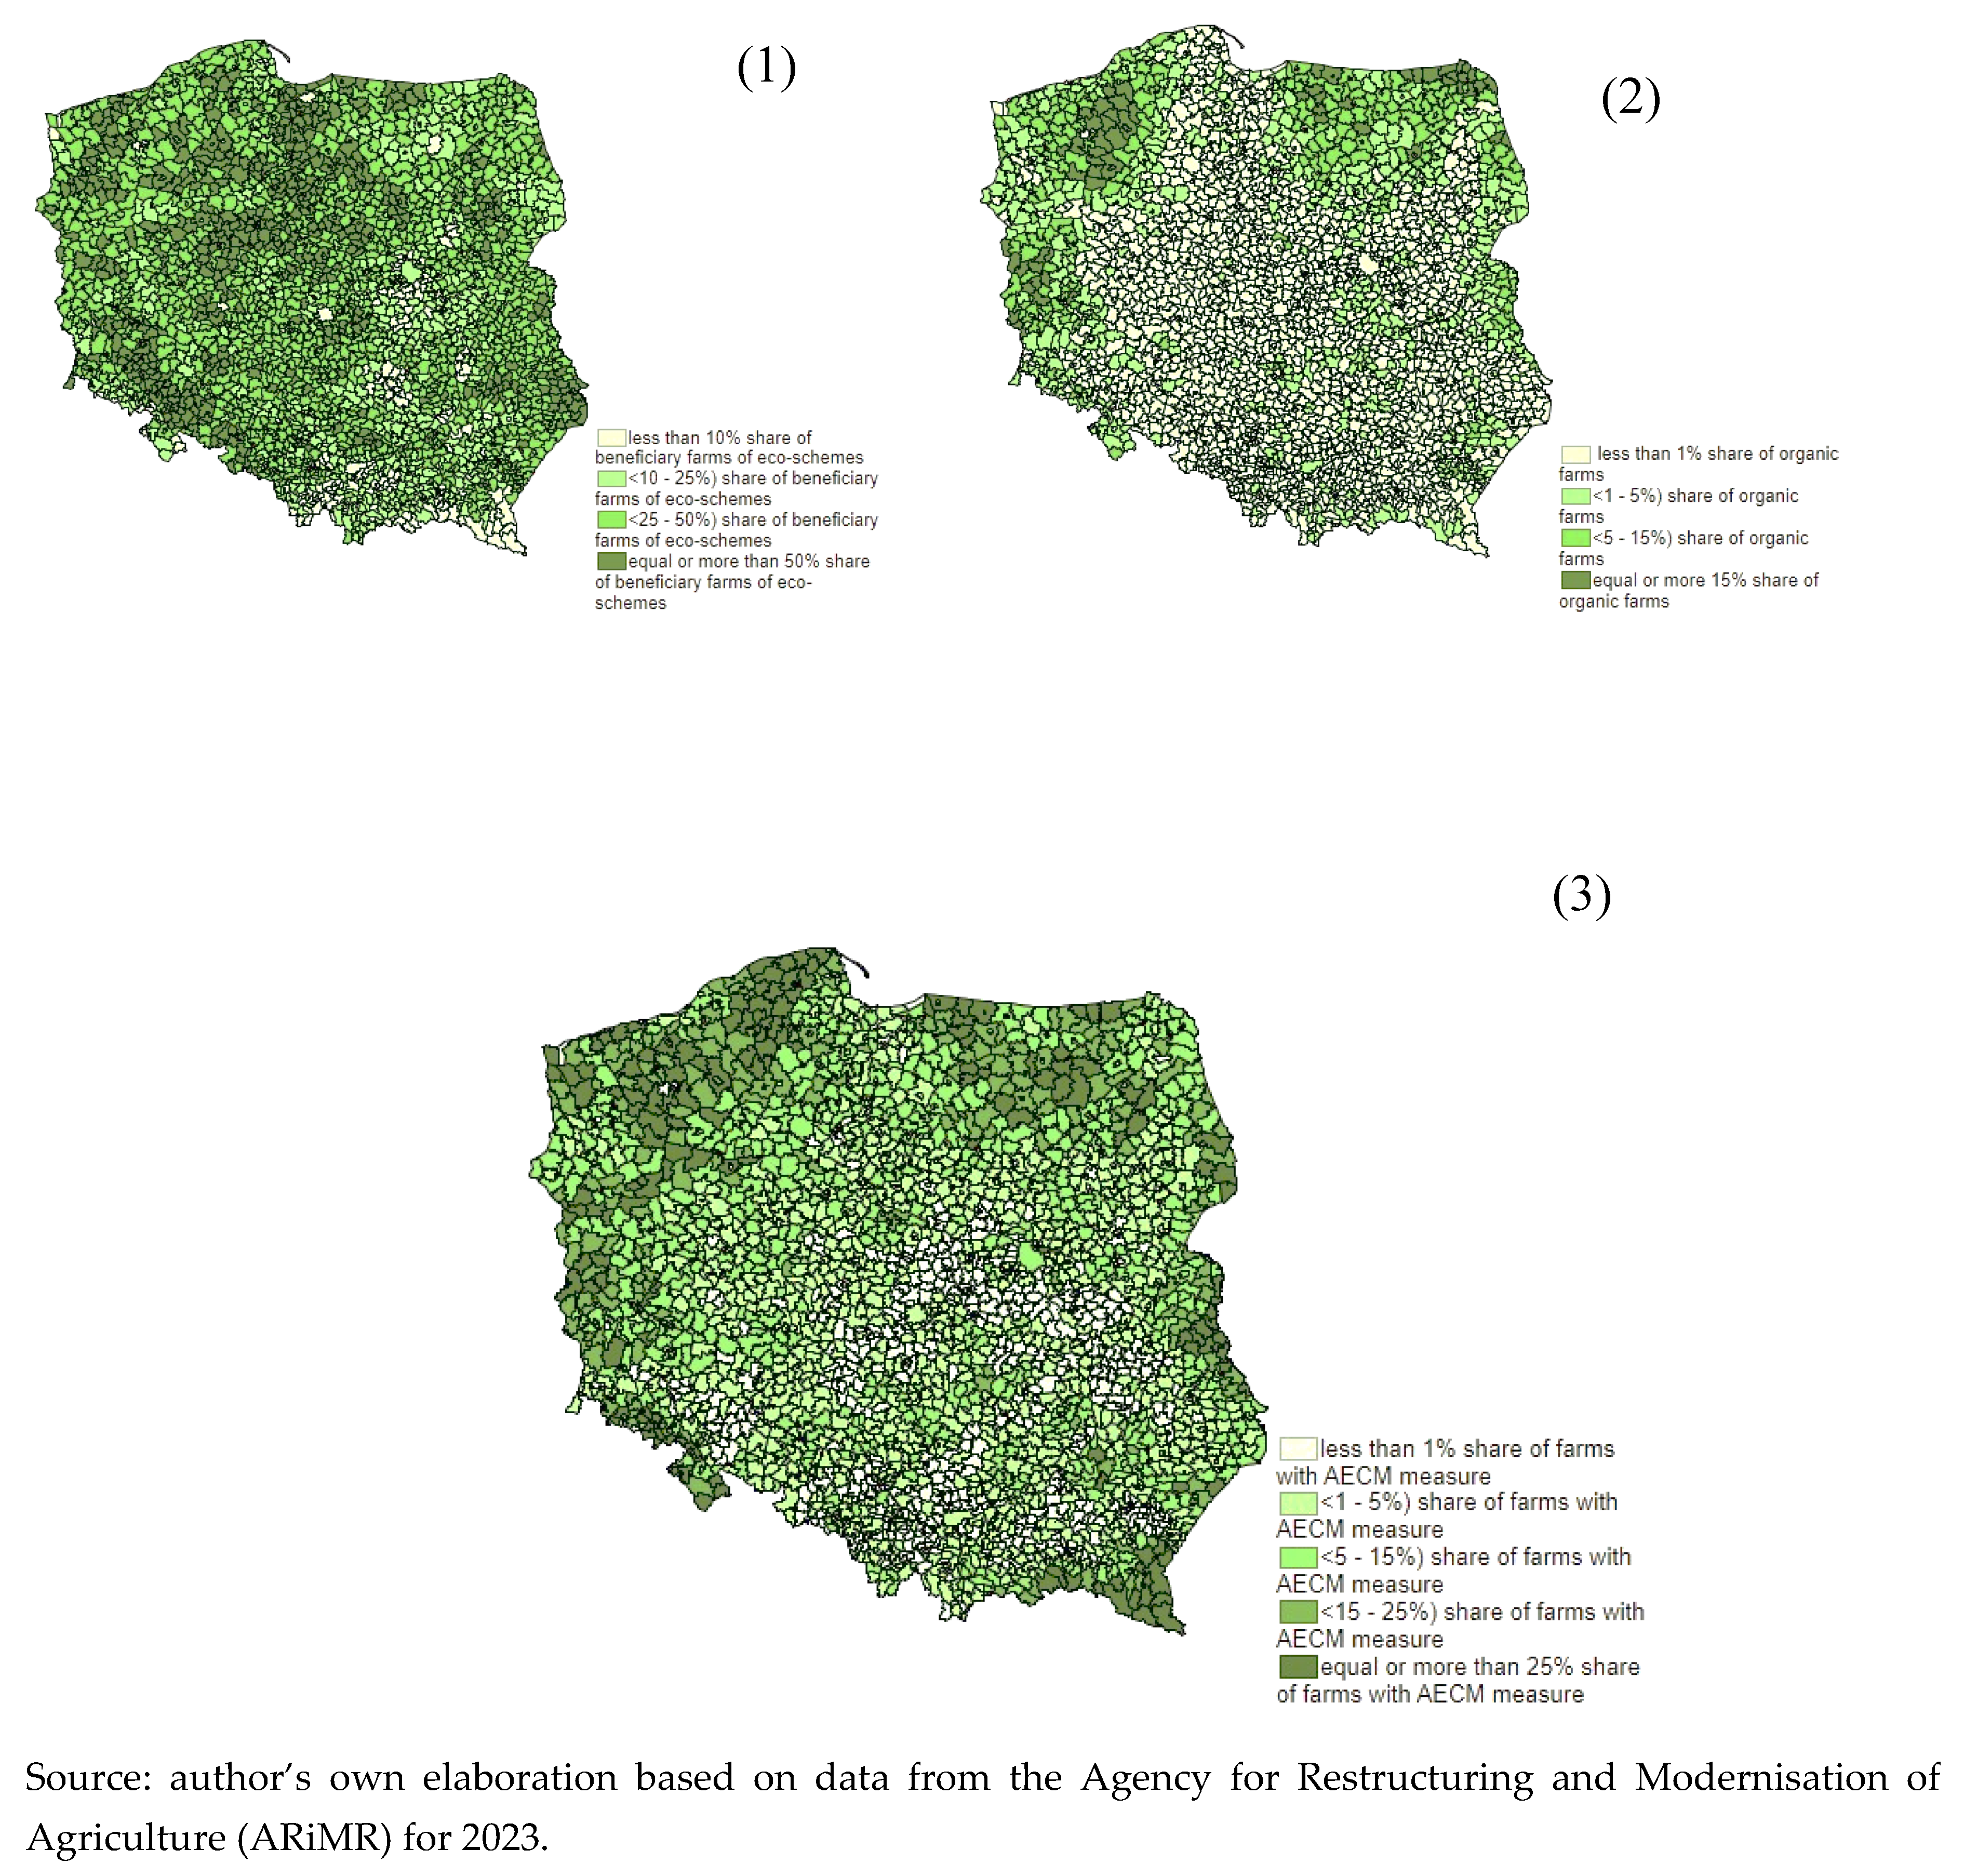

Table 1.
List of selected dependent variables.
| variable | definition of the variable in terms of data source | volatility range | data source | |||
|---|---|---|---|---|---|---|
| 5th percentile | Median | 95th percentile | ||||
| pCropl | Percentage of cropland area in total area of mountainous region (%) for the year 2000. pCropl = 100 · (exp(αc) / total area); where: ln(Cropland area) = αc + βc · (year – 2000). |
Cropland area = “Cropland, rainfed” area * (3/3) + “Cropland, irrigated or post-flooding” area * (3/3) + “Mosaic cropland (>50%) / natural vegetation (tree, shrub, herbaceous cover)(<50%)” area * (2/3) + “Mosaic natural vegetation (tree, shrub, herbaceous cover) (>50%) / cropland (<50%)” area * (1/3). |
0.1 | 8.2 | 35.1 | ESA CCI Land Cover [8,10] |
| crpCropl | Change rate of percentage cropland area in total area of mountainous region (% year-1) for the years 2000-2022. crpCropl = 100 · βc; where: ln(Cropland area) = αc + βc · (year – 2000). |
-1.09 | -0.15 | 0.75 | ||
| pGrassl | Percentage of grassland area in total area of mountainous region (%) for the year 2000. pGrassl = 100 · (exp(αg) / total area); where: ln(Grassland area) = αg + βg · (year – 2000). |
Grassland area = “Grassland” area * (3/3) + “Mosaic herbaceous cover (>50%) / tree and shrub (<50%)” area * (2/3) + “Mosaic tree and shrub (>50%) / herbaceous cover (<50%)” area * (1/3). |
0.5 | 10.2 | 40.3 | |
| crpGrassl | Change rate of percentage grassland area in total area of mountainous region (% year-1) for the years 2000-2022. crpGrassl = 100 · βg; where: ln(Grassland area) = αg + βg · (year – 2000). |
-0.15 | 0.15 | 1.08 | ||
| pUrban | Percentage of urban area in total area of mountainous region (%) for the year 2000. pUrban = 100 · (exp(αu) / total area); where: ln(Urban area) = αu + βu · (year – 2000). |
Urban area = “Urban areas” area * (3/3). |
0.0 | 0.3 | 4.6 | |
| crpUrban | Change rate of percentage urban area in total area of mountainous region (% year-1) for the years 2000-2022. crpUrban = 100 · βu; where: ln(Urban area) = αu + βu · (year – 2000). |
0.00 | 2.23 | 7.49 | ||
Source: author’s own research.
Table 2.
List of selected explanatory variables.
| variable | definition of the variable in terms of data source | volatility range | data source | ||
|---|---|---|---|---|---|
| 5th percentile | Median | 95th percentile | |||
| SLP | Slope of terrain surface in degrees (°). Calculated in GEE by ‘ee.Terrain.slope’ from MERIT DEM. |
7.2 | 10.9 | 20.5 | MERIT DEM [69] |
| AI | Aridity Index which is a ratio of mean annual precipitation to mean annual potential evapotranspiration (-). | 0.3 | 0.8 | 1.9 | Global Aridity Index [73] |
| TEMP | Mean annual temperature of air (°C). | 3.3 | 9.0 | 15.5 | WorldClim BIO [29] |
| pGDPpc | Gross Domestic Product per capita of mountainous region as a percentage of EU average (%) for the year 2000. pGDPpc = exp(αgdp) / (GDPpc of EU in 2000); where: ln(GDPpc) = αgdp + βgdp · (year – 2000). |
7.6 | 77.4 | 197.0 | Gross domestic product [21] |
| crGDPpc | Change rate of GDPpc of mountainous region (% year-1) for the years 2000-2022. crGDPpc = 100 · βgdp; where: ln(GDPpc) = αgdp + βgdp · (year – 2000). |
0.3 | 2.6 | 7.7 | |
| POPd | Population density of mountainous region (person km-2) for the year 2000. POPd = exp(αpop) / total area; where: ln(Population) = αpop + βpop · (year – 2000). |
17 | 83 | 451 | Average annual population [21] |
| crPOPd | Change rate of population density of mountainous region (% year-1) for the years 2000-2022. crpPOPd = 100 · βpop; where: ln(Population) = αpop + βpop · (year – 2000). |
-1.40 | 0.13 | 1.40 | |
| CPOP | Population of country of mountainous region (mln person). | 2.1 | 48.6 | 85.5 | EU official website [14] |
| EUy | Years as member of EU until 2023 (year). | 0 | 37 | 65 | |
Source: author’s own research.
Table 3.
RF model errors estimated in cross-validation tests.
| model error measure | pCropl | pGrassl | pUrban | crpCropl | crpGrassl | crpUrban |
| RMSEcv | 7.72 | 9.74 | 2.74 | 1.03 | 0.79 | 2.05 |
| MAEcv | 5.11 | 6.96 | 0.93 | 0.43 | 0.32 | 1.33 |
| R2cv | 0.59 | 0.50 | 0.36 | -0.17 | -0.08 | 0.40 |
Source: author’s own elaboration.
Table 4.
Production potential of farms in mountain areas in selected the EU Member States (average for 2004–2022).
Table 4.
Production potential of farms in mountain areas in selected the EU Member States (average for 2004–2022).
| Country | Utilised agricultural area (ha) | Total labour input (AWU/farm) | Average capital value (thousand euros/farm) |
|---|---|---|---|
| Austriaa | 29.9 | 1.57 | 351.4 |
| Bulgariab | 21.9 | 2.14 | 44.5 |
| Czechia | 207.7 | 5.22 | 489.7 |
| Germanyb | 37.9 | 1.5 | 228 |
| Greece | 9.7 | 1.24 | 55.5 |
| Spain | 46.5 | 1.49 | 162.2 |
| Finland | 59.3 | 1.43 | 309.9 |
| France | 75.9 | 1.76 | 291 |
| Italy | 19.5 | 1.24 | 129.3 |
| Poland | 11.2 | 1.65 | 51.2 |
| Portugal | 19.1 | 1.53 | 49.2 |
| Romaniab | 7.8 | 1.38 | 29.7 |
| Sweden | 85.6 | 1.48 | 379 |
| Slovenia | 10.5 | 1.49 | 105.7 |
ᵃ European FADN data cover the years 2004–2021. ᵇ European FADN data cover the years 2007–2022. Source: European FADN monitoring data for 2004–2022.
Table 5.
Farm income and profitability of labour and land in farms located in mountain areas of selected EU countries (average for 2004–2022).
Table 5.
Farm income and profitability of labour and land in farms located in mountain areas of selected EU countries (average for 2004–2022).
| Country | Farm income (thousand euros/farm) | Farm income per family work unit (thousand euros/FWU) |
|---|---|---|
| Austria | 24.5 | 16.2 |
| Bulgaria | 9.0 | 6.6 |
| Czechia | 36.1 | 27.4 |
| Germany | 34.5 | 24.5 |
| Greece | 13.2 | 12.5 |
| Spain | 27.3 | 23.9 |
| Finland | 26.1 | 22.7 |
| France | 26.6 | 18.3 |
| Italy | 23.7 | 24 |
| Poland | 6.4 | 4.2 |
| Portugal | 11.6 | 9.2 |
| Romania | 4.9 | 4.1 |
| Sweden | 19.4 | 15.9 |
| Slovenia | 6.3 | 4.3 |
Source: data from European FADN monitoring for 2004–2022.
Table 6.
Number and share of beneficiary farms under environmental measures in municipalities with varying levels of mountain agricultural land in Poland in 2023.
Table 6.
Number and share of beneficiary farms under environmental measures in municipalities with varying levels of mountain agricultural land in Poland in 2023.
| Municipalities with share of agricultural land in mountain areas: | Total number of farms (thousand) |
% of farms under eco-schemes | % of farms under organic farming | % of farms under agri-environment-climate interventions |
| 100% | 23.6 | 15.2 | 1.0 | 10.2 |
| <25-100%) | 9.8 | 11.9 | 1.4 | 23.7 |
| below 25% | 13.0 | 16.7 | 0.9 | 15.3 |
| other | 1,187.9 | 35.5 | 1.6 | 5.8 |
Source: author’s own elaboration based on data from the Agency for Restructuring and Modernisation of Agriculture (ARiMR) for 2023.
Table 7.
Area and share of utilised agricultural land (UAA) of beneficiary farms under environmental measures in municipalities with varying levels of mountain agricultural land in Poland in 2023.
Table 7.
Area and share of utilised agricultural land (UAA) of beneficiary farms under environmental measures in municipalities with varying levels of mountain agricultural land in Poland in 2023.
| Municipalities with share of agricultural land in mountain areas: | Total UAA (thousand ha) | % of UAA in farms under eco-schemes | % of UAA under organic farming | % of UAA under agri-environment-climate interventions |
| 100% | 120.5 | 17.9 | 3.8 | 20.2 |
| <25-100%) | 64.2 | 12.4 | 6.0 | 37.9 |
| below 25% | 89.8 | 34.0 | 3.3 | 20.7 |
| other | 13,820.5 | 61.1 | 3.2 | 7.7 |
Source: author’s own elaboration based on data from the Agency for Restructuring and Modernisation of Agriculture (ARiMR) for 2023.
Disclaimer/Publisher’s Note: The statements, opinions and data contained in all publications are solely those of the individual author(s) and contributor(s) and not of MDPI and/or the editor(s). MDPI and/or the editor(s) disclaim responsibility for any injury to people or property resulting from any ideas, methods, instructions or products referred to in the content. |
© 2025 by the authors. Licensee MDPI, Basel, Switzerland. This article is an open access article distributed under the terms and conditions of the Creative Commons Attribution (CC BY) license (http://creativecommons.org/licenses/by/4.0/).
Copyright: This open access article is published under a Creative Commons CC BY 4.0 license, which permit the free download, distribution, and reuse, provided that the author and preprint are cited in any reuse.


