Submitted:
13 November 2025
Posted:
14 November 2025
You are already at the latest version
Abstract
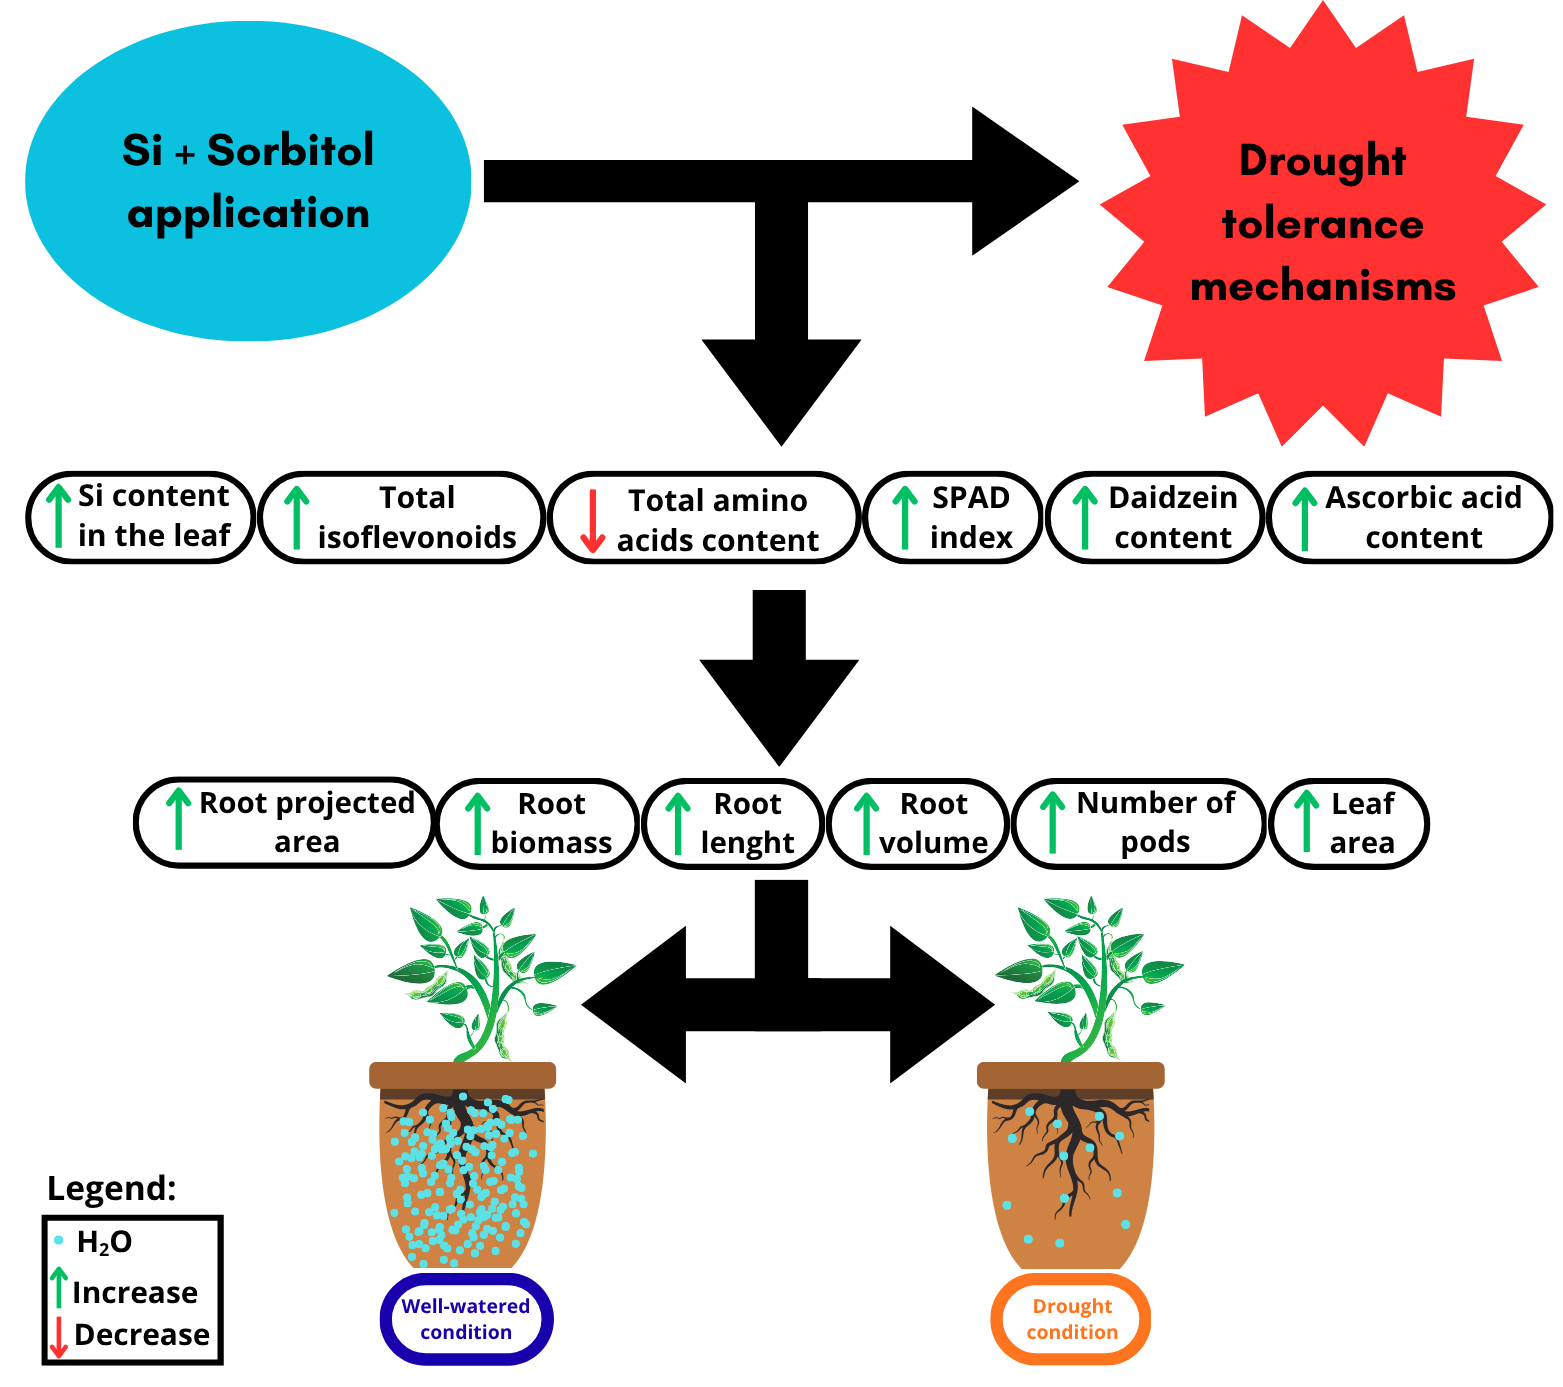
Silicon (Si) plays a pivotal role in modulating plant physiological responses, particu-larly by influencing non-enzymatic antioxidant systems and amino acid metabolism. The objective of this study is to evaluate soybean performance in response to soil and foliar Si applications under both well-watered and drought conditions, aiming to en-hance Si accumulation in plant tissues and potentially amplify the crop’s physiological responses under water deficit stress. This is particularly relevant given that the mech-anisms underlying Si fertilization and its role in soybean stress tolerance remain insuf-ficiently explored. A greenhouse experiment was conducted using a 3×2 factorial de-sign. The factors were: i) three foliar Si treatments: a control (no Si), potassium silicate (SiK; 128 g L⁻¹ Si, 126.5 g L⁻¹ K₂O, pH 12.0), and sorbitol-stabilized potassium silicate (SiKe; 107 g L⁻¹ Si, 28.4 g L⁻¹ K₂O, 100 mL L⁻¹ sorbitol, pH 11.8); and ii) two soil water levels: water-restricted and well-watered, 40% and 80% of field capacity, respectively. The drought condition simulated tropical dry spells. Si was applied to the soil via irri-gation and to the leaves via foliar sprays prior to water restriction. All Si solutions were adjusted to pH 7.0 with 1M HCl immediately before use. Potassium (K) levels were balanced across all treatments using soil and foliar applications of KCl. Biometric and physiological attributes were measured. Sorbitol-stabilized silicon increased Si accumulation in soybean tissues and enhanced plant resilience under both well-watered and drought conditions by improving key physiological traits, such as elevated daidzein and ascorbic acid levels, along with reduced amino acid concentra-tions, as well as biometric parameters, including leaf area, root development, and number of pods per plant. These findings reinforce the role of Si as a beneficial element in promoting stress tolerance and advancing sustainable agricultural practices.
Keywords:
Glycine max
; water deficit
; foliar application
; flavonoids
; Si
1. Introduction
Climate change escalates the frequence and intensity of climate extreme events. Extensive heat waves and droughts periods, as well as excessive rainfall that results in floods, mudslide and erosion [1], are becoming increasingly recurrent, especially in tropical and subtropical environments, such as Brazil, one of the main agricultural suppliers worldwide [2]. Therefore, to seek practices that enhances plant's resilience to extreme weather events is crucial for economic-environmental sustainability and food security.
Soybean (Glycine max (L.) Merrill) is the fourth most cultivated crop worldwide and Brazil’s leading crop, where it covered 46 million hectares in the 2024/2025 season [3]. Its broad distribution, particularly across diverse Brazilian regions, exposes it to variable climate conditions, notably drought. Climate change is expected to intensify these challenges by concentrating rainfall and prolonging dry spells, underscoring the need for strategies to enhance crop resilience and safeguard food security [4]. An analysis of soybean production data in Brazil from 1970 to 2023 revealed that during years characterized by prolonged drought periods, yield losses reached up to 30% in the territory [5].
Silicon (Si) is the second most abundant element (~28%) in the earth crust [6], is reportedly shown as a beneficial element with potential to increase yield in several crops [7,8,9]. Si application has been also reported to ameliorate biotic stress, such as pests and diseases, and abiotic stress, such as shading, drought, radiation, high and low temperature, salinity, toxic elements and disbalance nutrition [10,11,12]. In soybean, an increase in the resilience over drought stress by the production of chlorophyll content and lignin in the steam was observed, allowing a higher stomatal conductance and steam stability, ultimately increasing the seed’s protein and oil yields. Likewise, Si application via nutrient solution was reported to ameliorate the drought stress in tomato (Solanum lycopersicum L.) [13], sorghum (Sorghum bicolor) [9] and soybean [14]. However, the beneficial effects of Si depend on the absorption by plants, growth stage and Si availability in the soil [15,16]. Drought stress occurs when plant’s water transpiration to the atmosphere is greater than the amount of water that their roots can absorb from the soil [17,18]. The lack of water decreases the cell division rate, cell elongation and differentiation, impairs the leaves thermal regulation, increases the damage on the cell membrane, leading to the production of reactive oxygen species (ROS) and reactive nitrogen species (RSN). The lack of water can degrade chlorophyll pigments, decrease photosynthesis, the production of metabolites and finally the potential yield [11,19].
ROS is either produced by redox reactions or by the own metabolism in different cell organelles, e.g., mitochondria, peroxisomes, endoplasmic reticulum, cell wall and apoplast [20]. Under normal conditions, cells maintain a balance between ROS production and scavenging, but abiotic or biotic stress disrupts this equilibrium, leading to excessive ROS accumulation and oxidative damage. Chloroplast, photosystem I, photosystem II and electron transport chain are producers of ROS, e.g., 1O2 and O2-. There is also formation of ROS by the reduction of oxygen (O2) to hydrogen peroxide (H2O2) in the complexes I and III from mitochondria by electron transport [21].
The Si can regulate the cell wall, membrane integrity, the metabolism of carbohydrates and accumulation of proline [22]. The proline decreases the toxic effect of ROS [10], and stabilize signal proteins responsible for hydric stress tolerance, as kinases and transcription factors [10]. In common bean (Phaseolus vulgaris), Si has been reported to increase osmolyte and metabolite accumulation, enhancing cell turgor and water uptake [23]. Si enhances polyamine and 1-aminocyclochloropane-1-carboxylic acid expression, stimulates root development, and increases the surface area for water absorption [13].
Furthermore, by the analysis of genes expressions, the application of Si shown to upregulate the expression of enzymes responsible for lignin accumulation in the steam and as result decrease the chance of lodging. Smaller leaf area and greater thickness were reported after foliar Si application, without affecting chlorophyl accumulation under either full light or shading [12]. In soybean under water deficit and UV-B radiation exposed, Si application (1.7 mM) increased stomatal conductance, reduced anthocyanin and phenolic compound accumulation, enhanced antioxidant enzyme activity, and promoted growth [14].
The benefits of Si to soybean have been reported by the polymerization of Si under the epidermis, that limits the excessive transpiration by plant [22,24,25,26]. Si supplementation can alleviate saline stress in soybean by increasing the production of non-enzymatic antioxidants such as phenolics and ascorbic acid [27]. Leaf Si absorption can be enhanced by combining it with sorbitol, which lowers the solution’s deliquescence point, reduces droplet evaporation, and favors uptake [24]. This improves spray stability and, when combined with Si, can enhance the absorption in soybean, maize and cotton [24].
The principal question to be answered is how Si stabilized solution with sorbitol could affect different physiological and biometric components of soybean under well-watered and drought conditions.
Although several studies have been demonstrating the benefits of Si in enhancing plant tolerance to abiotic stress, the underlying physiological and metabolic mechanisms, particularly in soybean, should be more explored. In this context, the objective of this study is to evaluate how increased Si content in plant tissue, associated with sorbitol-stabilized formulation could affect physiological, biochemical, and biometric traits in soybean, under both well-watered and drought conditions.
2. Results
2.1. Experiment I
For the SPAD index, the treatment potassium silicate stabilized with sorbitol (SiKe), regardless of water conditions, exhibited higher values, 6.8% and 15.5%, greater than potassium silicate (SiK) and the control (with no Si application), respectively (Figure 1A). Additionally, well-watered plants showed a 10.2% higher SPAD index compared with drought conditions. Leaf area (Figure 1B) showed the highest response under the SiKe treatment, with increases of 9.6% and 20.3% compared with SiK and the control, respectively, regardless of water conditions. Stem diameter (Figure 1C) did not differ among the Si treatments however, drought stress reduced stem diameter by 21% compared with well-watered plants. The leaf temperature (Figure 1D) did not differ among the Si factor; however, it increased 14.6% in drought conditions compared to well-watered.
The number of pods per plant (Figure 2A) did not differ among the Si treatments under drought conditions. However, under well-watered conditions, pod number increased by 8.0% and 23.1% compared with the control with SiK and SiKe, respectively. The number of grains per plant (Figure 2B) also presented no differences among the Si treatments. Nevertheless, well-watered plants produced 45.8% more grains per plant than drought-stressed plants. For thousand-grain weight (Figure 2C), no differences were observed among the Si treatments; however, well-watered conditions resulted in a 14.4% increase compared with drought. Grain protein content (Figure 2D) presented no differences among treatments.
2.2. Experiment II
In Figure 3A, the effects of Si treatments and water availability on the root structure and development of soybean plants can be observed. The images were collected during the analysis of root attributes. Root length presented an interaction between Si and water availability (Figure 3B). Under drought stress, root length increased by 52.6% and 35.3% in SiKe compared with SiK and the control, respectively. Under well-watered conditions, all Si treatments differed, with SiKe showing the greatest effect, increasing 26.6% and 10.7% more than SiK and control, respectively.
Root volume also differed between Si treatments and water availability (Figure 3C). SiKe increased root volume by 44.4% and 38.1% compared with SiK and the control, regardless of water availability. In addition, well-watered conditions increased root volume by 42.3% compared with drought conditions.
For root projection area, an interaction was detected between Si and water availability (Figure 3D). Under drought conditions, root projection area increased 96.3% and 70.9% by SiKe compared with SiK and the control, respectively. However, under well-watered conditions, no differences were observed.
Root biomass increased 44.4% and 38.1% with SiKe compared with SiK and the control (Figure 3E). Regarding water availability, well-watered conditions increased root biomass by 45.2% compared with drought.
Leaves Si content with SiKe was 24.2% and 74.7% greater than SiK and the control, respectively (Figure 4A). Under well-watered conditions, the Si content in leaves was 69.7% higher compared to drought-stressed plants. The SPAD index did not differ among either Si treatments or water conditions (Figure 4B). Similarly, leaf area presented no difference by Si or water condition (Figure 4C), maybe because was quantified in R3 of the phenological stage.
Leaf water content had no difference by Si treatments but was affected by water condition (Figure 4D), where well-watered plants presented a 31.1% higher water content compared with drought-stressed plants. Electrolyte leakage (Figure 4E) was also unaffected by Si treatments, but increased by 21.6% under drought compared with well-watered conditions. Chlorophyll content (Figure 4F) did not differ between Si treatments or water availability, and the same trend was observed for carotenoid content (Figure 4G).
Proline content in control was 326% higher than SiK, but did not differ from SiKe. Water conditions did not affect proline levels (Figure 5A). Ascorbic acid content presented an interaction between Si treatments and water condition (Figure 5B). Under drought, ascorbic acid with SiKe was 110% and 24% higher than SiK and the control, respectively. Under well-watered conditions, Si treatments also differed, with ascorbic acid content with SiKe 100% and 132% greater than SiK and the control, respectively.
Total pheophytin content did not differ among Si treatments or water conditions (Figure 5C). For total isoflavonoids, an interaction was observed between Si and water availability (Figure 5D). Under drought, both SiKe and SiK increased isoflavonoid content by 58.2% and 55.0%, respectively, compared with the control. Under well-watered conditions, SiK showed the highest response, with isoflavonoid content increases of 59.3% and 191% compared with the control and SiKe, respectively.
For Daidzein content, only the Si factor showed an effect (Figure 6A). The SiKe treatment presented an increase of 677% compared to SiK and 226% compared to the Control. No differences were observed for the water condition. For Daidzin, Genistein, and Genistin, no responses were detected for either the Si factor or the water condition (Figure 6BCD).
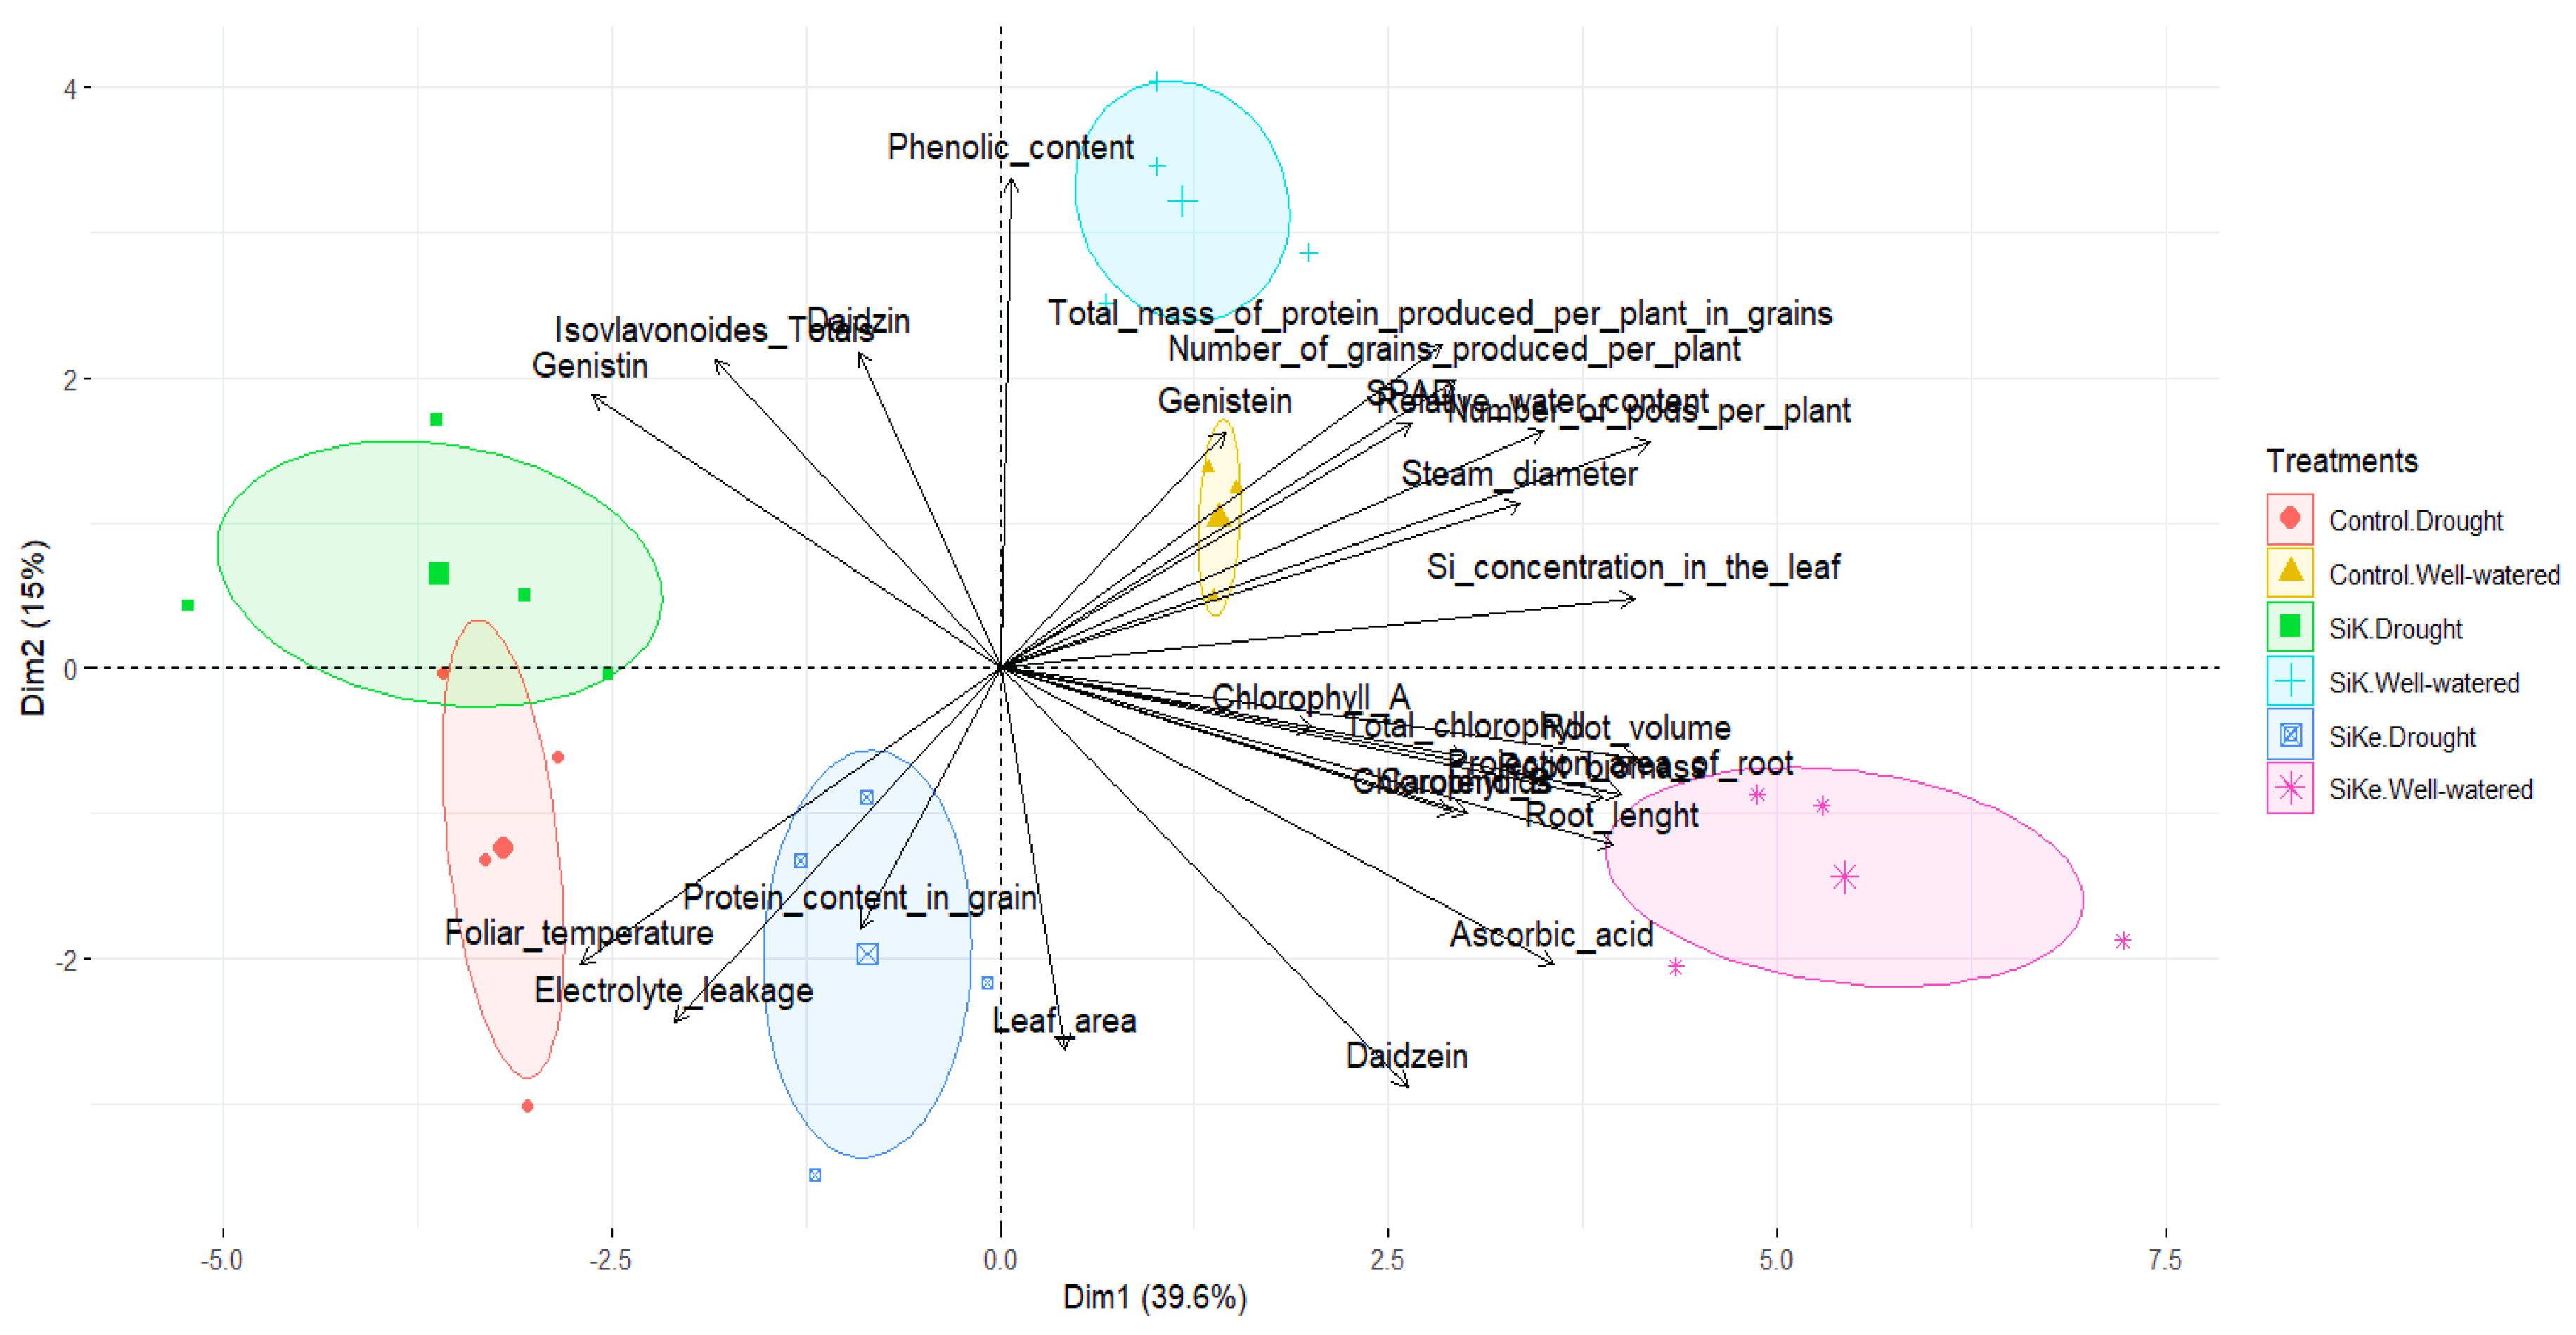
2.3. Principal Components Analysis (PCA)
Using the data of the Experiment I and II, the first two principal components (Dim1 and Dim2) explain 39.6% and 15% of the total variance, respectively, indicating that these dimensions capture a portion of the dataset's structure. The PCA revealed a strong distinction between treatments, with well-watered plants clustering on the right side and drought-stressed plants on the left. Notably, stress-related variables, such as foliar temperature, electrolyte leakage, genistin, total isoflavonoids, and daidzin, were closely associated with drought treatments, reinforcing their potential as reliable stress indicators.
The SiKe and well-watered treatment exhibited a pronounced association with root biometric traits, chlorophyll content, ascorbic acid, and daidzein, suggesting that stabilized Si with sorbitol affect root development and physiological parameters, thereby increasing plant resilience. Additionally, variables such as Si concentration in leaves, total protein mass produced per plant in grains, SPAD values, number of pods per plant, genistein content, and stem diameter showed an intermediate trend between the SiK and SiKe treatments. These findings suggest that Si, particularly in its stabilized form, may enhance physiological resilience even under non-stress conditions, potentially improving overall soybean performance.
Figure 7.
Principal Component Analysis (PCA) of all variables presented as graphs in this article, showing the distribution of factors according to PC1 and PC2. The analysis was performed in RStudio environment.
Figure 7.
Principal Component Analysis (PCA) of all variables presented as graphs in this article, showing the distribution of factors according to PC1 and PC2. The analysis was performed in RStudio environment.
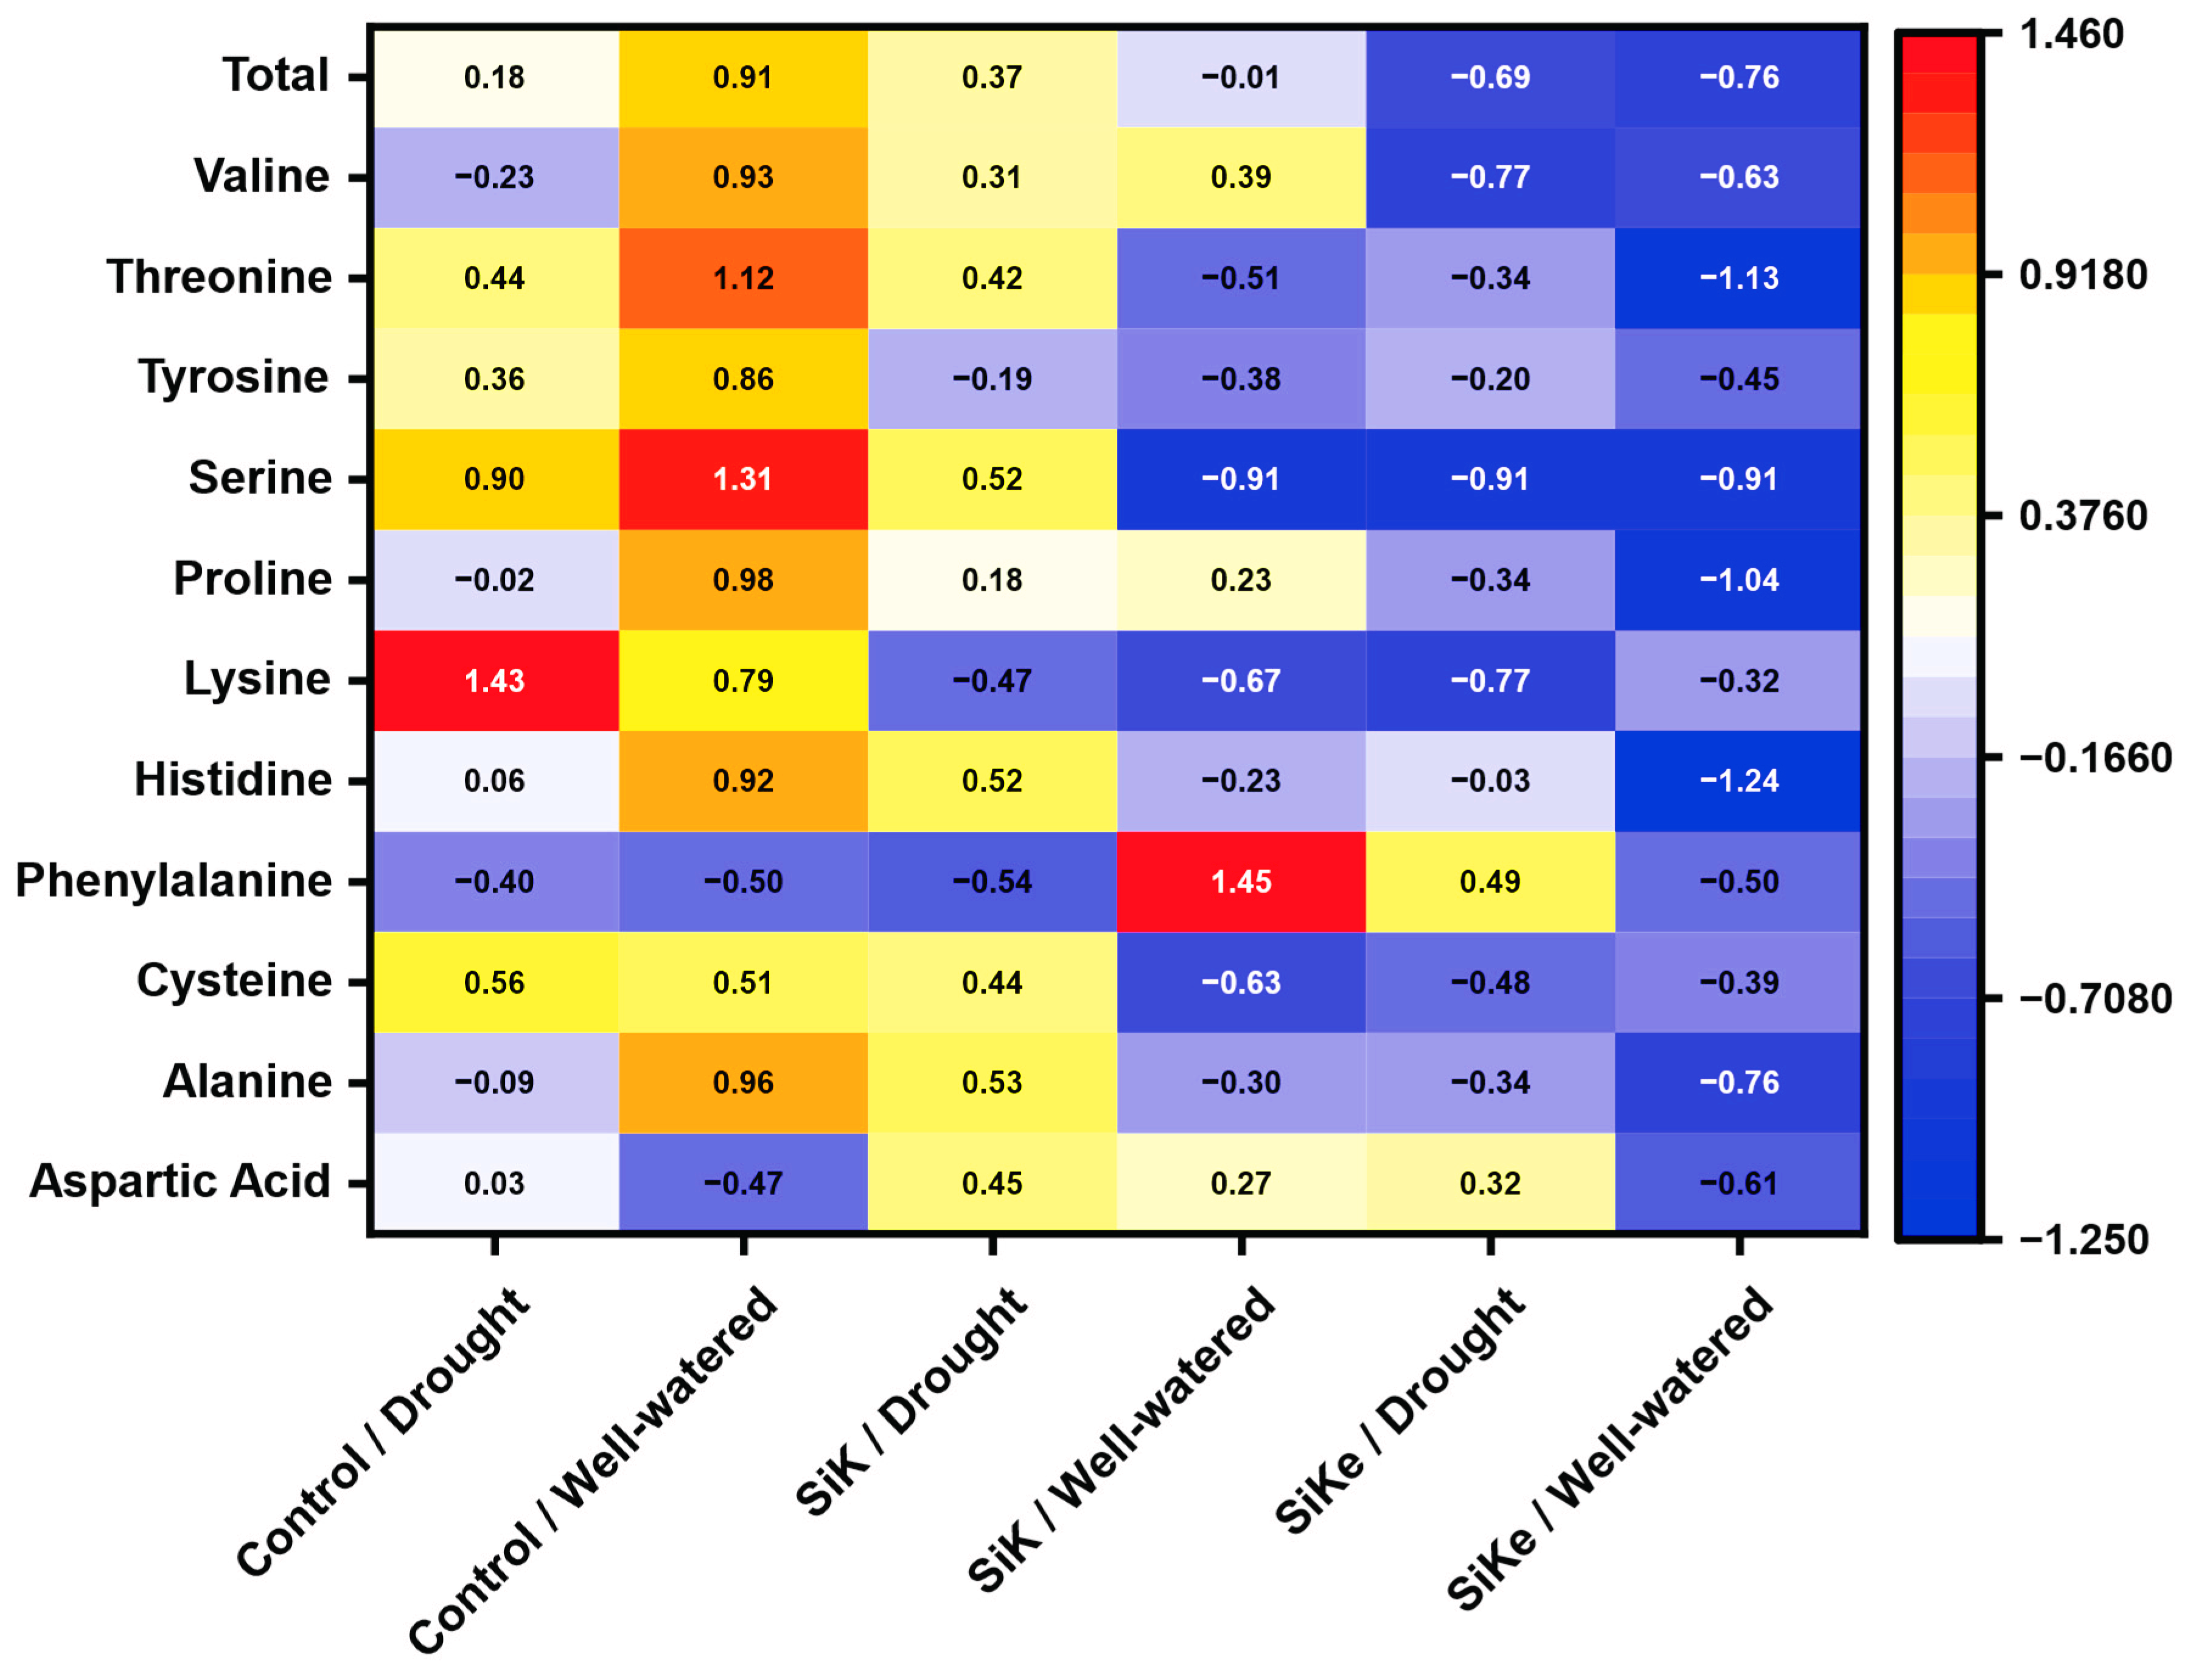
2.4. Heatmap of Amino Acids Content in the Leaf
A high variability in amino acid content in the leaves was observed in the Experiment II, particularly among the control, SiKe, and SiK treatments, regardless of water condition. In the control treatment (both drought and well-watered), the concentrations of several amino acids, especially threonine, serine, and lysine, were higher compared to SiK and SiKe. This pattern suggests a possible physiological modulation by Si, mainly through the remobilization of these amino acids, thereby reducing the need for their accumulation in the tissues. Such effect may contribute to improved metabolic homeostasis and, consequently, greater physiological efficiency in the plant.
Interestingly, proline levels were lower in the SiK treatments, which may indicate that silicon mitigates the damage caused by drought stress, reducing the activation of stress-induced osmoprotective responses. In addition, tyrosine contents also decreased under Si supply, which may reflect an increased requirement for phenolic compound biosynthesis, including lignin and antioxidant metabolites, under these conditions.
Figure 8.
The heatmap shows Z-score correlations of amino acid contents (Aspartic acid, Alanine, Cysteine, Phenylalanine, Histidine, Lysine, Proline, Serine, Tyrosine, Threonine, Valine, and Total) with the factors control (with no Si application), potassium silicate (SiK), and potassium silicate stabilized with sorbitol (SiKe) under drought and well-watered conditions. The color gradients represent correlation intensity: red indicates Z-scores above the mean (positive correlations), yellow indicates values around the mean (moderate correlations), and blue indicates Z-scores below the mean (negative correlations). Statistical details, including p-values for each factor and the coefficient of variation (CV) for each amino acid, are provided in the Supplementary Material (Table A3).
3. Discussion
Over the last years, the use of Si has emerged as a promising strategy to mitigate the negative impacts caused by drought stress during plant development. The combination of Si with sorbitol has also been tested in previous study [24], showing positive results on both biometric and physiological traits. Sorbitol enhances the potential of polar network ligands in aqueous solutions, which delays Si particle formation. In addition, it modifies the deliquescence point of salts, enabling prolonged absorption of the fertilizer through the leaf surface [24].
In Experiment I, water deficit negatively affected the control treatment (Control), even KCl was used to balance potassium levels in the SiK and SiKe sources. Whereas SPAD index and leaf area were improved with Si sources, regardless of water availability. This evidences that with Si enrichment a certain tolerance to chlorophyll oxidative stress and improved water-use efficiency to sustain cell division was observed. These findings are consistent with other studies [28,29]. Drought reduced stem diameter and increased leaf temperature, as expected. For yield-related traits such as grain number per plant, thousand-grain weight, and grain protein content (Figure 2), no differences were observed among Si sources. This suggests that the late-cycle drought stress was too severe for Si to mitigate its effects, contrasting with previous reports of yield improvements under Si supply [30]. However, the number of pods per plant increased in irrigated treatments supplied with Si (Figure 2), possibly due to improved flower retention during plant development.
In Experiment II, root traits improved with Si stabilized with sorbitol. Both root volume and root biomass (Figure 3) increased under SiKe application, independent of water condition. For root length and root projection area (Figure 3), an interaction was detected: under drought, SiKe promoted higher root growth compared with SiK and control treatments. These results agree with other studies [13,29,31], who suggested that enhanced root development under Si supply may be linked to modulation of root gene expression, particularly auxin transport and biosynthesis, as well as improved allocation of photo assimilates with a constant supply of sugars for root growth. Such mechanisms contribute to greater resilience under stress conditions.
In the Experiment II, no consistent Si effects were observed for shoot and physiological traits (leaf area, leaf water content, electrolyte leakage, total chlorophyll, carotenoids, SPAD index, and pheophytin content) (Figure 3 and Figure 4). This variability may be attributed to environmental fluctuations during sampling, which limited conclusive outcomes, although SiKe showed a trend toward positive responses. Water deficit remained the main factor driving changes in these parameters. In contrast, ascorbic acid content (Figure 5) showed a strong increase under SiKe application, both under drought and well-watered conditions. Previous reports indicate that Si can enhance ascorbic acid accumulation by stimulating the ascorbate–glutathione cycle, improving ROS detoxification, and modulating metabolic pathways that favor antioxidant biosynthesis [10].
Isoflavonoid analysis (daidzein, daidzin, genistein, and genistin) in Experiment II revealed that Si supply influenced secondary metabolism (Figure 6). Total isoflavonoid content presented interaction between Si sources and water availability, with SiK and SiKe treatments outperforming the control under both conditions, except for SiKe under well-watered treatment (Figure 5). This suggests that Si acts as an elicitor of secondary metabolism by enhancing phenylalanine ammonia-lyase activity and stimulating the phenylpropanoid pathway, resulting in increased isoflavonoids synthesis. This effect is also consistent with a priming mechanism, whereby Si induces basal accumulation of defense-related metabolites, even under non-stressed conditions, thus contributing to redox homeostasis and physiological defense [32,33]. Among the compounds analyzed, daidzein content showed a consistent increase under SiKe, regardless of water condition, highlighting Si’s role in modulating this compound, which is essential for plant defense against pathogens and for scavenging reactive species [34].
Principal component analysis (PCA) further supported these findings by revealing a clear separation between treatments and water condition. Well-watered treatments (Control, SiK, and SiKe) clustered distinctly, showing differential physiological and biometric responses compared with drought-stressed treatments. Well-watered SiKe was associated with root and shoot growth parameters (root length, root volume, plant height, and biomass), suggesting that Si combined with normal irrigation promotes vegetative growth. Conversely, traits related to drought stress, such as leaf temperature, electrolyte leakage, and accumulation of isoflavonoids (daidzein, genistein, and genistin), correlated with drought treatments, indicating adaptive responses to water restriction. Notably, some Si treatments under drought (SiK and SiKe) showed intermediate patterns, suggesting a mitigating role of Si in maintaining physiological and metabolic functions under stress, varying with Si content in the leaf. Overall, PCA highlighted the integrated influence of water condition and Si content on soybean physiology, growth, and metabolism.
The heatmap (Z-score) revealed pronounced heterogeneity in amino acid accumulation among treatments, depending on water condition and Si application. Control plants, regardless of water availability, accumulated higher amino acid levels, which may represent a strategy to maintain osmotic potential under stress. In contrast, Si treatments, particularly SiKe, showed reduced amino acid levels. Moreover, in the Table A3 of Supplementary Material, the Si factor altered the amino acids histidine, lysine, serine, threonine and total amino acids, which contribute for the modulation of metabolites production. This suggests a remobilization of amino acids toward the biosynthesis of other compounds, such as isoflavonoids and ascorbic acid, consistent with the higher levels of these metabolites observed in the present study. The enhanced foliar absorption of SiKe due to sorbitol likely contributed to this metabolic shift.
Taken together, these results validate the hypothesis that Si can mitigate drought-induced stress in soybean, stimulate antioxidant production, and modulate primary/secondary metabolism. Moreover, the stabilized source (SiKe) provided more consistent agronomic benefits, indicating its potential as a better Si foliar fertilizer under both well-watered and drought conditions.
4. Materials and Methods
4.1. Pot Experiment and Location
The study was conducted in greenhouse in Piracicaba, São Paulo state, Brazil. Pots with a capacity of 5 dm³ were used, and the soil was a Typic Dystrophic Red Latosol [35]. Prior to the experiments, a chemical analysis was performed following the methodology described by Raij et al. (2001) [36] (Table 1). As shown, the Si content was lower than 9.7 mg dm⁻³, which indicates a potential low availability [37], since soils with less than 20 mg dm⁻³ of available silicon are considered insufficient for silicon-accumulating crops, although soybean is not classified as a typical Si accumulator.
Two independent experiments were carried out. Experiment I was sown in 09/12/2023 (22°42’S, 47°37’W, altitude 538 m) and experiment II was sown at 12/02/2024 (22°42’S, 47°37’W, altitude 516 m). The schedule for both experiments is in the Supplementary Material in Tables A1 and A2, respectively.
Soybean variety Dagma 6822 IPRO was used. The seeds were inoculated with 2 ml kg-1 of solution containing Bradyrhizobium japonicum and Azospirillum brasilense (5×10⁹ CFU ml-1, Dual Force®), and five seeds were sowing in each pot. After two weeks, thinning was performed to maintain only three plants per pot. No fertilizer correction was applied. The soil water retention capacity was 546 ml pot-1.
4.2. Experiment Design
The experiment followed a 3×2 factorial design, with five replicates per treatment. The first factor was the Si sources: control (with no Si application), potassium silicate (SiK) and potassium silicate stabilized with sorbitol (SiKe), composed of SiK + Sorbitol [C6H14O6].
The second factor was water conditions after flowering stage (R1) [38]: 40% and 80% of soil water retention capacity, aimed at simulating a crop with drought and well-watered conditions, respectively. The moisture levels were established, in which 80% was identified as the optimal moisture content for soybean growth, while 40% represented the threshold at which visible wilting symptoms started to occur [39,40].
The foliar applications were done at three growth stages: two trifoliate leaves developed (V3), four trifoliate leaves developed (V5) and the beginning of bloom (R1). Foliar applications were performed under a relative humidity of 80%±10% and a temperature of 20 °C±5% (Elitech® datalogger) during the morning (6:00 h a.m.), with a portable CO₂-pressurized sprayer (2.0 bar) equipped with fan-type nozzles, (Jacto®, model JGT 11002, Brazil) calibrated for a flow rate of 1.5 L min⁻¹ per nozzle to simulate an application volume of 150 L ha⁻¹.
At each application, a 3.91 mL per plant volume was, applied, corresponding to 9.48 mmol[Si] L⁻¹ of Si and 18.96 mmol L⁻¹ of K for all the sources. In SiKe 2.03 mmol L⁻¹ of sorbitol (Quimisulsc®, 70%) were also used in the solution. The solution was prepared immediately before foliar application; the pH was adjusted to 7.0 using 1 M HCl. The adjuvant (FluiFlex® Agrichem, Brazil) was added at a concentration of 0.1% v/v and was applied in the control too, which received only KCl.
Soil Si applications were performed during 80 days, from the sowing until the onset of water deficit, through daily application of 200 mL of solution containing 2.8 mmol L-1 of Si and 5,6 mmol L⁻¹ of K, and the solution pH was adjusted to 7.0 using 1 M HCl. This concentration was defined to avoid the Si polymerization process, which occurs in concentrations above 3 mmol L-1 and decrease the efficiency of Si application [41]. In the control treatment, the same amount of potassium was applied both in foliar and soil using potassium chloride (KCl) as K source.
During the experiment, soil moisture was monitored daily using pot weight as standard. The water deficit treatment was initiated at the R1 growth stage in both experiments and maintained for 20 days (Tables A1 and A2 of Supplementary Material).
4.3. Experiment I Measurements
The SPAD index, leaf area, stem diameter, and leaf temperature were evaluated. The SPAD index was assessed in the central third of each leaflet of the third trifoliate leaf in R2 stage (chlorophyLOG Falcon®). Leaf area per plant was quantified in R3 by multiplying the length and width of each leaflet in each replicate by 0.7 [42]. Stem diameter was measured at three different points at the base of the plant: 5, 10, and 15 cm above the ground was also made in R3. These three measurements were taken in each replicate to determine the average for each treatment.
Leaf temperature was measured using a standard laser-aiming thermometer. The central region of the leaflet of the third trifoliate of all replicates was measured with the plant and R3.
The number of pods per plant, the number of grains per plant, and the grain dry mass per plant were determined. A grain mass sample was placed in a forced-air oven at 60°C for 48 h for indirect moisture determination.
Grain nitrogen content was determined by the total N method after sulfuric digestion in a digester block. Protein content was calculated by the grain N concentration expressed on a dry basis × 6.25 [43]. Protein accumulation per plant was determined by the ratio of protein content to grain mass per plant.
4.4. Experiment II Measurements
Leaf area and SPAD index were made exactly as presented in Experiment I.
Relative water content in the leaf was collected during R2 stage, by 09:00 h a.m., it was collected 10 discs of 1.5 mm of radius each from fresh third trifoliolate leaf, than weighted as fresh mass (Mf), rehydrated in deionized water for 6 hours, weighted again to get the turgid mass (Mt), dry in forced oven ventilation and got the dry mass (Md), finally calculating by the equation of Barrs & Weatherley (1962) [44].
The electrolyte leakage (EL) was determined by the method of Tarhanen et al (1999) [45]. Ten discs of 1.5 mm of radius each were collected at R3 stage from the third trifoliate, counting from the base of the plant, and left for 2 hours in a becker with 20 ml of deionized water. After that it was made the initial electrical conductivity measurement (Ci) with a benchtop conductivity meter (TEC-4MP/Tecnal®), after that, the beckers stayed in an oven for 3 hours with temperature of 65°C, finally getting the final electrical conductivity (Cf). The results consisted of the equation 1:
At R3, chlorophyll A, B, total and carotenoids content were determined. Five discs of 1.5 mm of radius each were collected from the third trifoliolate leaf and included in aluminum revested Eppendorf (ml) with 80% acetone solution and waited 72 hours for depigmentation. A fluorescence spectrometer (BEL1105/Tecnal®) was used to detect the absorbance, following the methodology of Lichtenthaler (1987) [46].
At grain filling stage (R5), physiological metabolites were analyzed using the third trifoliolate leaf collected at 07:00 h a.m. The sampled leaves were immediately frozen in liquid nitrogen in situ and stored at −80 °C until analysis. The content of ascorbic acid [47], total phenolic content [48] was made. The isoflavonoids (Daidzein, Daidzin, Genistein and Genistin content) [49,50] and amino acids [50,51,52] were quantified via UPLC. The isoflavonoids and amino acids were described as mg 100g-1 of dry matter (DM).
The foliar Si content was also measured at the R5 stage. Leaves were collected from the third trifoliolate counting from the base of the plant, washed with water, detergent solution (0.1%), acid solution (HCl – 3%), and deionized water, dried in a forced-air oven (65 ±5 °C), and ground into a fine powder [53]. The dry digestion method was used to determine the Si concentration in the leaf followed the methodology of Elliott et al. 1991 [54].
At the full seed stage (R₆), a descriptive evaluation was carried out to evaluate the root attributes. The intact roots were separated by immersing the substrate in water. Root analysis was carried out according to the protocol described by Bouma et al. (2000) [55]. The roots were carefully positioned in an acrylic tray filled with water, ensuring complete submersion, and subsequently scanned at a resolution of 300 dpi using an Epson XL 10000 scanner. Biometric parameters analysis was performed with the WinRhizo software, version 4.1c (Regent Instruments Inc., 2017). The following traits were assessed: root volume, total length, projected area and biomass. Then, the root was dried in forced oven ventilation and then determined the root biomass by weighing in an electronic balance. Finally, soil samples were collected from the treatments and the Si content was determined using the van Raij method (2001) [36].
4.4. Statistical Analysis
Data were assessed for homogeneity of variances using Levene’s test and for normality using the Shapiro–Wilk test. When both assumptions were satisfied, group means were compared by Tukey’s HSD test at α = 0.05, considering the interaction between factors in a two-way factorial design. If either assumption was violated, the nonparametric Kruskal–Wallis test was applied separately for each factor level (α = 0.05). The principal component analysis (PCA) was performed using the “FactoMineR” package in association with “ggplot2”, considering only numerical variables and applying a 95% confidence ellipse. Prior to PCA, all variables were standardized (centered and scaled) to ensure comparability across different measurement units. All statistical analyses were carried out in the RStudio environment version 2024.12.0+467.
5. Conclusions
The use of stabilized silicon source with sorbitol (SiKe), proved to be an effective strategy to enhance Si uptake and improve soybean performance under both drought stress and well-watered conditions. This study demonstrated that SiKe not only supports root growth and upper biomass accumulation but also contributes to improved antioxidant capacity and modulation of primary and secondary metabolism, leading to greater tolerance against oxidative stress.
Si application under well-watered conditions promoted pod set, while under drought it helped sustain physiological and metabolic traits, highlighting its dual role in both stress mitigation and yield maintenance. Altogether, these findings emphasize Si multifaceted role as a resilience and enhancing element and point to its potential as a key tool in climatic changes in a sustainable agriculture. Future studies should explore the field-level implementation and molecular mechanisms of stabilized Si sources on field and the molecular mechanisms underlying their beneficial effects.
Supplementary Materials
The following supporting information can be downloaded at the website of this paper posted on Preprints.org. Table A1. Schedule of the water deficit stress period in Experiment I; Table A2. Schedule of the water deficit stress period in Experiment II; Table A3. P-value and CV (%) of each variable of the experiments.
Author Contributions
FSF: conceptualization, data collection, data analysis, writing - review & editing; JPSJ: conceptualization, data analysis, writing - review & editing; RMP: data collection, writing - review & editing; MGC: conceptualization, data analysis, writing - review & editing; CNSC: data collection, data analysis, writing - review & editing; LBMJ: data collection, data analysis, writing; NLC: data collection; GPL: data collection; GSM: writing - review & editing; MLMG: data collection, data analysis, writing - review & editing; ACSCS: data collection, data analysis, writing - review & editing; HWPC: conceptualization, writing - review & editing; JLJ: writing - review & editing; RCU: conceptualization, data analysis, writing - review & editing. All authors have read and agreed to the published version of the manuscript.
Funding
This research was financially supported by the São Paulo Research Foundation (Fapesp, project no. 2023/07908-0).
Acknowledgments
We thank the financial support provided by the São Paulo Research Foundation (Fapesp, project no. 2023/07908-0). We also thank the Luiz de Queiroz College of Agriculture (ESALQ/USP) and the Center for Nuclear Energy in Agriculture (CENA/USP) for the facilities and infrastructure made available for this study.
Conflicts of Interest
The authors declare that the research was conducted in the absence of any commercial or financial relationships that could be construed as a potential conflict of interest.
Abbreviations
The following abbreviations are used in this manuscript:
| SiK | Potassium silicate (K₂SiO₃) |
| SiKe | Potassium silicate (K₂SiO₃) + Sorbitol (C6H14O6) |
| ROS | Reactive oxygen species |
| RSN | Reactive nitrogen species |
| ¹O₂ | Singleton Oxygen |
| O₂⁻ | Superoxide |
| Vn | Soybean’s vegetative stages |
| Rn | Soybean’s reproductive stages |
| SPAD | Soil-Plant Analysis Development |
| EL | Electrolyte leakage |
| Ci | Initial conductivity |
| Cf | Final conductivity |
| DM | Dry matter |
| UV-B | Ultraviolet-B radiation |
| PCA | Principal component analysis |
References
- Marengo J.A., Schaeffer R., Zee D., Pinto H.S. (2009). Mudanças climáticas e eventos extremos no Brasil. Rio de Janeiro: FBDS, 2009. 76 p.
- IPCC (2021). Summary for Policymakers: Climate change 2021 the physical science basis. Contribution of Working Group I to the Sixth Assessment Report of the Intergovernmental Panel on Climate Change.
- Companhia Nacional de Abastecimento. (2025). Acompanhamento da safra brasileira de grãos: Safra 2024/2025 – 2º levantamento, outubro 2025. Brasília, DF: Conab. Recuperado de https://www.conab.gov.br/info-agro/safras/graos/boletim-da-safra-de-graos.
- Basso, M. F., Neves, M. F., & Grossi-de-Sa, M. F. (2024). Agriculture evolution, sustainability and trends, focusing on Brazilian agribusiness: A review. Frontiers in Sustainable Food Systems, 7, 1296337. [CrossRef]
- Ferreira, R. C., Sibaldelli, R. N. R., Crusiol, L. G. T., Neumaier, N., & Farias, J. R. B. (2024). Soybean Yield Losses Related to Drought Events in Brazil: Spatial–Temporal Trends over Five Decades and Management Strategies. Agriculture, 14(12), 2144. [CrossRef]
- Khan I., Awan S.A., Ikram R., Rizwan M., Akhtar N., Yasmin H., Sayyed R.Z., Ali S., Ilyas N. (2021). Effects of epibrassinolide on plant growth, antioxidants defense system, and endogenous hormones in two wheat varieties under drought stress. Physiologia Plantarum 172:696–7062. [CrossRef]
- Khan A., Bilal S., Khan A.L., Imran M., Al-Harrasi A., Al-Rawahi A., Lee I-J (2020). Silicon mediated alleviation of combined salinity and cadmium stress in date palm (Phoenix dactylifera L.) by regulating physio-hormonal alteration. Ecotoxicology and Environmental Safety 188:109885. [CrossRef]
- Bhardwaj S., Sharma D., Singh S., Ramamurthy PC, Verma T, Pujari M, Singh J, Kapoor D, Prasad R (2022). Physiological and molecular insights into the role of silicon in improving plant. Plant and Soil 486:25-43. [CrossRef]
- Sonobe K., Hattori T., An P., Tsuji W., Eneji A.E., Kobayashi S., Kawamura Y., Tanaka K., Inanaga S. (2010).tripa Effect of silicon application on sorghum root responses to water stress. Journal of Plant Nutrition 341:7182. [CrossRef]
- Wang M., Wang R., Mur L.A.J., Ruan J., Shen Q., Guo S. (2021). Functions of silicon in plant drought stress responses. Horticulture Research. [CrossRef]
- Sharma A., Kumar V., Shahzad B., Ramakrishnan M., Singh Sidhu G.P., Bali A.S., Handa N., Kapoor D., Yadav P., Khanna K. (2020). Photosynthetic response of plants under different abiotic stresses: A review. Journal of Plant Growth Regulation 392:509–531. [CrossRef]
- Hussain S., Shuxian Li., Mumtaz M., Shafiq I., Iqbal N., Brestic M., Shoaib M., Sisi Q., Li W., Mei X., Bing C., Zivcak M., Rastogi A., Skalicky M., Hejnak V., Weiguo L., Wenyu Y. (2021) Foliar application of silicon improves stem strength under low light stress by regulating lignin biosynthesis genes in soybean (Glycine max (L.) Merr.). Journal of Hazardous Materials, 401:123-256. [CrossRef]
- Shi Y., Zhang Y., Han W., Feng R., Hu Y., Guo J., Gong H. (2016). Silicon enhances water stress tolerance by improving root hydraulic conductance in Solanum lycopersicum L. Frontiers in Plant Science 7:196. [CrossRef]
- Shen X, Zhou Y, Duan L, Li Z, Egrinya A, Li J (2010) Silicon effects on photosynthesis and antioxidant parameters of soybean seedlings under drought and ultraviolet-B radiation. Journal of Plant Physiology 167:1248-1252. [CrossRef]
- Greger M., Landberg T., Vaculík M. (2018). Silicon influences soil availability and accumulation of mineral nutrients in various plant species. Plants 7:41. [CrossRef]
- Knight C.T., Kinrade S.D. (2001). A primer on the aqueous chemistry of silicon. Studies in plant science. Elsevier 8:57–84. [CrossRef]
- Kapoor D., Bhardwaj S., Landi M., Sharma A., Ramakrishnan M., Sharma A. (2020). The impact of drought in plant metabolism: How to exploit tolerance mechanisms to increase crop production. Applied Science 1016:5692. [CrossRef]
- Lambers H., Chapin F., Pons T. (2008). Plant physiological ecology. (Springer: New York). [CrossRef]
- Laxa M., Liebthal M., Telman W., Chibani K., Dietz K-J (2019). The role of the plant antioxidant system in drought tolerance. Antioxidants 84:94. [CrossRef]
- Cerny, M., Habanová, H., Berka, M., Luklová, M., & Brzobohatý, B. (2018). Hydrogen Peroxide: Its Role in Plant Biology and Crosstalk with Signalling Networks. International Journal of Molecular Sciences, 19(9), 2812. [CrossRef]
- Baxter A, Mittler R., Suzuki N. (2014) ROS as key players in plant stress signaling. Journal of Experimental Botany. [CrossRef]
- Chen D., Wang S., Yin L., Deng X. (2018) How does silicon mediate plant water uptake and loss under water deficiency? Frontiers in Plant Science 9:281. [CrossRef]
- Andrade, A.F. de, Bueno, A.M., de Carvalho, A.d.S. Innovative Soluble Silicon Leaf Source Increase Gas Exchange, Grain Yield and Economic Viability in Common Bean. Silicon 14, 3739 3747 (2022). [CrossRef]
- Souza Júnior, J. P., Prado, R. de M., Diniz, J. F., Guedes, V. H. de F., Silva, J. L. F. da, Roque, C. G., & Alvarez, R. de C. F. (2022). Foliar application of innovative sources of silicon in soybean, cotton, and maize. Journal of Soil Science and Plant Nutrition, 22(6), 5186–5199. [CrossRef]
- Oliveira S., Lemes E.S., Meneghello G.E., Tavares L.C., Barros A.C.A. (2015). Aplicação de silício via solo no rendimento e na qualidade fisiológica de sementes de soja. Semina: Ciências Agrárias 36:3029–3042. [CrossRef]
- Moreira A.R., Fagan E.B., Martins K.V., Souza C.H.E. (2010) Resposta da cultura de soja a aplicação de silício foliar. Bioscience Journal 26:413-423.
- Farhangi-Abriz S., Torabian S. (2018). Nano-silicon alters antioxidant activities of soybean seedlings under salt toxicity. Protoplasma 255:953–962. [CrossRef]
- Sah, S. K., Reddy, K. R., & Li, J. (2022). Silicon Enhances Plant Vegetative Growth and Soil Water Retention of Soybean (Glycine max) Plants under Water-Limiting Conditions. Plants (Basel, Switzerland), 11(13), 1687. [CrossRef]
- Abdullah, M. M., Waraich, E. A., Ahmad, M., Hussain, S., Asghar, H. N., Haider, A., Zulfiqar, U., Ahmad, Z., Soufan, W., Prasad, P. V., & Djalovic, I. (2025). Improving soybean drought tolerance via silicon-induced changes in growth, physiological, biochemical, and root characteristics. Plant signaling & behavior, 20(1), 2465232. [CrossRef]
- Wei, J., Liu, L., Wei, Z., Qin, Q., Bai, Q., Zhao, C., Zhang, S., & Wang, H. (2025). Silicon Nano-Fertilizer-Enhanced Soybean Resilience and Yield Under Drought Stress. Plants, 14(5), 751. [CrossRef]
- Tripathi, P., Tayade, R., Mun, B.-G., Yun, B.-W., & Kim, Y. (2022). Silicon application differentially modulates root morphology and expression of PIN and YUCCA family genes in soybean (Glycine max L.). Frontiers in Plant Science, 13, 842832. [CrossRef]
- La, H.; et al. (2023). Drought stress-responsive abscisic acid and salicylic acid crosstalk with the phenylpropanoid pathway in soybean seeds. Frontiers in Plant Science. [CrossRef]
- Biju, S., Fuentes, S., & Gupta, D. (2023). Novel insights into the mechanism(s) of silicon-induced drought stress tolerance in lentil plants revealed by RNA sequencing analysis. BMC Plant Biology, 23, 498. [CrossRef]
- Trush, K., & Pal'ove-Balang, P. (2023). Biosynthesis and role of isoflavonoids in legumes under different environmental conditions. Plant Stress, 8, 100153. [CrossRef]
- Santos, H. G. dos, Jacomine, P. K. T., Anjos, L. H. C. dos, Oliveira, V. A. de, Lumbreras, J. F., Coelho, M. R., Almeida, J. A. de, Araujo Filho, J. C., Oliveira, J. B. de, & Cunha, T. J. F. (Eds.). (2018). Brazilian Soil Classification System (5th ed., rev. & exp.; Translated by C. E. A. Reichart, L. H. C. dos Anjos, M. C. Alves, H. G. dos Santos, & J. F. Lumbreras). Brasília, DF: Embrapa. ISBN 978-85-7035-821-9.
- Raij, B. van; Andrade, J. C.; Cantarella, H.; Quaggio, J. A. (2001). Chemical Analysis for Soil Fertility Evaluation in Tropical Soils. Campinas: Instituto Agronômico de Campinas. 285 p.
- Datnoff, L. E., Snyder, G. H., & Korndörfer, G. H. (Eds.). (2001). Silicon in agriculture. Studies in Plant Science, 8. Elsevier Science B.V., Amsterdam, The Netherlands. 403 p.
- Fehr, W. R. & Caviness, C. E. Stages of soybean development. (1977).
- Sinclair, T. R. & Ludlow, M. M. (1986). Influence of soil water supply on the plant water balance of four tropical grain legumes. Australian Journal of Plant Physiology, 13(3), 329–341. [CrossRef]
- Gong, H., Zhu, X., Chen, K., Wang, S., & Zhang, C. (2005). Silicon alleviates oxidative damage of wheat plants in pots under drought. Plant Science, 169(2), 313–321. [CrossRef]
- Birchall, J. D. The essentiality of silicon in biology. Chem. Soc. Rev. 24, 351–357 (1995). [CrossRef]
- Adami, M., Hastenreiter, F.A., Flumignan, D.L., Faria, R.T. (2008). Estimativa de área de folíolos de soja usando imagens digitais e dimensões foliares. Bragantia, 67, 1053-1058. [CrossRef]
- AOAC International. (2005). Official methods of analysis of AOAC International (18th ed., Method 988.05 – Protein (Crude)). AOAC International.
- Barrs, H.D. and Weatherley, P.E. (1962) A Re-Examination of the Relative Turgidity Techniques for estimating water deficits in leaves. Australian Journal of Biological Sciences, 15, 413-428. [CrossRef]
- Tarhanen, S. Metsärinne, S., Holopainen, T., Oksanen, J. (1999) Membrane permeability response of lichen Bryoria fuscescens to wet deposited heavy metals and acid rain. Environmental Pollution. 104, 121-129. [CrossRef]
- Lichtenthaler, H. (1987). Chlorophylls and carotenoids: Pigments of photosynthetic biomembranes. Methods in Enzymology, 148C, 350-382. [CrossRef]
- Stroehecker R., Henning H.M. (1967). Análises de vitaminas: Métodos comprobados. Madrid: Paz Montalvo.
- Singleton V.L., Rossi J.R. (1965). Colorimetry of total phenolics with phosphomolybdic- acid reagents. American Journal of Enology and Viticulture 16:144-158. [CrossRef]
- Carrão-Panizzi, M.C., Favoni, S.P.G., Kikuchu, A. (2002). Extraction time for isoflavone determination. Brasilian Archives of Biology and Technology, v. 45, p. 515-518. [CrossRef]
- Oliveira, I.C., Santana, D.C., de Oliveira, J.L.G. et al. Flavonoids and their relationship with the physiological quality of seeds from different soybean genotypes. Sci Rep 14, 17008 (2024). [CrossRef]
- Bates, L., Waldren, R. P., Teare, I. D. (1973). Rapid determination of free proline for water-stress studies. Plant and Soil 39:205–207. [CrossRef]
- Seron, A.C.d.S.C.; Santana, D.C.; Oliveira, I.A.; Campos, C.N.S.; Teodoro, L.P.R.; Silva, E.V.M.; Ratke, R.F.; Baio, F.H.R.; da Silva Junior, C.A.; Teodoro, P.E. Relationship Between Hyperspectral Data and Amino Acid Composition in Soybean Genotypes. AgriEngineering 2025, 7, 265. [CrossRef]
- Silva, F. C. da (2009). Manual de análises químicas de solos, plantas e fertilizantes. Embrapa Informação Tecnológica.
- Elliott C.L., Snyder G.H. (1991). Autoclave-induced digestion for the colorimetric determination of silicon in rice straw. Journal of Agricultural Food Chemistry 39:1118-1119. [CrossRef]
- Bouma, T. J., Nielsen, K. L., & Koutstaal, B. (2000). Sample preparation and scanning protocol for computerised analysis of root length and diameter. Plant and Soil, 218(1), 185–196. [CrossRef]
Figure 1.
(a) SPAD index; (b) Leaf area; (c) Stem diameter; (d) Leaf temperature. Lowercase letters indicate significant differences between the control (with no Si application), potassium silicate (SiK), and potassium silicate stabilized with sorbitol (SiKe) treatments; uppercase letters compare the water conditions (drought and well-watered) within each Control, SiK, and SiKe treatments. Significance was determined at Tukey’s HSD (α = 0.05).
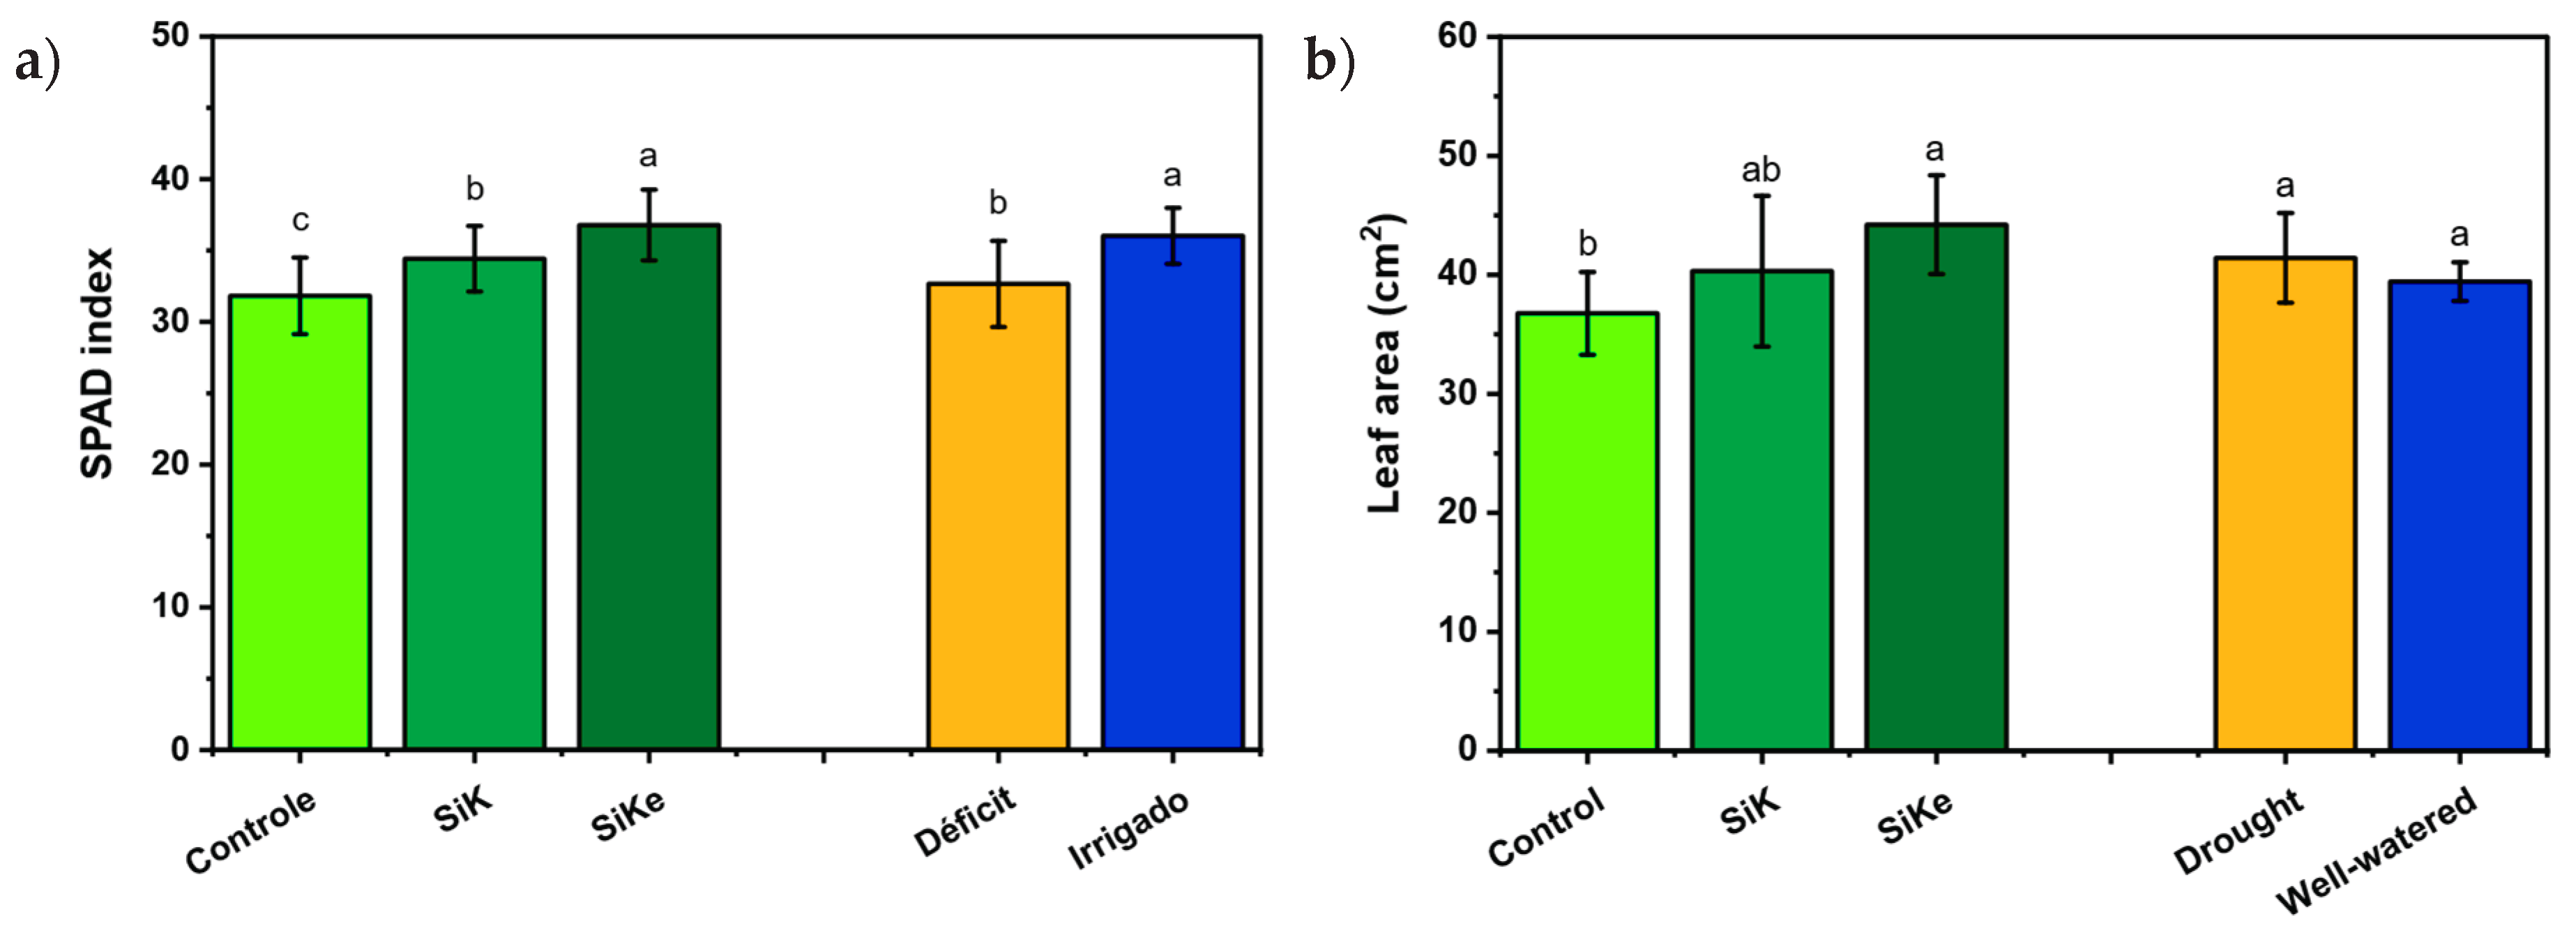
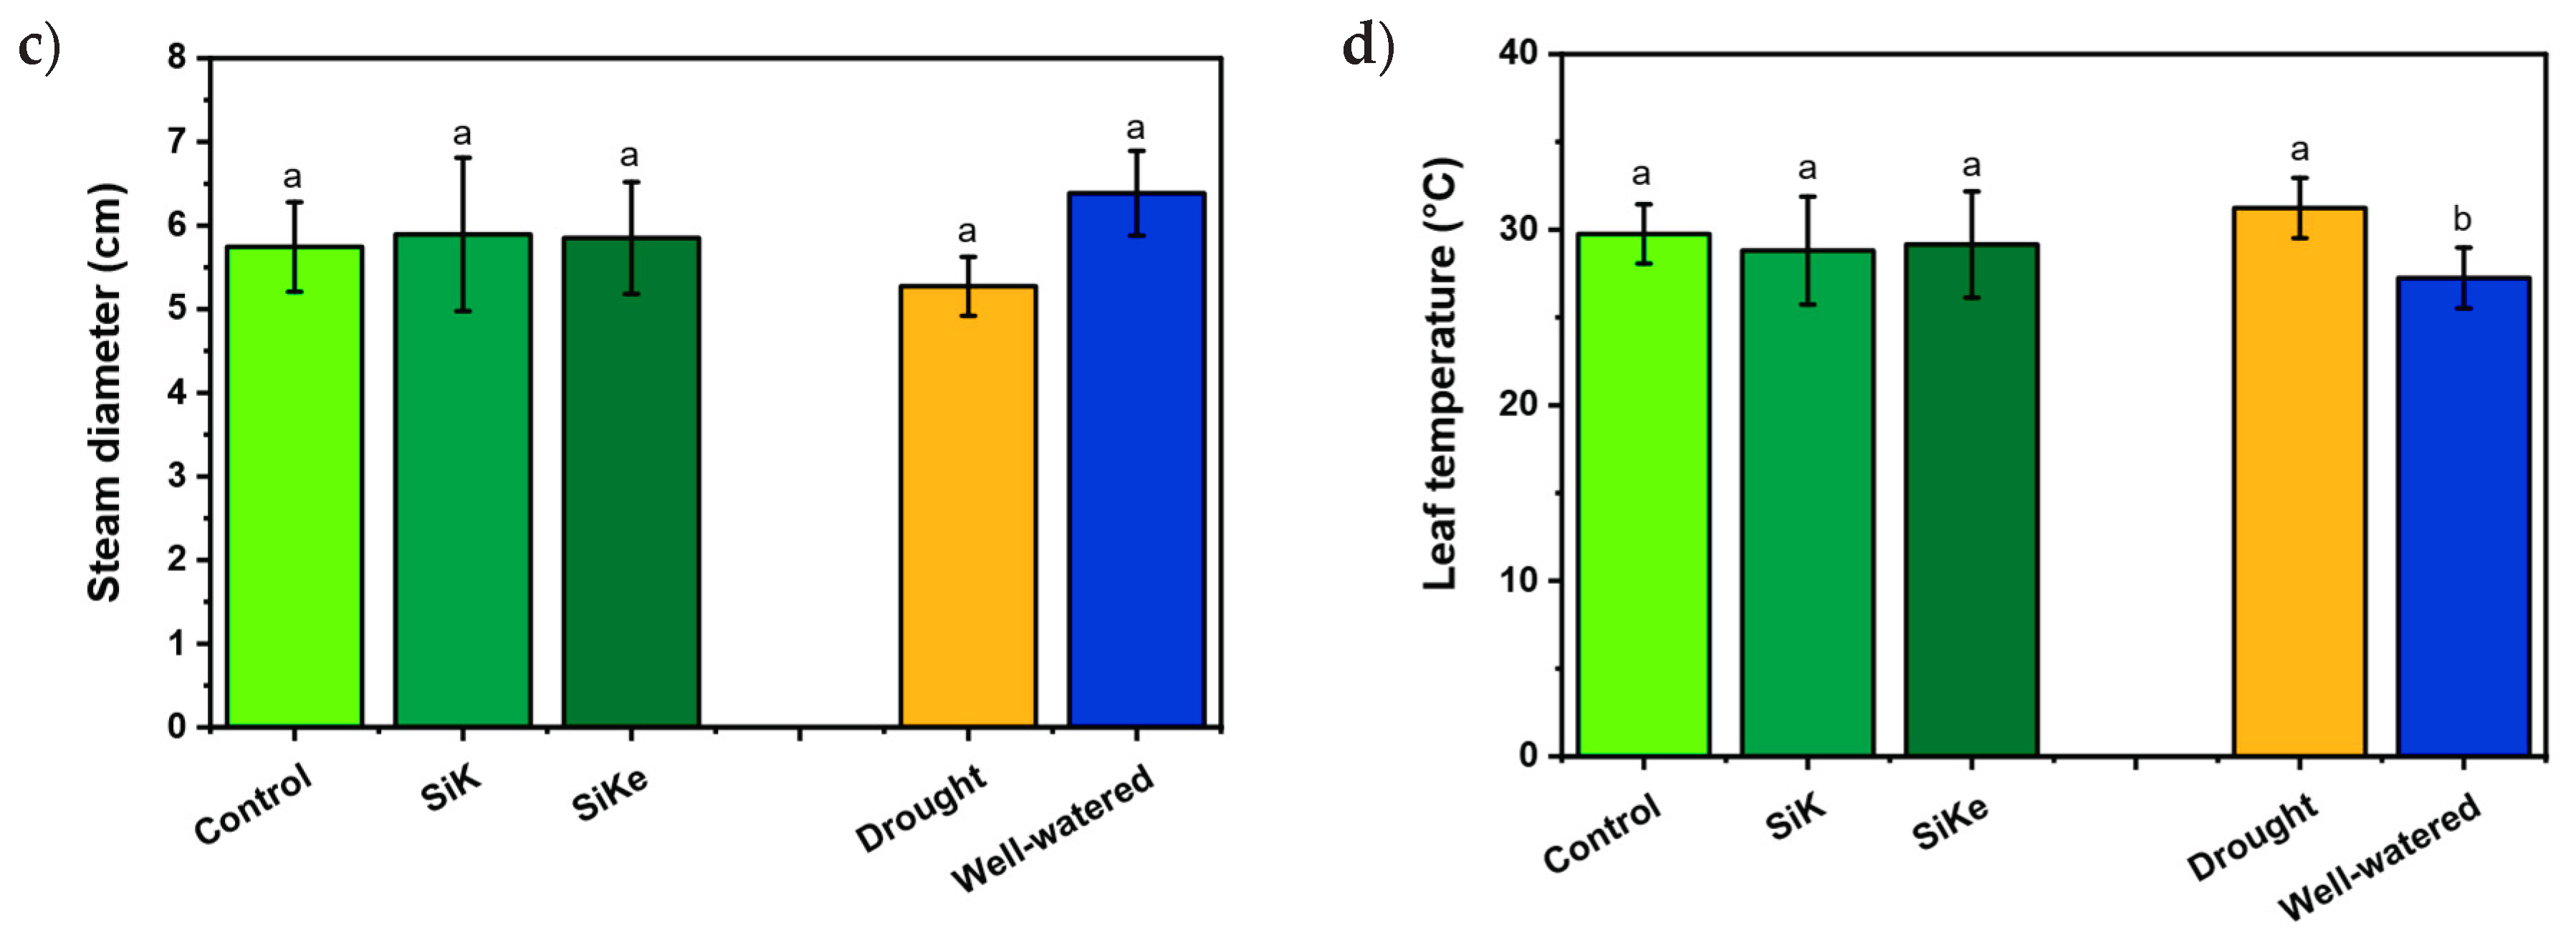
Figure 2.
(a) Pods per plant; (b) Grains per plant; (c) Thousand-grain weight; (d) Grain protein content. Lowercase letters indicate significant differences between the control (with no Si application), potassium silicate (SiK), and potassium silicate stabilized with sorbitol (SiKe) ; uppercase letters compare the water conditions (drought and well-watered) within each Control, SiK, and SiKe treatments. Significance was determined at Tukey’s HSD (α = 0.05).
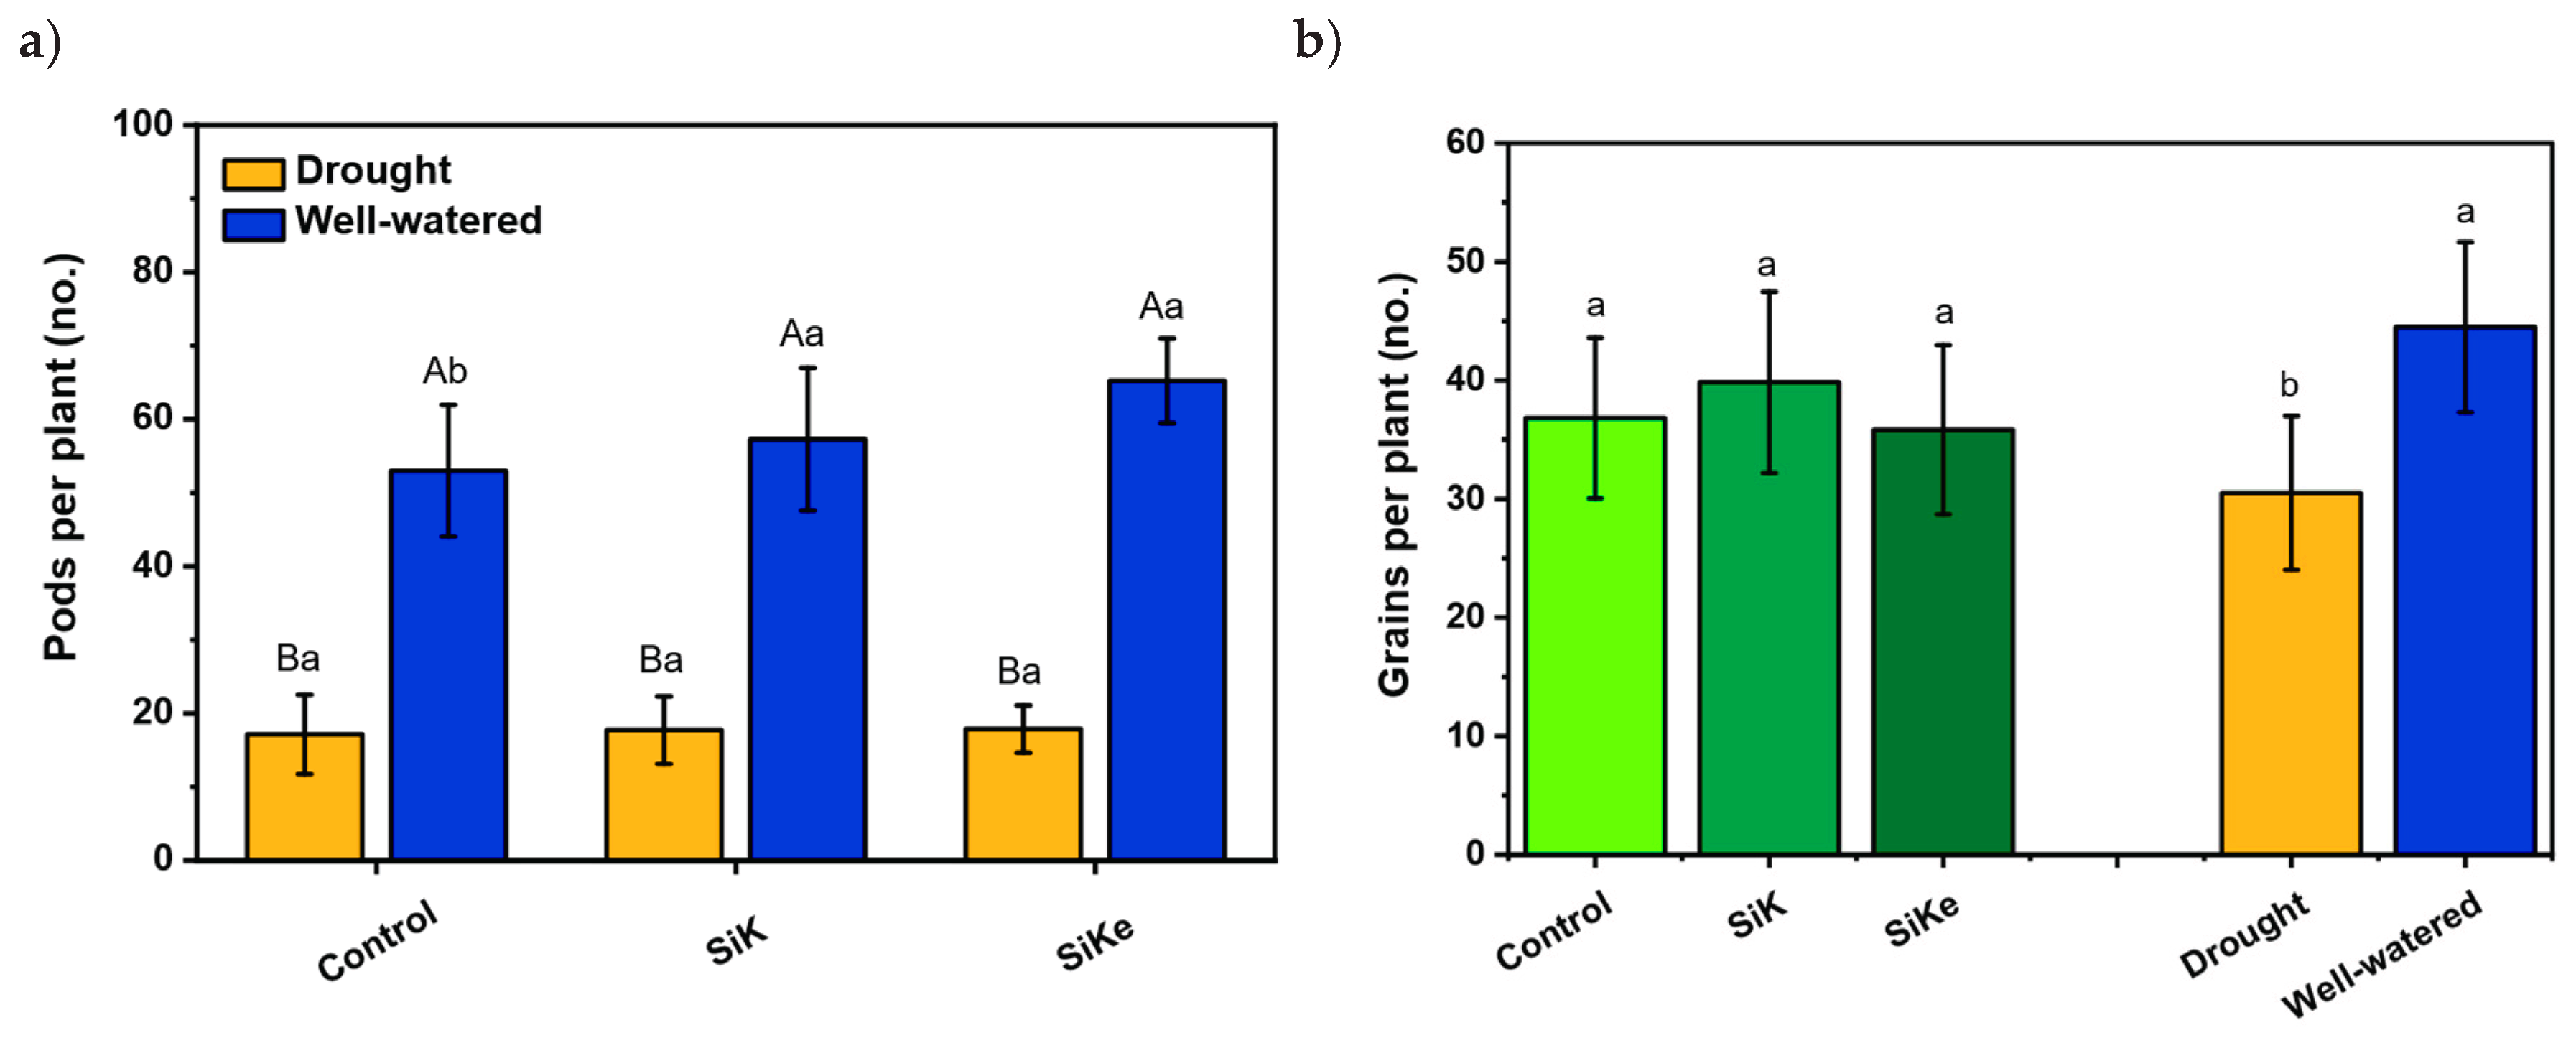
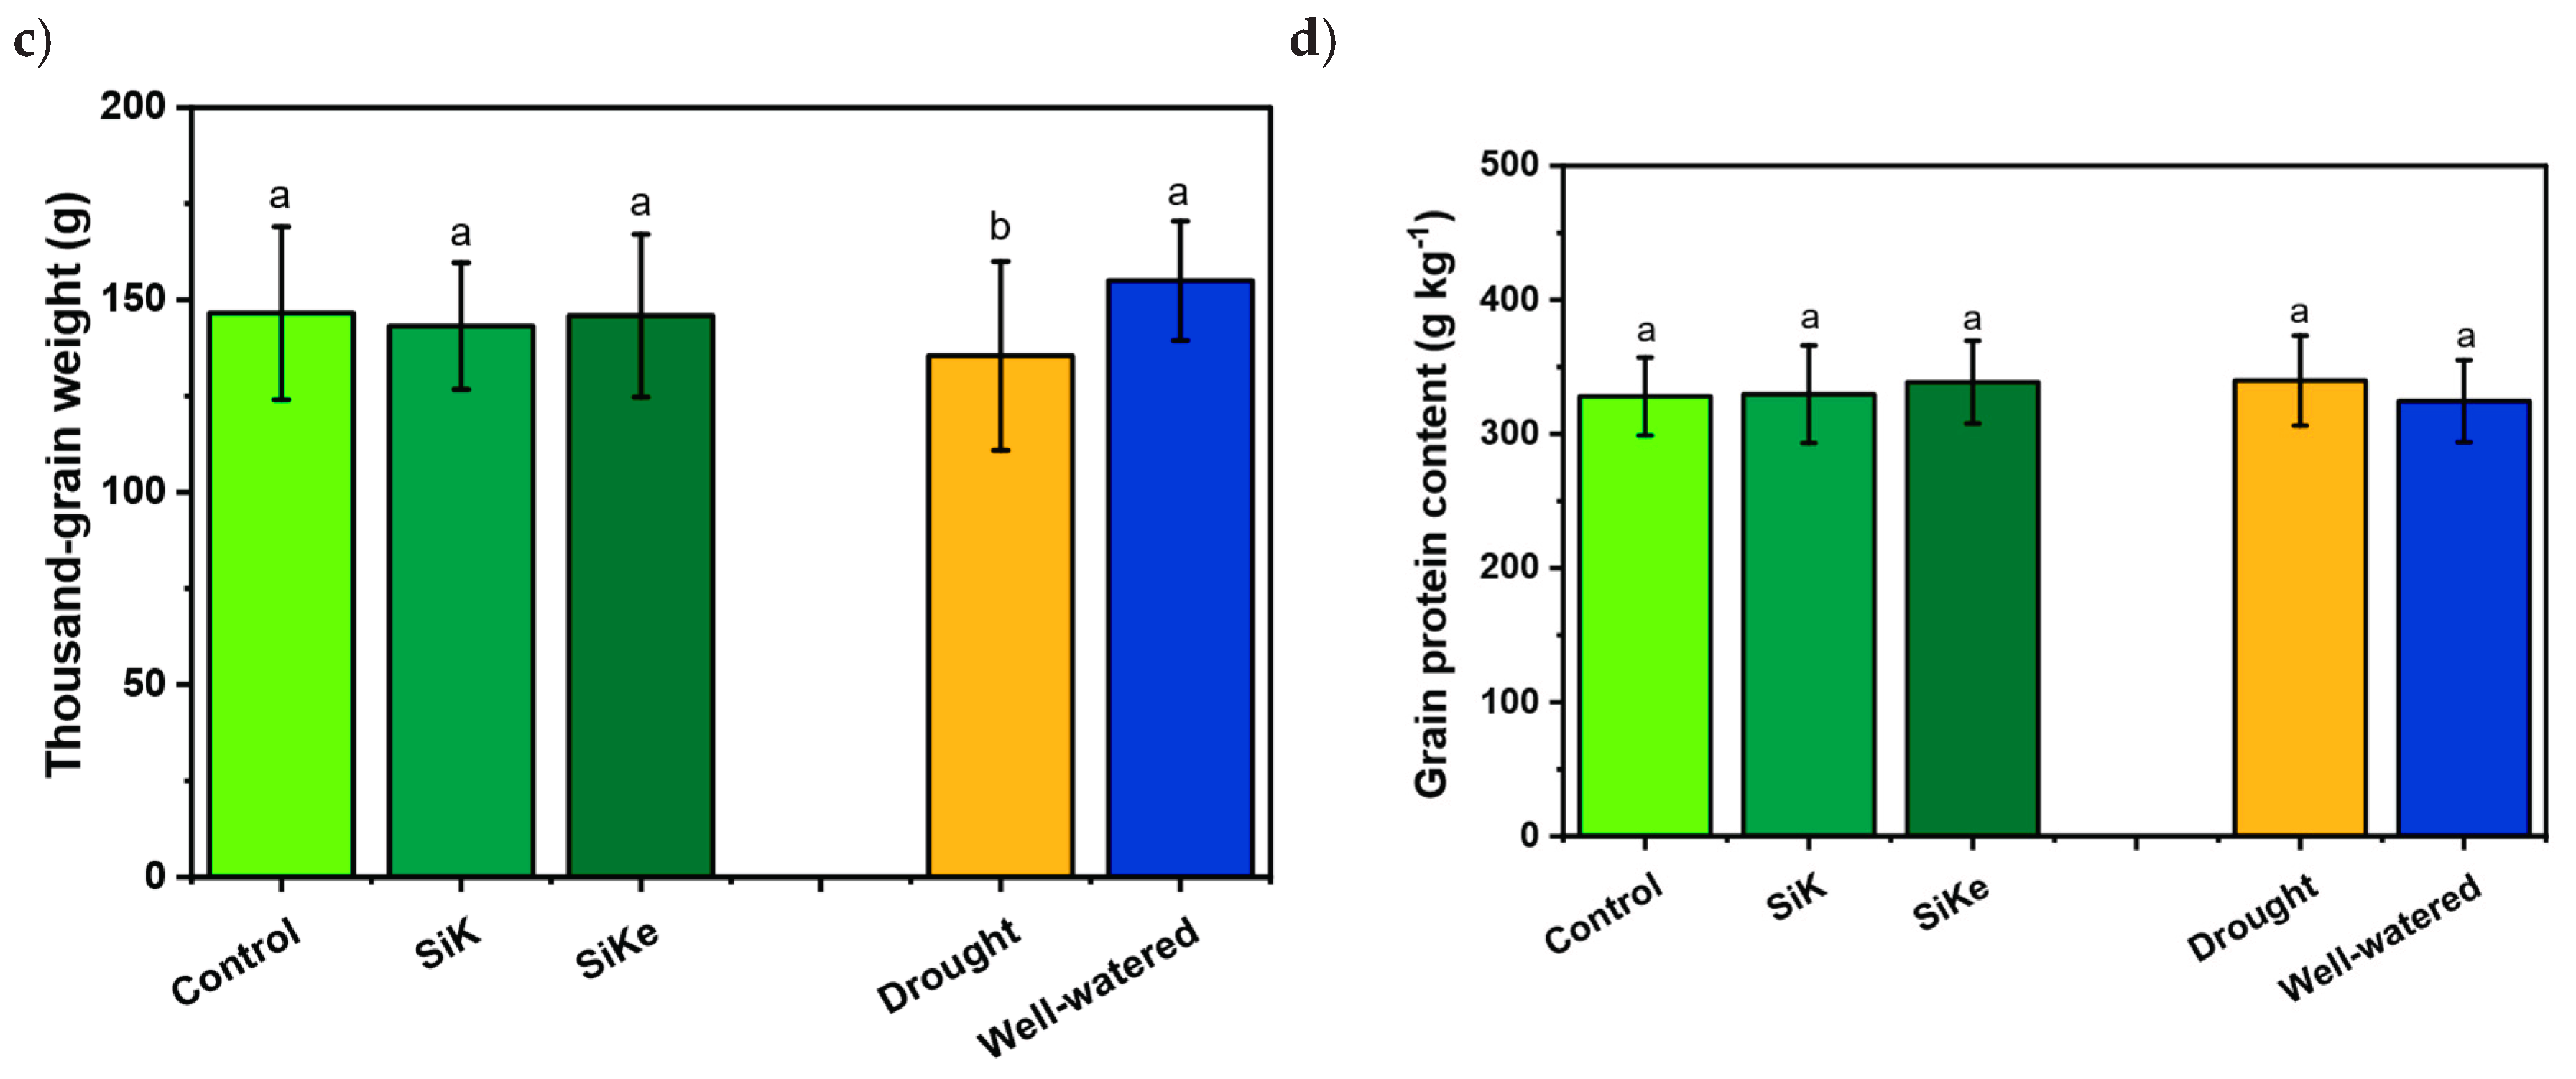
Figure 3.
(a) Samples of images for the evaluation of root attributes; (b) Root length; (c) Root volume; (d) Root projected area; (e) Root biomass. Lowercase letters indicate significant differences between the control (with no Si application), potassium silicate (SiK), and potassium silicate stabilized with sorbitol (SiKe) treatments; uppercase letters compare the water conditions (drought and well-watered) within each Control, SiK, and SiKe treatments. Significance was determined at Tukey’s HSD (α = 0.05).
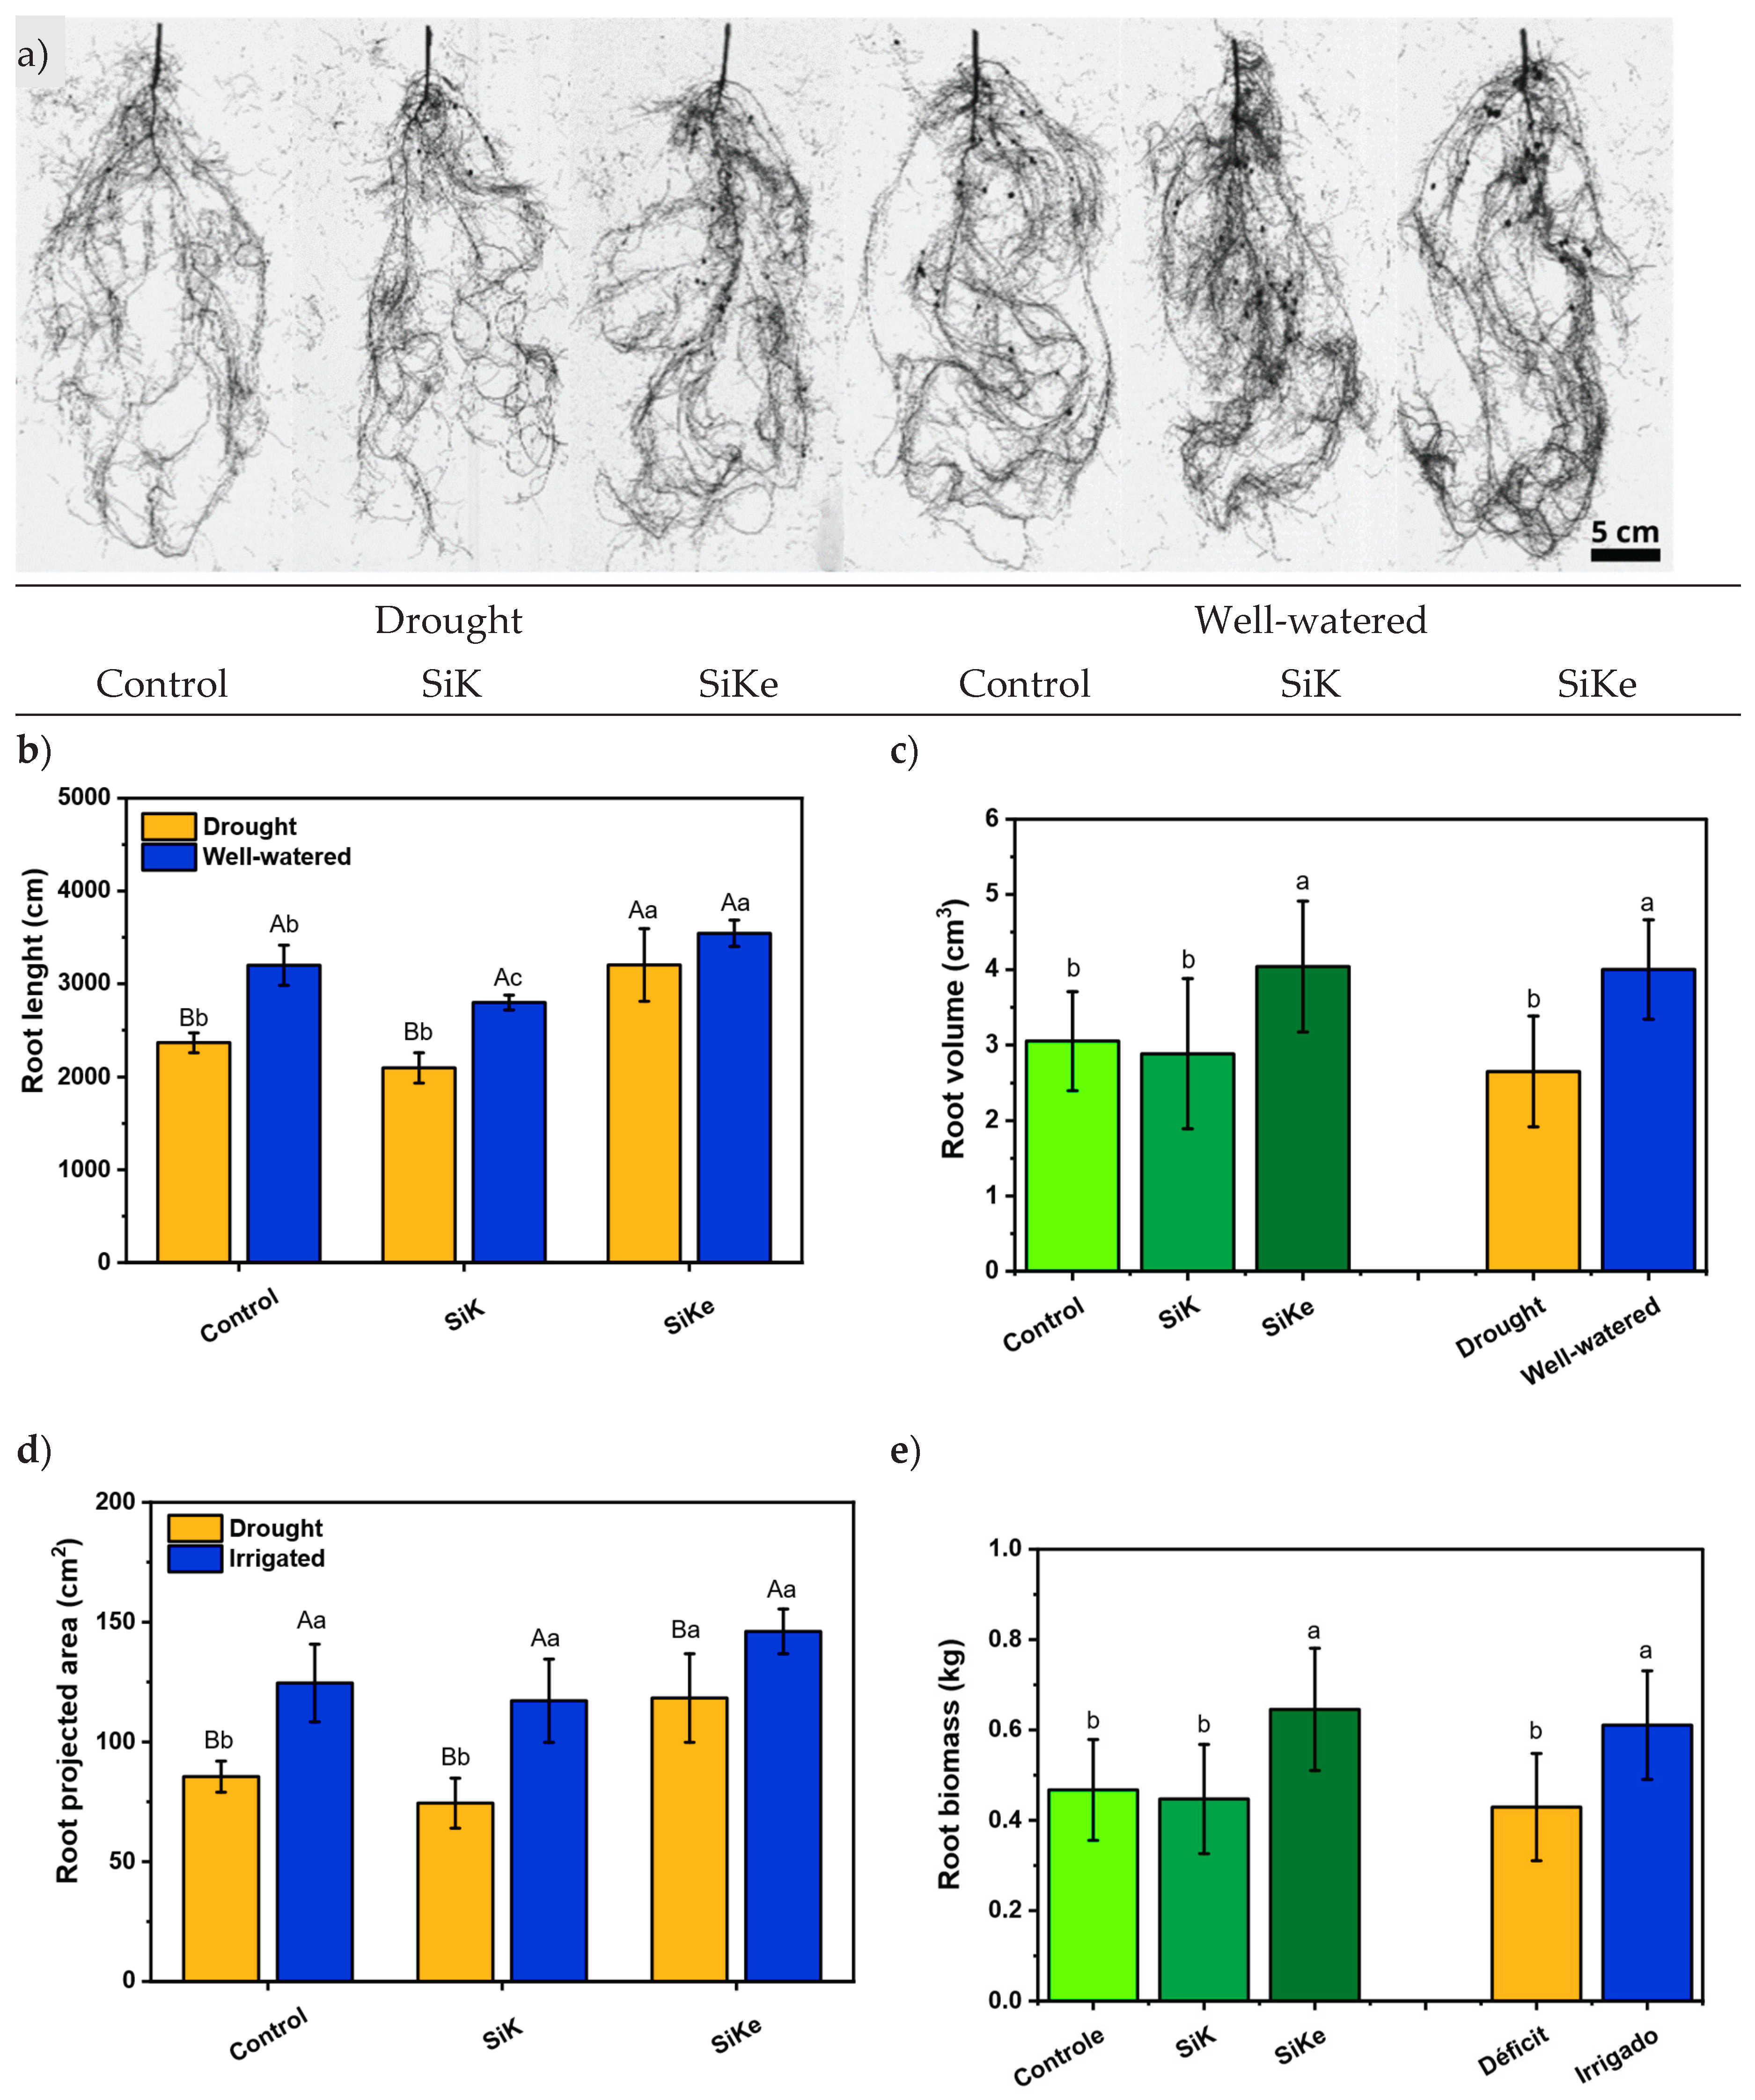
Figure 4.
(a) Leaf Si content; (b) SPAD index; (c) Leaf area; (d) Leaf water content; (e) Electrolyte leakage; (f) Chlorophyll content; and (g) Carotenoids content. Lowercase letters indicate significant differences between the control (with no Si application), potassium silicate (SiK), and potassium silicate stabilized with sorbitol (SiKe) treatments; uppercase letters compare the water conditions (drought and well-watered) within each Control, SiK, and SiKe treatments. Significance was determined at Tukey’s HSD (α = 0.05).
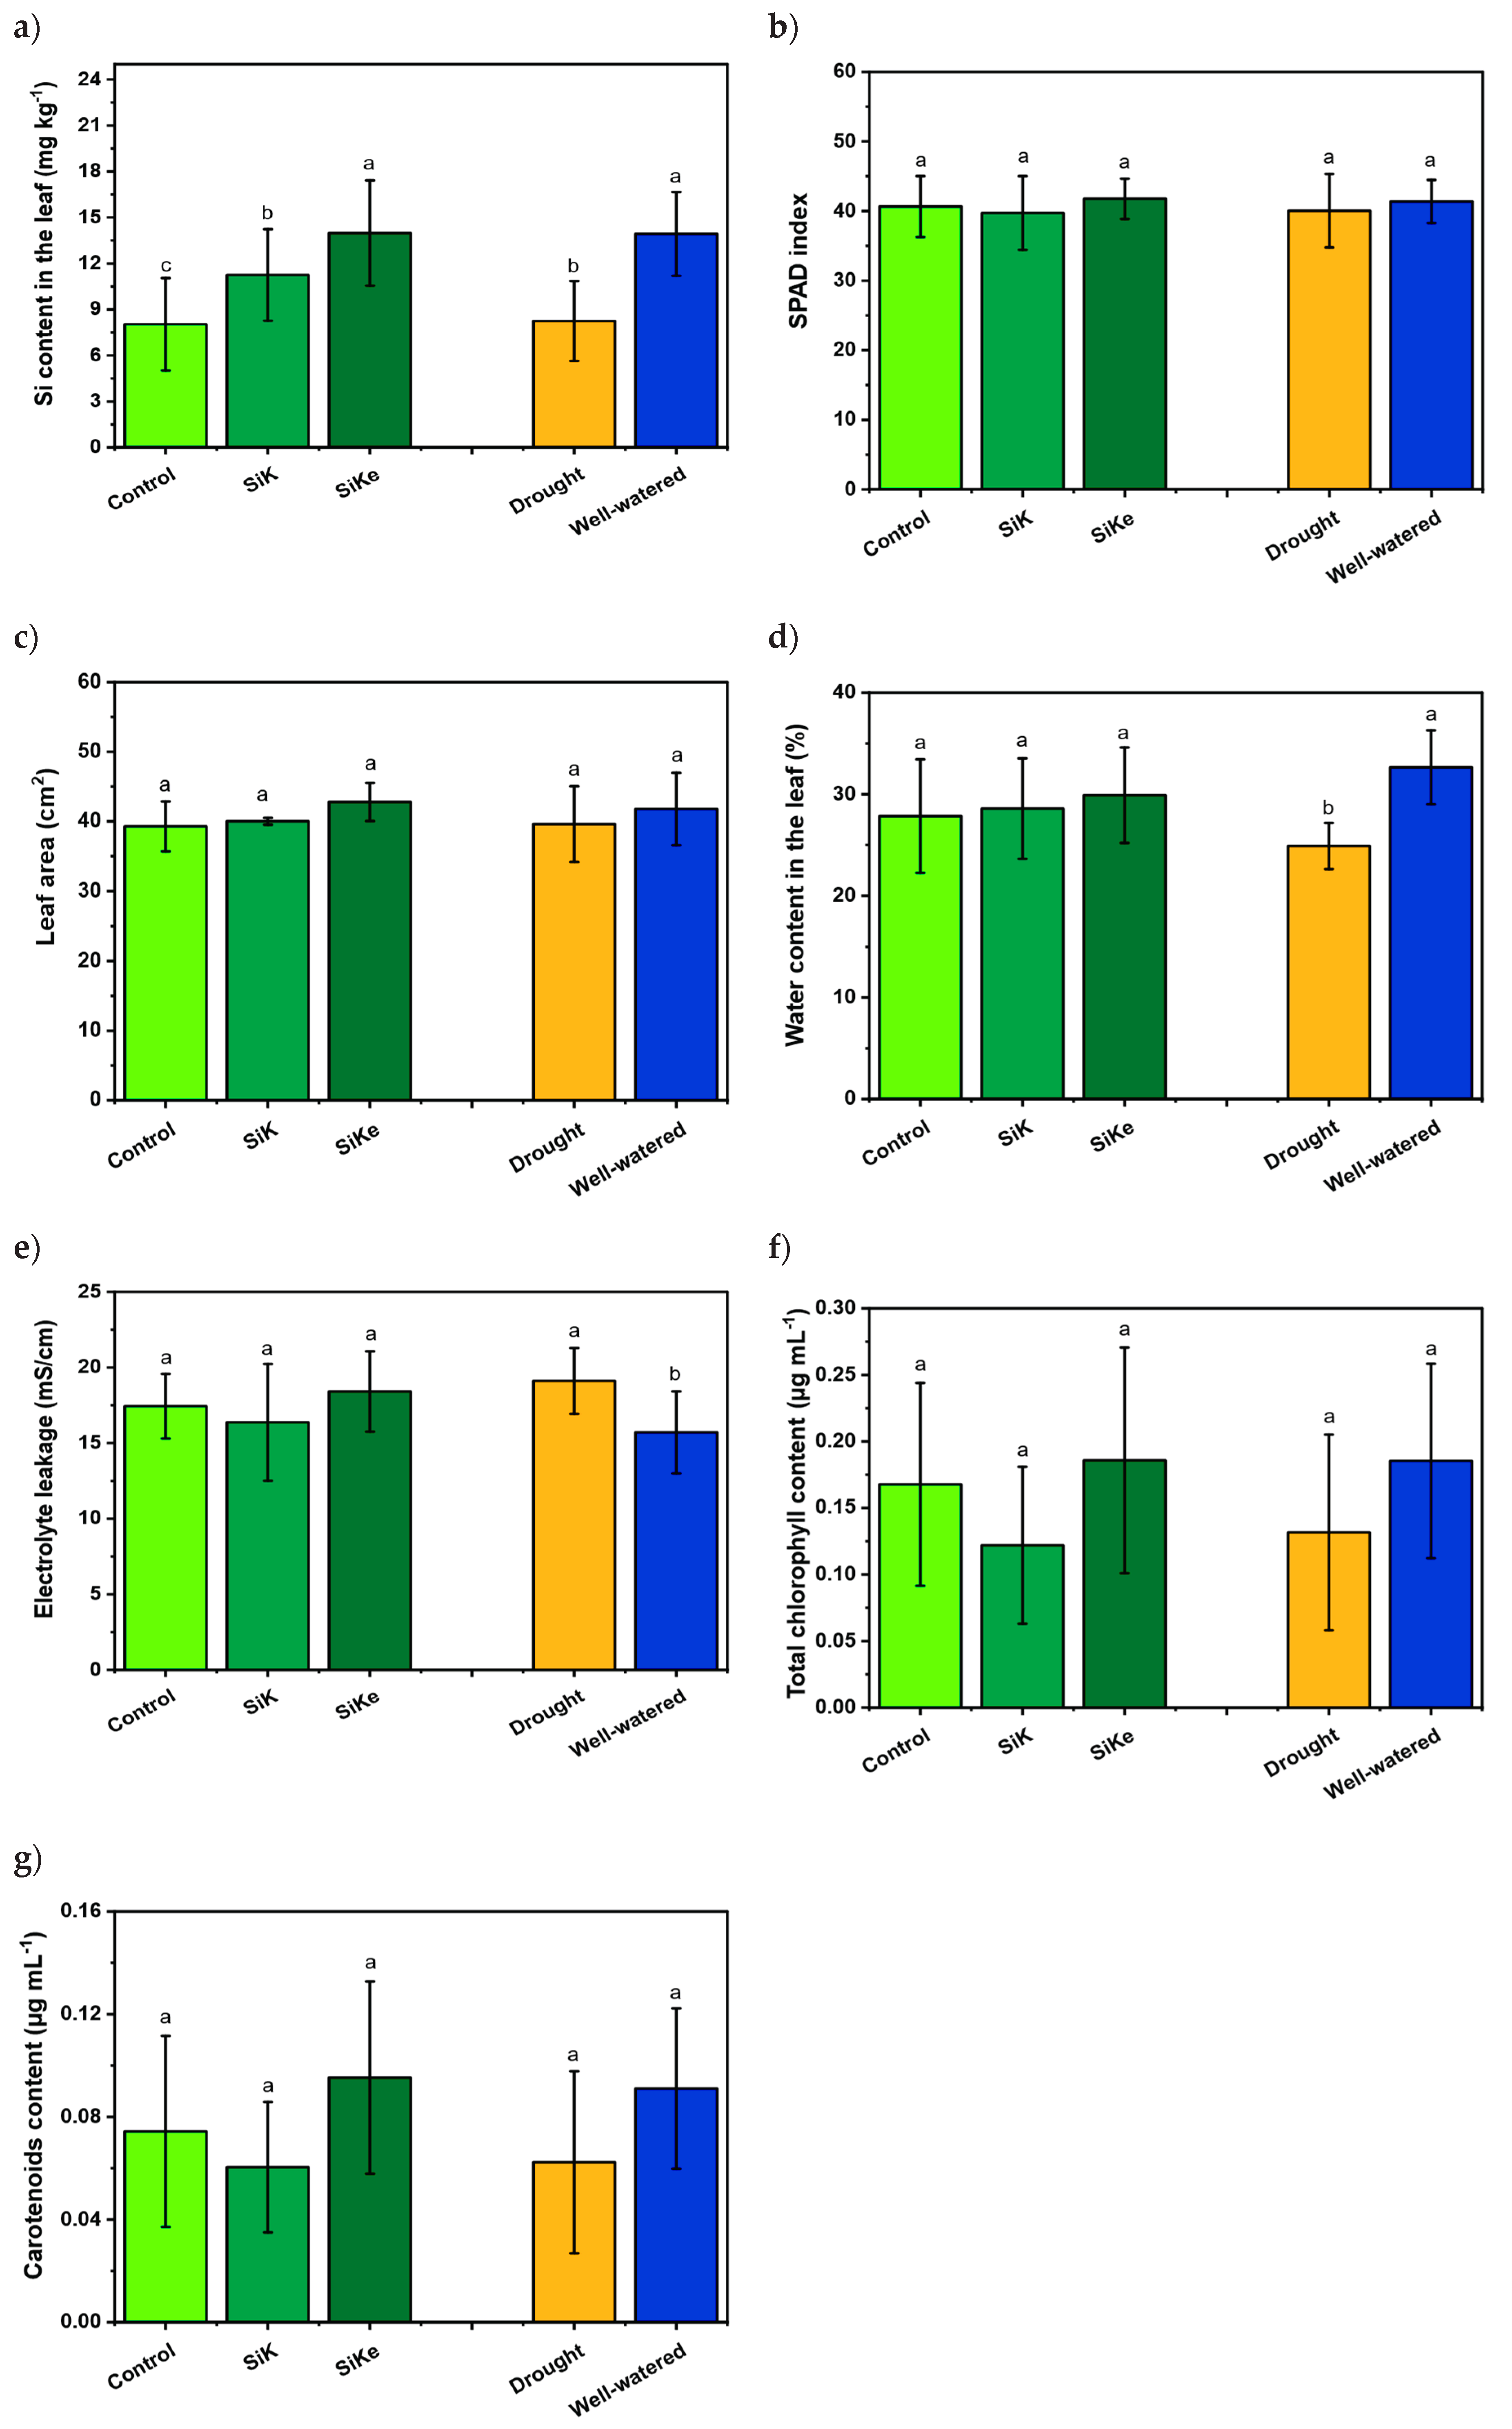
Figure 5.
(a) Proline content; (b) Ascorbic acid content; (c) Total pheophytin content; (d) Total isoflavonoids. Lowercase letters indicate significant differences between the control (with no Si application), potassium silicate (SiK), and potassium silicate stabilized with sorbitol (SiKe) treatments; uppercase letters compare the water conditions (drought and well-watered) within each Control, SiK, and SiKe treatments. Significance was determined at Tukey’s HSD (α = 0.05).
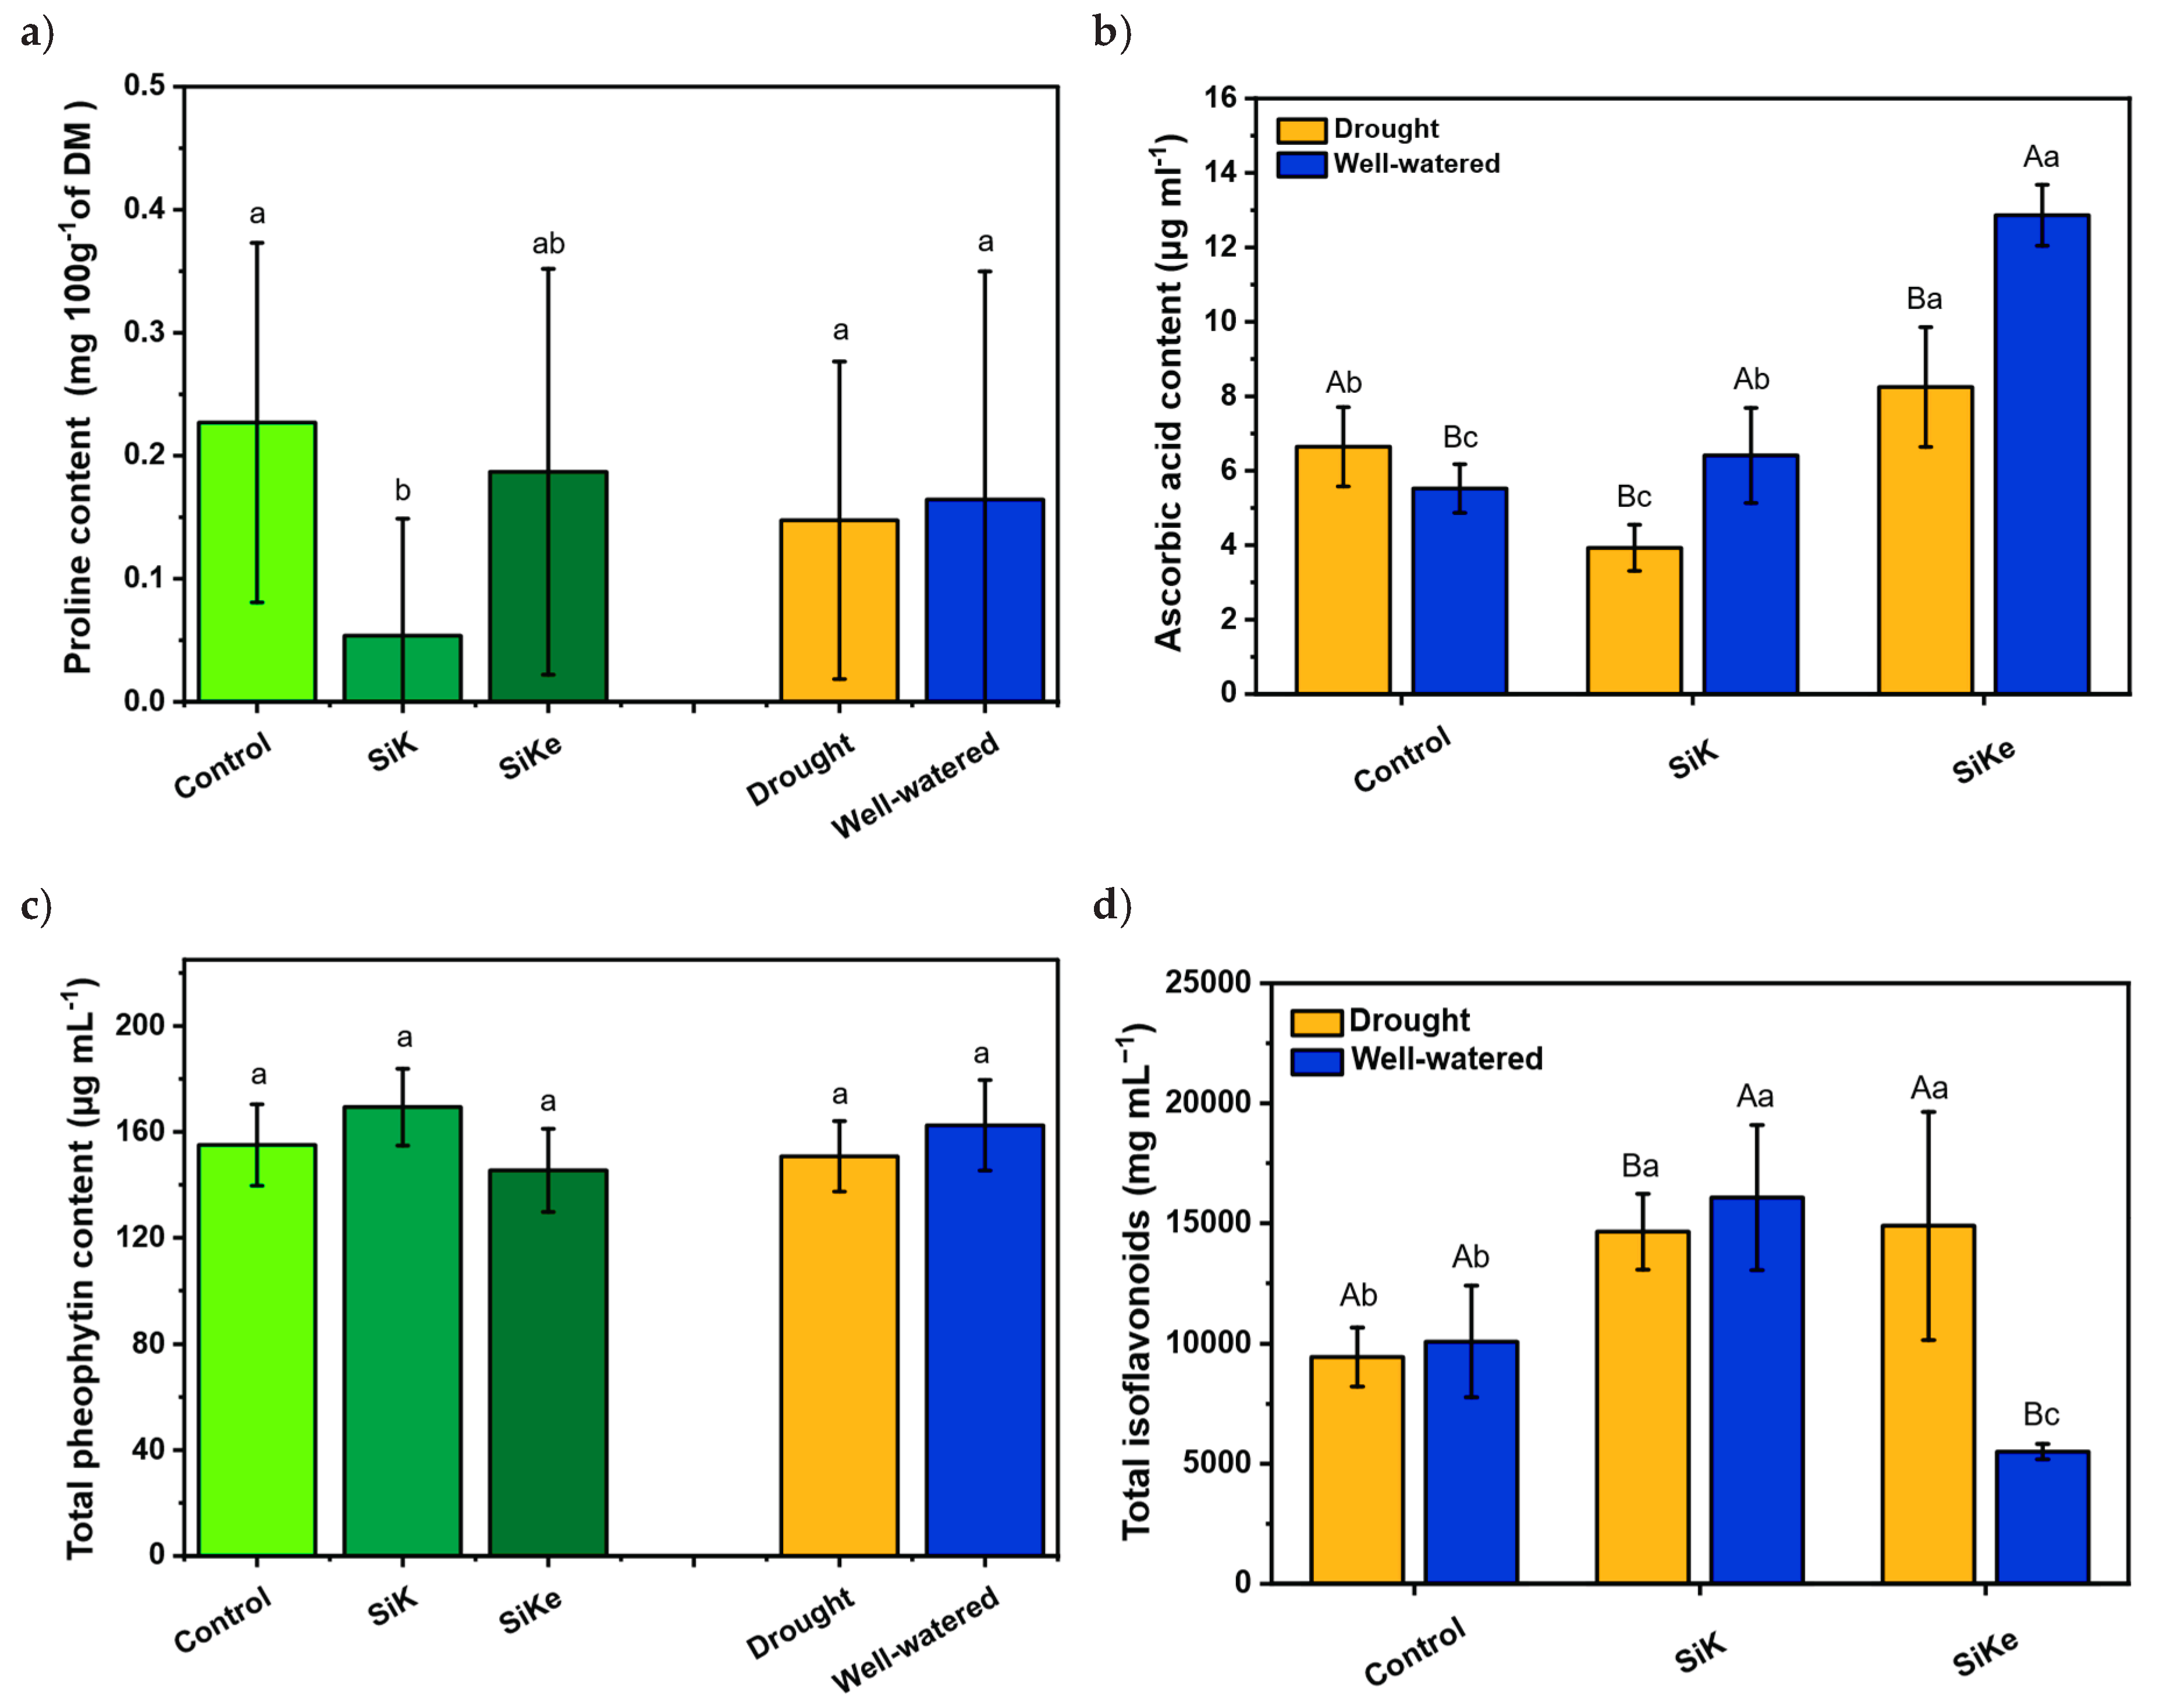
Figure 6.
(a) Daidzein content; (b) Daidzin content; (c) Genistein content; (d) Genistin content. Lowercase letters indicate significant differences between the control (with no Si application), potassium silicate (SiK), and potassium silicate stabilized with sorbitol (SiKe) treatments; uppercase letters compare the water conditions (drought and well-watered) within each Control, SiK, and SiKe treatments. Significance was determined at Tukey’s HSD (α = 0.05).
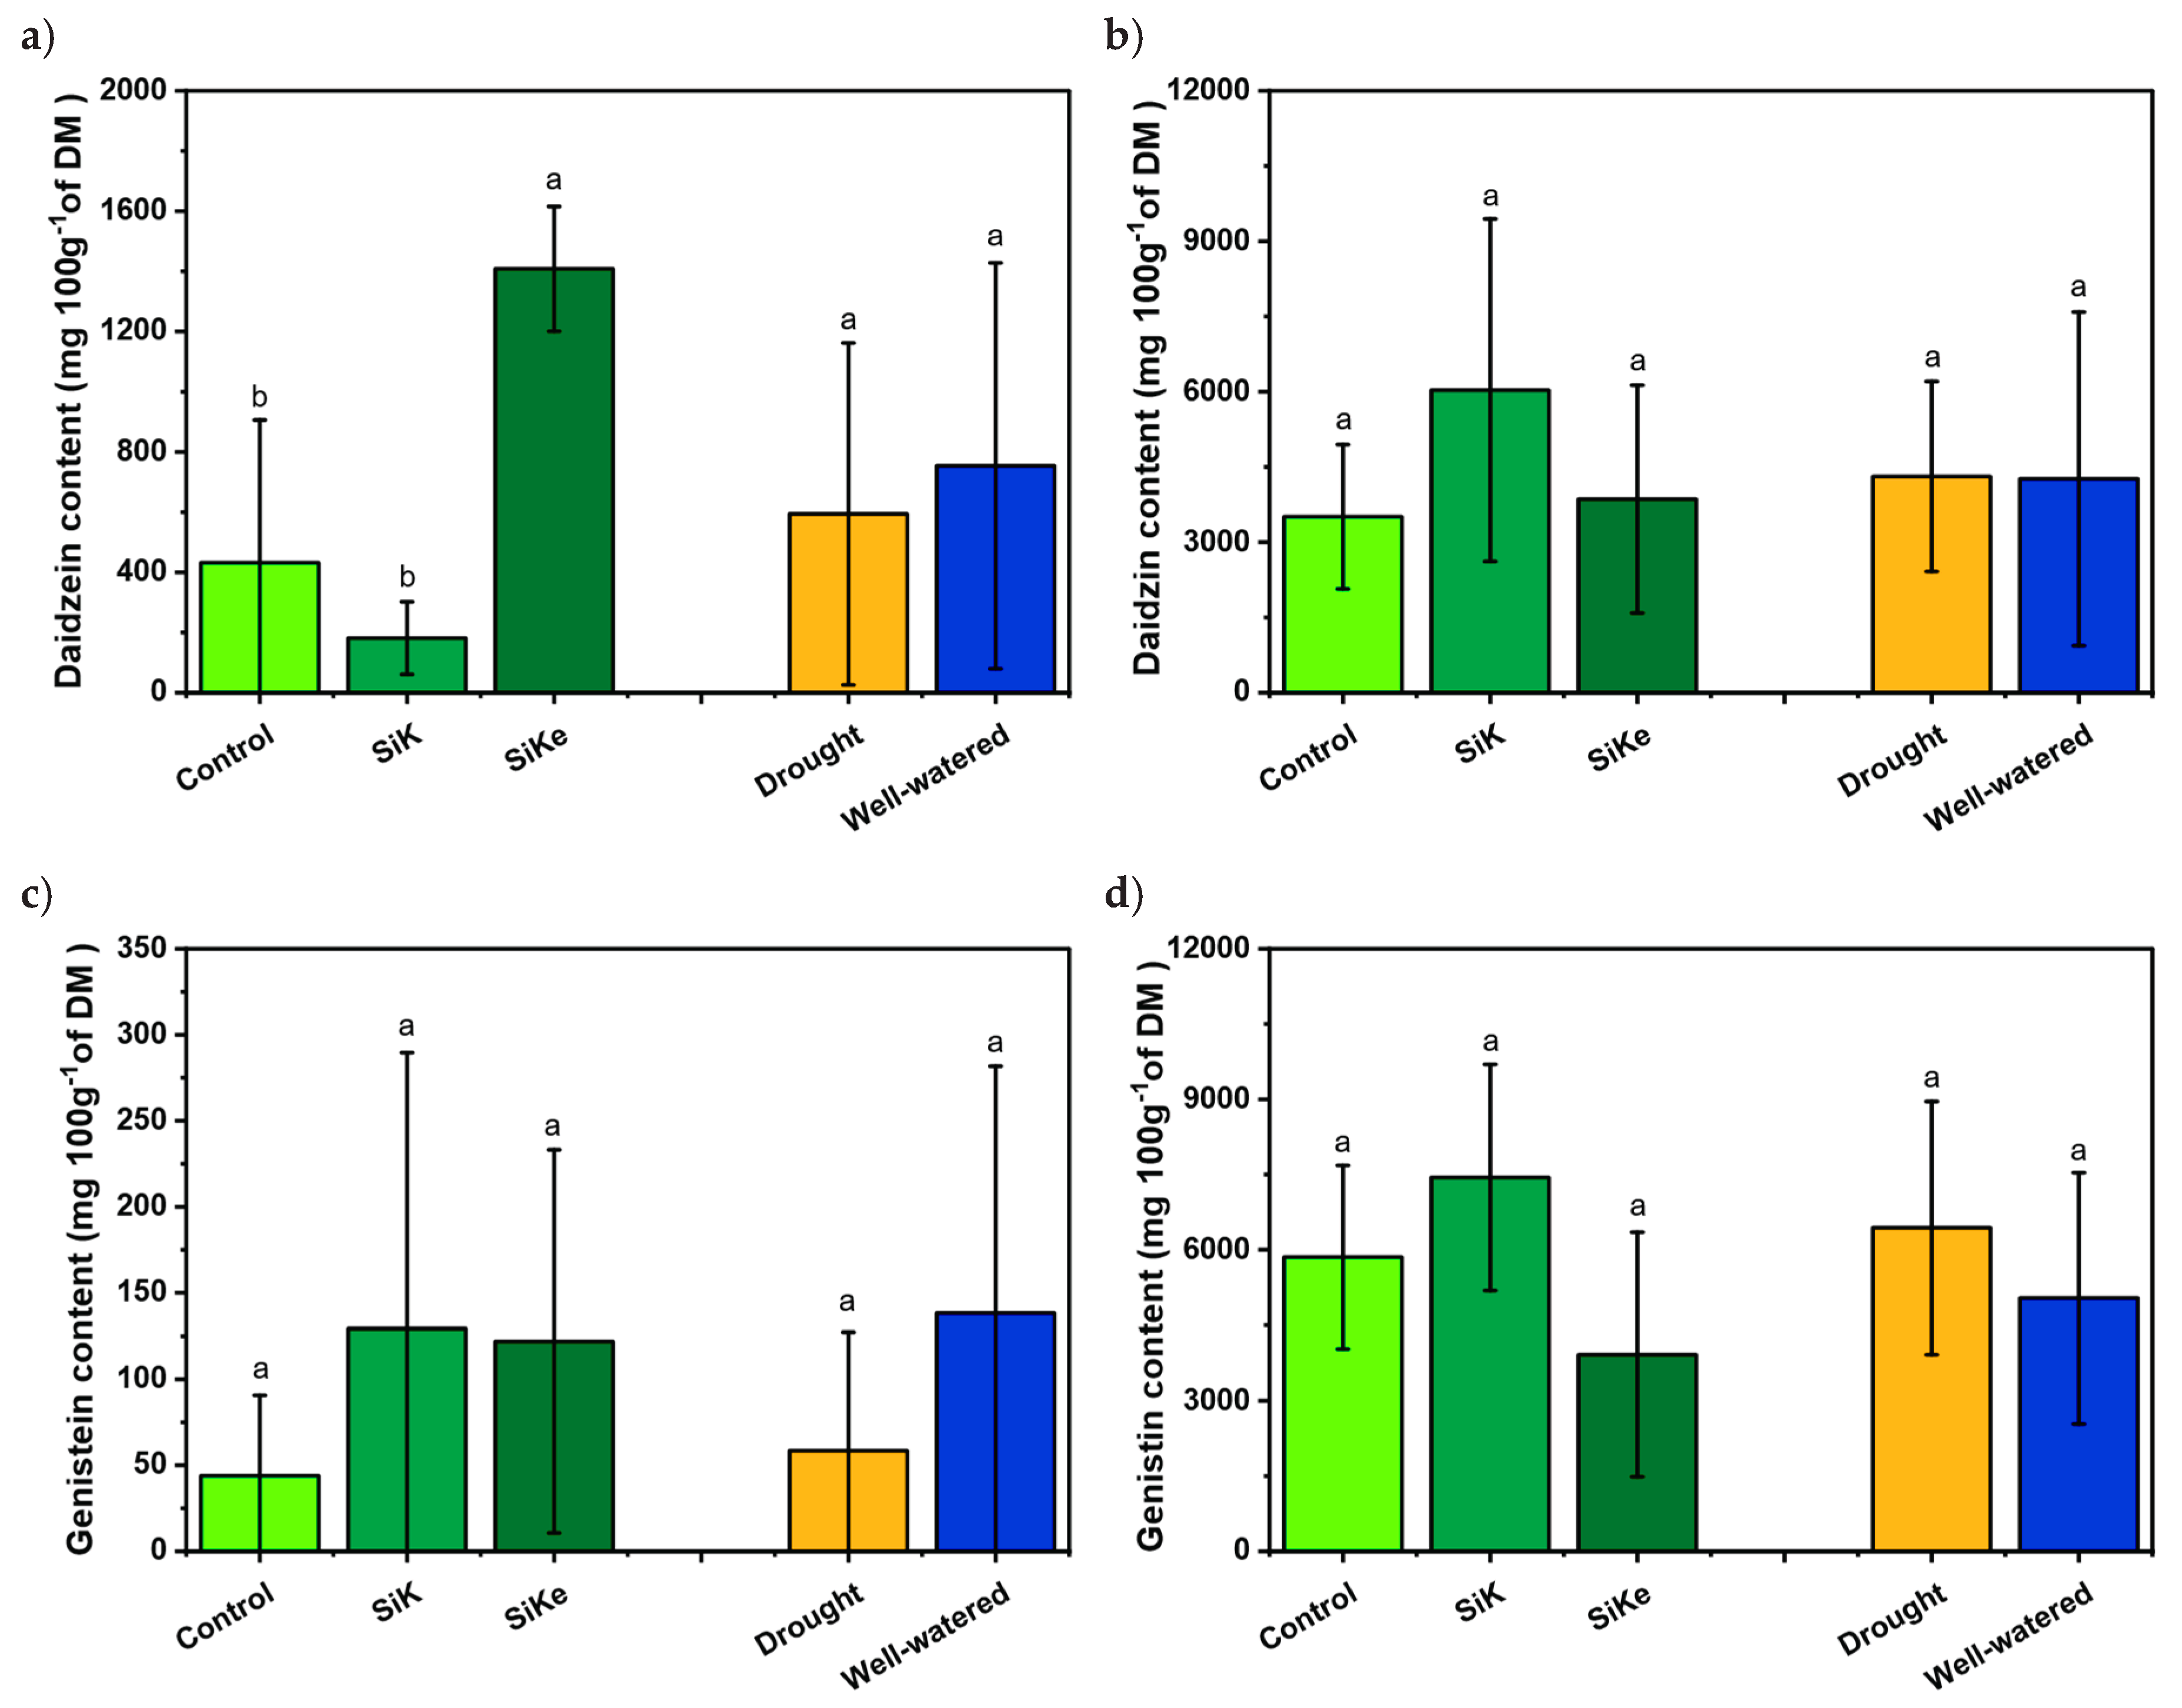

Table 1.
Chemical analysis of the soil used in the experiment.
| pH CaCl2 |
O.M. | P(resin) | S | Ca | Mg | K | Al | H+Al | BS | CEC | BS | m |
| g dm⁻³ | --- mg dm⁻³ --- | --------------------------------- mmolc dm⁻³ ------------- | % | % | ||||||||
| 5.71 | 22.9 | 17.6 | 10.2 | 37.6 | 12 | 3.24 | <0.1 | 14.1 | 52.8 | 66.9 | 79 | 0 |
| B | Cu | Fe | Mn | Zn | Na | Si | Sand total | Silt | Clay | Texture class | ||
| --------------------- mg dm⁻³ -------------------------------- | ------------g kg⁻¹--------------- | |||||||||||
| 0.4 | 1.1 | 25.3 | 38.2 | 2.9 | 9 | <9.7 | 751 | 25 | 224 | Medium | ||
O.M., organic matter; P(resin), phosphorus (resin); S, sulphur (Ca3(PO4)2 0,01 mol L⁻¹); Ca, calcium (KCl 1 mol L-1); Mg, magnesium (KCl 1 mol L-1); K, potassium (resin); Al, aluminium (KCl 1 mol L-1); H+Al, (SMP), BS, base saturation; CEC, cation exchange capacity; m, Al saturation; B, boron (hot water); Cu, cupper (DTPA); Fe, iron (DTPA); Mn, manganese (DTPA); Zn, zinc (DTPA); Na (Mehlich1); Si, silicon (CaCl₂ 0,01 mol L-1) [36].
Disclaimer/Publisher’s Note: The statements, opinions and data contained in all publications are solely those of the individual author(s) and contributor(s) and not of MDPI and/or the editor(s). MDPI and/or the editor(s) disclaim responsibility for any injury to people or property resulting from any ideas, methods, instructions or products referred to in the content. |
© 2025 by the authors. Licensee MDPI, Basel, Switzerland. This article is an open access article distributed under the terms and conditions of the Creative Commons Attribution (CC BY) license (http://creativecommons.org/licenses/by/4.0/).
Copyright: This open access article is published under a Creative Commons CC BY 4.0 license, which permit the free download, distribution, and reuse, provided that the author and preprint are cited in any reuse.


