
Submitted:
12 November 2025
Posted:
13 November 2025
You are already at the latest version
Abstract
Tauopathies are a group of neurodegenerative diseases associated to a pathological, hyperphosphorylated state of the microtubule-associated protein tau which, in the brain, cause a progressive degradation of neuronal connections that lead to overt network-wide functional alterations. Despite the importance of these diseases, no in vitro models have explored tauopathies in the context of network dynamics and functional connectivity. To address this gap, here we considered a tauopathy model using mouse primary cultures in which we compared healthy and tau-affected conditions. For that, we prepared control cultures, cultures treated with extracellular wild–type tau, and cultures exposed with pathological tau (pTau) extracted from the sarkosyl–insoluble fraction of P301S (+/-) mice. To accelerate potential pTau-induced damage, cultures were further transduced with viruses encoding P301L human tau. In all culture conditions, spontaneous activity was monitored along 16 days, and different metrics related to network activity and functional characteristics were analyzed. We observed that the presence of pTau did not cause severe disruptions in neuronal network behavior, with only a mild increase in network bursting activity and a slight strengthening of network-wide communication. We hypothesize that the intrinsic properties of primary neuronal cultures, characterized by prevalent network bursting and homeostatic mechanisms, may mask network-level damage, hence making functional alterations difficult to detect.
Keywords:
neuronal cultures
; tauopathies
; functional connectivity
1. Introduction
The tau protein is a microtubule-associated protein that plays an important role in the central nervous system (CNS) by stabilizing microtubules and facilitating axonal transport [1]. Tau can be expressed in six different isoforms whose proportion varies across spices and brain’s developmental stage [2]. Under pathological conditions tau becomes hyperphosphorylated, detaches from microtubules and assembles into filaments and neurofibrillary tangles (NFTs) known as tau aggregates. As a consequence, neuronal communication is compromised, leading to synaptic loss, altered synaptic plasticity, and disrupted network connectivity [1]. This pathological form of tau (pTau) is observed in a wide spectrum of diseases, including Alzheimer’s disease (AD) [3,?], frontotemporal lobar degeneration (FTLD) [4], and several other forms of dementia [5,6]. The presence of tau aggregates is a shared histopathological trait across tauopathies, a group of neurodegenerative diseases characterized by progressive neuronal dysfunction and cognitive decline. However, the cell types primarily affected by pTau, the distribution of the aggregates in different regions of the brain, as well as the characteristics of the aggregates themselves [7] depend on the particular traits of each disease.
A hallmark of tauopathies is the affectation of micro–scale molecular cues that disrupt fundamental brain mechanisms at the macro-scale, like neuronal activity and functional organization, and that are essential for cognition, memory, and behavior. Indeed, it was shown that insoluble tau filaments affected neuronal excitability and synaptic transmission by altering the balance of intracellular calcium ions [8,9], impairing mitochondrial function [10,11] and promoting the hyperactivity of vulnerable neuronal populations [12]. It was also proposed that aberrant neuronal activity, such as network hyperactivity, could be ascribed to the activation of brain’s compensatory mechanisms against early signs of degeneration [13,14]. However, these mechanisms may exacerbate tau pathology, creating a detrimental positive feedback loop that further drives disease progression.
Despite efforts, the progression of pTau and its underlying mechanisms remain unclear. Some works hypothesized that tau pathology spreads from cell to cell mimicking prion protein (PrP) mechanisms [15,16]. This prion–like hypothesis considers that protein tau misfolds and acquires the ability to act as a template, inducing the misfolded form in healthy counterparts, a process known as seeding [17]. Recent studies have reported that tau filaments, extracted from the sarkosyl–insoluble fraction of human brain tissues affected by AD, have demonstrated the ability to induce seeding in cultured cells [18] and in wild–type mice [19,20]. The prion–like propagation, or spreading of seed–competent tau, might occur through a process that includes a donor neuron, which releases tau seeds via exocytosis. Extracellular pTau is then internalized by a nearby neuron by endocytosis. This process might also occur trans–synaptically, after the degeneration of presynaptic neurons that release pathological tau to the postsynaptic neuron by synaptic vesicles [1,21]. In AD, the process of spreading of the tau pathology is well–documented and occurs in a specific spatiotemporal manner, following the anatomical connections between brain regions [22]. However, in other tauopathies, the patterns of tau pathology propagation varies, exhibiting regional variations or even dependence on specific cell types. Although recent studies have carried out experiments regarding the spreading mechanism of abnormal forms of tau [23,24,25], the details of this process remain unclear.
To advance in the quest of understanding pTau propagation, in vitro studies in the form of neuronal cultures have emerged as accessible experimental models given their controllability and ease of manipulation [26,27]. Specifically, they have been used to study the process of seeding and spreading of pTau [28], mostly using microfluidics devices. These platforms include fluidically isolated chambers interconnected by microchannels that allow the growth of neuronal soma and dendrites separately from axons, facilitating the application of perturbations that mimic disease in specific chambers and the monitoring of disease propagation to other chambers [29,30]. These in vitro studies aim at relating tauopathies, disease spreading and primary neuronal dysfunction, but generally focus on studying changes in neuronal activity at a given time point, typically after pathological tau application. However, there are no in vitro studies investigating the effects of pTau through time–course experiments, neither the evaluation of alterations at the whole network level, i.e., at a dynamic (loss or increase of activity) and at a functional levels.
In the present work, we investigated spontaneous neuronal activity in mouse primary neuronal cultures grown on glass that were pre–treated with either extracellular wild–type (wt) or seed–competent tau proteins (pTau), with a focus on exploring the prion–like hypothesis of pTau propagation. Over a period of 16 days in vitro, we monitored the cultures to examine potential alterations in spontaneous activity and functional organization. Despite efforts, we only observed weak evidences of pTau–induced alterations in network behavior, namely an increase in network activity and a strengthening of network–wide communication. We hypothesize that the characteristic bursting of standard primary neuronal cultures, with neurons locked in a all–or–none activity pattern, combined with homeostasis, masks cellular level alterations or their large–scale impact.
2. Materials and Methods
2.1. Preparation of Sarkosyl–Insoluble Fractions from Mice’ Brains
P301S mice are a transgenic mouse model genetically engineered to overexpress the shortest human tau isoform (0N4R) bearing the P301S mutation. This mutation is associated to an inherited form of frontotemporal dementia (FTD) [31].
Briefly, frozen brains were weighed and homogenized by using a Dounce homogenizer in a proportion of 1:10 of fresh, ice-cold homogenization buffer [ M NaCl, 1 mM EGTA, 10% sucrose, M Na2H2P2O7, M NaF, 2 mM Na3VO4, M -glycerolphosphate, M Tris-HCl, pH ] supplemented with protease inhibitors (Hoffmann-La Roche, Basel, Switzerland). After centrifugation at rpm for 22 min at 4 °C, the resulting supernatant (SN1) was collected. The pellet was then resuspended in a proportion of 1:5 with homogenization buffer and centrifuged again at rpm for 22 min at 4 °C. The resulting supernatant (SN2) was combined with the SN1, and the mixture (SN1 + SN2) was incubated with % sarkosyl (Sigma-Aldrich, St. Louis, MO, USA) on a rotating shaker at room temperature for 1 h. The mixture was centrifuged at rpm for 63 min at 4 °C. The supernatant was discarded, and the remaining pellet (sarkosyl-insoluble fraction), resuspended in 50 mM Tris-HCl, pH (L/g starting material), aliquoted and stored at °C until use. Protein concentrations were determined using the Pierce™ BCA assay kit (Sigma-Aldrich, St. Louis, MO, USA), and equal amounts of protein were analyzed by immunoblot.
2.1.1. Dodecyl Sulfate-Polyacrylamide Gel Electrophoresis
Samples were characterized through dodecyl sulfate-polyacrylamide gel electrophoresis (SDS-PAGE). Sarkosyl-insoluble fractions were mixed with Laemmli sample buffer (Bio-Rad, California, USA) and denatured for 10 min at 100 °C. The obtained solutions were then loaded on 10% SDS-PAGE gels and electrophoresed using a constant voltage of 60 V for 15 min, followed by 100 V for 1 h.
2.1.2. Western Blot
The proteins were transferred onto nitrocellulose membranes through electrophoretic transfer, run at 100 V for 1 h. Following transfer, the membranes were blocked with 5% fat-free milk in Tris-buffered saline containing % Tween 20 (TTBS, Sigma-Aldrich, St. Louis, MO, USA) for 1 h at room temperature. Membranes were incubated overnight with a buffer containing TTBS, % azide and the primary antibodies mix [mouse anti-4R-tau (1:) (Merck Millipore, catalog no. 05-804), mouse anti--Tubulin (1:) (BioLegend, catalog no. 801201)] at 4 °C on a shaker. After that, membranes were washed three times with TTBS and incubated with the appropriate secondary antibody conjugated with horseradish peroxidase, which was diluted at 1: proportion in 5% fat-free milk in TTBS for 1 h at room temperature. Subsequently, the membranes were rinsed three times with TTBS for 10 min each. Finally, membranes were revealed with the ECL-plus chemiluminescence western blot kit (Amersham-GE Healthcare, United Kingdom).
2.2. Preparation of Primary Neuronal Cultures from Embryonic Cortical Mice
Tissue manipulation and neuronal cultures were prepared in accordance to the regulations of the Ethical Committee for Animal Experimentation of the University of Barcelona (approved ethical order B-RP-094/15–7125 of 10 July 2015) and the laws for animal experimentation of the Generalitat de Catalunya (Catalonia, Spain).
Prior cell culturing, 13 mm coverslips (#1 Marienfeld-Superior, Germany) were cleaned in 70% nitric acid for 90 minutes, rinsed twice in double–distilled water and then sonicated in a 96% ethanol bath for 20 minutes. Coverslips were flame–dried and attached to Polydimethylsiloxane molds (PDMS, Dow, Corning, Midland, Michigan, USA) made of a 1 mm thick PDMS layer 13 mm in diameter that contained two circular cavities 4 mm in diameter each. The PDMS strongly bond the glass coverslips during subsequent autoclaving, effectually shaping twin PDMS cavities over a glass substrate (Figure 1). The PDMS molds contained two 4 mm wells in order to facilitate the simultaneous recording of two independent wells, therefore doubling statistics in a single recording. The glass-PDMS combinations were placed onto 4-well plates (Thermo Scientific Nunc) and treated overnight with a 10 mg/mL Poly-L-Lysine (PLL, Sigma-Aldrich) to facilitate posterior cell attachment and a homogeneous distributions of neurons on the glass.
Cortical tissue from CD1 mouse embryos at day 16 of development (E 16) was extracted, mechanically dissociated through repeated pipetting and plated in the PDMS–glass systems ( Figure 1a). Mice were provided by Charles Rivers (Saint Germain Nuelles, France). Dissections were conducted in L-15 medium (Gibco, ThermoFisher Scientific, Waltham, MA, USA) previously enriched with 4% glucose 1 M, 1% glutamax (Sigma-Aldrich, St. Louis, MO, USA) and % gentamicin (Sigma-Aldrich, St. Louis, MO, USA). Dissociated neurons initially developed on ‘plaiting medium’ [90% Eagle’s MEM-enriched with % glucose, 1% 100X glutamax, and g/mL gentamicin, with 5% horse serum, 5% fetal calf serum and L/mL B27]. Isolated neurons were plated with a final concentration of cells/mL.
At day in vitro (DIV) 1, the genetically encoded fluorescent calcium indicator GCaMP6s (AAV9.Syn.GCaMP6s.WPRE.SV40, Addgene) was incorporated into the cell culture via viral transduction through adeno–associated viruses (AAVs), which expressed the calcium indicator under the synapsin-I promoter of mature neurons, as illustrated in Figure 1a. At DIV 5, plating medium was switched to ‘changing medium’ [90% Eagle’s MEM-enriched with % glucose, 1% 100X glutamax, and g/mL gentamicin, with 10% horse serum and % FUDR] to stop glial cells proliferation. Medium was then changed at DIV 7 to ‘final medium’ [Enriched 90% Eagle’s MEM with a 10% horse serum] and refreshed every two days. Cultures were incubated at 37 °C, 5% and 95% humidity.
The prepared cultures contained both neurons and glial cells, but only neuronal activity was monitored through the GCaMP6s indicator, as described later. All cultures contained 80% excitatory neurons and 20% inhibitory ones [32].
2.2.1. Emulation of Thaopaties In Vitro I: Sarkosyl Insoluble Fraction of P301S Mice
In a first group of experiments, a potential pathological state was induced in the neuronal cultures through the administration of extracellular tau, obtained from the sarkosyl insoluble fraction of P301S mice cells, and network behavior was compared with the corresponding wild–type controls. Treatments were administered at DIV 5, when culture medium was switched from ‘plating’ to ‘changing’. The experimental conditions, summarized in Figure 2a, were:
- Standard culture (Std): Neurons developed following the standard laboratory protocol. These measurements provided a reference for normal network development and activity that could be compared with treated cultures.
- Wild–type extracellular tau (WT): Medium containing P301S (-/-) insoluble-sarkosyl fraction, which was hypothesized to be innocuous, was administered to the cultures.
- Pathological extracellular tau (pTau): Medium containing potentially harmful hyperphosphorilated tau, derived from P301S (+/-) insoluble-sarkosyl fraction, was administered to the cultures.
The considered treatments were administered only once and were not refreshed with media changes. This decision was based on evidence indicating that tau protein is internalized by cells within 24 hours of exposure [33,34]. Previous studies demonstrated that a single treatment with tau is sufficient for cellular uptake, rendering repeated treatments unnecessary. By administering tau only once and waiting for about 3 days for culture medium replacement, we ensured that the cells had a sufficient time window to internalize the protein. Treatment concentrations were tested and adjusted to 10 g/mL of total protein. A total of 60 cultures (containing each two 4 mm wells) from 9 different dissections were considered. From them: 18 were Std, 19 WT, and 32 pTau.
2.2.2. Emulation of Thaopaties in vitro II: P301L Mutated Tau Delivered Through AAVs
In a second group of experiments, damage was potentially accelerated by transducing the cultures at DIV 1 with viral particles encoding full-length human tau with the P301L mutation (AAV-P301L) under the control of the Syn1 promoter. Then, at DIV 4, cultures were treated with the P301S insoluble fraction of sarkosyl (WT or pTau) coinciding with medium change, as above. As summarized in Figure 2b, the considered conditions in this group of experiments were:
- Standard culture (Std): Neurons developed following the standard laboratory protocol.
- Viral P301L condition (vStd): Cells were infected at DIV 1 with AAV-P301L to induce expression of P301L-mutated tau. From this time point onwards, cultures were manipulated as in standard conditions.
- Viral P301L + wild–type tau (vWT): Cells were infected with the AAV-P301L at DIV 1. At DIV 5, P301S (-/-) insoluble sarkosyl fraction was included.
- Viral P301L + pTau (vpTau): Cells were infected with the AAV-P301L at DIV 1. At DIV 5 P301S (+/-) insoluble sarkosyl fraction (pTau) was included.
As in the previous protocol, all treatments with P301S insoluble sarkosyl fraction were delivered only once at a concentration of 10 g/mL. A total of 37 cultures (containing each two 4 mm wells) from 4 different dissections were prepared. From them, 9 were Std, 7 P301L, 7 v-WT, and 14 v-pTau.
2.3. Data Acquisition and Analysis
2.3.1. Calcium Fluorescence Imaging
Spontaneous activity in the designed conditions was monitored every two days along a 2–week period. Recordings commenced at DIV 7, when fluorescence calcium signal was sufficiently strong, and ended at DIV 16, when cultures in standard conditions degraded and detached from the glass. Activity was recorded on a Zeiss Axiovert C25 inverted microscope equipped with a calcium imaging setup and a high–speed CMOS camera (Hamamatsu Orca Flash 4.1) that provided an image size of pixels and a 8-bit grey scale levels. Two 4 mm wells were recorded simultaneously by combining of a X objective and an optical zoom (Figure 1b), providing a spatial resolution of m/pixel. Recordings were carried out for 15 min at 33 frames per second.
2.3.2. Data Analysis and Event Detection
Calcium imaging recordings were analyzed with the software Netcal [35] run in Matlab. For analysis, a set of 900 Regions of Interest (ROIs) were first set on each of the twin 4 mm cultures, shaping a circular grid centered at the culture (Figure 1c, left). Each ROI had a typical size of m and contained about neurons. The average fluorescence intensity of each ROI i along the 15 min recording was next extracted, corrected from drifts and normalized as , where is the fluorescence level at rest (Figure 1c, center).
The fluorescence trace of each ROI was converted into time series representing neuronal activity using the Schmitt–trigger method [36]. This method identifies an activity event whenever the fluorescence intensity remains above a higher threshold for at least 100 ms and subsequently drops below a lower threshold. The resulting train of detected events (‘1’ for the presence of activity and ‘0’ for its absence) for each ROI in the culture was presented as a raster plot (Figure 1c, right), which provided the main dataset for subsequent dynamical and effective connectivity analyses.
2.3.3. Networks Dynamical Characteristics
The collective behavior of the neuronal cultures, visualized as raster plots, was analyzed to obtain a series of descriptors that were related to the capacity of the neuronal cultures to show activity. Thus, they helped to assess possible alterations due to neurodegeneration. These descriptors included the population activity, the velocity of propagation fronts and the inter–burst interval
(i) Population activity: Denoted as PA, it quantified the tendency for the neurons in the network to activate together in a short time window. It ranged from 0 (no collective activity) to 1 (full network activation). The latter conceptually corresponded to vertical bands of activity in the raster plots. To calculate PA, a sliding window 1 s wide scanned the raster plot in s steps and counted the number of independent ROIs in the network that activated within the window. The resulting number was then divided by the total number of ROIs to obtain the fraction of the network that activated together. Sharp peaks in PA indicated strongly coordinated activity and were referred as network bursts. These bursts were considered significant whenever their amplitude, denoted as PAb, satisfied the condition , where and represented the mean and standard deviation of the background activity, respectively. Typically, significant bursts were those with , i.e., 10% of the network. All significant burst amplitudes , across repetitions and under a specific experimental condition, were pooled together to create the distribution of amplitudes, which were compared across different experimental conditions.
(ii) Propagation velocity of network bursts: Denoted by v, it quantified the speed of the propagation of information throughout the network, which ultimately depended on the connectivity of the network. The velocity was determined by taking advantage of previous studies that showed that neuronal cultures grown on glass displayed network bursts that propagated as circular fronts from an origin termed ‘burst initiation point’ [37,38]. The velocity was then estimated by plotting the Euclidean distance of each ROI i relative to the origin of activity, , as a function of the time of activation of the ROI. The slope of the linear fit provided the average velocity.
(iii) Inter-burst interval: Denoted as IBI, it was defined as the average time elapsed between two consecutive networks bursts, and was calculated as , where is the activation time of each burst k.
2.3.4. Effective Connectivity Analysis and Network Measures
Causal relationships between pairs of ROIs’ activity were determined using a modified version of Generalized Transfer Entropy (GTE) implemented in Matlab, as described in [39,40,41]. To carry out the analysis, binarized vectors of neuronal activity trains for each ROI were built, with each vector containing the 15 min recording in 20 ms bins whose values were either 1 (presence of an activity event) or 0 (absence of activity). An effective connection from ROI I to ROI J was inferred whenever the information contained in I significantly improved the prediction of future states of J. Instant feedback was present and Markov order was set to 2 [40]. The significance of the inferred connections was established by comparing the transfer entropy estimate with the joint distribution of all input X to J and output I to Y (for any X and Y), as
where and are the average value of the joint distribution and its standard deviation, respectively. A connection was then deemed significant for , setting the corresponding effective connection to ‘1’ (presence of an effective link); otherwise the connection was set to ‘0’ (absence of an effective link). The threshold value of 2 was considered optimal to capture both direct neuron–to–neuron interactions and whole network communication [38,39].
The final effective connectivity networks were directed but binary, and were stored in an adjacency matrix for the computation of the following network measures using the Brain Connectivity Toolbox [42] run in Matlab.
(i) Global efficiency It captured the capacity of the network to exchange information as a whole [43], and was defined as
where N is the number of ROIs and the shortest topological path connecting ROIs i and j, with non-connected ROIs procuring . varied between 0 and 1. A value of indicated that the network was an ensemble of disconnected ROIs, while indicated that any neuron immediately communicated with any other, i.e., information was swiftly exchanged at a global scale.
(ii) Community statistic Q: It captured the tendency of neurons to form functional communities, i.e., groups of neurons that were more connected within their group than with the rest of the network. Q was defined as: [44]
where N is the number of ROIs, is the matrix of effective connections, is the sum of the links attached to neuron i, is the community to which neuron i belongs, and is the Kronecker Delta with for and 0 otherwise. Optimal community structure was extracted using the Louvain algorithm [44]. Q varied between 0 and 1, where indicated the absence of communities, i.e., the entire network was a group by itself, while a value indicated that each ROI was a community, i.e., a fully disconnected network. A values of typically indicated the presence of well–defined communities in the network [38].
3. Results
3.1. Sarkosyl-Insoluble Fractions from P301S Mice’ Brains Contain Phospho-Tau and Tau Filaments
The tau biosensor cell line has served as a reliable source to investigate the presence of proteopathic seeding activity —abnormal protein folding, aggregation, or accumulation— in biological specimens since its development in M. I. Diamond’s laboratory in 2014 [45]. This engineered cell line expresses a fusion of the tau repeated domain with the disease–associated P301S mutation, coupled to either the cyan or yellow fluorescence proteins. The addition of extracellular seed–competent tau increases the recruitment of fragments of this protein present in the biosensor cell line, leading to the formation of intracellular inclusions that can be quantified via flow cytometry or fluorescence imaging.
In this context, and in order to ascertain the presence of seed–competent tau species prior use in spontaneous activity recordings of primary neuronal cultures, we followed the ‘protocol I’ described in Methods and analyzed sarkosyl–insoluble fractions obtained from the brains of P301S (+/-) mice at DIV 12. In addition, P301S (-/-) sarkosyl–insoluble fractions were also analyzed to ensure the absence of pathological inclusions. As a control, we considered empty liposomes used as vehicles. The results of the analysis, shown in Figure 3, indicate that only P301S (+/-) treatment triggered the formation of fluorescent inclusions (white arrowheads on the left panel), whereas the P301S (-/-) and the vehicle preparations did not. Therefore, these results confirmed the presence of pathological tau protein in sarkosyl–insoluble fractions extracted from P301S (+/-) mice brains.
3.2. Cortical Neurons in Culture Express P301L Human Tau
We verified through a western blot analysis that virally–transduced cells expressed human tau (data not shown). Additionally, we also assessed the capacity of human P301L to form insoluble tau aggregates. For that, we considered the ‘protocol II’ described in Methods and prepared the four different conditions described. At DIV 16, cells were fixated, treated with methanol to remove soluble tau, and immunolabeled with the anti-HT7 antibody (green) to stain insoluble tau as well as Hoechst (blue) to stain cell nuclei. As shown in Figure 4c-e, insoluble tau was only present in the P301L(+/-) pTau condition. We therefore confirmed that cells in culture both expressed P301L human tau and had the capacity to form insoluble pathological aggregates.
3.3. Activity and Connectivity in Neuronal Cultures Treated with P301S Sarkosyl–Insoluble Fraction
We investigated whether mice primary cortical cultures exhibited significant alterations in both dynamics and effective connectivity when P301S sarkosyl–insoluble fraction was introduced into the culture medium. As described in Methods, data was obtained from calcium imaging spontaneous activity recordings at different developmental time points, from DIV 7 to DIV 16 every approximately two days.
3.3.1. P301S (+/-) Sarkosyl–Insoluble Fraction Does Not Alter Networks Dynamics
Three different scenarios were considered: Std, which corresponds to the standard culturing protocol without any treatment; WT, in which the cultures were treated with extracellular wild–type protein tau; and pTau, in which extracellular pathological tau (obtained from P301S (+/-) sarkosyl insoluble fraction) was administered.
Calcium fluorescence recordings of spontaneous activity in the three conditions were analyzed and the detected neuronal activity events were plotted in the form of raster plots. Figure 5 shows illustrative raster plots and the corresponding network population activity (PA) for each of the explored conditions at DIV 12, i.e., one week post-treatment. While the raster plots portray the collective activity of the network, the population activities highlight the fraction of neurons in the network that tended to activate together in a short time window. Peaks in PA therefore indicate network bursts, a characteristic feature of neuronal cultures grown in flat two–dimensional substrates [37]. Results show that, at DIV 12, cells exposed to pTau (Figure 5, right column) substantially increased their frequency of bursting as compared to Std and WT, with pTau cultures reducing by almost a factor two the time spanned between consecutive bursts, a measure known as inter–burst interval (IBI). These pTau cultures also generated stronger bursts (higher PA peaks). The strengthening of collective activity and the easiness for burst generation suggest that pTau cultures reached a hyperexcited state in which neuronal activity and broad network communication was favored.
To ascertain whether such a possible hyperexcited state of pTau cultures was consistent along time, we inspected the evolution of both PA amplitudes and IBIs from DIV 7 to 16 for the three conditions. Figure 6a, left, provides the evolution of PA with DIV. Although a clear trend cannot be extracted, the data indicates that, up to DIV 12, the healthy conditions (WT and Std) started with relatively high PA amplitudes that gradually reduced, while the pTau cultures experienced the opposite trend. After DIV 12, cultures showed sudden changes in behavior. For instance, cultures with wild–type tau considerably increased PA value at DIV 16, indicating enhanced synchrony in those cultures. Since DIV 12 was the last time point of a consistent trend between conditions, we took it to statistically compare the obtained data at the same developmental stage. Figure 6a, right, shows the distribution of culture–averaged PA values across conditions. At this time–point, although pTau cultures had on average higher PA values than Std, there were no statistically significant differences across conditions, with , and .
On the other hand, the analysis of the average IBI at different time–points (Figure 6b, left) revealed differences between untreated cultures and those seeded with pTau. Overall, the IBI tended to gradually decrease for Std and WT cultures as they matured (from s to s), but for pTau it was about 30 s at DIV 7 and remained low toward most of the evolutionary stages. This low IBI is in accordance with the high frequency of bursting previously described in Figure 5. The statistical comparison of data at DIV 12, shown in Figure 6b, right, exposes the strong fall of the IBI for pTau and evinces significant differences (though weak) between pTau–treated cultures and Std, although not between pTau WT, with , and .
To complete the analysis of dynamical changes, we also computed the velocity of network bursts propagation in the neuronal cultures. The velocity is a useful descriptor since the higher the connectivity among neurons, the faster the propagation of information across the network [46]. Thus, the velocity provides an indirect dynamical measure of possible network alterations upon pTau treatment. As described in Methods, the velocity was measured by analyzing, for each burst, the activation time of the regions of interested in relation to their spatial location. Figure 7a shows spatiotemporal patterns of bursts propagation and the extracted velocities, while Figure 7b shows the time evolution of computed velocities (averaged over network bursts and experimental repetitions). The time evolution shows that, for all three conditions, the velocity gradually decayed with culture time, although the decay was stronger for Std ad WT, indicating that pTau retained a capacity to propagate information faster and that is probably linked to its hyperexcited state. However, at DIV 12, the comparison of distribution of velocities for the three conditions (Figure 7c) did not show significant statistical differences, with , and .
Overall, the results show that the Std and WT cultures exhibited similar trends in dynamic behavior that departed, though not very strongly, from pTau ones. The trends for Std and WT suggest that cultures underwent a change in their dynamics from DIV 7 to DIV 12 that is associated with their natural development in vitro, in which neurons self-organize to increase and stabilize their connectivity as they mature [47]. We hypothesize that this steady developmental process is slowed down or disrupted in the pTau cultures, which maintain an excessively connected or hyperexcited state. However, with the data at hand and the statistical comparisons, we cannot verify such a hypothesis and therefore conclude that no overt dynamical alterations can be attributed to the presence of pTau in the cultures.
3.3.2. Presence of P301S Extracellular Pathological pTau Does Not Alter Effective Connectivity
To provide additional analyses to determine whether pTau altered network formation and functional organization, we carried out a network analysis of the spontaneous activity recordings to extract effective connectivity matrices and key network topological characteristics.
Figure 8 shows examples of effective connectivity matrices for the three conditions. All of them exhibit a similar functional behavior with a comparable number of communities and interconnectivity, with a global efficiency around in the three conditions. Thus, healthy and pathological cultures appeared to establish connections and an overall communication that seemed indistinguishable from one another. The only difference that could be appreciated was in the community statistic Q, which was much larger for the Std condition () than for the others ( and ). This larger value indicates that communities in the Std condition were relatively more segregated, i.e., neurons more frequently tended to exchange information within their group rather than across the entire network, whereas for the WT and pTau the behavior was the opposite.
The fact that the illustrative pTau culture of Figure 8 portrays the lowest Q indicates that neurons in this culture were the most integrated, tending to exchange information globally, a result that by itself is again compatible with a hyperexcited state. To ascertain whether this hyperexcitability held with all the data at hand, we plotted the evolution of and Q along DIV (Figure 9a) as well as the distribution of these metrics at DIV 12 including all replicates (Figure 9b). Clearly, both and Q measures had a similar evolution with no statistically significant differences at DIV 12. One could argue that the Std culture exhibited, on average, the lowest and the highest Q, i.e., this condition portrayed the most segregated networks of all. One could then hypothesize that tau (in either wild-type or pathological form) affected the behavior of neuronal cultures to make them more excitable and network-wide communicative, but the data is not sufficiently conclusive.
3.4. Accentuation of Damage in Culture by Incorporating the P301L Mutation
The above results indicated that no significant alterations could be observed in the dynamics or functional organization of pTau cultures. We therefore speculated that the lack of observable effects could be attributed to the fact that the cultured neurons were young and wild–type, whereas it is well–documented that aging represents one of the foremost risk factors for sporadic forms of AD and other neurological disorders [22,48]. In an effort to accelerate damage in in vitro, we induced the over-expression of the P301L mutant tau isoform to predispose the primary neurons to a more pathological scenario prior treating them with extracellular tau. To this end, and as described in Methods, we transduced primary cortical cultures with AAV-P301L at DIV 1 and confirmed by biochemical analysis that they over-expressed P301L tau. In these novel culture conditions, neurons were not only exposed to extracellular pathological tau but were also capable of generating P301L tau isoforms endogenously. Potential dynamical and functional alterations were then quantified through recordings of spontaneous activity and subsequent analyses.
3.4.1. Neuronal Cultures Expressing P301L Human Tau Exhibit a Tendency Toward Stronger Bursting
Figure 10a-b shows illustrative raster plots at DIV 12, together with their corresponding population activity PA, for the different conditions explored. We note that, for this series of experiments, we considered an additional ‘standard’ culture in which neurons were transduced with P301L human tau and were then cultured normally. As can be observed in the panels of Figure 10, all four conditions (Std, vStd, vWT and vpTau) behaved similarly. Only the latter scenario (Figure 10b, right) seemed to exhibit a higher activity, but the behavior could not be systematically observed in other replicates. Indeed, the detailed analysis of the dynamic observables (front velocity, PA and IBI) including all replicates dis not provide conclusive results. Data is shown in Figure 11, for both the evolution of a given quantity along DIV or its statistics at DIV 12.
For the velocity analysis (Figure 11a, left), we can observe that the four curves, corresponding to each culture scenario, cross one another over time, with no trends that could hint at a systematic alteration. The comparison of conditions with all replicates at DIV 12 (Figure 11a, right) shows no statistically significant differences between scenarios, with , and . For the population activity PA (Figure 11b, left), we observed that the vpTau curve was above the vStd one after DIV 10, suggesting a tendency for stronger network bursting for the culture treated with pathological tau, i.e, an increase in the number of neurons that participated in collective events. However, the comparison of the distributions of PA values at DIV 12 (Figure 11b, right) showed no statistically significant differences among conditions, with , and . Finally, for the inter–burst interval (IBI) we observed that the vpTau curve was below the others for most of the developmental days (Figure 11c, left), particularly when compared to the vStd curve, and suggested that pathological tau increased bursting activity. The distribution of IBI values at DIV 12 (Figure 11c, right) showed significant differences betweeen vStd and vpTau, though weak, with , but not between Std and vpTau ( and between vWT and pTau ().
Overall, results suggest that for neuronal cultures expressing P301L human tau (vStd), there was a consistent trend for its observables to deviate from those in which wild-type tau (vWT) or pathological tau were included (vpTau), indicating that the presence of tau itself (in any of its forms) tended to alter the dynamics of neuronal cultures, increasing the velocity of activity fronts, strengthening bursting and reducing the inter-burst interval IBI. For the specific case of the IBI, the pathological condition (vpTau) appeared to accentuate the differences with the Std condition.
3.4.2. Cultures with Expression of P301L Human Tau Do Not Alter Effective Connectivity
The spontaneous activity data for the P301L–expressing cultures was further analyzed to compute the effective connectivity and corresponding major network metrics, namely the global efficiency and community statistic Q. As shown in Figure 12, these quantities were plotted as a function of DIV and compared in detail at DIV 12. For (Figure 12a), all four conditions (Std, vStd, vWT, and vpTau) showed a similar trend, in which increased along maturation with no clear differences between conditions within statistical error. At DIV 12 there were no significant statistical difference between conditions, although the pathological vpTau condition tended to exhibit a higher than their vStd control, a result that is compatible with the strongest network bursting of vpTau cultures observed above. For Q (Figure 12b), all four also behaved similarly, reducing Q along DIV. For the specific time points at DIV 12, no statistically significant differences could be observed among conditions, although Q for vpTau was on average smaller than in the vStd condition, which is again expected given the strong bursting of the former and that effectually accentuates the functional integration of the network.
4. Discussion
4.1. Network Behavior
The aim of this work was to design an in vitro model for assessing the impact of extracellular pTau on neurons in culture, carried out by quantifying alterations in both the dynamics and functional organization of tau–dosed networks and their controls. We used primary neuronal cultures from CD1 mice embryos (wild–type) as they allow to study the emergence of sporadic tauopathies, i.e., those characterized by the accumulation of abnormal forms of insoluble tau that gradually degrade network behavior. We believe that such a model provides a complementary insight to other strategies such as animal models that overexpress tau, in which damage is triggered in the brain and its impact monitored through the analysis of animal cognitive or motor deficits [49,50,51].
Our hypothesis when designing the in vitro model is that the known role of pTau in microtubules’ destabilization and axonal degradation would translate into quantifiable network–wide dynamical changes and connectivity alterations. For this reason we measured the velocity of propagation of network bursts since it is tightly dependent on the neuronal connectivity and axonal lengths [52,53,54], with the velocity increasing with average network connectivity. We therefore expected that extracellular pTau would substantially reduce the velocity of activity propagation in affected neuronal networks as pTau–induced axonal damage progressed. Such a trend, however, could not be extracted with the data at hand. The velocity decreased (Figure 11a), but similarly in all conditions, either pathological or control, indicating that its reduction may be due to the natural development of network, e.g., pruning of connections after an initial boost in connectivity [55], rather than an actual damage on network circuitry.
We also anticipated changes in the population activity. The capacity of a network to generate bursting events depends on the connectivity of the network and the fast exchange of spiking activity among neurons [37,56], which would be compromised upon physical deterioration of axons and connectivity. We thus expected a reduction in the amplitudes of population activity PA and an increase in the inter–burst interval. A decrease in PA would reflect a drop in the capacity of the network to accommodate a large number of active neurons within a burst, whereas a larger IBI would reflect the difficulties in the network to propagate spikes, recruit activity and trigger a bursting event. The analysis of results at DIV 12, however, revealed just the opposite behavior. First, no significant differences were observed in PA values among preparations (Figure 11b), and with even a slight trend for PA to grow for tau-treated cultures. And, second, a significant reduction in IBI was observed between Standard and pTau cultures, which indicates that bursting was actually favored. However, the overall results, including the different developmental time points of analysis, indicate that no neat alterations from a dynamical point of view can be demonstrated.
Similarly, we expected changes in the functional organization of the in vitro networks under pTau. We expected a decrease in the global efficiency in pTau cultures as compared to control conditions due to the hypothesized loss of connectivity, which would compromise the exchange of information between neurons in the network. However, no significant differences were observed when comparing for pTau–treated and untreated cultures. Similar arguments could be made regarding the community statistic Q, for which we expected a higher number of neuronal communities and a larger Q for pTau–treated cultures as a result of connectivity disruption and network functional disintegration. However, no clear differences in the value of Q were found at DIV 12 for the different conditions, and with an overall increase in and decrease in Q along development in all conditions that may just indicate the growth of connections and the gradual integration of the network as it matures.
4.2. Comparison with Other Models
To put our results in context with other studies, we showed that sarkosyl–insoluble fractions from P301S (+/-) mice’ brains contain phospho–tau and insoluble filaments (Figure 4). In AD patients, it was observed that the progress of pTau aggregates formation correlates with the progress of the disease [57]. In this context, neurons containing insoluble filaments degenerate and liberate reactive forms of tau protein into the extracellular space, known as ghost tangles, that may accumulate and be toxic to the healthy neighboring neurons [58,59]. The addition of extracellular tau was described to be toxic and promoted neuronal death for human neuroblastoma cells cultured in vitro [60]. Assuming that such a toxicity is severe, it is puzzling that we did not observe any evidence for network degradation and cell death, indicating that the presented culture model is clearly not adequate in capturing such important hallmarks of AD.
We note that there are studies similar to us in the literature, although with key differences. Stancu et al. treated primary neurons from P301S mice and their wild–type littermates with transgenic truncated human tau fragments, either wild-type or P301L tau. After treatment, the changes in calcium fluorescence were quantified by adding Fura-2 AM. Results showed an increase in both synchronization and amplitude of oscillations of those neuronal populations derived from P301S mice treated with extracellular tau, whereas no changes were observed in wild-type neurons under the same treatment [61]. In our experiments, wild-type cortical neurons treated with pathological tau were also unaffected, rising the question of whether wild-type cells are resistant to the presence of extracellular tau. At the time of writing this text, and to the best of our knowledge, no other study besides the one of Stancu et al. has explored the impact of extracellular tau in vitro in wild-type neuronal cultures, with the limitation that they only considered measures at DIV 1 for analysis, i.e. only one time–point. It is important to note that their study was solely focused on measuring changes in network activity, and no further investigations were conducted such as functional organization.
4.3. A Possible Hyperexcited State Due to pTau?
The increase in PA and the reduction of IBI at DIV 12 (shown in Figure 11) suggests that pTau cultures exhibited a hyperexcitable, i.e., neurons were more prone to activate, although the reasons for such a behavior are elusive. They could be ascribed to the failure of regulatory mechanisms such as the loss of inhibition or alterations in the membrane potential that facilitated neuronal activity, but we could not obtain independent evidences for such strong assumptions. It was reported that the presence of extracellular tau increased the levels of intracellular calcium [8], and therefore neurons displayed a different calcium fluorescence response. However, an analysis of the fluorescence amplitudes of the neurons in the different preparations showed no significant differences, indicating that possible alterations in calcium transport were not present (or not observable) in our experiments.
Dysregulation of calcium homeostasis has been related to tau-induced pathology and aberrant excitatory activity; and an imbalanced excitation–inhibition has been described as relevant figures of AD pathology progression [62,63,64]. It has been described that cortical activity regulates the release of endogenous tau in physiological conditions in vivo [14] being excitatory neuronal activity strongly related with an increase of extracellular tau level. Yamada et al. [65] linked presynaptic excitatory neuronal activity with the release of tau by neurons in vivo, indicating that the propagation of tauopathy diseases might be an active process, associated with synapsis, leaving behind the theory that extracellular tau comes only from neurons degenerated because of the disease [66]. In our experiments the excitation state is a consequence of the presence of extracellular tau, suggesting that it could be a two-way road. In fact, literature exposed that early hyperactivation in AD patients can be a mechanism to compensate for emerging cognitive decline [67,68].
In this direction, some authors questioned the toxic role of pTau and assumed a protective role of insoluble tau filaments and NFTs. Lee et al. proposed an antioxidant role in the accumulation of phosphorylated tau as a response to oxidative damage [69], which has been reported as one of the main figures in AD progression [70,71]. In contrast Hanger et al. hypothesized that NFTs accumulation might be caused by an effort to restore physiological levels of protein tau available for microtubule binding in neurons when increasing the steady–state levels [72]. These theories, coupled with the fact that the presence of extracellular tau does not appear to have significant effects in wild–type neurons, either in animal models or in culture, raise questions about the role of insoluble forms of tau in the development of tauopathies. This is related to the observation, already postulated in the literature, that resulting NFTs might not be toxic but the toxicity of pTau relates to the presence of toxic tau intermediates [73,74]. We note that oligomeric forms are not available in our experimental set–up. Moreover, conventional in vitro models pose limitations when studying neurodegenerative pathologies due to the dilution of cell–secreted neurotoxic factors in the culture medium, which are eventually eliminated during media changes. This is in contrast to the in vivo progression and propagation of these pathologies, where highly concentrated nucleation sites are formed in the extracellular space. In addition, pathologies like tauopathies are the results of complex fluctuations that might include signaling cascades, synaptic modifications, and network interaction that are extraordinarily difficult to replicate in vitro [75].
Finally, we must note that primary wild–type neurons, as in our experimental model, can be reacting to pathological perturbations by activating compensation mechanisms such as plasticity to maintain their homeostatic ‘set point’ [76]. Thus, neurons in culture might be in a state of continuous adaptation against the effect of extracellular tau. One possible adaptive mechanism is the one proposed by Desai et al., who showed that neurons in culture increase their intrinsic excitability when their activity decreases [77]. Synaptic plasticity acts by changing the synaptic weight in neuronal connectivity and is determined by the activity pattern of the network [78]. This mechanism can be hidden by the synchronous activity of standard primary neuronal cultures, resulting in higher excitability of the cultures and no detectable functional changes in the affected networks. Neural plasticity is widely recognized for its remarkable adaptability, playing a crucial role in maintaining neurological functions both in healthy states and in the presence of disease.
5. Conclusions
In this work we investigated the impact of pathological tau on the dynamics and functional organization of mouse primary cultures. In a first strategy, we administered to the cultures pathological tau extracted from the P301S (+/-) sarkosyl–insoluble fraction, and monitored the evolution of the neuronal networks along development, comparing the results in detail at DIV 12. Results hinted at an increase in the excitability of networks with pathological tau, which translated into an accentuated network bursting and a higher functional integration of the network. With the aim to strengthen these observations, damage in the cultures was accelerated by transducing them with P301L human tau. A similar trend was observed, although no robust evidence could be extracted that the observed alterations (stronger bursting and functional integration) accentuated due to P301L.
We ascribe the difficulty to observe substantial alterations to the neuronal cultures themselves, which are strongly homeostatic and continuously self–regulate to operate at an optimal set point, which masks the capacity to monitor affectations caused by biochemical perturbations. Thus, although we could observe some changes due to pathological tau, no decisive conclusions could be extracted on its damaging role. Additionally, our work highlights the difficulty of using standard primary neuronal cultures as a model system to study neurological disorders in vitro, and advocates for the development of new or complementary experimental setups that allow for a neater quantification of dynamic and functional alterations.
Author Contributions
Conceptualization, J.S., J.A.R., C.F.L.-L., and J.S.-J.; methodology, J.S., and C.F.L.-L.; formal analysis, C.F.L.-L.; investigation, C.F.L.-L. and J.S.-J.; resources, J.S. and J.A.R.; data curation, C.F.L.-L.; writing-original draft preparation, C.F.L.-L.; writing-review and editing, J.S., J.A.R., C.F.L.-L., and J.S.-J.; supervision, J.S. and J.A.R.; project administration, J.S. and J.A.R.; funding acquisition, J.S. and J.A.R. All authors have read and agreed to the published version of the manuscript.
Funding
The research leading to these results received funding from “La Caixa” Foundation (ID 100010434) under the agreement LCF-PR-HR19- 52160007. J.S. acknowledges support from grants PID2019-108842GB-C21 and PID2022-137713NB-C22, funded by MCIU/AEI/10.13039/501100011033 and by ERDF/EU; and by the Generalitat de Catalunya under grant 2021-SGR-00450. J.A.D.R. was supported by PRPCDEVTAU PID2021-123714OB-I00, ALTERNed PLEC2022-009401, PDC2022-133268-I00, THRIVE PID2024-162521OB-I00 funded by MCIN/AEI/10.13039/501100011033 and by ERDF A way of making Europe, the CERCA Program, and the Commission for Universities and Research of the Department of Innovation, Universities, and Enterprise of the Generalitat de Catalunya (SGR2021-00453) J.S.J was supported by la Fundación Pérez de Guzman el Bueno.
Institutional Review Board Statement
Primary cortical tissue from CD1 mouse embryonic cortices at day 16 of development was used in all experiments. Mice were provided by the animal facility of the Pharmacy Faculty, University of Barcelona. Animal manipulation and tissue dissection were carried out under ethical order B-RP-094/15–7125 of 10 July 2015, which was approved by the Ethics Committee for Animal Experimentation of the University of Barcelona in accordance to the regulations for animal experimentation of the Generalitat de Catalunya (Catalonia, Spain).
Data Availability Statement
Data and materials are available upon request to the corresponding author.
Acknowledgments
We thank Dr. Jose Luis Lanciego (Universidad de Navarra) for providing the AVVs that carry the tau mutant P301L. We also thank...
Conflicts of Interest
The authors declare no conflict of interest.
References
- Wang, Y.; Mandelkow, E. Tau in physiology and pathology. Nature reviews neuroscience 2016, 17, 22–35. [Google Scholar] [CrossRef]
- Guo, T.; Noble, W.; Hanger, D.P. Roles of tau protein in health and disease. Acta neuropathologica 2017, 133, 665–704. [Google Scholar] [CrossRef]
- Zhang, J.; Zhang, Y.; Wang, J.; Xia, Y.; Zhang, J.; Chen, L. Recent advances in Alzheimer’s disease: Mechanisms, clinical trials and new drug development strategies. Signal transduction and targeted therapy 2024, 9, 211. [Google Scholar] [CrossRef]
- Grossman, M.; Seeley, W.W.; Boxer, A.L.; Hillis, A.E.; Knopman, D.S.; Ljubenov, P.A.; Miller, B.; Piguet, O.; Rademakers, R.; Whitwell, J.L.; et al. Frontotemporal lobar degeneration. Nature Reviews Disease Primers 2023, 9, 40. [Google Scholar] [CrossRef]
- Lee, V.M.; Goedert, M.; Trojanowski, J.Q. Neurodegenerative tauopathies. Annual review of neuroscience 2001, 24, 1121–1159. [Google Scholar] [CrossRef] [PubMed]
- Moore, K.B.; Hung, T.J.; Fortin, J.S. Hyperphosphorylated tau (p-tau) and drug discovery in the context of Alzheimer’s disease and related tauopathies. Drug discovery today 2023, 28, 103487. [Google Scholar] [CrossRef] [PubMed]
- Götz, J.; Halliday, G.; Nisbet, R.M. Molecular pathogenesis of the tauopathies. Annual Review of Pathology: Mechanisms of Disease 2019, 14, 239–261. [Google Scholar] [CrossRef]
- Gómez-Ramos, A.; Díaz-Hernández, M.; Rubio, A.; Miras-Portugal, M.T.; Avila, J. Extracellular tau promotes intracellular calcium increase through M1 and M3 muscarinic receptors in neuronal cells. Molecular and Cellular Neuroscience 2008, 37, 673–681. [Google Scholar] [CrossRef]
- Bouillet, T.; Ciba, M.; Alves, C.L.; Rodrigues, F.A.; Thielemann, C.; Colin, M.; Buée, L.; Halliez, S. Revisiting the involvement of tau in complex neural network remodeling: analysis of the extracellular neuronal activity in organotypic brain slice co-cultures. Journal of Neural Engineering 2022, 19, 066026. [Google Scholar] [CrossRef] [PubMed]
- Esteras, N.; Abramov, A.Y. Mitochondrial calcium deregulation in the mechanism of beta-amyloid and tau pathology. Cells 2020, 9, 2135. [Google Scholar] [CrossRef]
- David, D.C.; Hauptmann, S.; Scherping, I.; Schuessel, K.; Keil, U.; Rizzu, P.; Ravid, R.; Dröse, S.; Brandt, U.; Müller, W.E.; et al. Proteomic and functional analyses reveal a mitochondrial dysfunction in P301L tau transgenic mice. Journal of Biological Chemistry 2005, 280, 23802–23814. [Google Scholar] [CrossRef] [PubMed]
- Dickerson, B.; Salat, D.; Greve, D.; Chua, E.; Rand-Giovannetti, E.; Rentz, D.; Bertram, L.; Mullin, K.; Tanzi, R.; Blacker, D.; et al. Increased hippocampal activation in mild cognitive impairment compared to normal aging and AD. Neurology 2005, 65, 404–411. [Google Scholar] [CrossRef]
- Palop, J.J.; Mucke, L. Synaptic depression and aberrant excitatory network activity in Alzheimer’s disease: two faces of the same coin? Neuromolecular medicine 2010, 12, 48–55. [Google Scholar] [CrossRef]
- Pooler, A.M.; Phillips, E.C.; Lau, D.H.; Noble, W.; Hanger, D.P. Physiological release of endogenous tau is stimulated by neuronal activity. EMBO reports 2013, 14, 389–394. [Google Scholar] [CrossRef]
- Sanders, D.W.; Kaufman, S.K.; DeVos, S.L.; Sharma, A.M.; Mirbaha, H.; Li, A.; Barker, S.J.; Foley, A.C.; Thorpe, J.R.; Serpell, L.C.; et al. Distinct tau prion strains propagate in cells and mice and define different tauopathies. Neuron 2014, 82, 1271–1288. [Google Scholar] [CrossRef]
- Clavaguera, F.; Bolmont, T.; Crowther, R.A.; Abramowski, D.; Frank, S.; Probst, A.; Fraser, G.; Stalder, A.K.; Beibel, M.; Staufenbiel, M.; et al. Transmission and spreading of tauopathy in transgenic mouse brain. Nature cell biology 2009, 11, 909–913. [Google Scholar] [CrossRef]
- Frost, B.; Diamond, M.I. Prion-like mechanisms in neurodegenerative diseases. Nature Reviews Neuroscience 2010, 11, 155–159. [Google Scholar] [CrossRef] [PubMed]
- Audouard, E.; Houben, S.; Masaracchia, C.; Yilmaz, Z.; Suain, V.; Authelet, M.; De Decker, R.; Buée, L.; Boom, A.; Leroy, K.; et al. High–molecular-weight paired helical filaments from Alzheimer brain induces seeding of wild-type mouse tau into an Argyrophilic 4R tau pathology in vivo. The American journal of pathology 2016, 186, 2709–2722. [Google Scholar] [CrossRef]
- Guo, J.L.; Narasimhan, S.; Changolkar, L.; He, Z.; Stieber, A.; Zhang, B.; Gathagan, R.J.; Iba, M.; McBride, J.D.; Trojanowski, J.Q.; et al. Unique pathological tau conformers from Alzheimer’s brains transmit tau pathology in nontransgenic mice. Journal of Experimental Medicine 2016, 213, 2635–2654. [Google Scholar] [CrossRef] [PubMed]
- Lasagna-Reeves, C.A.; Castillo-Carranza, D.L.; Sengupta, U.; Guerrero-Munoz, M.J.; Kiritoshi, T.; Neugebauer, V.; Jackson, G.R.; Kayed, R. Alzheimer brain-derived tau oligomers propagate pathology from endogenous tau. Scientific reports 2012, 2, 700. [Google Scholar] [CrossRef]
- Clavaguera, F.; Hench, J.; Goedert, M.; Tolnay, M. Invited review: Prion-like transmission and spreading of tau pathology. Neuropathology and applied neurobiology 2015, 41, 47–58. [Google Scholar] [CrossRef]
- Braak, H.; Braak, E. Neuropathological stageing of Alzheimer-related changes. Acta neuropathologica 1991, 82, 239–259. [Google Scholar] [CrossRef]
- Vogel, J.W.; Iturria-Medina, Y.; Strandberg, O.T.; Smith, R.; Levitis, E.; Evans, A.C.; Hansson, O. Spread of pathological tau proteins through communicating neurons in human Alzheimer’s disease. Nature communications 2020, 11, 2612. [Google Scholar] [CrossRef]
- De Calignon, A.; Polydoro, M.; Suárez-Calvet, M.; William, C.; Adamowicz, D.H.; Kopeikina, K.J.; Pitstick, R.; Sahara, N.; Ashe, K.H.; Carlson, G.A.; et al. Propagation of tau pathology in a model of early Alzheimer’s disease. Neuron 2012, 73, 685–697. [Google Scholar] [CrossRef]
- Liu, L.; Drouet, V.; Wu, J.W.; Witter, M.P.; Small, S.A.; Clelland, C.; Duff, K. Trans-synaptic spread of tau pathology in vivo. PloS one 2012, 7, e31302. [Google Scholar] [CrossRef]
- Keller, J.M.; Frega, M. Past, present, and future of neuronal models in vitro. In Vitro Neuronal Networks: From Culturing Methods to Neuro-Technological Applications 2019, pp. 3–17.
- Soriano, J. Neuronal Cultures: Exploring Biophysics, Complex Systems, and Medicine in a Dish. Biophysica 2023, 3, 181–202. [Google Scholar] [CrossRef]
- Slanzi, A.; Iannoto, G.; Rossi, B.; Zenaro, E.; Constantin, G. In vitro models of neurodegenerative diseases. Frontiers in cell and developmental biology 2020, 8, 328. [Google Scholar] [CrossRef] [PubMed]
- Calafate, S.; Buist, A.; Miskiewicz, K.; Vijayan, V.; Daneels, G.; De Strooper, B.; de Wit, J.; Verstreken, P.; Moechars, D. Synaptic contacts enhance cell-to-cell tau pathology propagation. Cell reports 2015, 11, 1176–1183. [Google Scholar] [CrossRef]
- Wu, J.W.; Herman, M.; Liu, L.; Simoes, S.; Acker, C.M.; Figueroa, H.; Steinberg, J.I.; Margittai, M.; Kayed, R.; Zurzolo, C.; et al. Small misfolded Tau species are internalized via bulk endocytosis and anterogradely and retrogradely transported in neurons. Journal of Biological Chemistry 2013, 288, 1856–1870. [Google Scholar] [CrossRef] [PubMed]
- Allen, B.; Ingram, E.; Takao, M.; Smith, M.J.; Jakes, R.; Virdee, K.; Yoshida, H.; Holzer, M.; Craxton, M.; Emson, P.C.; et al. Abundant tau filaments and nonapoptotic neurodegeneration in transgenic mice expressing human P301S tau protein. Journal of Neuroscience 2002, 22, 9340–9351. [Google Scholar] [CrossRef]
- Soriano, J.; Rodríguez Martínez, M.; Tlusty, T.; Moses, E. Development of input connections in neural cultures. Proceedings of the National Academy of Sciences 2008, 105, 13758–13763. [Google Scholar] [CrossRef]
- Wu, J.W.; Herman, M.; Liu, L.; Simoes, S.; Acker, C.M.; Figueroa, H.; Steinberg, J.I.; Margittai, M.; Kayed, R.; Zurzolo, C.; et al. Small Misfolded Tau Species Are Internalized via Bulk Endocytosis and Anterogradely and Retrogradely Transported in Neurons*. Journal of Biological Chemistry 2013, 288, 1856–1870. [Google Scholar] [CrossRef]
- Puangmalai, N.; Bhatt, N.; Montalbano, M.; Sengupta, U.; Gaikwad, S.; Ventura, F.; McAllen, S.; Ellsworth, A.; Garcia, S.; Kayed, R. Internalization mechanisms of brain-derived tau oligomers from patients with Alzheimer’s disease, progressive supranuclear palsy and dementia with Lewy bodies. Cell death & disease 2020, 11, 314. [Google Scholar] [CrossRef]
- Orlandi, J.G.; Fernández-García, S.; Comella-Bolla, A.; Masana, M.; Barriga, G.G.D.; Yaghoubi, M.; Kipp, A.; Canals, J.M.; Colicos, M.A.; Davidsen, J.; et al. NETCAL: an interactive platform for large-scale, NETwork and population dynamics analysis of CALcium imaging recordings. Neuroscience 2017. [Google Scholar]
- Grewe, B.F.; Langer, D.; Kasper, H.; Kampa, B.M.; Helmchen, F. High-speed in vivo calcium imaging reveals neuronal network activity with near-millisecond precision. Nature methods 2010, 7, 399–405. [Google Scholar] [CrossRef]
- Orlandi, J.G.; Soriano, J.; Alvarez-Lacalle, E.; Teller, S.; Casademunt, J. Noise focusing and the emergence of coherent activity in neuronal cultures. Nature Physics 2013, 9, 582–590. [Google Scholar] [CrossRef]
- Montalà-Flaquer, M.; López-León, C.F.; Tornero, D.; Houben, A.M.; Fardet, T.; Monceau, P.; Bottani, S.; Soriano, J. Rich dynamics and functional organization on topographically designed neuronal networks in vitro. iScience 2022, 25, article–105680. [Google Scholar] [CrossRef] [PubMed]
- Ludl, A.A.; Soriano, J. Impact of physical obstacles on the structural and effective connectivity of in silico neuronal circuits. Frontiers in computational neuroscience 2020, 14, 77. [Google Scholar] [CrossRef] [PubMed]
- Stetter, O.; Battaglia, D.; Soriano, J.; Geisel, T. Model-free reconstruction of excitatory neuronal connectivity from calcium imaging signals 2012.
- Tibau, E.; Ludl, A.A.; Ruediger, S.; Orlandi, J.G.; Soriano, J. Neuronal spatial arrangement shapes effective connectivity traits of in vitro cortical networks. IEEE Transactions on Network Science and Engineering 2018, 7, 435–448. [Google Scholar] [CrossRef]
- Rubinov, M.; Sporns, O. Complex network measures of brain connectivity: uses and interpretations. Neuroimage 2010, 52, 1059–1069. [Google Scholar] [CrossRef]
- Latora, V.; Marchiori, M. Economic small-world behavior in weighted networks. The European Physical Journal B-Condensed Matter and Complex Systems 2003, 32, 249–263. [Google Scholar] [CrossRef]
- Blondel, V.D.; Guillaume, J.L.; Lambiotte, R.; Lefebvre, E. Fast unfolding of communities in large networks. Journal of statistical mechanics: theory and experiment 2008, 2008, P10008. [Google Scholar] [CrossRef]
- Holmes, B.B.; Furman, J.L.; Mahan, T.E.; Yamasaki, T.R.; Mirbaha, H.; Eades, W.C.; Belaygorod, L.; Cairns, N.J.; Holtzman, D.M.; Diamond, M.I. Proteopathic tau seeding predicts tauopathy in vivo. Proceedings of the National Academy of sciences 2014, 111, E4376–E4385. [Google Scholar] [CrossRef]
- Jacobi, S.; Soriano, J.; Moses, E. BDNF and NT-3 increase velocity of activity front propagation in unidimensional hippocampal cultures. Journal of neurophysiology 2010, 104, 2932–2939. [Google Scholar] [CrossRef]
- Antonello, P.C.; Varley, T.F.; Beggs, J.; Porcionatto, M.; Sporns, O.; Faber, J. Self-organization of in vitro neuronal assemblies drives to complex network topology. Elife 2022, 11, e74921. [Google Scholar] [CrossRef]
- Frost, B.; Götz, J.; Feany, M.B. Connecting the dots between tau dysfunction and neurodegeneration. Trends in cell biology 2015, 25, 46–53. [Google Scholar] [CrossRef]
- Xu, Q.Q.; Yang, W.; Zhong, M.; Lin, Z.X.; Gray, N.E.; Xian, Y.F. Animal models of Alzheimer’s disease: preclinical insights and challenges. Acta Materia Medica 2023, 2, 192–215. [Google Scholar] [CrossRef]
- Nakai, T.; Yamada, K.; Mizoguchi, H. Alzheimer’s disease animal models: elucidation of biomarkers and therapeutic approaches for cognitive impairment. International journal of molecular sciences 2021, 22, 5549. [Google Scholar] [CrossRef]
- Maruyama, M.; Shimada, H.; Suhara, T.; Shinotoh, H.; Ji, B.; Maeda, J.; Zhang, M.R.; Trojanowski, J.Q.; Lee, V.M.Y.; Ono, M.; et al. Imaging of tau pathology in a tauopathy mouse model and in Alzheimer patients compared to normal controls. Neuron 2013, 79, 1094–1108. [Google Scholar] [CrossRef] [PubMed]
- Golomb, D.; Ermentrout, G.B. Continuous and lurching traveling pulses in neuronal networks with delay and spatially decaying connectivity. Proceedings of the National Academy of Sciences 1999, 96, 13480–13485. [Google Scholar] [CrossRef] [PubMed]
- Bressloff, P.C. Traveling waves and pulses in a one-dimensional network of excitable integrate-and-fire neurons. Journal of Mathematical Biology 2000, 40, 169–198. [Google Scholar] [CrossRef]
- Feinerman, O.; Segal, M.; Moses, E. Signal propagation along unidimensional neuronal networks. Journal of neurophysiology 2005, 94, 3406–3416. [Google Scholar] [CrossRef]
- Cullen, D.K.; Gilroy, M.E.; Irons, H.R.; LaPlaca, M.C. Synapse-to-neuron ratio is inversely related to neuronal density in mature neuronal cultures. Brain research 2010, 1359, 44–55. [Google Scholar] [CrossRef]
- Hernández-Navarro, L.; Faci-Lázaro, S.; Orlandi, J.G.; Feudel, U.; Gómez-Gardeñes, J.; Soriano, J. Noise-driven amplification mechanisms governing the emergence of coherent extreme events in excitable systems. Physical Review Research 2021, 3, 1–15. [Google Scholar] [CrossRef]
- Delacourte, A.; David, J.P.; Sergeant, N.; Buee, L.; Wattez, A.; Vermersch, P.; Ghozali, F.; Fallet-Bianco, C.; Pasquier, F.; Lebert, F.; et al. The biochemical pathway of neurofibrillary degeneration in aging and Alzheimer’s disease. Neurology 1999, 52, 1158–1158. [Google Scholar] [CrossRef]
- Goedert, M. Filamentous nerve cell inclusions in neurodegenerative diseases: tauopathies and alpha-synucleinopathies. Philosophical transactions of the royal society of london. Series B: biological sciences 1999, 354, 1101–1118. [Google Scholar] [CrossRef]
- Frost, B.; Jacks, R.L.; Diamond, M.I. Propagation of tau misfolding from the outside to the inside of a cell. Journal of biological chemistry 2009, 284, 12845–12852. [Google Scholar] [CrossRef] [PubMed]
- Gómez-Ramos, A.; Díaz-Hernández, M.; Cuadros, R.; Hernández, F.; Avila, J. Extracellular tau is toxic to neuronal cells. FEBS letters 2006, 580, 4842–4850. [Google Scholar] [CrossRef]
- Stancu, I.C.; Vasconcelos, B.; Ris, L.; Wang, P.; Villers, A.; Peeraer, E.; Buist, A.; Terwel, D.; Baatsen, P.; Oyelami, T.; et al. Templated misfolding of Tau by prion-like seeding along neuronal connections impairs neuronal network function and associated behavioral outcomes in Tau transgenic mice. Acta neuropathologica 2015, 129, 875–894. [Google Scholar] [CrossRef] [PubMed]
- Palop, J.J.; Chin, J.; Roberson, E.D.; Wang, J.; Thwin, M.T.; Bien-Ly, N.; Yoo, J.; Ho, K.O.; Yu, G.Q.; Kreitzer, A.; et al. Aberrant excitatory neuronal activity and compensatory remodeling of inhibitory hippocampal circuits in mouse models of Alzheimer’s disease. Neuron 2007, 55, 697–711. [Google Scholar] [CrossRef] [PubMed]
- Maestú, F.; de Haan, W.; Busche, M.A.; DeFelipe, J. Neuronal excitation/inhibition imbalance: core element of a translational perspective on Alzheimer pathophysiology. Ageing Research Reviews 2021, 69, 101372. [Google Scholar] [CrossRef]
- Styr, B.; Slutsky, I. Imbalance between firing homeostasis and synaptic plasticity drives early-phase Alzheimer’s disease. Nature neuroscience 2018, 21, 463–473. [Google Scholar] [CrossRef]
- Yamada, K.; Holth, J.K.; Liao, F.; Stewart, F.R.; Mahan, T.E.; Jiang, H.; Cirrito, J.R.; Patel, T.K.; Hochgräfe, K.; Mandelkow, E.M.; et al. Neuronal activity regulates extracellular tau in vivo. Journal of Experimental Medicine 2014, 211, 387–393. [Google Scholar] [CrossRef] [PubMed]
- Kobayashi, S.; Tanaka, T.; Soeda, Y.; Takashima, A. Enhanced tau protein translation by hyper-excitation. Frontiers in Aging Neuroscience 2019, 11, 322. [Google Scholar] [CrossRef] [PubMed]
- Dickerson, B.C.; Salat, D.H.; Bates, J.F.; Atiya, M.; Killiany, R.J.; Greve, D.N.; Dale, A.M.; Stern, C.E.; Blacker, D.; Albert, M.S.; et al. Medial temporal lobe function and structure in mild cognitive impairment. Annals of neurology 2004, 56, 27–35. [Google Scholar] [CrossRef]
- Targa Dias Anastacio, H.; Matosin, N.; Ooi, L. Neuronal hyperexcitability in Alzheimer’s disease: what are the drivers behind this aberrant phenotype? Translational Psychiatry 2022, 12, 257. [Google Scholar] [CrossRef]
- Lee, H.g.; Perry, G.; Moreira, P.I.; Garrett, M.R.; Liu, Q.; Zhu, X.; Takeda, A.; Nunomura, A.; Smith, M.A. Tau phosphorylation in Alzheimer’s disease: pathogen or protector? Trends in molecular medicine 2005, 11, 164–169. [Google Scholar] [CrossRef]
- Alavi Naini, S.M.; Soussi-Yanicostas, N.; et al. Tau hyperphosphorylation and oxidative stress, a critical vicious circle in neurodegenerative tauopathies? Oxidative medicine and cellular longevity 2015, 2015. [Google Scholar] [CrossRef]
- Cassidy, L.; Fernandez, F.; Johnson, J.B.; Naiker, M.; Owoola, A.G.; Broszczak, D.A. Oxidative stress in alzheimer’s disease: A review on emergent natural polyphenolic therapeutics. Complementary therapies in medicine 2020, 49, 102294. [Google Scholar] [CrossRef] [PubMed]
- Hanger, D.P.; Anderton, B.H.; Noble, W. Tau phosphorylation: the therapeutic challenge for neurodegenerative disease. Trends in molecular medicine 2009, 15, 112–119. [Google Scholar] [CrossRef]
- Castellani, R.J.; Nunomura, A.; Lee, H.g.; Perry, G.; Smith, M.A. Phosphorylated tau: toxic, protective, or none of the above. Journal of Alzheimer’s Disease 2008, 14, 377–383. [Google Scholar] [CrossRef] [PubMed]
- Cárdenas-Aguayo, M.d.C.; Gómez-Virgilio, L.; DeRosa, S.; Meraz-Ríos, M.A. The role of tau oligomers in the onset of Alzheimer’s disease neuropathology. ACS chemical neuroscience 2014, 5, 1178–1191. [Google Scholar] [CrossRef] [PubMed]
- Palop, J.J.; Chin, J.; Mucke, L. A network dysfunction perspective on neurodegenerative diseases. Nature 2006, 443, 768–773. [Google Scholar] [CrossRef]
- Turrigiano, G. Homeostatic synaptic plasticity: local and global mechanisms for stabilizing neuronal function. Cold Spring Harbor perspectives in biology 2012, 4, a005736. [Google Scholar] [CrossRef]
- Desai, N.S.; Rutherford, L.C.; Turrigiano, G.G. Plasticity in the intrinsic excitability of cortical pyramidal neurons. Nature neuroscience 1999, 2, 515–520. [Google Scholar] [CrossRef]
- Fauth, M.; Wörgötter, F.; Tetzlaff, C. The formation of multi-synaptic connections by the interaction of synaptic and structural plasticity and their functional consequences. PLoS computational biology 2015, 11, e1004031. [Google Scholar] [CrossRef] [PubMed]
Figure 1.
Culture preparation, monitoring and data analysis. (a) Culture preparation. Cortical tissue from mouse embryos was mechanically dissociated and plated onto a twin 4 mm diameter PDMS cavities over glass. At DIV 1 cells were transduced with the calcium fluorescent indicator GCaMP6s. (b) Representative image of the twin cultures during a fluorescence calcium imaging recording. Bright areas indicate active neurons. (c) Data analysis pipeline using the software Netcal. A circular grid of regions of interest (ROIs) was specified on each cavity, and the average fluorescence trace of each ROI as a function of time extracted. Each trace was then analyzed to detect sharp fluorescence peaks and that were ascribed as neuronal activations, procuring raster plots that portrayed the culture’s collective behavior. Blue dots mark neuronal activity, and apparent vertical lines indicate network bursts. Panels (a) and (b) of the figure used images from Servier Medical Art, licensed under Creative Commons Attribution 3.0 Unported License.
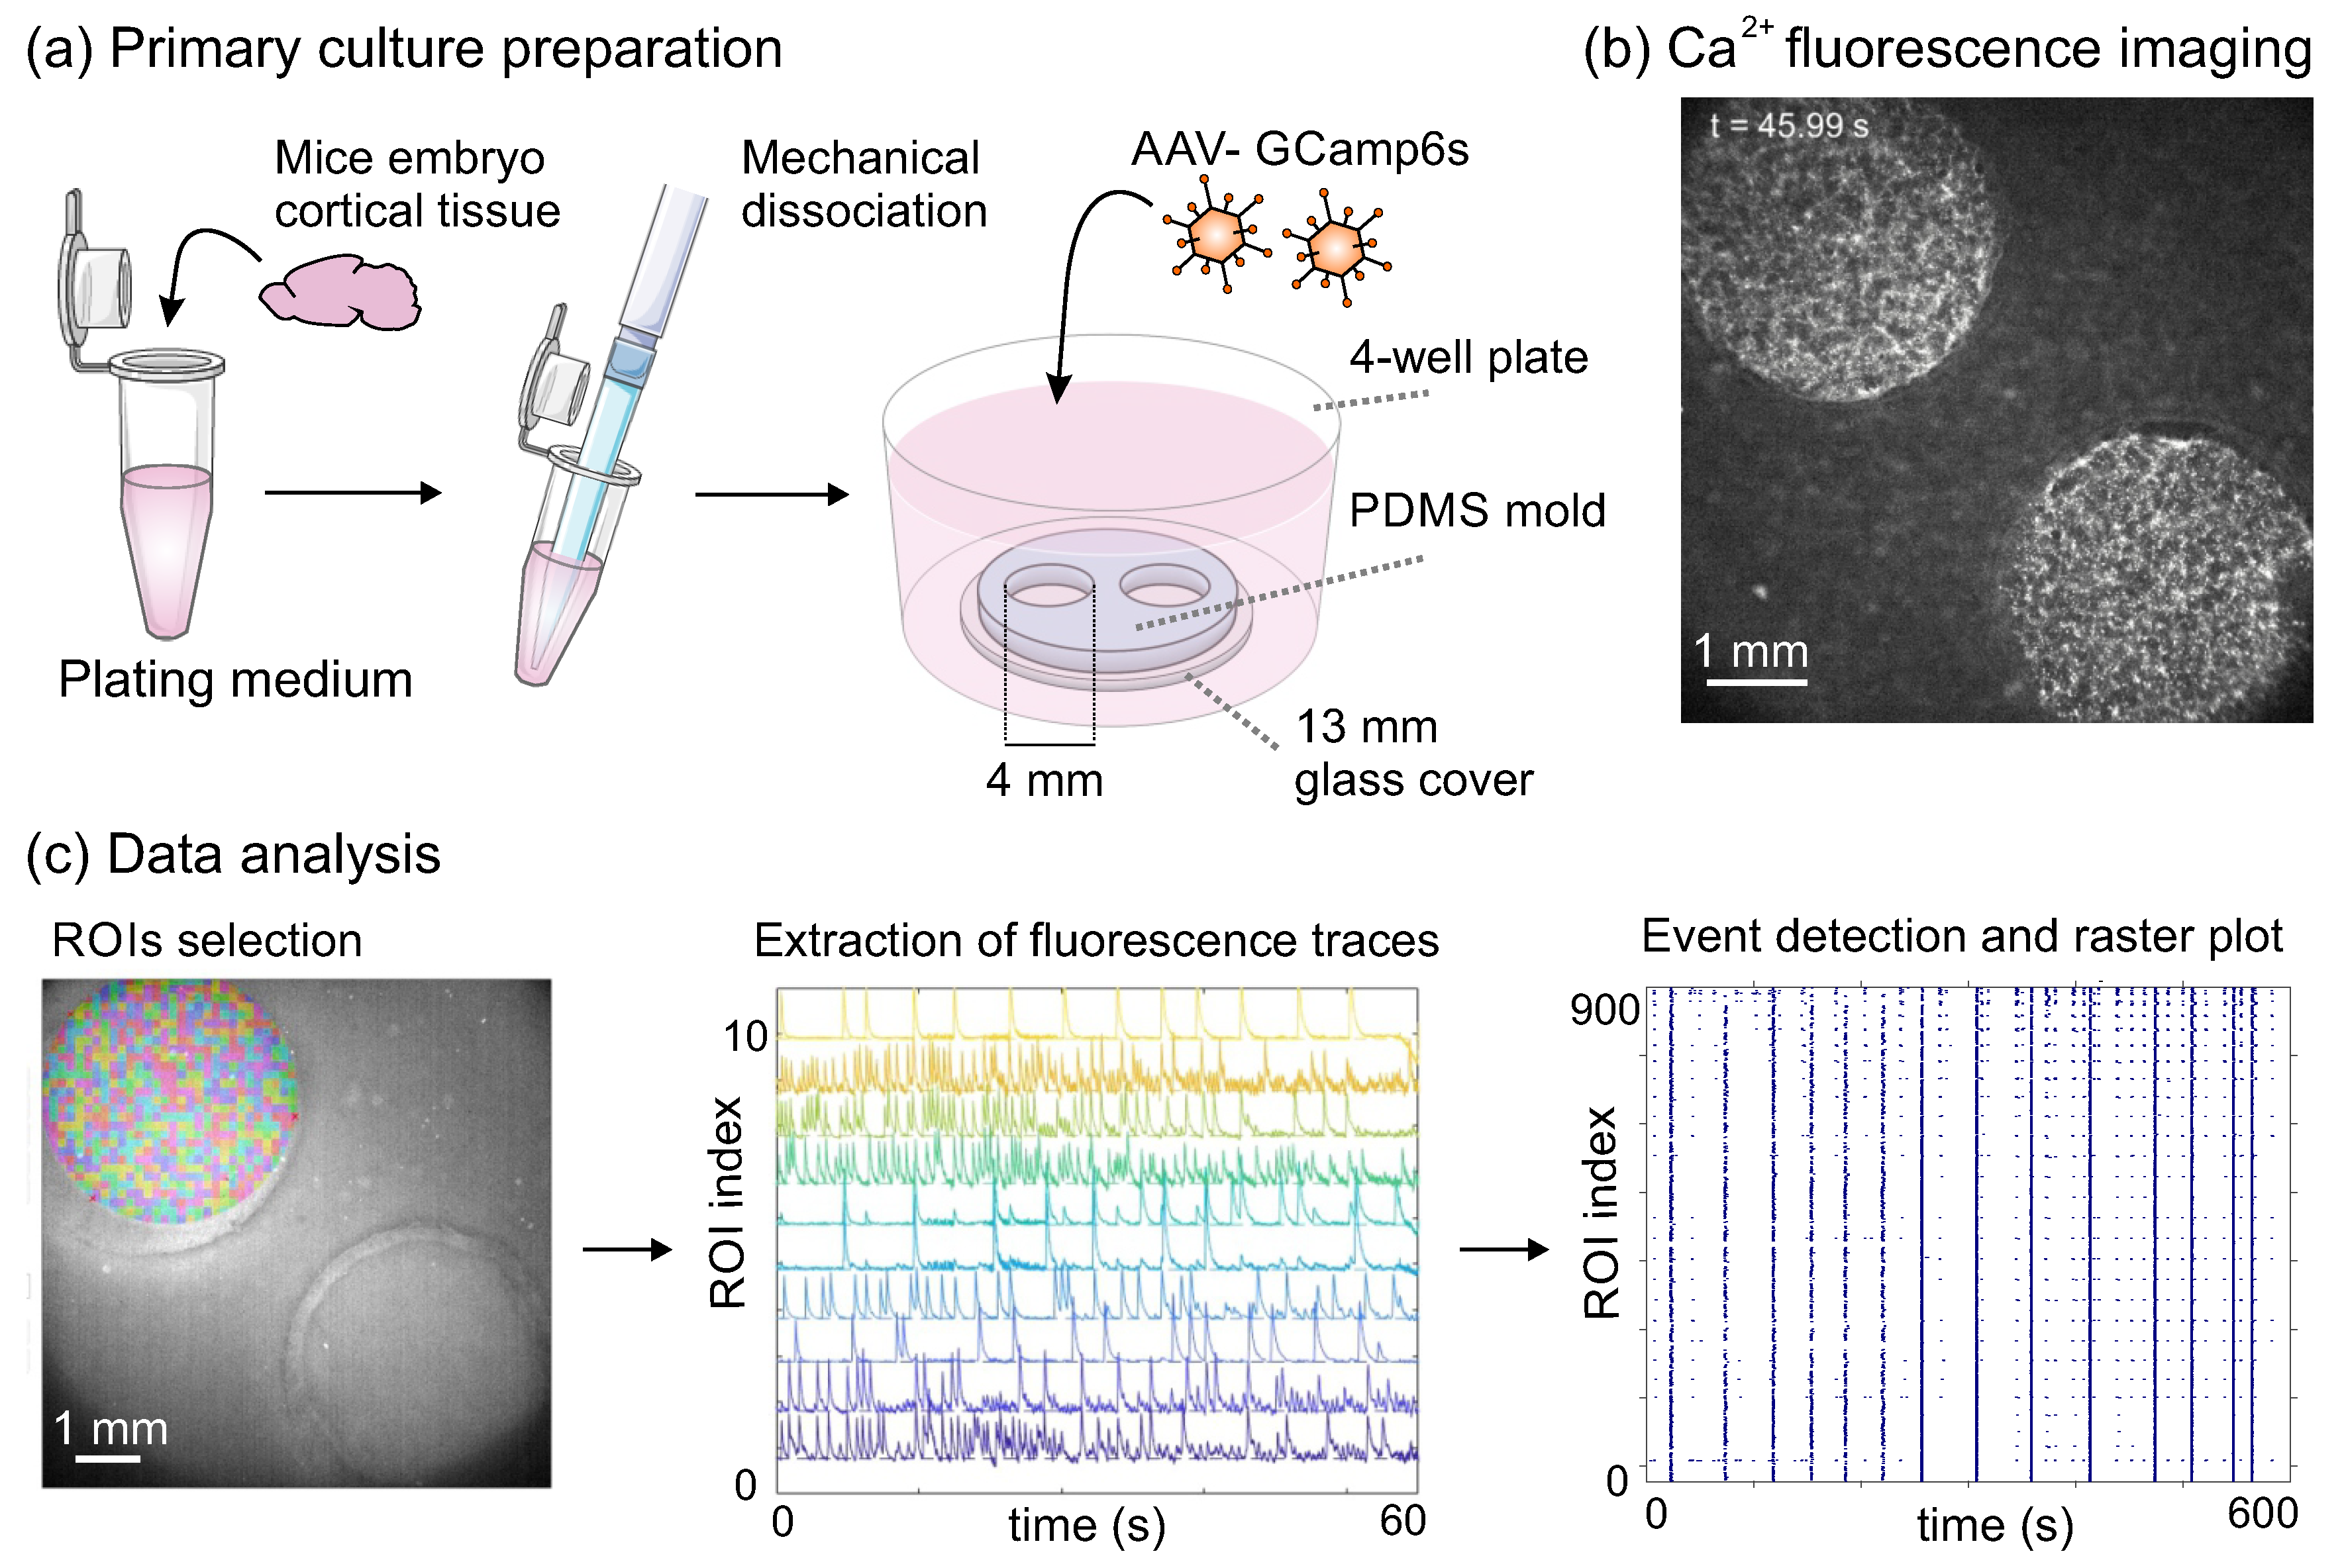
Figure 2.
Summary of protocols for pTau damage and corresponding diagrams for the application of perturbations and culture maintenance. In the diagrams, the important days in vitro for culture manipulation are indicated, as well the characteristic days in which spontaneous activity is recorded through calcium fluorescence imaging (green arrowheads). (a) Protocol I is based on the insoluble sarkosyl fraction of P301S cells. (b) Protocol II, with additional inclusion of P301-AAV to strengthen the damaging action of pTau. Figure panels utilize images from Servier Medical Art, licensed under Creative Commons Attribution 3.0 Unported License.
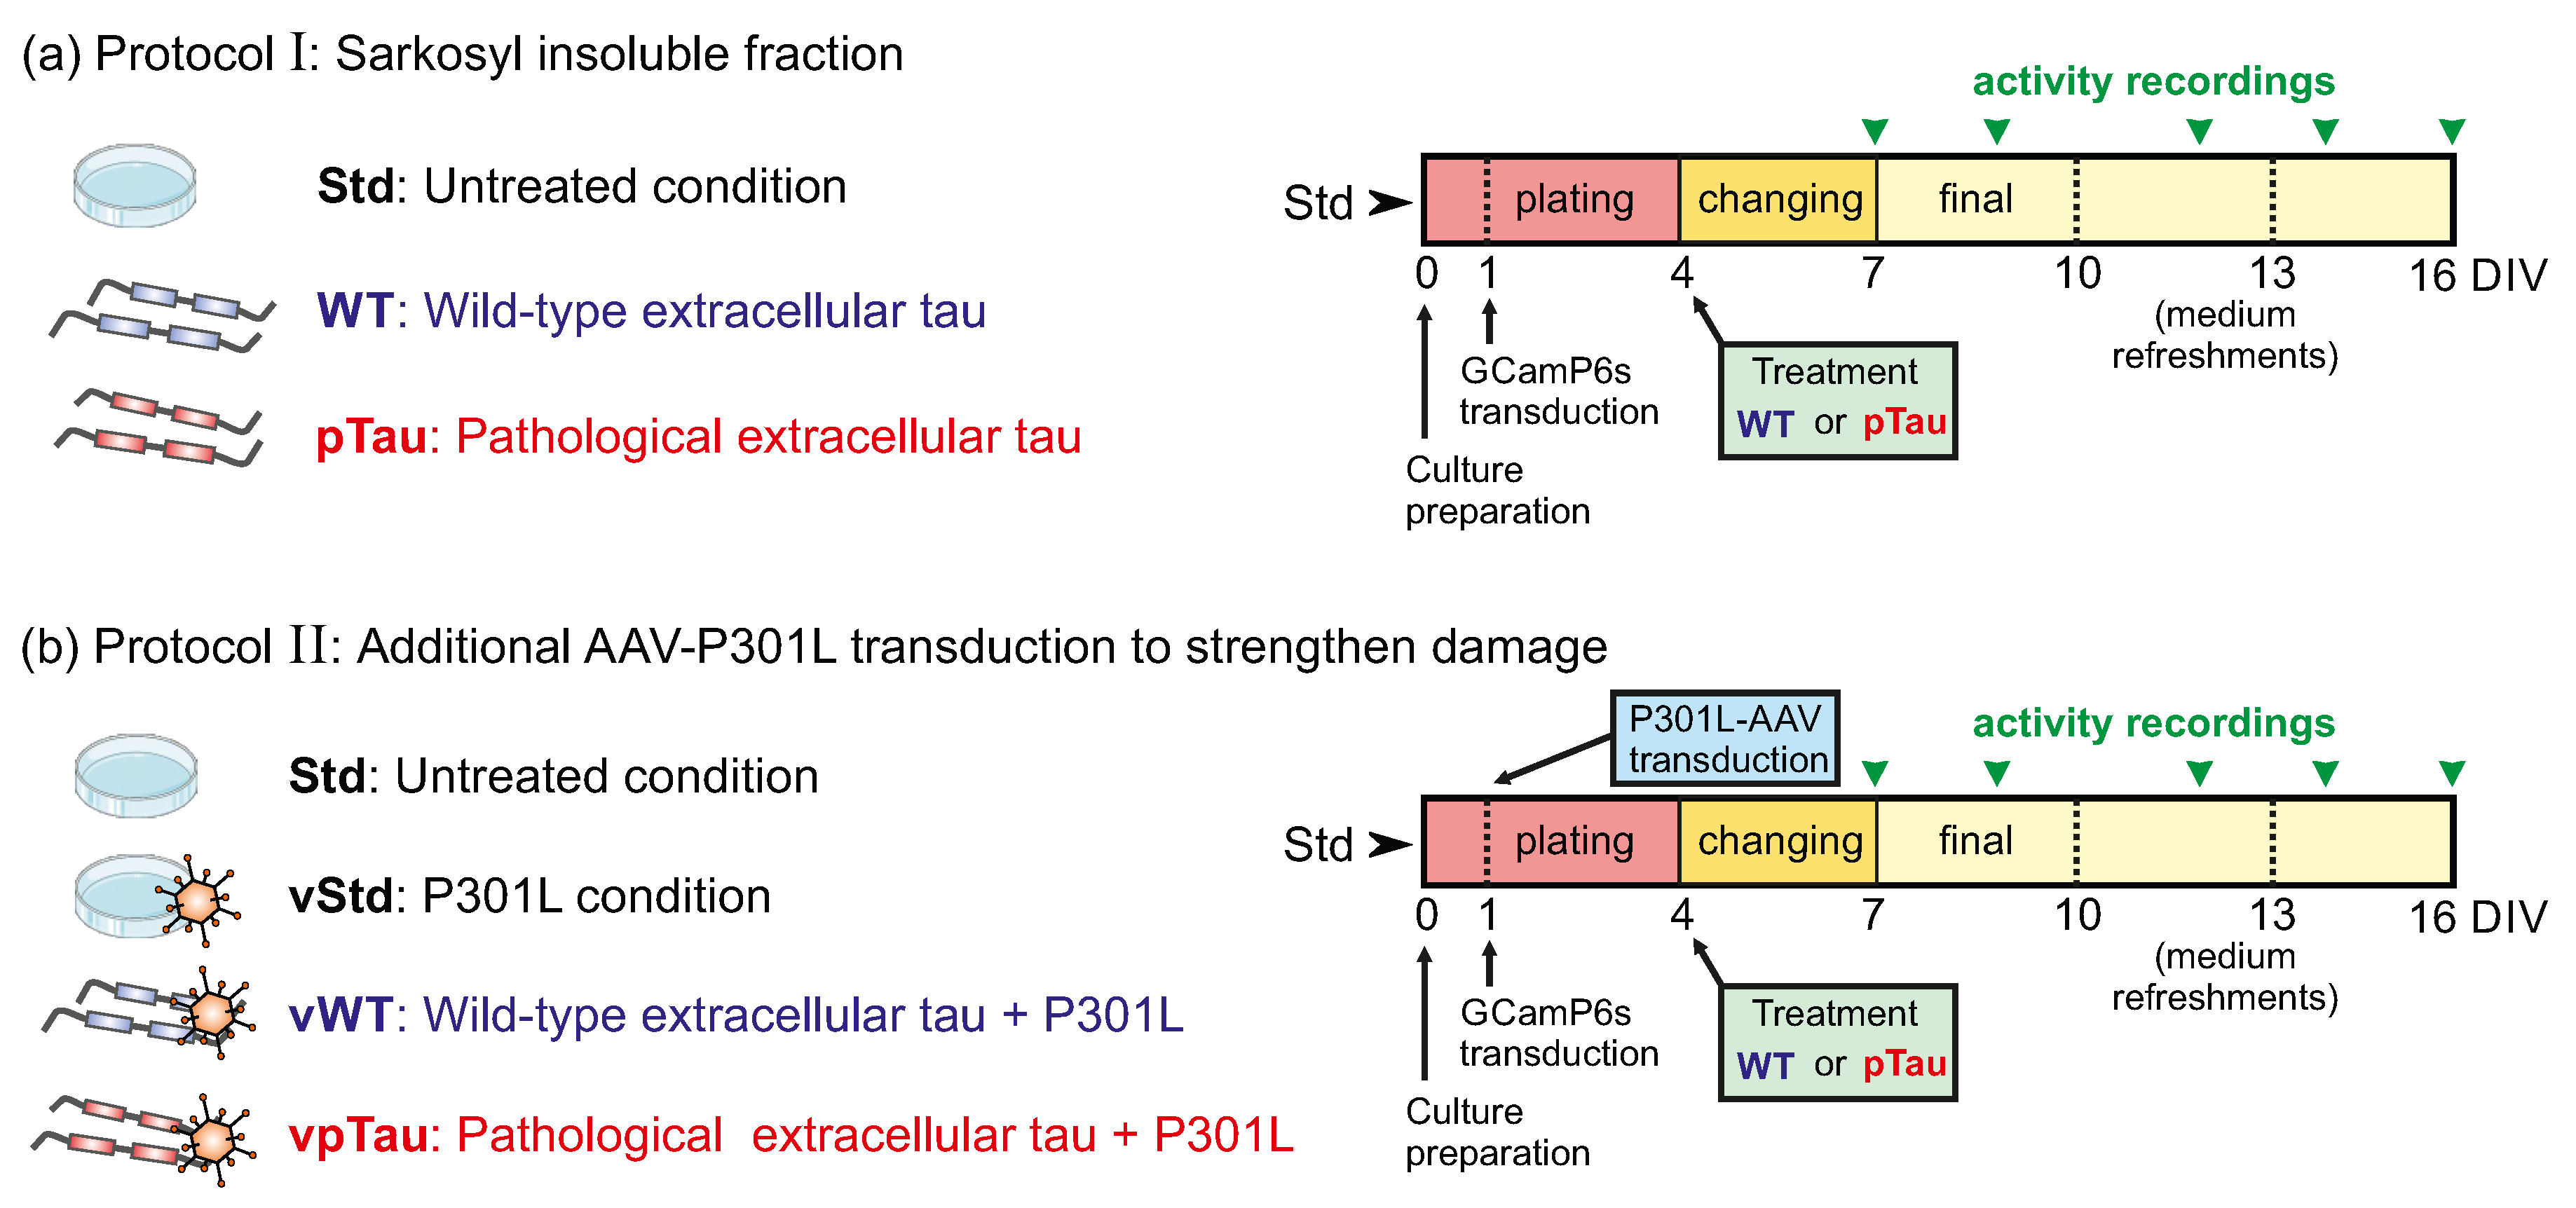
Figure 3.
Characterization of tau biosensor cell line. Images of in vitro Biosensor tau cells at DIV 12 treated with sarkosyl insoluble fractions derived from P301S (+/-) mice (pTau), its innocuous analogous P301S (-/-) (WT), as well as empty liposomes (vehicle) and that correspond to sarkosyl-free controls. Fluorescent inclusions, a signature of pathological tau, are only present in those cells treated with the P301S (+/-). Inclusions appear as highly bright fluorescent spots (marked with white arrows) in the inset of the pTau panel. Scale bars are m.
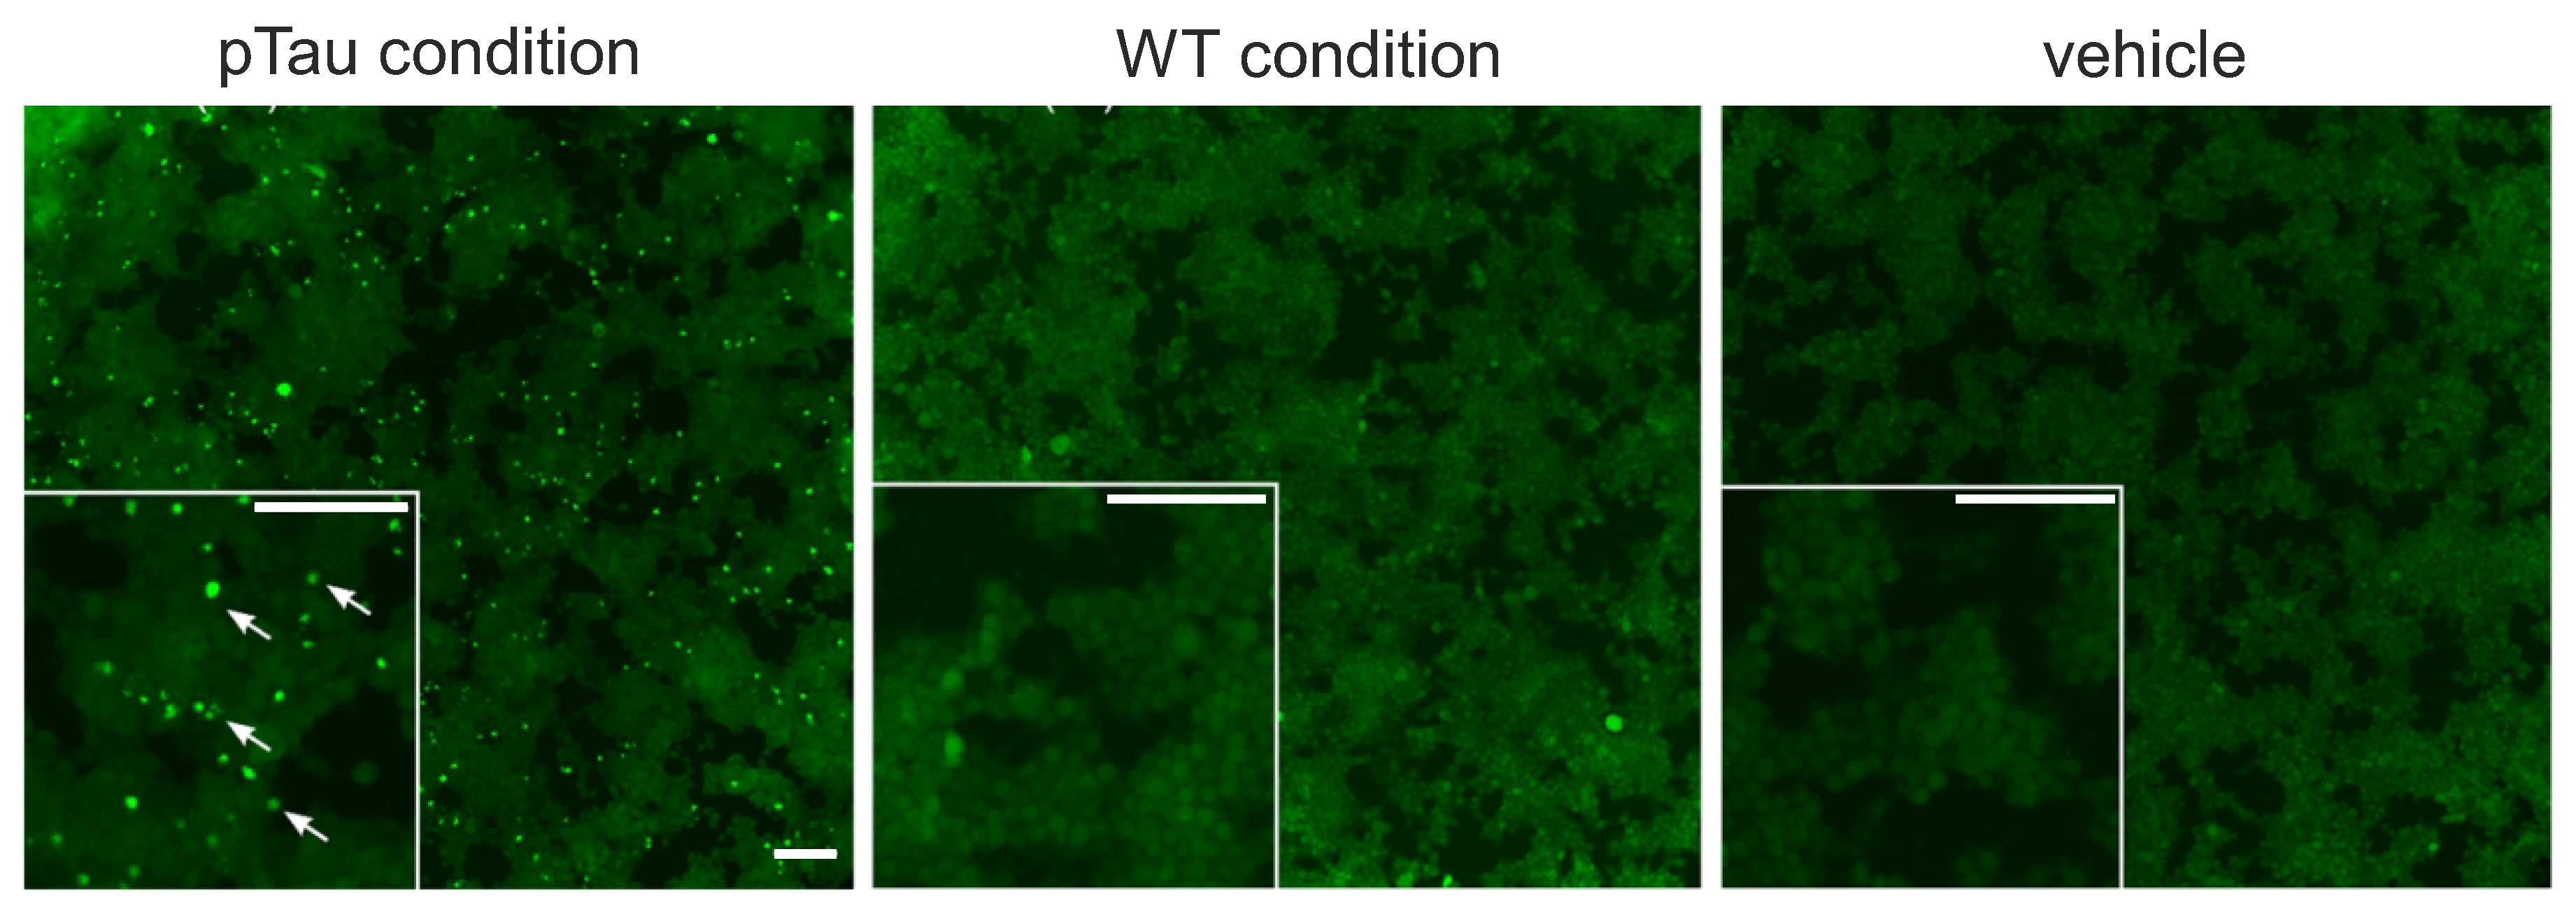
Figure 4.
Expression of P301L human tau in mouse primary cortical neurons. Immunostaining images of cortical neurons in culture at DIV 16 after infection with AAV-hSyn-P301L. (a) Example of a culture with uninfected neurons (TUJ-1 positive). (b)-(e) Examples of primary cortical neurons infected with AAV-hSyn-P301L after treatment with P301L (-/-) sarkosyl-insoluble extract (panel b) or with P301L(+/-) sarkosyl-insoluble extract (panels c to e). Neurons were immunolabeled at DIV 16 with anti-HT7 antibody (green) to stain human tau, TUJ1 antibody and counterstained with Hoechst (blue) for cell nuclei. Insoluble tau (green) was only present in the AVV-hSyn-P301L infected neurons treated with pTau containing extracts, i.e., P301L(+/-), panels c to e. These panels show different examples of affected cells. Scale bars are m (panels a and b), and m (panels c to e).
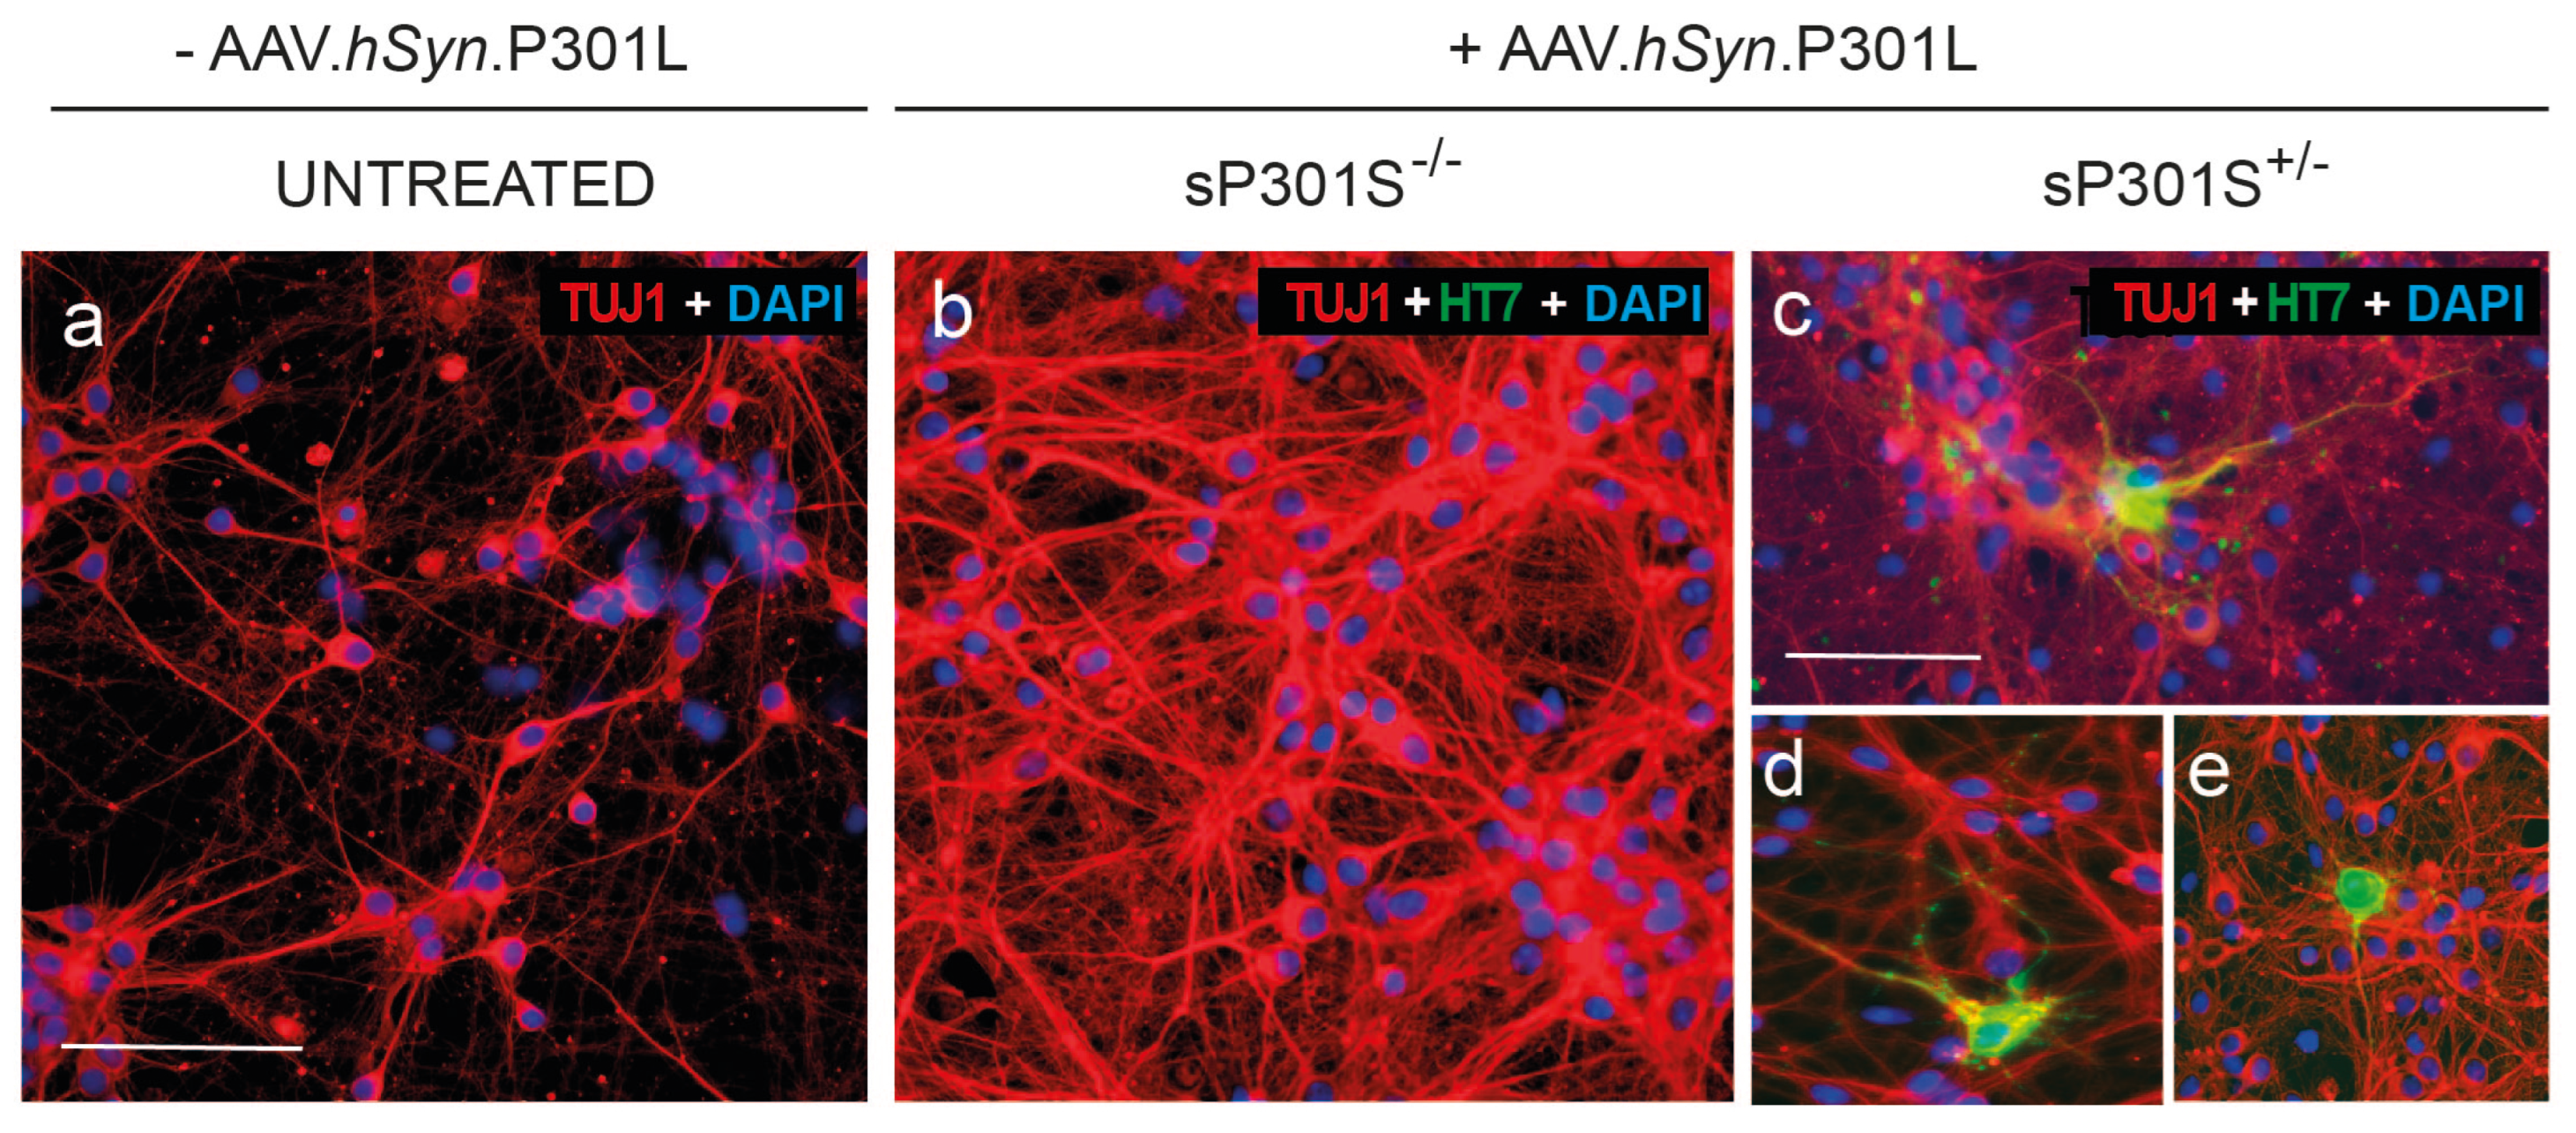
Figure 5.
Illustrative spontaneous activity data of neuronal cultures treated with the P301S (+/-) insoluble fraction of sarkosyl. The plots show examples of raster plots (bottom) and corresponding population activity PA (top) for the three conditions studied, namely Std, WT and pTau, at DIV 12. High amplitude peaks in PA reflect strong network synchronization.
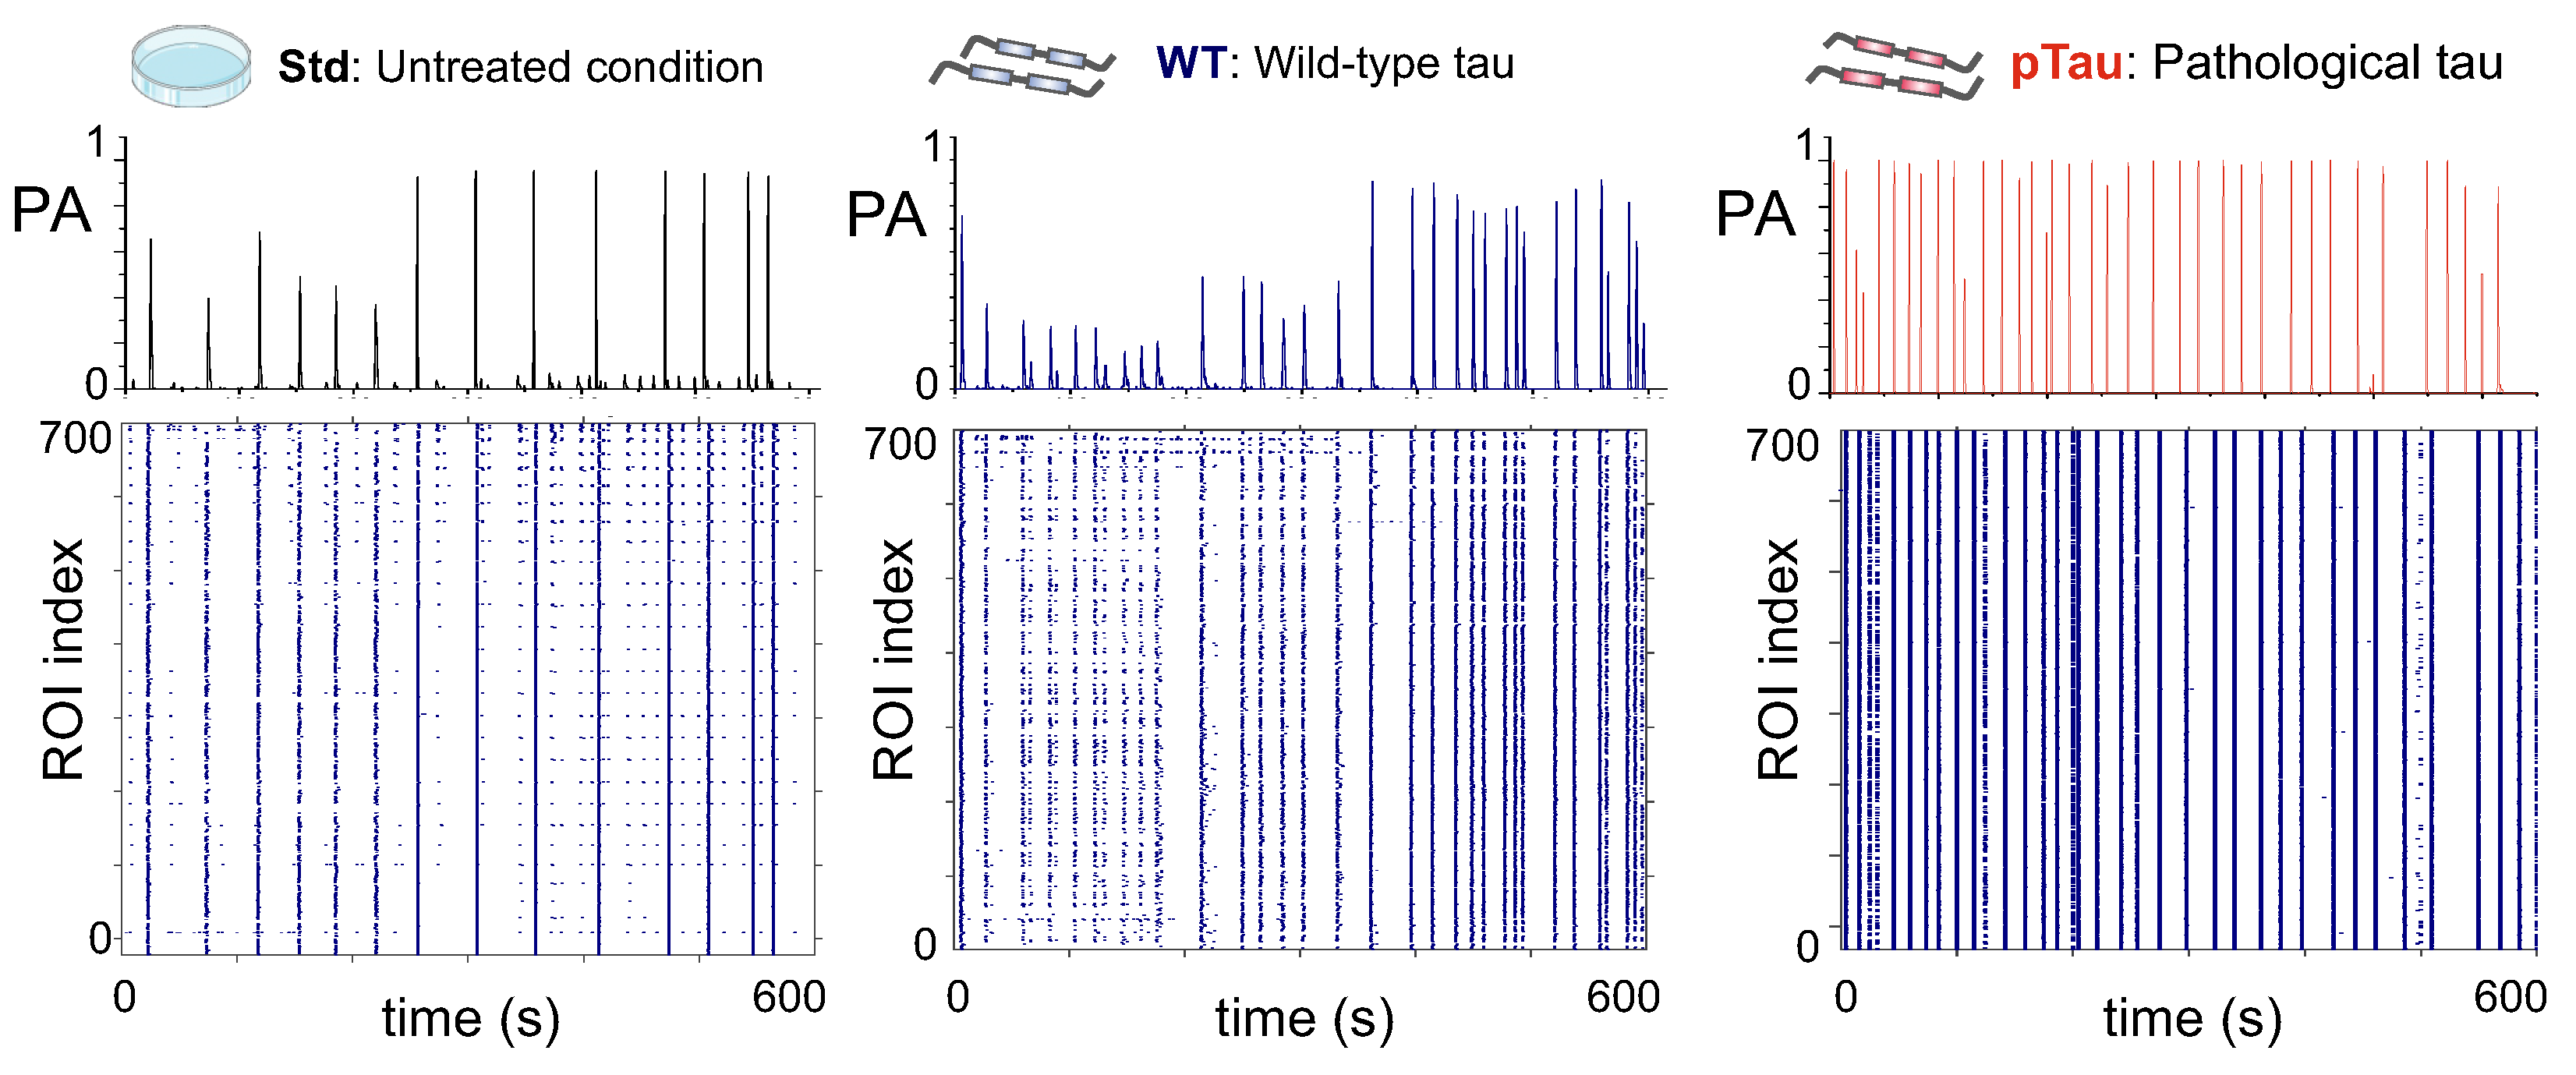
Figure 6.
Dynamics in Sarkosyl-treated cultures. (a) Left: Evolution of the average population activity (PA) along DIV for the three conditions. Each dot is the average value among experimental repetitions, and shadings are the standard error. Right: Box plots showing the distribution of the PA values for the different repetitions (colored circles) of a given condition at DIV 12. (b) Left: Corresponding evolution of the inter–burst interval (IBI), where each dot is the average among repetitions and shadings are standard error. Right: Distribution of IBI values for the different repetitions of a given condition at DIV 12. In all box plots. the horizontal lines represent the mean value of the distribution and the color boxes the standard deviation of the data. Statistics correspond to N for Std, N for WT and N for pTau condition. * p < 0.05 and n.s means ’non-significant´ (Student’s t-test).
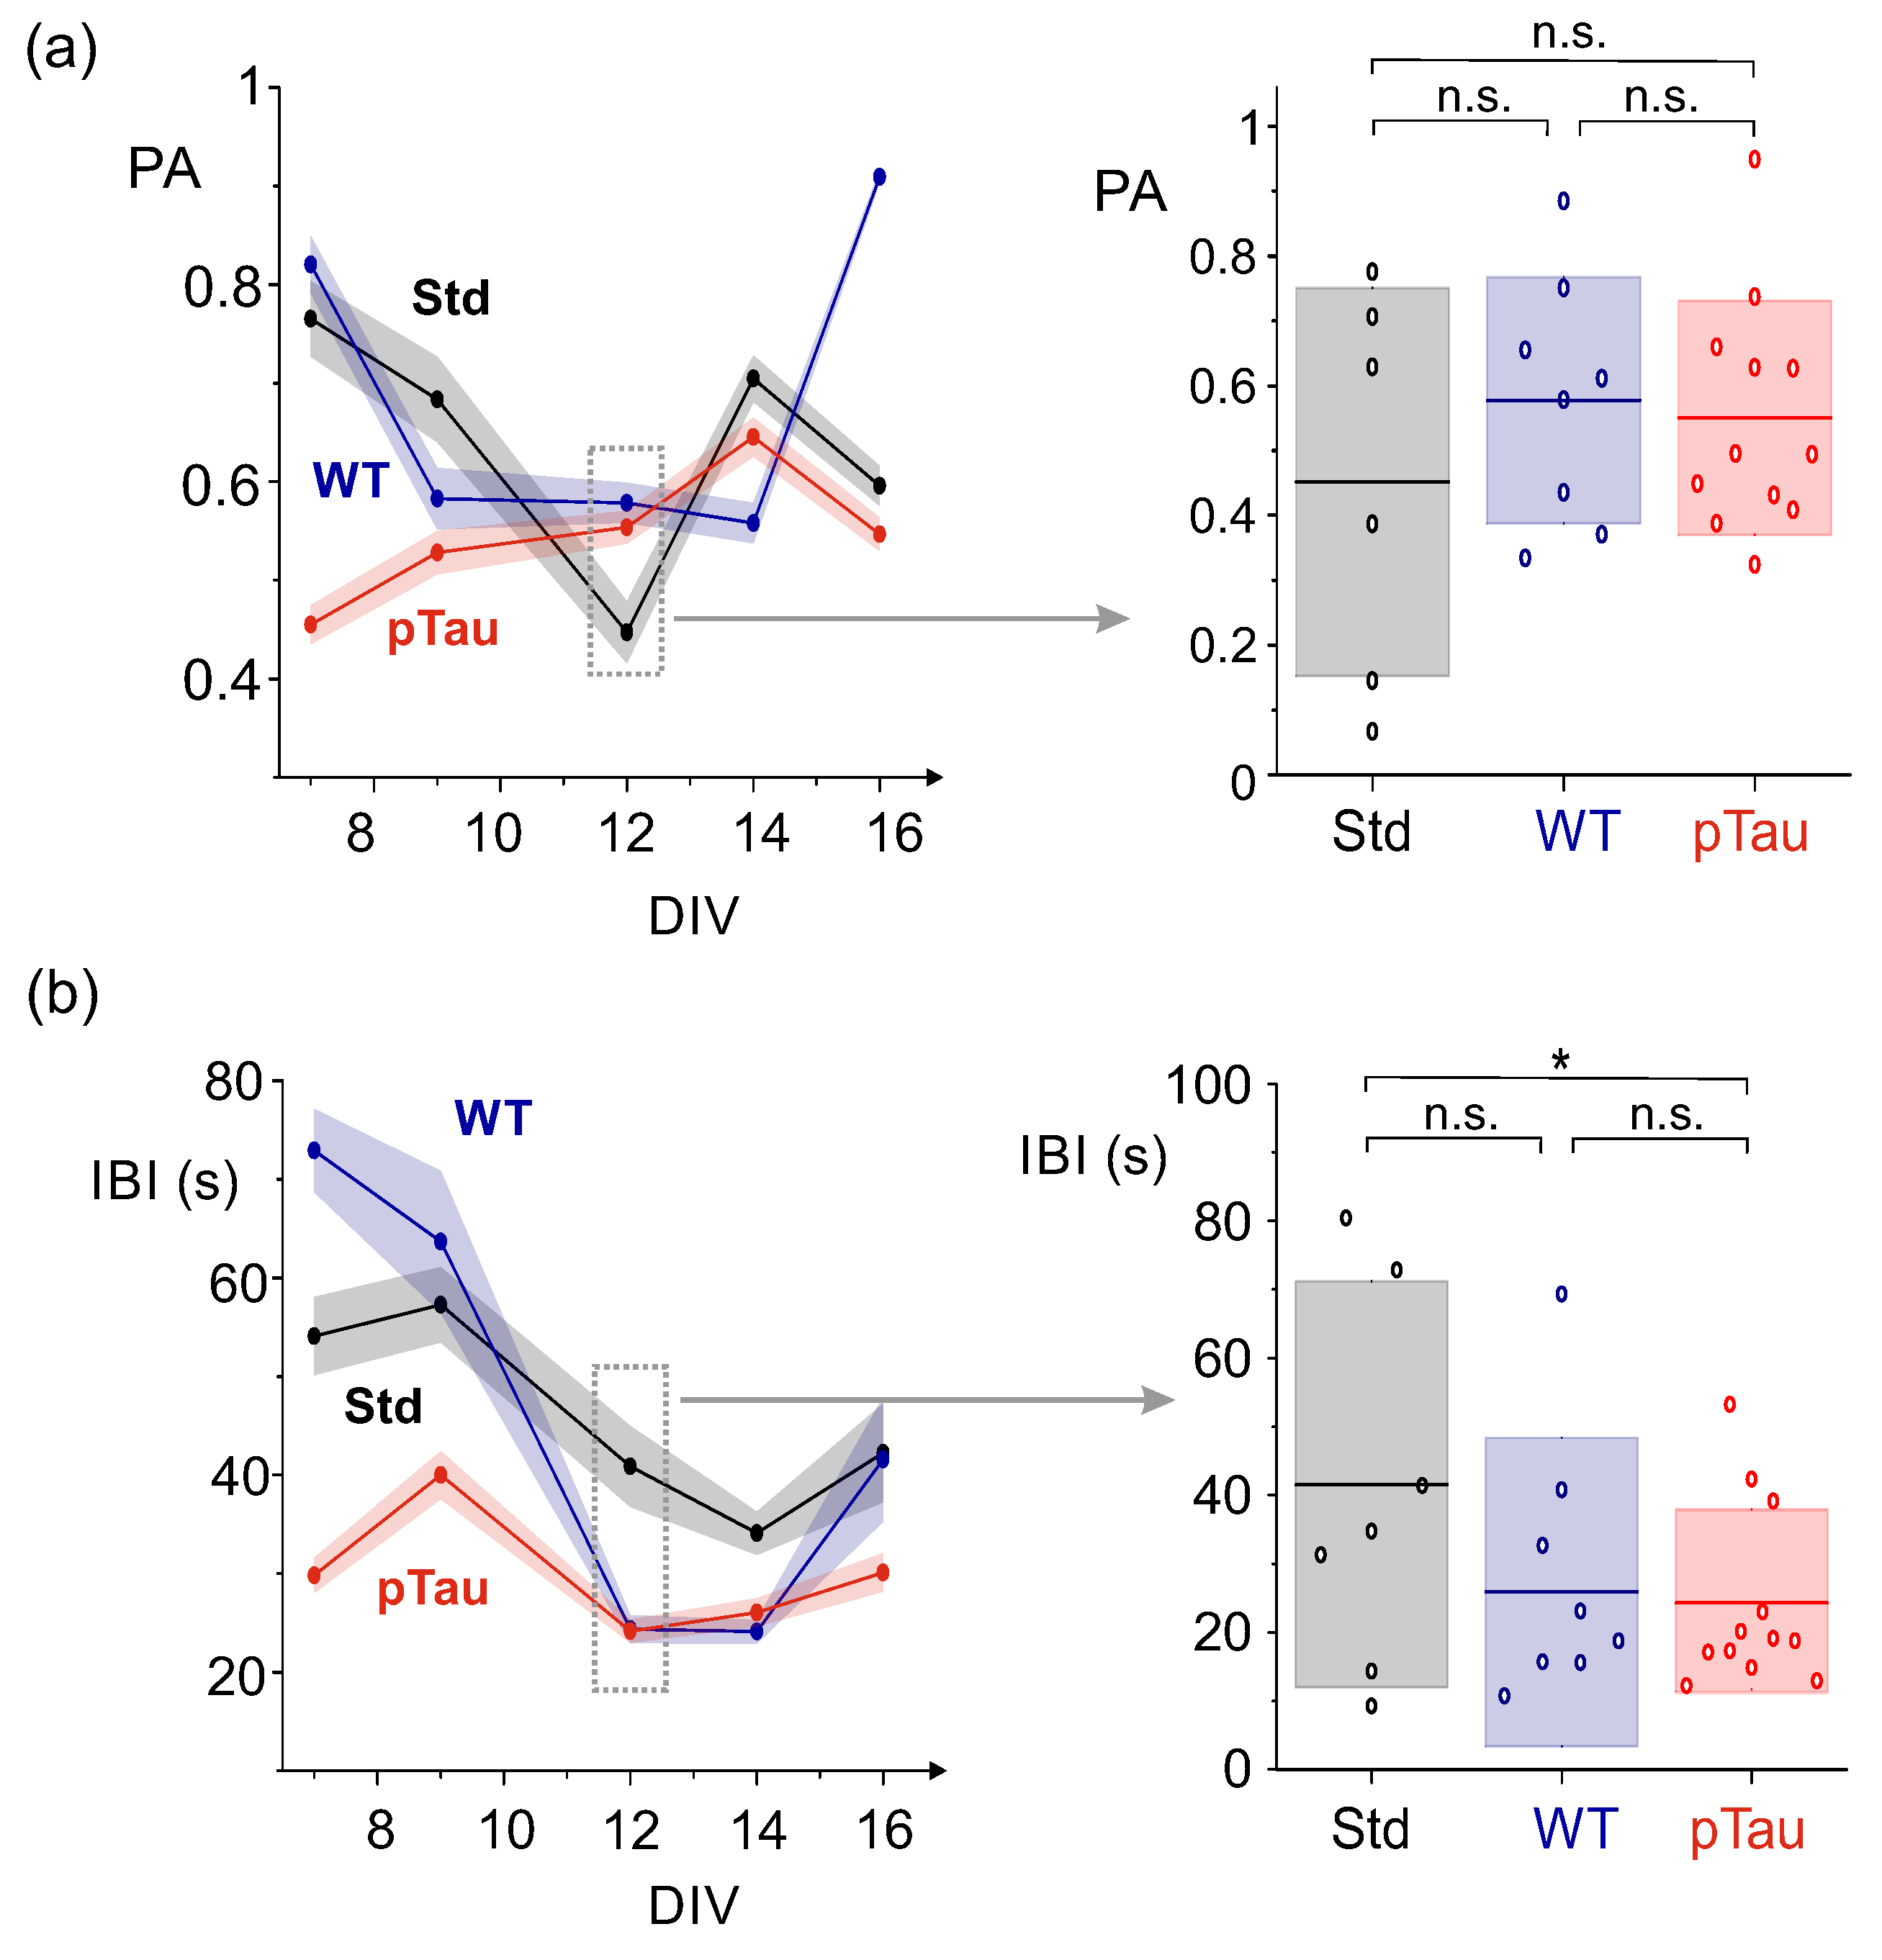
Figure 7.
Analysis of activity propagation velocity in Sarkosyl-treated cultures. (a) Comparison of the evolution of propagating fronts for the Std and pTau conditions. (b) Front velocity for the three conditions, averaged among repetitions (black dots), as a function of DIV together with its standard error (color shadings). (c) Distribution of mean velocity values per culture across the three conditions at DIV 12. The horizontal lines indicate the mean value and the color boxes the standard deviation of the data. for Std, for WT and for pTau. ‘n.s.’ indicates no statistical significance (Student’s t-test).
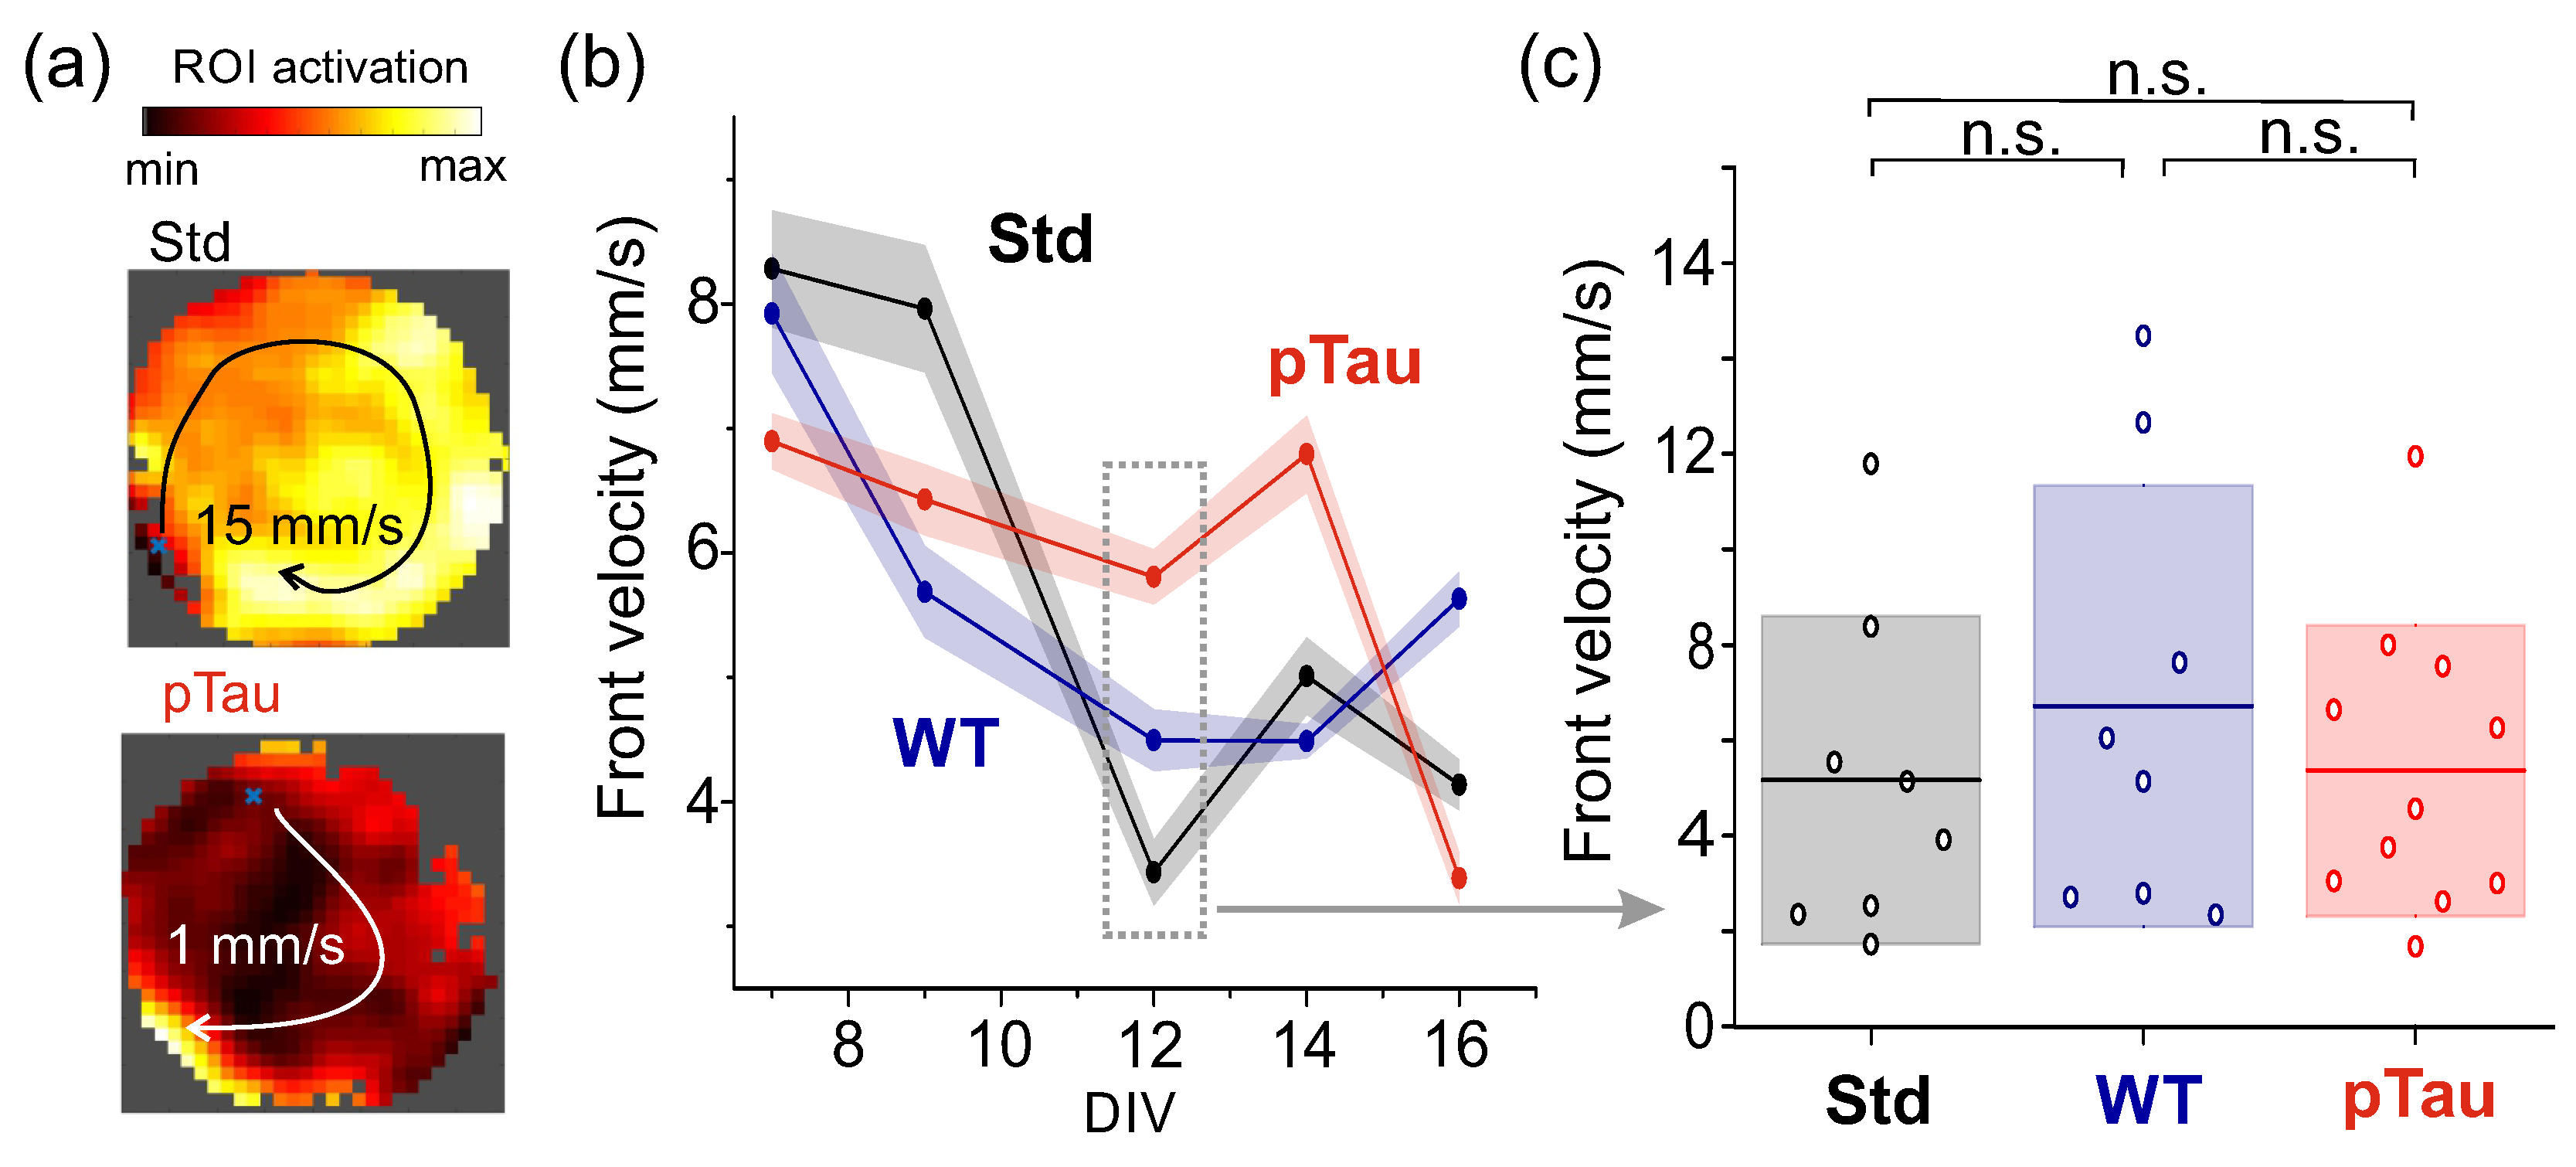
Figure 8.
Connectivity in Sarkosyl-treated cultures. Illustrative connectivity matrices for Std, WT and pTau conditions at DIV 12. On the matrices, black dots correspond to effective connections and color boxes to functional communities. The network measures and Q indicate, for each condition, the global efficiency and the community statistic.
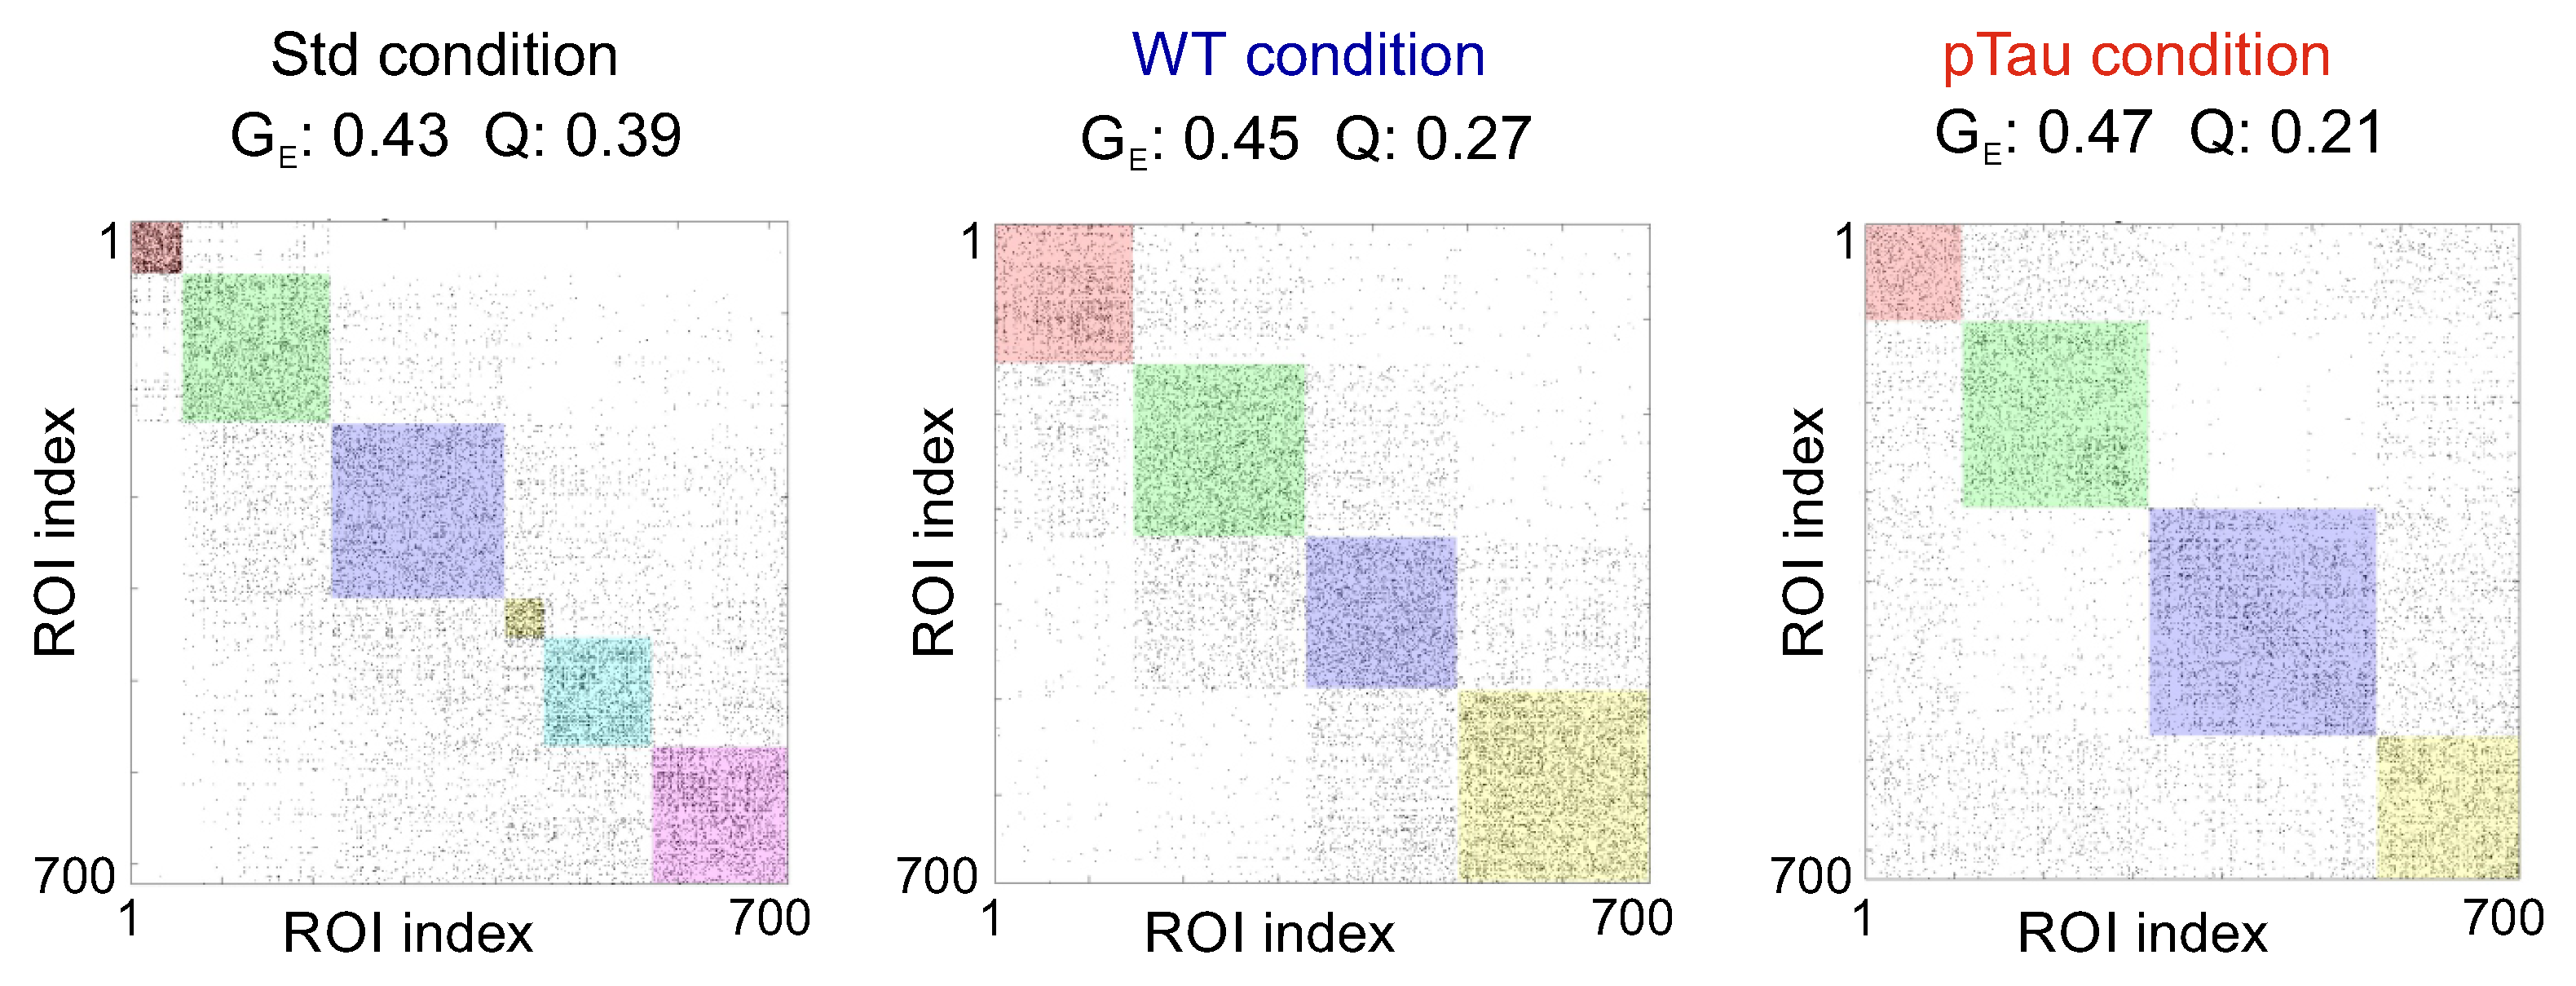
Figure 9.
Network metrics in Sarkosyl-treated cultures. (a) Evolution of average global efficiency (top) and community statistic Q (bottom) with DIV, together with their standard error (color shadings). (b) Distribution of (top) and Q (bottom) values for each culture condition and replicates at DIV 12. In the box plots, horizontal lines represent the mean value and the color boxes the standard deviation of the data. N for Std, N for WT and N for pTau. ‘n.s.’ indicates no significant statistical differences (Student’s t-test).
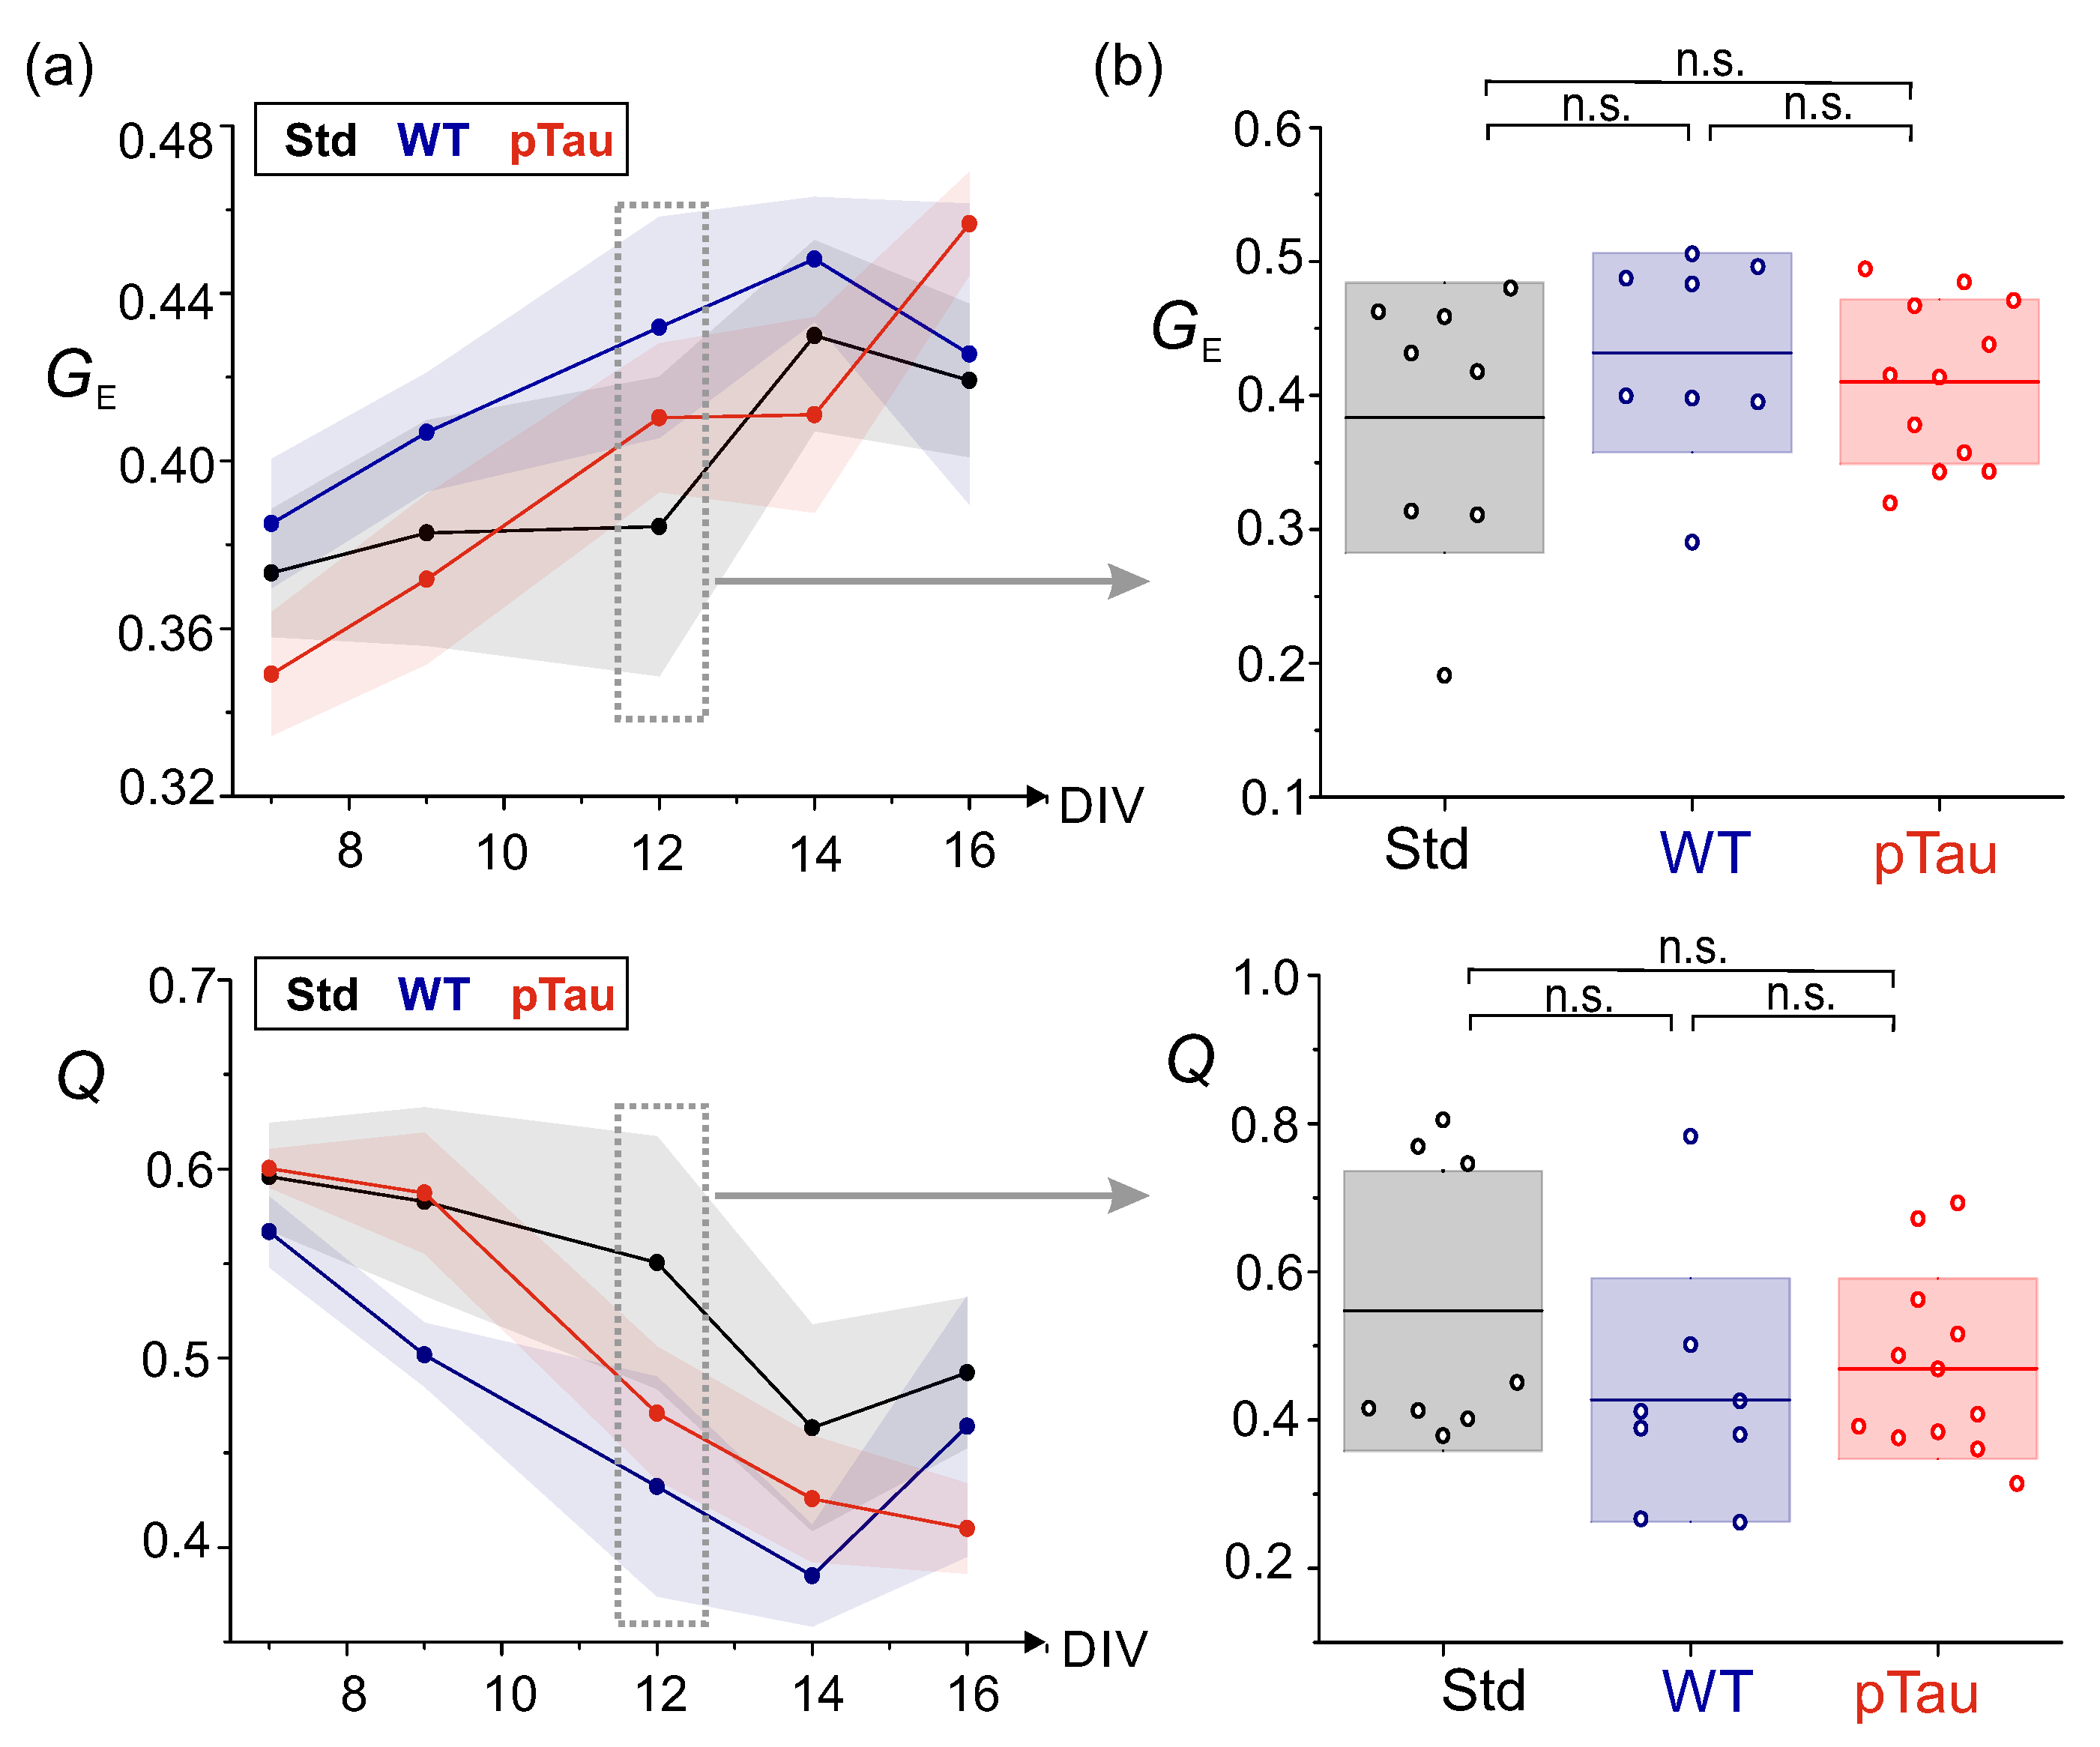
Figure 10.
Illustrative spontaneous activity data of neuronal cultures expressing P301L human tau. (a) Raster plots and population activity (PA) quantification for standard cultures at DIV 12, with either no P301L expression (Std, left) or expressing it (vStd, right). (b) Corresponding raster plots and PA quantification for P301L cultures with additional inclusion of wild–type tau (vWT, left) or pathological tau (vpTau, right). For the latter, the presence of pTau increased neuronal bursting, as observed by the higher density of collective activity events in both the raster and PA plots.
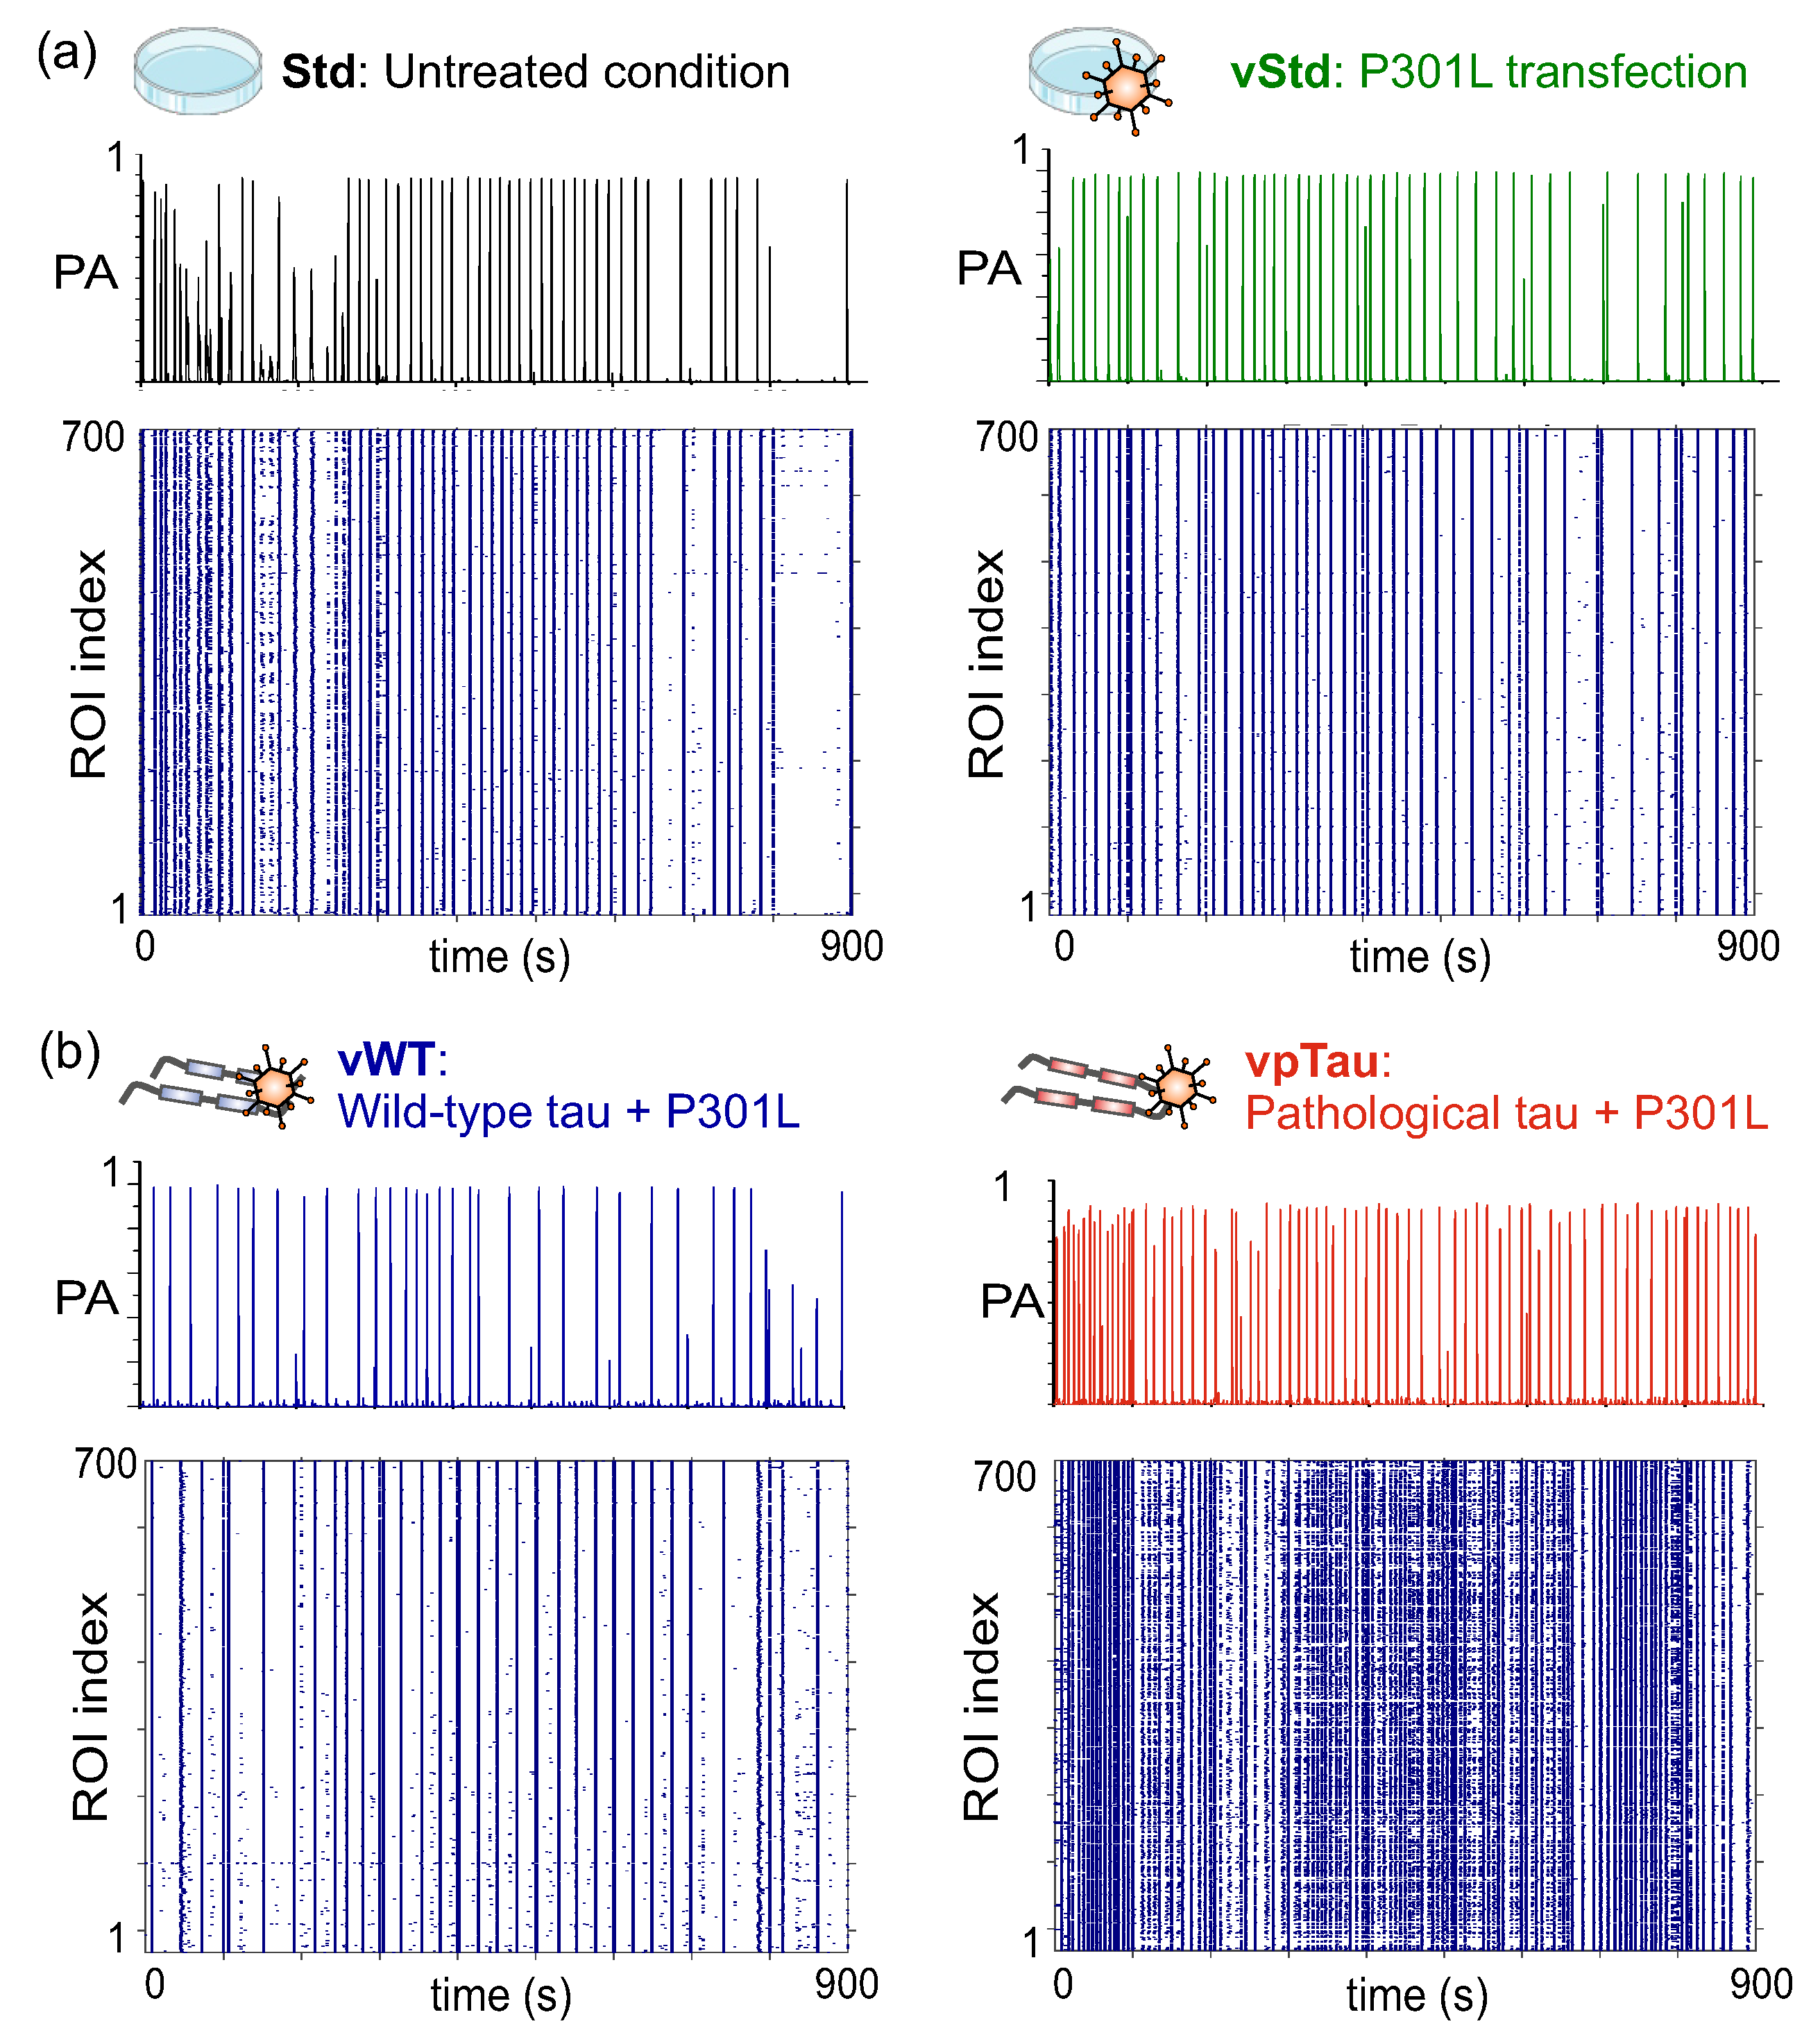
Figure 11.
Dynamics in neuronal cultures expressing P301L human tau. (a) Left: Evolution of the average front velocity along DIV for the four conditions explored (Std, vStd, vWT and vpTau). Each dot is the average value among experimental repetitions, and shadings are the standard error. Right: Box plots showing the distribution of front velocity vales at for the different repetitions (colored circles) of a given condition at DIV 12. (b) Left: Evolution of the average population activity (PA) along DIV for the four conditions, with data points indicating average value and shadings the standard error. Right: Box plots for the distribution of PA values for the different repetitions (colored circles) of a given condition at DIV 12. (c) Left: Corresponding evolution of the inter–burst interval (IBI), with data points indicating average value and shadings the standard error. Right: Distribution of IBI values for the different repetitions of a given condition at DIV 12. In all box plots in the figure, horizontal lines represent the mean value of the distribution and color boxes the standard deviation of the data. Statistics correspond to for Std, for vStd, for vWT and for vpTau. * p < 0.05 and n.s means ’non-significant´ (Student’s t-test).
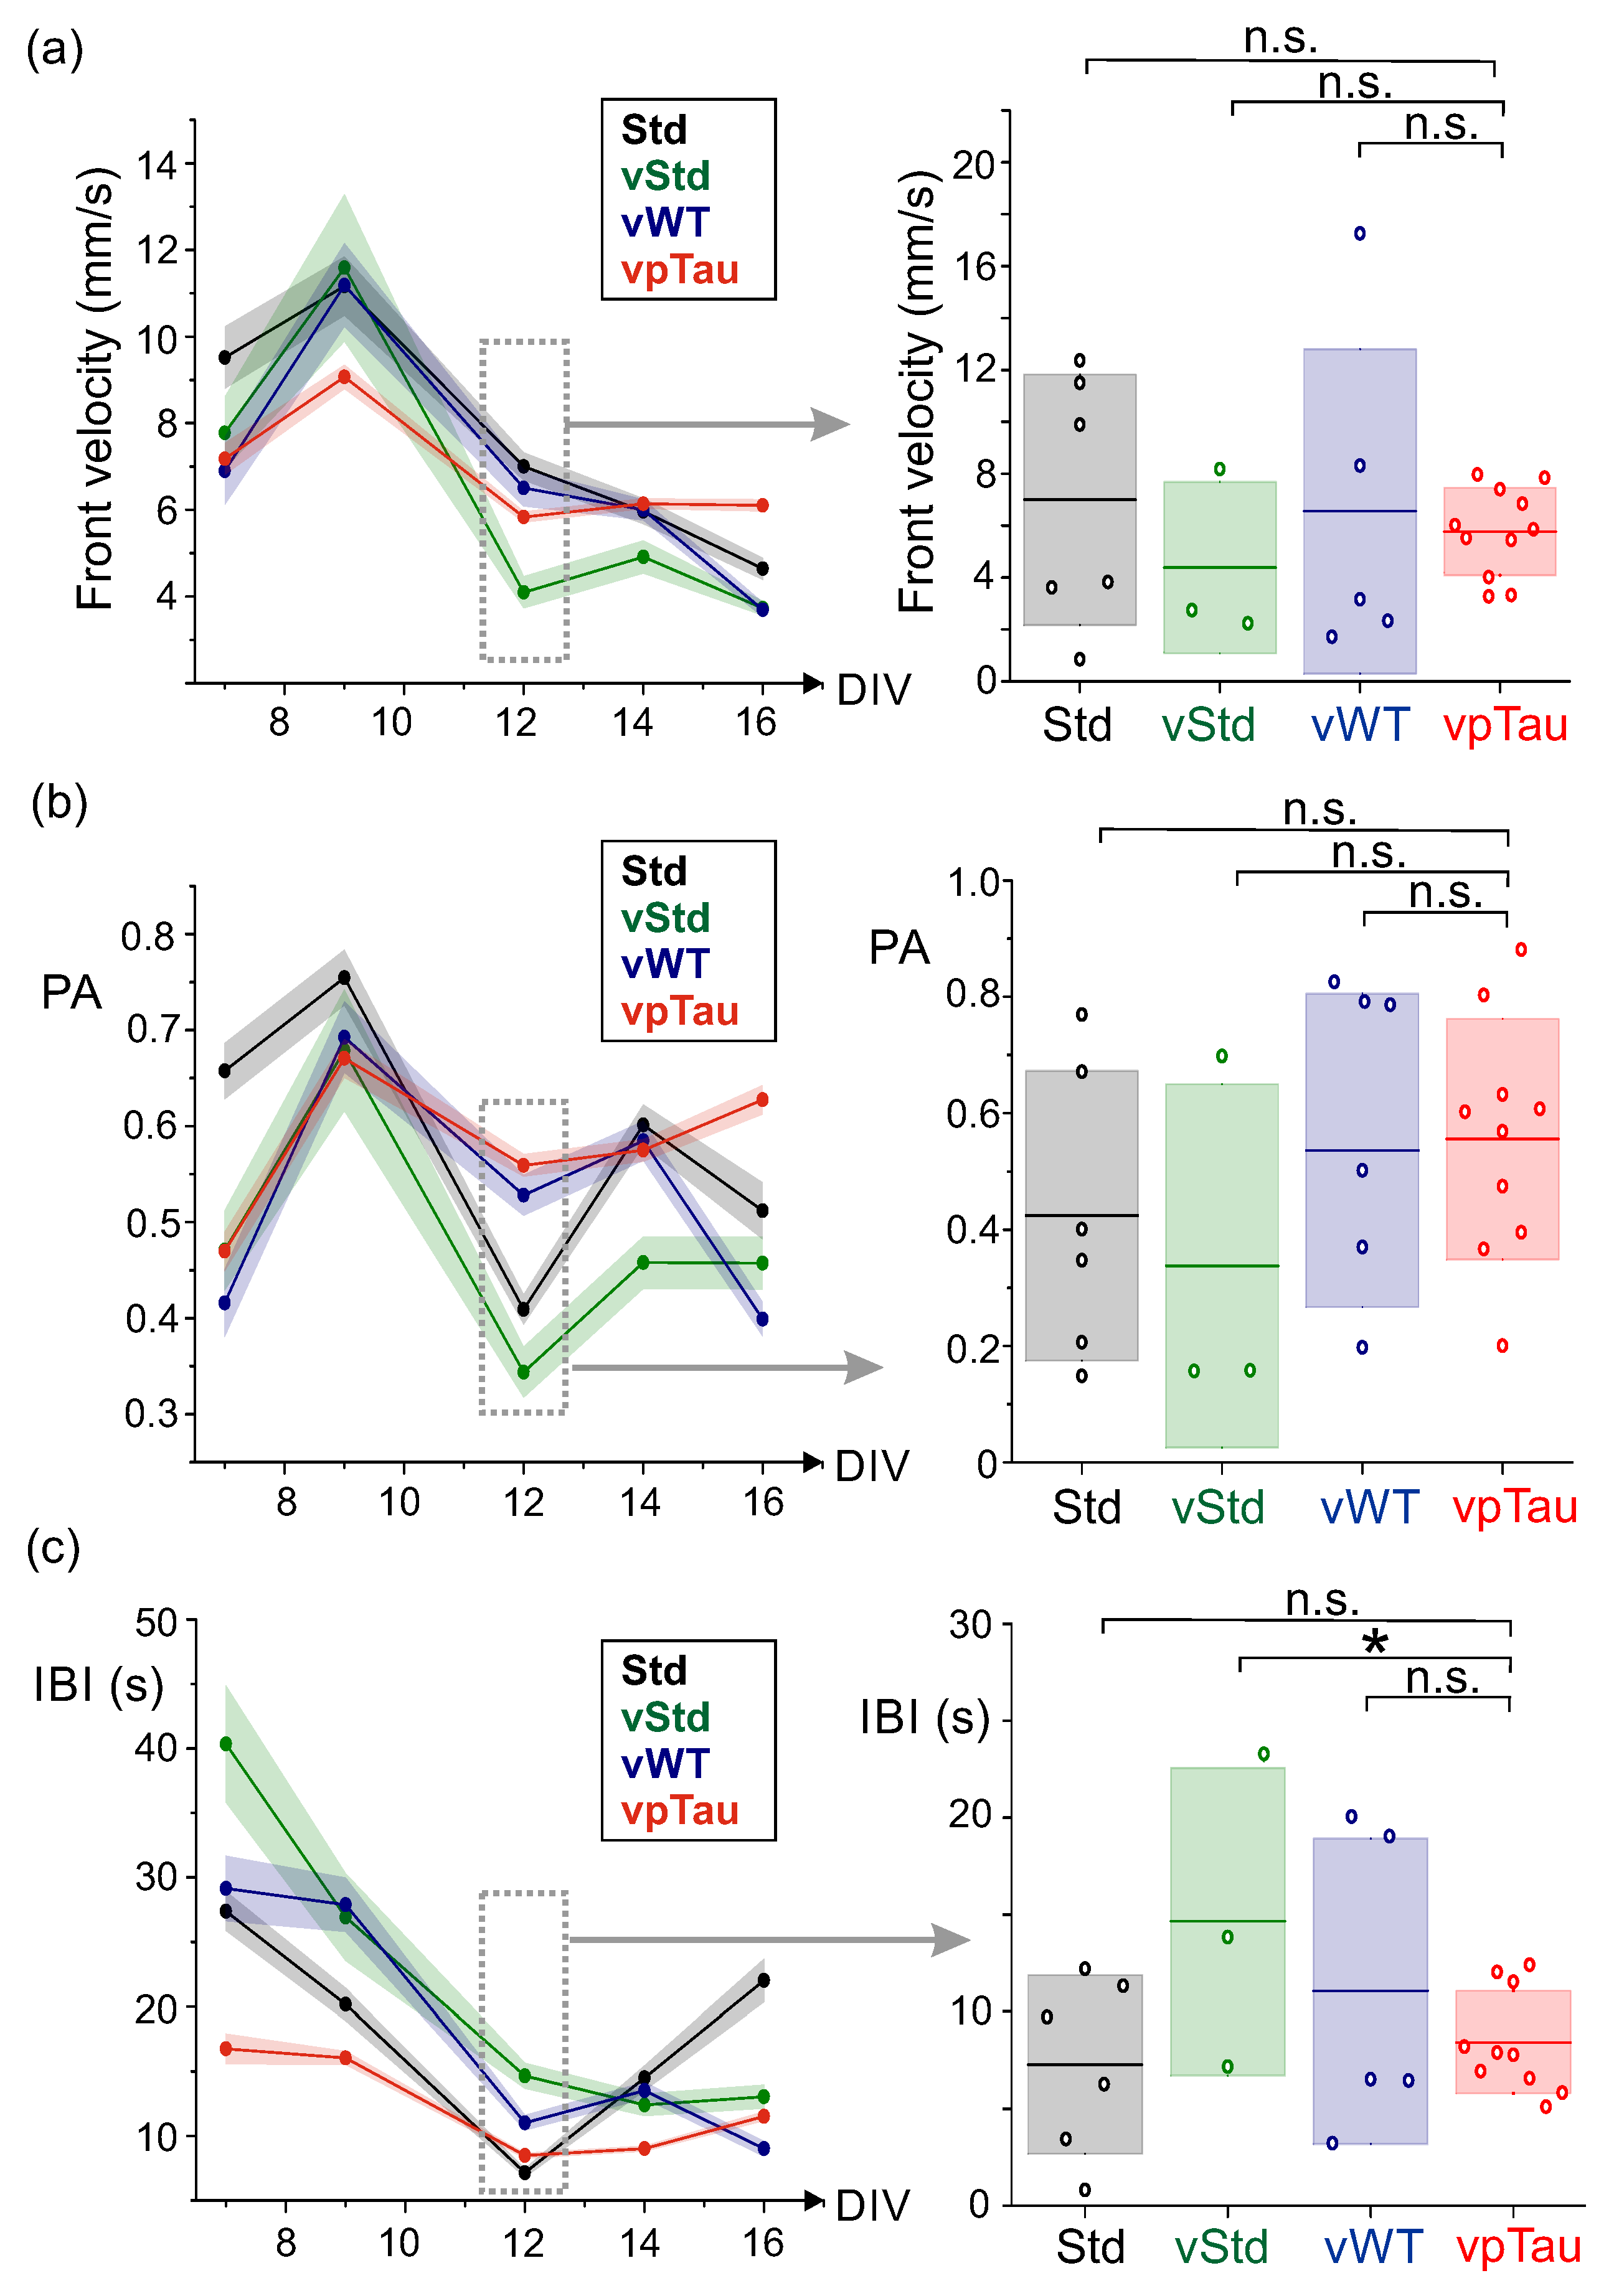
Figure 12.
Network metrics in cultures expressing P301L human tau. (a) Evolution of average global efficiency with DIV (left) together with its standard error, and distribution of values for the different replicates at a given condition at DIV 12 (right). (b) Evolution of the average community statistic Q with DIV (left), and distribution of Q at DIV 12 for different replicates and conditions (right). In the box plots, colored circles are data points for a given replicate, horizontal lines the mean value of the distribution and color boxes the corresponding standard deviation. For the box plots, N for Std, N for vStd, N for vWT, and for vpTau. ‘n.s.’ indicates no significant statistical differences (Student’s t-test).
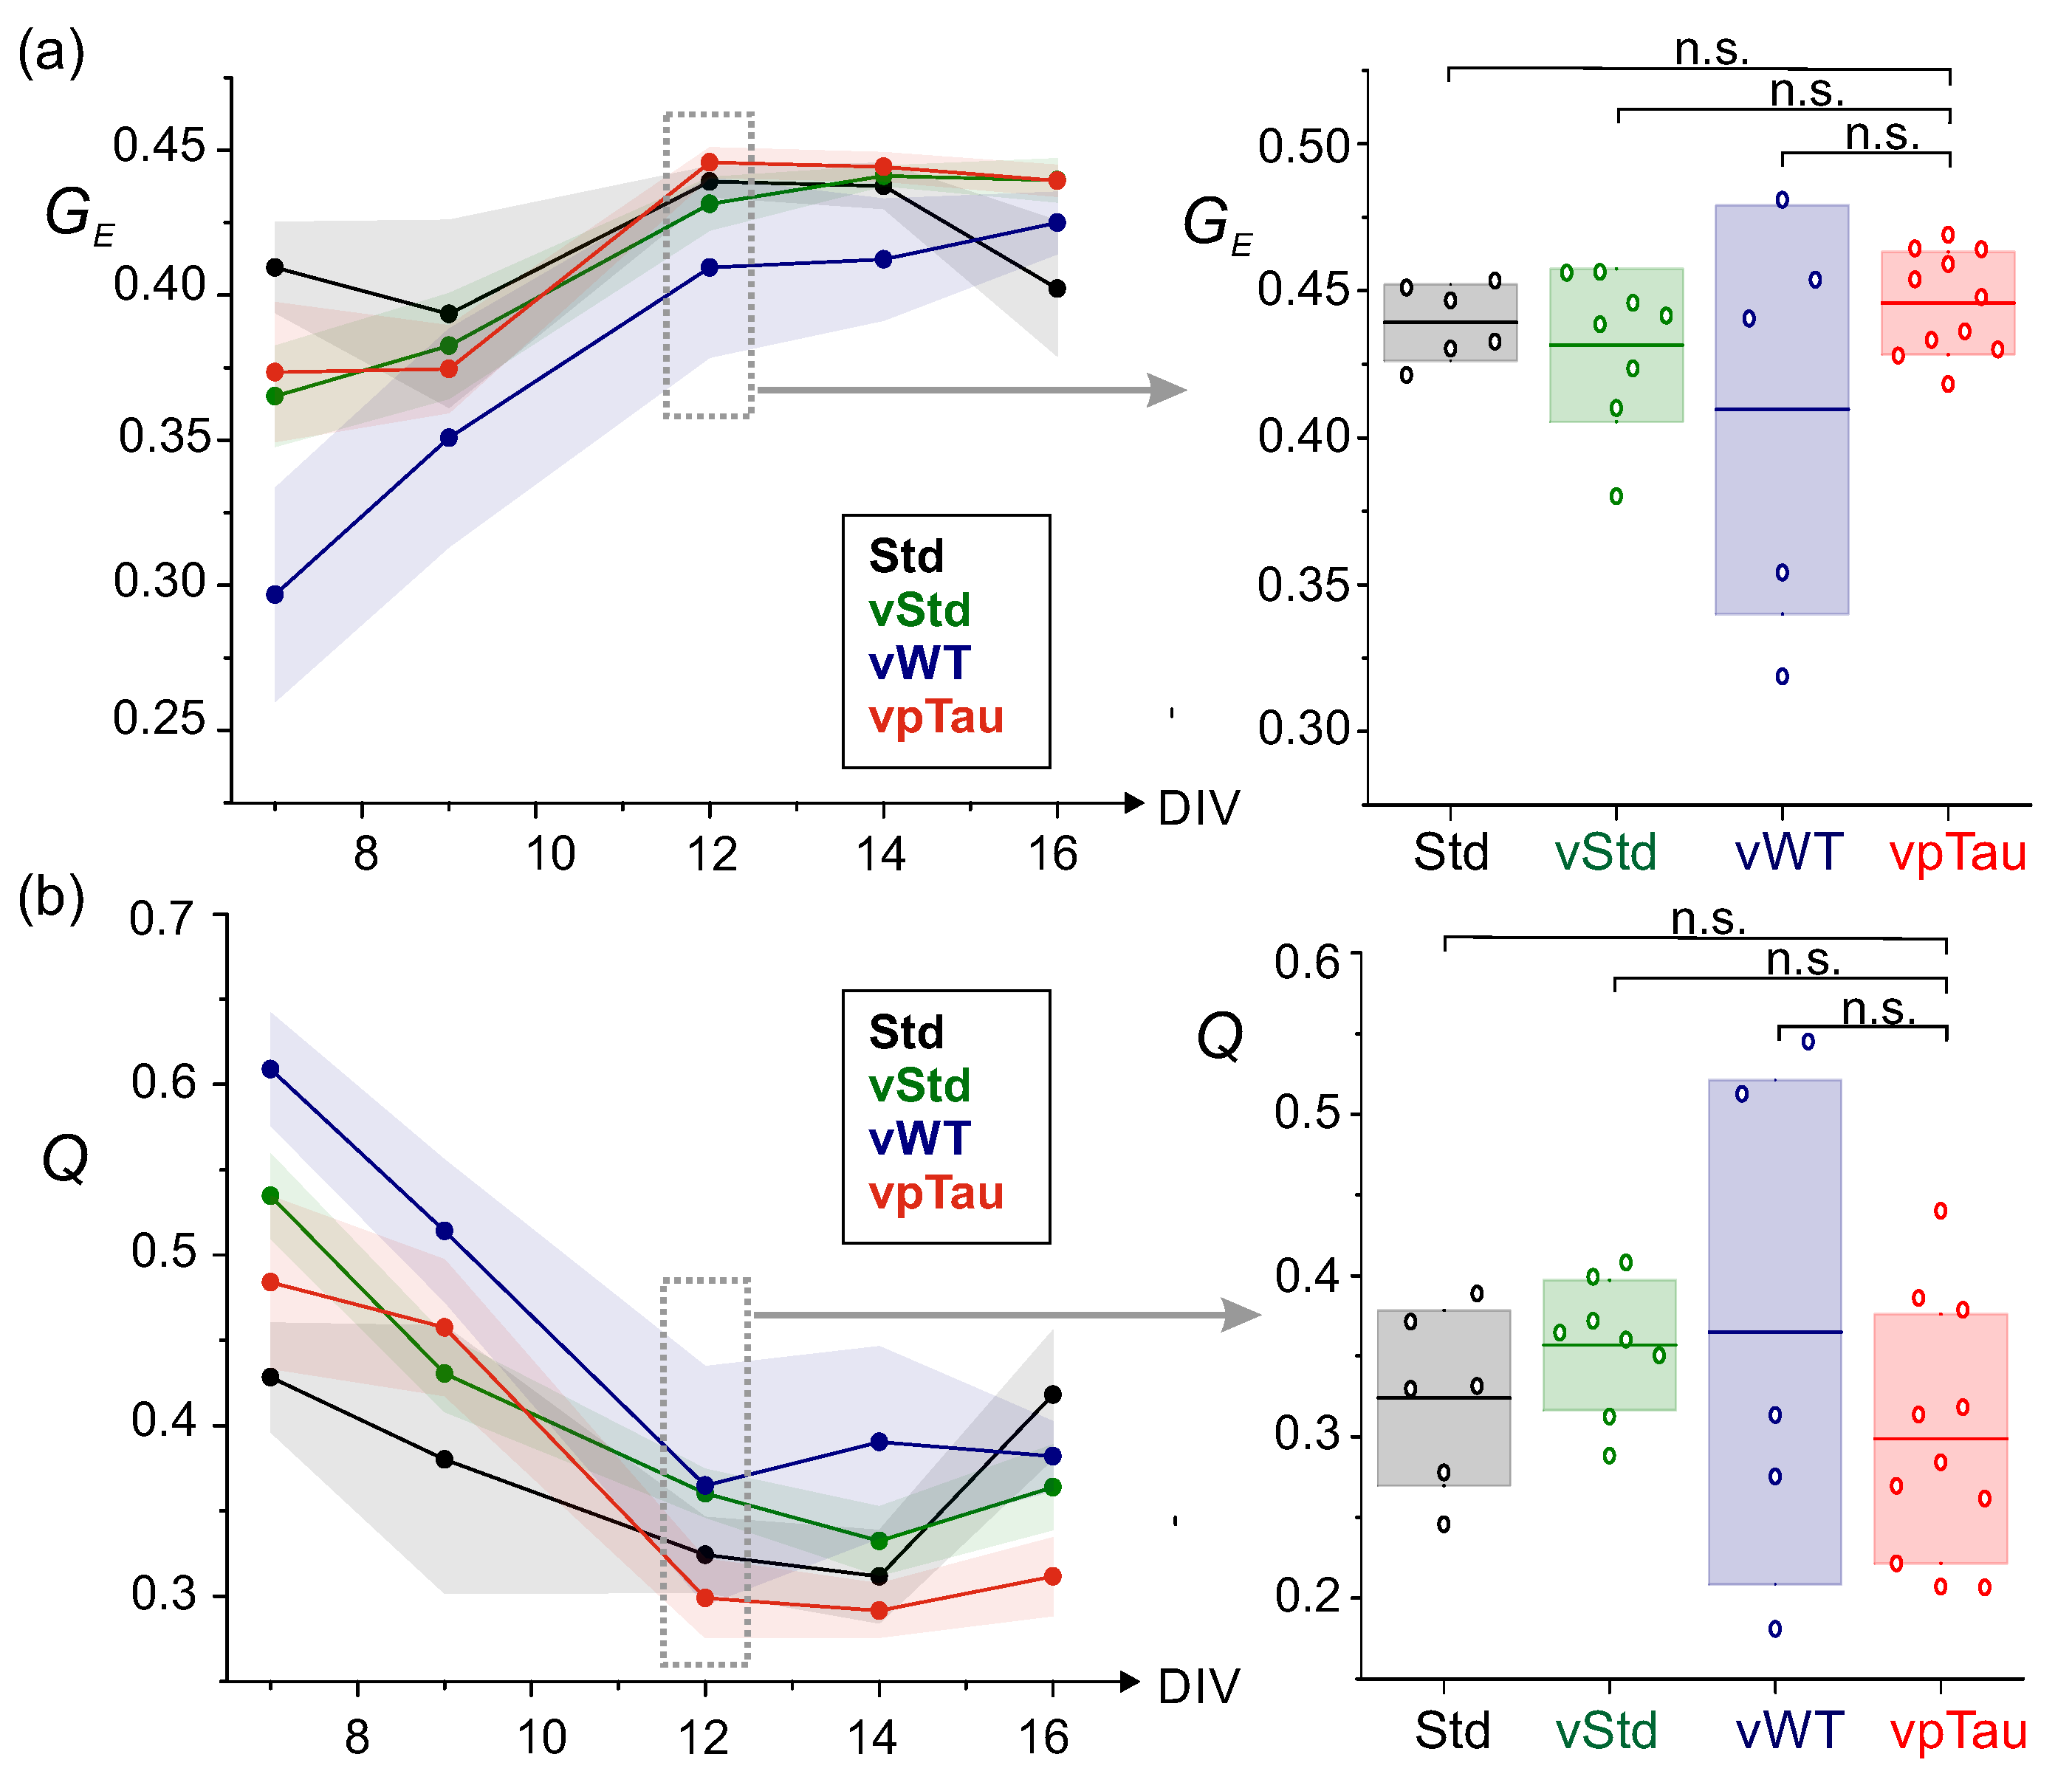
Disclaimer/Publisher’s Note: The statements, opinions and data contained in all publications are solely those of the individual author(s) and contributor(s) and not of MDPI and/or the editor(s). MDPI and/or the editor(s) disclaim responsibility for any injury to people or property resulting from any ideas, methods, instructions or products referred to in the content. |
© 2025 by the authors. Licensee MDPI, Basel, Switzerland. This article is an open access article distributed under the terms and conditions of the Creative Commons Attribution (CC BY) license (http://creativecommons.org/licenses/by/4.0/).
Copyright: This open access article is published under a Creative Commons CC BY 4.0 license, which permit the free download, distribution, and reuse, provided that the author and preprint are cited in any reuse.


