
Submitted:
12 November 2025
Posted:
13 November 2025
You are already at the latest version
Abstract
The study of human population dynamics at a country level is a critical topic. Understanding population trends in a given country can be highly valuable for designing policies related to birth control, economy, urban planning, among others. In this work, we analyze data from eight countries whose population growth tends to follow a logistic pattern over time. In particular, we focus on the carrying capacity parameter, and observe how this value can change its interpretation. We define a socio-economic asymptotic value, and claim that this value plays the role of a socio-economic carrying capacity in some of the countries under study. Each country within this study present different socioeconomic conditions, densities and population size. However, the sigmoidal growth seems to be present in all of them. This work invites the community to think different about the traditional carrying capacity definition.
Keywords:
carrying capacity
; logistic model
; socio-economic asymptotic value
1. Introduction
Living organisms, in one way or another, have managed to persist over generations. A fundamental part of this survival is thanks to the process of reproduction. In order to survive, species reproduce, and with favorable conditions increase in their presence until the ecosystem allows them. This clearly depends on food availability, the presence of predators, climate conditions, and other factors that limit growth.
On the other hand, mathematical tools have been used to understand the dynamics or behavior of population growth. The concept of exponential growth was not used until 1798 when the British economist Thomas Robert Malthus carried out an analysis of the growth of unrestricted human populations [2]. Later, in 1838, Pierre-François Verhulst proposed for the first time what we know today as the logistic equation[3]. One of the first mathematical models used to describe the growth of a species, in this case, the human population of the USA [4], was the use of a first-order autonomous differential equation, generated from the premise that the change in population size P at time t is directly proportional to the number of individuals at that time. The following initial value problem gives the aforementioned model:
Note that , where is the birth rate per capita per unit of time, and is the death rate per unit of time. Thus, a is the growth rate per unit of time. It is easy to show that the solution to the initial value problem is given by the function
Now, note that if , we interpret this as meaning that there are more deaths than births, and therefore, the population will tend to become extinct, whereas if , it implies that the population will grow infinitely over time. The dynamics of this type of growth are known as exponential growth. The problem with this model is that the solution tends to infinity. That is, it would predict that the human population would grow infinitely, which we know is not possible since we live in a place where food, space, and other factors limit this behavior.
Therefore, to better model the behavior of population growth, considering factors that prevent exponential growth, the growth rate is considered not to be constant as in the previous case but rather a rate that depends on the population itself at time t. That is, if the number of individuals at time t is huge, then , assuming there will be death due to lack of space or resources. However, if the population is relatively small, then a must be positive since everyone has space and resources, favoring reproduction. Thus, considering in 1, we obtain the model known as the logistic model, given by the initial value problem (IVP)
where r is the growth rate, and K is the system’s carrying capacity. The function gives the solution to this IVP
Biologically, the system’s carrying capacity represents the maximum sustainable population size K that the environment can support in the long term. Mathematically, is a constant solution of the logistic equation and an attractor invariant manifold for the model’s dynamics.
The logistic equation has been extensively studied and used to model phenomena in different areas, particularly ecology. To mention just a few,[5] provides an extensive analysis of the logistic equation as a model of ecological phenomena; [6] models the evolution of the Aedes Aegypti mosquito using the logistic equation, and [7] uses the logistic equation to model fungal growth.
The purpose of this work is to provide with some insights about what is meant by carrying capacity within the logistic equation. The concept carrying capacity in mathematical biology is well known and it refers to the maximum population size that an environment can sustainably support [8,9,10,11,12]. Populations below this level, tend to increase whereas populations above this level tend to decrease. In both scenarios, the limiting population size is the carrying capacity.
In this article, we analyze solutions to the logistic equation, whose parameters were fitted to population growth data from some countries. The fit was initially performed using a neural network, and to improve robustness, a Bayesian approach was adopted. With the results obtained, we can easily determine the carrying capacity from the equation’s perspective. Although we can observe that populations exhibit this behavior, we cannot claim that a country has reached its carrying capacity in the strict (biological) sense of the concept. Based on this work, we aim to provide information that will allow us to more clearly understand the concept of carrying capacity and how we can reinterpret it, depending on the country under study.
2. Materials and Methods
To properly understand the carrying capacity concept within the logistic model, we analyzed the evolution of the population size in the following countries: Mexico, Democratic Republic of the Congo, India, China, Germany, Angola, Japan, and Brazil. We consulted databases of https://datacommons.org/ from 1960 to 2020 in 5 years intervals. The data corresponding to these countries are shown in Table 1.
As a first approximation, the parameters of Equation (4) were fitted to the data in Table 1 using the neural network approach [1]. To do this, (5) was used as the test function and 6 as the error function (See Appendix A for more details).
To make the results more robust, the parameter values obtained from neural network fitting were used to implement Bayesian inference. In these sense, to implement the Bayesian inference, we consider that the population at year i () from a country follows a Normal distribution with mean , given by the Equation (4), and a standard deviation , which will be estimated. Thus, the sampling distribution is given by
where is the observed data from a country (according to Table 1) and is the parameter vector. Assuming prior independence, the joint prior distribution for the parameter vector is
where , , , and are the probability density function of either Uniform or Normal distributions. The parameters values of each distribution is given in Table 2.
Then, the posterior distribution of the parameters of interest is
We used a Markov Chain Monte Carlo (MCMC) method based on the Metropolis-Hasting algorithm [13] to obtain the estimated probability density of the parameters. We run the algorithm for one million iterations, and use the last 100,000 to generate the posterior distributions.
3. Results
When we implemented the Bayesian inference method with the Equation (4), there were identifiability problems with the parameters that form the term , so, in order fit the data, we define the parameter s as in the Equation (4). Thus, we consider the solution:
where . The parameters of model (10) were estimated using a Bayesian inference approach. Then, we obtain the following results.
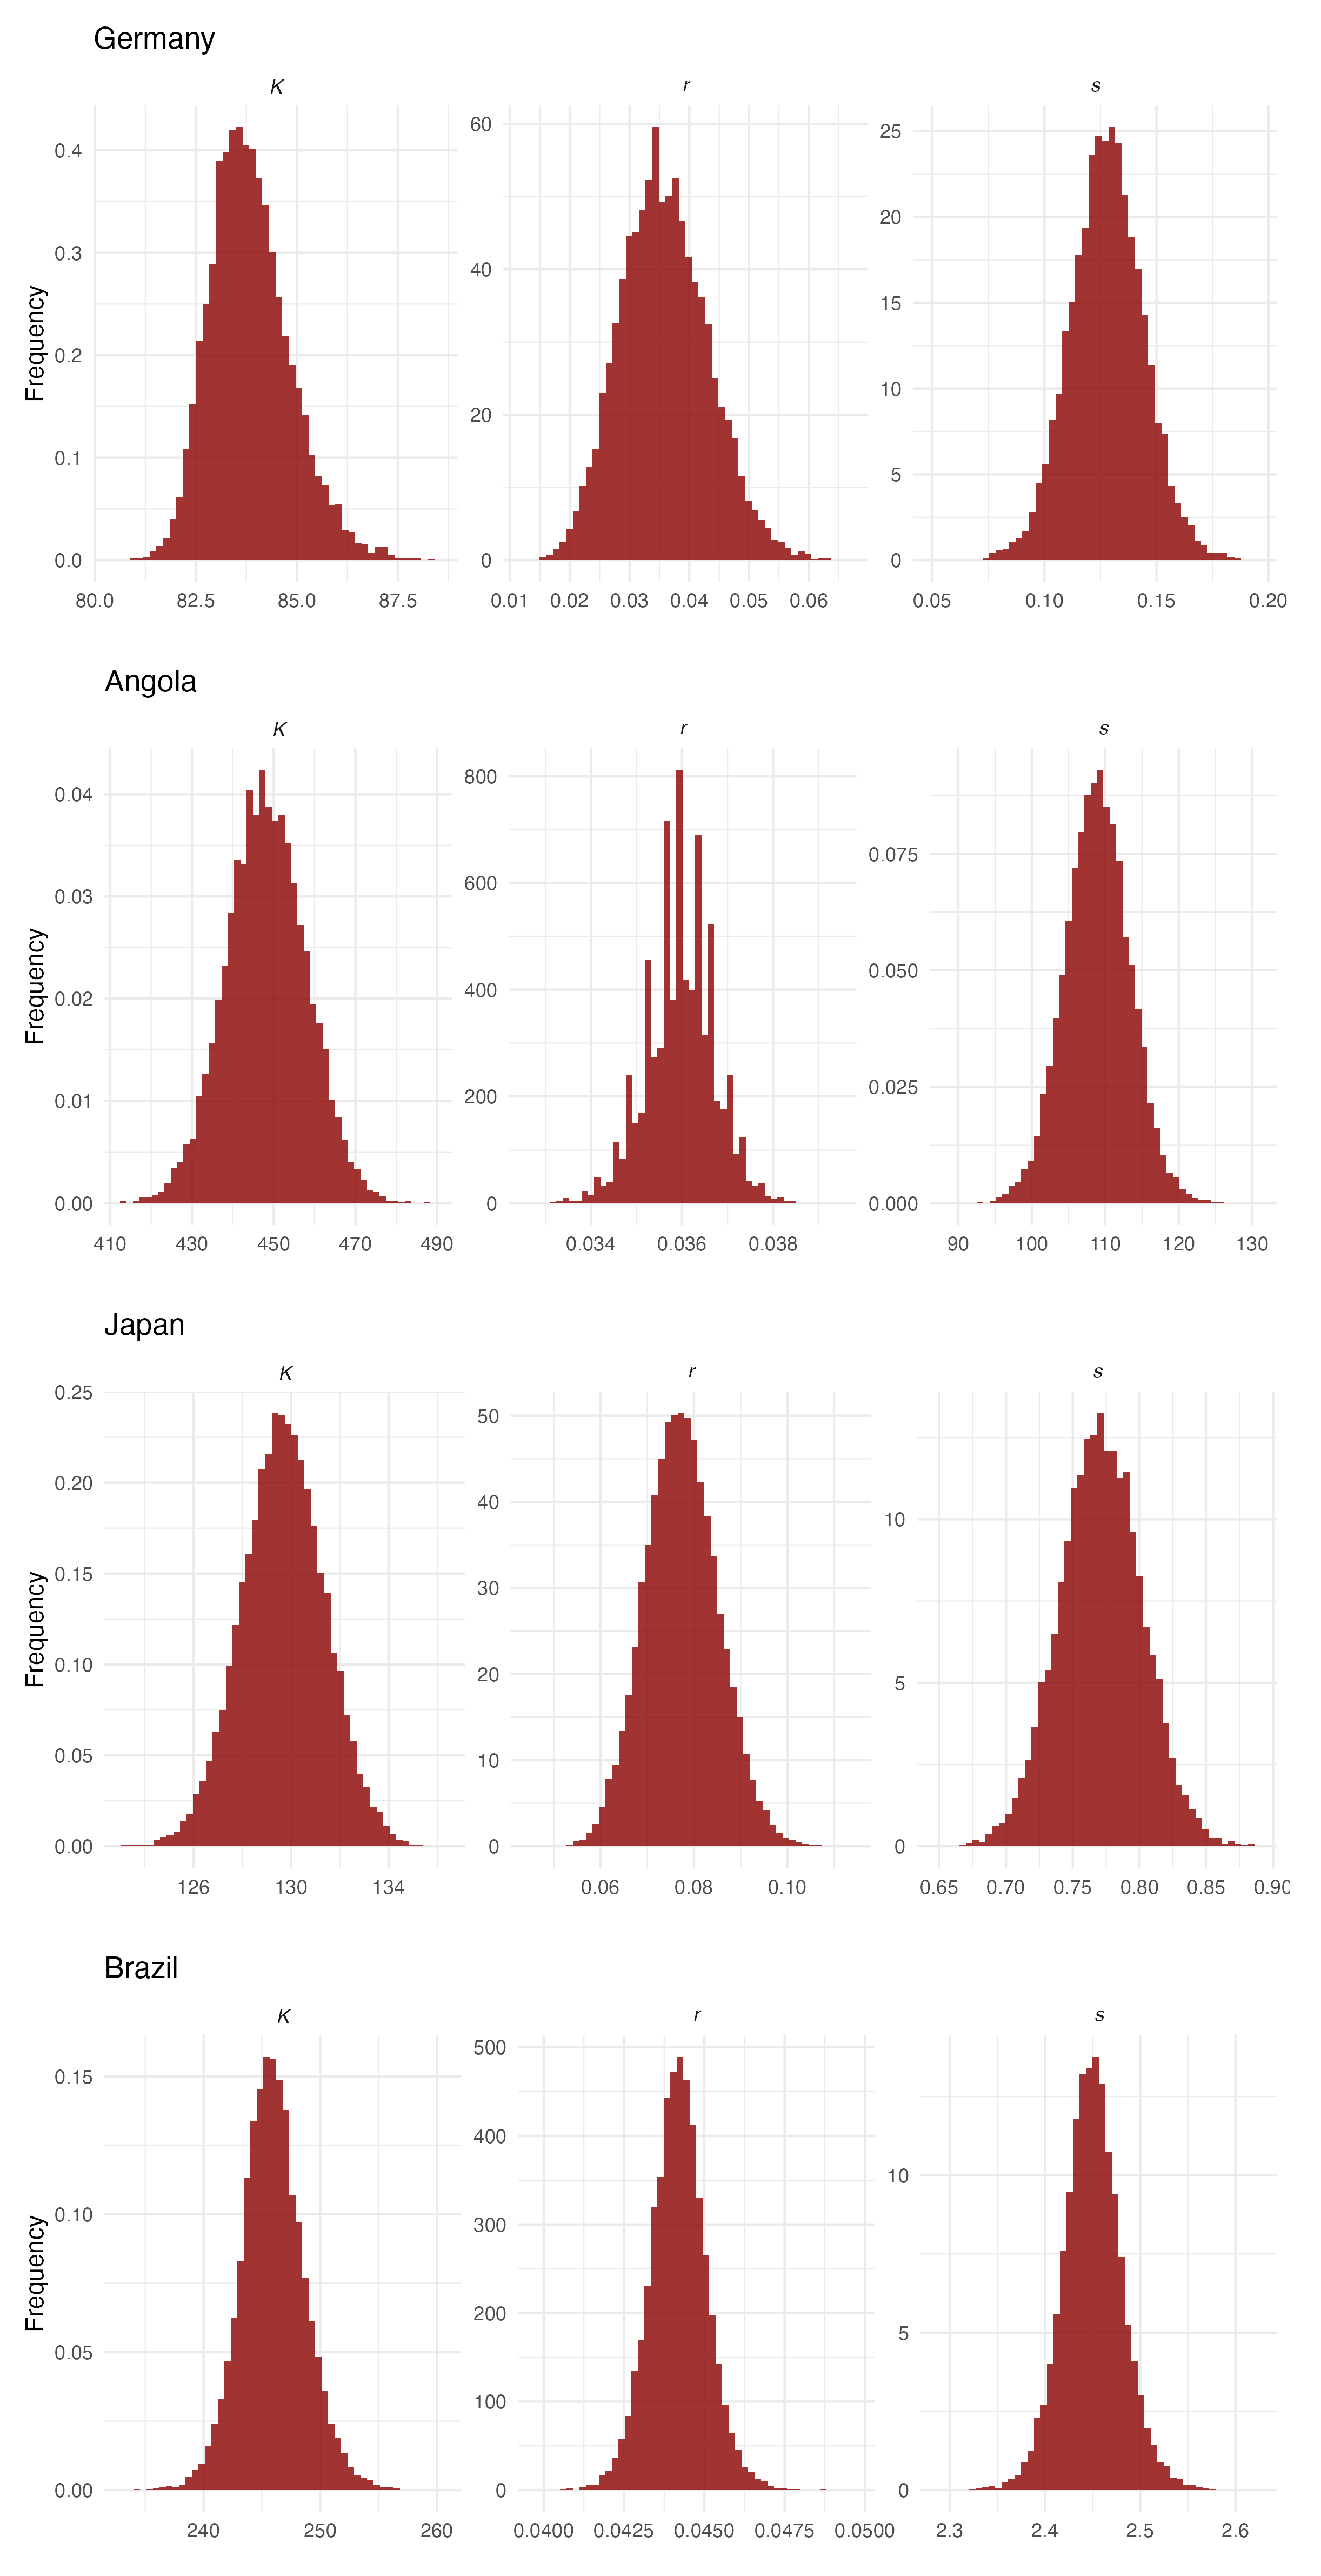
The median and 95% credible intervals of the posterior distributions for K, r, and s are given in Table 3.
Figure 1 displays the posterior distribution of the parameters obtained using Mexico data. The results for all other countries are provided in Appendix B.
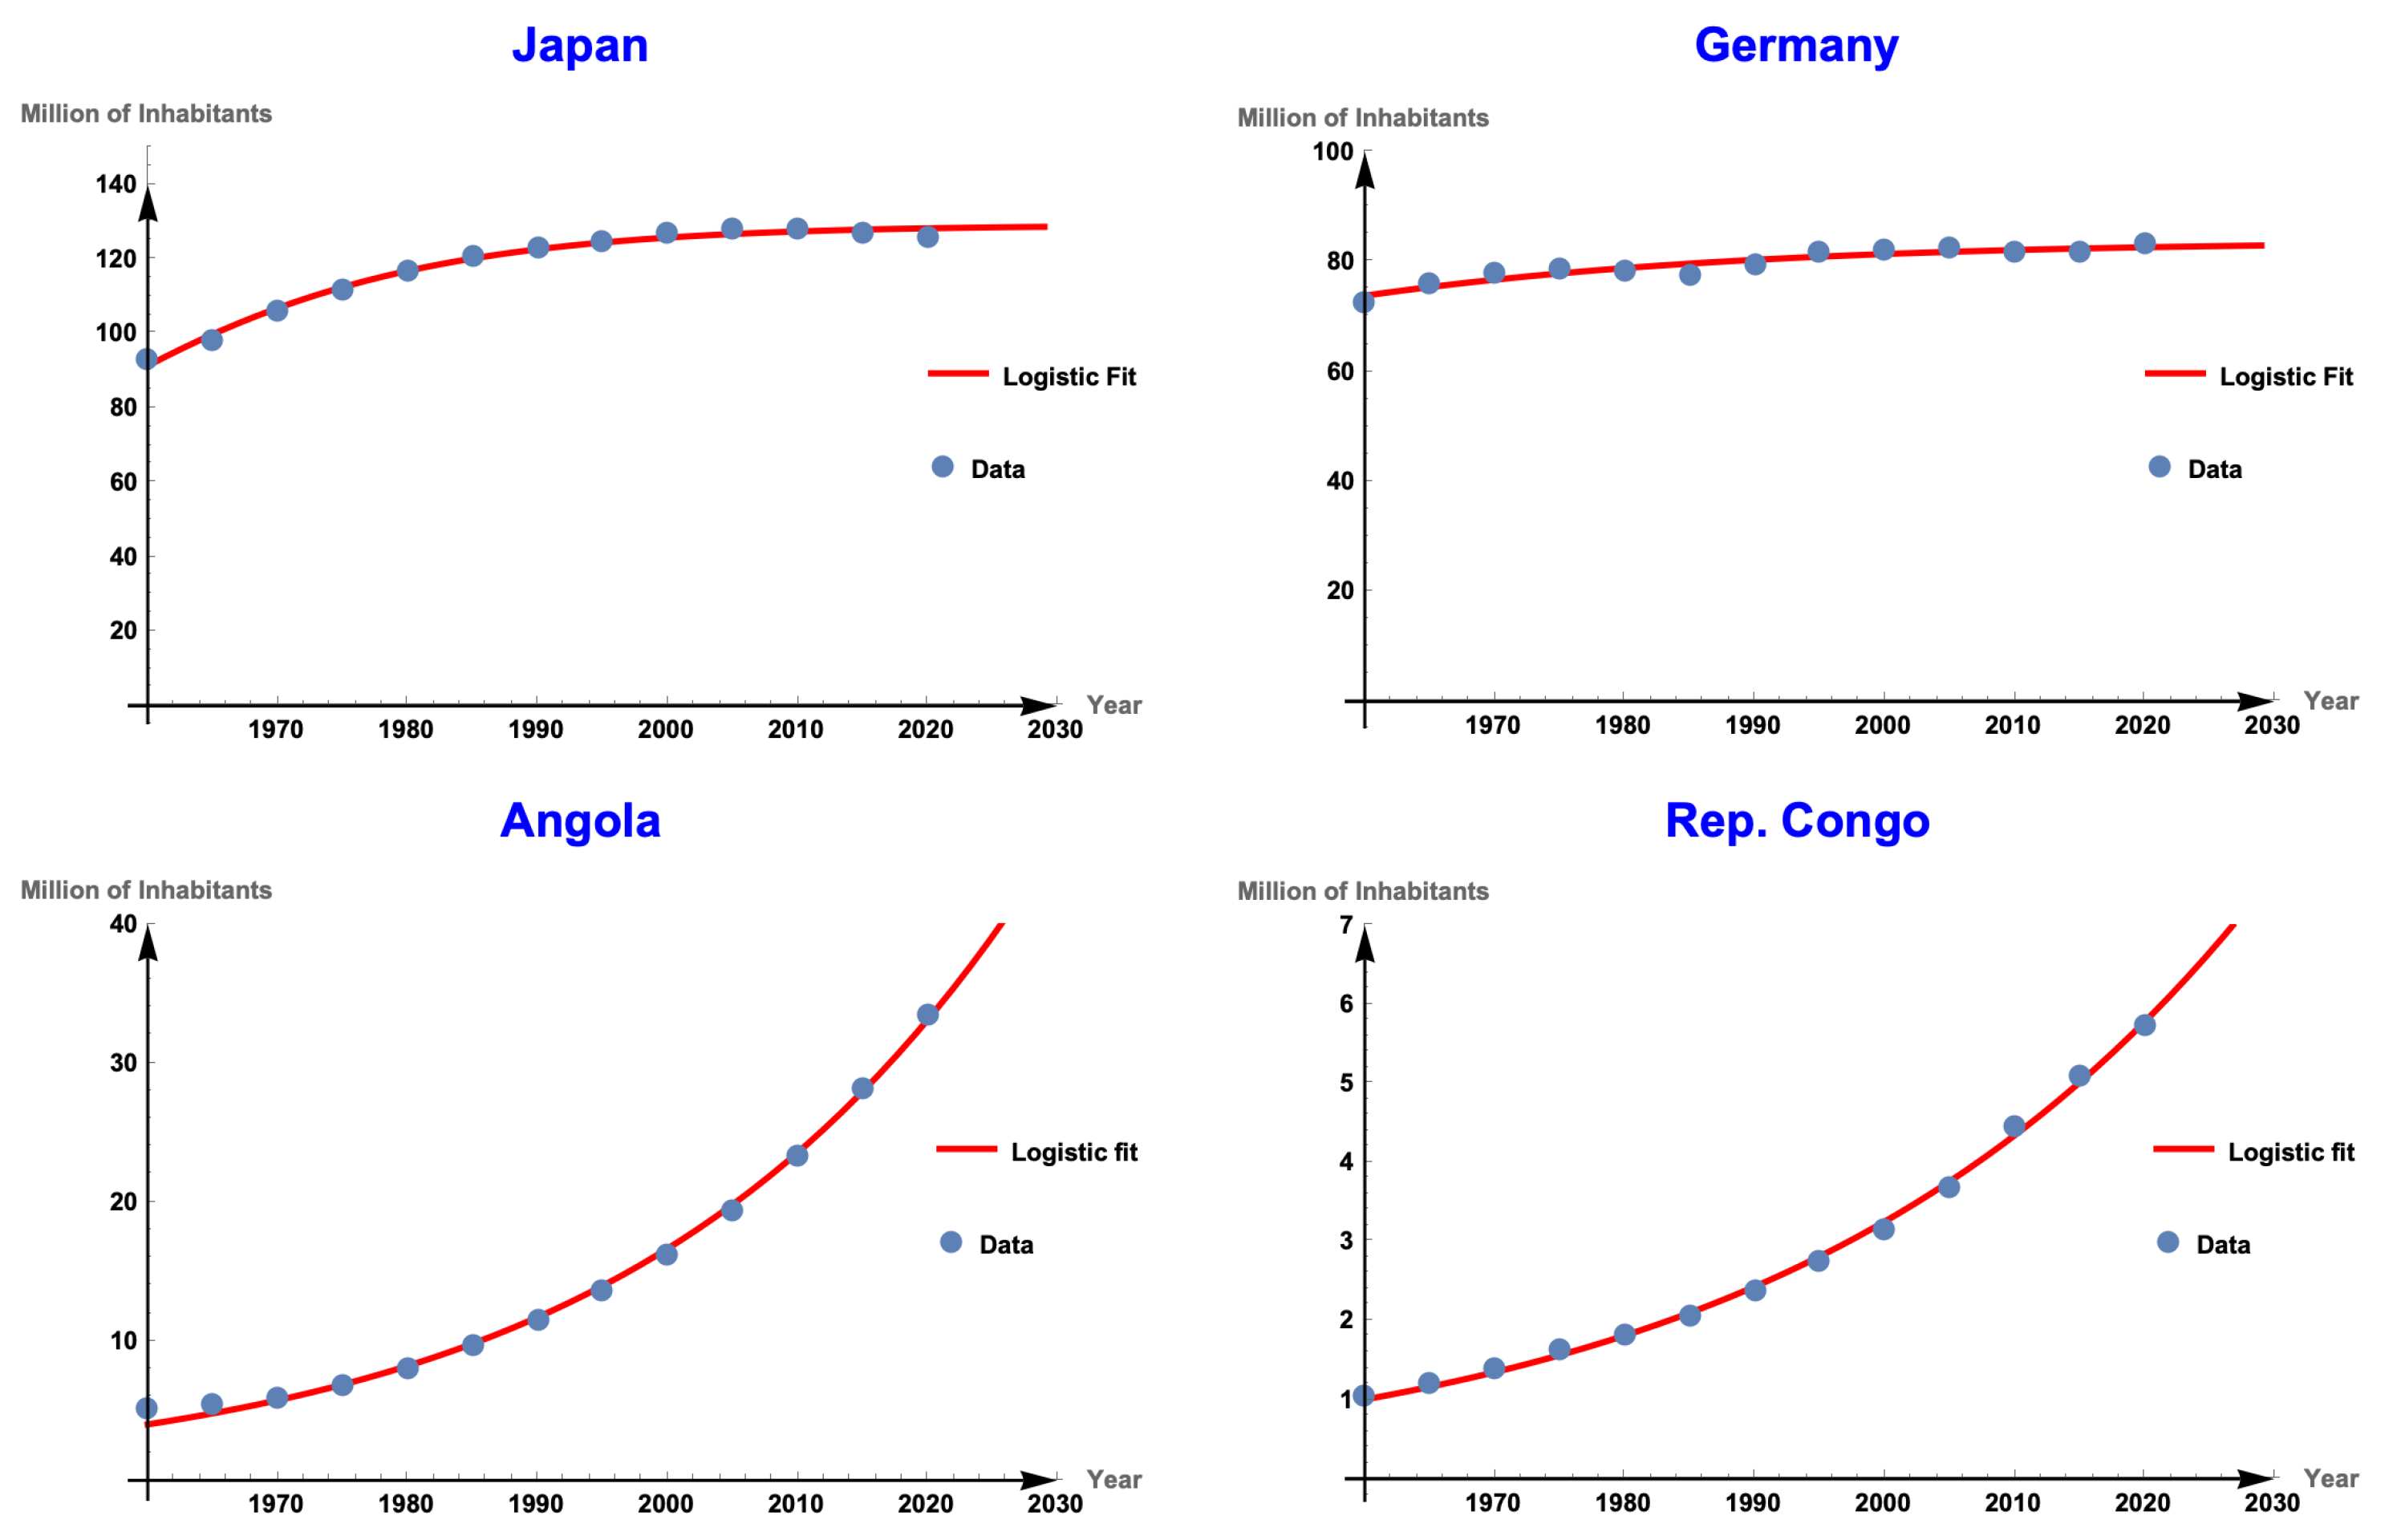
Figure 2 and Figure 3 show the graph of the population data for each country studied, as well as the fit obtained with the logistic model.
Based on the results, we note that in the analyzed cases, the populations exhibit logistic behavior. In some cases, the parameter known as the carrying capacity appears to be well-defined for countries such as Japan and Germany (See Figure 3). As shown in Figure 2, for countries such as Brazil, Mexico, India, and China, we observe a change in curvature that is characteristic of populations approaching their carrying capacity. Finally, for Angola and the Democratic Republic of the Congo, it is difficult to determine when a change in curvature will occur ( See Figure 3).
3.1. Insights into the Carrying Capacity
Starting from the biological interpretation of carrying capacity, we begin by considering adjusting the logistic equation to the evolution of the number of individuals in the countries mentioned above. It is worth mentioning that the countries analyzed here were selected by looking for those that exhibited this behavior. In these cases, we can observe that some countries exhibit exponential growth, meaning they have not yet perceived the problem of overpopulation; that is, they have not reached their carrying capacity. Other countries are in the middle of the logistic curve, and a change in curvature is observed in their behavior; in this scenario, overpopulation is beginning to slow the population growth rate. Finally, we also present cases in which some countries appear to have reached their carrying capacity.
3.1.1. Population Density
Population density is one of the most fundamental factors influencing the determination of carrying capacity. Table 4 show the population density of the selected countries for the year 2021. In the table, we see that India, Japan, and Germany are the countries with the highest population density. Among these three, Japan and Germany are developed nations. In the cases of Japan and Germany, note that they appear to have reached their carrying capacity, In such scenarios, one could consider using the logistic equation to model population growth dynamics in terms of population density rather than the number of individuals. In this way, Using population density as a metric helps standardize the comparative framework among different countries.
Let be A the area of a country. Then, , represents the population density of that country. From Equation (4), we obtain the following equation
In this scenario, , plays the role of the maximum density allowed in a country. In this ideal model, we observe that is a quantity that depends on each country’s culture, geographic location and living standards. For example, according to Table 4, Japan, has a considerably higher value than Germany, even though both countries are approximately the same size. One possible factor is Japan’s maritime environment, facilitating their adaptation through resource exploitation. On the other hand, India, the country with the highest population density, has not reached a level that we could identify as the country’s carrying capacity. The significance could be that India can support more population due to food resources. Or simply that carrying capacity through population density does not provide a complete measure for a population that behaves logistically. Perhaps, in human populations, one factor to consider is how wealthy can be in average an adult in a country. For densely populated countries, economic prosperity may be of help to enable the identification of optimal population stabilization levels.
3.1.2. Social and Economical Factors.
In addition to population density, other factors appear to be responsible for a populations reaching an apparent stable level, which is far from the concept of maximum density. Countries such as Mexico, China, and Brazil, with much lower population densities than the three previous countries, are approaching a constant population level that behaves as the carrying capacity in the logistic model. However, in this case, this artificial carrying capacity value can be thought of as a consequence of other factors such as social or governmental policies [14,15,16,17,18,19], the desire for procreation among new-generation couples, and economic problems that led to fewer children than previous generations. In other words, these artificial carrying capacity values are simply a consequence of the reduction in birth rates relative to death rates and appear unrelated to the actual size of the population. In this scenario, we refer to as the level of socioeconomic convergence, to differentiate it from the traditional biological level of carrying capacity.
In this regard, we focus on the data for Brazil, Mexico, India and China. In these countries, there is evidence of logistic behavior, where population growth has shown a significant decline over the past 20 years. In seeking to understand the behavior of the population growth dynamics of these individuals, there are two important magnitudes to analyze: the instantaneous growth rate and the instantaneous per capita growth rate. The former is given by
whereas the latter is given by
These two quantities help us to understand this socio-economic convergence level. As mentioned earlier, is a quantity that is not given apriori, but rather is a consequence of all the different factors related to social and economical events. In a more general sense, we can assume that a population follows the general rule
where , and is a decreasing function. The simplest scenario is the logistic growth, in which . However, this linear behavior does not necessarily have to be satisfied by a population. Even the theoretical value that we consider as a carrying capacity in its traditional sense could probably satisfy an equation of the type given by Equation (14). However, the fit of the data by the solution of the logistic equation gives us some direction to see whether the instantaneous growth rate and the per capita growth rate follows the form given in Equations (12) and (13), respectively.
Figure 4 and Figure 5 show the average growth rate and the average per capita growth rate for four different countries, calculated from the data (blue dots) as follows
and
respectively, and the instantaneous growth rate and the per capita instantaneous growth rates, obtained with Equations (12) and (13) (red lines). We chose those countries as they have shown to be in a similar stage on the logistic solution. Clearly, we can see that formulations (12) and (13), are good representatives from the data. This means that a population approaching a value different from its carrying capacity also follows a logistic behavior, i.e. the population behaves as if it were reaching its carrying capacity. In this case, however, it is not direct how such a value is defined, but rather is an experimental observation. Moreover, we note that dynamics follow a behavior given by Equation (14), but with , i.e. it follows a linear per capita growth rate, which means to have a behavior given by the traditional logistic equation, but with an asymptotic socio-economical value, instead of the carrying capacity.
4. Discussion
An explanation of the possible factors behind the existence of asymptotic socio-economical levels varies from country to country. For example, in China, the implementation of the one child policy from 1979 to 2015, has led to a behavior of possible convergence to a socioeconomic value [14,15,19]. This can be seen in Figure 5, where the data adjustment is evident along this time period. In countries like Mexico, there are factors that could add to have this socioeconomic level. Among those factors we have (i) Cost of living; (ii) Avoidance of parenthood role, (iii) Provision to a better life quality to new generations, (iv) social progress, (v) incorporation of women into the workforce, a product of migration from rural to urbanized areas, which provides greater access to sexual education and health. All these factors, and others, impact the population’s awareness of how to avoid pregnancies, especially in women on childbearing age [16,17,18]. These factors can act separately or together, resulting in a reduction in the birth rate with respect to the death rate. Figure 6 shows the evolution of the total fertility rate for each country analyzed, defined as the number of births per woman, from 1960 to 2020. From the graph, we observe the consistency between the stabilization of the population in a country as a consequence of the reduction of the total fertility rate.
The last case in this study belongs to countries like Angola and Congo. These two countries have less dense populations within our country sample, without counting Brazil. The case of Brazil is misleading as most of the population lives in a very small portion of the country. In these two African countries, exponential growth follows. Clearly, the sigmoidal part of the logistic equation has not yet been observed as there seem not to be factors that stop population growth.
Why are they not showing like Mexico, Brazil or China a reduction in their growing? Is that a possibility that these nations are not completely connected to other countries such that they feel the pressure of reducing birth rates?, Could it be the case that these countries have characteristics that do not see the need to reduce their birth rates? These are just some of the author’s thoughts. However, a deeper analysis can be done in this direction.
5. Conclusions
In this work, the purpose was to give some insights into what is meant by the carrying capacity of a system in human populations. Does this quantity truly measure the maximum number of individuals a system can sustain? Can it be different when dealing with human populations? In this work, we observed that when a population is far from reaching the real carrying capacity value, we can obtain a logistic behavior with an asymptotic value that is different from the true carrying capacity. We have called this value the socio-economic convergence level. In other words, convergence to an asymptotic value does not necessarily mean that we have reached a biological carrying capacity, but rather a socio-economic asymptotic level. And the rate at which populations tend to this value, follows a logistic behavior.
Each of the studied countries has its own population size, population density, economic wealth, and traditions. However, in these particular cases, there is a sigmoid behavior. The resulting asymptotic value acts as a carrying capacity. Now, some of the questions that arise are: even though there are different conditions that lead to the new carrying capacity, in each country, this capacity may depend mainly on a particular and dominant situation within the country?, Is it possible to understand the reason a carrying capacity is formed? If another situation is ruling the country, can we obtain a different carrying capacity?
Clearly, the concept of carrying capacity and the socio-economic-cultural convergence level are factors that will depend from country to country, i.e. these are not absolute values. The carrying capacity, seen in terms of density, depends on many factors, such as economic wealth, resources, technological advance, among others. Some factors to be studied is the percentage of conscious individuals in a country that choose to have few or not have descendants. It is possible that above some percentage of conscious individuals, could lead to a change of mind in most of the population. Additionally, it could be of interest how is the behavior over all the countries around the world and see if their population change behavior is linked to culture type, religious background, economy network, or maybe another quantity of importance.
In this work, we have taken all the population into account, such that all humans are already at reproductive age. This statement is clearly not correct. However, we are not interested in having a real estimation of the parameters, but rather we want to observe the overall behavior of the population. In this sense, clearly the per capita growth rate is not well estimated, but, clearly gets reduced as the number of individuals increase.
The value of the socio-economic convergence level is a quantity that is not necessarily constant. Up to this point, from the revised countries, it appears to have a definite value. However, as the socio-economic conditions in a country change, we may expect changes on how population levels change as well.
In this work, it was not the purpose to find predictive values for the human population across countries. Similar approximations can be found with different parameter values. However, it is the purpose to state that country populations can be seen in different stages of logistic growth and that the carrying capacity does not necessarily have to behave in the usual sense. In some scenarios, like India, we may have been experiencing the closest scenario to the traditional definition of carrying capacity. However, in other countries, economic and social factors are redefining this concept.
Author Contributions
The following statements should be used “Conceptualization, D. O. and D. B.; Methodology, D. O. , D. B. and M. T.; Software, D. O and M. T.; Validation, D. O. , D. B. and M. T.; Formal analysis, D. O. , D. B., and M. T.; investigation, D. O. , D. B., M. T. and C. A.; Data curation, D. O. , D. B., and C. A.; Writing—original draft preparation, D. O. , D. B.; writing—review and editing, D. O. , D. B., M. T. and C. A.; Visualization, D. O. , D. B., M. T. and C. A.; Supervision, D. O. , D. B.; Project administration, D. O.; Funding acquisition, D. B. All authors have read and agreed to the published version of the manuscript.”
Conflicts of Interest
The authors declare no conflicts of interest.
Appendix A
In order to adjust the data with Equation (4), we have used the neural network approach [1], with one layer and a single node. The test function is given by (5)
where it follows that this one neuron setting has the same structure as the solution of the logistic equation, Therefore, error minimization can be done by using either the differential equation or its solution. In this work, we consider the error function given by
where represents the number of individuals for a particular country at time . Minimization follows by the use of the Adams method to minimize the neural network. For each of the countries used as examples, an initial solution approximation was taken empirically and then the optimization of the parameters was initialized. During the optimization process, we took the value B equal to zero in Equation (5) for each optimization step, to obtain a solution of the form given in Equation (4). Once we find the values of , we can obtain k, M and , as , , and .
In Table A1 we show the parameters that provided with the least error. Figure A1 and Figure A2 show the population data for each country and the resulting fit curve.

Table A1.
Parameters used in Figure A1 to fit the data.
Table A1.
Parameters used in Figure A1 to fit the data.
| Country | r | K | b | |
|---|---|---|---|---|
| Mexico | ||||
| Dem. Rep. Congo | ||||
| India | ||||
| China | ||||
| Germany | ||||
| Angola | ||||
| Japan | ||||
| Brazil |
Clearly, in all the cases, we have obtained a good fit by using the logistic equation.
Figure A1.
Country study data and model fit.
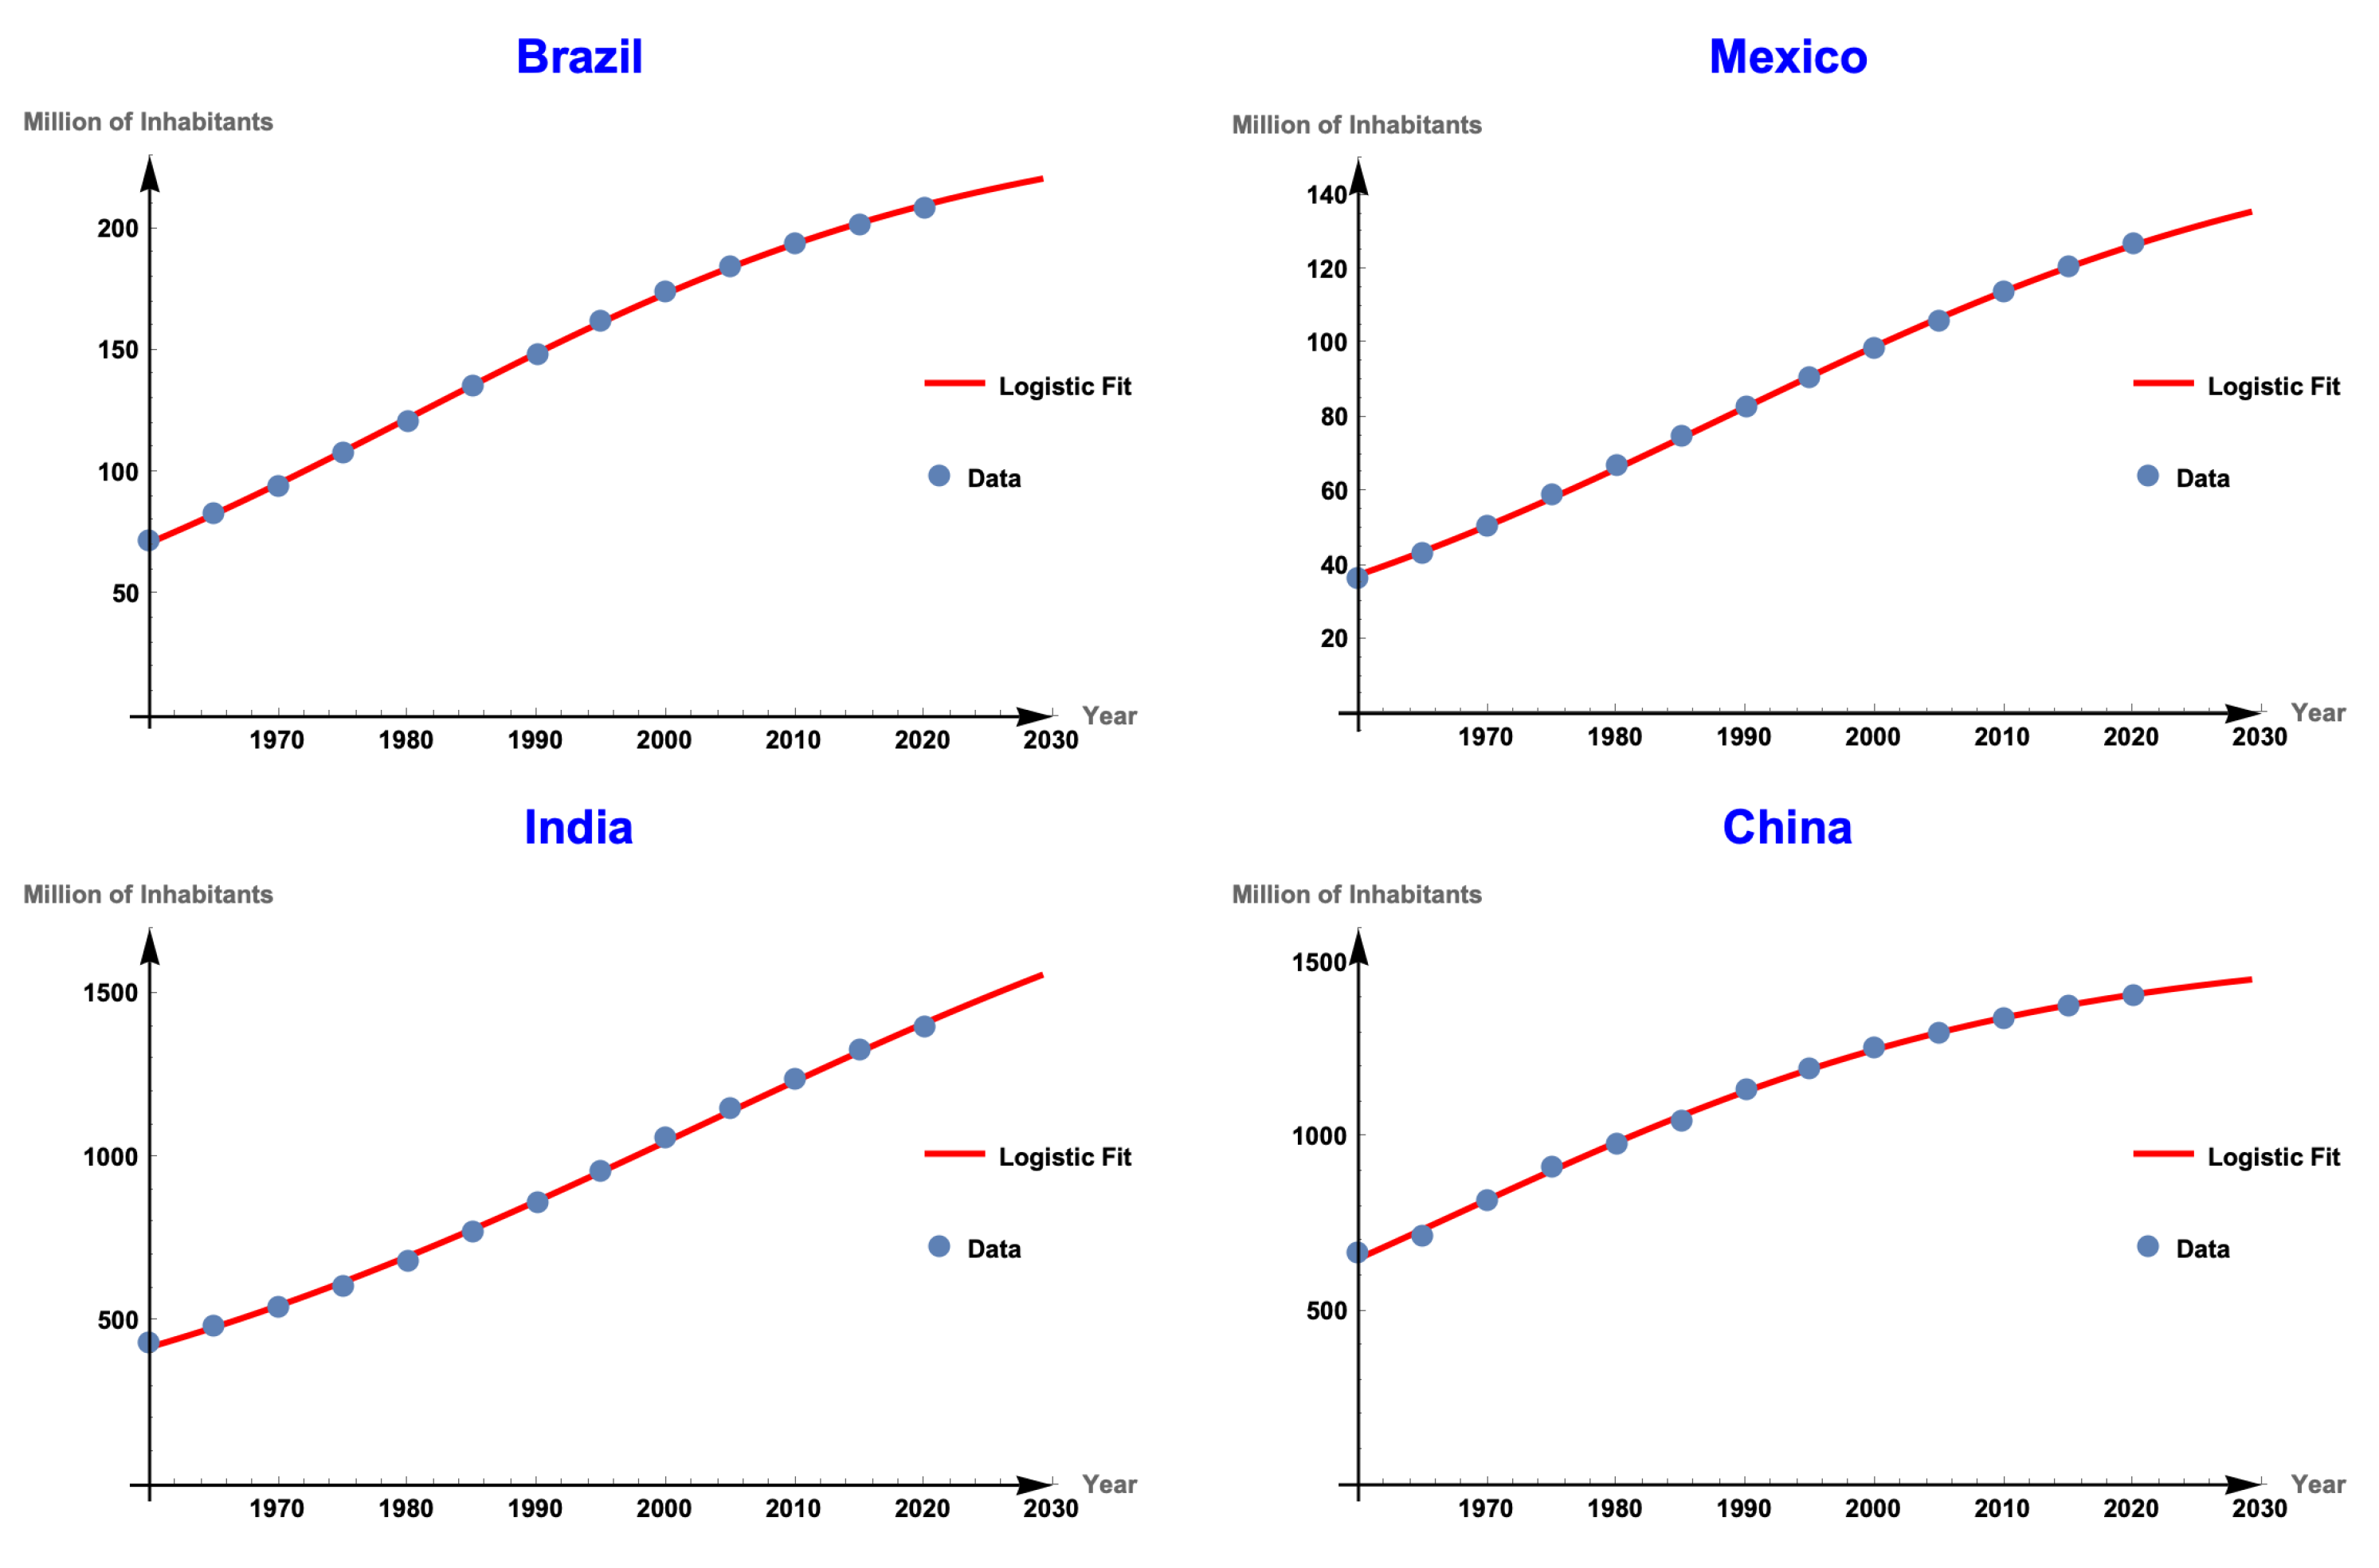
Figure A2.
Country study data and model fit.
Appendix B
Figure A3.
Posterior distribution for parameters K, r, and s.
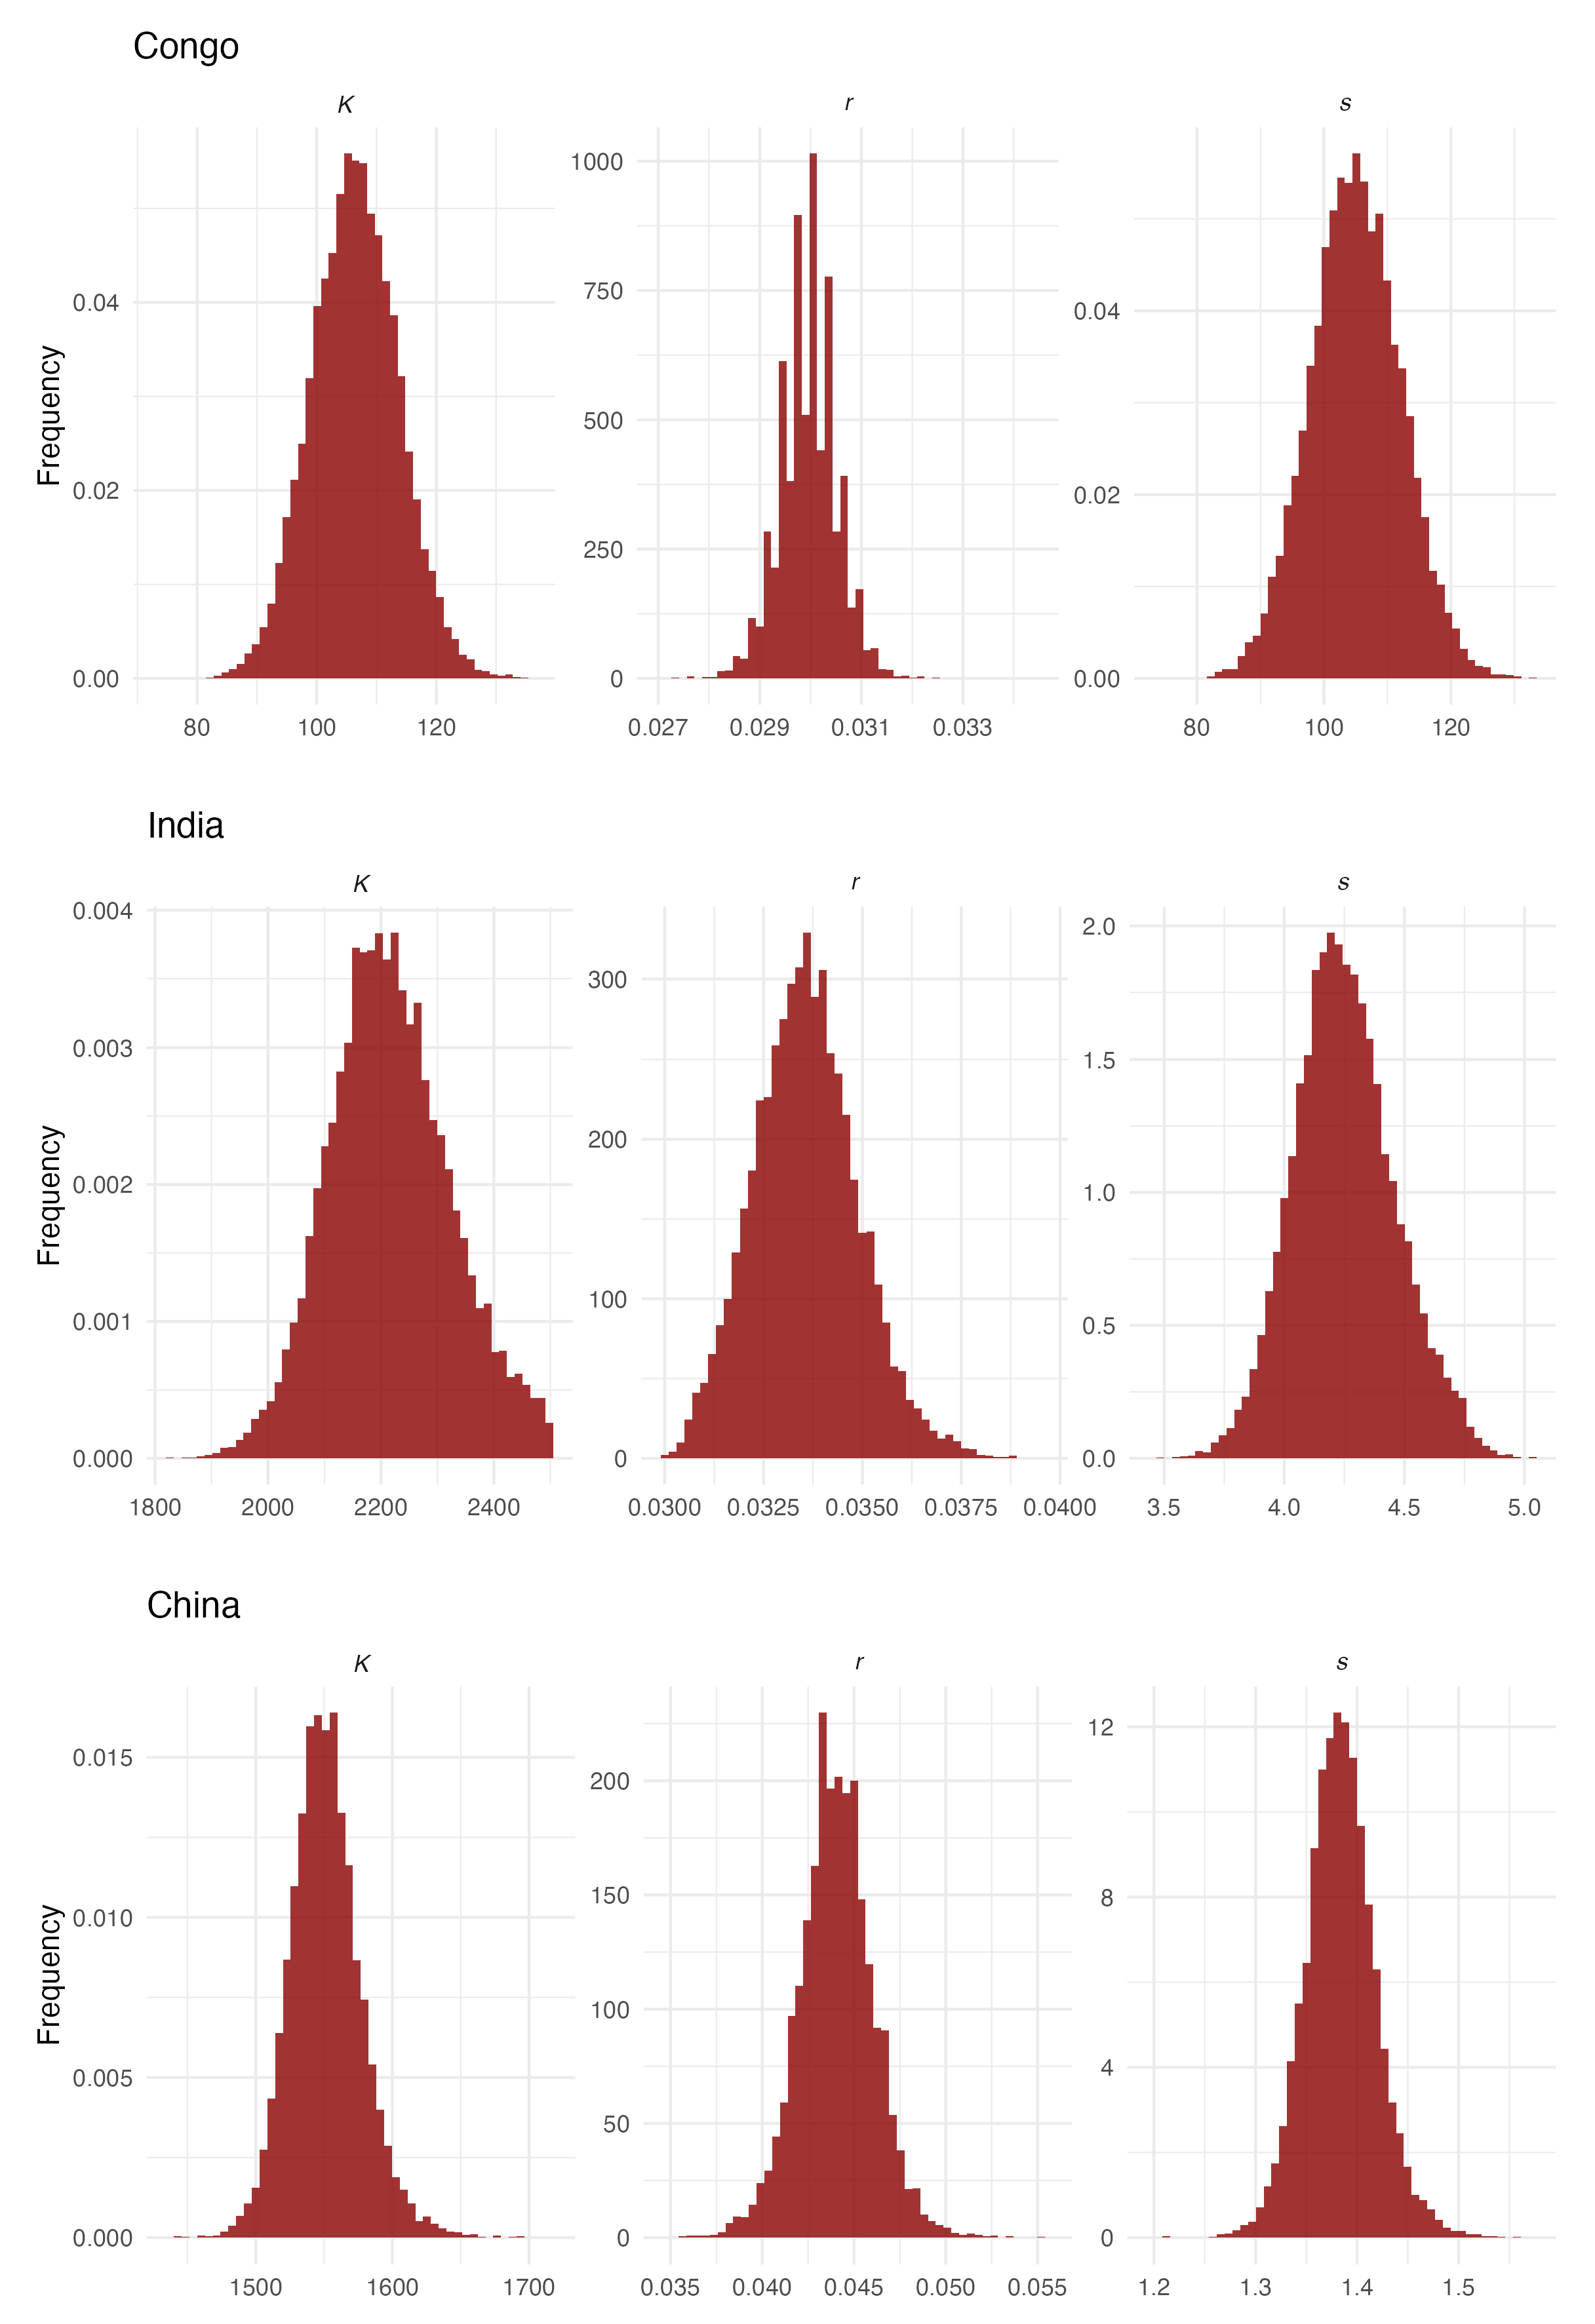
Figure A4.
Posterior distribution for parameters K, r, and s.
References
- Bishop, C. M.; Roach, C. M. Fast curve fitting using neural networks. Review of scientific instruments 1992, 63(10), 4450–4456. [Google Scholar] [CrossRef]
- Malthus, T. R. An essay on the principle of population. The Works of Thomas Robert Malthus. Pickering Chatto Publishers 1 1798, 1, 1–139. [Google Scholar]
- Verhulst, P. F. Notice sur la loi que la population suit dans son accroissement. Correspondence mathematique et physique 1838, 10, 113–129. [Google Scholar]
- Pearl, R.; Reed, L. J. On the rate of growth of the population of the United States since 1790 and its mathematical representation. Proceedings of the national academy of sciences 1920, (6), 275–288. [Google Scholar] [CrossRef] [PubMed]
- Kot, M. 2001. Elements of mathematical ecology. Cambridge University Press.
- Olarte García, J. A.; Loaiza, A. M. A population growth model of Aedes Aegypti with logistic carrying capacity. { Revista de Matemática Teoría y Aplicaciones 2018, 25(1), 79–113.
- Pan, J.; Le, W.; Wang; Z. A.; Chen, J. Mathematical model for predicting fungal growth and decomposition rates based on improved Logistic equations. International Journal of Agricultural and Biological Engineering 2023, 16(1), 60–65. [Google Scholar] [CrossRef]
- Del Monte-Luna, P.; Brook, B. W.; Zetina-Rejón, M. J.; Cruz-Escalona, V. H. The carrying capacity of ecosystems. Global ecology and biogeography 2004, 13(6), 485–495. [Google Scholar]
- Dorini, F. A.; Cecconello, M. S.; Dorini, L. B. On the logistic equation subject to uncertainties in the environmental carrying capacity and initial population density. Communications in Nonlinear Science and Numerical Simulation 2016, 33, 160–173. [Google Scholar] [CrossRef]
- McKendrick, A. G.; Pai, M. K. 1912. XLV.—the rate of multiplication of micro-organisms: a mathematical study. Proceedings of the Royal Society of Edinburgh 1912, 31, 649–655. [Google Scholar] [CrossRef]
- Seidl, I.; Tisdell, C. A. Carrying capacity reconsidered: from Malthus’ population theory to cultural carrying capacity. Ecological economics 1999, 31(3), 395–408. [Google Scholar] [CrossRef]
- Zhang, B.; DeAngelis, D. L.; Ni, W. M. Carrying capacity of spatially distributed metapopulations. Trends in Ecology & Evolution 2021, 36(2), 164–173.
- Chib, S. Chib, S., & Greenberg, E. Understanding the metropolis-hastings algorithm. The american statistician 1995, 49(4), 327–335.
- Cai, Y.; Feng, W. The social and sociological consequences of China’s one-child policy. Annual Review of Sociology 2021, 47(1), 587–606. [Google Scholar]
- Huang, Y. Family size and children’s education: Evidence from the one-child policy in China. Population Research and Policy Review 2022, 41(1), 317–342. [Google Scholar] [CrossRef]
- Index Mundi. Tasa de fertilidad. url:https://https://www.indexmundi.com/es/datos/m%C3%A9xico/indicador/SP.DYN.TFRT.IN#google_vignette. (Accessed on 23/04/2025, 20:00).
- Mendoza. V. D. Los factores determinantes de la disminución de la fecundidad/Los efectos de la urbanización, salud, educación y trabajo femenino. DemoS 2009, 011. https://www.revistas.unam.mx/index.php/ dms/article/view/6724.
- Soriano-Ortega; K. P., Carballo-Mondragón, E.; Roque-Sánchez, A. M.; Durán-Monterrosas, L.; Kably-Ambe, A. Fertility perception in reproductive women´s according to their age. Ginecología y obstetricia de México 2017, 85(6), 364–373.
- Zhang, J. The evolution of China’s one-child policy and its effects on family outcomes. Journal of Economic Perspectives 2017, 31(1), 141–160. [Google Scholar] [CrossRef]
Figure 1.
Posterior distribution of parameters using Mexico’s data.
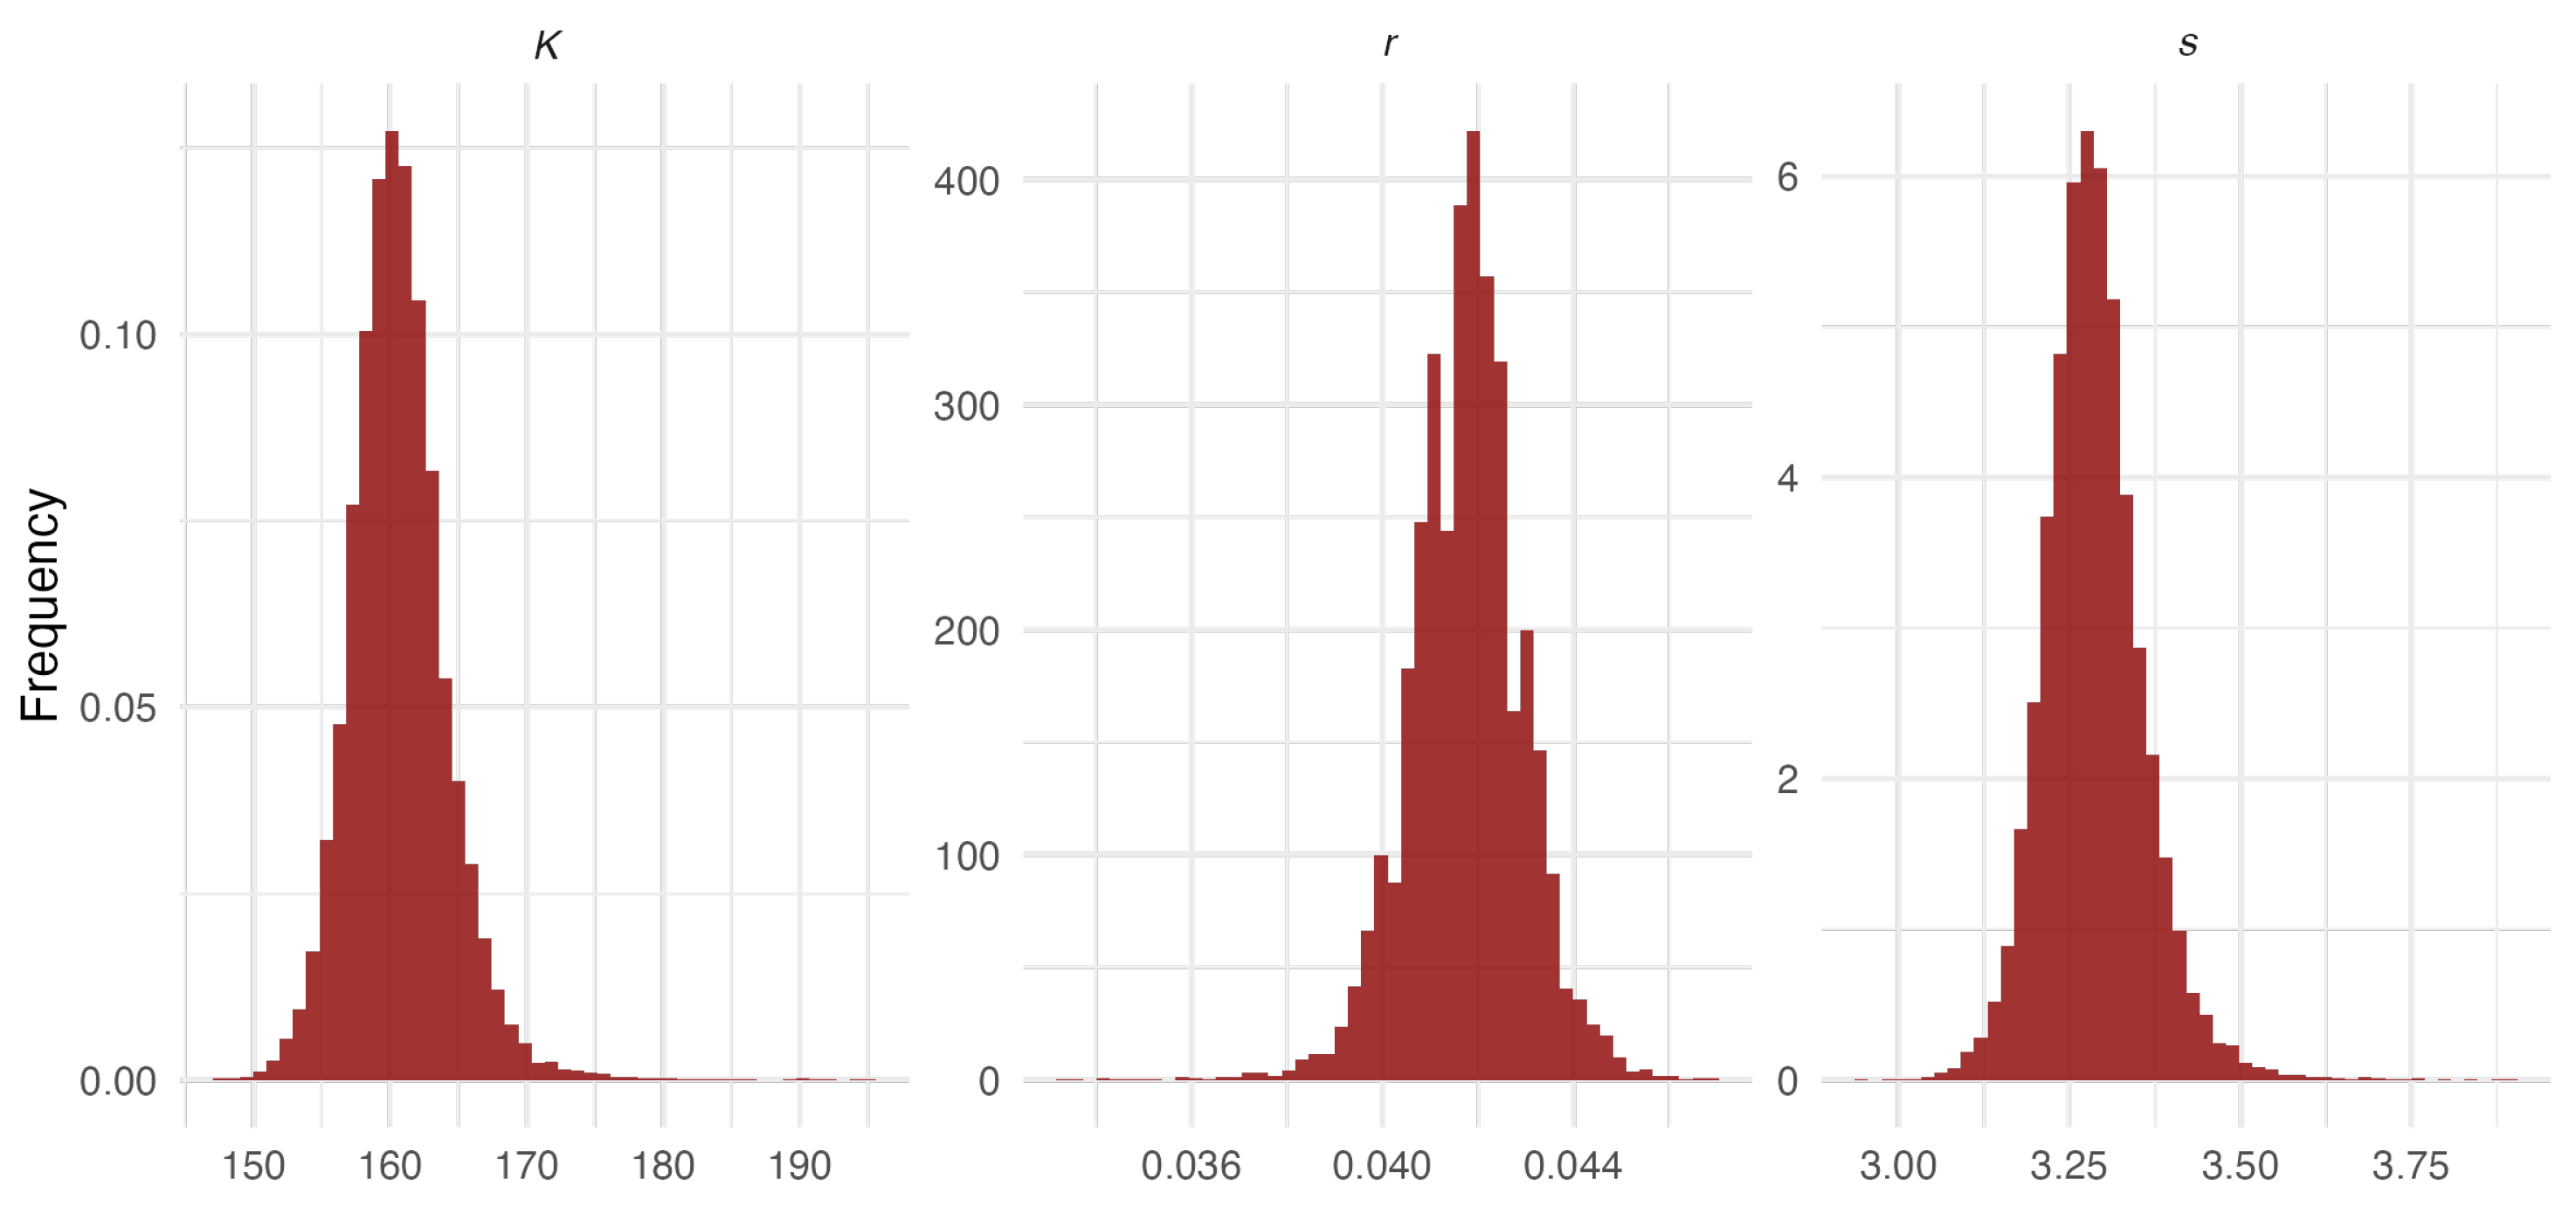
Figure 2.
Country study data and model fit.
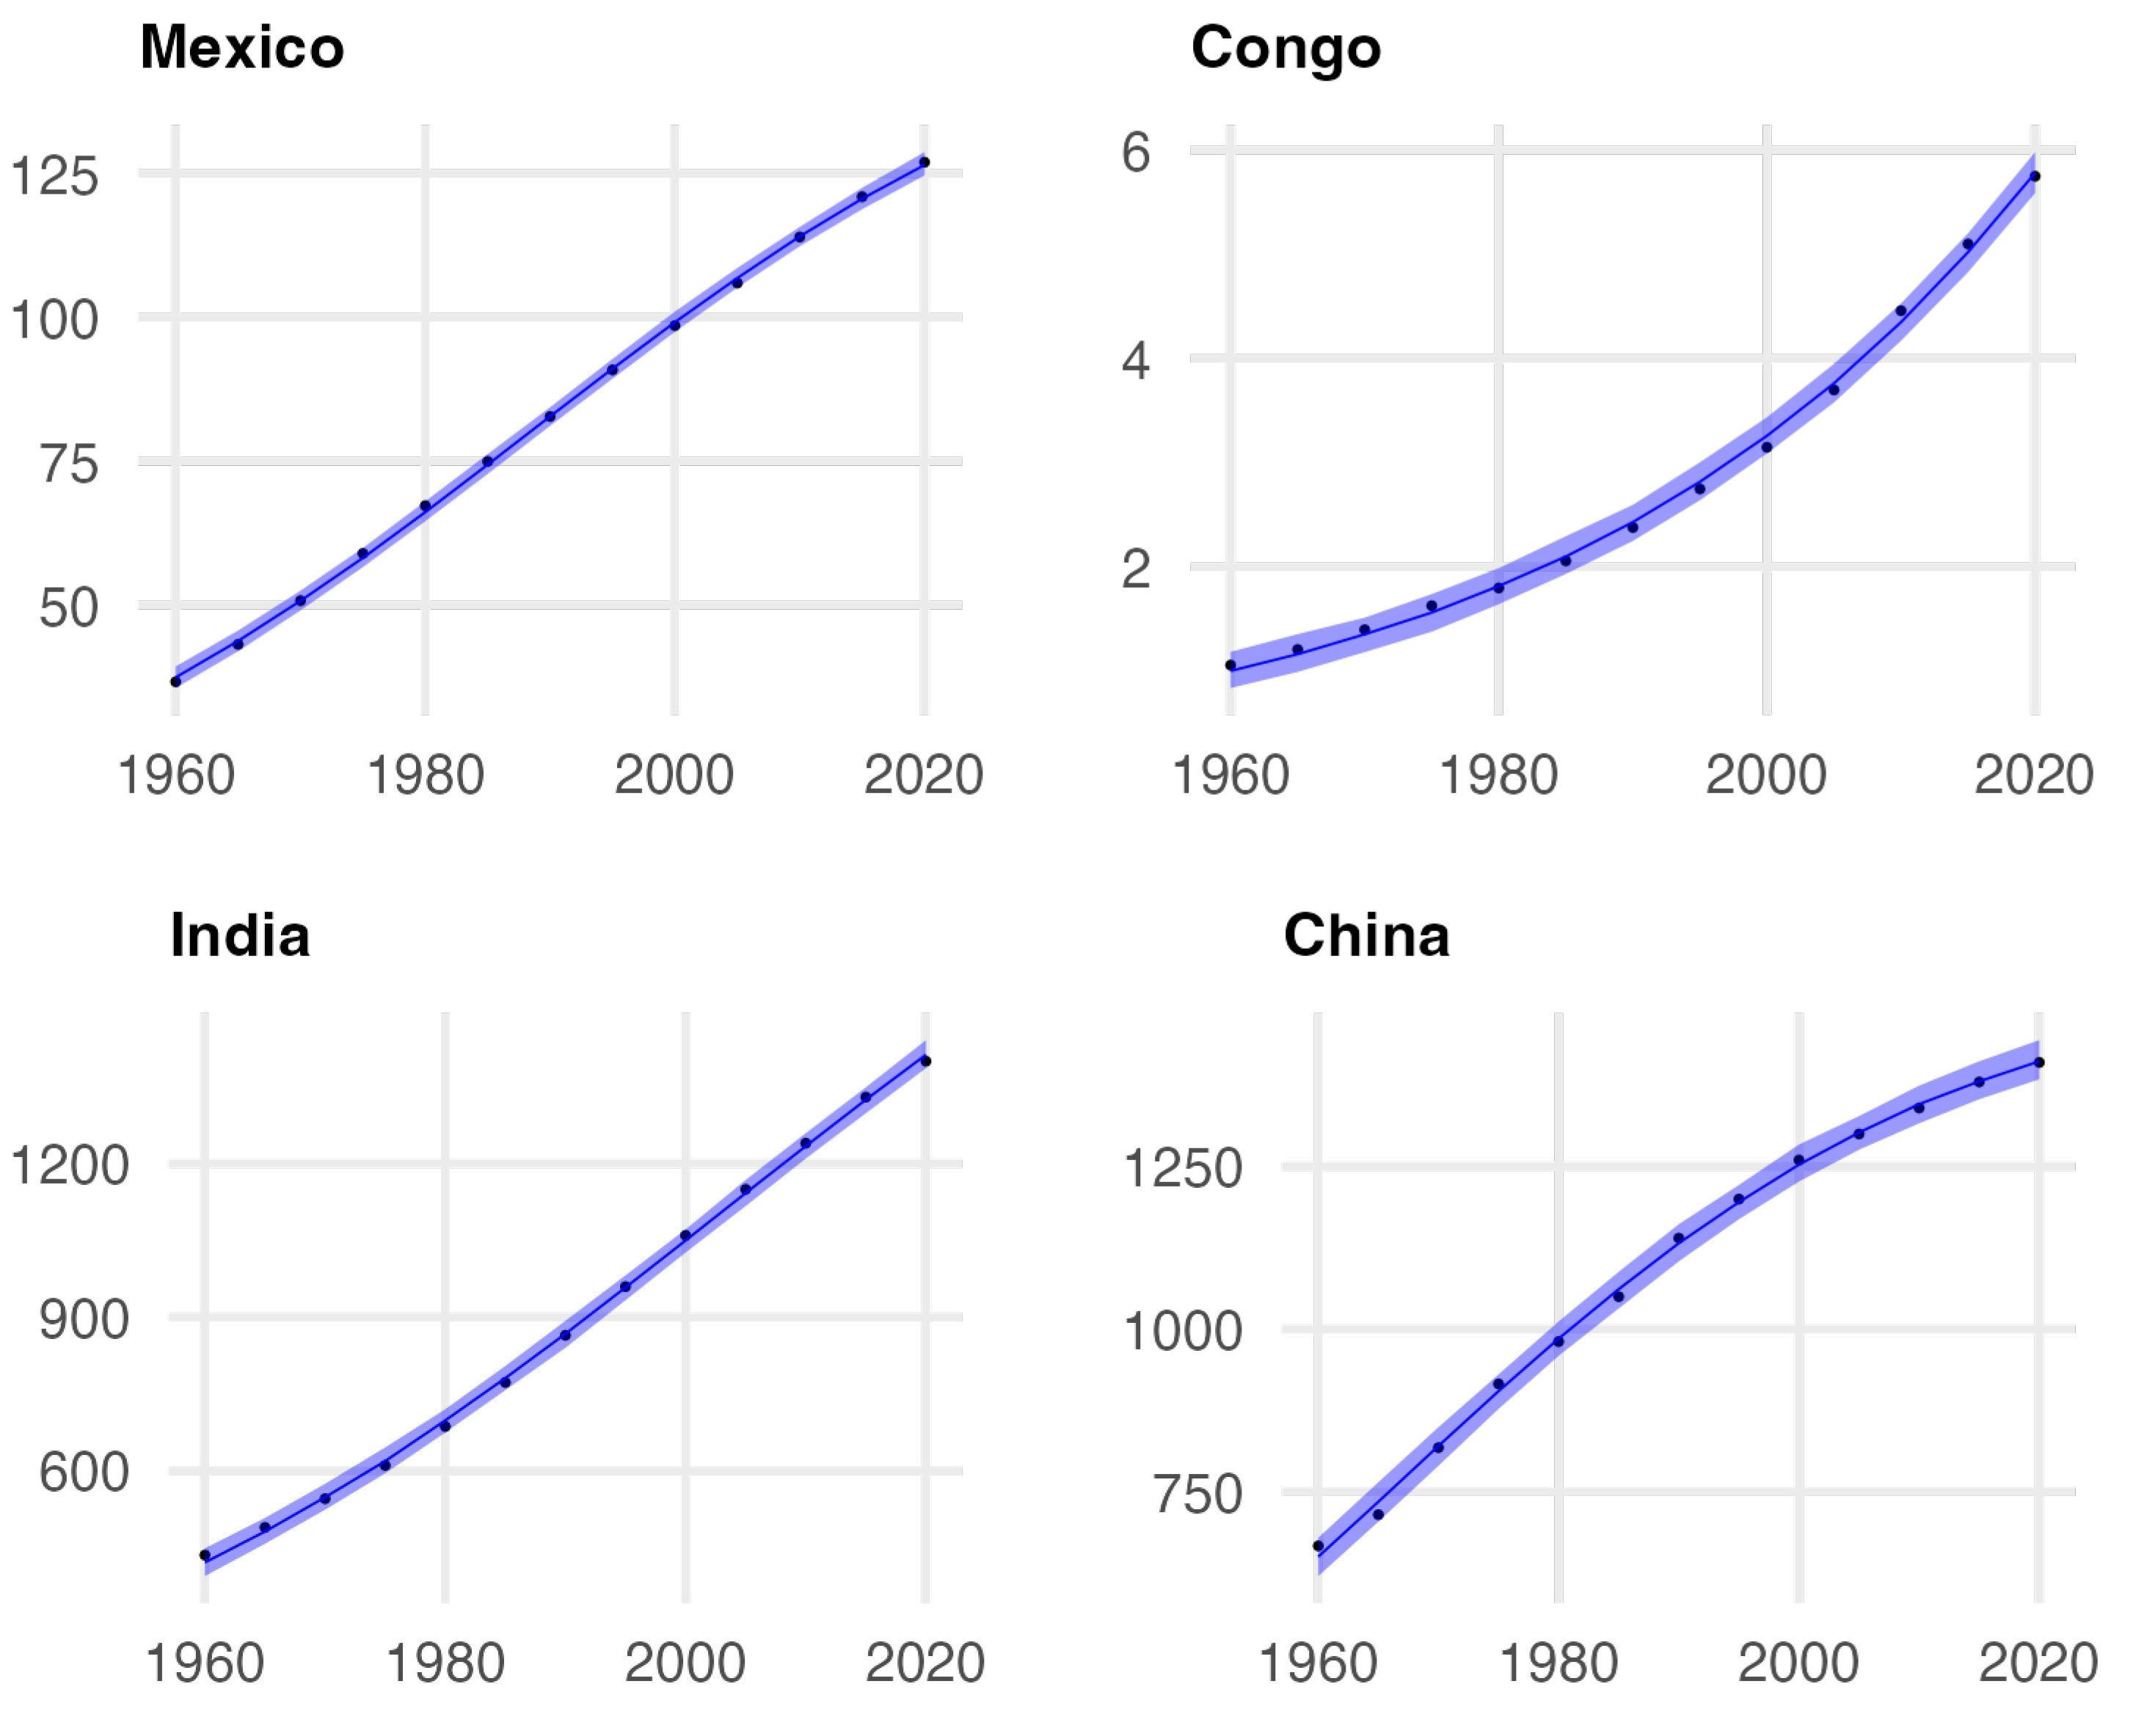
Figure 3.
Country study data and model fit.
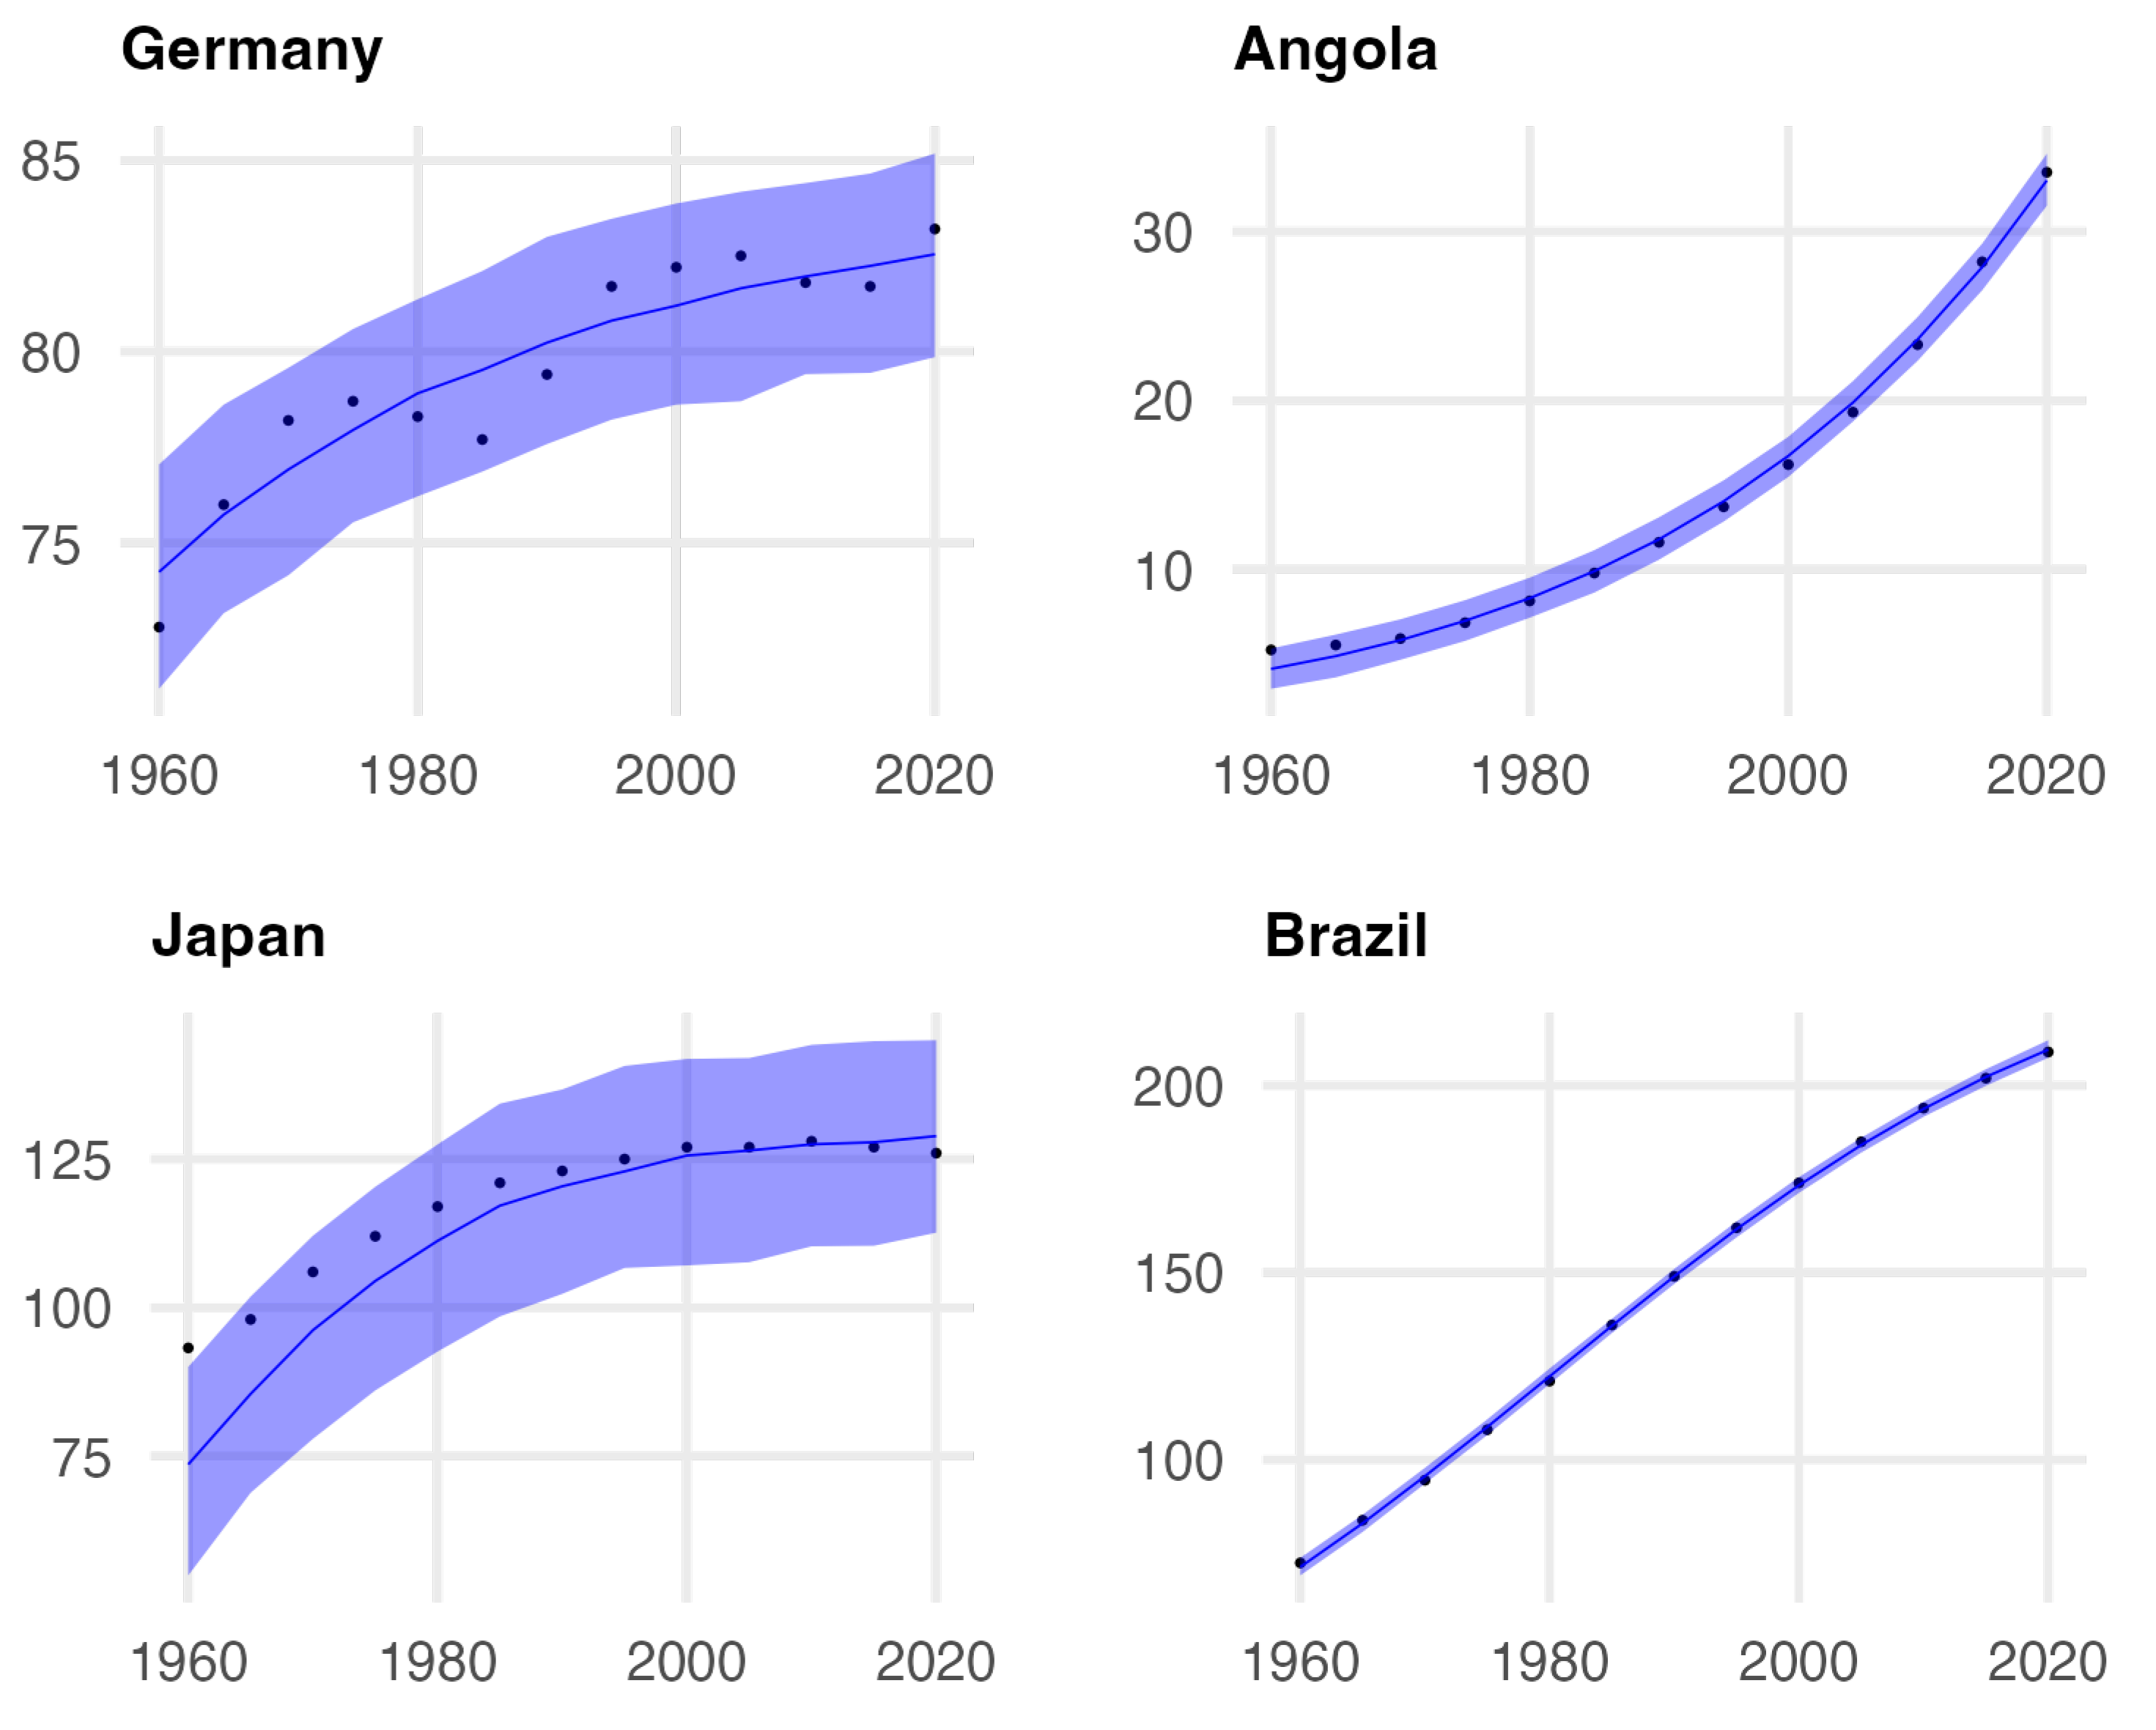
Figure 4.
Behavior of the average growth rate compared to the instantaneous one. The blue dots represent the average values given by data, whereas the red lines are the instantaneous values given by the Equation (12).
Figure 4.
Behavior of the average growth rate compared to the instantaneous one. The blue dots represent the average values given by data, whereas the red lines are the instantaneous values given by the Equation (12).
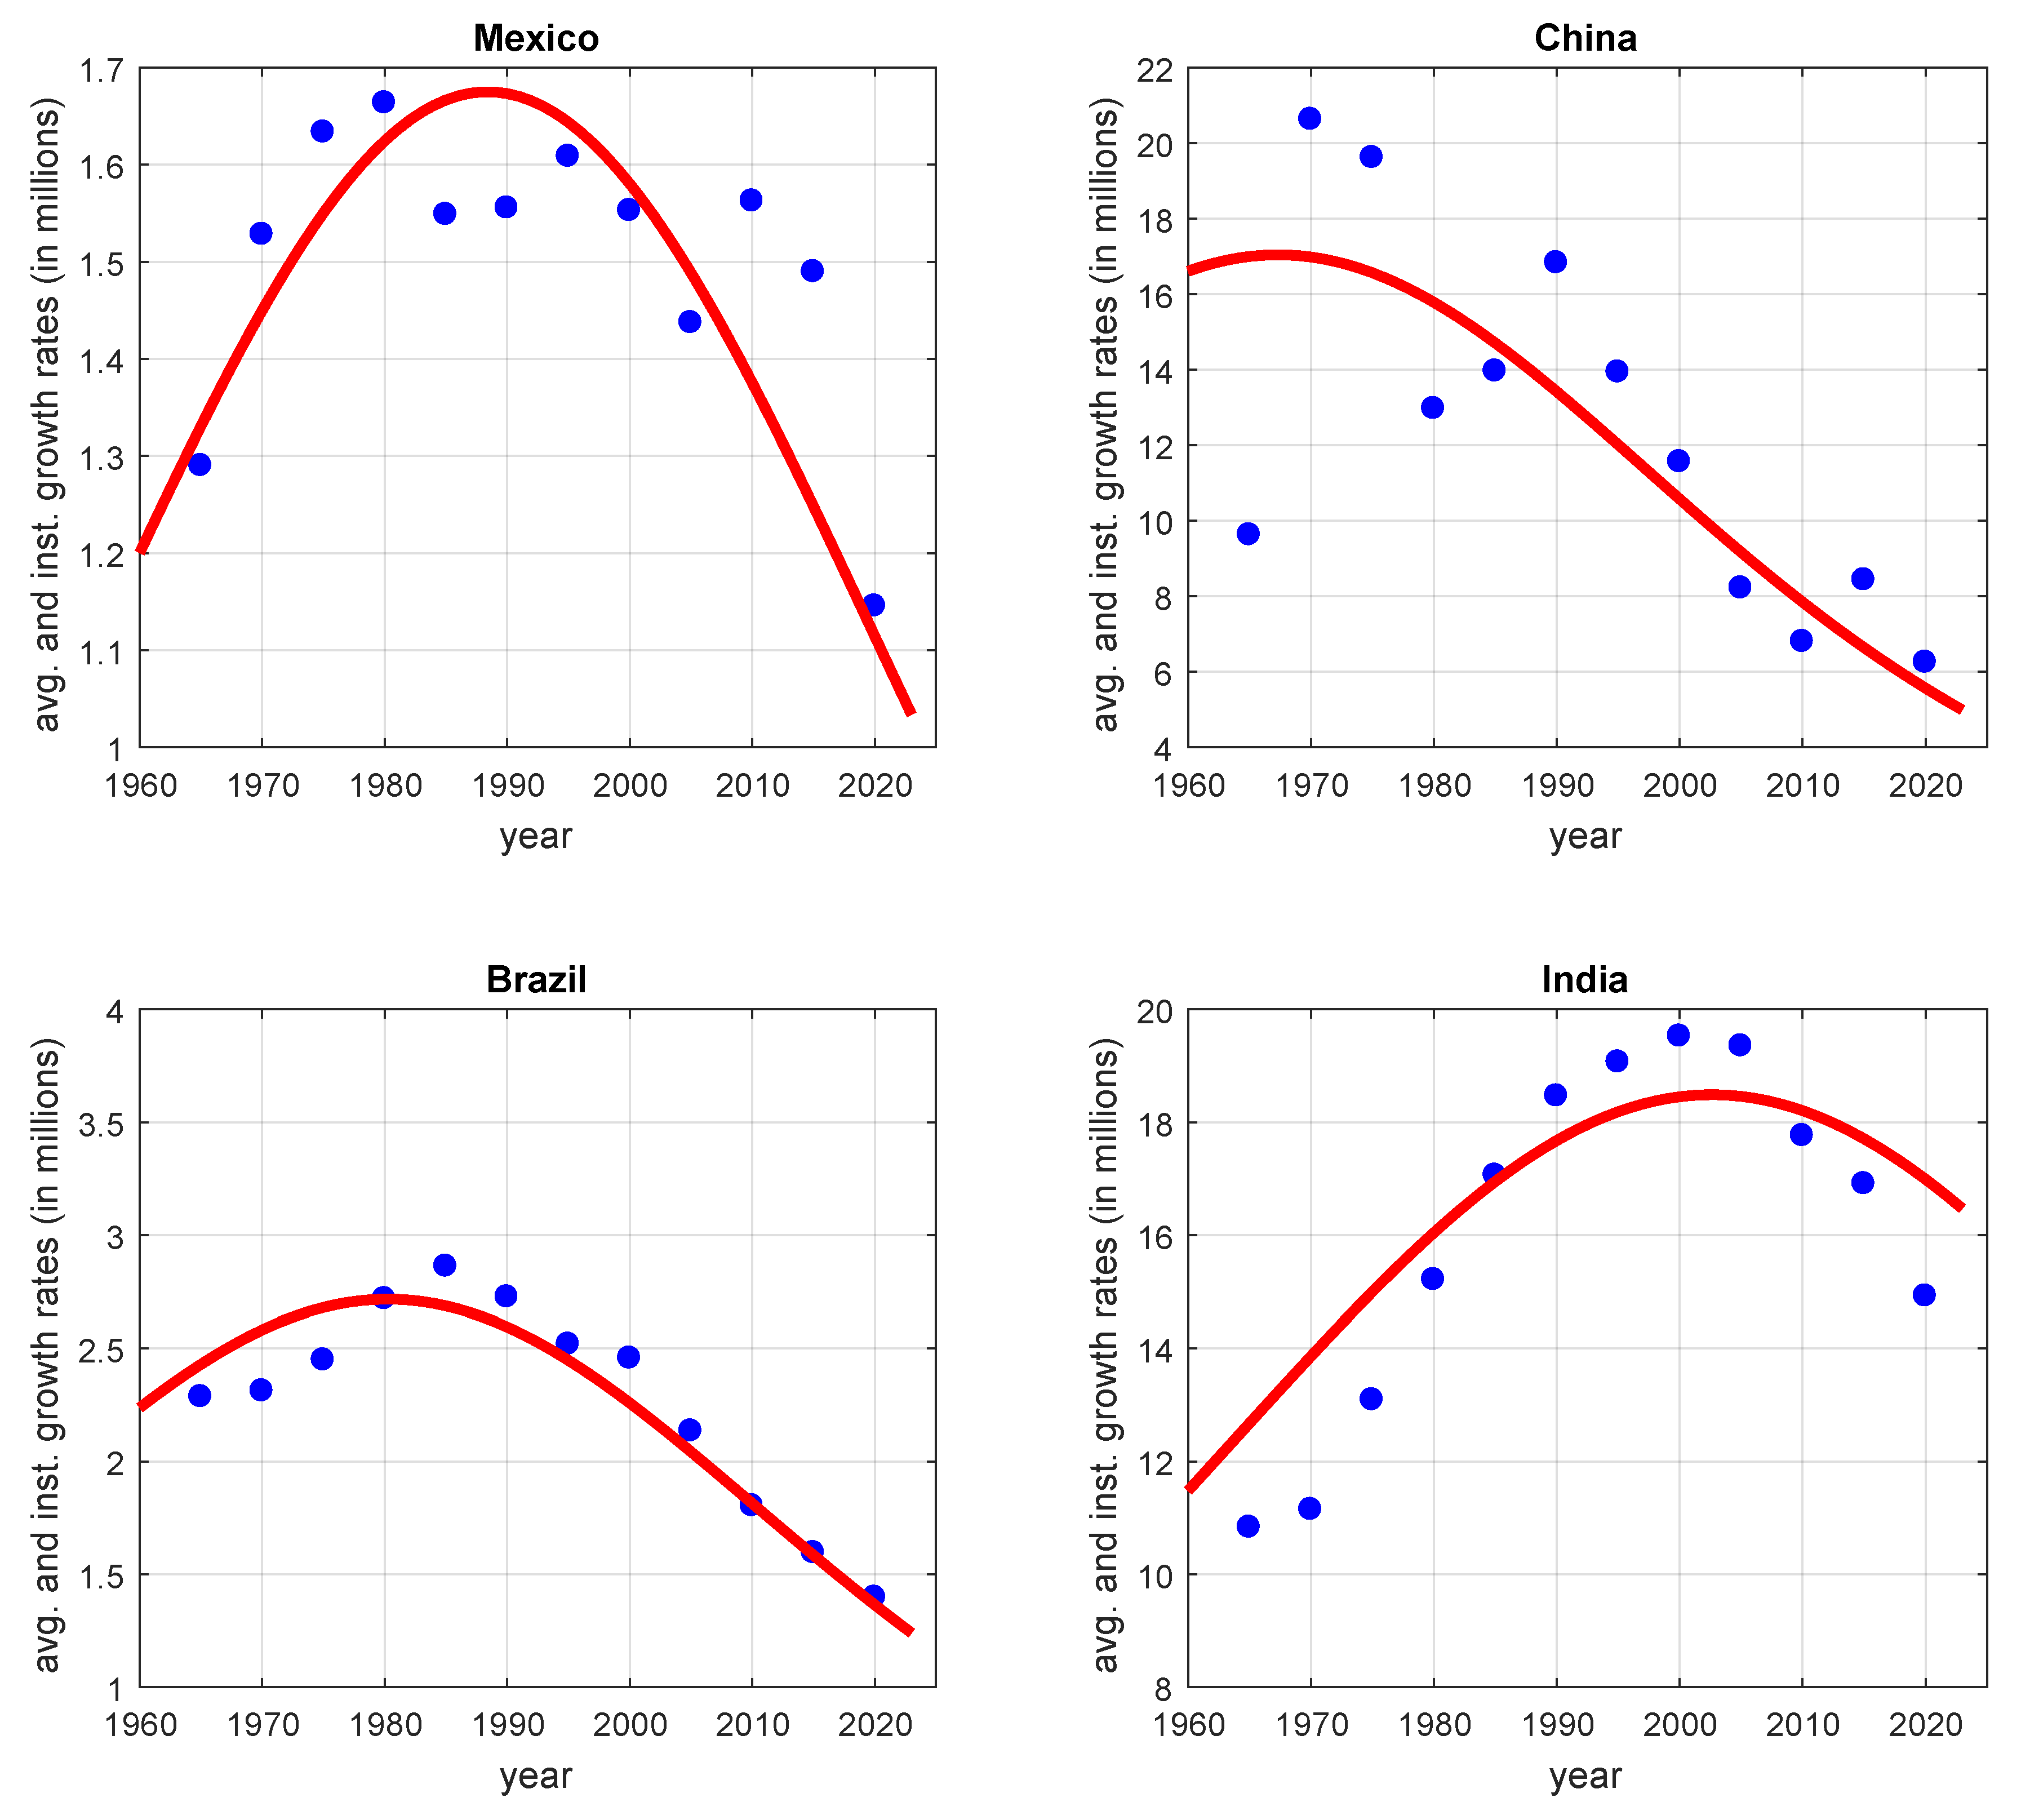
Figure 5.
Behavior of the average per capita growth rate compared to the instantaneous one. The blue dots represent the average values given by data, whereas the red lines are the instantaneous values given by Equation (13).
Figure 5.
Behavior of the average per capita growth rate compared to the instantaneous one. The blue dots represent the average values given by data, whereas the red lines are the instantaneous values given by Equation (13).
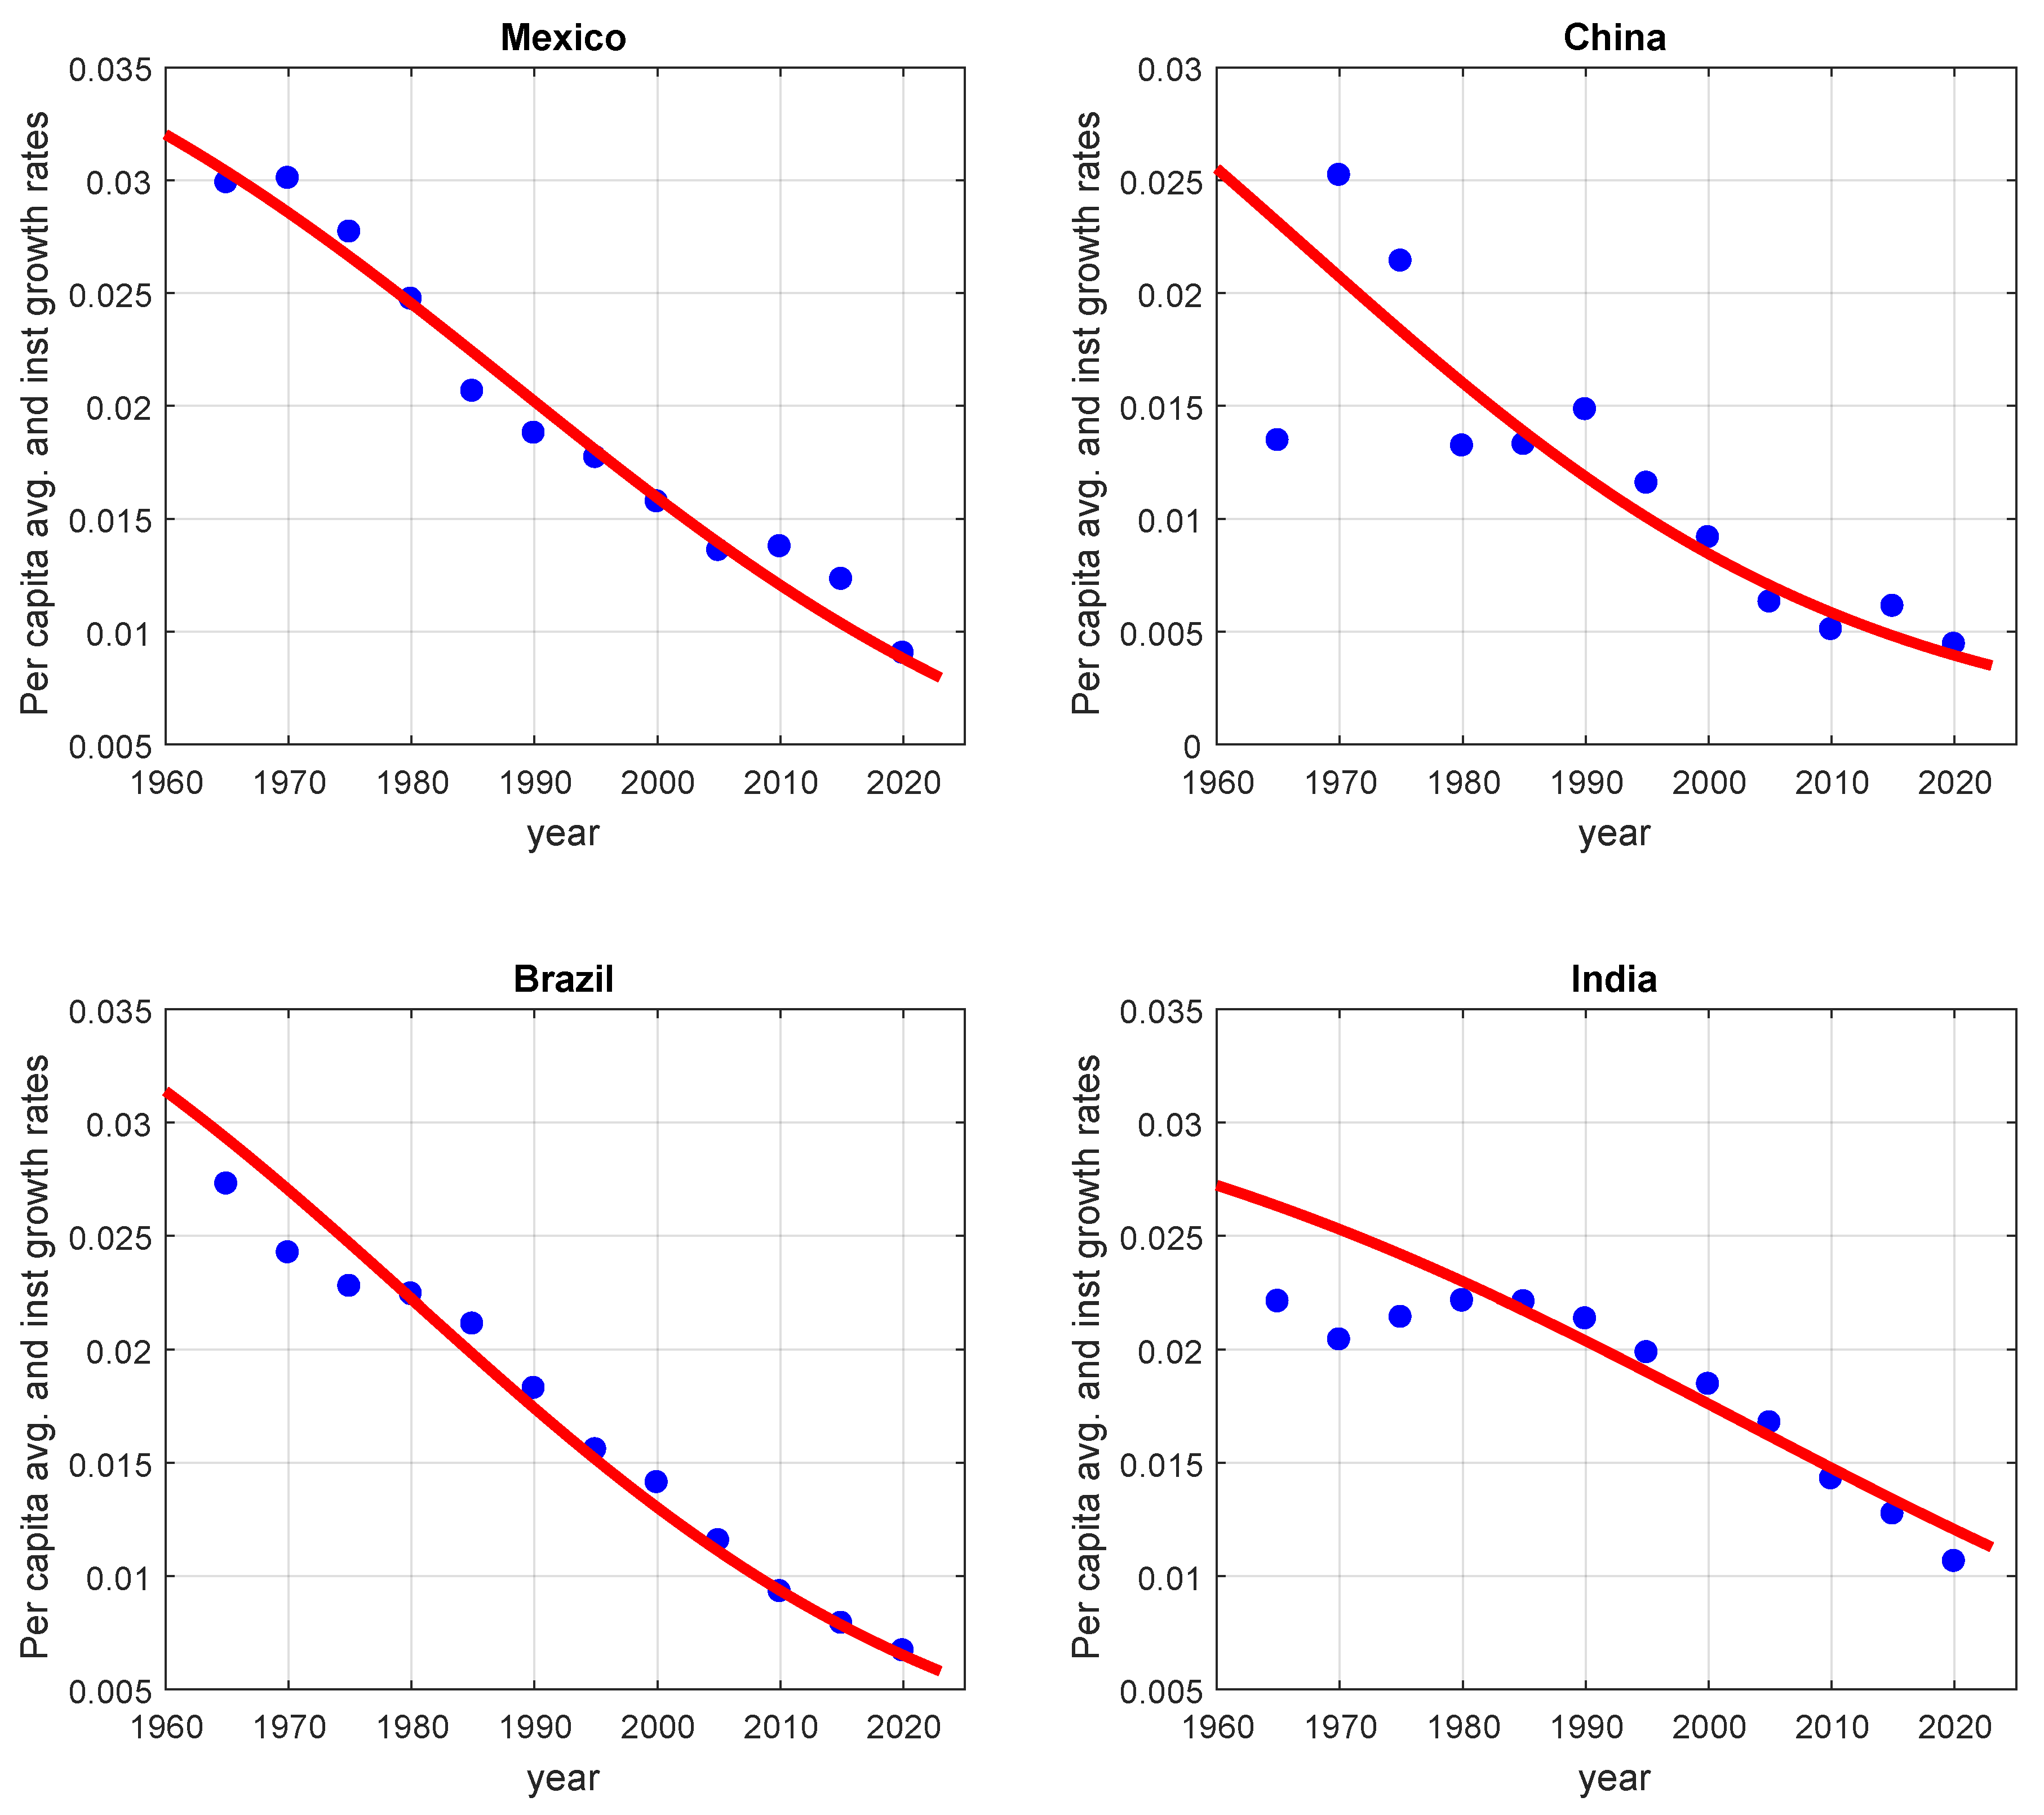
Figure 6.
Behavior of the average the total fertility rate for Countries studied. Information taken from [16].
Figure 6.
Behavior of the average the total fertility rate for Countries studied. Information taken from [16].
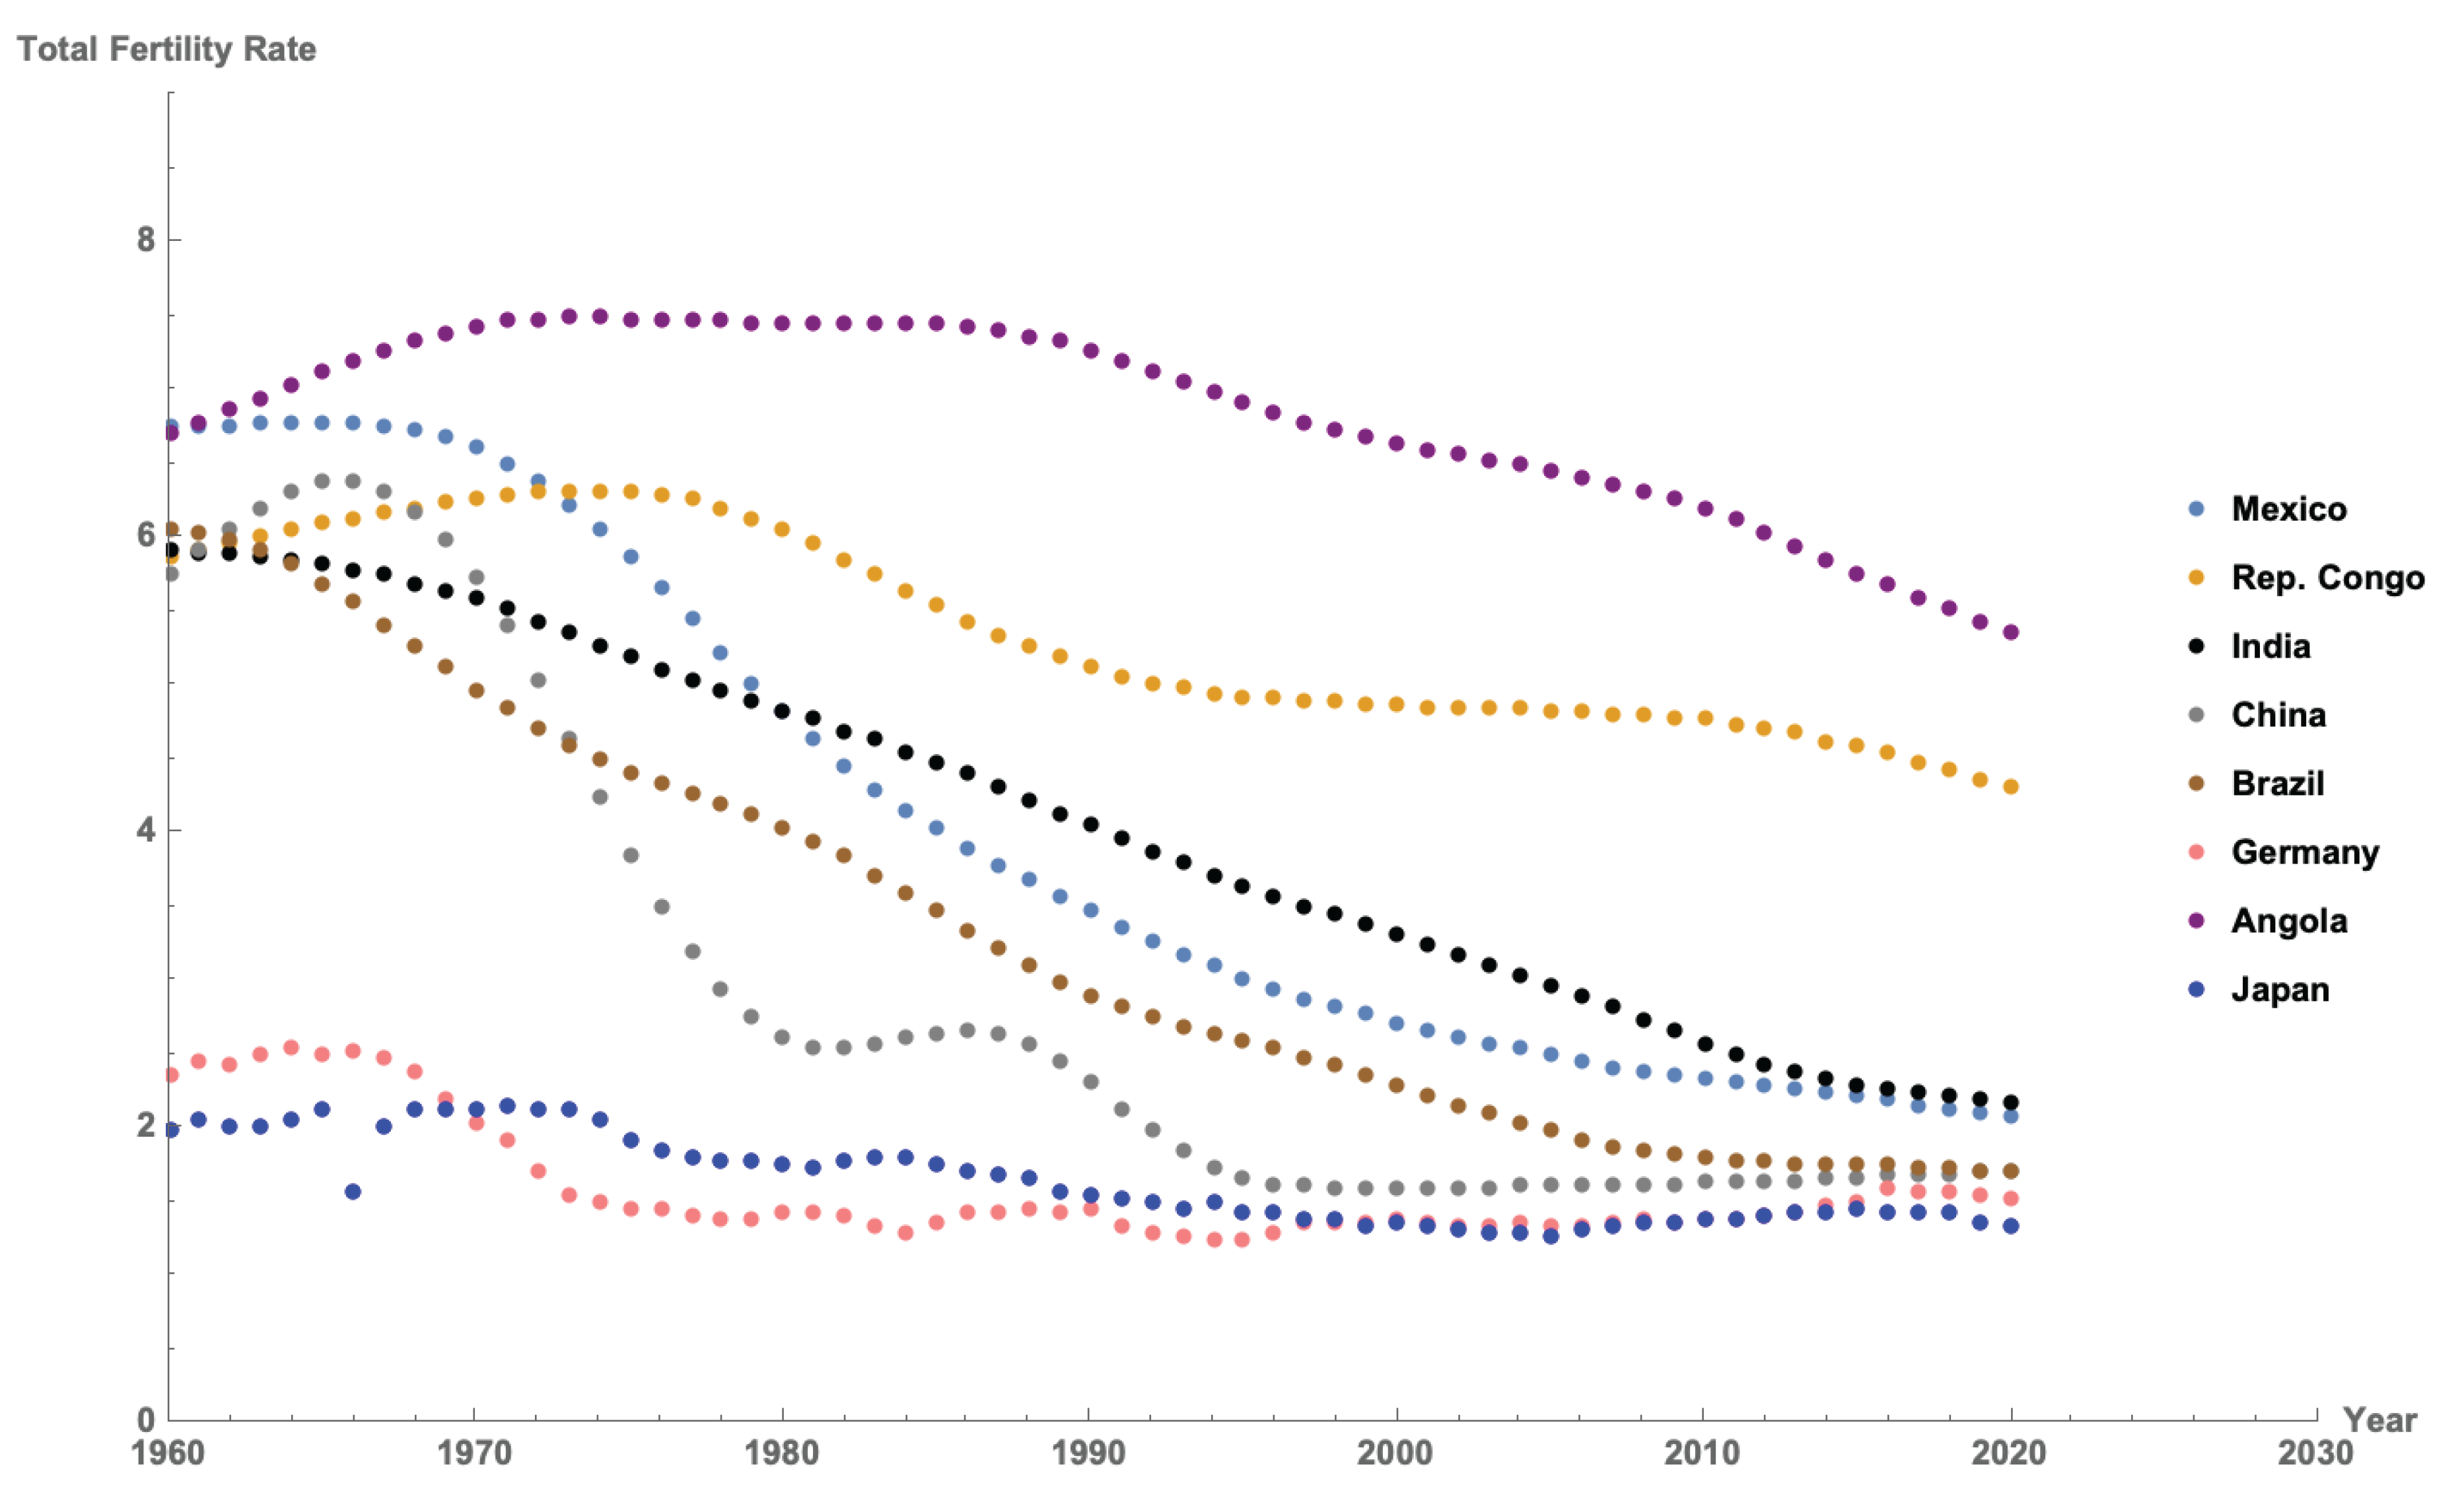
Table 1.
Number of inhabitants (in millions) for different countries.
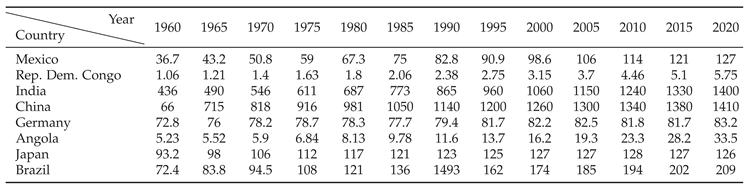 |
Table 2.
Prior distribution for K, r, a and parameters by Country.
| Country | K | r | s | |
|---|---|---|---|---|
| Mexico | (130, 200) | (0.01, 0.1) | (1, 5) | (0.01, 10) |
| RD Congo | (110, 10) | (0.01, 0.1) | (100, 10) | (0.01, 5) |
| India | (1500, 2500) | (0.01, 0.1) | (2, 7) | (1, 30) |
| China | (1200, 1800) | (0.01, 0.1) | (1, 5) | (1, 30) |
| Germany | (80, 5) | (0.03, 0.01) | (0.1, 0.03) | (0.01, 10) |
| Angola | (450, 10) | (0.01, 0.1) | (100, 10) | (0.01, 5) |
| Japan | (127, 2) | (0.06, 0.01) | (0.8, 0.03) | (8, 2) |
| Brazil | (200, 300) | (0.01, 0.1) | (1, 5) | (0.01, 5) |
Table 3.
Parameter estimates by country: median and 95% credible intervals.
| Country | K | r | s |
|---|---|---|---|
| Mexico | 160.417 | 0.042 | 3.281 |
| ([154.331, 168.341]) | ([0.039, 0.044]) | ([3.153, 3.444]) | |
| DR Congo | 106.421 | 0.030 | 104.938 |
| ([92.398, 120.848]) | ([0.029, 0.031]) | ([91.142, 119.113]) | |
| India | 2211.064 | 0.034 | 4.240 |
| ([2016.008, 2446.791]) | ([0.031, 0.036]) | ([3.858, 4.697]) | |
| China | 1550.180 | 0.044 | 1.383 |
| ([1503.309, 1608.064]) | ([0.040, 0.048]) | ([1.317, 1.457]) | |
| Germany | 83.749 | 0.035 | 0.128 |
| ([82.174, 86.052]) | ([0.022, 0.051]) | ([0.096, 0.161]) | |
| Angola | 448.044 | 0.036 | 108.939 |
| ([428.883, 467.651]) | ([0.034, 0.034]) | ([100.272, 117.652]) | |
| Japan | 129.681 | 0.077 | 0.771 |
| ([126.302, 133.036]) | ([0.062, 0.093]) | ([0.710, 0.831]) | |
| Brazil | 245.886 | 0.044 | 2.450 |
| [(240.683, 251.680)] | [(0.042, 0.046)] | [(2.388, 2.514)] |
Table 4.
Population density for each country for year 2021. Sources: (a)https://datacommons.org/, (b) https://www.theglobaleconomy.com/.
Table 4.
Population density for each country for year 2021. Sources: (a)https://datacommons.org/, (b) https://www.theglobaleconomy.com/.
| Country | Population | Source |
|---|---|---|
| Density () | ||
| India | 423 | (a) |
| Mexico | 64.8 | (a) |
| Germany | 235 | (a) |
| China | 148 | (a) |
| DR Congo | 42 | (b) |
| Japan | 335 | (a) |
| Angola | 28 | (b) |
| Brazil | 25.1 | (a) |
Disclaimer/Publisher’s Note: The statements, opinions and data contained in all publications are solely those of the individual author(s) and contributor(s) and not of MDPI and/or the editor(s). MDPI and/or the editor(s) disclaim responsibility for any injury to people or property resulting from any ideas, methods, instructions or products referred to in the content. |
© 2025 by the authors. Licensee MDPI, Basel, Switzerland. This article is an open access article distributed under the terms and conditions of the Creative Commons Attribution (CC BY) license (http://creativecommons.org/licenses/by/4.0/).
Copyright: This open access article is published under a Creative Commons CC BY 4.0 license, which permit the free download, distribution, and reuse, provided that the author and preprint are cited in any reuse.


