
Submitted:
12 November 2025
Posted:
12 November 2025
You are already at the latest version
Abstract
This study will focus on the connection between financial overconfidence and financial vulnerability, using data from the 2024 FINRA National Financial Capability Study (NFCS). The main question was whether people who think they know more about money than they actually do would end up taking more financial risks. After applying Exploratory Factor Analysis, the study identified three key areas that include financial confidence, financial knowledge, and financial vulnerability. These were combined to create an overconfidence score that was then used in several prediction models. Five machine learning models were tested on ten random sample seeds. Among these tested models, XGBoost performed the best to have explained about 60% of the variation in financial vulnerability. To better understand the results, SHAP analysis was then applied to see which factors mattered most. Confidence turned out to be the strongest influence, followed by overconfidence and knowledge. Income and education had smaller effects. Surprisingly, the results did not show that overconfidence increases vulnerability. Instead, a moderate level of confidence actually tends to be financially protective, especially for people with lower knowledge levels. Overall, it was figured that confidence may act more as a form of psychological support than as a risk factor. This finding suggests that financial education should help people build both knowledge and self-belief.
Keywords:
financial literacy
; overconfidence
; financial vulnerability
; confidence
; machine learning
; XGBoost
; SHAP analysis
Introduction
In the last few years, there have been growing concerns about overconfidence, which is the gap between how people feel about their financial knowledge and how well they actually understand key financial concepts (Atkinson & Messy, 2012). When people believe they know a lot about money, but actually perform bad on financial knowledge tests, such mismatch can be noted as overconfidence in financial literacy. According to the FINRA National Financial Capability Study (NFCS), more than 25% adults rated their financial knowledge as high, while failed to answer even three out of five basic financial questions correctly (FINRA Investor Education Foundation, 2021). Based on this fact, the word “overconfidence” does not sound positive. An adult being overconfident may tend to have more risky financial behaviors, such as overspending, having high-interest debt, or failing to save for emergencies. When it gets to tougher and more complex financial decisions, such as student loans, using credit wisely or planning for retirement, the people who are unaware of their own knowledge gaps may get especially vulnerable to financial instability and end up struggling financially (Organization for Economic Co-operation and Development/OECD, 2020). Although this matter seems to be a serious issue, not many researchers have focused on overconfidence as a crucial factor that can highly affect financial outcomes.
Comparing to financial studies, the concept of overconfidence was actually more widely studied within psychology and behavioral economics fields. Moore and Healy (2008) described three main forms of overconfidence in their research: Overestimation (thinking one’s own ability is higher than it really is), Overplacement (believing one is better than others), and Overprecision (being overly certain about one’s beliefs). In financial studies, the idea for overconfidence is closer to the definition of overestimation, which describes the situation where someone’s perceived financial literacy is higher than their actual knowledge (Vörös, 2021). There were also studies showing the possible harm from being financially overconfident. For example, Balasubramnian, Seshadri, and Venkataramani (2020) found that individuals who overrate their financial literacy are more likely to miss payments or have issues on collecting debt. Another study showed that overconfident consumers are less likely to seek financial advices, because they believe they already know well enough (Porto, 2016). Overconfidence can also affect trading behaviors, where people tend to trade more but earn lower returns in the capital markets (Barber & Odean, 2001). Overall, all these studies suggested that overconfidence represents a mismatch between confidence and competence, which can lead to financial vulnerability.
The scale of such issue can be better reflected in the 2021 FINRA NFCS results. While over 70% of adults rated their financial knowledge as high, but only 34% of tested adults correctly answered how interest compounds, which is a basic question testing one of the most fundamental financial concepts in borrowing and saving (FINRA Investor Education Foundation, 2021). This result tells us how widespread the confidence gap has grown to be. By reviewing prior related researches, there has been comparison of financial literacy across demographic features, such as age, gender and education level (Lusardi & Mitchell, 2014; Yakoboski, Lusardi, & Hasler, 2020). However, it is still unclear how overconfidence, beyond knowledge itself, is related to behaviors such as saving, spending and paying bills.
People may ask if financial overconfidence really matters in the real world. According to the 2021 NFCS report, around 40% of the US adults have no emergency savings. About one in five of adults reported having trouble paying their bills in the past year. These findings revealed real-world consequences that may not be solely attributable to lack of information, but can be related to misplaced confidence. (FINRA Investor Education Foundation, 2021; Hastings, Madrian, & Skimmyhorn, 2013). Understanding such misplacement of confidence can help explain why financial education programs sometimes won’t reach the best effects. People who overestimate their own knowledge may tend to ignore advices, resist feedbacks, or make poor financial decisions when they are actually supposed to know better. By looking deeper into how overconfidence contributes to financial vulnerability, educators and policy makers can design better financial education programs that not only focus on knowledge, but also take into account of self-awareness and realistic confidence. (Tang & Baker, 2016; Xiao, Chen, & Sun, 2015).
Following such trend, this paper will review prior work, present the research question and hypotheses, describe data and construct definitions, report the results, and conclude with discussion, limitations, and implications.
Literature Review
What We Know About Financial Literacy
Financial literacy is well known as an important factor that shapes one’s financial well-being. There are consistent studies showing that a large portion of US population is still struggling with very basic financial concepts, such as interest compounding and inflation (Atkinson & Messy, 2012; Lusardi & Mitchell, 2014). Prior researches have recorded that younger adults, and people with lower income or lower education, tend to score lower in financial literacy tests (OECD, 2020; Yakoboski, Lusardi, & Hasler, 2020), while gender differences seem to be more related to confidence rather than the actual knowledge (Bucher-Koenen et al., 2021). One thing to note here, however, is the researchers caution. The comparison between demographic groups should be carefully interpreted, because there exists systematic barriers such as gender pay gaps, different access to financial education, or limited banking resources. These barriers can shape both the financial knowledge and behavior (OECD, 2013). In addition, variation within the same demographic group, such as different risk tolerances or financial strategies or preferences, may also have significant effects on the variance in people’s overconfidence and behaviors.
On the other hand, financial knowledge typically refers to the understanding of key financial concepts. These concepts include but are not limited to interest rates, inflation, risk diversification and budgeting, etc. (Lusardi & Mitchell, 2014). For financial behaviors, people are typically considered as good in financial behavior when they perform some activities to enhance long-term financial stability, such as saving regularly, staying away from high-interest loans, or paying bills on time. Meanwhile, “bad” financial behaviors typically refer to those who overspend, do not save for emergency, or default on obligations (Hastings et al., 2013).
Studies have linked the lack of knowledge to different kinds of poor financial behaviors. People with lower literacy are more likely to accumulate high interest debts, hard to save for emergency, and fail to manage appropriate daily spending (Hastings, Madrian, & Skimmyhorn, 2013; Lusardi & Tufano, 2015). Other studies, meanwhile, found that higher literacy is associated with better financial behaviors, such as taking debt wisely and building saving buffers (Tang & Baker, 2016; Xiao, Chen, & Sun, 2015). Given these conditions, it still worths a reminder again that other financial constraints beside a lack of knowledge may also affect or lead to some certain financial behaviors. For instance, if an individual with lower income is not saving for emergency, it is possibly not because they don’t understand the importance of such saving, but because their income can just barely cover their daily necessities like rent, food and healthcare (Lusardi, 2019), so that they are not able to create extra buffer.
To resolve the risky financial behavers driven by knowledge lack, there have been many financial education programs introduced over the years. These programs cover a wide range of knowledge and skills from school based curricula to community workshops, and they even cover online tools. However, researchers found that the results of these education programs have been mixed. Some studies even show that such interventions only provide very minimum improvement in financial behaviors (Fernandes, Lynch, & Netemeyer, 2014). Regarding to this issue, some scholars proposed another idea, that the problem is not only caused by what people know, but also relates to how people assess their own knowledge. This idea could be inspired by the cognitive biases, such as the Dunning-Kruger effect, where individuals with lower abilities tend to overestimate their competence (Dunning, 2011). Therefore, it is reasonable to believe that understanding such bias in the context of personal finance could help explain the long-lasting financial missteps which are persistent even after several educational efforts.
Confidence vs. Knowledge: A Mismatch
While lots of studies have been focusing on how much people actually know, fewer researches examined how people perceive their own knowledge. This is where the concept of overconfidence comes in. According to Moore and Healy (2008), as stated in the introduction section already, the three forms of overconfidence include Overestimation, Overplacement, and Overprecision. Among them, Overestimation, which is thinking one’s own ability is higher than it really is, appears to be most common in financial behavior studies. This kind of overconfidence mainly refers to people who believe their financial literacy is higher than their financial concept quizzes actually show (Vörös, 2021).
This pattern has been continued to be revealed by the National Financial Capability Study (NFCS). During the 2021 NFCS report, more than one in four US adults rated their financial knowledge as high, while failed to answer even three out of five basic financial questions correctly (FINRA Investor Education Foundation, 2021). Such mismatch between individuals’ own perceived knowledge and their actual knowledge can lead to risky financial decisions. People can perform poor financial behaviors while still feeling confident about their choices.
More researches can be found that confirmed the relationship between negative outcomes and inflated self-perception. For instance, Balasubramnian, Seshadri, and Venkataramani (2020) found that people who overestimate their financial literacy are more likely to miss payments or to have collection accounts. Porto (2016) also pointed out that individuals who are self-confident are less likely to seek professional financial advices, as they believe they already know well enough. Similarly, Asaad (2015) found that confidence within financial literacy can mediate the relationship between knowledge and satisfaction, where higher confidence may lead to lower financial satisfaction and worse outcomes.
Confidence and overconfidence have also been observed in investing behaviors. Barber and Odean (2001) had provided a very well-known example. They revealed that men trade more frequently than women do because they are more confident and self-convincing. However, such frequent trading normally results in lower net returns. This finding suggested that higher self-perception is part of a broad behavioral bias that can affect both daily financial management, and long term financial performances.
Psychological traits also play an important role in how overconfidence develops. People’s self-assessment of their own competence can be increased, even when there’s no evidence to support, by their personality characteristics, such as extraversion or narcissism (Schaefer, Williams, Goodie, & Campbell, 2004). This tendency is also part of the reason that caused financial overconfidence to grow stronger, and make traditional financial education less effective.
What’s Still Unclear
Although the concept of overconfidence has been well-known in psychology (Dunning, 2011), its specific role in financial vulnerability, beyond just knowledge, has been less studied. Questions can still be raised about how overconfidence interact with other factors like income, education and age. Although there are earlier researches comparing confidence across demographic groups, comparably less attention has been paid to whether overconfidence itself can directly predict negative outcomes, such as lack of saving, or hard time paying bills.
How overconfidence is formed and expressed may also be affected by cultural and social norms. For example, some cultures would consider money as taboo or highly value the feature of financial independence. In such cultures, people may tend to exaggerate their self-perceived knowledge to look more competent (Atkinson & Messy, 2012; Klapper, Lusardi, & van Oudheusden, 2015). In addition, households with lower income may also experience overconfidence in a different way. Sometimes they would act as coping mechanisms when they face financial stresses, or when they have insufficient access to reliable information (Lusardi, 2019).
Parker and Fischhoff (2005) stated that making good decisions relies on applying financial knowledge accurately to real-life situations. This idea also emphasized the importance to study how confidence and knowledge work together to affect financial outcomes like saving, budgeting and using debts. Most researches studied confidence and knowledge separately, while only a few combined these two factors to identify people who are both confident and wrong. These people can be the most at-risk ones in financial problems (Lusardi, 2019; Vörös, 2021).
How This Project Fills the Gaps
Given the known gaps as discussed, this project directly builds on these gaps, in the method of moving focuses to the behavioral impact of financial overconfidence, from only one factor or the demographic comparisons. This study uses surveyor responses from the 2024 NFCS data (FINRA Investor Education Foundation, 2024) to define overconfidence as the difference between self-rated financial capability and the objective score from financial knowledge quizzes. With the quantitative definition of overconfidence, the analysis will then test whether individuals who are overconfident are more likely to experience financial vulnerability, which is also part of the NFCS data that includes financial situations like spending more than earning, struggling with bills, or lacking emergency savings.
Instead of traditional regression approaches, this study decided to apply machine learning models to capture more complex relationships between the interested factors and chosen features. The analysis will also include SHAP which allows better interpretation of the tested feature importance. These analyses can provide a clear picture of how much overconfidence actually contribute to vulnerability, comparing to that from knowledge or confidence individually, or from demographic or income factors.
Overall, by combining the test over confidence, knowledge, overconfidence, demographic features and the outcomes together, this study provides a clear view of how financial overconfidence would affect financial results. The findings may help the policy makers and educators realize that it is not only important to teach financial concepts and facts, but also essential to help people re-visit their self-perception on their own financial knowledge levels, and know the necessity to change if there exists improper overconfidence. Better adjustments and more effective polices and education programs can then be made to make better impacts.
Hypotheses/Research Questions and Methods
Research Question and Hypothesis
This study focused on only one research question: Does financial overconfidence increase financial vulnerability? The tested hypothesis (H₁) states that individuals with higher financial overconfidence are more likely to experience greater financial vulnerability, while the null hypothesis (H₀) states that there is no relationship between financial overconfidence and financial vulnerability.
Some limitations to be noted are that NFCS 2024 data are cross-sectional and self-reported, so the results may show associations rather than cause. Also, the measures may include some errors or vary across subgroups.
Data
This study uses publicly available data from the 2024 National Financial Capability Study (NFCS), the most recent wave available at the time of this analysis, which is a nationwide survey conducted by the FINRA Investor Education Foundation (FINRA Investor Education Foundation, 2024) every three years. During each survey, NFCS would collect information on financial knowledge, confidence, attitudes, and behaviors from over 27,000 adults across all 50 US states and the District of Columbia. In the 2024 NFCS survey, each state included around 500 respondents, with California and Oregon oversampled at around 1,250 each to improve regional precision. The survey was conducted online from June 2024 to October 2024. It was administered through address-based and probability-sampled research panels designed to reflect national demographic distributions by age, gender, race/ethnicity, and education (FINRA Investor Education Foundation, 2024).
To ensure good representativeness, NFCS provides survey weights at multiple aggregation levels: wgt_n2 (national), wgt_d2 (Census Division), and wgt_s3 (state). These weights can adjust for sampling and nonresponse bias based on American Community Survey (ACS) benchmarks. For this project, the analysis used unweighted individual-level data, as the focus was on within-sample behavioral patterns, rather than population-level estimates.
Constructs and Predictors
The study first performs Exploratory Factor Analysis (EFA) to identify the latent constructs. The identified factors were the key theoretical domains that are examined in this research. All EFAs were conducted using maximum likelihood extraction and varimax rotation. Items for each construct were selected based on their theoretical relevance and clarity in the NFCS codebook, as well as preliminary statistical checks for adequacy. Before conducting EFA, a manual review of the NFCS codebook was performed to identify and retain only quizzes, behavioral, and confidence-related items that were conceptually aligned with the three target domains. Responses coded as “98” (“Don’t know”) and “99” (“Missing”) were treated as missing values, while incorrect quiz responses were recoded as zero. Blank entries were excluded before factor analyses and modeling.
Financial Knowledge Factor. The study analyzed seven NFCS quiz questions (M6 to M10, M31, M50) to represent objective financial knowledge. These items tested understanding of key financial concepts, including compound interest (M6), inflation (M7), bond prices and interest rates (M8), mortgage terms (M9), and risk diversification (M10). Two additional questions (M31 and M50) were retained that assessed broader financial literacy, such as risk-return tradeoffs and investment knowledge. Responses to each quiz question were scored as 1 for correct and 0 for wrong. Note that for the knowledge factor specifically, the “don’t know” responses were treated as incorrect, instead of missing values, to better reflect respondents’ financial knowledge level.
Financial Confidence Factor. The study analyzed four NFCS questions (M1_1, M4, J20, and J43) that are related to respondents’ self-perceived financial confidences. These items asked how confident individuals feel about managing their finances, setting long-term goals, handling unexpected expenses, and making investment decisions. Together, they reflect an overall sense of financial self-efficacy and control.
Financial Vulnerability Factor. The study analyzed eleven behavioral indicators to reflect financial vulnerability. These items covered practical signs of financial stress, including bill payment difficulties (J4), spending more than income (J3), lack of emergency savings (J5), and credit-related issues such as missing payments and high-interest borrowing (G23, J61). Additional items captured broader aspects of budgeting strain, debt management, and financial resilience. Together, these items formed a composite measure of vulnerability in daily financial behaviors.
Overconfidence Variable. As inspired by Moore and Healy’s (2008) framework of overestimation, the study defined overconfidence as the standardized difference between perceived confidence and actual knowledge:
Overconfidence = z (Confidence Factor) – z (Knowledge Factor)
Such definition also aligns well with prior financial literacy studies (Vörös, 2021; Balasubramnian et al., 2020). The calculation captures degree to which individuals believe they know more than their demonstrated understanding.
Demographic covariates were also included to control for background effects. Features included are gender (A50A), age group (A3Ar_w), education (A5_2015), and household income (A8_2021).
Outcome Variable
The outcome variable, financial vulnerability, was modeled as a continuous factor score derived from the EFA as described above. This standardized score served as the dependent variable in all predictive analyses. Higher scores represent greater financial stress or instability.
Data Analytic Plan
Overview. This study conducted all the data analysis with Python in Google Colab. Some early diagnostic checks were performed in RStudio during the exploratory factor analysis stage. The analysis was completed in four main stages: first, Exploratory Factor Analysis; second, data preparation and split; third, model comparison; and forth, explainability and robustness testing using SHAP. Each stage built on the previous one, starting from cleaning and organizing the data.
Stage 1: Exploratory Factor Analysis (EFA). At the very beginning, factor analysis was conducted as detailed in the Constructs and Predictors section. Factor scores for financial confidence, knowledge, and vulnerability were saved for later modeling, and the overconfidence variable was computed as the standardized difference between confidence and knowledge scores. The EFA was conducted in RStudio using the psych package, while subsequent modeling and SHAP analyses were performed in Python.
Stage 2: Data Preparation and Split. After EFA, the dataset was cleaned and prepared for further analysis. Variables that are not related to confidence, knowledge, or financial vulnerability were removed to reduce noises, and to make the dataset easier to interpret.
The final analytic dataset includes factor scores from the earlier EFA, which included financial confidence, knowledge and vulnerability, as well as the calculated overconfidence variable and several demographic controls including gender, age, education and income. After removing missing values, the cleaned dataset had around 25,500 valid responses. This confirmed that missing data pints were minimal across predictors. In addition, since machine learning models such as XGBoost can handle missing inputs pretty well, no imputation was deemed necessary herein. During this process, all the continuous variables were standardized for comparability, and all the categorical variables were dummy-coded.
The analysis then split the dataset into 60% training, 20% validation, and the remaining 20% was for testing. The split used random sampling which was controlled by a fixed seed for reproducing. The training set was designed to be used for fitting models, validation set was to tun hyperparameters and apply early stopping, and the test set was held out for the final evaluation and explainability analysis. Note that in order to confirm results are consistent and does not represent only one particular data split, this process was repeated across ten different random seeds.
Stage 3: Model Comparison. The next step was to find the best model that predicts our outcome variable. Five algorithms were picked to this comparison: Linear Regression, Random Forest Regressor, Support Vector Machine (SVM), Generalized Additive Model (GAM), and XGBoost Regressor. The selections represented a range of linear, non-linear, and ensemble methods commonly used in behavioral prediction. All of these models used the same predictors (confidence, knowledge, overconfidence, and demographics) and the same data splits. Therefore accuracy, generalizability and interpretability can be well balanced.
Each of the five models was trained and tested across ten random seeds to decrease the risk of random variation that can affect results. The performance of each model was measured using four metrics: R², root mean square error (RMSE), mean absolute error (MAE), and the correlation between predicted and actual outcomes. The model demonstrating the most consistent and generalizable performance across ten seeds was selected for further analysis.
Stage 4: Explainability and Robustness (SHAP Analysis). After the best model was selected, SHAP was then applied to better understand how each variable actually affects the model’s prediction. SHAP can assign a contribution value to each feature and show every single feature’s individual prediction. This made it very transparent on seeing and interpreting what the model learned.
The first step was computing SHAP value for the validation set across all of the ten seeds. For each seed, every feature’s mean absolute SHAP value was calculated and ranked by importance. Then, Spearman rank correlation was calculated to check how similar across seeds the rankings are. The five seeds that had highest agreement in feature ranking were deemed the most stable models and selected for later pooled analysis.
In the next step, the SHAP outputs of these five top performance seeds were combined to create a pooled feature importance summary. To visualize which feature had the strongest and most consistent effect on the outcome variable, a bar plot and beeswarm plot were generated for each of validation and test sets.
To further confirm the stability of the model, the average absolute SHAP values between validation and test sets were then compared to see the ranking differences. Finally, the specific feature relationships were examined using SHAP dependence and interaction plots. In addition, an interaction plot between overconfidence and knowledge was created.
Results
Exploratory Factor Analysis
As stated above, the study first conducted EFA on the selected NFCS items to identify underlying structures within the three key domains: financial confidence, financial knowledge, and financial vulnerability. After the analysis, all of these three domains produced interpretable single-factor solutions that well aligned with theory and met the standard statistical adequacy criteria.
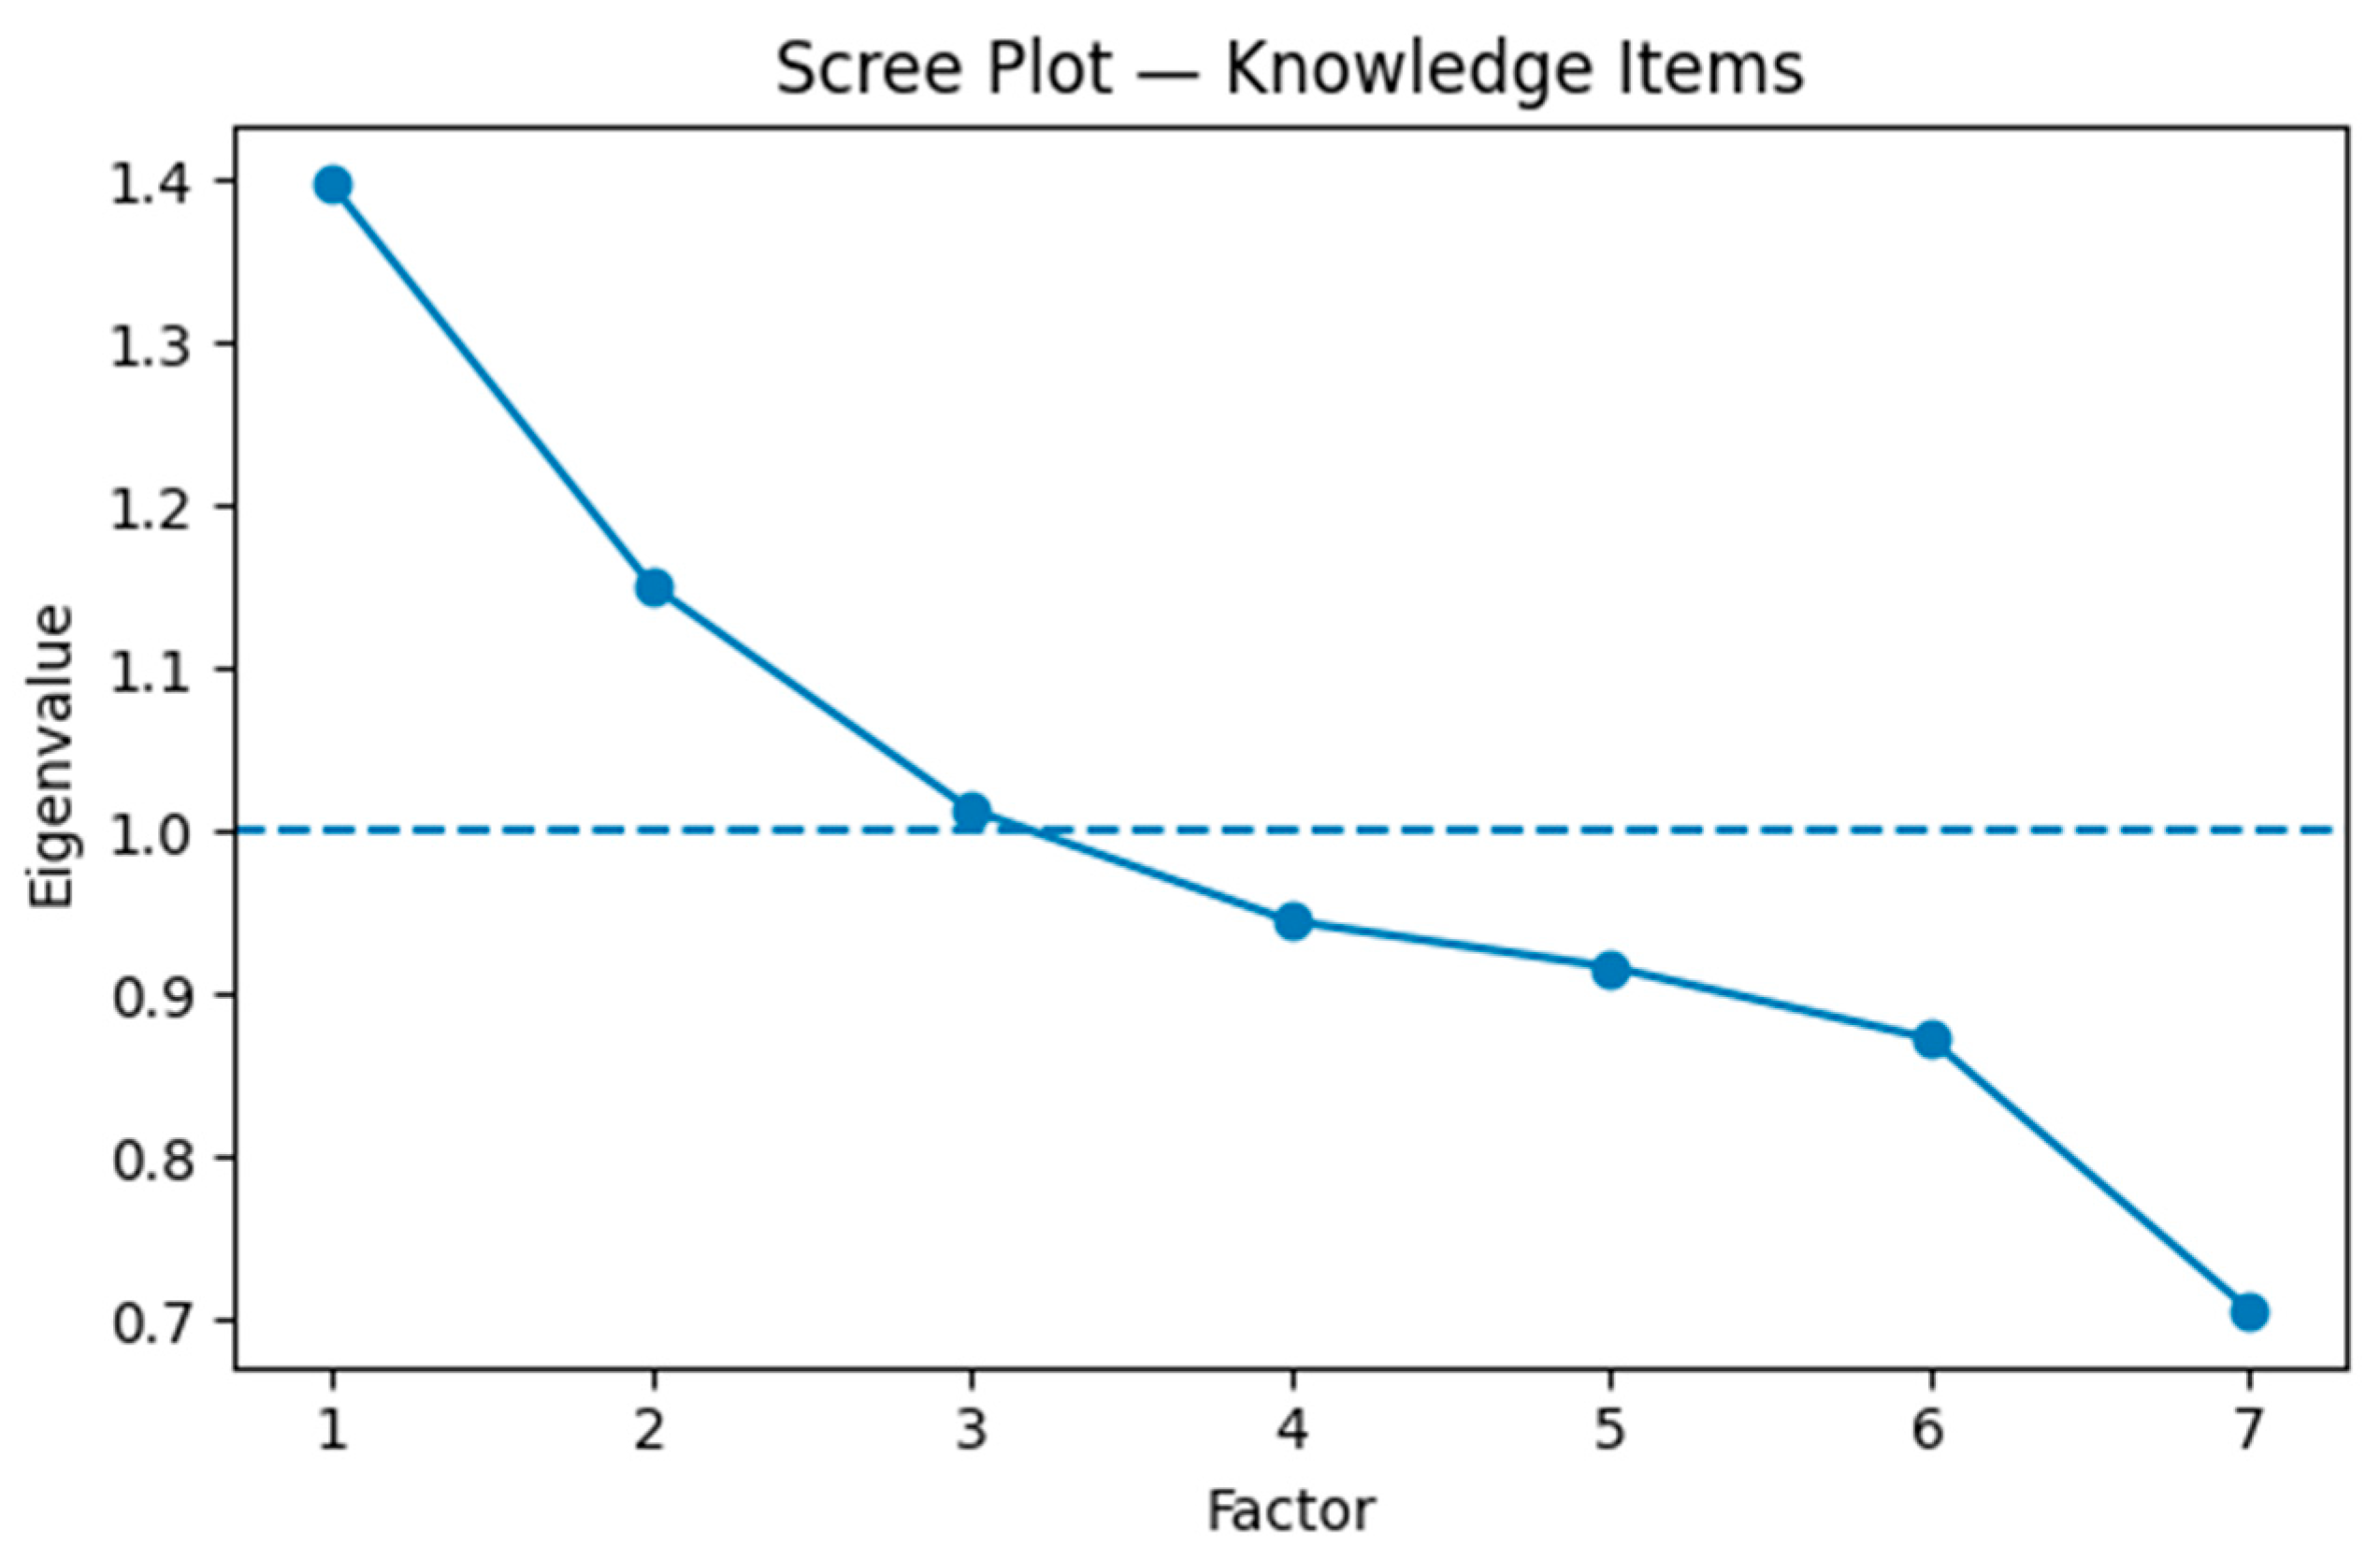
For the financial knowledge factor, the seven NFCS quiz items loaded positively onto a single component representing objective financial literacy. The Bartlett test was significant (p < .001), and the KMO value of 0.543 was marginal but acceptable for binary quiz data.
Figure 1.
Scree plot for knowledge items (EFA). Note. The plot shows eigenvalues for the seven NFCS knowledge items. The elbow after the first factor supports a one-factor solution, which represents objective financial knowledge.
Figure 1.
Scree plot for knowledge items (EFA). Note. The plot shows eigenvalues for the seven NFCS knowledge items. The elbow after the first factor supports a one-factor solution, which represents objective financial knowledge.
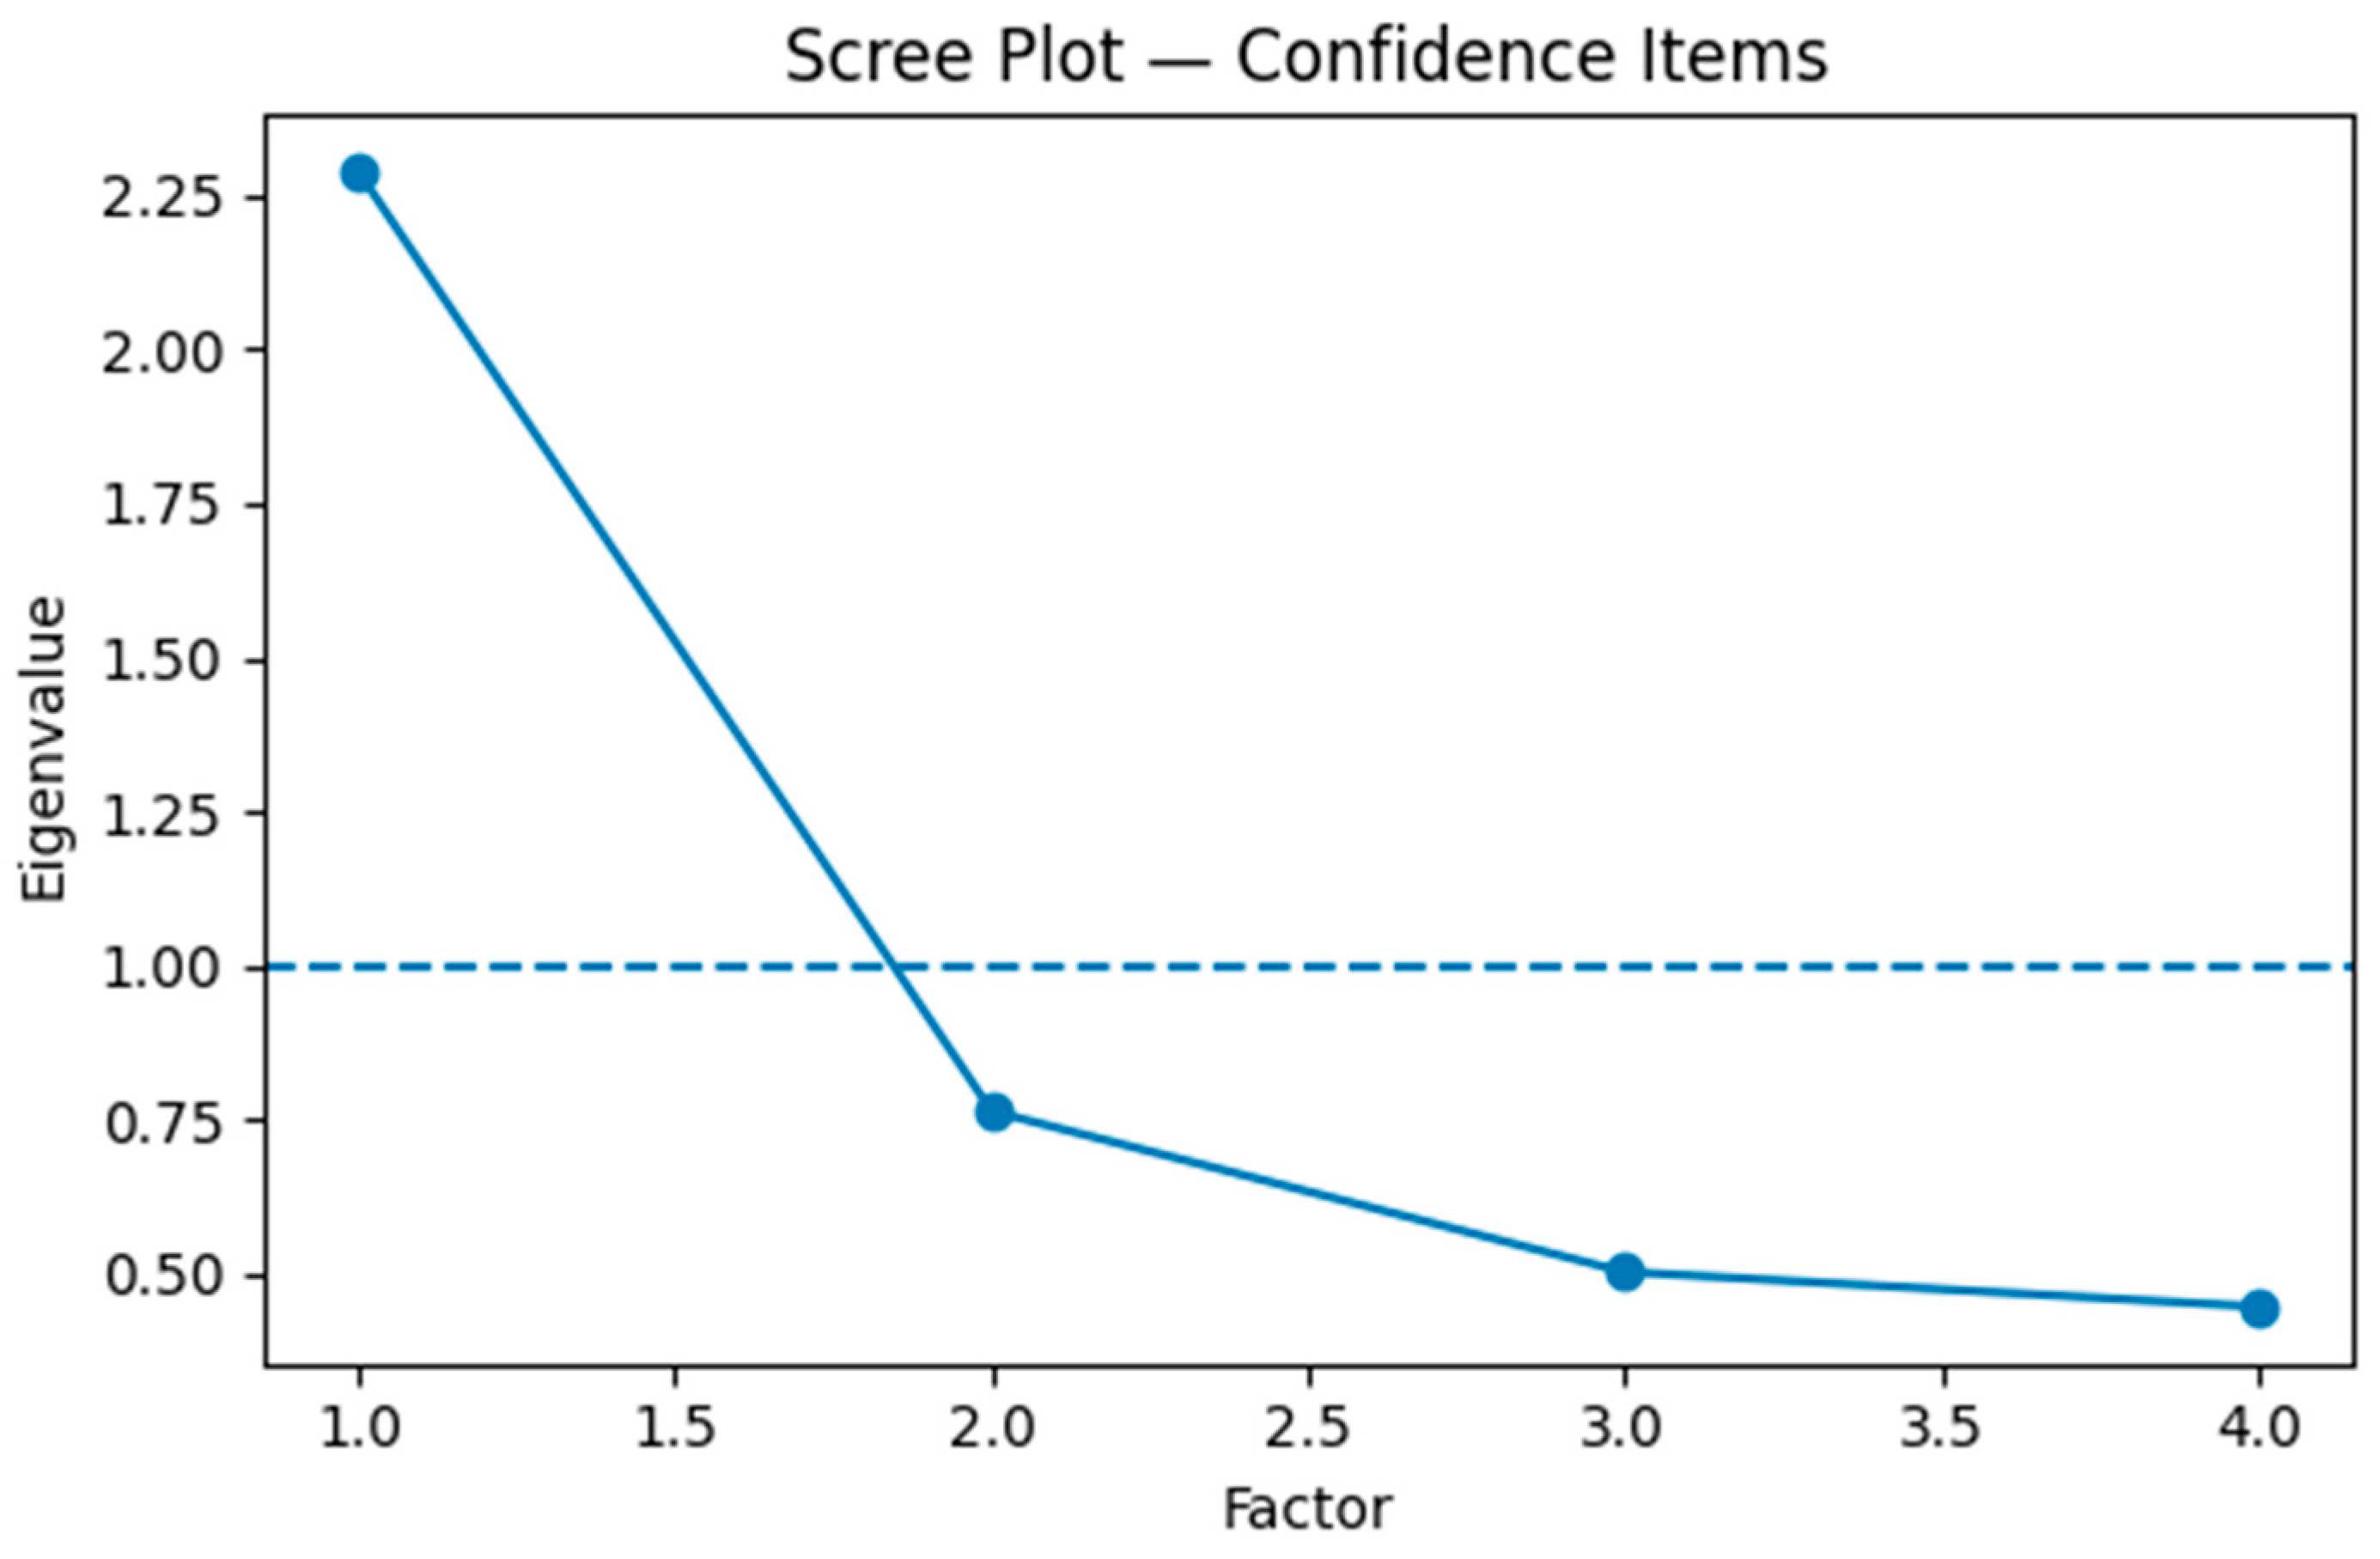
For the financial confidence factor, the Bartlett test was significant (p < .001), and the KMO value of 0.722 indicated good sampling adequacy. The scree plot confirmed a one-factor solution with strong loadings (0.64 to 0.66).
Figure 2.
Scree plot for confidence items (EFA). Note. The plot shows eigenvalues for four self-reported financial-confidence questions. The single dominant factor indicates a unified latent construct for perceived confidence.
Figure 2.
Scree plot for confidence items (EFA). Note. The plot shows eigenvalues for four self-reported financial-confidence questions. The single dominant factor indicates a unified latent construct for perceived confidence.
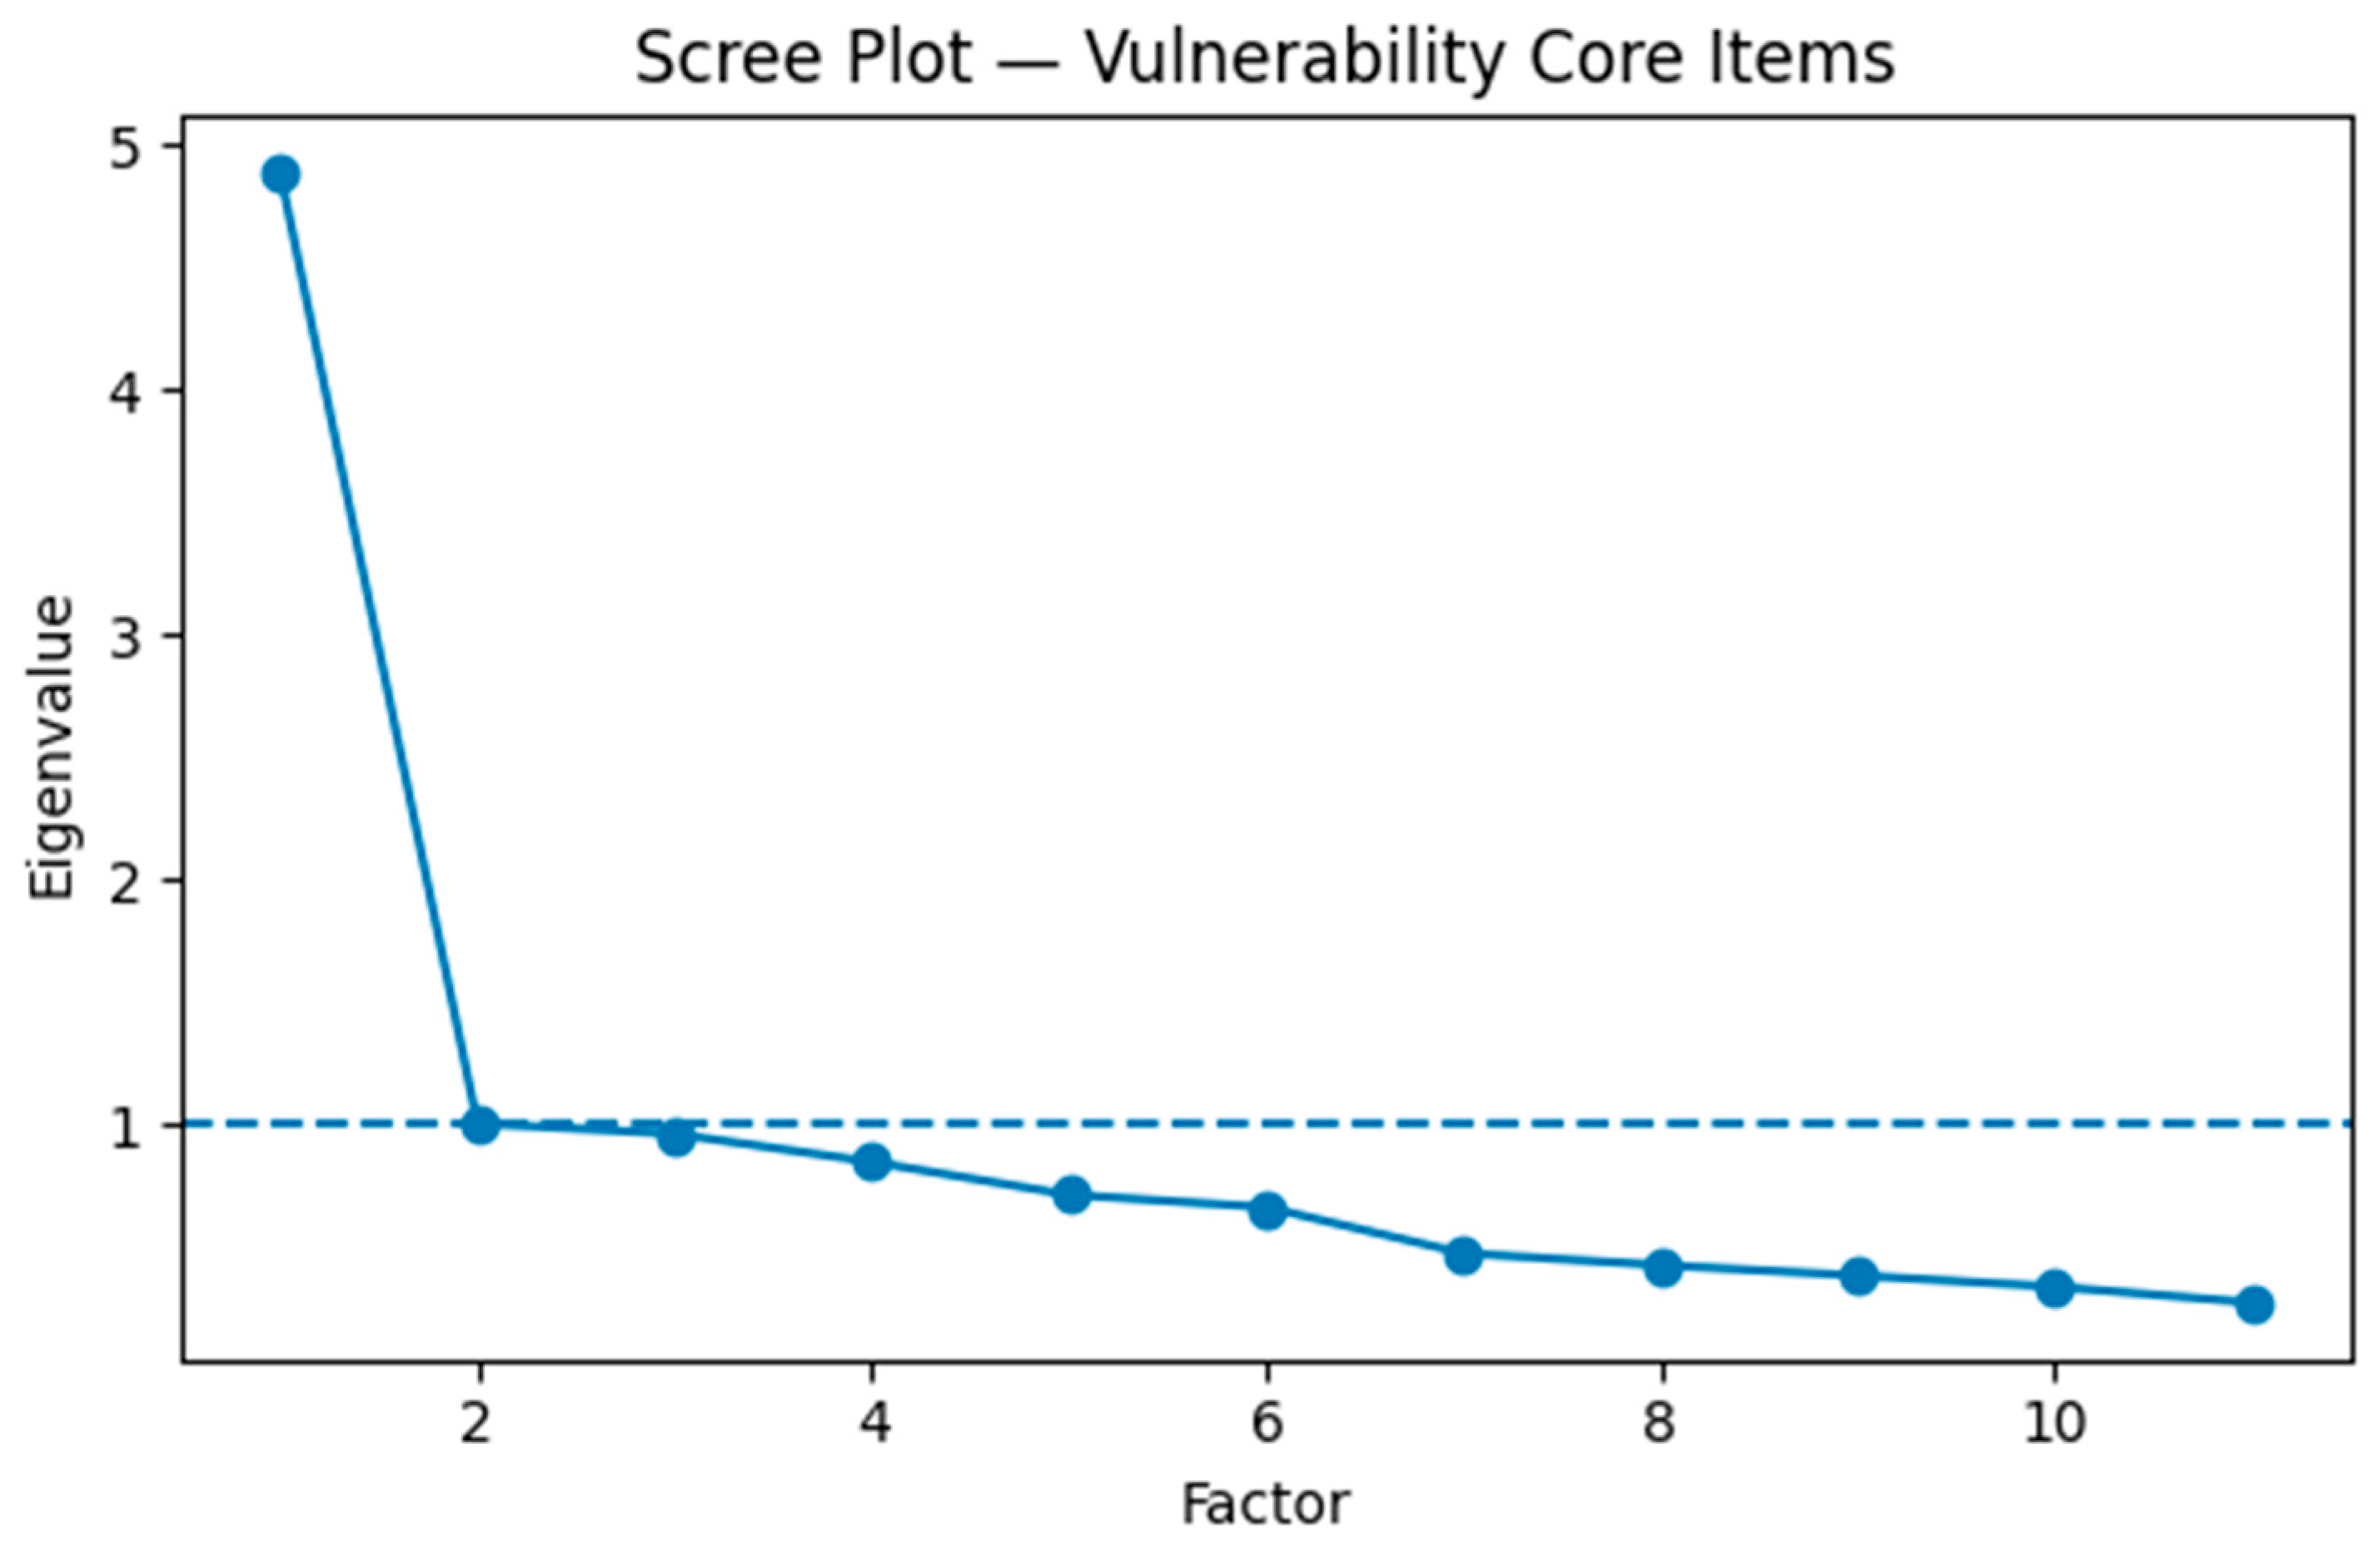
Finally, for the financial vulnerability factor, the KMO of 0.924 and significant Bartlett test confirmed strong factor reliability. One dominant factor explained about 43% of the total variance, representing overall financial vulnerability.
Figure 3.
Scree plot for Vulnerability items (EFA). Note. The plot shows eigenvalues for eleven self-reported financial outcome questions. The single dominant factor indicates a unified latent construct.
Figure 3.
Scree plot for Vulnerability items (EFA). Note. The plot shows eigenvalues for eleven self-reported financial outcome questions. The single dominant factor indicates a unified latent construct.
These factor results confirmed that the three constructs, confidence, knowledge, and vulnerability, were statistically and conceptually distinct. This allows further creation of a standardized overconfidence score, which is the difference between confidence and knowledge z-scores.
Descriptive Statistics
The descriptive analysis showed that the respondents to the survey generally reported moderate financial confidence, but scored lower on objective financial knowledge. The calculated overconfidence values ranged from negative 3 to positive 3, with a median near 0. This suggests that these individuals have a balanced mix between under confidence and overconfidence.
The average financial vulnerability score indicated that about one in three respondents had at least one of the major financial challenges among emergency savings and bill paying. Figure 4 above illustrated the relationship between overconfidence and financial vulnerability, showing a slight downward pattern. This suggests that people with higher overconfidence tend to report slightly lower vulnerability. Overall, confidence and knowledge were both negatively related to vulnerability, while overconfidence had a weak but slightly negative association.
Model Comparison Results
Five machine learning models were trained and compared using ten random seeds to predict financial vulnerability from the selected predictors. Across all runs, XGBoost consistently performed best (Figure 5).
As shown in Figure 5, XGBoost model had an average R² of 0.626 on the validation set and 0.605 on the test set. This proved both of its high accuracy and generalizability. Other models either had lower performance or less stability across seeds. Moreover, XGBoost had a small difference between training and validation R² (0.63 vs. 0.61), which suggested that the model was well-tuned and not overfitted. This strong predictive performance supported the decision to use XGBoost as the final model for the following explainability analysis.
Feature Importance and SHAP Results
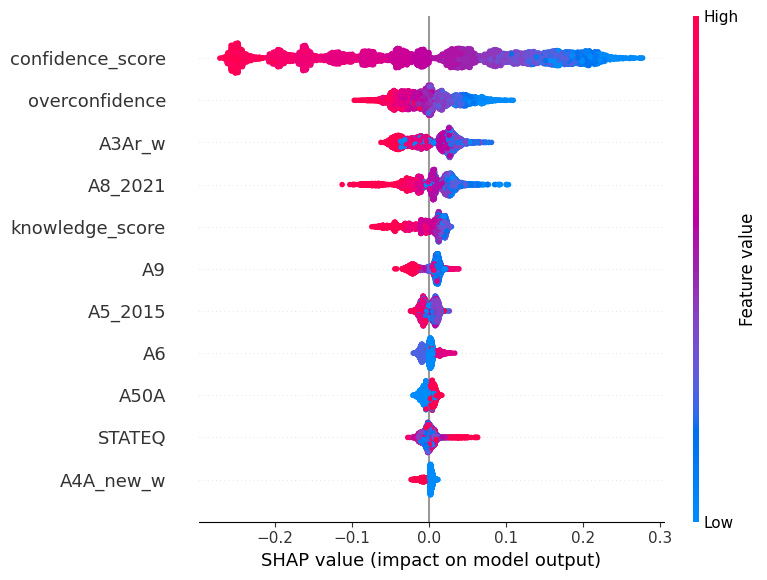
The SHAP analysis provided detailed insight on which variables contributed most to the XGBoost model’s predictions. It was first run on the validation set and then repeated on the test set to verify stability and robustness. In both of these sets, confidence remained the strongest predictor for financial vulnerability, with overconfidence and knowledge being the second and third. Among the demographic variables that were included for control purposes, income and education also had moderate impacts, while age and gender played smaller roles.
The test set results are presented in Figure 6 and Figure 7. The validation set results were not presented herein, but were highly consistent with the test findings, showing identical ranking of feature importance.
With Figure 6 showing the importance ranking, the SHAP beeswarm plot in Figure 7 illustrated the direction of these effects. Readers can easily tell that a higher confidence value is associated with lower predicted vulnerability, which is the negative SHAP value in the plot. Meanwhile, a lower confidence increased the vulnerability. Overconfidence also showed negative SHAP values, indicating its mild protective effect on vulnerability. It is also clear that knowledge, age and income all had negative effects on the outcome, meaning higher of these values would push vulnerability to the lower side.
To further verify if the result is robust, the mean absolute SHAP from validation and test sets where compared in Figure 8. There was a strong alignment between these two sets, with an average rank difference of less than one position apart. This result confirmed that the feature importance patterns are highly stable across the validation and testing datasets.
Overall, these SHAP analysis results proved that XGBoost model was not only accurate, but also interpretable. The model produced consistent patterns across different seeds and datasets. Altogether, these results provided a convincing way that connected overconfidence, knowledge and financial outcomes, allowing the main research question to be tested in a data driven and transparent manner. The model predictions were hence confirmed to be not only statistically reliable, but also behaviorally meaningful.
Overconfidence Patterns and Interaction Effects
The study then generated several visualizations to further explore how overconfidence affected predicted financial vulnerability. In Figure 9, the SHAP dependence plot showed a downward trend, indicating that individuals with higher overconfidence are predicted to have lower vulnerability scores, which supported the results from the prior figures. The quartile-based comparisons in Figure 10 and Figure 11 further confirmed this trend, both showing decreased actual and predicted vulnerability when overconfidence level is higher.
To check consistency, respondents were further divided into quartiles based on their overconfidence levels. Both the actual and predicted vulnerability averages decreased as overconfidence increased, confirming the same trend across groups.
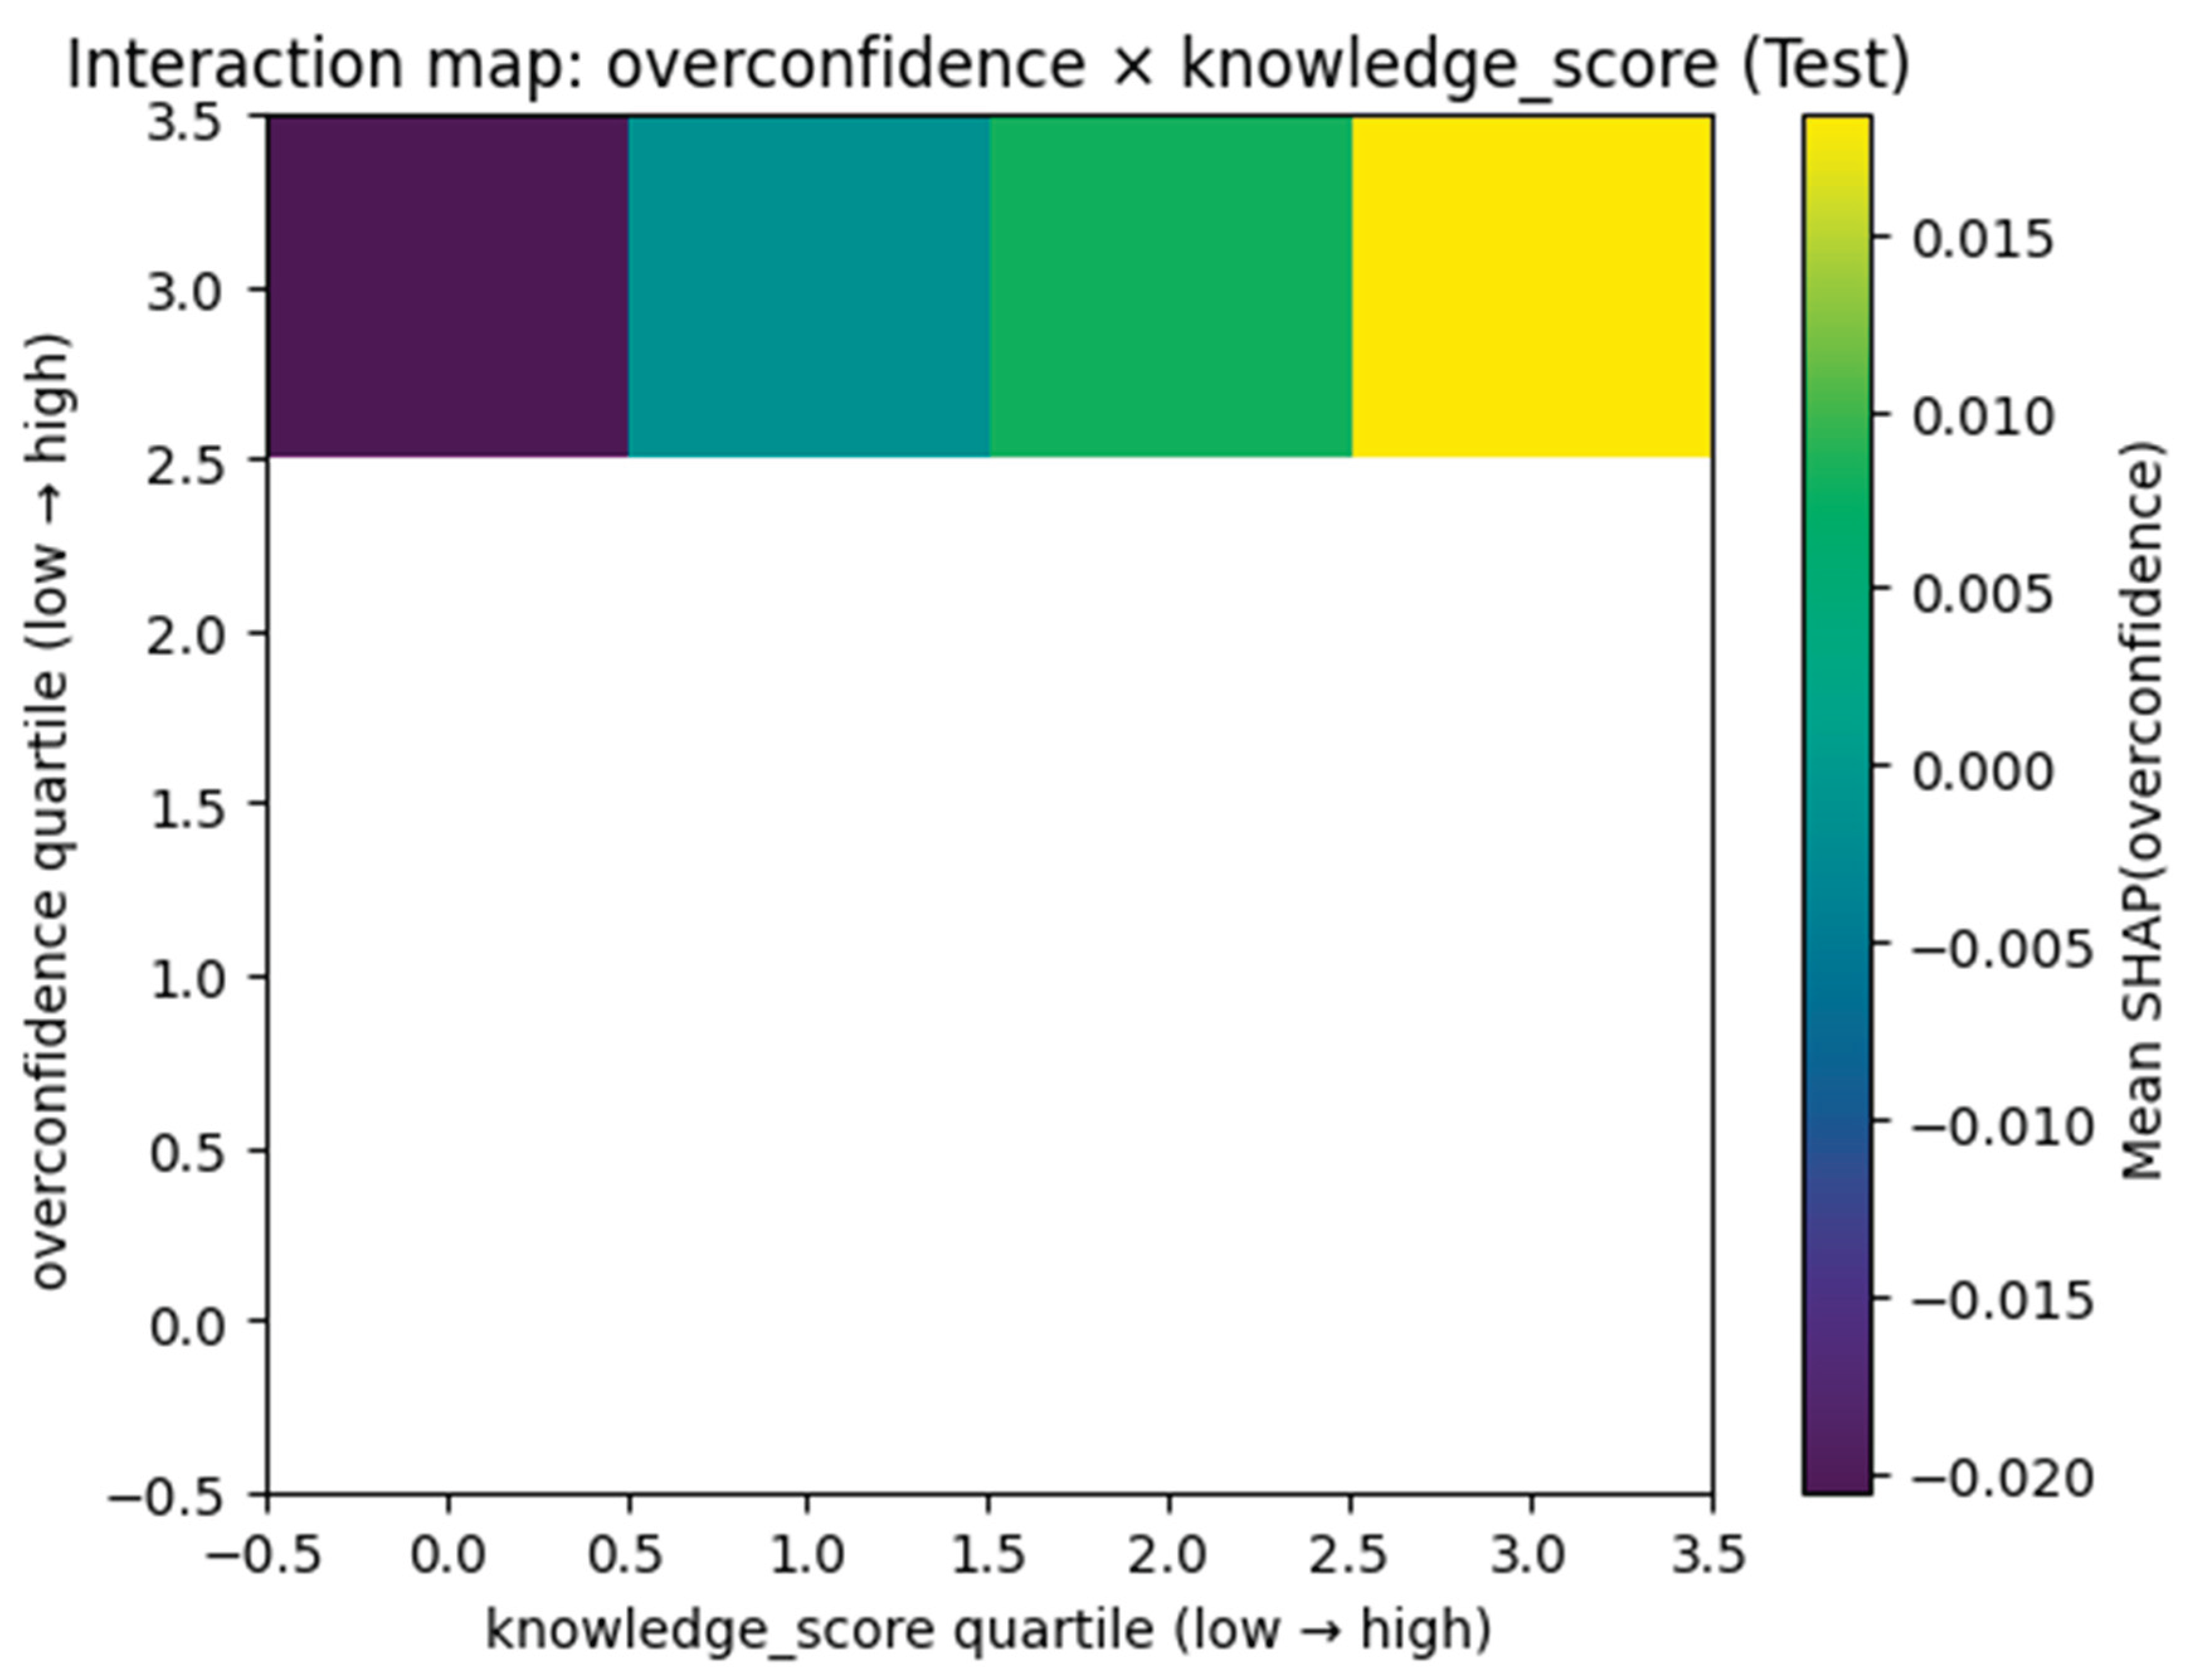
A visualization of interaction was also generated which further showed that SHAP values for overconfidence were most negative when knowledge was low (Figure 12). This pattern suggests that confidence may sometimes protect against vulnerability, especially when combined with lower actual knowledge levels.
Summary of Findings
Generally speaking, the final XGBoost model explained about 61% of the variance in financial vulnerability, which represents a strong and stable model fit for social science data. The model performed well and produced stable and interpretable patterns across all analyses. Confidence, knowledge, and overconfidence emerged as the key behavioral factors explaining financial vulnerability, while demographics played smaller but still noticeable roles.
The results also revealed that overconfidence actually did not increase financial vulnerability, which was originally hypothesized in this study. Instead, a moderate level of confidence, even when not fully supported by knowledge, appeared to have a slightly protective effect. These results underscored the complex interactions between financial knowledge, confidence, and actual financial behaviors. In the next section, the discussion will connect these findings with prior research and suggest possible explanations for the discover that overconfidence may be actually helpful, rather than harmful, on financial outcomes. The next section will also briefly cover how these results may set the stage for interpreting the psychological and practical implications of overconfidence.
Conclusion and Discussion
This study examined whether financial overconfidence increases people’s financial vulnerability when facing financial issues or stress. Using the 2024 FINRA NFCS data, the analysis identified each of financial confidence, knowledge and vulnerability as distinct latent constructs through Exploratory Factor Analysis. The XGBoost model analysis was then deemed to have demonstrated the strongest in predicting accuracy and the interpretability, and was selected for explainability analysis using SHAP values, which further revealed that in both validation and the test datasets, confidence was the strongest predictor for financial vulnerability, followed by knowledge and overconfidence.
The original hypothesis proposed in this study was that individuals with higher overconfidence would show greater financial vulnerability. In other words, the study initially suggested that if individuals believe they know more than they actually do, such overestimation of financial literacy would lead to worse financial outcomes. However, the model results draw a completely opposite picture, in which the SHAP value indicated that overconfidence has a rather small but negative effect on vulnerability. This points to a different direction showing that overconfidence is actually mildly protective, instead of harmful. In other words, people who reported higher confidence comparing to their actual knowledge tend to score slightly lower on the vulnerability index.
This finding, although opposite to the common instinct, was consistent across validation and test datasets, as well as all the ten random seeds used during the analysis. It was also confirmed by the dependence and quartile plots that higher overconfidence was generally linked to lower predicted vulnerability. One possible explanation is that individuals who believe they can manage their finance well may act more decisively or take proactive steps. These characteristics can help reduce short term financial stress, despite lower objective literacy. (Atkinson & Messy, 2012; Lusardi & Mitchell, 2014).
Overall, these results contributed to the understanding of behavioral finance, especially regarding the role of confidence and overconfidence. Lots of prior studies have described overconfidence as a risk factor that could lead to poor investment choices, excessive trading , or lower financial literacy (Barber & Odean, 2001; Moore & Healy, 2008). However, the findings in this study actually suggested that confidence may be on the constructive side. It turns out that confidence may actually help individuals take proactive steps, such as budgeting and maintaining sense of control during uncertain times, though which can further help reduce one’s anxiety and improve the consistency in the financial decision, even when one’s knowledge is not at the better level. Such finding and interpretation actually aligned well with some psychological researches suggesting that a sense of control or self-efficacy can protect against stress and improve goal-directed behaviors (Bandura, 1997; Baumeister et al., 2018).
The results from this study also have practical implications. As noted before, the financial education programs often focus on improving people knowledge, but pay less attention to people’s motivations and confidence. This study help support the idea that building one’s confidence alongside with knowledge might make financial education more effective. If educators can add to their workshops the encouragement of self-assurance in managing money, while still mentioning where the realistic limits are through knowledge teaching, individuals may feel more capable and have better financial outcomes. It could also be helpful for the policy makers to design outreach programs that increase participation by emphasizing empowerment, instead of deficiency. That way, people with limited financial knowledge would also be encouraged to learn and take necessary financial steps based on their decisions, instead of just watching or following others.
There are several limitations that need to be noted about this study though. The FINRA NFCS data is self-reported and cross-sectional. This could limit the data’s causal inference. Also, while SHAP analysis improves transparency, it can still reflect some correlational patterns rather than causal relationships. Finally, the data source of this study was limited to 2024 NFCS dataset. Incorporating the earlier waves could help determine whether these patterns have always been like these over the time.
Therefore, the future researchers can extend and further verify these findings by applying similar models to multiple NFCS data waves, such as including 2018 and 2021datasets. This can better examine changes in confidence and vulnerability across time ranges. Also, as stated in the literature review section, there are other definitions of overconfidence such as overplacement and overprecision (Moore & Healy, 2008) that could also be incorporated and explored. Scholars can conduct longitudinal or experimental studies to test whether boosting confidence through some targeted interventions can still reduce vulnerability. In addition, there can be subgroup analysis to examine more deeply on how financial confidence functions across different cultural, gender or income groups of population.
Generally speaking, the results from this study suggested that confidence and knowledge each play significant but different roles in shaping financial outcomes. Confidence appeared to be more like a behavioral motivator, while knowledge provides the technical foundation during decision making. The combination of these two factors, when moderately imbalance, actually does not necessarily increase financial risks as previously expected. Instead, even when not fully supported by knowledge, a certain level of confidence may serve as a buffer against financial vulnerability for some individuals.
Code Availability Statement
The complete Python code used for this analysis is available at: https://github.com/lihuang0922/ANLY699-Project---Overconfidence-and-Financial-vulnerability/blob/main/Updated2_ANLY699_Complete_Code_10_21.ipynb.
Data Availability Statement
Data used in this study come from the 2024 National Financial Capability Study (NFCS) and can be accessed at: https://finrafoundation.org/nfcs-data-and-downloads.
Conflicts of Interest
No known conflicts of interest are declared.
References
- Asaad, C. T. Financial literacy and financial behavior: Assessing knowledge and confidence. Financial Services Review 2015, 24(2), 101–117. Available online: https://openjournals.libs.uga.edu/fsr/article/download/3236/2871. [CrossRef]
- Atkinson, A.; Messy, F. A. Measuring financial literacy: Results of the OECD/International Network on Financial Education (INFE) pilot study. 2012. Available online: https://www.oecd.org/content/dam/oecd/en/publications/reports/2012/03/measuring-financial-literacy_g17a210b/5k9csfs90fr4-en.pdf.
- Balasubramnian, B.; Sargent, C. S. Impact of inflated perceptions of financial literacy on financial decision making. Journal of Economic Psychology 2020, 80, 102306. Available online: https://www.academia.edu/download/123329095/j.joep.2020.10230620250617-1-7drv3h.pdf. [CrossRef]
- Bandura, A. Self-efficacy: The exercise of control . Freeman 1997, Vol. 11. Available online: https://books.google.com/books?hl=en&lr=&id=eJ-PN9g_o-EC&oi=fnd&pg=PR7&dq=Bandura,+A.+(1997).+Self-efficacy:+The+exercise+of+control.&ots=zAMKNWebZd&sig=P6KH5Lj8lbFjIVEq3lBnCigg9FI#v=onepage&q=Bandura%2C%20A.%20(1997).%20Self-efficacy%3A%20The%20exercise%20of%20control.&f=false. [CrossRef]
- Barber, B. M.; Odean, T. Boys will be boys: Gender, overconfidence, and common stock investment. The quarterly journal of economics 2001, 116(1), 261–292. Available online: https://papers.ssrn.com/sol3/Delivery.cfm?abstractid=139415. [CrossRef]
- Baumeister, R. F.; Vohs, K. D.; Tice, D. M. The strength model of self-control. Current directions in psychological science 2007, 16(6), 351–355. Available online: https://www.elaborer.org/psy1045d/cours/Baumeister(2007).pdf. [CrossRef]
- Bucher-Koenen, T.; Alessie, R.; Lusardi, A.; van Rooij, M. Financial literacy and stock market participation. Fearless woman. 2021. Available online: https://gflec.org/wp-content/uploads/2021/03/Fearless-Woman-Research-March-2021.pdf.
- Dunning, D. The Dunning–Kruger effect: On being ignorant of one's own ignorance. In Advances in experimental social psychology; Academic Press, 2011; Vol. 44, pp. 247–296. Available online: https://casualpsych.com/wp-content/uploads/2021/10/The-Dunning-Kruger-Effect.pdf.
- Fernandes, D.; Lynch, J. G.; Netemeyer, R. G. Financial literacy, financial education, and downstream financial behaviors. Management science 2014, 60(8), 1861–1883. Available online: https://papers.ssrn.com/sol3/Delivery.cfm?abstractid=2333898. [CrossRef]
- FINRA Investor Education Foundation. National Financial Capability Study (NFCS 2024). 2024. Available online: https://www.finrafoundation.org/nfcs.
- Hastings, J. S.; Madrian, B. C.; Skimmyhorn, W. L. Financial literacy, financial education, and economic outcomes. Annu. Rev. Econ. 2013, 5(1), 347–373. Available online: https://www.nber.org/system/files/working_papers/w18412/w18412.pdf. [CrossRef] [PubMed]
- Klapper, L.; Lusardi, A.; Van Oudheusden, P. Financial literacy around the world. World Bank. Washington DC: World Bank 2015, 2, 218–237. Available online: https://data.opendevelopmentmekong.net/dataset/df9a7bf9-72a3-4591-adb4-12eedd28f39c/resource/3322e885-f1fb-4450-a6c7-b8692cc7f057/download/Finlitpaper16F2singles.pdf.
- Lusardi, A. Financial literacy and the need for financial education: evidence and implications. Swiss journal of economics and statistics 2019, 155(1), 1–8. Available online: https://link.springer.com/content/pdf/10.1186/s41937-019-0027-5.pdf. [CrossRef]
- Lusardi, A.; Mitchell, O. S. The economic importance of financial literacy: Theory and evidence. American Economic Journal: Journal of Economic Literature 2014, 52(1), 5–44. Available online: https://www.nber.org/system/files/working_papers/w18952/w18952.pdf. [CrossRef] [PubMed]
- Lusardi, A.; Tufano, P. Debt literacy, financial experiences, and overindebtedness. Journal of pension economics & finance 2015, 14(4), 332–368. Available online: https://www.nber.org/system/files/working_papers/w14808/w14808.pdf.
- Moore, D. A.; Healy, P. J. The trouble with overconfidence. Psychological review 2008, 115(2), 502. Available online: https://papers.ssrn.com/sol3/Delivery.cfm?abstractid=1001821. [CrossRef] [PubMed]
- OECD. Women and financial education: Evidence, policy responses and guidance; OECD Publishing, 2013. [Google Scholar] [CrossRef]
- OECD. OECD/INFE 2020 International Survey of Adult Financial Literacy; OECD Publishing, 2020; Available online: https://www.oecd.org/en/publications/2020/06/oecd-infe-2020-international-survey-of-adult-financial-literacy_bbad9b27.html.
- Parker, A. M.; Fischhoff, B. Decision-making competence: External validation through an individual-differences approach. Journal of Behavioral Decision Making 2005, 18(1), 1–27. Available online: https://www.researchgate.net/profile/Baruch-Fischhoff/publication/227634038_Decision-Making_Competence_External_Validation_Through_an_Individual-Differences_Approach/links/5c0e596192851c39ebe25d39/Decision-Making-Competence-External-Validation-Through-an-Individual-Differences-Approach.pdf?_sg%5B0%5D=started_experiment_milestone&origin=journalDetail. [CrossRef]
- Porto, N.; Xiao, J. J. Financial literacy overconfidence and financial advice seeking. Porto, N., & Xiao, JJ (2016). Financial Literacy Overconfidence and Financial Advice Seeking. Journal of Financial Service Professionals 2016, 70(4). Available online: https://papers.ssrn.com/sol3/Delivery.cfm?abstractid=4051786.
- Schaefer, P. S.; Williams, C. C.; Goodie, A. S.; Campbell, W. K. Overconfidence and the big five. Journal of research in Personality 2004, 38(5), 473–480. Available online: https://www.academia.edu/download/40973709/Schaefer_et_al._2003_JRP.pdf. [CrossRef]
- Tang, N.; Baker, A. Self-esteem, financial knowledge and financial behavior. Journal of economic psychology 2016, 54, 164–176. [Google Scholar] [CrossRef]
- Vörös, Z.; Szabó, Z.; Kehl, D.; Kovács, O. B.; Papp, T.; Schepp, Z. The forms of financial literacy overconfidence and their role in financial well-being. International Journal of Consumer Studies 2021, 45(6), 1292–1308. [Google Scholar] [CrossRef]
- Xiao, J. J.; Chen, C.; Sun, L. Age differences in consumer financial capability. International Journal of Consumer Studies 2015, 39(4), 387–395. Available online: https://digitalcommons.uri.edu/cgi/viewcontent.cgi?article=1021&context=hdf_facpubs. [CrossRef]
- Yakoboski, P.; Lusardi, A.; Hasler, A. The 2020 TIAA Institute-GFLEC Personal Finance Index: Many do not know what they do and do not know. 2020. Available online: https://gflec.org/wp-content/uploads/2020/04/TIAA-Institute-GFLEC_2020-P-Fin-Index_April-2020.pdf.
Figure 4.
Scatterplot of overconfidence and financial vulnerability (z-scores). Note. Each point represents one respondent.
Figure 4.
Scatterplot of overconfidence and financial vulnerability (z-scores). Note. Each point represents one respondent.
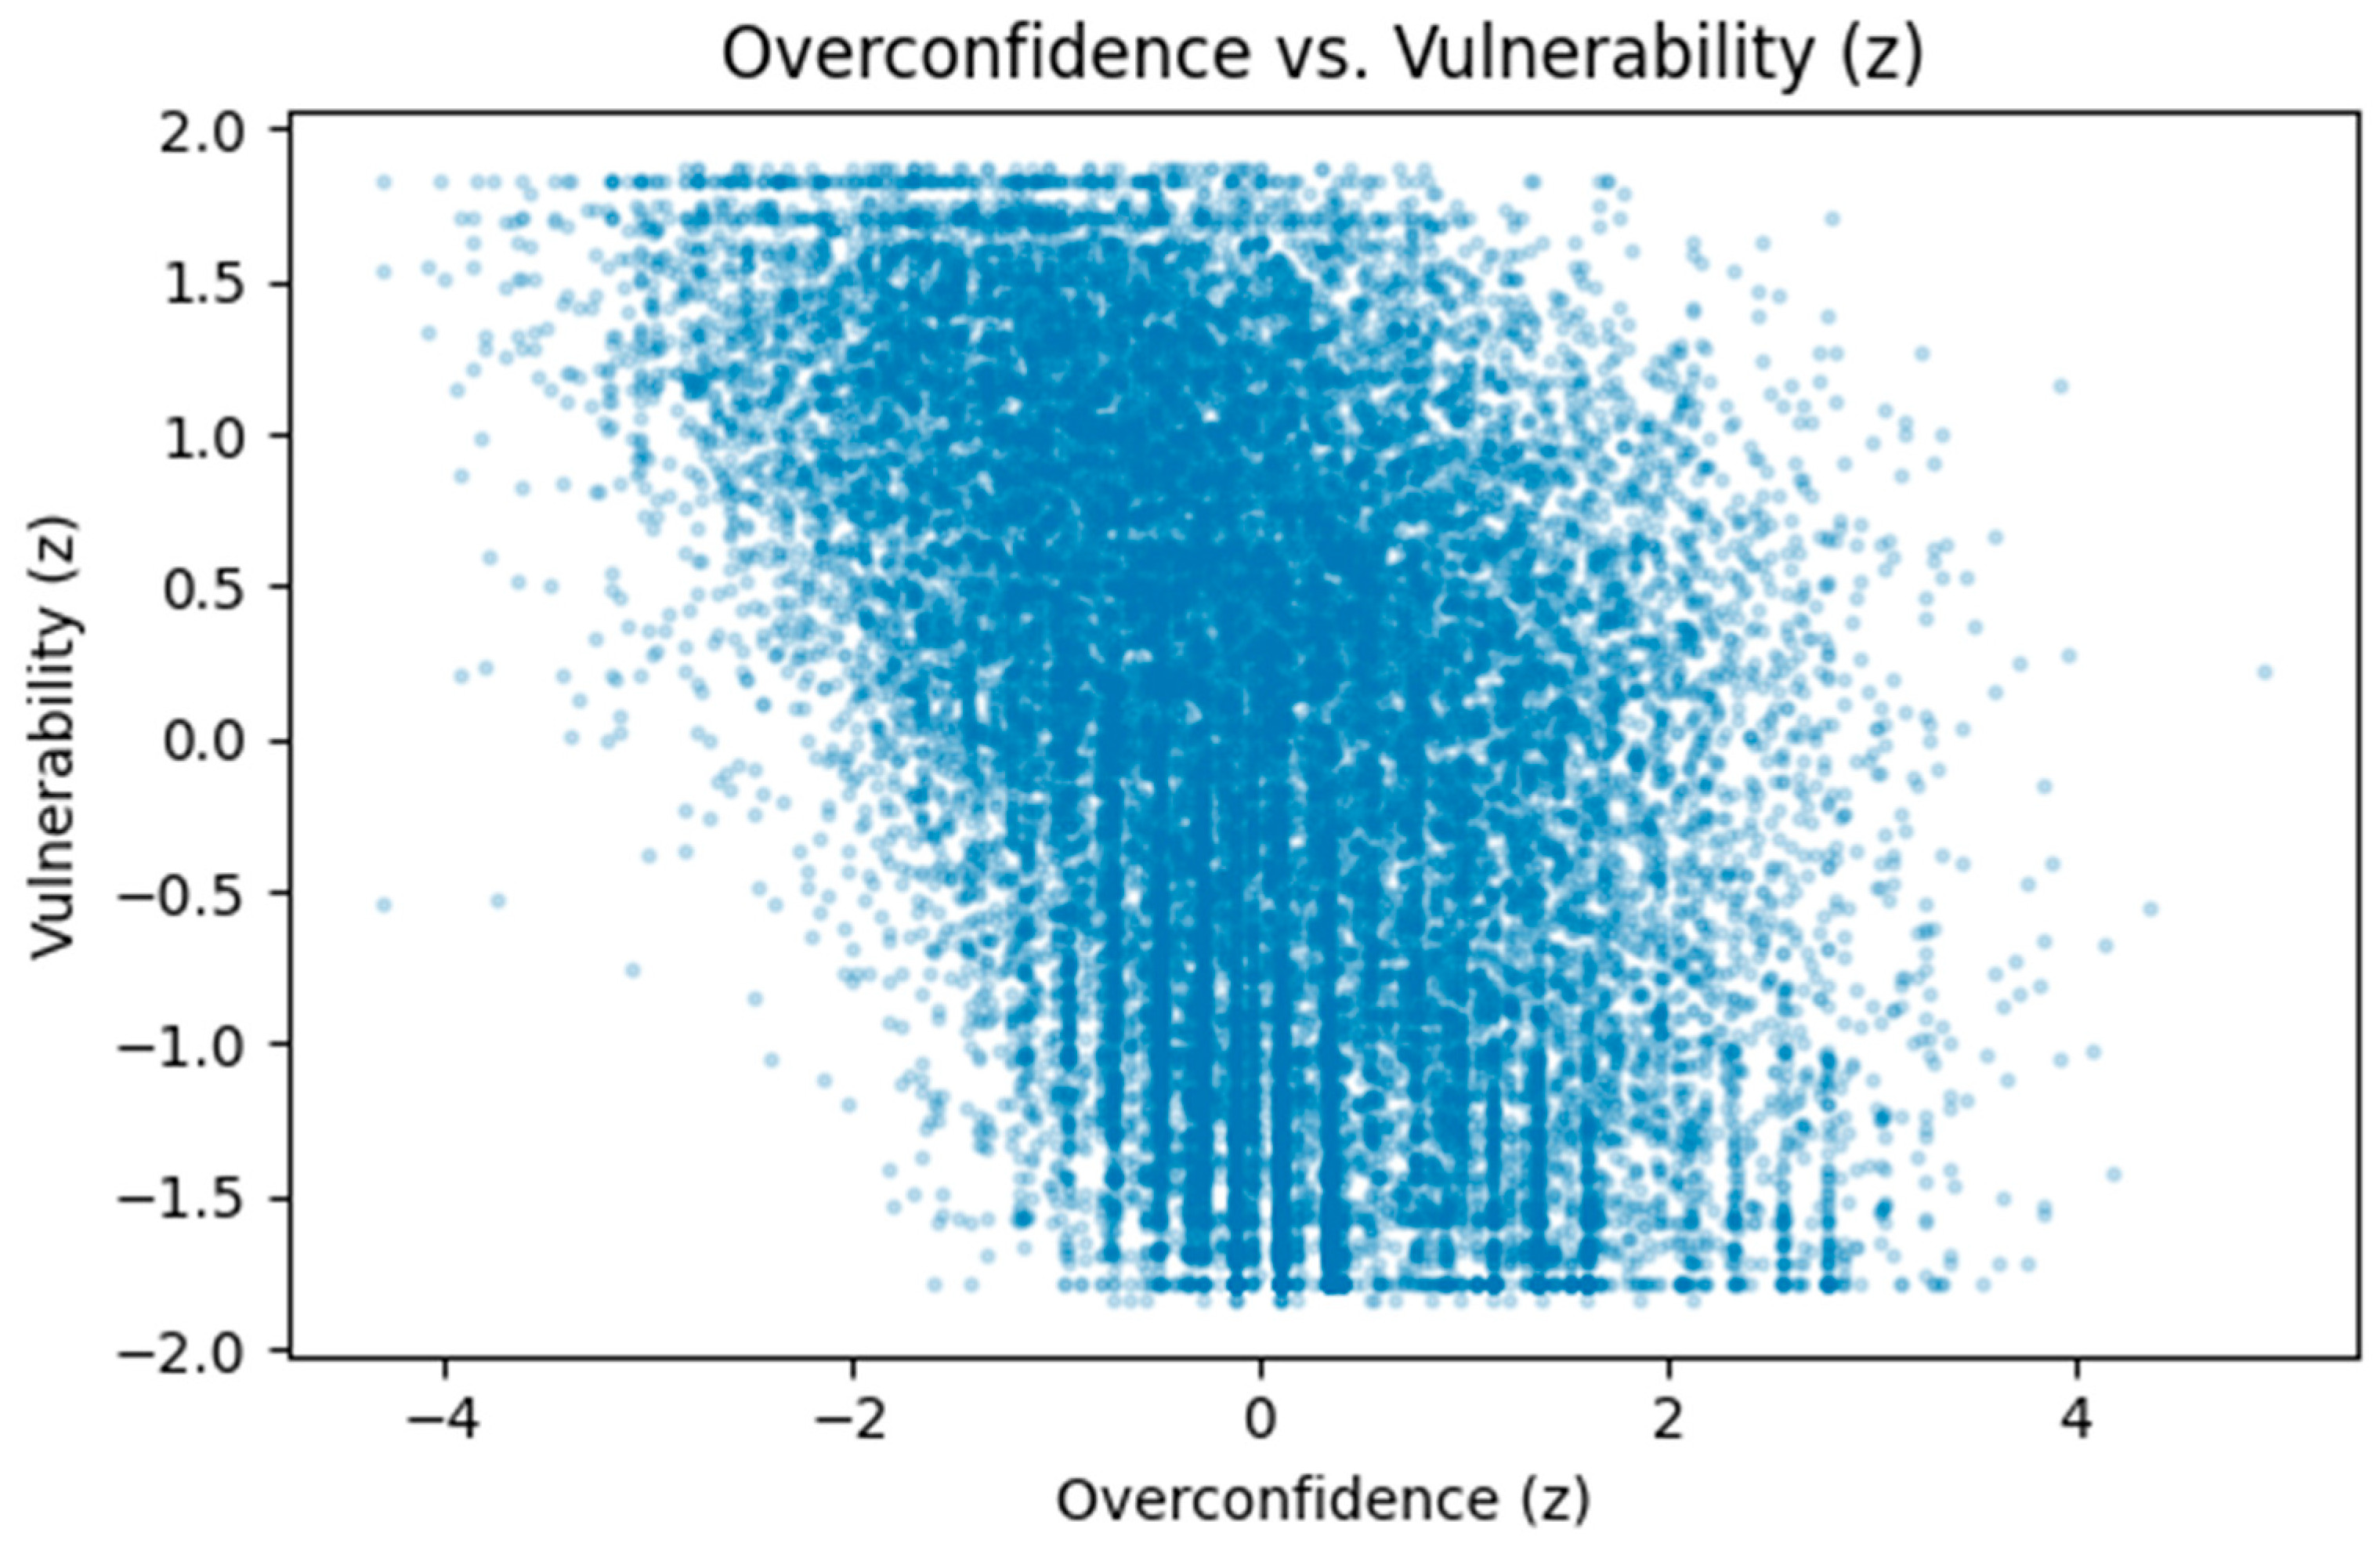
Figure 5.
Actual versus predicted results for all models across 10 seeds. Note. The plot compares between predicted and actual financial vulnerability scores across training, validation, and test sets for XGBoost, Linear Regression, Random Forest, SVM (Linear), and GAM models.
Figure 5.
Actual versus predicted results for all models across 10 seeds. Note. The plot compares between predicted and actual financial vulnerability scores across training, validation, and test sets for XGBoost, Linear Regression, Random Forest, SVM (Linear), and GAM models.
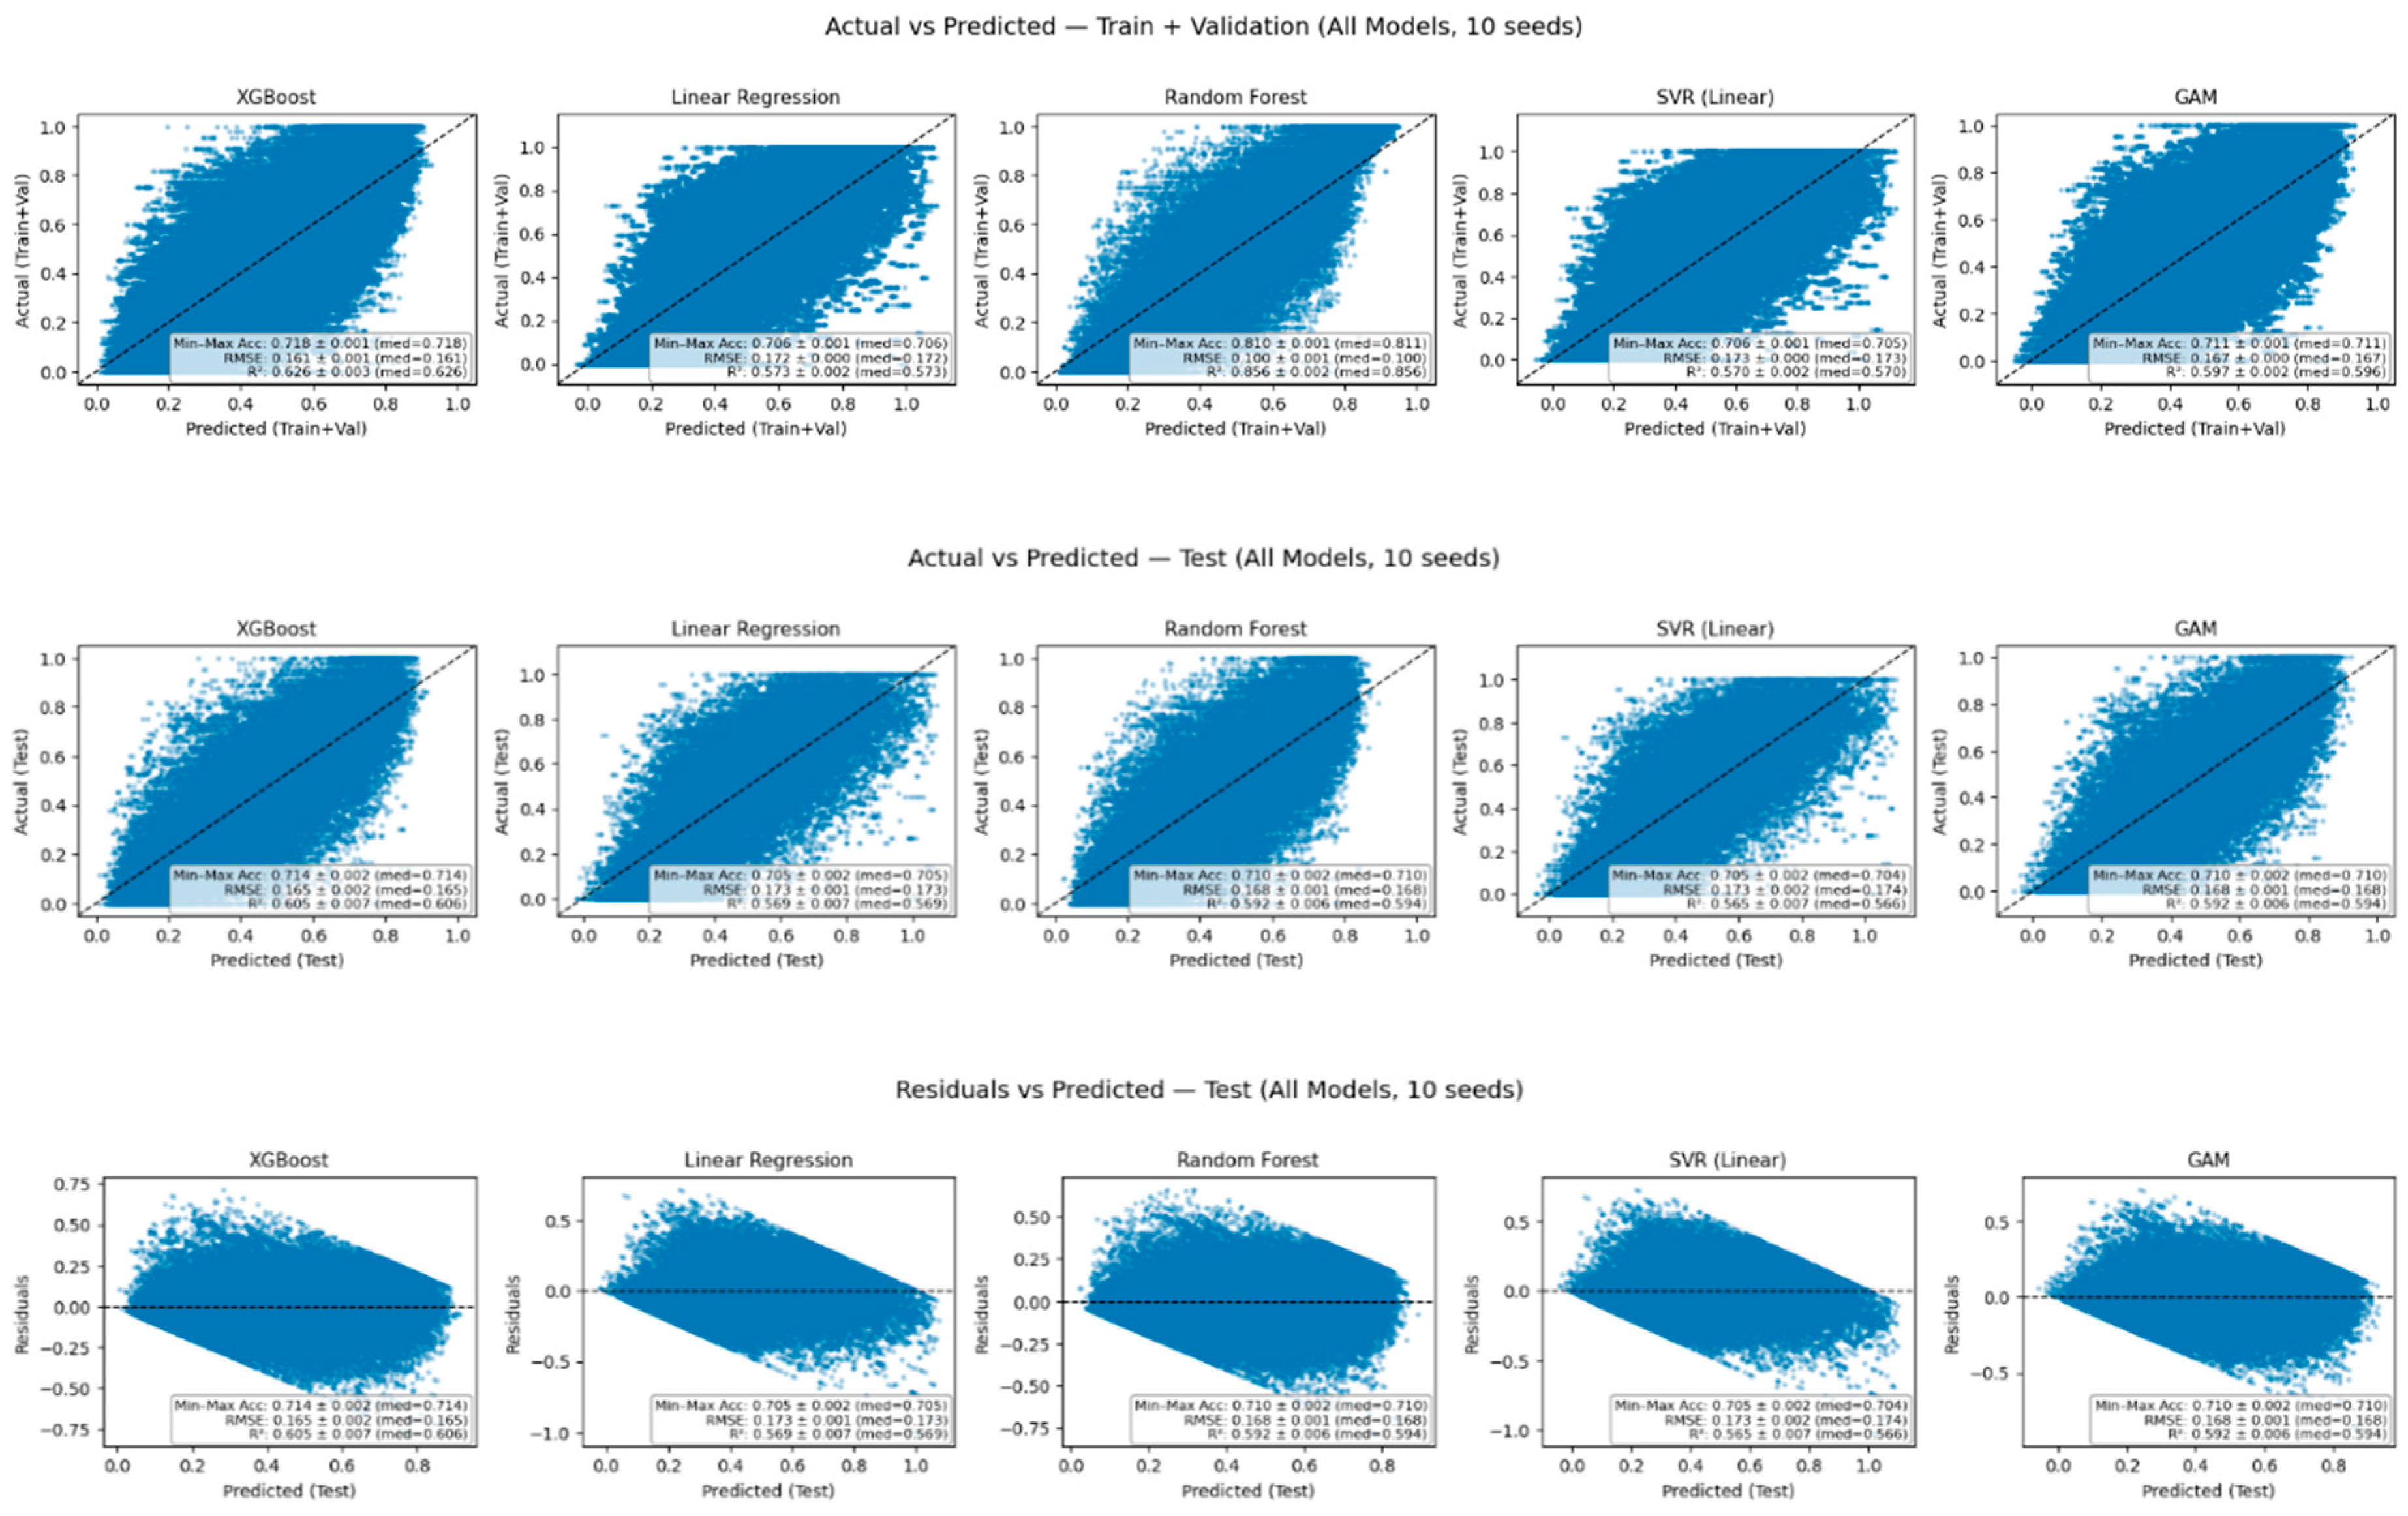
Figure 6.
Pooled SHAP feature importance for the test set. Note. The figure shows the mean absolute SHAP values (average impact on model output) for all predictors in the XGBoost model. Confidence was the strongest contributor to predicting financial vulnerability, followed by overconfidence, age group (A3Ar_w), household income (A8_2021), and financial knowledge. The remaining features represent demographic factors, including marital status (A9), education level (A5_2015), employment status (A6), gender (A50A), state of residence (STATEQ), and race or ethnicity (A4A_new_w).
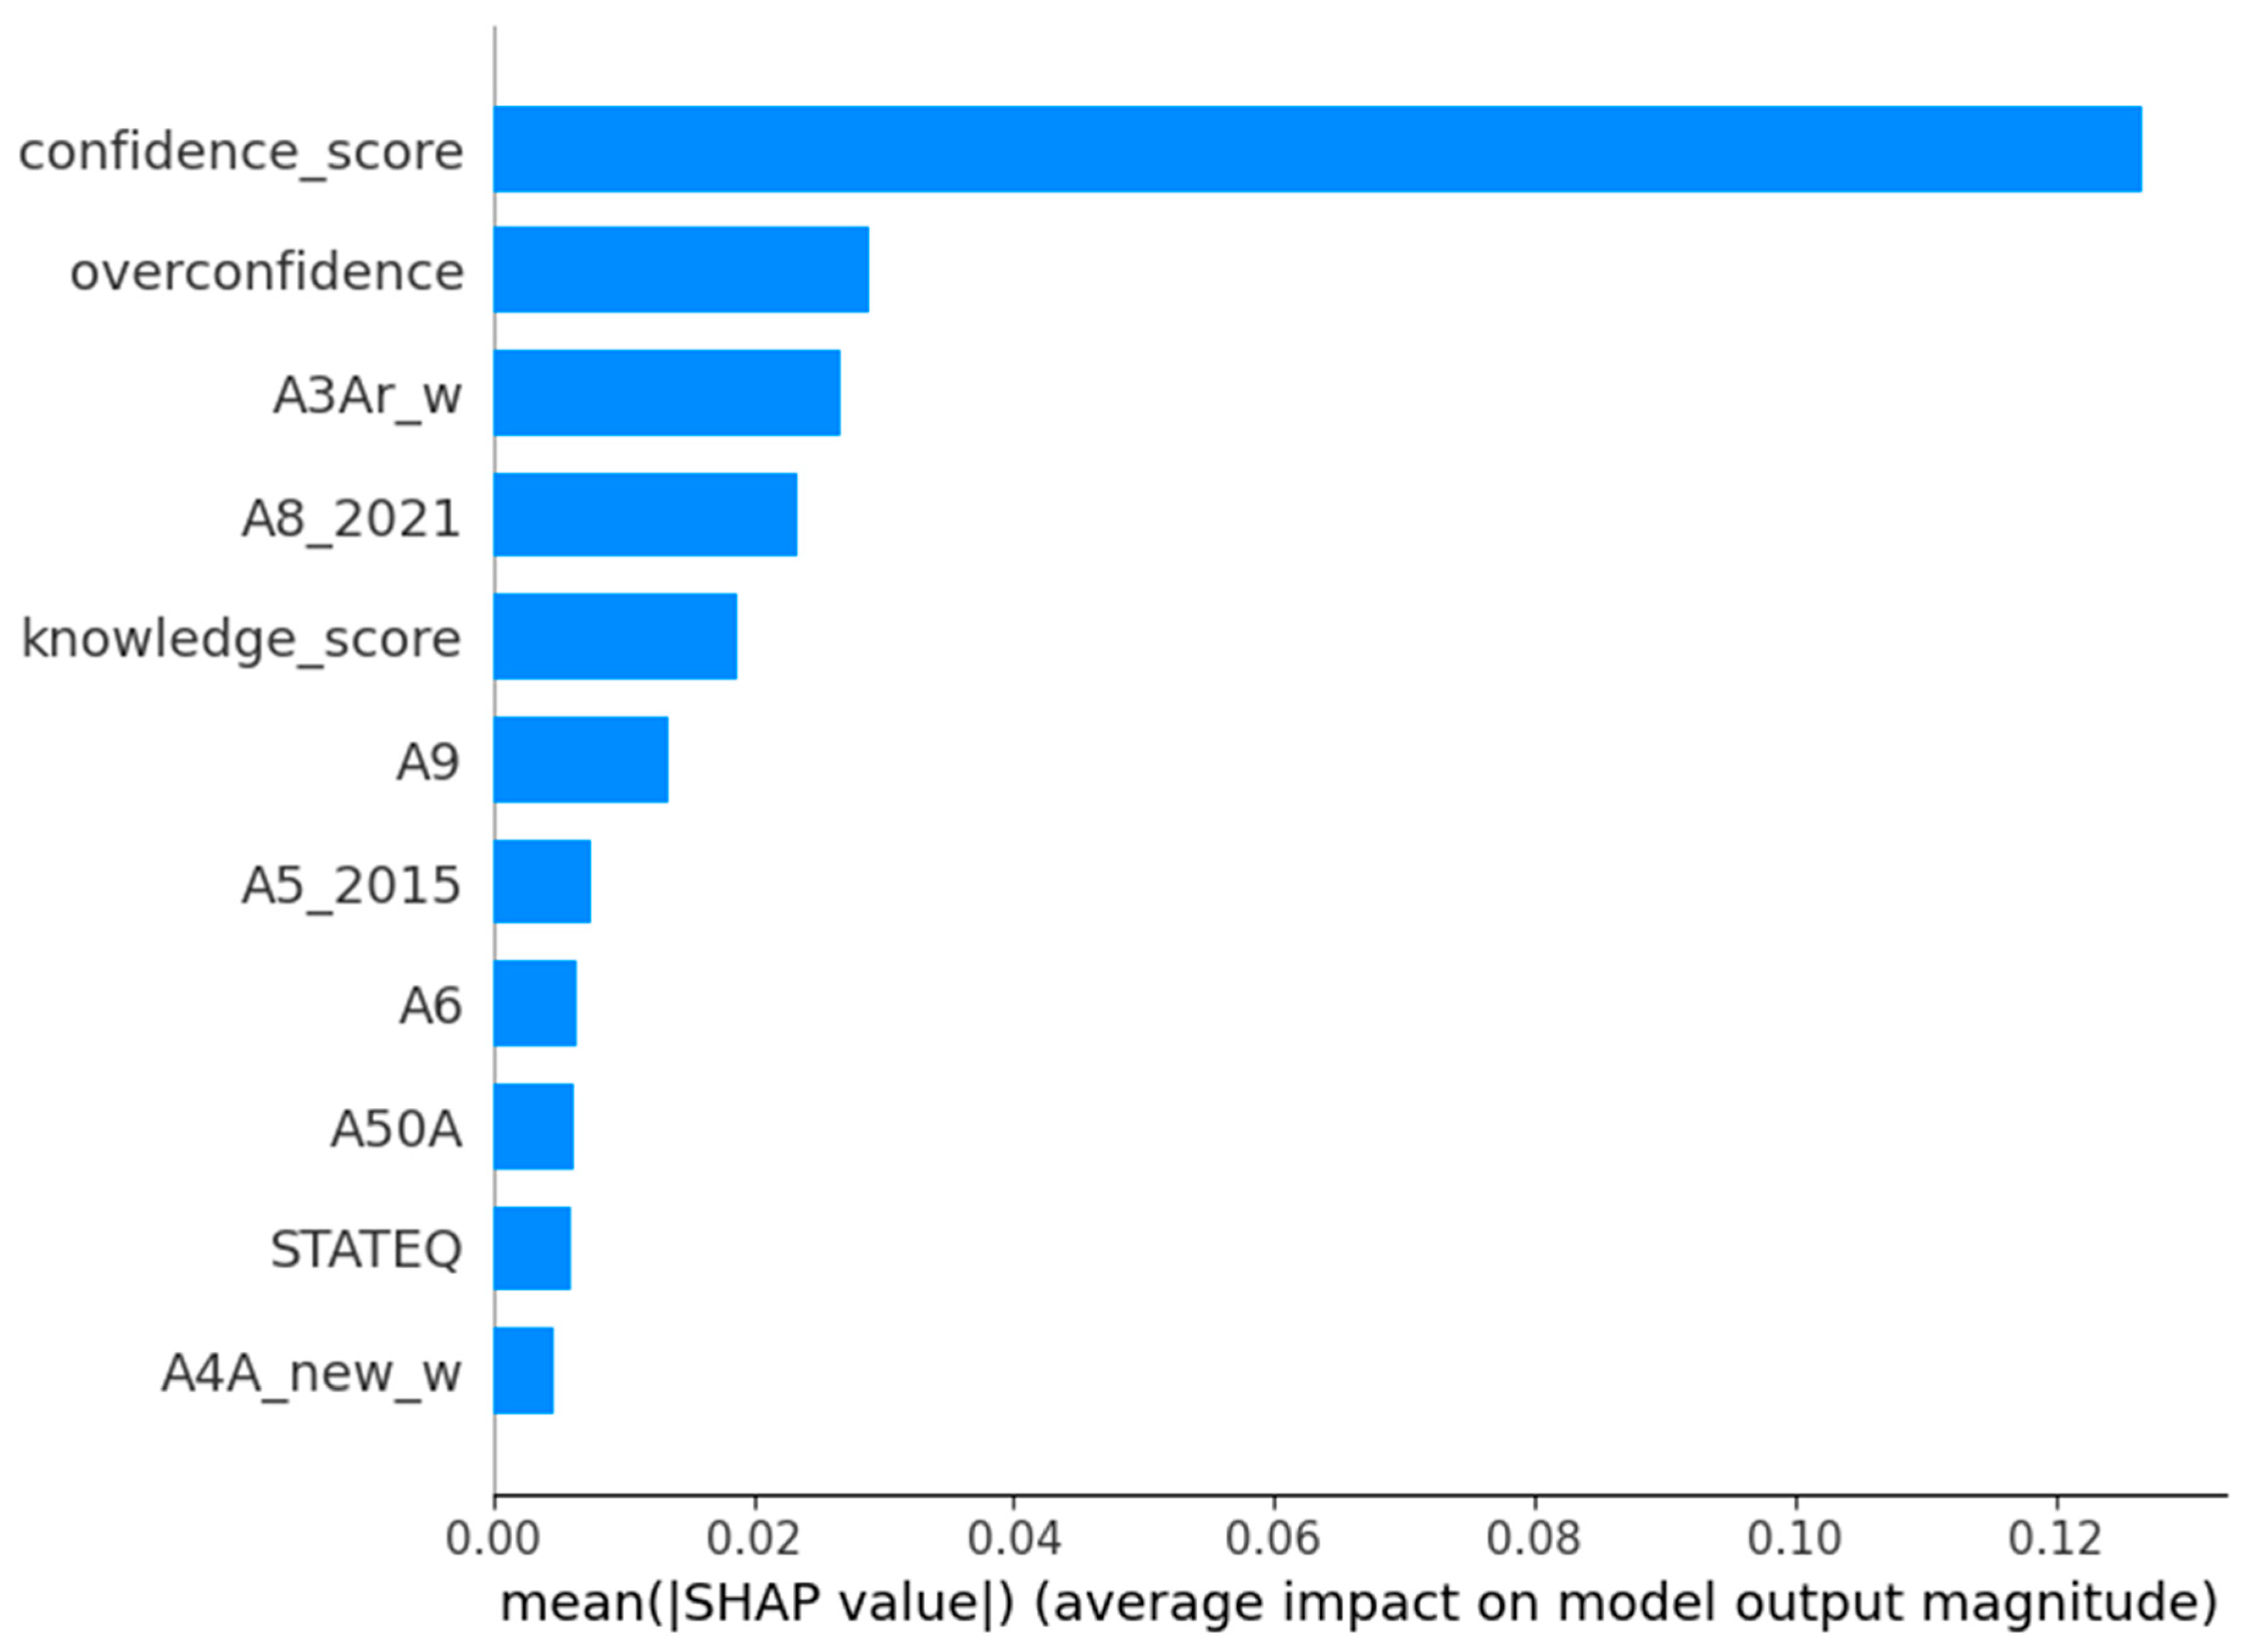
Figure 7.
Pooled SHAP beeswarm plot for the test set. Note. Each dot represents one observation. Colors show the feature value (red = high, blue = low). Negative SHAP values indicate lower predicted vulnerability, positive values increase it. Higher confidence scores strongly link to lower predicted vulnerability, while lower confidence, income, age and knowledge levels raise predicted vulnerability.
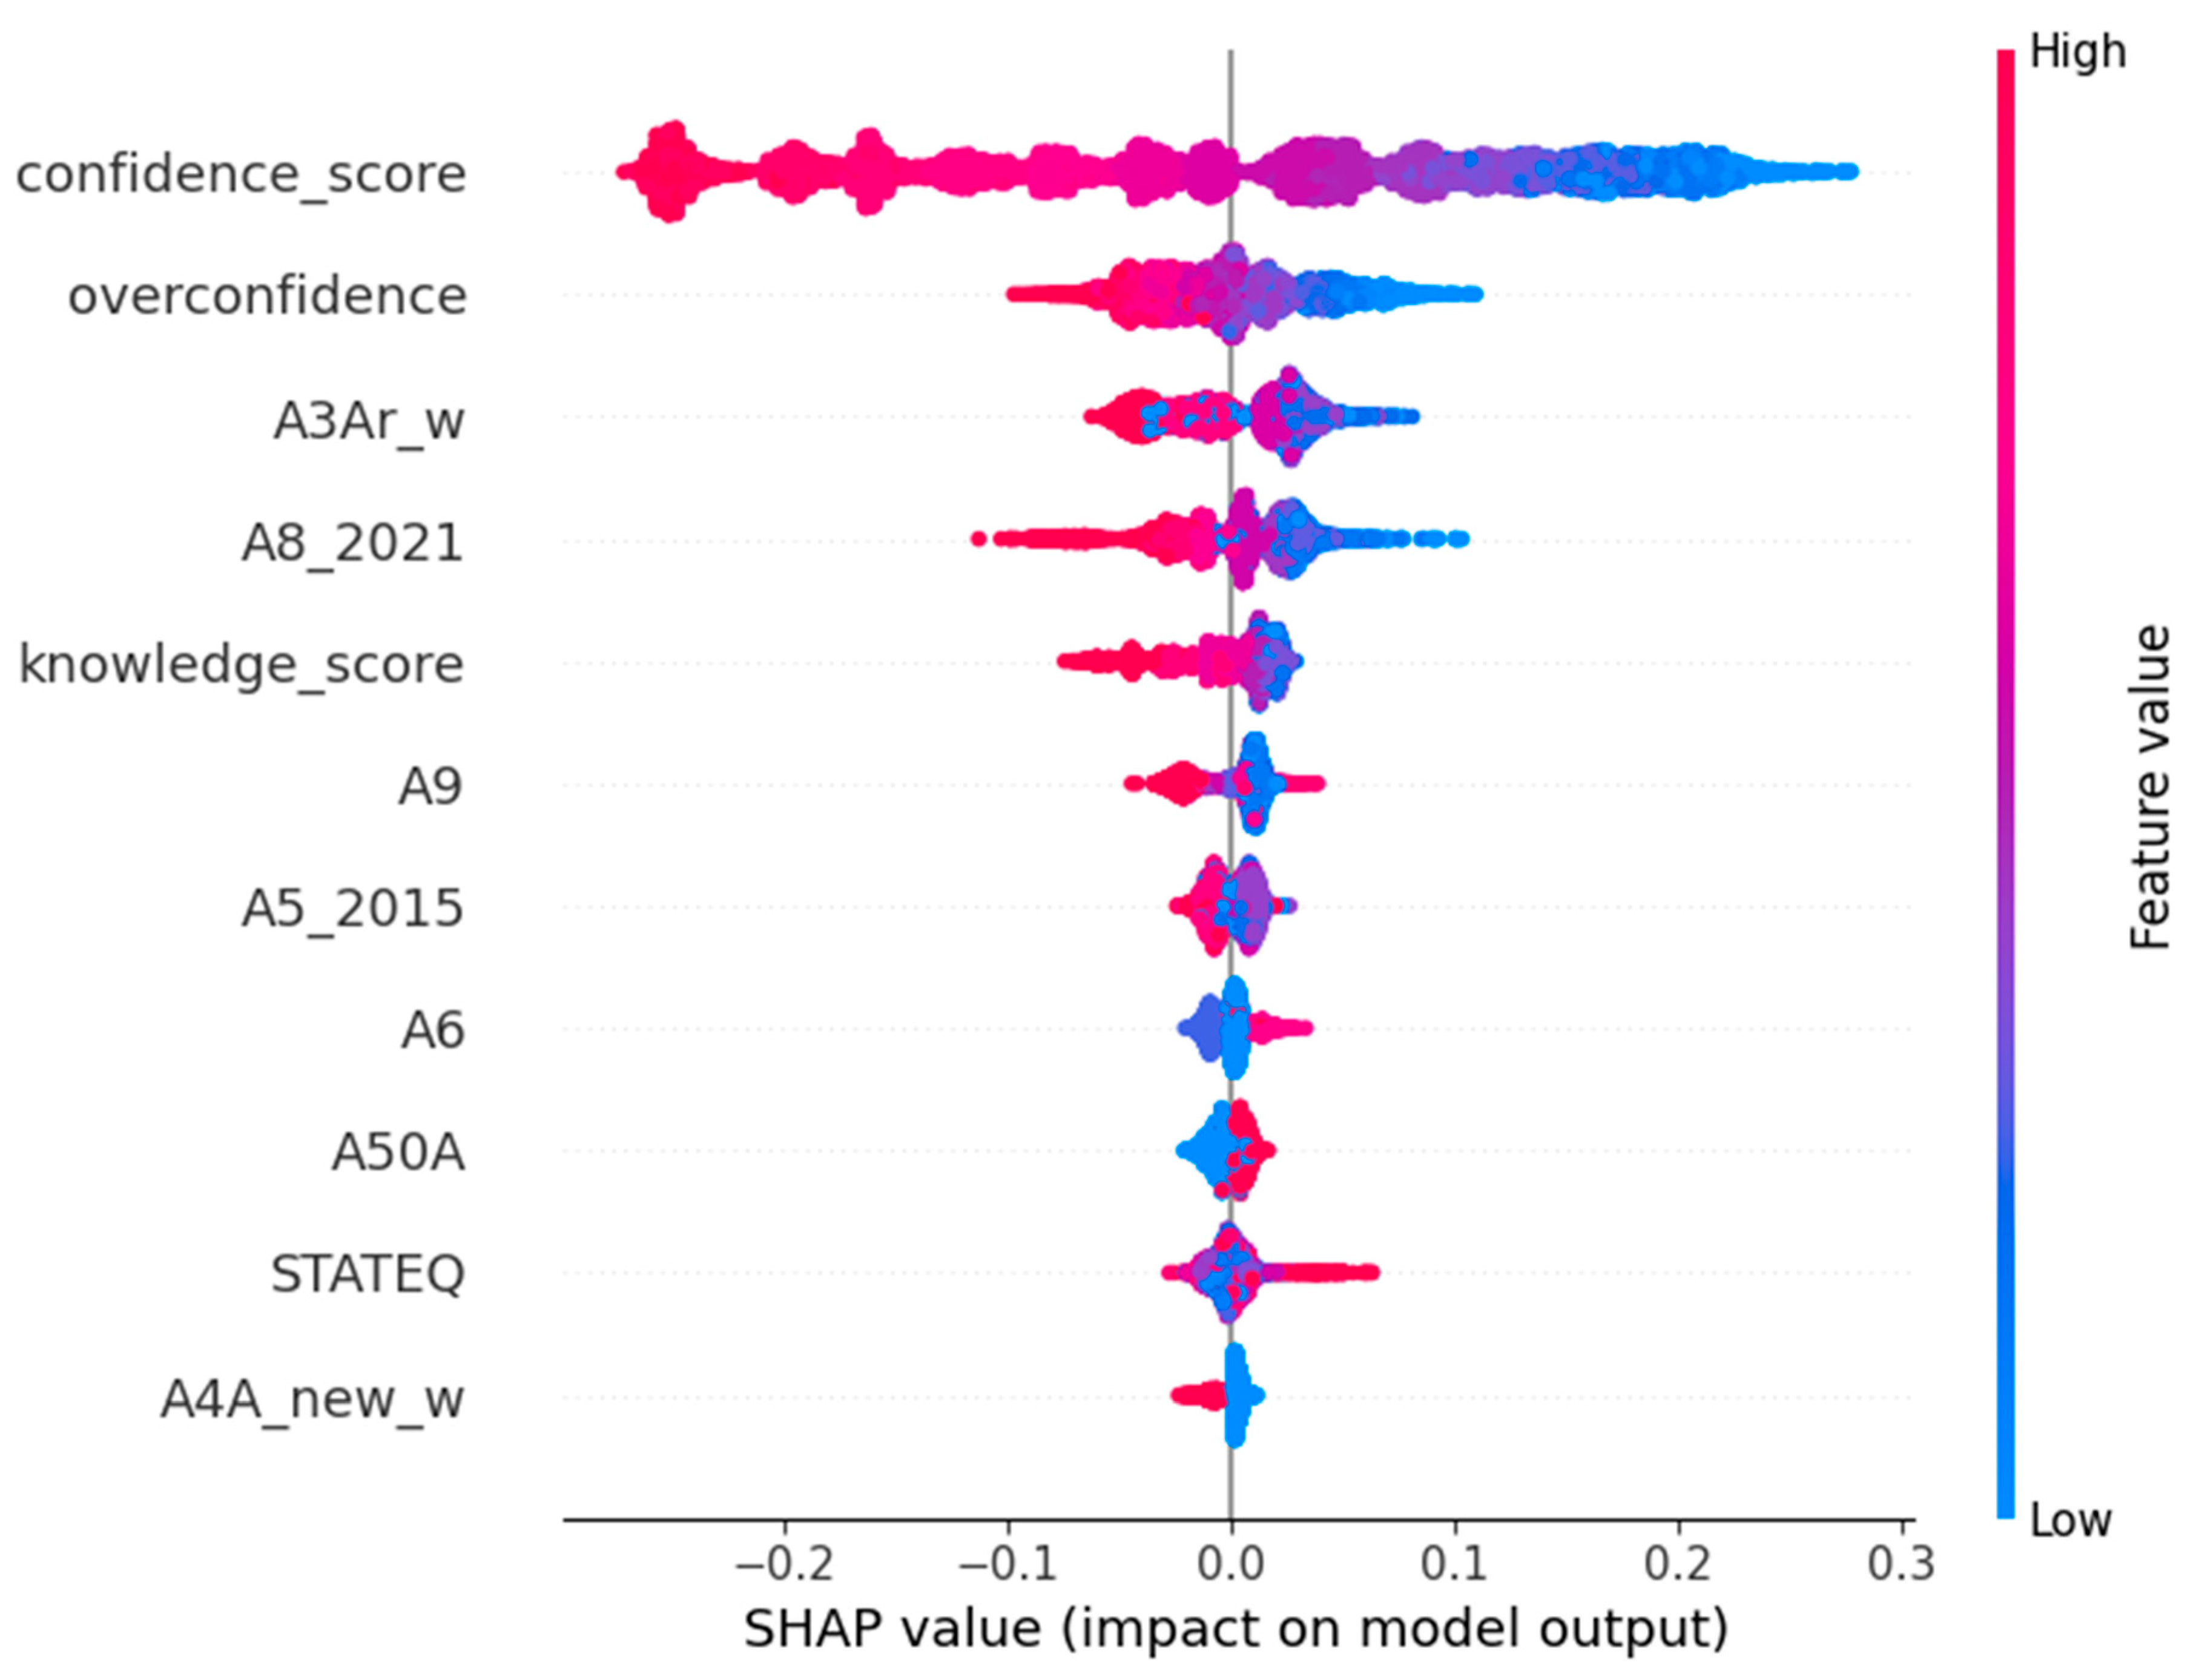
Figure 8.
Validation & test consistency of mean absolute SHAP values. Note. Each point represents one predictor’s average SHAP importance in the validation and test datasets. The high Spearman correlation (ρ = 0.991) shows that feature rankings remained almost identical across datasets, confirming the model’s robustness and reproducibility.
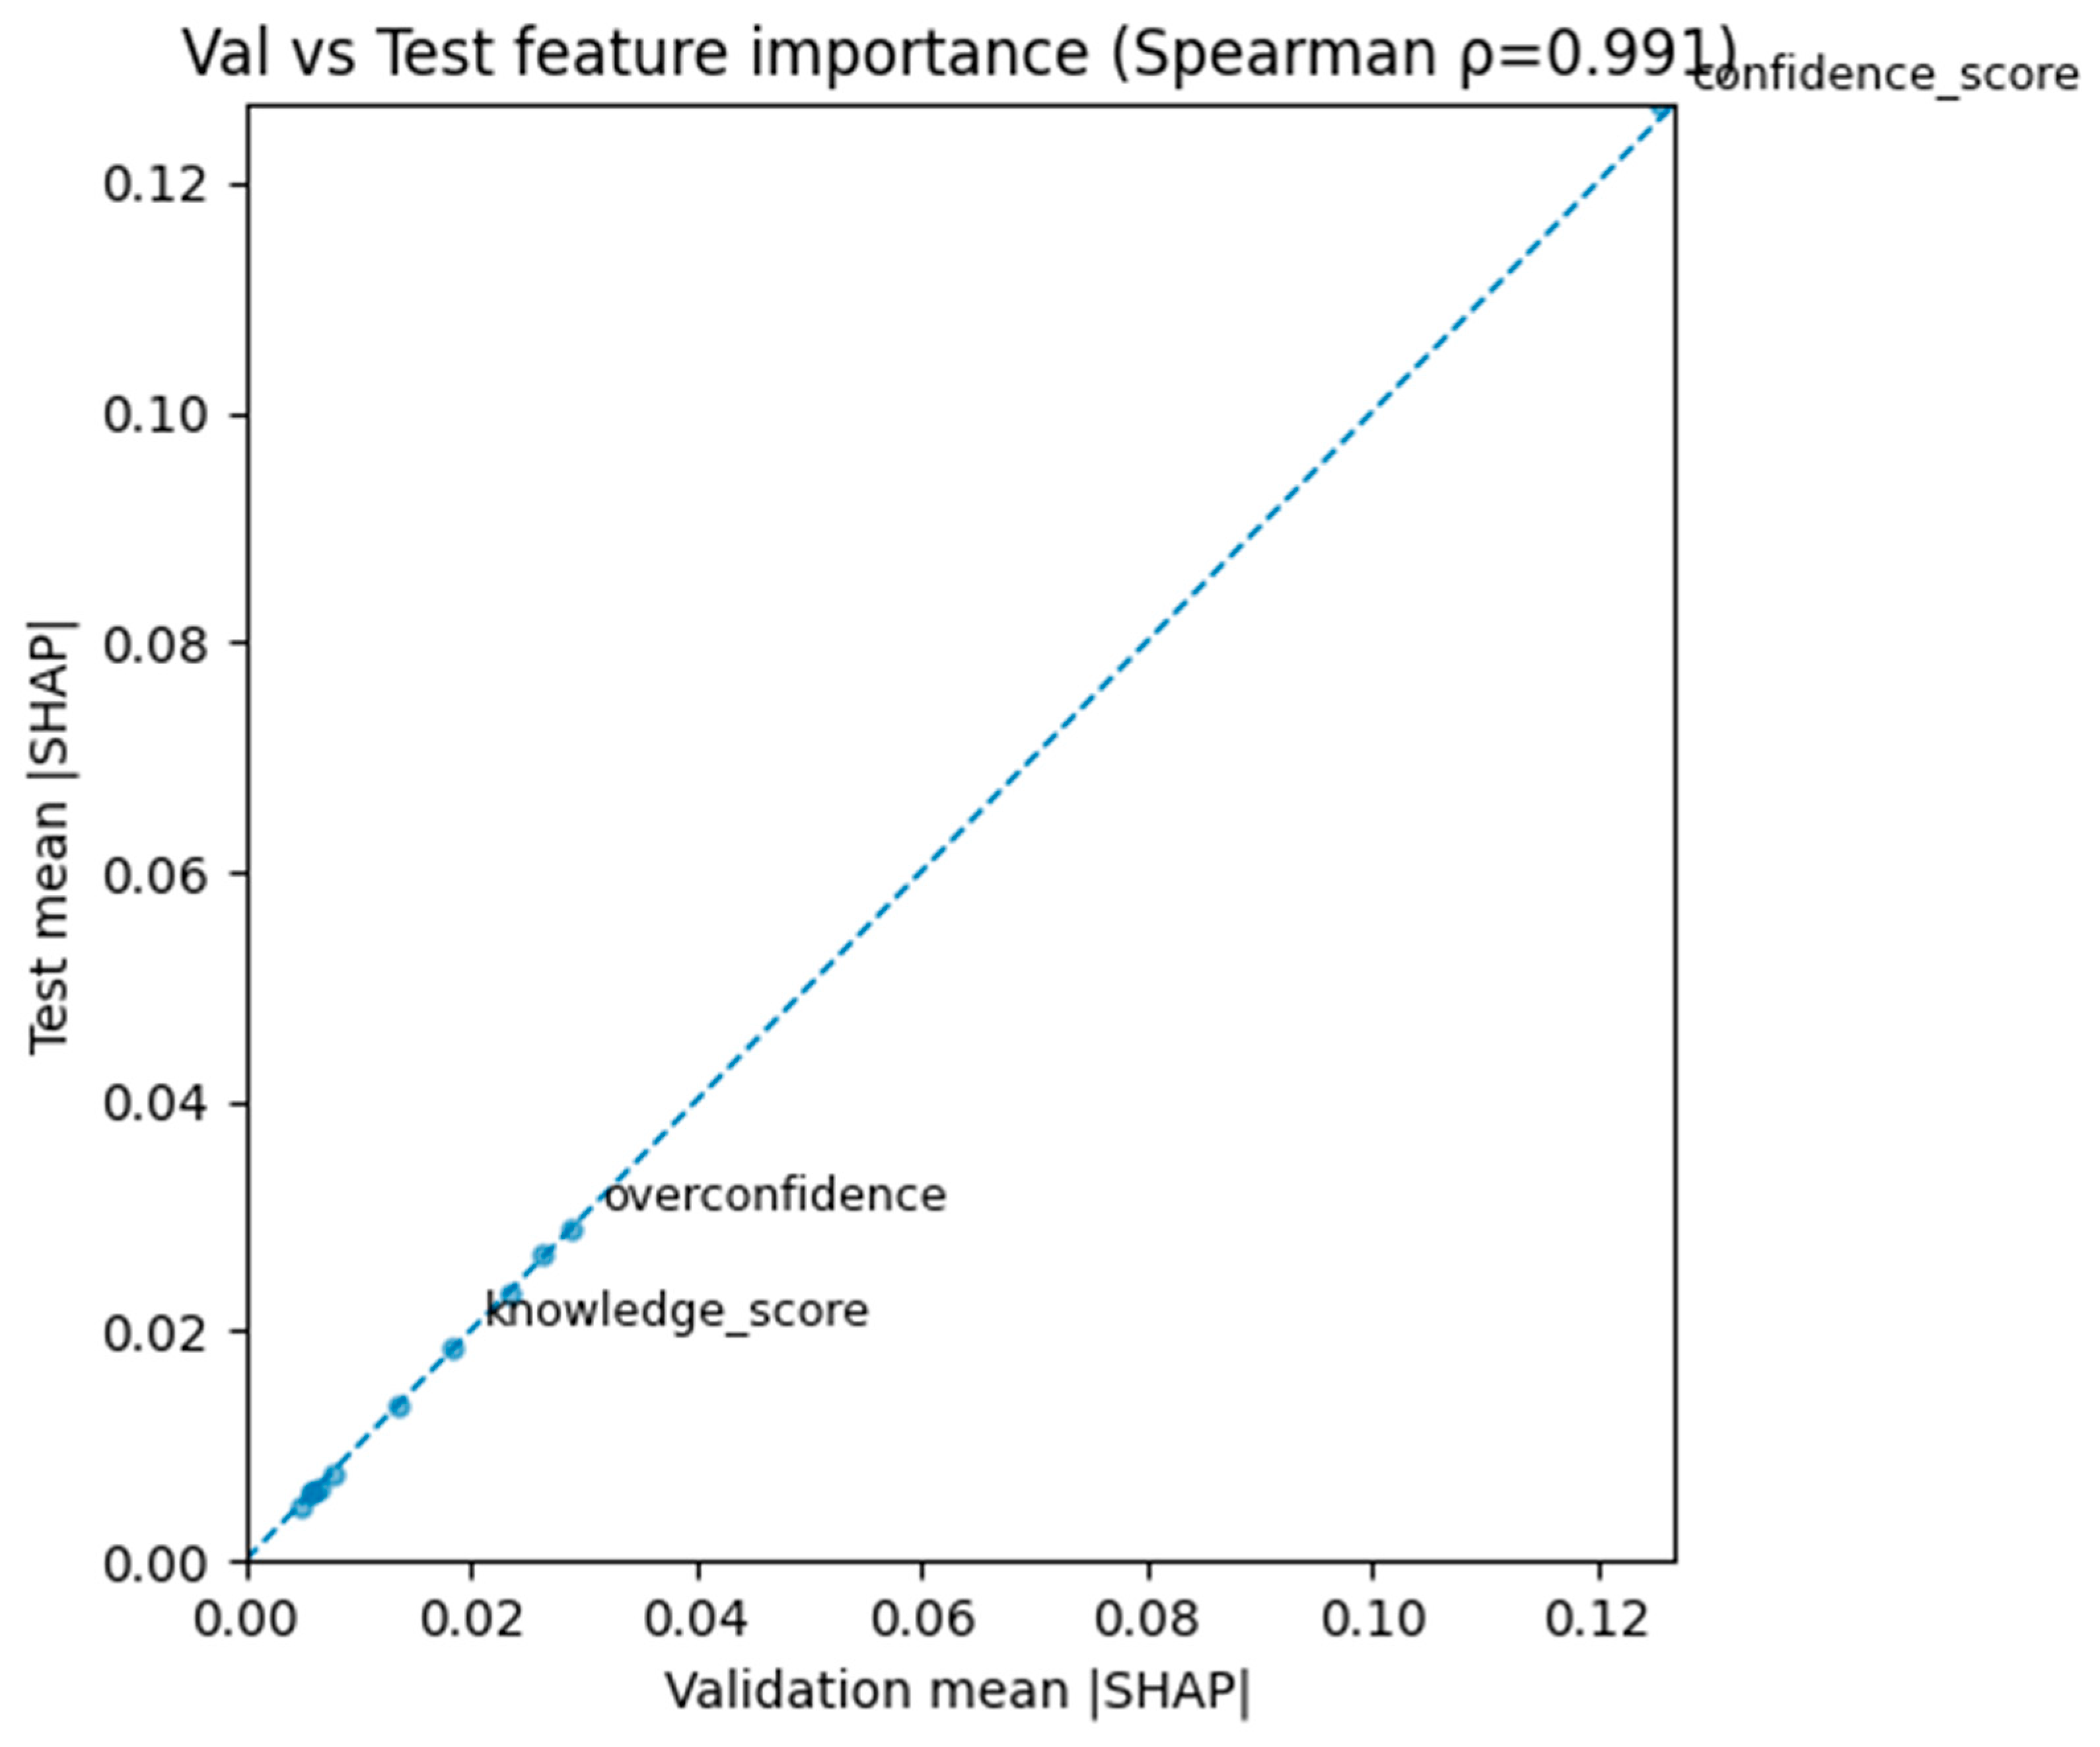
Figure 9.
SHAP dependence plot showing the effect of overconfidence on predicted financial vulnerability (Test set). Note. Each point represents one observation. Colors indicate financial knowledge level (darker = lower knowledge, lighter = higher knowledge). The plot shows a clear downward trend. As overconfidence increases, predicted financial vulnerability decreases. The effect is strongest when knowledge scores are low, suggesting that people who are confident but less knowledgeable tend to be perceived by the model as less financially vulnerable.
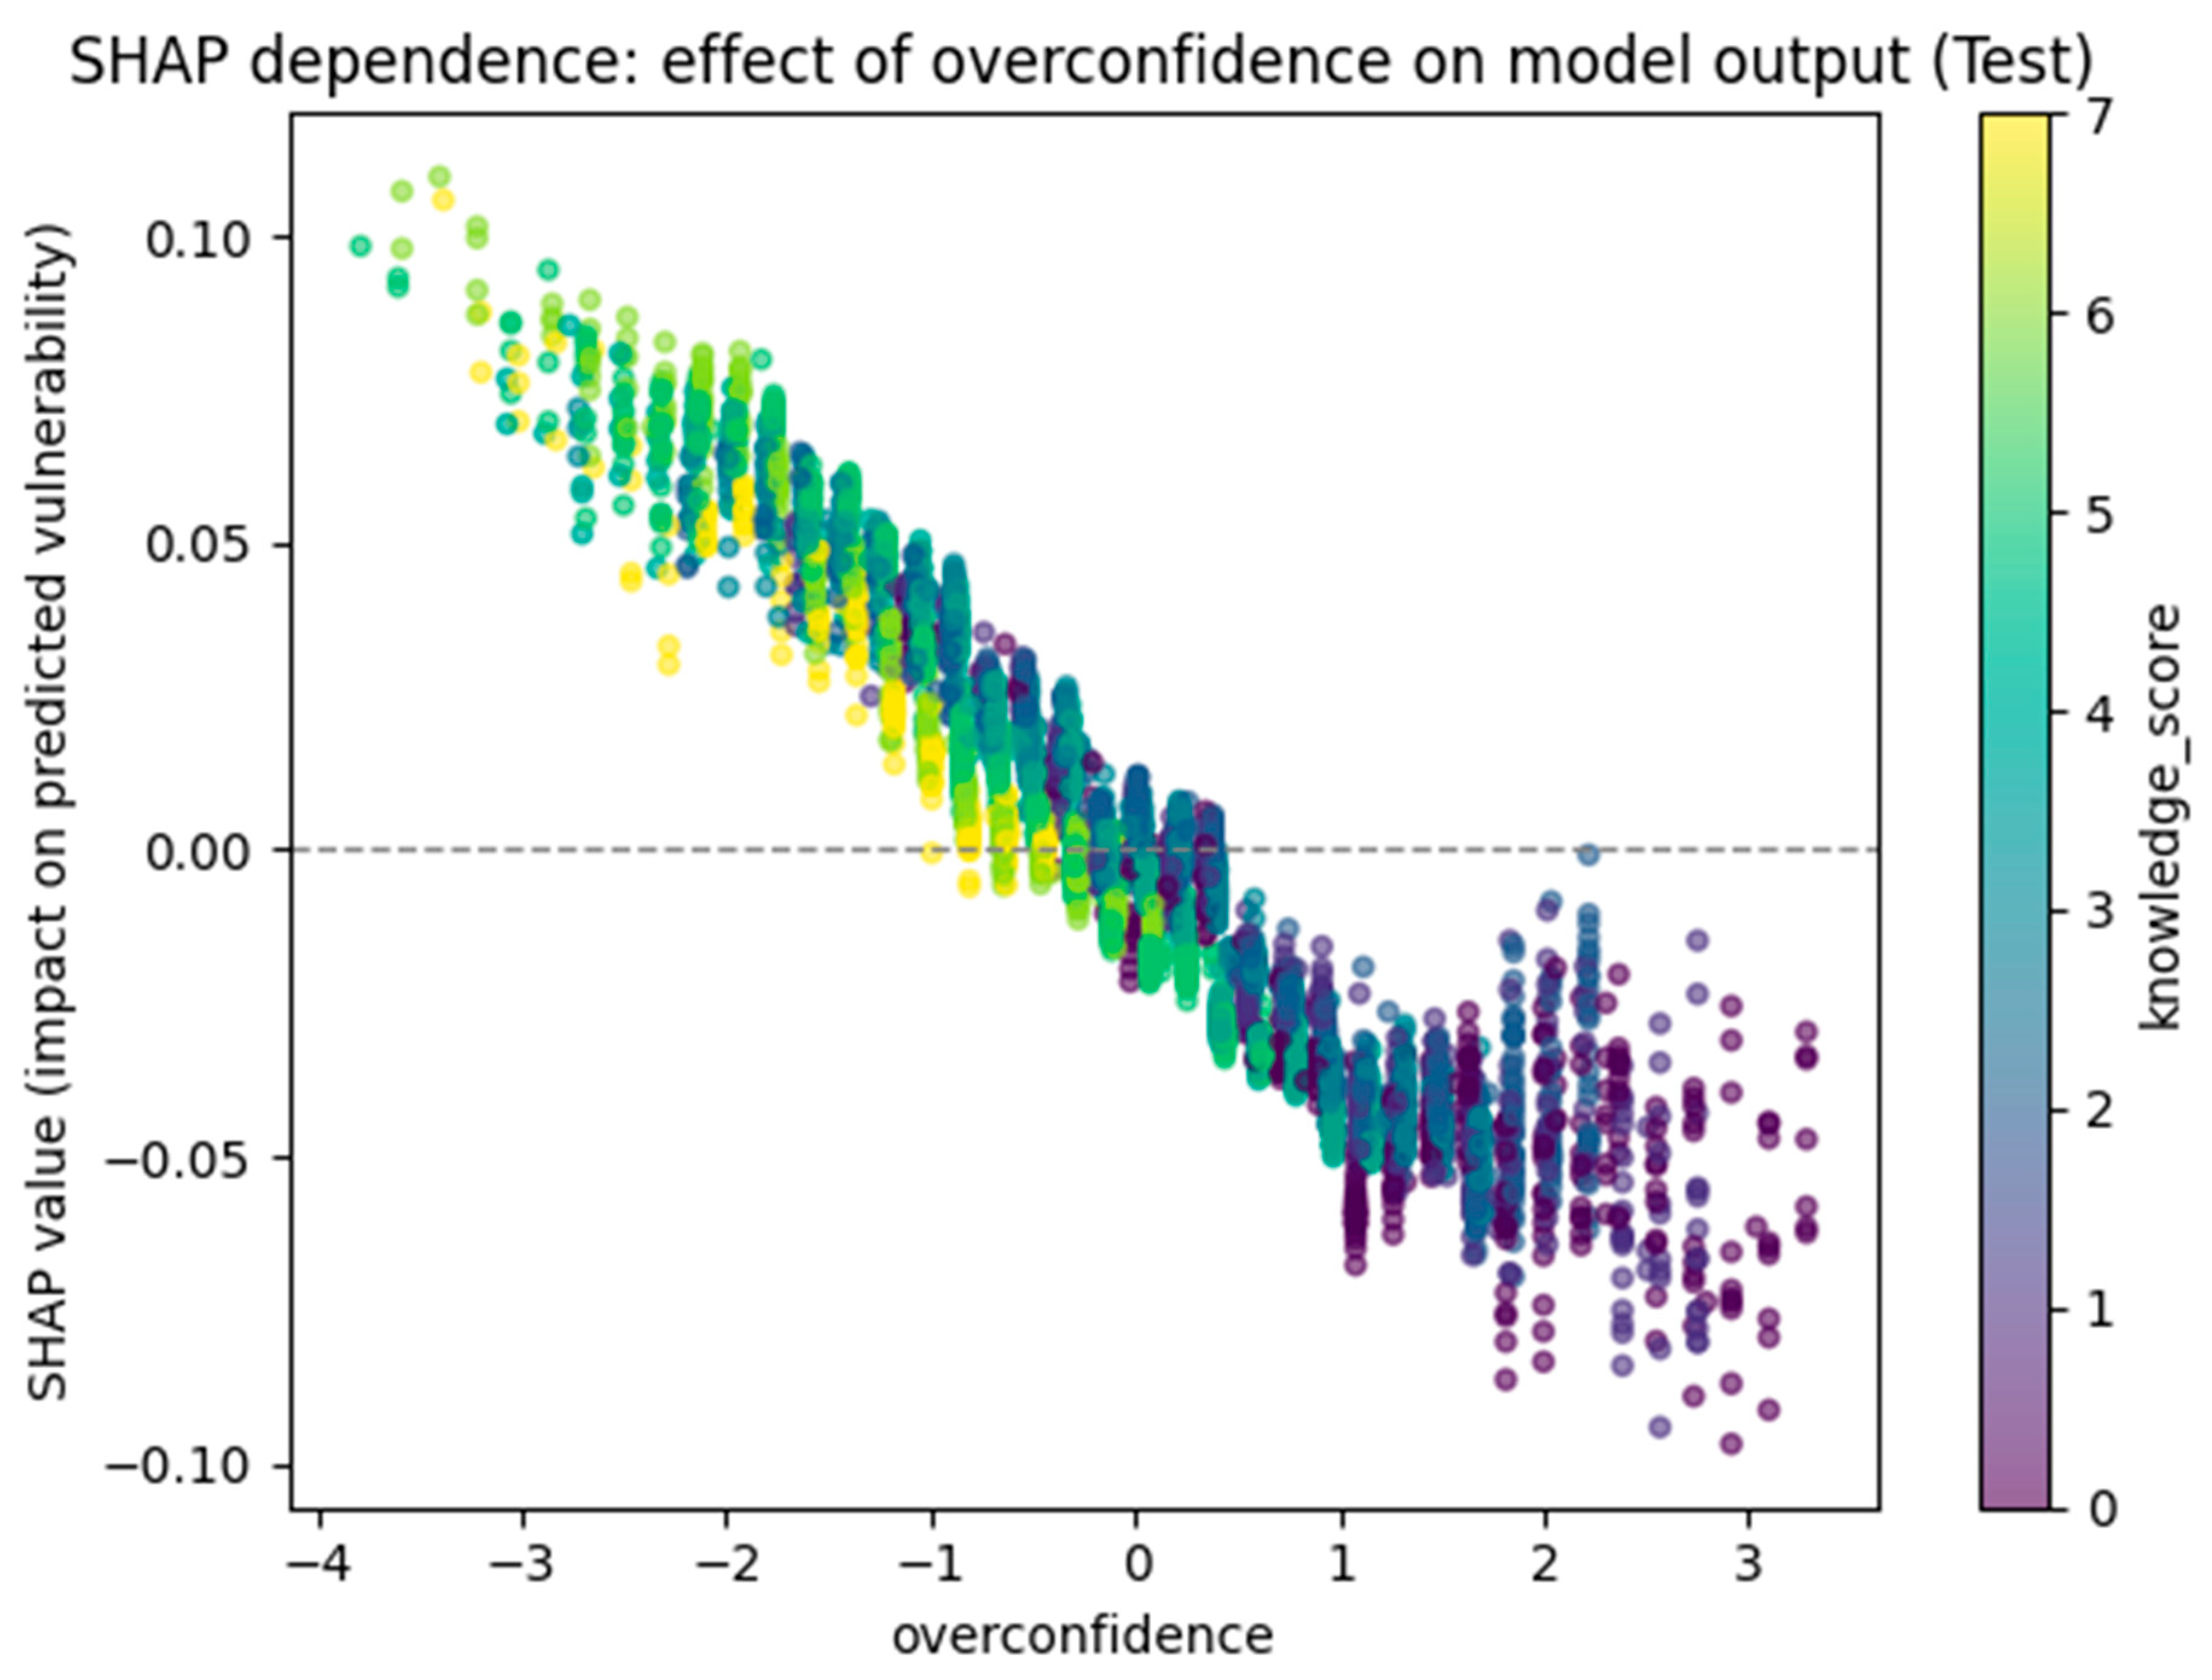
Figure 10.
Overconfidence quartiles and corresponding actual versus predicted financial vulnerability (Test set). Note. The figure shows average financial vulnerability for each quartile of overconfidence. Q1 represents the least confident individuals. Q4 represents the most overconfident ones. Both actual and predicted means show the same downward pattern, meaning that individuals with higher overconfidence level tend to have lower financial vulnerability, which is consistent with model predictions.
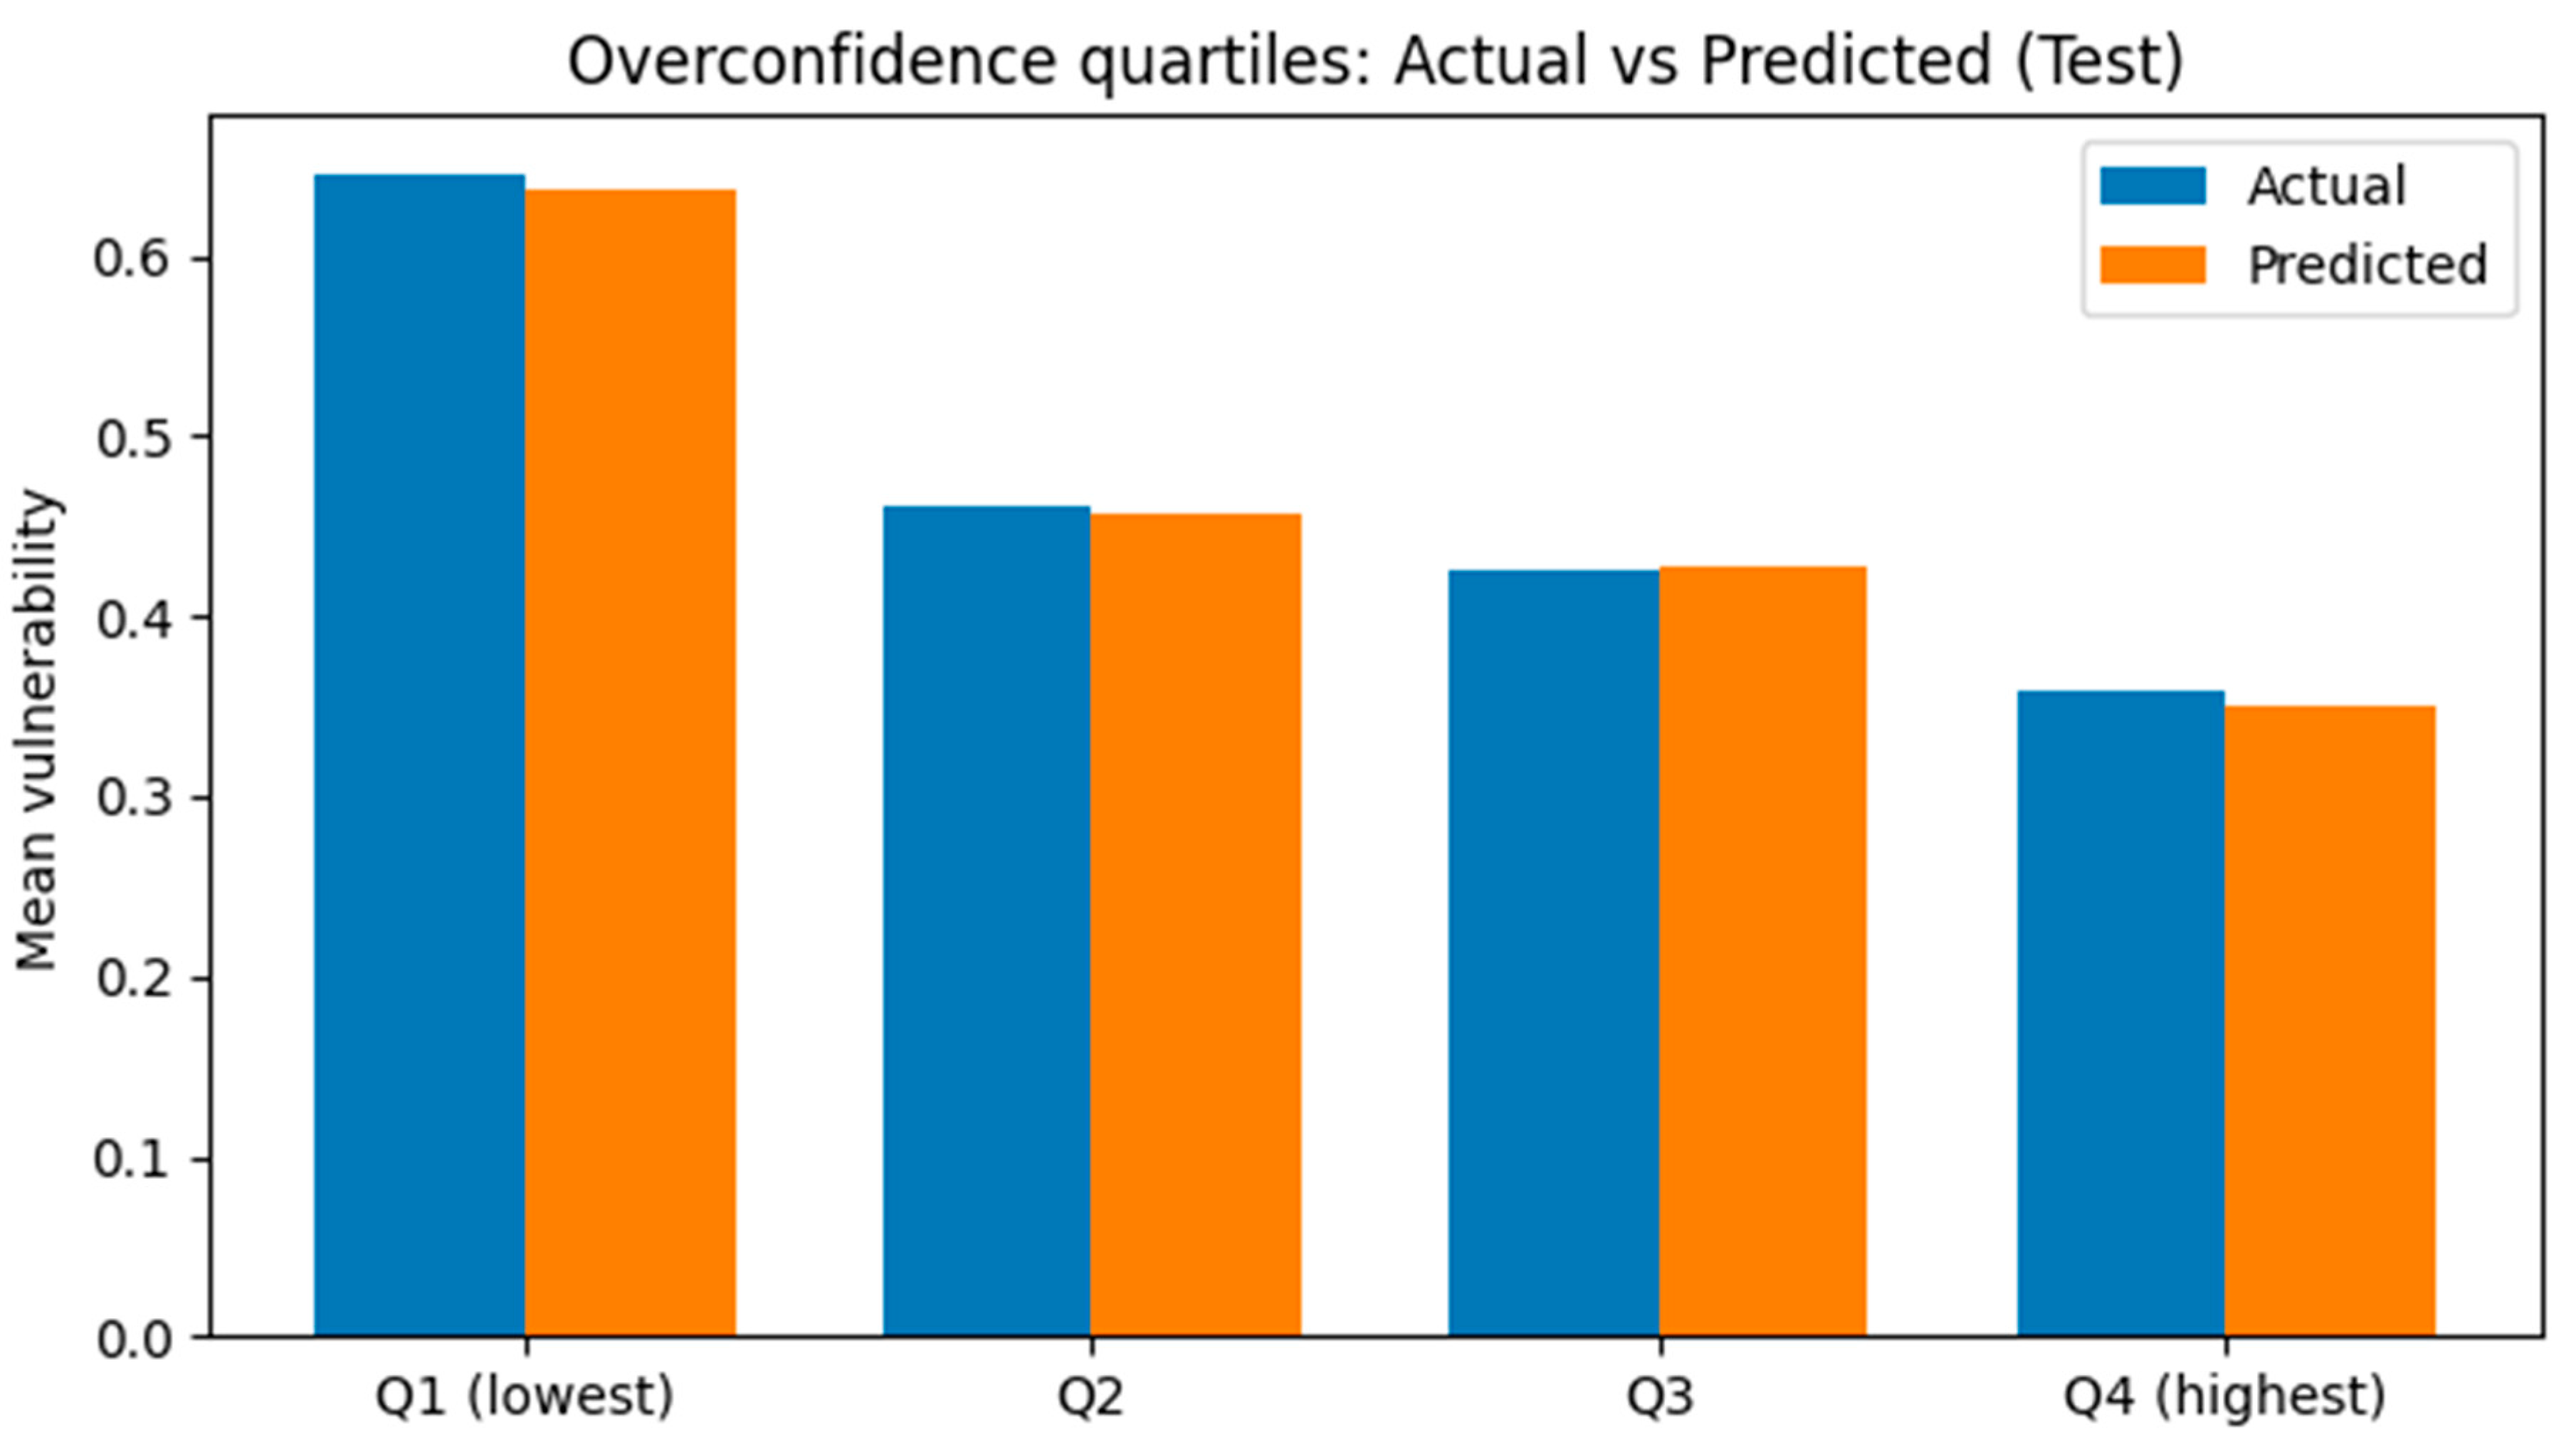
Figure 11.
Average SHAP contribution of overconfidence by quartile (Test set).Note. The plot shows how the mean SHAP value of overconfidence changes across quartiles, from Q1 (lowest confidence) to Q4 (highest overconfidence). Positive SHAP values indicate higher predicted vulnerability. The pattern tells that respondents in the lowest quartile of confidence had the strongest positive SHAP effects (higher predicted vulnerability), while highest overconfidence quartile showed negative SHAP values, which is lower predicted vulnerability.
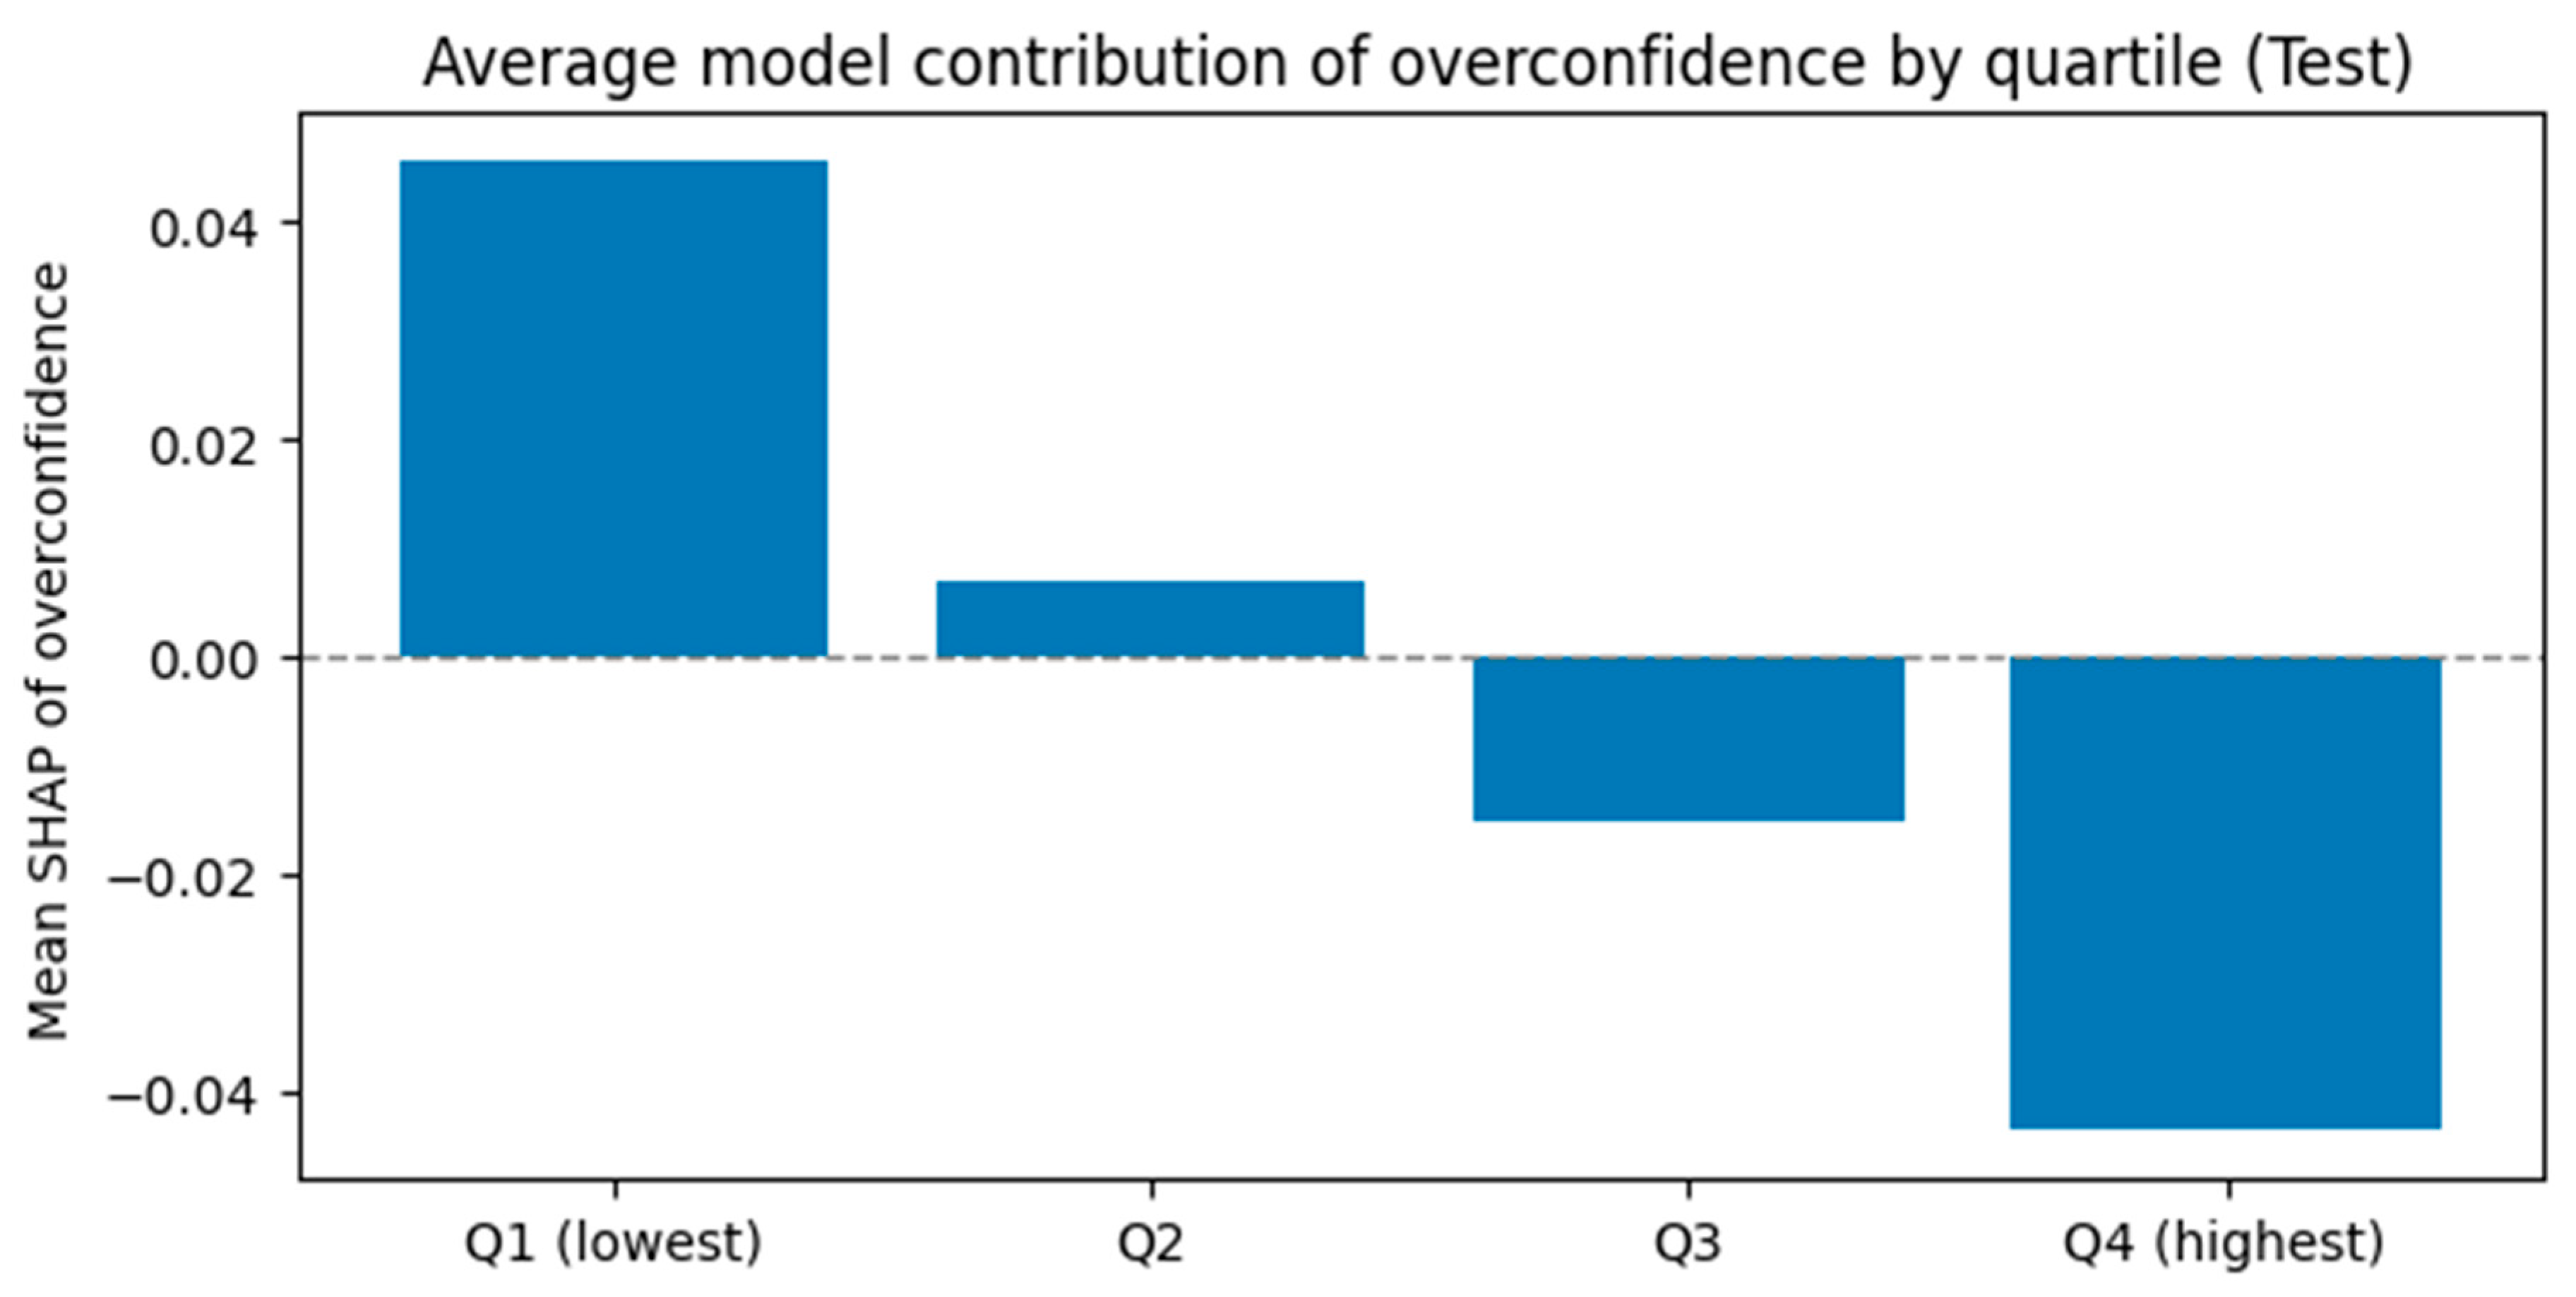
Figure 12.
Interaction between overconfidence and financial knowledge on predicted vulnerability (Test set). Note. The heatmap displays the average SHAP value of overconfidence across quartiles of overconfidence (in vertical axis) and knowledge score (in horizontal axis). Darker colors represent stronger negative SHAP contributions (lower predicted vulnerability). The pattern shows that overconfidence reduces predicted vulnerability to the highest extension when financial knowledge is low, meaning that individuals who are confident but less knowledgeable are viewed by the model as less financially vulnerable.
Disclaimer/Publisher’s Note: The statements, opinions and data contained in all publications are solely those of the individual author(s) and contributor(s) and not of MDPI and/or the editor(s). MDPI and/or the editor(s) disclaim responsibility for any injury to people or property resulting from any ideas, methods, instructions or products referred to in the content. |
© 2025 by the author. Licensee MDPI, Basel, Switzerland. This article is an open access article distributed under the terms and conditions of the Creative Commons Attribution (CC BY) license (https://creativecommons.org/licenses/by/4.0/).
Copyright: This open access article is published under a Creative Commons CC BY 4.0 license, which permit the free download, distribution, and reuse, provided that the author and preprint are cited in any reuse.


