
Submitted:
02 June 2025
Posted:
04 June 2025
You are already at the latest version
Abstract
This study examines the financial literacy and prudence of college students of differing majors at Suffolk University and Emerson College, two higher education institutions in Downtown Boston with similar locations and population sizes but different academic focuses. Specifically, this study aims to determine the disparity in financial literacy and prudence between business and non-business majors using a quantitative analysis of a knowledge-based test on financial literacy and a personal assessment of financial prudence replicated from Cude et al. (2006) to answer the question: To what extent are business-related college students in the Downtown Boston area more financially literate and prudent than their non-business majoring counterparts? The tests were handed out in person via a QR code to an online survey on the campuses of these colleges in February 2025. The scores highlighted the importance of financial education near adulthood, the financial abilities that college students currently possess, and the disparities between the financial literacy and prudence of business and non-business majors. The results saw a substantial difference in financial literacy between business and non-business majors, improvements in overall financial literacy since the National Jump$tart Coalition’s Survey of High School Seniors and College Students in 2008, and variations in financial prudence compared with the large southern public universities analyzed by Cude et al. (2006), further agreeing with the point that business majors are more financially literate than non-business majors by a large margin. Further investigations should explore the financial literacy and prudence of college students all around the United States to see if certain regions’ college students are more financially literate or prudent than others and to provide that information for students looking to enroll in certain colleges around the country.
Keywords:
finance
; financial literacy
; financial prudence
; college students
Introduction
When students transition from high school to higher education, they encounter financial responsibilities that likely haven’t been present before, such as bills, various taxes, student loan repayment, and more. Katherine Sauer, a PhD graduate from the University of Colorado, says that many students ranging from 18-24 years of age only see themselves entering the “real world” after graduation because they relied on their parents to continue managing their finances or providing financial help (Sauer et al., 2017). Regardless of whether higher education introduces financial responsibilities for students, they will have to endure the universal challenges of managing finances such as bills, rent, groceries, and more in their adulthood, which all traces back to a student’s understanding of financial literacy. Hung and colleagues (2009) define financial literacy as using “knowledge and skills to manage financial resources effectively for a lifetime of financial well-being.” When an individual is financially literate, they learn to depict their financial decisions more responsibly and allocate more focus to the future, also known as financial prudence. To be considered prudent in the financial scene, one must exhibit positive financial behavior, which typically consists of saving money for retirement, emergencies, future children, and more. These actions of low risk build cash over time. Financial literacy is also known to be “strongly associated” with planning, showing “statistically significant results at conventional levels,” which also shows the relationship between financial prudence and financial literacy (Lusardi & Mitchell, 2008).
In the Downtown Boston area, there are many higher education institutions, each with different cultures, academic strengths, and student backgrounds, which were all considered during the evaluation process of initial research. In this paper, the financial literacy and prudence of college students at Suffolk University and Emerson College were assessed based on responses to five fact-based questions and five personal assessment questions in a survey compiled from both the five most general financial literacy questions and five questions from a study conducted by Cude et al. (2006) that this paper replicates. These two institutions were selected because they are within walking distance from each other and are similarly sized in terms of the student population. Still, they vary drastically in academic focus since Suffolk University is considered a university that offers a wide range of educational pathways. At the same time, Emerson College is nationally recognized as a liberal arts college with a strong focus on communications and the arts (“Majors & Programs”, n.d). Both of these institutions have a business major, which allows for a comparison between business and non-business majors’ financial literacy rates.
This paper contains a replication of Cude et al. (2006), who assessed the financial management practices of college students at large state universities—Louisiana State University and the University of Georgia—and found that while most students could pay rent and credit card bills on time, a majority of students do not follow a weekly/monthly budget or save money each month. Since Cude et al. (2006) do not distinguish any external factors that would allow these students to handle these responsibilities more easily, such as family income, another gap is introduced to the field of interest. This study intended to compare the results of college students in smaller institutions to those who attend larger institutions, identify if a student’s major affects and/or correlates with financial literacy, and determine if the nearly 20-year gap between this study and the aforementioned study results in any differences.
Literature Review
The Jump$tart National Coalition Survey of High School and College Students began in 1997 and was conducted biennially from 2000 to 2008 by following “Jump$tart Financial Foundations for Educators” (J$FFE) trained and untrained teachers and surveying the students in their classroom in the Washington D.C. metropolitan area. This survey assessed the financial literacy rates of high school seniors and college students on a 31-question exam, in which the average score for college students was 62.2%, where a passing score would be 60% or higher (Jump$tart Coalition, 2008). While this mark is much higher than the 48.3% reported for high school seniors in the same year, it highlights that college students who have been in the higher education system for over three years are still barely passing basic financial literacy assessments. These results exacerbate the issues with low financial literacy rates in our college populations, as scores should be much higher in a world where such a large portion of adulthood relies on financial literacy.
Bianco & Bosco (2012) ran a similar study to both the Jump$tart National Coalition Survey and Cude et al. (2006) with slightly different questions, but the results in this study are much more staggering. Bianco & Bosco (2012) reported only a 45.4% mean score for a group of all grades of undergraduate college students, even with a sample compiled of 35.2% business majors. After running the survey results through an analysis of variance, it was found that business majors had the highest mean scores of the group, but only boasting a surprising 46% average score. The lowest-scoring major in the group was liberal arts, representing the majority of the survey at 35.8% of the participants, scoring an average of 41% on the financial literacy questions. These marks raised concerns as to the extent of the financial literacy of all college students, but most surprisingly, the lack of disparity between business majors and non-business majors, as business majors should have more knowledge based on the business classes they take in college that most non-business majors don’t.
Chen & Volpe (1998) describe the foundational work in this field, serving as the first version of surveys for college students to assess financial literacy. They argue that students will not gain knowledge in financial literacy by simply “spending more time in college learning other unrelated subjects,” but rather “through a business course, seminars, or their own mistakes” (Chen & Volpe, 1998). This means that financial illiteracy is not caused by the lack of adequate educational resources but by the lack of students taking these courses. Therefore, Suffolk University and Emerson College, which are not large-scale business schools but still offer business majors and classes and are about a 12-minute walk away from each other, arose as the perfect match for this study.
Location
Downtown Boston is a significant area of interest because although Massachusetts remains the #1 state in the United States for quality of higher education and #3 in cost of living, it ranks #25 in the nation for financial literacy according to WalletHub, a personal finance endorsement company, managing editor John S. Kiernan and the World Population Review (Kiernan, 2024; World Population Review, 2024). This difference should be accounted for if the correlation between quality of education and financial literacy exists, but because of this substantial difference that is not mentioned in the scholarly works that exist in the financial literacy field, questions arose as to what is correlated.
There is a gap regarding the disparity between the financial literacy rates of college students focused on business and college students focused on any other field of study. These non-business students are still interested in learning about financial literacy. As seen in Hagadorn & Lahousse (2019), students at a liberal arts college were surveyed to assess their interest in learning more about financial literacy, where 64.14% of respondents said they were interested in learning about managing their money, 60.61% were interested in investing, and 60.10% were interested in budgeting. Since these groups have similar interests but different results, the question arises: To what extent are business-related college students in the Downtown Boston area more financially literate and prudent than their non-business majoring counterparts?
Method
This study replicates the work of Cude et al. (2006), in which they conducted an online questionnaire with a college population and then analyzed mean scores to assess the financial management practices of their respondents. This paper employed the same method and five of the same questions to evaluate financial prudence, while five additional questions in the same questionnaire measured financial literacy. The study took place at Suffolk University and Emerson College. In February 2025, an online survey was distributed in person to students on both campuses, who scanned a QR code to access the survey hosted on Google Forms. To address ethical considerations, respondents were first asked for consent to have their answers recorded for this analysis. The survey was designed to collect data anonymously, with no identifying information collected. I circled both campuses for about two hours each, asking students if they were enrolled at either university and inviting them to complete the survey if they were.
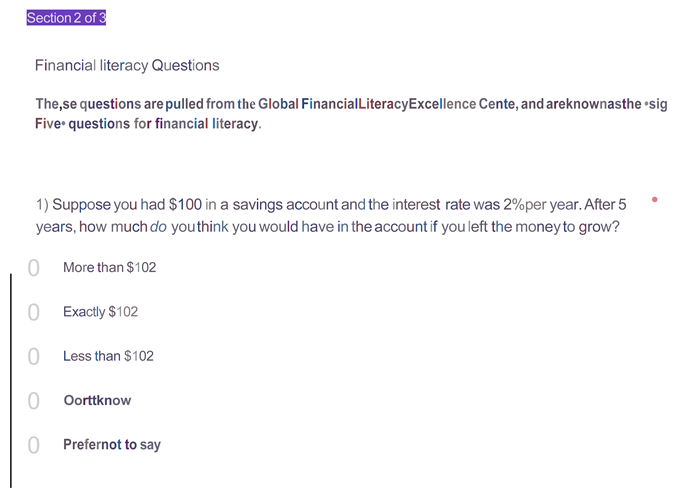
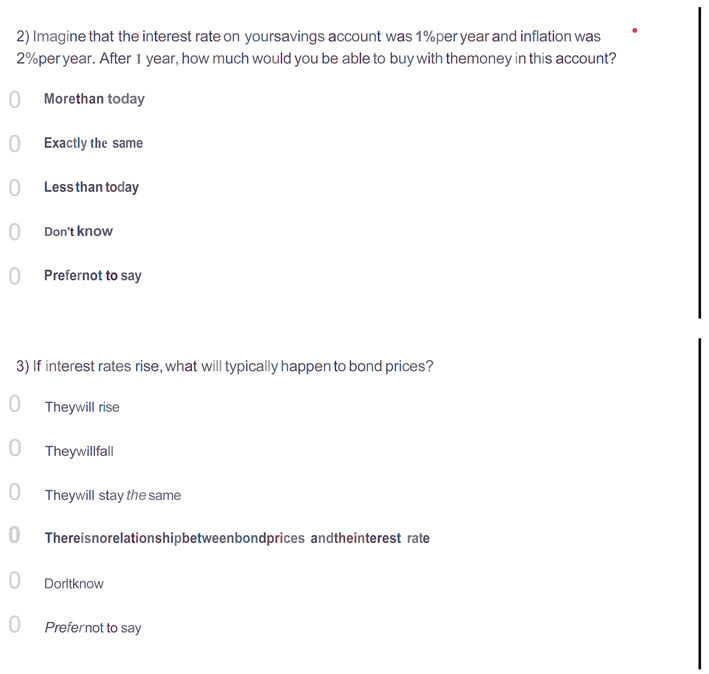
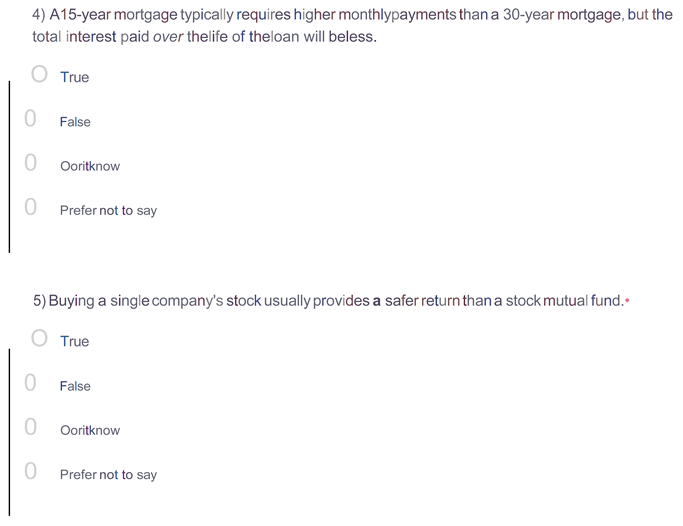
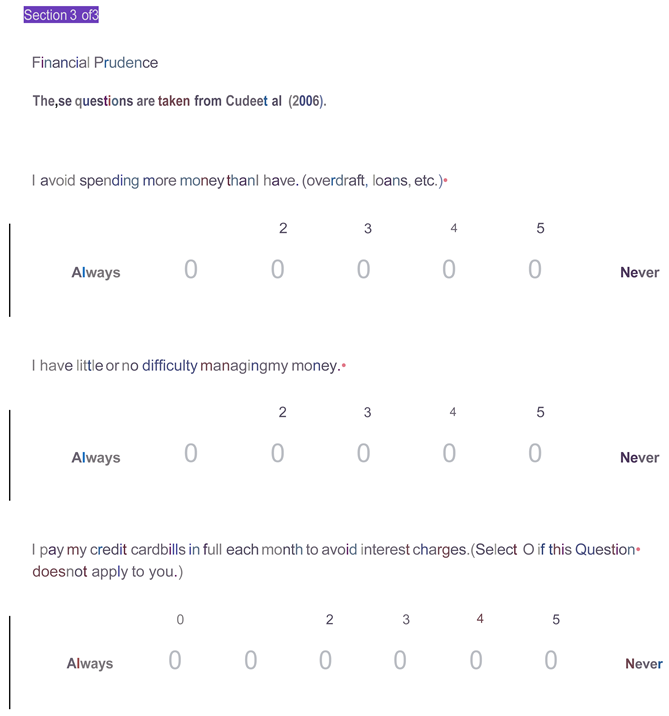
One of the better ways to assess financial literacy is with a performance test that assesses knowledge (Hung et al., 2009). A knowledge-based test displays the strengths and weaknesses of students in the financial world, as financial literacy can proficiently be proven with questions that have right or wrong answers. If respondents answer a question incorrectly, it signals that they do not understand the concept at hand. Therefore, students were asked to answer five knowledge-based questions to assess their financial literacy, five tendency questions to assess their financial prudence, and six prerequisite questions (see Appendix). The financial literacy questions come from two professors at the Wharton School of the University of Pennsylvania, Annamaria Lusardi and Olivia S. Mitchell, and they are commonly known as the “Big Five” financial literacy questions. The five prudence questions come from Cude et al. (2006), which are self-assessment questions used to gauge how much students are valuing their savings/planning for their adulthood with their money. These questions require respondents to rate themselves at a skill on how often they practice it, an example being “I avoid spending more money than I have” on a 5-point Likert scale, with 1 symbolizing always and 5 symbolizing never. Finally, the prerequisite questions were used to create subgroups to determine what factors correlate with varying levels of financial literacy and prudence.
Additionally, tuition prices have been rapidly increasing over the past few decades, as seen in the figure below.
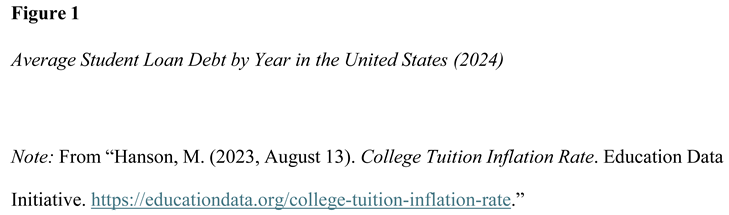
This leaves students with a larger financial burden that lingers for both the years in college and postgraduate (Hanson, 2023). Most college students typically perceive student loans as a “notion of upward mobility,” meaning loans are a necessary sacrifice needed to land higher- paying jobs, which effectively changes their ideas of job prospects after graduation and money decisions while in college (Carales & Molina, 2023). Since the family incomes of college students are an essential component of predicting financial literacy rates of college students because of their exposure to money, this study asks a prerequisite question regarding financial aid to subtly determine the background of each student’s response without using identifying information (Cude et al., 2006). With Suffolk University hovering around $70,000 before financial aid and Emerson College around $80,000 before aid, most students in this study will ideally know their financial responsibilities regarding student loan repayment.
The financial literacy rate of all adults in the United States is 57% (Klapper et al., 2015).
Compared to other countries with highly developed economies, such as the United Kingdom (67%), Canada (68%), and Germany (66%), the United States finds its financial literacy rates lagging. The data gathered from the survey was compared to this mark, as a university should be where many young Americans learn their financial literacy skills before entering the workforce. If the financial literacy rates of university students are substantially lower than the national average, that would indicate the cause of how financial literacy begins to be lower than in other countries. Additionally, the results from this survey were compared with scores from a similar population from Bianco & Bosco (2012), a 2014 study titled “The financial literacy of non- business university students in South Africa” done by Olawale Fatoki on the financial literacy of non-business students, and the latest iteration of the Jump$tart National Coalition Survey of High School and College Students to see the disparity between their knowledge and prior knowledge from different demographics.
Results
Demographic Results
51 responses were gathered from students attending Suffolk University, and 36 were gathered from students attending Emerson College. The sample consisted only of undergraduate students in each school, with the largest proportion being freshmen (28.7%) and the lowest being sophomores (23%). The study had about a 35.6% reported male population, while 64.4% of respondents identified themselves as females, which is consistent with Suffolk University’s reported gender distribution being 67.9% female to 32.1% male for freshmen and 61.8% female to 38.2% male for continuing students. Emerson College’s reported population of 68.9% female to 31.1% male for freshmen and 66.4% female to 33.6% male for returning students (Forward Pathway, 2021a; 2021b). The pool of respondents contains 40.2% arts/humanities majors, 26.4% business majors, 16.1% public/social services majors, 11.5% social sciences majors, and 5.7% STEM majors. Additionally, 87.4% of students in this survey reported that they were receiving some sort of financial aid, and 60.9% of students reported that they hadn’t taken a business course in college before. Financial aid is important to track because family income is sensitive information to collect, and institutional financial aid is typically given to students with lower family incomes.

Table 1.
Demographic Characteristics from the Sample (n=87).
| Demographic Characteristics |
n |
% |
| College | ||
| Suffolk University | 51 | 58.60% |
| Emerson College | 36 | 41.40% |
| Year in College | ||
| Freshman | 25 | 28.70% |
| Sophomore | 20 | 23% |
| Junior | 21 | 24.10% |
| Senior | 21 | 24.10% |
| Gender | ||
| Male | 31 | 35.60% |
| Female | 56 | 64.40% |
| Field of Study/Major | ||
| Arts/Humanities | 35 | 40.20% |
| Business | 23 | 26.40% |
| Public & Social Services |
14 |
16.10% |
| STEM | 5 | 5.70% |
| Social Sciences | 10 | 11.50% |
| Financial Aid | ||
| Yes | 76 | 87.40% |
| No | 11 | 12.60% |
| Taken a Business Course?* | ||
| Yes | 30 | 34.50% |
| Plan to in the future | 16 | 18.40% |
| No | 53 | 60.90% |
| Currently in a Business class |
17 |
19.50% |
*: Percentages may not add up to 100% because respondents could choose multiple answers.
Table 2.
Answers to Financial Literacy Questions (n=87).
|
Question |
n correct |
% corre ct |
% correct (Busine ss) |
% correct (Non- Busine ss) |
| 1) Suppose you had $100 in a savings account and the interest rate was 2% per year. After 5 years, how much do you think you would have in the account if you left the money to grow? |
76 |
87.40 % |
100% |
82.81 % |
| 2) Imagine that the interest rate on your savings account was 1% per year and inflation was 2% per year. After 1 year, how much would you be able to buy with the money in this account? |
58 |
66.67 % |
100% |
54.69 % |
| 3) If interest rates rise, what will typically happen to bond prices? |
29 |
33.33 % |
65.22% |
20.31% |
| 4) A 15-year mortgage typically requires higher monthly payments than a 30- year mortgage, but the total interest paid over the life of the loan will be less. |
79 |
90.80 % |
95.65% |
92.19% |
| 5) Buying a single company’s stock usually provides a safer return than a stock mutual fund. |
48 |
55.20 % |
91.30% |
42.19% |
Overall Financial Literacy Results
Although the questions on this survey were not meant to be difficult, the question about interest rates impacting bond prices was the most confusing of the bunch, with only 29 correct answers in total. Overall, there was an average score of 3.33/5 (66.7%), a median score of 4/5 (80%), and a financial literacy rate (where 4+ correct answers depict being financially literate) of 51.7%.
This is lower than the average adult score (57%) in the United States but higher than the score for non-business students (47.01%) obtained by Olawale Fatoki’s study in 2014 (Klapper et al., 2015). In addition to this comparison, Chen and Volpe (1998) grouped the number of correct scores into three different categories: category 1 representing 80% correct and a high level of financial literacy, category 2 representing 60-79% correct and a medium level of financial literacy, and category 3 representing <60% correct and a low level of financial literacy. The reported score for the entire survey would, therefore, indicate a low level of financial literacy for the participants in this questionnaire.
Suffolk Financial Literacy Results
Of the financial literacy responses from Suffolk University, 51 students responded to the survey, and 18 (35.3%) of them were majoring in a business-related field. The other respondents consisted of four (7.8%) arts/humanities majors, 14 (27.5%) public/social services majors, 10 (19.6%) social sciences majors, and five (9.8%) STEM majors. Suffolk students correctly answered each question at a rate of 86.27%, 70.6%, 39.2%, 92.2%, and 62.7%, respectively, resulting in a financial literacy rate of 58.8% as an institution (where ⅘ correct responses equate to being financially literate). The distinction between business and non-business majors was substantial, as students majoring in a business-related field had a financial literacy rate of 88.9%, whereas students majoring elsewhere reported a rate of 42.4%. The high percentage attributed to business-related majors is expected, as many entry-level classes at Suffolk University, such as “Global Macroeconomics (EC-102),” “Intermediate Finance (FIN-311),” and “Business Finance (FIN-200)” teach the basic principles of financial literacy (Suffolk University, 2024). However, the low non-business score may not be expected, as this number is lower than the 47.01% score from non-business students reported by Fatoki in 2014.
Emerson Financial Literacy Results
Of the financial literacy results reported by students at Emerson College, 36 students responded, 5 students were majoring in a business-related field (13.9%), and all 31 other respondents were majoring in an arts/humanities focus (86.1%). Emerson students correctly responded to the questions at a rate of 86.1%, 61.1%, 25%, 88.9%, and 41.7%, respectively, resulting in a school- wide financial literacy rate of 41.7%. Business majors at this school reported a financial literacy rate of 100%, while non-business majors at this school only reported a rate of 35.5%. Granted, the sample size for business majors was marginally low, which would explain the substantially high rate. However, for the non-business majors at this school, their rate was much lower than both the rate reported (57%) for all adults in the United States and the rate reported (47.01) for non-business college students in South Africa (Fatoki, 2014; Klapper et al., 2014). This shows that Emerson College’s non-business students from the study are not financially prepared for their adulthood and are behind in financial literacy compared to other students of similar academic focus.
Table 3.
Answers to Financial Prudence Questions (n=87).
|
Question |
Mean Score |
Mean Score (Busine ss) |
Mean Score (Non- Busine ss) |
| I avoid spending more money than I have. (overdraft, loans, etc.) |
1.55 |
1.3 |
1.64 |
| I have little or no difficulty managing my money. | 3.3 | 3 | 3.39 |
| I pay my credit card bills in full each month to avoid interest charges. (Select 0 if this question does not apply to you.) |
3.28 |
2.87 |
3.44 |
| I have a weekly (or monthly) budget that I follow. |
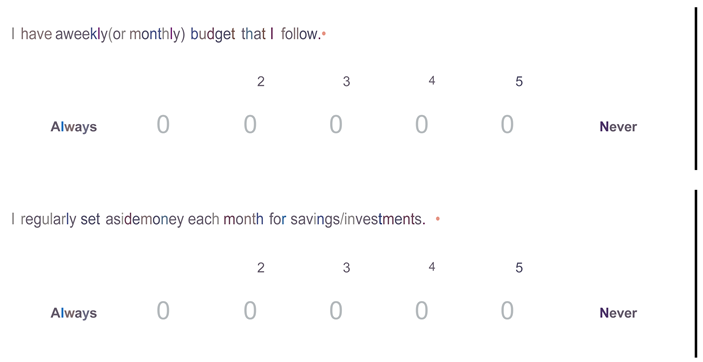
3.83 |
3.13 |
4.08 |
| I regularly set aside money each month for savings/investments. |
2.18 |
1.35 |
2.77 |
Note: 1 = always, 5 = never. Question 3’s mean score excludes all 0’s.
Overall Financial Prudence Results
The questions asked in this section were specifically chosen to match the basic financial responsibilities that college students are expected to encounter at their age. For example, 57% of college students have a credit card, 48.2% of students take out federal student loans to pay for school, and 72.5% of college students feel stressed about their finances (Center for the Study of Student Life, 2023; Hanson, 2025; Mae, 2019). The students in this survey often avoided going into debt/over-drafting for expenses that did not include school and invested/saved their money regularly. On the contrary, respondents infrequently paid their credit card bills in full, set weekly/monthly budgets, or found personal finance management easy. The inability to repay credit card bills in full can partially be attributed to the small amount of disposable income available to college students, and the difficulty in financial management can be attributed to the amount of financial stress that college students have in their daily lives. However, the lack of budgeting in the college population raises concerns as to the amount of impulse purchases, planning, and imprudent transactions that occur in the lives of college students. The mean financial prudence score of the entire survey was 2.83, above an exact average score of 3.
Suffolk Financial Prudence Results
Suffolk University students had an average financial prudence score (average of the means of all 5 questions) of 2.71. This mark is lower than the mean score for the entire survey, which means that Suffolk students were more financially prudent than Emerson students. Students in this focus group had an average frequency of 1.41, 3.37, 3.03, 3.59, and 2.16, respectively, for each question. This means that Suffolk students had a better score than the average for all of the questions besides the personal finance management question, in which they were 0.07 points higher than the average. The business students at this school had an average score of 2.32, while the average score for non-business students was 2.93. Business students answered each assessment with a frequency of 1.28, 3.17, 2.87, 3.06, and 1.22, respectively, while non-business students answered with frequencies of 1.48, 3.48, 3.14, 3.88, and 2.67, respectively. The largest disparity between the two groups is seen in the fifth assessment, which determined the frequency of saving and investing. This can be explained because while 55% of all college students report that they set aside savings every month, only 16% invest their money to entertain higher gains (Mae, 2019). Since business students are more frequently exposed to the stock market in their classes, they are more likely to participate in investing and stocks than other students. Overall, the respondents from Suffolk University are more financially prudent than students from Emerson College, and the business-related majoring students are much more prudent than the non-business majoring students.
Emerson Financial Prudence Results
The respondents attending Emerson College had an average financial prudence score (average of the 5 means) of 3.13. This score is 0.42 points higher than the average from Suffolk, which could be explained by many factors. However, the major correlation between this disparity is the fact that the respondents from Suffolk had a larger proportion of business students (35.3%) when compared to the proportion of business students at Emerson (13.9%). Business majors at Emerson had an average score of 2.13 and answered each assessment with a score of 1.4, 2.4, 1.67, 3.4, and 1.8, respectively, while non-business students at this school had an average score of 3.22 and answered each assessment with a score of 1.81, 3.21, 2.33, 3.79, and 2.55, respectively. The difference between average scores for the two groups varied drastically, as Emerson’s non-business majoring students were the only group to have an average score of over a 3. However, Emerson’s business majoring students had the lowest score of the four groups (Emerson business & non-business + Suffolk business & non-business), as their score of 2.13 was 0.19 points less than Suffolk’s business students. This could indicate that a smaller environment is more productive at inspiring financial prudence than a larger environment, since Emerson’s entire population consists of 12% business majors, whereas 40% of Suffolk’s population majors in a business-related field (Department of Education, 2025a; 2025b).
Discussion
College students at Suffolk University and Emerson College are less financially literate than all college students in the United States and the average adult in the United States (National Financial Educators Council, 2024). The average student at Suffolk University, however, is much more financially literate than the average student at Emerson College, which draws questions as to the cause of this disparity. The largest correlation for financial literacy scores in the responses is major, as business majors scored an average of 32% higher than non-business majors on each financial literacy question. Business majors had a financial literacy rate of 95.7%, while non-business majors had a financial literacy rate of 35.9%. The business-majoring mark was substantially higher than the financial literacy rate of all adults in the United States (57%), while the non-business mark was marginally lower. However, non-business students had an average correct answer percentage of 58.44%, which was higher than the rate reported for non-business students in South Africa, which was a rate of 47.01% (Fatoki, 2014). Since South Africa’s average financial literacy rate among all adults is 42%, college students in the United States should have higher financial literacy rates than students in South Africa, which was not the case (Klapper et al., 2015).
When compared to the National Jump$tart Coalition’s “Survey of High School Seniors and College Students” done in 2008, the financial literacy scores are similar. The National Jump$tart Coalition’s survey reported an average score of 62.2%, while my survey had an average score of 66.7% for all college students, showing a slight increase in financial literacy from 2008 (Mandell, 2008). However, there are not many factors that can be attributed to this increase because the National Jump$tart Coalition took a random sample of all college students in a “national compensated panel” that is maintained by the Survey Sampling International, while the students sampled in this study were taken from two specific institutions in Downtown Boston.
The 2008 study also notes that college seniors had the highest correct answer rate of 64.8%, which is still lower than the average score reported in this survey, further demonstrating the improvement in financial literacy for college students over time.
When compared to Cude et al. (2006), the financial prudence of college students from this sample was, on average, worse than the students sampled from the University of Georgia and Louisiana State University. The mean financial prudence score from the five prudence assessments from the Suffolk University and Emerson College sample was 2.83, while the mean score from the large public southern universities was 2.53. This shows that financial education in the two southern public universities results in financial prudence more often and effectively than in the two mid-sized, northern, private universities.
For the question that assesses debt avoidance, the frequency of not using more money than one has, the mean score in this entire sample was 1.55 and the mean score in Cude et al. (2006) was 1.69, meaning that students from Suffolk University and Emerson College avoid debt more often than students from Louisiana State University and the University of Georgia, but not by a large amount. The money management question saw a mean score of 3.3 in this study compared to 2.26 in Cude’s study, which is a remarkable disparity. This could be explained by the fact that people have a lot more money in their pockets to spend, as disposable income (income left over after all bills and expenses are paid) per capita has nearly doubled—from $33,261 in 2006 to $63,565 in 2024 — since the preliminary study has been conducted (U.S. Bureau of Economic Analysis, 2024). The credit card payment question had a score of 3.28 in this study compared to 2.29 in Cude’s study, which was an unexpected discovery. The participants in Cude’s study described their view of credit card debt as “danger[ous],” which would influence fewer people who couldn’t pay off credit cards to avoid getting one in the first place, strengthening their score on this particular question. The assessment on budgeting also received a large gap from one study to another, as in this study, students had a mean score of 3.83 for the budgeting question, while students in Cude’s study had a score of 3.14. Budgeting has always been uncommon in the college scene because of the irregular income and susceptibility to impulse purchases that college students commonly experience, which explains both high marks of this question. Finally, the last question assesses the frequency of savings and investments, in which the score in this study was 2.18 compared to a score of 3.28 in Cude’s study. Saving and investing have gotten much easier over the years as quicker options, such as mobile banking and investing, have allowed younger audiences to begin saving with less starting capital. Additionally, retracing to the disposable income per capita increase, more students could be trying to save more money because they have more money to begin with.
Limitations
This study was limited to a short period of data collection because of the AP Research data collection time frame and the conflicting schedules between me and typical college students. There was only one day for sampling included in this paper when an optimal amount would’ve been collected over multiple days to ensure validity and increase generalizability. Furthermore, the target sample size for this study was 150 responses, with 75 for each school. This number was not met because I underestimated the response rate of people who were asked to answer the survey, but 87 respondents is still acceptable for the scope of this study. Additionally, I failed to get in contact with any professors at either Suffolk University or Emerson College. If I had been able to do this, then the response rate would have been higher, and the sample size would have been closer to the target range.
While there is no data on the status of business courses taken, financial aid status, or majors in Cude et al., they drew the strongest correlation from parental income, which was not tracked in my study and could have also been a large correlational factor.
The survey was also limited in questions because of the confidentiality that had to be maintained and the fact that if I made the survey too difficult and too time-consuming, fewer people would answer it. Most of the studies I referenced in this paper used a larger number of questions with increased difficulty, which skews some of the percentages indicating true financial literacy. If I could have increased the question number to around 20 questions, then the financial literacy results would have been more accurate.
Conclusions and Steps for Further Research
Business-related majors from mid-sized private colleges in Downtown Boston are substantially more financially literate and prudent than non-business majors from the same schools. Financial literacy is most directly related to the chosen major, likely because of the curriculum and what is being taught in required classes for business majors. As a whole, the group of respondents reported a financial literacy rate of 51.7%, which is below the national average of 57%. Students majoring in non-business-related fields were also distanced to a great extent from the financial prudence of students majoring in business-related majors, as the average score on financial prudence varied by an average of .73 points for each group. When compared to large public universities from the south, most differences could be attributed to the modernization of finances in the 19 years since the last study had been conducted, while others could be attributed to the difference in education.
Further research in this field should target the effectiveness of business courses in teaching financial literacy and prudence in a college setting. This would determine how colleges are financially preparing their students for adulthood, as well as the current capabilities of teaching financial literacy and prudence. Additionally, further research should expand on the findings in this study in other regions. This study was only limited to a small region in Boston, Massachusetts, but results could vary based on geographic location, school prestige, demographics, and more. More research should also be done to assess how financially illiterate college students are managing their finances after they graduate to determine the magnitude of developing financial literacy at an age that precedes the workforce. This study should also be replicated at as many higher education institutions as possible to offer financial literacy data for high school students looking to apply to these institutions and to make narrower assumptions about financial literacy per region.
Appendix A
Financial Literacy & Prudence Survey
 |
 |
 |
 |
 |
 |
 |
 |
References
- Bianco, C. A., & Bosco, S. M. (2012). Financial (il)literacy of college students. Journal of American Academy of Business, Cambridge, 18(1). Available online: http://www.jaabc.com/Jaabc18-1September2012Bianco.html.
- Carales, V. D., & Molina, M. (2023). Indebted to My Education: Examining College Graduates’ Perceptions of Student Loan Repayment,” Journal of Student Financial Aid: Vol. 52: Iss. 1, Article 1. Available online: https://ir.library.louisville.edu/jsfa/vol52/iss1/1. [CrossRef]
- Center for the Study of Student Life. (2023). Student Financial Wellness in 2020 and 2023 Study on Collegiate Financial Wellness Center for the Study of Student Life. Available online: https://cssl.osu.edu/documents/scfw-2023-financial-wellness-comparison-to-2020-tagged.pdf.
- Chen, H., & Volpe, R. (1998). An analysis of personal financial literacy among college students. Financial Services Review, 7(2), 107–128. [CrossRef]
- Cude, B., Lawrence, F. C., Lyons, A. C., Metzger, K., LeJeune, E., Marks, L., & Machtmes, K. (2006). Eastern Family Economics and Resource Management Association 2006 Conference College Students and Financial Literacy: What They Know and What We Need to Learn. Available online: https://gradsense.org/ckfinder/userfiles/files/College_Students_and_Financial_Literacy.pdf.
- Department of Education. (2025a). Institution Data Profile - Emerson College. Ed.gov. Available online: https://nces.ed.gov/ipeds/institution-profile/165662#institution-characteristics.
- Department of Education. (2025b). Institution Data Profile - Suffolk University. Ed.gov. Available online: https://nces.ed.gov/ipeds/institution-profile/168005.
- Fatoki, O. (2014). The financial literacy of non-business university students in South Africa.
- Department of Business Management; University of Limpopo. Available online: http://krepublishers.com/02-Journals/IJES/IJES-07-0-000-14-Web/IJES-07-2-000-14-ABST-PDF/IJES-7-2-261-14-456-Fatoki-O/IJES-7-2-261-14-456-Fatoki-O-Tx%5B3%5D.pdf.
- Forward Pathway. (2021a, February). Emerson College - Forward Pathway. Forward Pathway. Available online: https://www.forwardpathway.us/emerson-college.
- Forward Pathway. (2021b, February). Suffolk University - Forward Pathway. Forward Pathway. Available online: https://www.forwardpathway.us/suffolk-university.
- Hagadorn, M., Lahousse, M. (2019). Financial Literacy Initiative at a Liberal Arts College: What Students Want (& Need)! Journal of Higher Education Theory and Practice, 19(5), 83. [CrossRef]
- Hanson, M. (2023, August 13). College Tuition Inflation Rate. Education Data Initiative. Available online: https://educationdata.org/college-tuition-inflation-rate.
- Hanson, M. (2025, January 15). Student loan debt statistics. Education Data Initiative; EducationData.org. Available online: https://educationdata.org/student-loan-debt-statistics.
- Hung, A., Parker, A. M., & Yoong, J. (2009, September 2). Defining and Measuring Financial Literacy. Papers.ssrn.com. Available online: https://papers.ssrn.com/Sol3/Papers.Cfm?
- Jump$tart Coalition for Personal Financial Literacy. (2008). 2008 survey of personal financial literacy among students. International Commission for Financial Education. Available online: https://icfe.org/2008-jumpstart-survey.
- Kiernan, J. (2024, April 4). 2024’s Most & Least Financially Literate States. WalletHub. Available online: https://wallethub.com/edu/most-and-least-financially-literate-states/3337.
- Klapper, L., Lusardi, A., & Van Oudheusden, P. (2015). Financial Literacy Around the World: Insights from the Standard & Poor’s Ratings Services Global Financial Literacy Survey. Available online: https://gflec.org/wp-content/uploads/2015/11/3313-Finlit_Report_FINAL-5.11.16.pdf.
- Lusardi, A. Lusardi, A., & Mitchell, O. S. (2008). Planning and Financial Literacy: How Do Women Fare?
- American Economic Review, 98(2), 413–417. [CrossRef]
- Lusardi, A., & Mitchell, O. (n.d.). The Big Three and Big Five. Global Financial Literacy Excellence Center (GFLEC). Available online: https://gflec.org/education/questions-that-indicate-financial-literacy/.
- Mae, S. (2019). Majoring in Money. Ipsos Public Affairs. Available online: https://www.salliemae.com/content/dam/slm/Media/images/Research/Majoring-In-Money-Report-2019.pdf.
- Majors & Programs. (n.d.). Emerson College. Available online: https://emerson.edu/majors-programs.
- Mandell, L. (2008). The Financial Literacy of Young American Adults: Results of the 2008 National Jump$tart Coalition Survey of High School Seniors and College Students For the Jump$tart Coalition ® for Personal Financial Literacy. Available online: https://views.smgww.org/assets/pdf/2008%20JumpStart%20Financial%20Literacy%20Survey.pdf.
- National Financial Educators Council. (2024). National Financial Literacy Test: Results, Data, Q & A | NFEC. NFEC. Available online: https://www.financialeducatorscouncil.org/national-financial-literacy-test/.
- Sauer, K., Ashton, B., Coogan, E., Goebel, P., Kaus, J., Pechinski, N., & Woodlee, T. (2017). The Financial Transition from Student to Employee: Implications for Higher Education and Employers. COHEAO’s Financial Wellness Task Force; COHEAO. Available online: https://coheao.com/wp-content/uploads/2024/05/COHEAO-Financial-Wellness-White-Paper-2017.pdf.
- Suffolk University. (2024). Suffolk University - Finance, BSBA. Smartcatalogiq.com. Available online: https://suffolk.smartcatalogiq.com/current/catalog/sawyer-business-school-undergraduate-programs/finance/finance-bsba/.
- U.S. Bureau of Economic Analysis. (2024). Disposable personal income: Per capita. FRED, Federal Reserve Bank of St. Louis. Available online: https://fred.stlouisfed.org/series/A229RC0A052NBEA.
Disclaimer/Publisher’s Note: The statements, opinions and data contained in all publications are solely those of the individual author(s) and contributor(s) and not of MDPI and/or the editor(s). MDPI and/or the editor(s) disclaim responsibility for any injury to people or property resulting from any ideas, methods, instructions or products referred to in the content. |
© 2025 by the author. Licensee MDPI, Basel, Switzerland. This article is an open access article distributed under the terms and conditions of the Creative Commons Attribution (CC BY) license (https://creativecommons.org/licenses/by/4.0/).
Copyright: This open access article is published under a Creative Commons CC BY 4.0 license, which permit the free download, distribution, and reuse, provided that the author and preprint are cited in any reuse.


