Submitted:
11 November 2025
Posted:
12 November 2025
You are already at the latest version
Abstract
Seed aging during storage represents a major challenge to global food security and germplasm resource conservation. Long-lived mRNAs, which are crucial for initiating germination after storage, have poorly understood regulatory mechanisms governing their stability. In this study, we identify the RNA-binding protein OsGRP3 as a key positive regulator of rice storability. Initially, we demonstrated that Arabidopsis AtGRP7 enhances seed vigor following aging. Phylogenetic analysis identified OsGRP3 as its closest rice homolog. Two independent OsGRP3-overexpression lines showed markedly improved germination rates and seed viability after extended artificial aging. Physiological assessments indicated that OsGRP3 mitigates aging-related damage, as evidenced by reduced malondialdehyde (MDA) levels and electrolyte leakage, consistent with better membrane integrity. RNA-seq analysis revealed that OsGRP3 overexpression attenuated the transcriptional disruption induced by aging. Moreover, OsGRP3 activates a "pre-adaptive" transcriptional network under non-stress conditions, leading to altered expression of 404 genes involved in DNA replication, gluconeogenesis, and essential amino acid metabolism to the onset of aging stress. Our findings establish OsGRP3 as a conserved RNA-binding protein that enhances seed storability, and offer a promising genetic target for improving storage tolerance in rice.
Keywords:
OsGRP3
; lonv lived mRNA
; seed vigor
; rice storability
1. Intruduction
Rice, a staple crop supporting more than half of the world’s population, is fundamental to global food security [1]. However, prolonged storage leads to a marked decline in seed vigor and a deterioration in grain quality, undercutting both nutritional value and agricultural productivity, a challenge particularly acute in tropical and subtropical regions [2]. Improving storage tolerance is therefore essential to securing grain preservation and sustainable seed use, establishing it as a priority trait in modern seed breeding. Uncovering genetic resources related to storage tolerance and deciphering the molecular basis of seed aging are thus critical for minimizing postharvest losses and safeguarding long-term food security [3,4].
During seed aging, a series of physiological and biochemical alterations take place, such as the inhibition of enzyme activity, accumulation of harmful metabolites, decline in antioxidant capacity, lipid peroxidation, biomembrane disruption, and damage to biological macromolecules including nucleic acids and proteins [2,5,6].It is widely established that the production and dysregulation of reactive oxygen species (ROS) serve as the principal drivers of seed deterioration [7]. During the later stages of storage, for instance, excessive ROS accumulation triggers lipid peroxidation, inflicts macromolecular damage, and results in DNA strand breaks [2,8,910]. Beyond oxidative damage, the stability of long-lived RNAs, a class of RNA molecules preserved in seeds that are crucial for early germination, also considerably affects seed storability [11,12,13,14]. Nevertheless, the protective mechanisms that maintain the integrity of these long-lived RNAs throughout the aging process remain largely unknown.
Glycine-Rich RNA-Binding Protein 7 (GRP7), a member of the glycine-rich RNA-binding protein (GR-RBP) family, specifically binds RNA and participates in post-transcriptional regulatory processes, including alternative splicing and translation, thereby modulating plant adaptation to environmental stresses [15,16,17]. Recent studies have revealed that GRP7 can also bind RNA extracellularly and contribute to the stability of extracellular RNAs (exRNAs) in the apoplastic fluid [18]. In rice, expression of its homolog OsGRP1A increases steadily during seed storage [19], raising the question of whether OsGRP enhances seed storage tolerance via RNA regulation.
Here, we first established that Arabidopsis AtGRP7 positively regulates seed vigor. Through homology analysis, we identified OsGRP3 as its closest ortholog in rice. Overexpression of OsGRP3 significantly preserved seed viability under artificial accelerated aging conditions. In addition, OsGRP3-overexpressing plants exhibited markedly reduced plasma membrane damage compared to the wild-type. Transcriptomic profiling further revealed that OsGRP3 overexpression induces broad transcriptional reprogramming of genes associated with oxidative stress response, energy metabolism, and cellular protection. These findings provide valuable genetic resources for breeding rice varieties with enhanced storage tolerance.
2. Materials and Methods
2.1. Plant Material Generation
To generate the OsGRP3-overexpression plant material, the full-length coding sequence of OsGRP3 was amplified and cloned into the pCAMBIA1390 vector, driven by the Ubiquitin promoter, with a GFP or flag tag fused to its C-terminus. The resulting construct was introduced into Agrobacterium tumefaciens strain EHA105 and subsequently transformed into the Nipponbare (Nip) background via Agrobacterium-mediated transformation [20]. Primary positive transgenic plants were initially screened and confirmed by Western blot (WB) analysis using anti-GFP or anti-FLAG antibody (Figure S1). T0 positive plants were self-pollinated to obtain T1 seeds for establishing stable overexpression lines.
2.2. Seed Germination Assay
For each seed sample, three biological replicates of 30 seeds each were set up. Seeds were evenly placed on square grid dishes lined with two layers of filter paper, and moistened with an adequate volume of ddH2O. The dishes were then incubated in a growth chamber set at 30 °C under low-light conditions. The day following the start of incubation was designated as day 1 of germination. Germination rates were recorded daily at a fixed time. The assay was terminated on day 8, by which point the final germination rate was recorded, as no further significant change in germination percentage was typically observed beyond this time point.
2.3. TTC Staining Assay
Rice seeds were first immersed in distilled water at 30℃ for 4 h to allow full imbibition. Subsequently, 100 seeds were randomly selected and completely immersed in a 0.5% (w/v) 2, 3, 5-triphenyltetrazolium chloride (TTC) solution in a Petri dish. The dish was sealed and incubated in the dark at 30 °C for 30 min. After incubation, the TTC solution was discarded, and the seeds were gently rinsed twice with distilled water. Staining of the embryos was immediately observed under a stereomicroscope. Seed viability was assessed based on the extent of red coloration in the embryonic tissues [21].
2.4. Treatment for Accelerating After-Ripening of Arabidopsis Seeds
To simulate natural seed aging within a shortened experimental timeframe, an internationally established artificial accelerated aging protocol was employed. Arabidopsis seeds with uniform initial moisture content and viability were used. An appropriate amount of seeds was evenly distributed in small Petri dishes. The dishes were sealed with plastic film, which was perforated uniformly with a fine needle to allow gas exchange. All dishes were then placed in a growth chamber maintained at 40 °C and 100% relative humidity for aging treatments of 0, 1, 2, and 3 days. Three biological replicates were included for each treatment group.
2.5. Treatment for Accelerated Aging of Rice Seeds
To rapidly evaluate differences in storage tolerance among rice accessions, an artificial accelerated aging assay was employed using high temperature and humidity conditions. Freshly harvested, physiologically mature rice seeds were subjected to aging in an environmental chamber maintained at 42 °C and 85% relative humidity for 0, 5, 10, 15, and 20 days. Following treatment, representative seeds from each time point were selected based on plumpness and the absence of visible damage, mold, or germination. The seeds were surface-sterilized in 10% (v/v) sodium hypochlorite solution for 40 min and subsequently rinsed thoroughly with ddH2O 3-5 times before further use.
2.6. Total Starch Content Assay
The total starch content was determined using an enzymatic hydrolysis method. In brief, the dried and ground rice seed samples were oscillated and centrifuged with 80% ethanol to remove free sugars. The precipitate was gelatinized at high temperature and then hydrolyzed by thermostable α-amylase and amyloglucosidase at 50 °C to release glucose. The glucose content in the hydrolysate was measured spectrophotometrically at 510 nm using the glucose oxidase peroxidase reagent. The total starch content was calculated by multiplying the glucose content by a conversion factor of 0.9 [22].This method ensures complete and specific conversion of starch to glucose, avoiding interference from other polysaccharides, and has been widely applied in cereal starch analysis.
2.7. Pasting Property Measurement
The pasting properties of rice starch were determined using a Rapid Visco Analyzer. A mixture of 3 g starch and 25 g distilled water was prepared in an RVA testing canister. The testing profile was set as follows: held at 50 °C for 1 min, heated uniformly to 95 °C over 8 min, maintained at 95 °C for 2.5 min, cooled uniformly to 50 °C over 8 min, and finally held at 50 °C for 2 min. The mixture was stirred at 60 r/min for the first 10 s, followed by continuous stirring at 160 r/min for the remainder of the test. The following parameters were recorded: peak viscosity, trough viscosity, final viscosity, pasting temperature, breakdown, and setback. All viscosity values are expressed in Rapid Visco Units.
2.8. Texture Profile Analysis
Rice grains were debusked and polished. The resulting white rice was rinsed three times with distilled water and subsequently soaked in distilled water for 30 min. After soaking, the rice was cooked with approximately 1.3-fold (v/w) distilled water for 40 min, followed by a 20-min equilibration period. The cooked rice was cooled to room temperature before analysis.Texture profile analysis was performed using a texture analyzer equipped with a 36R cylindrical probe. The instrument was calibrated for height and force prior to measurement. Three intact rice grains were placed on the platform for each test. The testing parameters were set as follows: pre-test speed, 10 mm/s; test speed, 0.5 mm/s; post-test speed, 5 mm/s; compression ratio, 70%; and trigger force, 10 g [23].
2.9. RNA-Seq
Total RNA was extracted from samples using the mirVana™ miRNA Isolation Kit. Eukaryotic mRNA was then enriched using magnetic beads with Oligo(dT), followed by mRNA fragmentation and synthesis of first-strand and second-strand cDNA [15]. The double-stranded cDNA was purified, subjected to end repair and A-tailing, and ligated with sequencing adapters. The constructed library was amplified and quality-checked using the Agilent 2100 Bioanalyzer.
Sequencing was performed on the Illumina HiSeq™ 2500 or HiSeq X Ten platform. Raw sequencing reads were processed through quality filtering to obtain high-quality clean reads. The FPKM (Fragments Per Kilobase of transcript per Million mapped reads) values for each gene were analyzed using the boNIPie2 software, while read counts were obtained using eXpress. Data normalization was performed with the estimateSizeFactors function from the DESeq R package, and the nbinomTest function was used to calculate p-values and fold changes for differential comparisons. Differentially expressed transcripts were identified with a q-value < 0.01 and a fold change > 2, followed by GO and KEGG enrichment analyses.
2.10. Localization Analysis of OsGRP3
For subcellular localization analysis of OsGRP3, the full-length coding sequence was amplified and cloned into the pCAMBIA1300 vector under the control of the 35S promoter, with a GFP tag fused to its C-terminus. The constructed plasmid was introduced into Agrobacterium tumefaciens strain GV3101. Arabidopsis mesophyll protoplasts were isolated from leaves of 4-week-old plants and subsequently transfected with the constructed plasmid using a PEG-mediated method. Transfected protoplasts were cultured in the dark at 22 °C for approximately 18 hours before examination. GFP fluorescence signals were observed under a confocal laser scanning microscope to ascertain the precise localization of OsGRP3 [20].
2.11. RNA Extraction and RT-qPCR
Total RNA was isolated from various rice tissues, including root, stem, leaf, seed, and caryopsis, using TRIzol reagent (Thermo Scientific, USA,, 15596018CN), following the manufacturer’s protocol [15]. Approximately 1 μg of total RNA was used for reverse transcription into first-strand cDNA with the Maxima H Minus First Strand cDNA Synthesis Kit (Thermo Scientific, USA, K1691). Quantitative real-time PCR (RT-qPCR) was subsequently performed to analyze gene expression levels, which were normalized using the rice OsActin gene as an internal control.
3. Result
3.1. AtGRP7 Positively Regualte Seed Vigor
In previous research, we identified an RNA-binding protein, AtGRP7, involved in stress responses in Arabidopsis thaliana [15,17]. To further investigate its biological function in maintaining seed vigor, we conducted systematic artificial accelerated aging experiments using wild-type (Col-0), AtGRP7-overexpression (AtGRP7-OE), and atgrp7 mutant seeds. Germination rate analysis showed that all genotypes exhibited similarly high germination levels under untreated conditions (0 d; Figure 1A, B), indicating no significant differences in initial seed viability among the genotypes. However, after 3 days of artificial aging treatment, distinct phenotypic differences emerged: the AtGRP7-OE lines maintained strong germination capacity and normal seedling establishment, comparable to the non-aged control group, whereas the atgrp7 mutant showed the most severe decline in viability, with significantly reduced germination rates (Figure 1A, C). When the aging period was extended to 9 days, the genotypic differences became more pronounced: AtGRP7-OE seeds consistently exhibited significantly higher germination rates than the wild-type control, while the atgrp7 mutant displayed the lowest germination level among all lines (Figure 1D). These time-course experimental results demonstrate that AtGRP7, actively participates in maintaining seed vigor under artificial aging stress and functions as a positive regulator in this process.
3.2. The Homologous Gene of AtGRP7, OsGRP3, Is Expressed in Rice
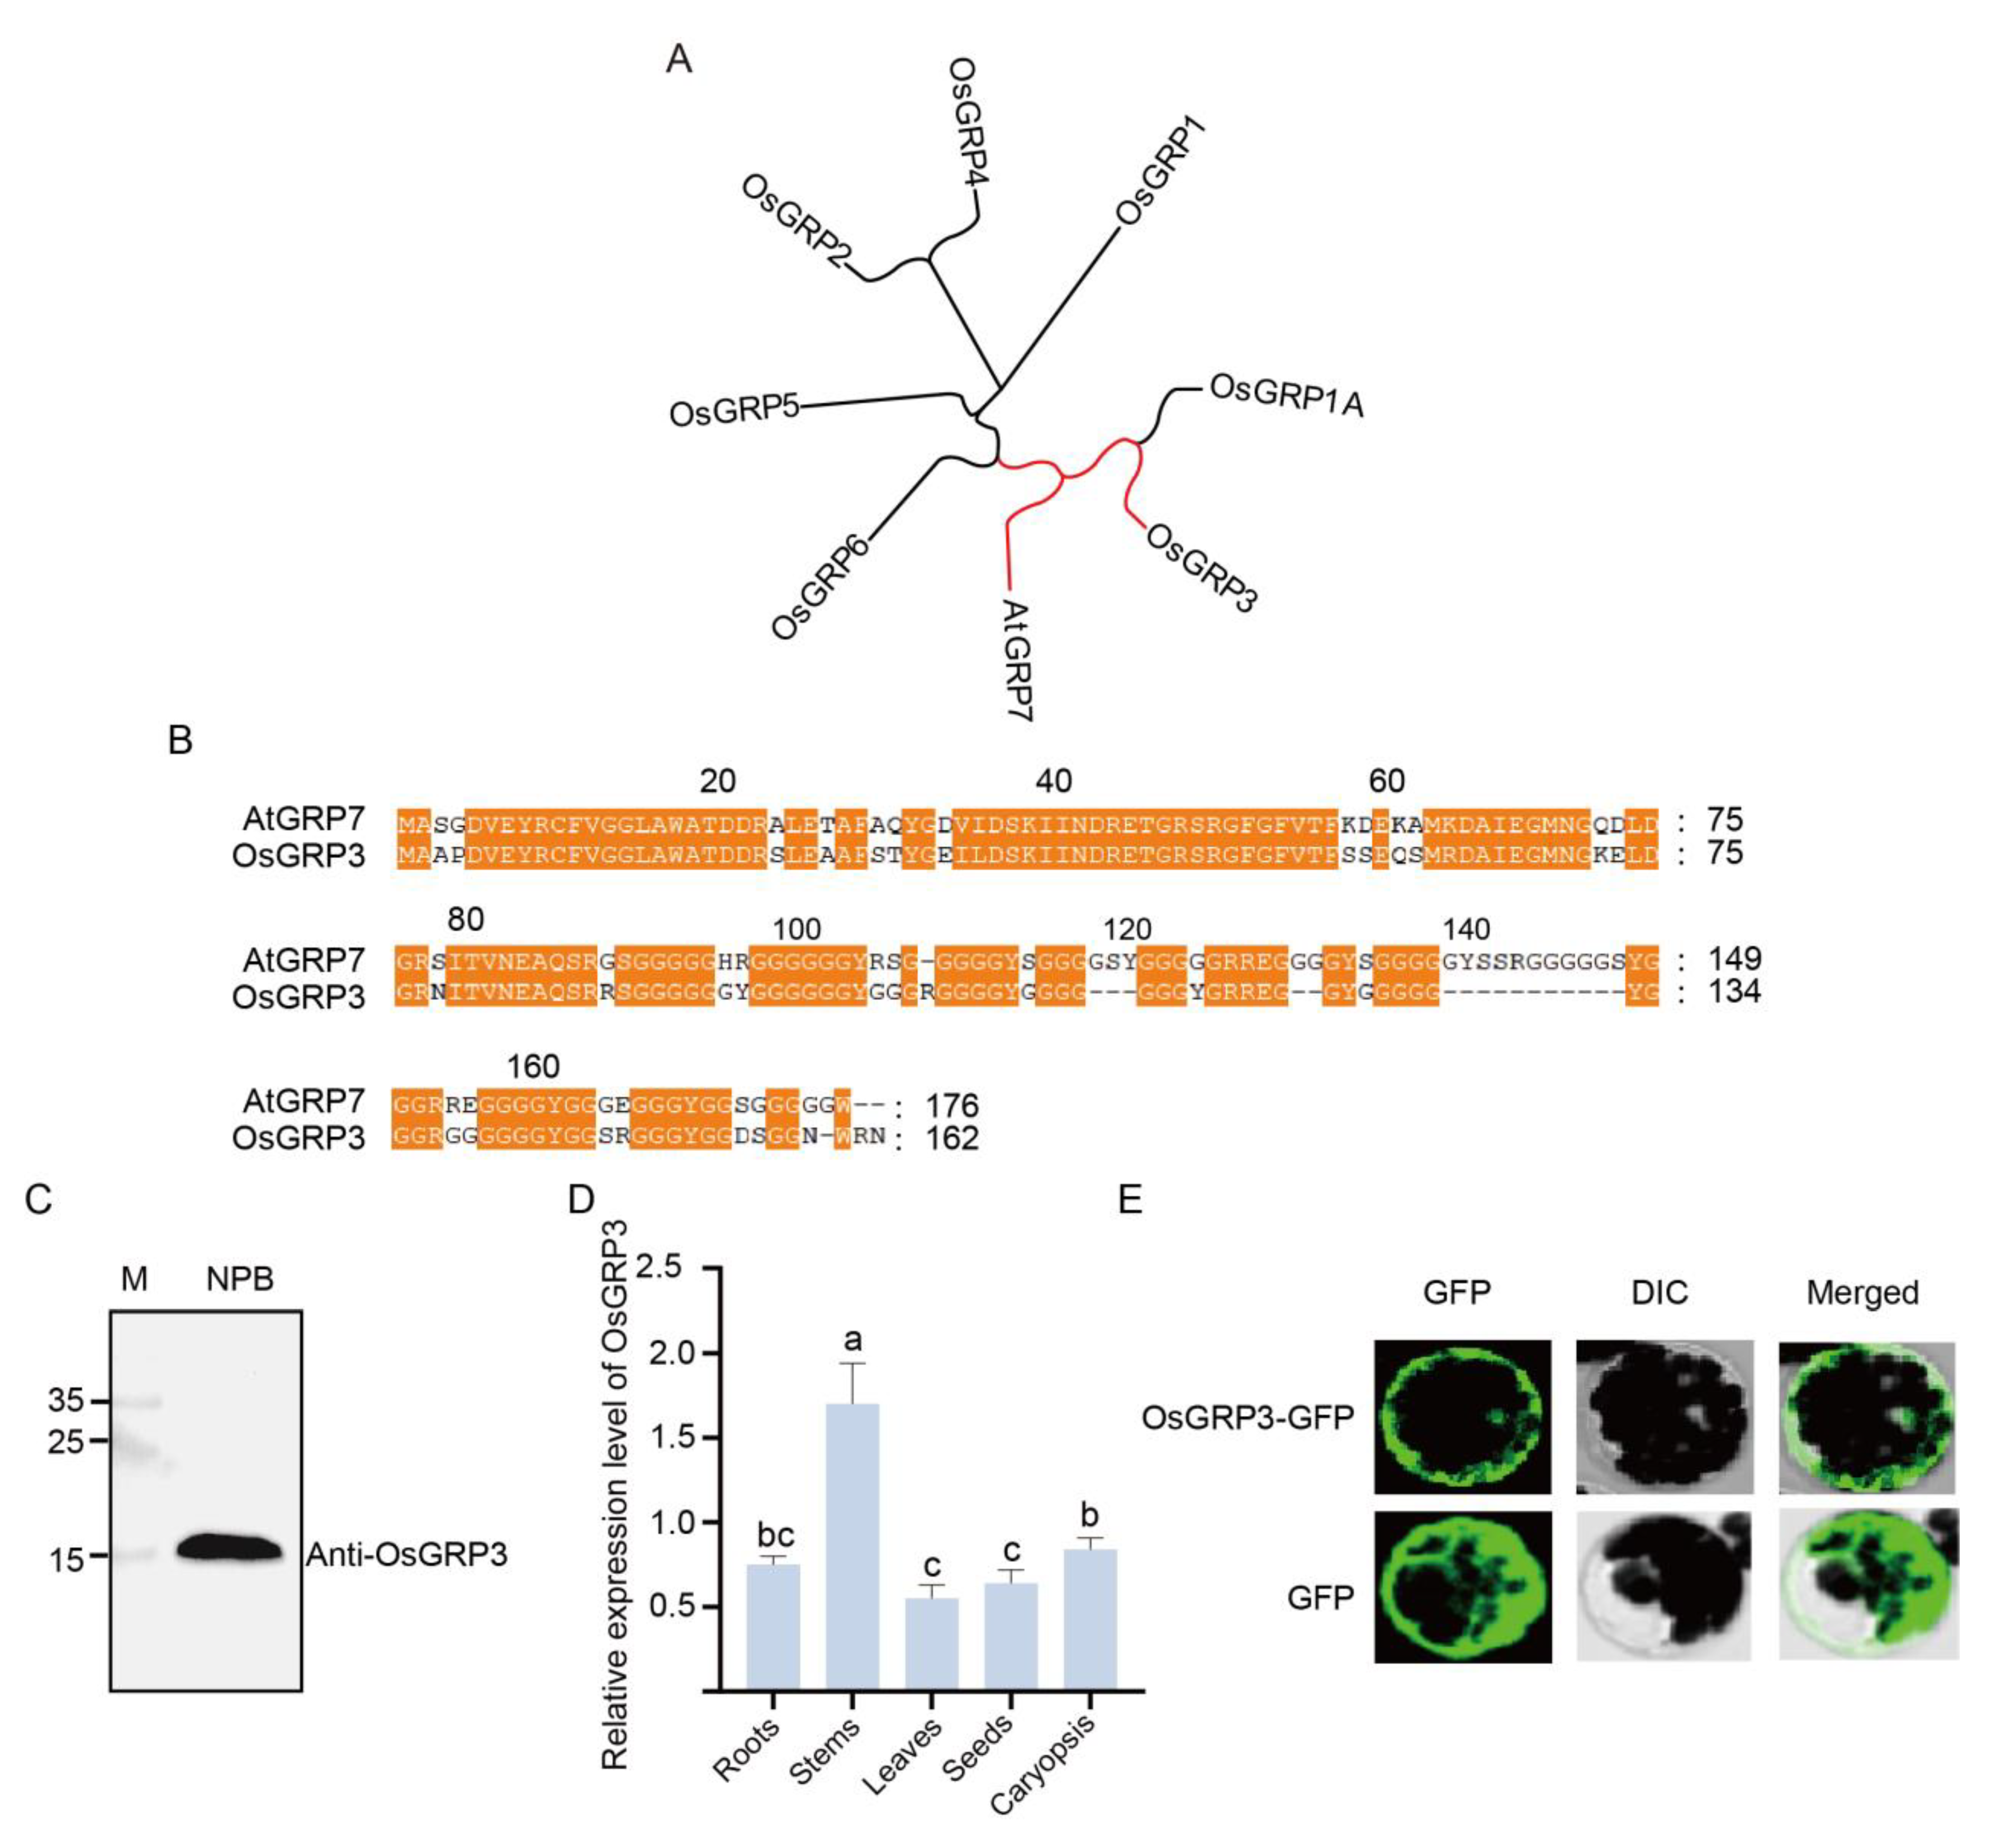
Phylogenetic analysis revealed that OsGRP3 shares the closest evolutionary relationship with AtGRP7 (Figure 2A, red marker), suggesting potential functional conservation between these two proteins. Further protein sequence alignment demonstrated multiple highly conserved regions between OsGRP3 and AtGRP7 (Figure 2B, orange highlights), particularly within the N-terminal domain, indicating that OsGRP3 likely maintains structural and functional characteristics similar to AtGRP7.
To determine whether OsGRP3 is expressed in seeds, we employed an endogenous antibody for detection. A single clear band of the expected molecular weight was detected in the Nipponbare (Nip) cultivar (Figure 2C), confirming that OsGRP3 is normally expressed in rice seeds. Tissue-specific expression analysis revealed distinct expression patterns, with the highest abundance in stems, followed by caryopses and roots, while relatively lower levels were observed in leaves and seeds (Figure 2D). Subcellular localization experiments revealed that the OsGRP3-GFP fusion protein was distributed throughout the cell, consistent with our previously reported localization pattern of AtGRP7 (Figure 2E). Collectively, phylogenetic and experimental analyses demonstrate that OsGRP3 represents a functional homolog of AtGRP7 in rice, and its expression in seeds suggests a potential role in seed vigor.
Figure 2.
Phylogenetic relationship, sequence alignment, expression pattern, and subcellular localization of rice OsGRP3. A, Phylogenetic analysis of GRP family members from rice and Arabidopsis thaliana AtGRP7. The red branch highlights the close evolutionary relationship between AtGRP7 and OsGRP3. B, Amino acid sequence alignment of AtGRP7 and OsGRP3. Conserved domains, indicative of potential functional similarity, are marked by orange boxes. C, Immunoblot validation of the OsGRP3 protein. Lane M represents the protein molecular weight marker, and Nip serves as the negative control. A specific band for OsGRP3 confirms its detection. D, Analysis of relative OsGRP3 expression levels across different rice tissues (root, stem, leaf, and hypocotyl). Different lowercase letters above the bars denote statistically significant differences among the tissue groups (mean ± SD; n = 3 biological replicates). E, Subcellular localization of the OsGRP3-GFP fusion protein (upper panel) compared to the GFP-only control (lower panel). Images from left to right show the GFP green fluorescence channel, DIC (Differential Interference Contrast) imaging, and the merged image. The localization pattern demonstrates the specific subcellular distribution of OsGRP3.
3.3. OsGRP3 Positively Regualte Seed Vigor
To elucidate the biological function of OsGRP3 in maintaining rice seed vigor, we successfully generated two independent overexpression lines, OsGRP3-GFP-1 and OsGRP3-flag-2. Under normal growth conditions, the germination rates of transgenic lines and wild-type seeds were comparable (Figure 3A, B), indicating that OsGRP3 overexpression does not affect the normal seed germination process. Following 20 days of artificial accelerated aging treatment, significant differences emerged among genotypes. Wild-type seeds showed a marked decline in germination rate, while both overexpression lines maintained higher germination capacity throughout the observation period (Figure 3A, C). This difference became particularly pronounced during the later stages of treatment, suggesting that OsGRP3 overexpression effectively alleviates the damage caused by aging stress on seed germination capability. In addition, we assessed metabolic activity in seed embryos using TTC staining. The results revealed that after aging treatment, the embryos of overexpression lines exhibited more intense red staining (Figure 3D), indicating preserved dehydrogenase activity and cellular metabolic function. This indicates that OsGRP3, similar to AtGRP7, positively regulates seed vigor in rice.
3.4. OsGRP3 Sustains Seed Vigor by Alleviating Membrane Damage During Prolonged Aging
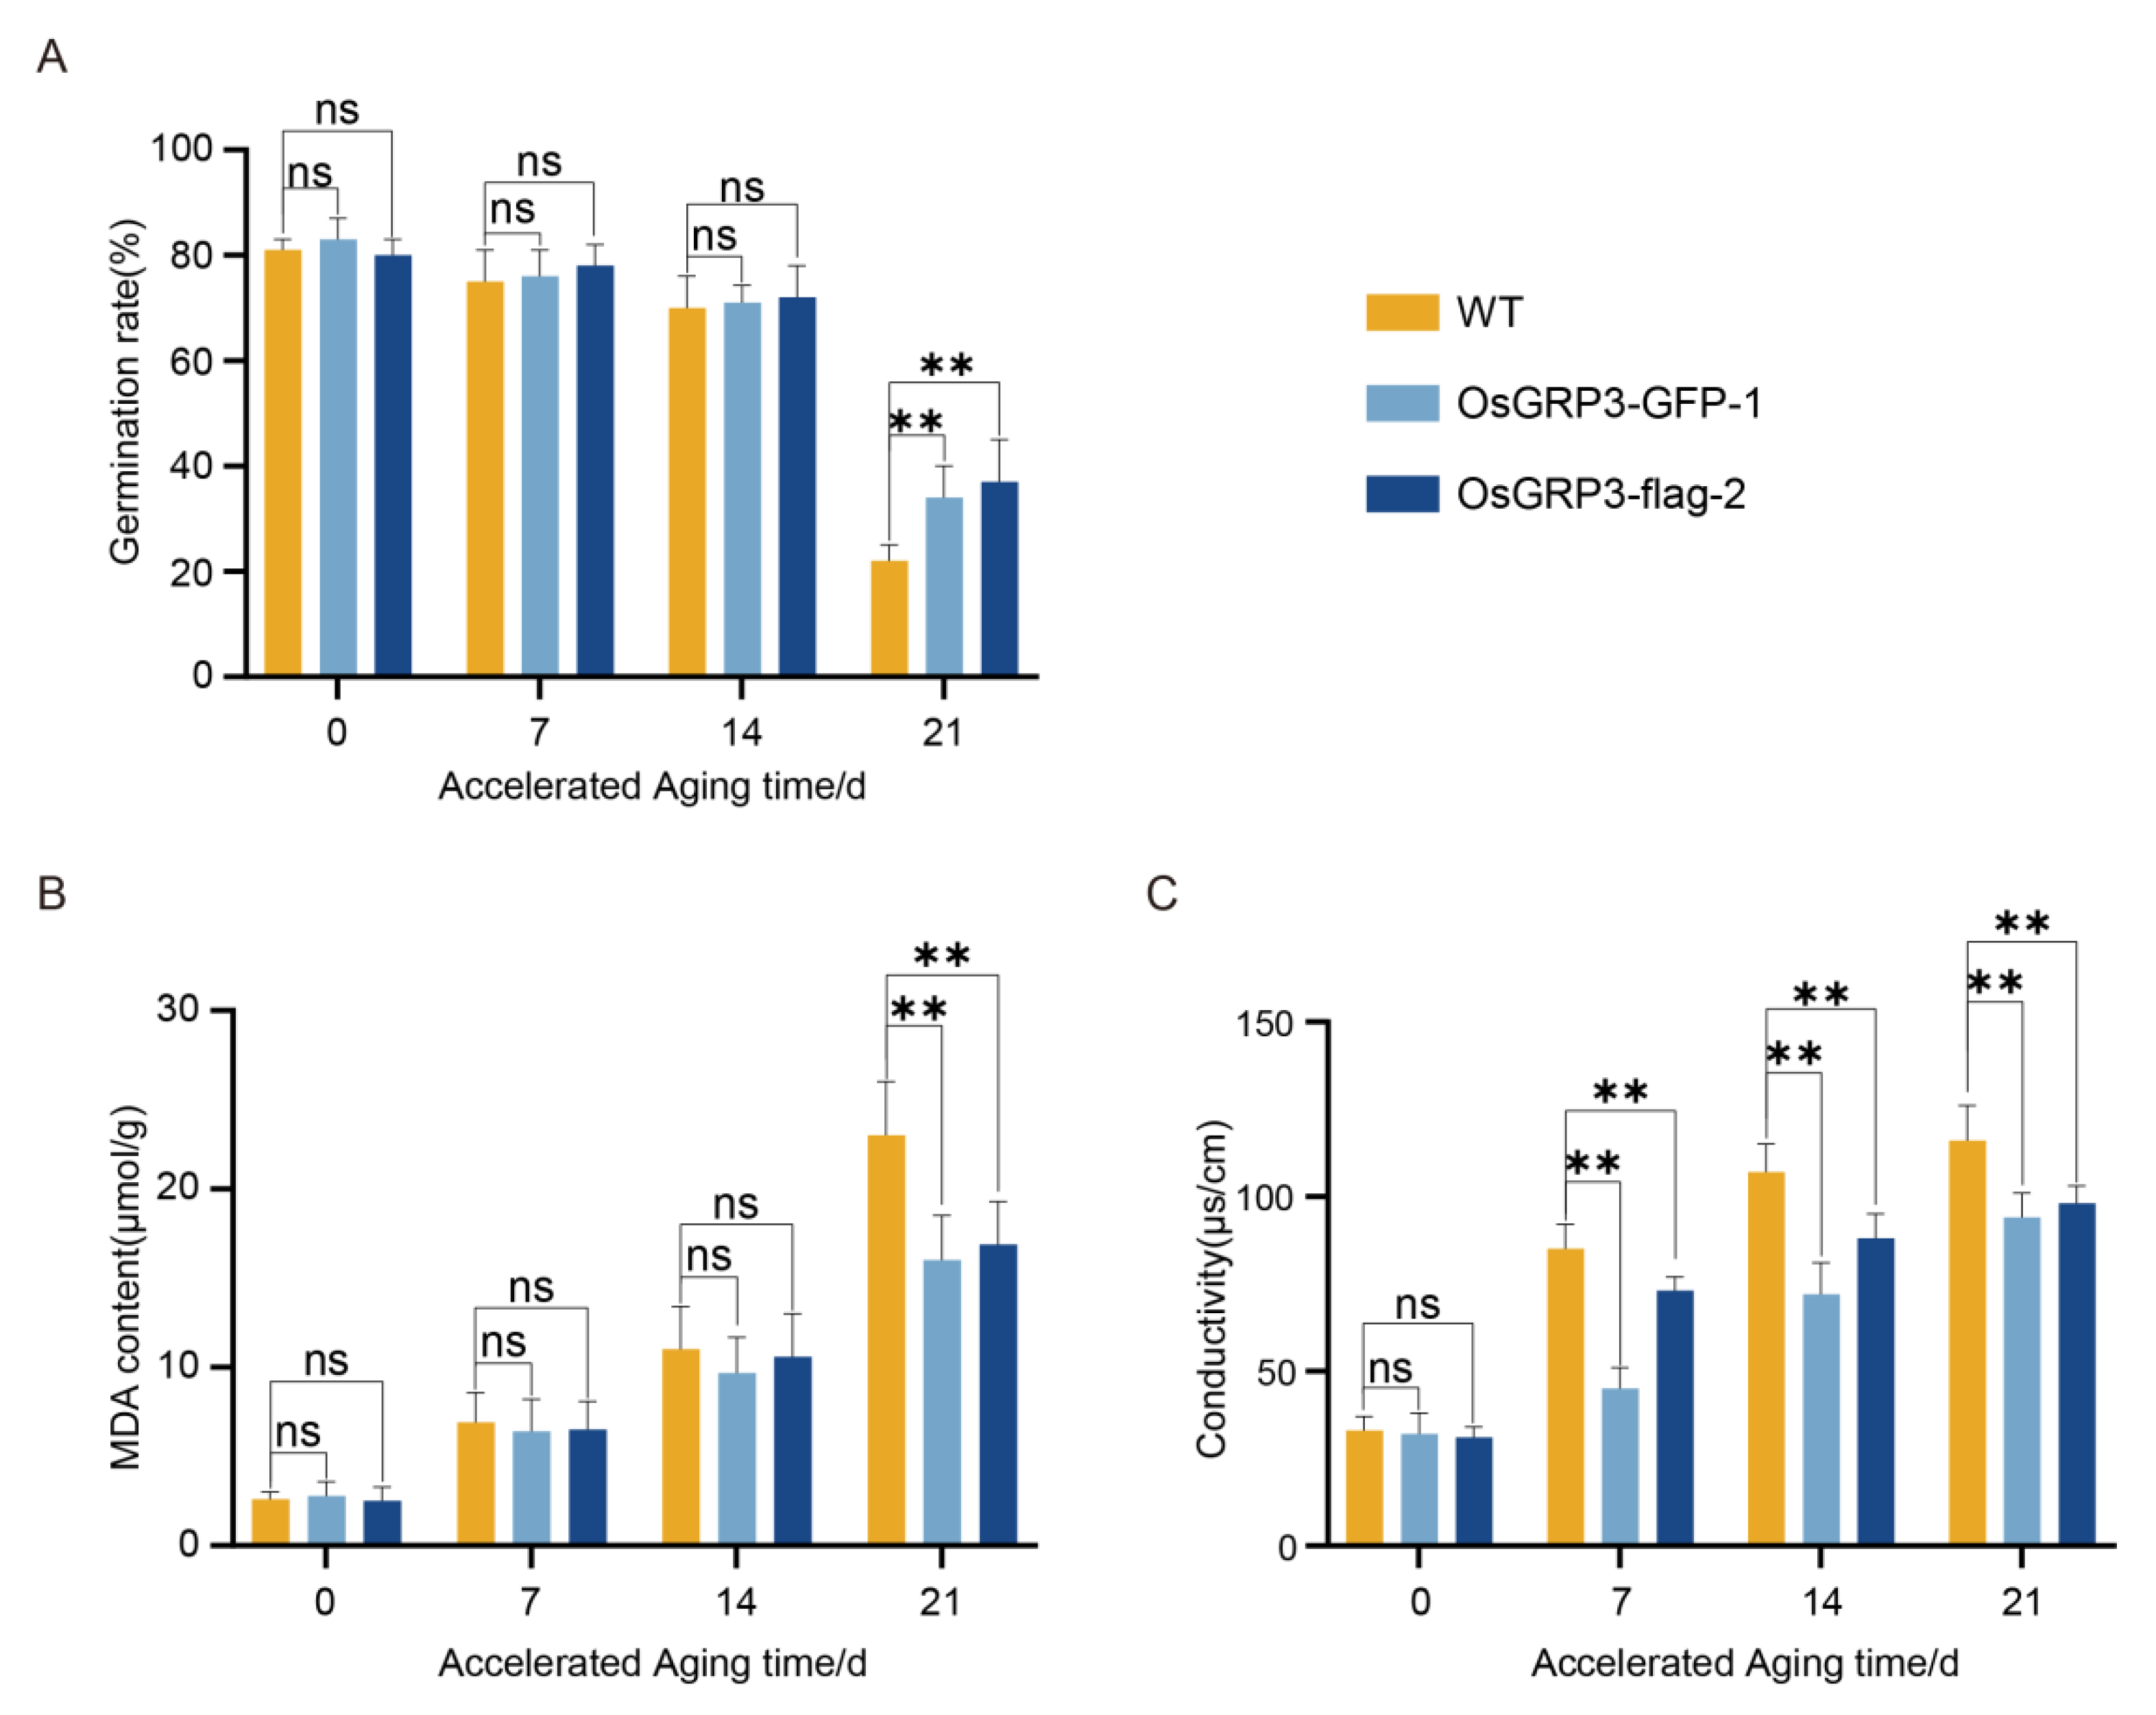
To investigate the sustained protective effect of OsGRP3 under long-term storage conditions, we further analyzed its temporal characteristics during a 21-day accelerated aging process. At the initial stage of aging (0 d), all genotypes showed similarly high germination rates, indicating comparable initial viability among the different lines. However, as the aging process progressed, genotypic differences gradually emerged: wild-type seeds displayed a continuous decline in germination capacity, with a significant reduction observed by day 21. In contrast, both OsGRP3-overexpression lines maintained higher germination levels even during the later stages of aging (Figure 4A), demonstrating their ability to sustainably preserve seed vigor.
Consistent with the germination phenotypes, further analysis of the physiological status of the seeds revealed the important role of OsGRP3 in mitigating aging-induced damage. Malondialdehyde (MDA), a key indicator of membrane lipid peroxidation [24], showed continuously increasing levels in wild-type seeds throughout the aging period, but remained relatively low in transgenic lines even at day 21 (Figure 4B). This result biochemically confirms that OsGRP3 overexpression effectively alleviates membrane lipid peroxidation damage caused by aging. Meanwhile, electrolyte leakage measurements, reflecting membrane integrity [25], demonstrated significantly lower rates in overexpression lines compared to wild-type during the entire aging process (Figure 4C), further supporting the crucial role of OsGRP3 in maintaining structural integrity of cell membranes. In summary, these results demonstrate that OsGRP3 enhances the germination of aged seeds while simultaneously mitigating aging-induced membrane damage and MDA accumulation.
Figure 4.
Effects of OsGRP3 overexpression on germination rate, malondialdehyde (MDA) content, and electrolyte leakage in rice seeds during accelerated aging. A, Germination rates of wild-type (WT), OsGRP3-GFP-1, and OsGRP3-flag-2 seeds after 0, 7, 14, and 21 days of accelerated aging. No significant differences (ns) were observed at 0, 7, and 14 days. After 21 days of aging, the germination rate of WT seeds was significantly lower than that of the OsGRP3-overexpression lines (**p < 0.01), indicating that OsGRP3 overexpression enhances the ability to germinate following prolonged accelerated aging (mean ± SD; n = 3 biological replicates). B, MDA content in WT, OsGRP3-GFP-1, and OsGRP3-flag-2 seeds during accelerated aging. MDA levels showed no significant differences at 0, 7, and 14 days. After 21 days, WT seeds accumulated significantly more MDA than the overexpression lines, demonstrating that OsGRP3 overexpression reduces oxidative damage and helps maintain membrane integrity under severe aging stress (mean ± SD; n = 3 biological replicates). C, Electrolyte leakage measurements in WT, OsGRP3-GFP-1, and OsGRP3-flag-2 seeds during accelerated aging. No significant difference was detected at day 0. However, after 7, 14, and 21 days of aging, WT seeds exhibited significantly higher electrolyte leakage compared to the OsGRP3-overexpression lines, providing further evidence that OsGRP3 overexpression enhances membrane stability and reduces cellular leakage during the aging process (mean ± SD; n = 3 biological replicates).
3.5. OsGRP3 Preserves the Cooking Quality of Rice After Storage
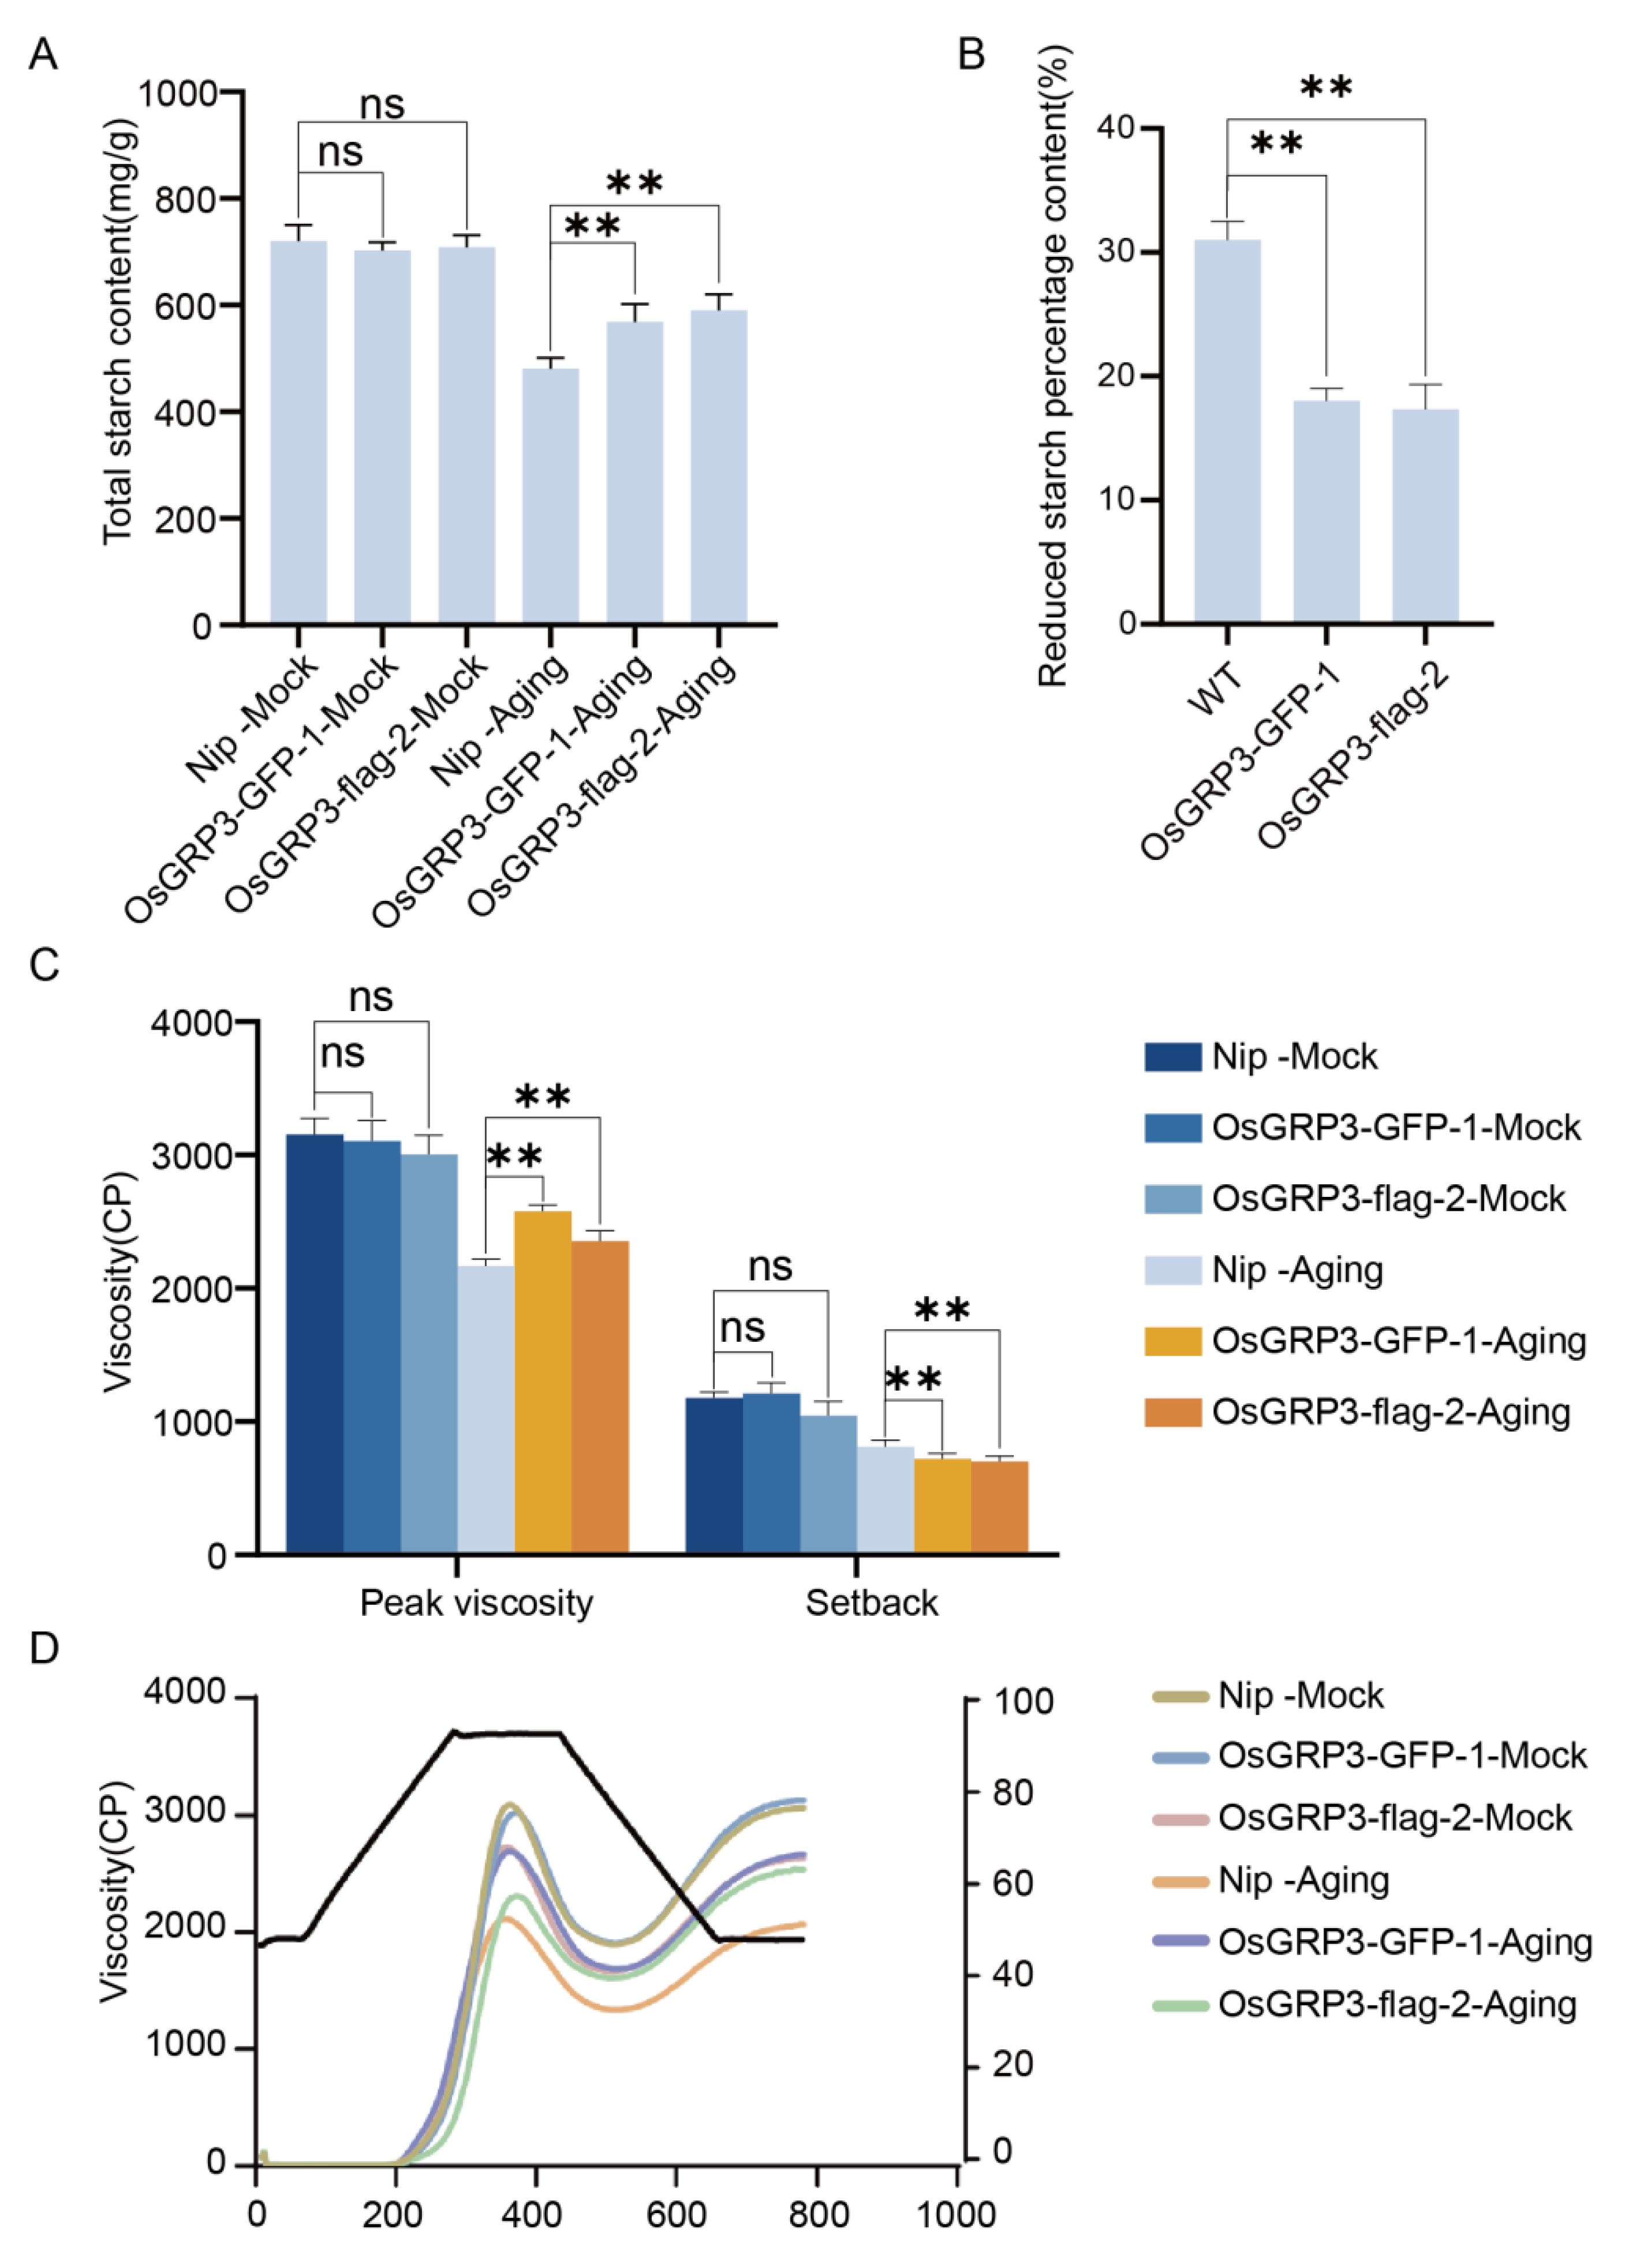
To investigate the effect of OsGRP3 on cooking quality after storage, we systematically analyzed its effects on starch content, structure, and functional properties during prolonged storage. Under normal conditions, no significant differences in total starch content were observed between wild-type Nip and the two OsGRP3 overexpression lines. However, after accelerated aging treatment, the transgenic lines exhibited significantly better retention of total starch content compared to wild-type (Figure 5A). Quantitative analysis revealed that the percentage reduction in total starch content after aging was significantly lower in both overexpression lines than in wild-type (Figure 5B), demonstrating enhanced starch preservation capacity in transgenic seeds under stress conditions. Analysis of starch pasting properties provided functional evidence supporting these findings. While all lines showed comparable peak viscosity and setback values under untreated conditions, the overexpression lines maintained significantly higher peak viscosity and lower setback values than wild-type after aging treatment (Figure 5C). The complete pasting curves clearly demonstrated that transgenic lines better preserved their viscosity characteristics under aging stress (Figure 5D). These results collectively demonstrate that OsGRP3 overexpression increases starch stability during storage.
3.6. OsGRP3 Overexpression Attenuates mRNA-Level Changes During Aging
To elucidate the function of OsGRP3 in rice seed development and aging response, we performed RNA-seq analysis on mature seeds of wild-type (Nip) and OsGRP3 overexpression lines. The experimental design included untreated control groups and 15-day artificial accelerated aging treatment groups, with three biological replicates per condition.
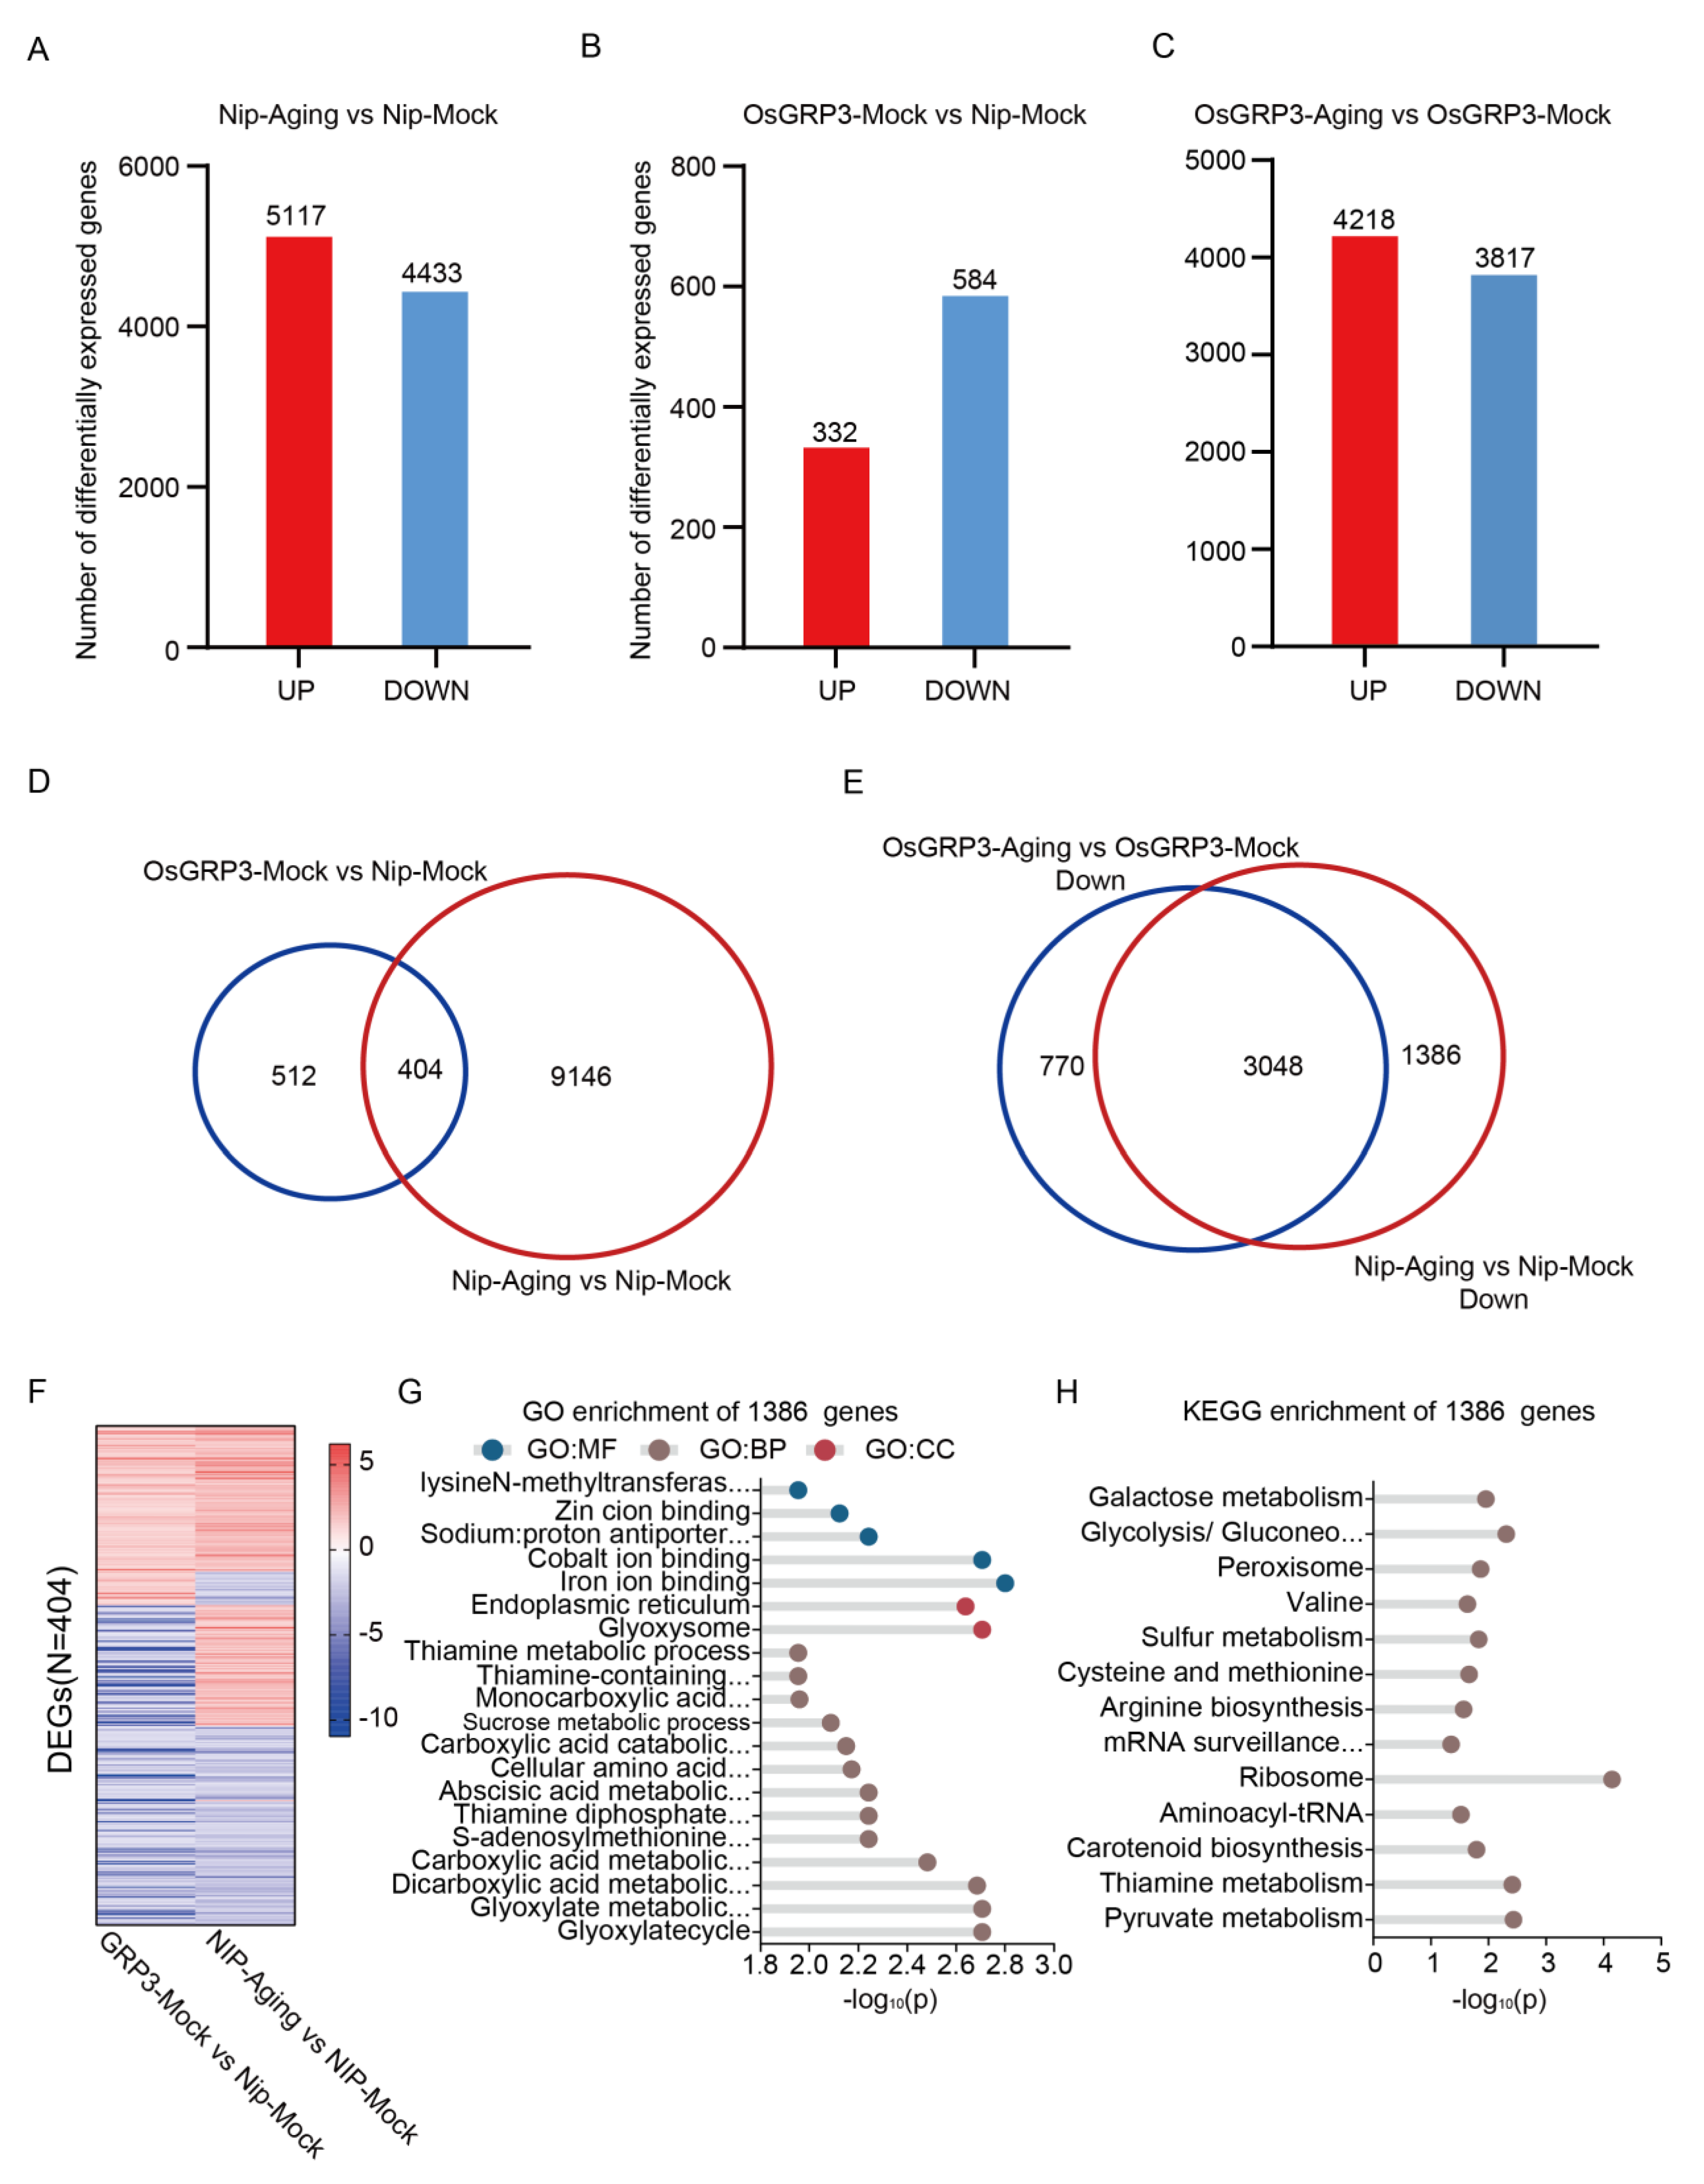
Principal component analysis (PCA) revealed tight clustering of biological replicates across all materials, both before and after aging, confirming high reproducibility of the transcriptome data (Figure S2). In wild-type seeds, aging stress induced extensive transcriptional reprogramming, with 5,117 genes up-regulated and 4,433 down-regulated (Figure 6A). Notably, even under non-stress conditions, OsGRP3 overexpression alone modulated the expression of 916 genes (332 up, 584 down; Figure 6B). Compared to wild-type, OsGRP3-overexpressing lines exhibited a more attenuated transcriptomic shift upon aging, with 4,218 genes up-regulated and 3,817 down-regulated (Figure 6C), suggesting that OsGRP3 mitigates mRNA instability during seed aging.
We further identified a significant overlap between the 916 genes differentially expressed in OsGRP3-overexpressing lines under non-stress conditions and those altered in aged Nipponbare seeds, with 404 genes common to both sets (Figure 6D). These overlapping genes were significantly enriched in key biological pathways such as DNA replication, gluconeogenesis, and essential amino acid metabolism (Figure S3). Their consistent expression patterns under both conditions (Figure 6F) indicate that OsGRP3 establishes a pre-adaptive molecular state in seeds, thereby enhancing their capacity to withstand subsequent aging stress.
Crucially, comparative analysis of downregulated genes revealed that a set of 1,386 genes exhibiting significant suppression in aged wild-type seeds were specifically preserved in aged OsGRP3 seeds (Figure 6E). Functional enrichment analysis demonstrated that these genes were strongly associated with fundamental processes including glycolysis/gluconeogenesis, peroxisome function, arginine biosynthesis, mRNA surveillance pathway, and pyruvate metabolism (Figure 6G, H). Transcripts related to glycolysis and pyruvate metabolism are essential for energy provision during early germination, whereas those involved in ribosome biogenesis and mRNA surveillance contribute to the stability of long-lived mRNAs. Additionally, pathways such as carotenoid biosynthesis and sulfur metabolism help mitigate oxidative damage. Collectively, our transcriptomic profiling indicates that OsGRP3 sustains seed vigor by attenuating excessive mRNA degradation while selectively preserving long-lived mRNAs that are critical for the initial stages of germination.
Figure 6.
Transcriptomic analysis of seed aging and OsGRP3 overexpression in rice. A, Number of differentially expressed genes (DEGs) (|log2FC| > 1, q < 0.01) between the Nip-Aging and Nip-Mock groups. Red and blue bars represent 5,117 up-regulated and 4,433 down-regulated genes, respectively, indicating that the aging treatment triggers extensive changes in the gene expression profile. B, Number of DEGs (|log2FC| > 1, q < 0.01) between the OsGRP3-Mock and Nip-Mock groups. Red and blue bars represent 332 up-regulated and 584 down-regulated genes, respectively, demonstrating that OsGRP3 overexpression itself alters the transcriptional landscape even in the absence of aging stress. C, Number of DEGs (|log2FC| > 1, q < 0.01) between the OsGRP3-Aging and OsGRP3-Mock groups. Red and blue bars represent 4218 up-regulated and 3817 down-regulated genes, respectively, reflecting the substantial transcriptional differences under both OsGRP3 overexpression and aging treatment. D, Venn diagram showing the overlap of DEGs between the OsGRP3-Mock vs. Nip-Mock comparison (blue circle) and the Nip-Aging vs. Nip-Mock comparison (red circle). The two sets share 404 common DEGs, with 512 unique to the OsGRP3-Mock group and 9,146 unique to the Nip-Aging group. E, Venn diagram showing the overlap of down-regulated DEGs between the OsGRP3-Aging vs. OsGRP3-Mock comparison (blue circle) and the Nip-Aging vs. Nip-Mock comparison (red circle). The two sets share 3048 common down-regulated genes, with 770 unique to the OsGRP3 group and 1386 unique to the Nip group, suggesting both conserved and specific aspects in the aging-associated down-regulated genes modulated by OsGRP3. F, Heatmap displaying the expression patterns of alternative splicing events for the 404 common DEGs identified in both the OsGRP3-Mock vs. Nip-Mock and Nip-Aging vs. Nip-Mock comparisons. The color gradient represents expression level differences, visually presenting the consistent expression patterns of these common DEGs under both conditions. G, GO enrichment analysis of the 1386 unique DEGs. Significantly enriched terms are presented from three categories: Molecular Function (GO:MF), Cellular Component (GO:CC), and Biological Process (GO:BP). The x-axis shows the -log10(P), where higher values indicate greater enrichment significance. H, KEGG pathway enrichment analysis of the 1,386 unique DEGs. The x-axis shows the -log10(P). The results reveal significant enrichment in pathways including Galactose metabolism, Glycolysis/Gluconeogenesis, and Ribosome, suggesting these pathways may play key roles in OsGRP3-mediated aging regulation.
4. Discussion
Our study reveals a conserved function for glycine-rich RNA-binding proteins (GRPs) in maintaining seed longevity across both monocot and dicot plants. We demonstrate that OsGRP3, the rice ortholog of Arabidopsis AtGRP7, positively regulates seed vigor through a multi-layered mechanism involving transcriptional pre-adaptation and post-transcriptional mRNA stabilization, and demonstrates the evolutionary importance of RNA-binding proteins in regulating plant seed aging [26,27].
We found that OsGRP3 coordinates a precise transcriptional program that prepares seeds for aging stress. This phenomenon resembles a “vaccination-like” effect, placing seeds in a state of readiness prior to actual stress exposure [28,29]. The identification of 404 differentially expressed genes responsive to both OsGRP3 overexpression and aging in wild-type seeds provides compelling evidence for the existence of a “pre-adaptive transcriptome” -a set of genes whose expression patterns are pre-configured by OsGRP3 to enhance stress preparedness. The enrichment of these genes in DNA replication, gluconeogenesis, and amino acid metabolic pathways indicates that OsGRP3 primes seeds by pre-activating essential metabolic and repair systems before stress onset [30,31].
Most importantly, we discovered that OsGRP3 specifically maintains the expression of 1,386 genes that are normally suppressed during aging in wild-type seeds. These genes, enriched in fundamental processes such as ribosome biogenesis, arginine biosynthesis, glycolysis/gluconeogenesis, represent the cellular machinery essential for seed resuscitation. Notably, its ortholog AtGRP7 has been shown to specifically recognize and bind the (UU/GCUGG) RNA motif [17]. Given the high conservation in the RNA-binding domain between OsGRP3 and AtGRP7, we propose that OsGRP3 likely binds these critical transcripts by recognizing similar cis-elements. Based on the conserved nature of these pathways as known targets of long-lived RNAs [32,33], combined with OsGRP3’s specific RNA-binding capability, we posit that OsGRP3 stabilizes these key transcripts, converting them into a protected mRNA reservoir that persists throughout seed storage. This mechanism ensures the immediate availability of translational machinery and metabolic enzymes upon imbibition, enabling rapid recovery after extended quiescence.
Reduced malondialdehyde accumulation and electrolyte leakage in OsGRP3 overexpression lines demonstrate enhanced membrane integrity maintenance [34,35] while preserved cooking quality and starch properties highlight the practical implications of our findings for grain storage. In conclusion, our work establishes OsGRP3 as a regulator in the seed aging response, operating through a dual mechanism of transcriptional pre-adaptation and post-transcriptional stabilization of key mRNAs. The maintenance of a long-lived RNA reservoir represents a sophisticated strategy for preserving seed viability during storage, offering both fundamental insights and potential applications for improving grain storability in agricultural contexts.
Supplementary Materials
The following supporting information can be downloaded at the website of this paper posted on Preprints.org.
Author Contributions
L. L. L. W conceived the project and designed research; D-X. W, N-B. Z, J-H. S, Y-Q, T performed research; C-Y. L contributed new reagents/analytic tools; L.W, D-X.W, N-B. Z wrote the paper; all authors reviewed and approved the manuscript for publication.
Acknowledgments
We would like to thank the Analytical Instrumentation Center of Hunan University. This work Supported by Guangdong Basic and Applied Basic Research Foundation (2024A1515012807), and the Open Research Fund of State Key Laboratory of Hybrid Rice (Hunan Hybrid Rice Research Center, 2025KF05).
Conflicts of Interest
The authors declare that there is no conflict of interest.
References
- Muthayya, S.; Sugimoto, J. D.; Montgomery, S.; Maberly, G. F., An overview of global rice production, supply, trade, and consumption. Ann Ny Acad Sci 2014, 1324, 7-14. [CrossRef]
- Tianshun, Z.; Dong, Y.; Liubing, W.; Yusheng, X.; Meijuan, D.; Dingyang, Y., Seed Storability in Rice: Physiological Foundations, Molecular Mechanisms, and Applications in Breeding. Rice Sci 2024, 31, 401-416. [CrossRef]
- Rajjou, L.; Duval, M.; Gallardo, K.; Catusse, J.; Bally, J.; Job, C.; Job, D., Seed Germination and Vigor. Annu Rev Plant Biol 2012, 63, 507-533.
- Shi, Y. M.; Zhao, G. C.; Dong, R. H.; Shi, J. X., Seed longevity in rice: Progress and prospects. Plant Sci 2025, 359,112651. [CrossRef]
- Powell, A. A.; Yule, L. J.; Jing, H. C.; Groot, S. P.; Bino, R. J.; Pritchard, H. W., The influence of aerated hydration seed treatment on seed longevity as assessed by the viability equations. Journal of experimental botany 2000, 51, 2031–2043. [CrossRef]
- Zhou, Y.; Zhou, S.; Wang, L.; Wu, D.; Cheng, H.; Du, X.; Mao, D.; Zhang, C.; Jiang, X., miR164c and miR168a regulate seed vigor in rice. Journal of integrative plant biology 2020, 62, 470-486.
- Hendry; George, A. F., Oxygen, free radical processes and seed longevity. Seed Science Research 1993, 3, 141-153.
- Waterworth, W. M.; Masnavi, G.; Bhardwaj, R. M.; Jiang, Q.; Bray, C. M.; West, C. E., A plant DNA ligase is an important determinant of seed longevity. The Plant journal : for cell and molecular biology 2010, 63 (5), 848-60. [CrossRef]
- Goel, A.; Sheoran, I., Lipid Peroxidation and Peroxide-Scavenging Enzymes in Cotton Seeds Under Natural Ageing. Biologia Plantarum 2003, 46, 429–434. [CrossRef]
- Kibinza, S.; Bazin, J.; Bailly, C.; Farrant, J. M.; Corbineau, F.; El-Maarouf-Bouteau, H., Catalase is a key enzyme in seed recovery from ageing during priming. Plant Sci 2011, 181 (3), 309-315. [CrossRef]
- Sajeev, N.; Bai, B.; Bentsink, L., Seeds: A Unique System to Study Translational Regulation. Trends Plant Sci 2019, 24, 487-495. [CrossRef]
- Qu, J. N.; Wang, M. L.; Liu, Z. M.; Jiang, S.; Xia, X. J.; Cao, J. Z.; Lin, Q. L.; Wang, L., Preliminary study on quality and storability of giant hybrid rice grain. J Cereal Sci 2020, 95, 103078. [CrossRef]
- Wang, B.; Wang, S.; Tang, Y.; Jiang, L.; He, W.; Lin, Q.; Yu, F.; Wang, L., Transcriptome-Wide Characterization of Seed Aging in Rice: Identification of Specific Long-Lived mRNAs for Seed Longevity. Frontiers in plant science 2022, 13, 857390. [CrossRef]
- Zhao, L.; Wang, S.; Fu, Y. B.; Wang, H., Arabidopsis Seed Stored mRNAs are Degraded Constantly over Aging Time, as Revealed by New Quantification Methods. Frontiers in plant science 2020, 10, 1764. [CrossRef]
- Wang, L.; Yang, T.; Wang, B.; Lin, Q.; Zhu, S.; Li, C.; Ma, Y.; Tang, J.; Xing, J.; Li, X.; Liao, H.; Staiger, D.; Hu, Z.; Yu, F., RALF1-FERONIA complex affects splicing dynamics to modulate stress responses and growth in plants. Sci Adv 2020, 6, eaaz1622. [CrossRef]
- Wang, L.; Xu, F.; Yu, F., Two environmental signal-driven RNA metabolic processes: Alternative splicing and translation. Plant Cell Environ 2023, 46, 718-732. [CrossRef]
- Xu, F.; Wang, L.; Li, Y.; Shi, J.; Staiger, D.; Yu, F., Phase separation of GRP7 facilitated by FERONIA-mediated phosphorylation inhibits mRNA translation to modulate plant temperature resilience. Molecular plant 2024, 17, 460-477. [CrossRef]
- Karimi, H. Z.; Baldrich, P.; Rutter, B. D.; Borniego, L.; Zajt, K. K.; Meyers, B. C.; Innes, R. W., Arabidopsis apoplastic fluid contains sRNA- and circular RNA-protein complexes that are located outside extracellular vesicles. The Plant cell 2022, 34, 1863-1881. [CrossRef]
- Sano, N.; Masaki, S.; Tanabata, T.; Yamada, T.; Hirasawa, T.; Kashiwagi, M.; Kanekatsu, M., RNA-binding proteins associated with desiccation during seed development in rice. Biotechnology letters 2013, 35, 1945-1952. [CrossRef]
- Jiang, L.; Xiao, W.; Chen, H.; Qi, Y.; Kuang, X.; Shi, J.; Liu, Z.; Cao, J.; Lin, Q.; Yu, F.; Wang, L., The OsGAPC1-OsSGL module negatively regulates salt tolerance by mediating abscisic acid biosynthesis in rice. The New phytologist 2024, 244, 825-839. [CrossRef]
- Sukkaew, N.; Kaewnaborn, J.; Soonsuwon, W.; Wongvarodom, V., Tetrazolium test for evaluating viability of stored rice (Oryza sativa) seeds. Seed Sci Technol 2023, 51, 97-109. [CrossRef]
- McCleary, B. V.; McLoughlin, C.; Charmier, L. M. J.; McGeough, P., Measurement of available carbohydrates, digestible, and resistant starch in food ingredients and products. Cereal Chemistry 2019, 97, 114-137. [CrossRef]
- Li, H.; Prakash, S.; Nicholson, T. M.; Fitzgerald, M. A.; Gilbert, R. G., Instrumental measurement of cooked rice texture by dynamic rheological testing and its relation to the fine structure of rice starch. Carbohydrate polymers 2016, 146, 253-263. [CrossRef]
- Apel, K.; Hirt, H., Reactive oxygen species: metabolism, oxidative stress, and signal transduction. Annu Rev Plant Biol 2004, 55, 373-399. [CrossRef]
- Bajji, M.; Kinet, J.-M.; Lutts, S., The use of the electrolyte leakage method for assessing cell membrane stability as a water stress tolerance test in durum wheat. Plant Growth Regulation 2002, 36, 61-70. [CrossRef]
- Huang, R.; Liu, M.; Gong, G.; Wu, P.; Patra, B.; Yuan, L.; Qin, H.; Wang, X.; Wang, G.; Liao, H.; Gao, L.; Yang, C.; Li, H.; Zhang, S., The Pumilio RNA-binding protein APUM24 regulates seed maturation by fine-tuning the BPM-WRI1 module in Arabidopsis. Journal of integrative plant biology 2021, 63, 1240-1259.
- Oishi, A.; Nakagawa, S.; Tamura, K., Nucleoporin 50 proteins affect longevity and salinity stress tolerance in seeds. J Exp Bot 2024, 75, 60-72. [CrossRef]
- Shim, J. S.; Park, S. H.; Lee, D. K.; Kim, Y. S.; Park, S. C.; Redillas, M.; Seo, J. S.; Kim, J. K., The Rice GLYCINE-RICH PROTEIN 3 Confers Drought Tolerance by Regulating mRNA Stability of ROS Scavenging-Related Genes. Rice 2021, 14, 31-49. [CrossRef]
- Xu, W.; Dou, Y.; Geng, H.; Fu, J.; Dan, Z.; Liang, T.; Cheng, M.; Zhao, W.; Zeng, Y.; Hu, Z.; Huang, W., OsGRP3 Enhances Drought Resistance by Altering Phenylpropanoid Biosynthesis Pathway in Rice (Oryza sativa L.). International journal of molecular sciences 2022, 23, 7045-7061. [CrossRef]
- Cheng, M. C.; Ko, K.; Chang, W. L.; Kuo, W. C.; Chen, G. H.; Lin, T. P., Increased glutathione contributes to stress tolerance and global translational changes in Arabidopsis. The Plant journal : for cell and molecular biology 2015, 83, 926-939. [CrossRef]
- Emri, T.; Pocsi, I.; Szentirmai, A., Glutathione metabolism and protection against oxidative stress caused by peroxides in Penicillium chrysogenum. Free radical biology & medicine 1997, 23, 809-814. [CrossRef]
- Sorenson, R.; Bailey-Serres, J., Selective mRNA sequestration by OLIGOURIDYLATE-BINDING PROTEIN 1 contributes to translational control during hypoxia in Arabidopsis. Proceedings of the National Academy of Sciences of the United States of America 2014, 111, 2373-2378. [CrossRef]
- Hollams, E. M.; Giles, K. M.; Thomson, A. M.; Leedman, P. J., mRNA stability and the control of gene expression: Implications for human disease. Neurochem Res 2002, 27, 957-980. [CrossRef]
- Bailly, C.; Audigier, C.; Ladonne, F.; Wagner, M. H.; Coste, F.; Corbineau, F.; Côme, D., Changes in oligosaccharide content and antioxidant enzyme activities in developing bean seeds as related to acquisition of drying tolerance and seed quality. J Exp Bot 2001, 52, 701-708. [CrossRef]
- Devaiah, S. P.; Pan, X.; Hong, Y.; Roth, M.; Welti, R.; Wang, X., Enhancing seed quality and viability by suppressing phospholipase D in Arabidopsis. The Plant journal : for cell and molecular biology 2007, 50, 950-957. [CrossRef]
Figure 1.
AtGRP7 modulates seed germination and aging tolerance in Arabidopsis. A, Phenotypic observation of seed germination in Col-0, AtGRP7-OE (AtGRP7-overexpression), and atgrp7 lines after 0 and 3 days of artificial aging. The images visually compare the germination progression and potential phenotypic differences among the genotypes under aging stress. B, Dynamic changes in germination rates of Col-0, AtGRP7-OE, and atgrp7 seeds without prior aging (0-day aging). The kinetics reveal the intrinsic role of AtGRP7 in regulating germination vigor under non-stress conditions(mean ± SD; n = 3 biological replicates). C, Germination rate dynamics of Col-0, AtGRP7-OE, and atgrp7 seeds following 3 days of aging. The comparative analysis highlights the impact of AtGRP7 expression levels on germination efficiency under moderate aging stress. D, Germination rate dynamics of Col-0, AtGRP7-OE, and atgrp7 seeds after 9 days of severe aging. The data demonstrate the critical function of AtGRP7 in enhancing seed longevity and maintaining germination capacity under prolonged aging treatment.
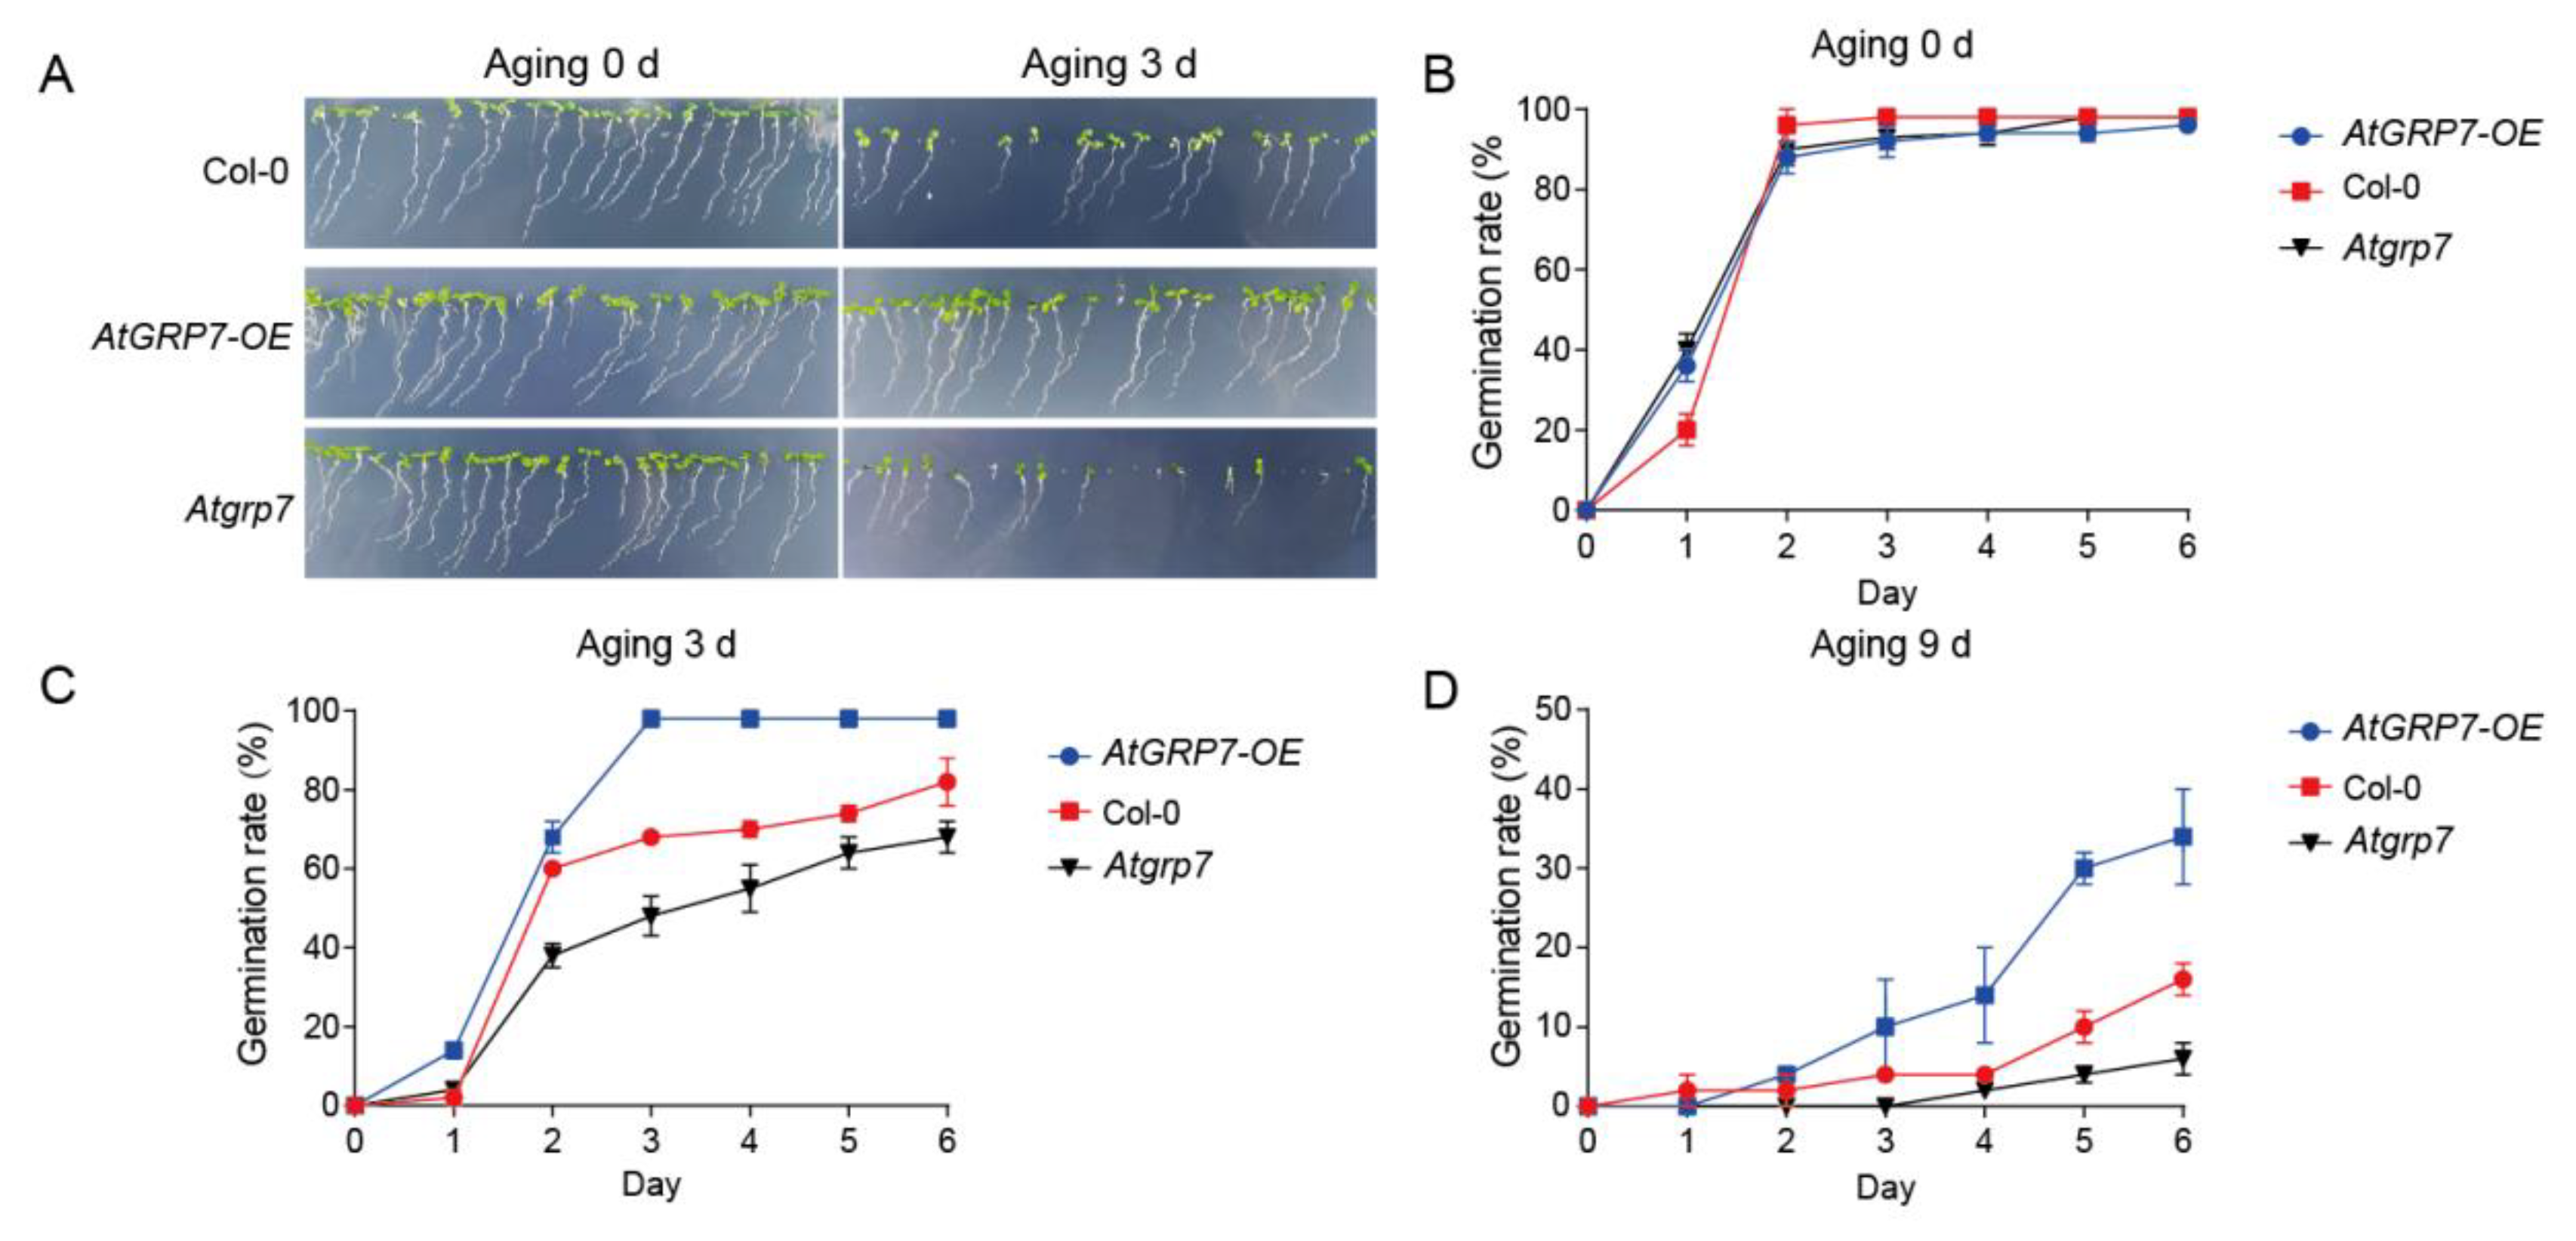
Figure 3.
Overexpression of OsGRP3 enhances seed aging tolerance in rice. A, Germination phenotypes of wild-type (WT), OsGRP3-GFP-1, and OsGRP3-flag-2 seeds under non-aged (Mock) and 20-day artificial aging conditions. Following aging, WT seeds exhibit significantly reduced and uneven germination, while OsGRP3-overexpression lines maintain high germination uniformity, indicating that OsGRP3 overexpression improves the ability to germinate after aging. B, Dynamic daily germination rates of WT, OsGRP3-GFP-1, and OsGRP3-flag-2 seeds without aging (Mock). All genotypes show a rapid increase and sustained high germination rate, indicating no significant difference in germination capacity under normal storage conditionss (mean ± SD; n = 3 biological replicates). C, Dynamic daily germination rates of WT, OsGRP3-GFP-1, and OsGRP3-flag-2 seeds after 20 days of artificial aging. WT seeds display a significantly lower final germination percentage and a slower germination rate compared to the OsGRP3-overexpression lines, quantitatively verifying that OsGRP3 overexpression enhances seed germination vigor after aging (mean ± SD; n = 3 biological replicates). D, TTC staining phenotypes of WT, OsGRP3-GFP-1, and OsGRP3-flag-2 seeds under non-aged (Mock) and 20-day artificial aging conditions. While all genotypes show strong red staining (high viability) when non-aged, aged WT seeds exhibit extensive color loss (viability loss), whereas the OsGRP3-overexpression lines retain substantial red staining, demonstrating that OsGRP3 overexpression enhances seed aging tolerance at the level of seed viability.
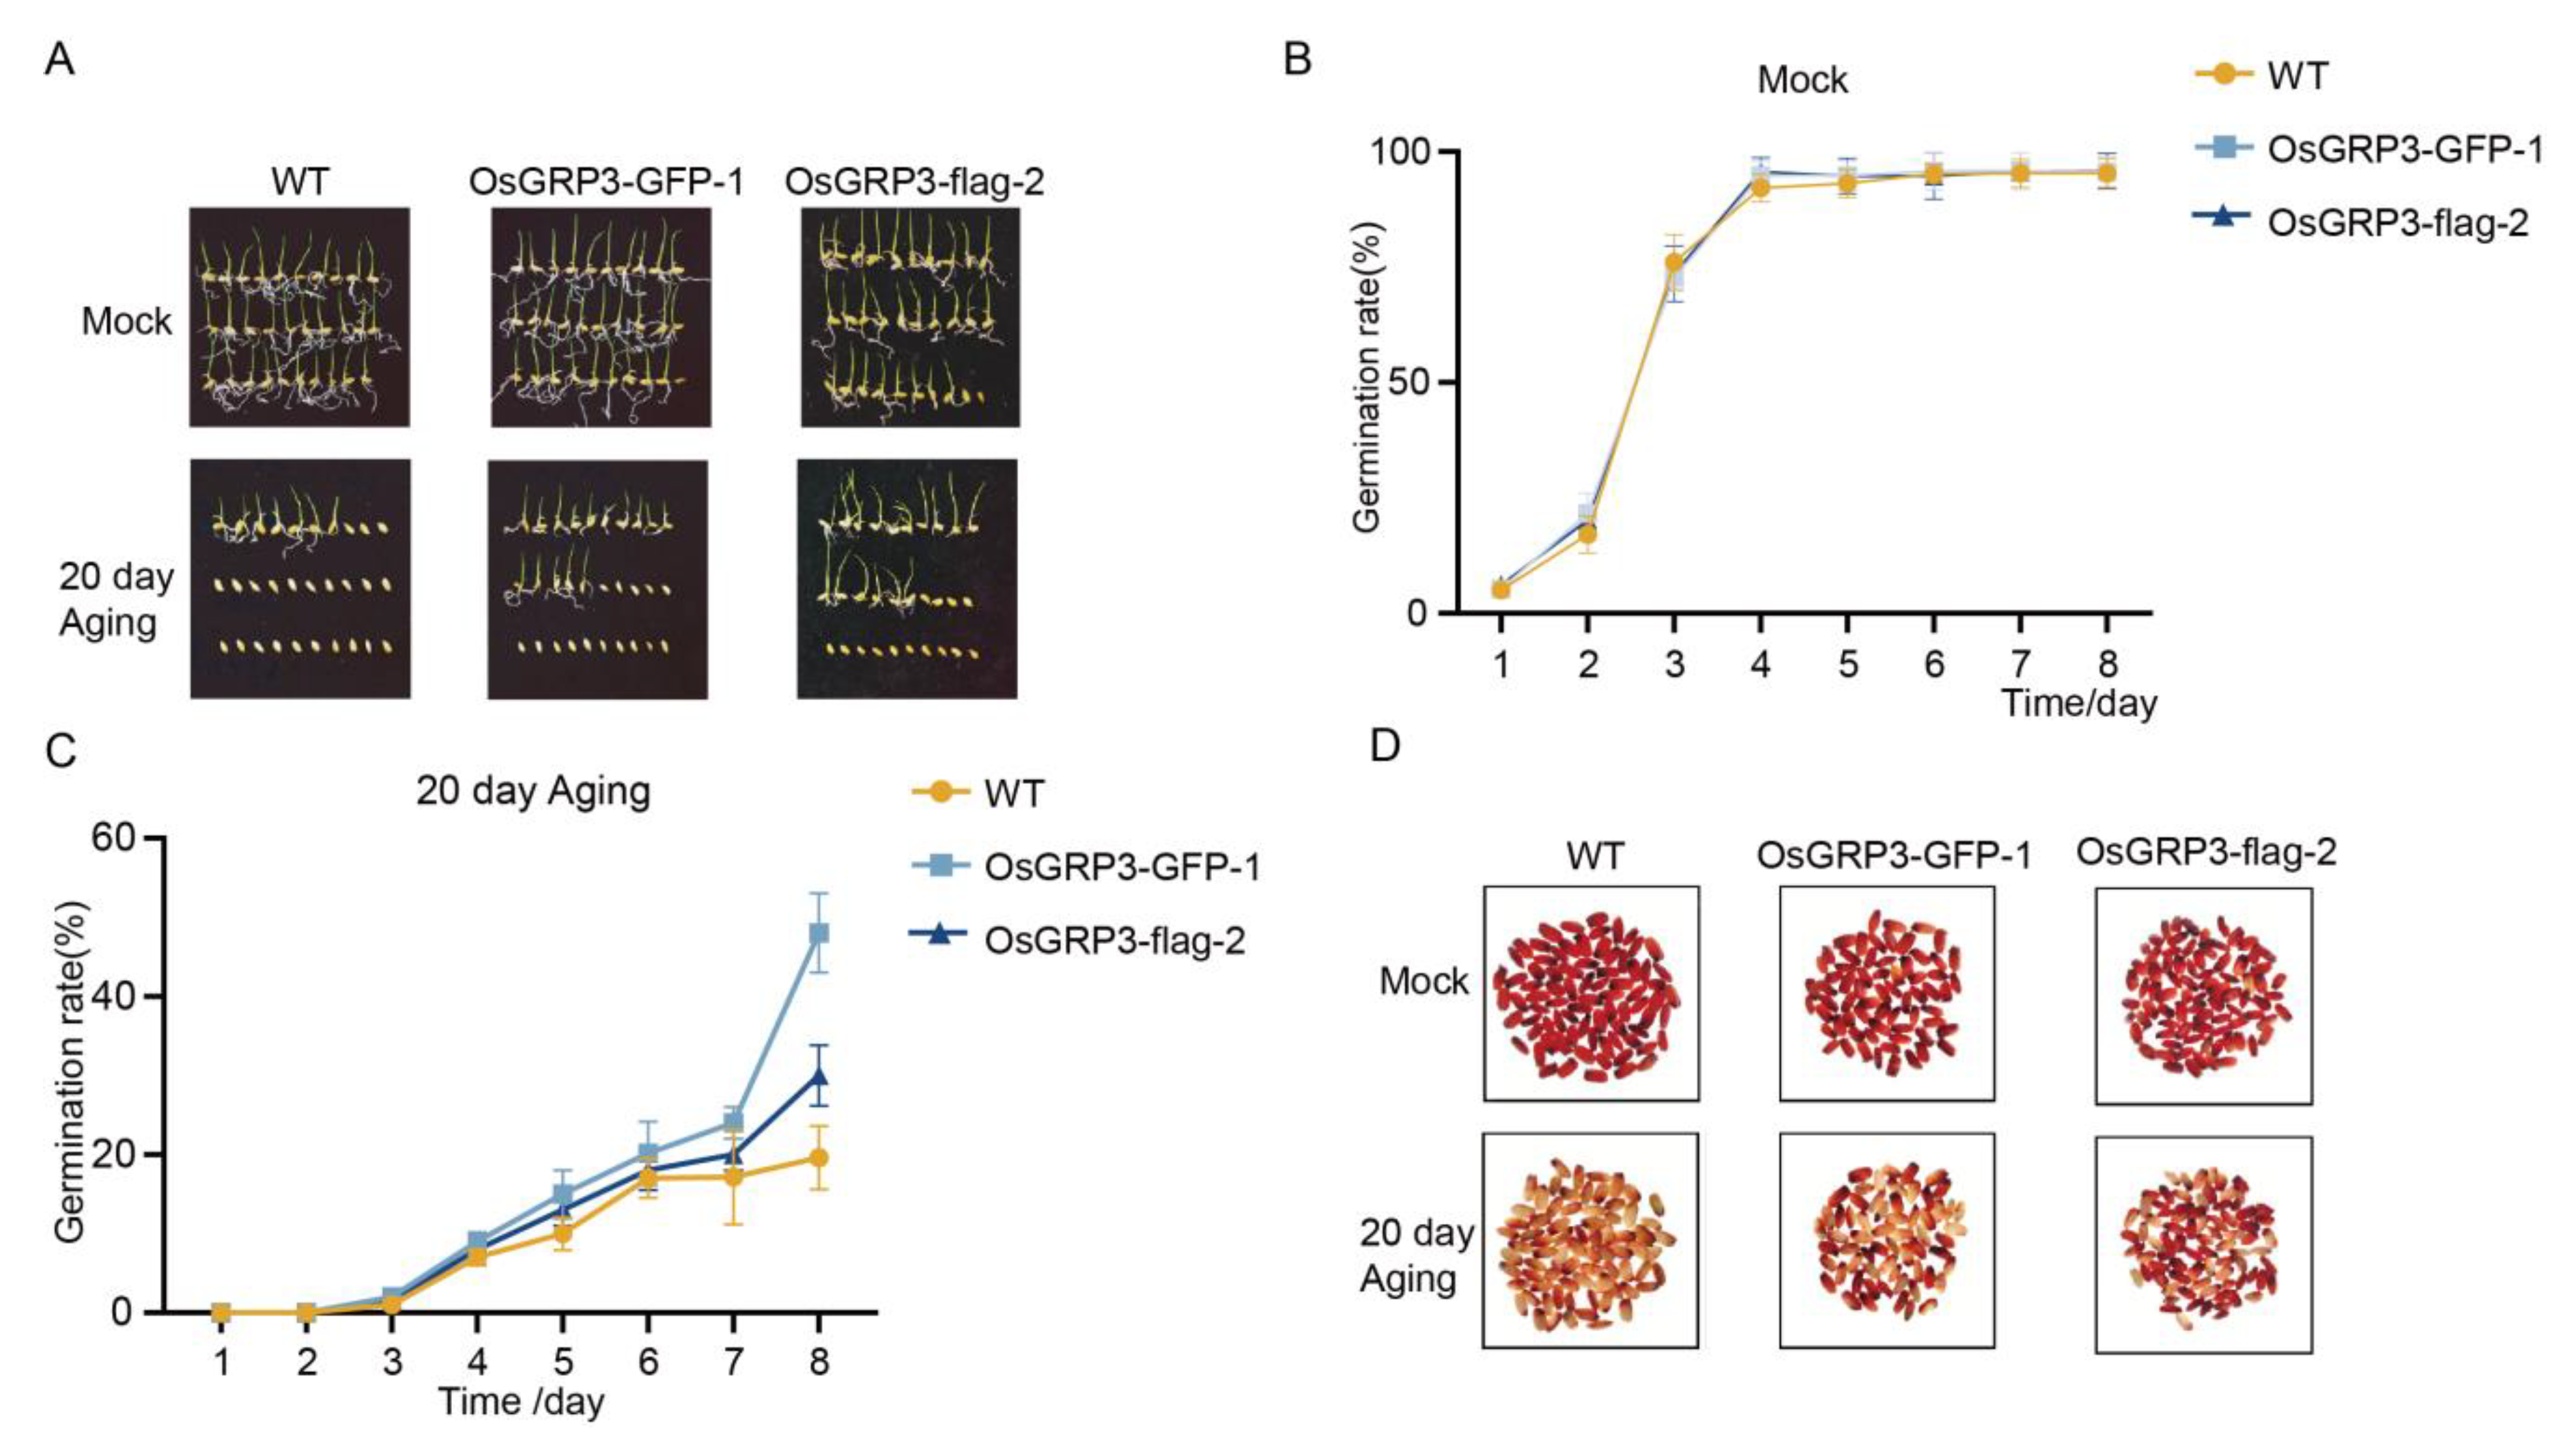
Figure 5.
Effects of OsGRP3 overexpression on starch content, starch reduction percentage, and pasting properties in rice seeds. A, Total starch content in Nip, OsGRP3-GFP-1, and OsGRP3-flag-2 seeds under non-aged (Mock) and aged conditions. No significant difference (ns) was observed among the genotypes under non-aged conditions. After aging, the total starch content of Nip was significantly lower than that of the OsGRP3-overexpression lines (**p < 0.01), indicating that OsGRP3 overexpression helps maintain starch content in aged seeds (mean ± SD; n = 3 biological replicates). B, Statistical analysis of the reduced starch percentage in Nip, OsGRP3-GFP-1, and OsGRP3-flag-2 seeds. The OsGRP3-overexpression lines showed a significantly lower percentage of starch reduction compared to Nip (**p < 0.01), suggesting that OsGRP3 overexpression attenuates the starch degradation process (mean ± SD; n = 3 biological replicates). C, Pasting properties (Peak Viscosity and Setback Value) of starch from Nip, OsGRP3-GFP-1, and OsGRP3-flag-2 seeds under non-aged (Mock) and aged conditions. Under non-aged conditions, the peak viscosity of overexpression lines showed no significant difference from Nip, whereas after aging, Nip exhibited a significantly lower peak viscosity. For the setback value, no significant differences were found under non-aged conditions, but after aging, Nip had a significantly higher setback value than the OsGRP3-overexpression lines (**p < 0.01, ns: not significant), demonstrating that OsGRP3 overexpression improves the starch pasting properties of aged seeds (mean ± SD; n = 3 biological replicates). D, Pasting viscosity curves of starch from Nip, OsGRP3-GFP-1, and OsGRP3-flag-2 seeds under non-aged (Mock) and aged conditions. The curves visually present the dynamic differences in starch pasting characteristics among the different genotypes.
Disclaimer/Publisher’s Note: The statements, opinions and data contained in all publications are solely those of the individual author(s) and contributor(s) and not of MDPI and/or the editor(s). MDPI and/or the editor(s) disclaim responsibility for any injury to people or property resulting from any ideas, methods, instructions or products referred to in the content. |
© 2025 by the authors. Licensee MDPI, Basel, Switzerland. This article is an open access article distributed under the terms and conditions of the Creative Commons Attribution (CC BY) license (http://creativecommons.org/licenses/by/4.0/).
Copyright: This open access article is published under a Creative Commons CC BY 4.0 license, which permit the free download, distribution, and reuse, provided that the author and preprint are cited in any reuse.


