
Submitted:
11 November 2025
Posted:
13 November 2025
You are already at the latest version
Abstract
Urban Air Mobility (UAM) promises to reduce ground-traffic and journey times by using electric vertical take-off and landing (eVTOL) aircraft for short, low-altitude flights, especially in urban environments. However, low-flying aircraft are at particularly high risk of collisions with wildlife, such as bird strikes. This study builds on previous research into UAM collision avoidance systems (UAM-CAS) by implementing one such system into the BlueSky open-source air traffic simulator and evaluating its efficacy in reducing bird strikes. Several modifications were made to the original UAM-CAS framework to improve performance. Realistic UAM flight plans were developed and combined with real-world bird movement datasets from all seasons, recorded by an avian radar at Leeuwarden Air Base. Fast-time simulations were conducted in the BlueSky Open Air Traffic Simulator using the UAM flight plan, the bird datasets, and the UAM-CAS algorithm. Results demonstrated that the UAM-CAS reduced bird strikes by 62%, with an average delay per flight of 15s. However, a small number of flights faced substantially longer delays, indicating some operational impacts. Based on the findings, specific avenues for future research to improve UAM-CAS performance are suggested.
Keywords:
air taxi
; bird strike
; collision avoidance system
; conflict detection & resolution
; eVTOL
; fast-time simulation
; urban air mobility
; wildlife strike
1. Introduction
Urban Air Mobility (UAM) is emerging as a promising new method of transportation, whereby electric vertical take-off and landing (eVTOL) aircraft provide services such as air taxis and medical transportation in urban areas. Several companies have secured $100M’s of funding [1,2,3], and are making progress towards regulatory type certification for their UAM aircraft [4,5]. While offering potential benefits such as reduced ground congestion and faster transit times [6], there is reason for concern regarding the risk of wildlife strikes with UAM aircraft [7,8].
Operating altitudes of UAM aircraft are expected to be no more than above ground level (AGL) [9]. Wildlife strikes, and more specifically, bird strikes in commercial aviation are more likely at lower altitudes (more than 95% of aircraft collisions with animals involve birds). Figure 1 shows that, from 1990 to 2023 in the United States, 91% of bird strikes in commercial aviation occurred at or below 3500 ft altitude AGL [10]. Furthermore, birds are more likely to initiate escape responses to louder and larger incoming aircraft [11]. UAM aircraft are quieter and smaller than conventional aircraft, so birds are less likely to initiate adequate escape responses, further increasing strike probability.
In addition, the regulatory requirements for bird impact resistance of UAM aircraft, stipulated by the European Aviation Safety Agency (EASA) [12], is lower than that of fixed-wing aircraft and many bird species exceed these proposed requirements [8]. Therefore, the outcome of a strike is more likely to cause damage if not critical failure. In the context of UAM operations, there is an increased risk to people and infrastructure on the ground should a critical bird strike occur [13]. These two factors suggest even further increased bird strike risk, compared to current commercial transport aircraft, caused by an increase in both the likelihood and severity of bird strikes. Hence, for UAM to become operationally viable and safe, bird strike risk must be reduced.
Wildlife Hazard Management (WHM) as required by the Civil Aviation Authorities (CAAs) [14] is targeted at reducing wildlife hazards at aerodromes. While this has been demonstrated to successfully reduce strikes within aerodrome boundaries, the numbers of strikes are still increasing beyond the aerodrome fence due to missing off-aerodrome measures [15]. This is especially critical in the context of UAM operations. UAM will involve numerous, dispersed vertiports with flight paths traversing urban areas between them. Relying solely on mitigative bird control measures for such widespread operations would be an unreasonable burden. Therefore, sufficient reduction in UAM bird strike risk will likely necessitate a combination of strategies, including mitigative bird control measures around vertiports, but also real-time detection and avoidance systems between UAM aircraft and birds such as those outlined in [7,8]. This study focuses on this latter method of reducing bird strike risk for UAM aircraft.
Previous research [16] proposed a concept for a UAM Collision Avoidance System (UAM-CAS), which extends concepts for conventional conflict detection and resolution with non-cooperative airspace users [17] by considering birds as potential Non-Cooperative Airspace Members (NCOAMs). It features a hierarchical, rules-based approach with concentric envelopes around the UAM aircraft, which are dynamically calculated depending on the relative speed between the UAM aircraft and a bird. The presence of birds in these envelopes results in delayed take-offs in a strategic pre-flight phase, automated avoidance actions in a tactical phase during flight and requests for the pilot to take over as an emergency response, should the automation fail to resolve the conflict. In [16], the open air traffic simulator BlueSky [18] was used to simulate a UAM flight plan with intruders manually placed at set positions along the route. Their results demonstrated substantially increased separation between the UAM aircraft and NCOAMs, with bearable airborne time delays typically under 10 % of total flight time.
Our study builds upon [16] by enhancing the existing BlueSky UAM-CAS implementation to work with any flight plan in any geographic location. The aim is to study the collision-prevention efficacy of the UAM-CAS concept for a realistic UAM air taxi flight plan in combination with real-world bird data collected by avian radar.
Section 2 describes the methods used in this study, including the simulation environment, bird dataset, flight plan and UAM-CAS implementation. Section 3 presents and discusses results, covering validation against historical strike trends, effects of UAM-CAS on envelope incursion rates and delays. Section 4 concludes with key findings, limitations and directions for future work.
2. Methods
2.1. Simulation Environment: BlueSky
BlueSky is an Open data Air Traffic Simulator tool [18], which served as the simulation platform for this study. BlueSky is open-source, Python-based and designed for modularity, allowing for the development and integration of custom modules. It has previously been enhanced with modules to represent bird movement and to detect collisions between aircraft and birds [19]. Its existing capabilities for simulating air traffic, and its previous use in bird strike research [16,19,20] made it a compelling choice. The existing implementation of UAM-CAS, which consisted of a hardcoded flight plan and manually positioned intruders, was rewritten. A key high-level addition to its functionality is the ability to work with large bird dataset input files, which can contain bird movement data at any geographic location. Further changes to UAM-CAS in this study are discussed in Section 2.3.
2.2. Bird Dataset and Flight Plan
For this study, a large real-world bird movement dataset was available. This consists of data sourced from a Robin MAX avian radar at Leeuwarden Air Base, the Netherlands [21]. The radar provides three-dimensional tracks for identified targets which were filtered for the classifications of small, medium and large birds as well as flocks, each with at least 20 recorded positions, as described in [20]. The data was then transferred into the format of a so called Bird Movement Plan (BMP), which are CSV files that serve as input to the fast-time simulation in BlueSky. Each line of a BMP represents data on one recorded bird or flock. The data consists of time, bird id, latitude, longitude, altitude, weight category, flock or individual bird, number of birds, heading, speed, as well as a second bird id. A difference in the two IDs indicates the end of the track. Therefore, detections belonging to the same bird/flock can be reconstructed into a track from the data.
It was found that some bird detections show high-speed and/or uncharacteristic bird behaviour. Birds with vertical speed exceeding 5 / or horizontal speed exceeding 20 / were not considered for avoidance manoeuvres, due to the complexity of avoidance for such birds. Such birds will be performing rare high-speed dives or other erratic behaviour, and such speeds are rare for birds in the European region [22]. Avoidance for these birds can be considered in future work, and is discussed further in Section 4.2
To represent bird movement across all seasons, one dataset of one week per month of the year 2023 was selected. For each month, weeks with lowest average rainfall as reported by the Royal Netherlands Meteorological Institute (KNMI) [23] were selected to maximise the radar’s detection capabilities. Due to increased rainfall in July, two weeks of June were selected instead to obtain a complete the dataset of 12 weeks, or 84 days. Figure 2 shows the spatial distribution of one of these BMPs.
As seen in Figure 2, there is a central concentration of bird data which becomes more sparse as distance from the radar increases, which is in line with the weakening of the radar signal with increasing distance. There is a missing region of data to the South-East; this is due to an antenna obstructing the radar, so the radar was switched off in the corresponding azimuthal directions (Hans van Gasteren, personal communication, 17 October 2025). In addition, there are radial directions seen in Figure 2, for which the minimum altitude of detected birds is substantially higher than all other directions. It was verified that these shadowing observations are consistent across all 84 BMPs.
To ensure a realistic UAM flight profile, an air taxi route was developed for real-life applicability of the study, with the aim of routing the route through areas of the bird dataset containing adequate bird coverage - that is, avoiding regions of radar shadowing and passing near the centre of the radar where coverage is known to be higher. Since Leeuwarden Air Base is a military air base, a civil air taxi service may be unrealistic in this area. As such, a real-world use case between Eindhoven Airport and Eindhoven Central Railway Station, also in the Netherlands, was developed, with the route designed to follow transport corridors and avoid densely populated areas, consistent with social acceptance guidelines [24]. The 2D top-down view of the Eindhoven flight plan is shown in Figure 3. The altitude profile is set with a cruise altitude of 300 , with 60 % of the flight at cruise and with a linear ascent and descent.
In order to use the Eindhoven flight plan in conjunction with the Leeuwarden bird dataset, the flight plan coordinates were transferred, yielding a new set of translated coordinates. To perform this translation, an Equirectangular approximation method was used, the details of which are described in Appendix A. In the end, this method of translation resulted in a very small error in flight plan ground length of around between the Eindhoven and Leeuwarden flight plans, which, for the original ground length, represents a negligible deviation of approximately .
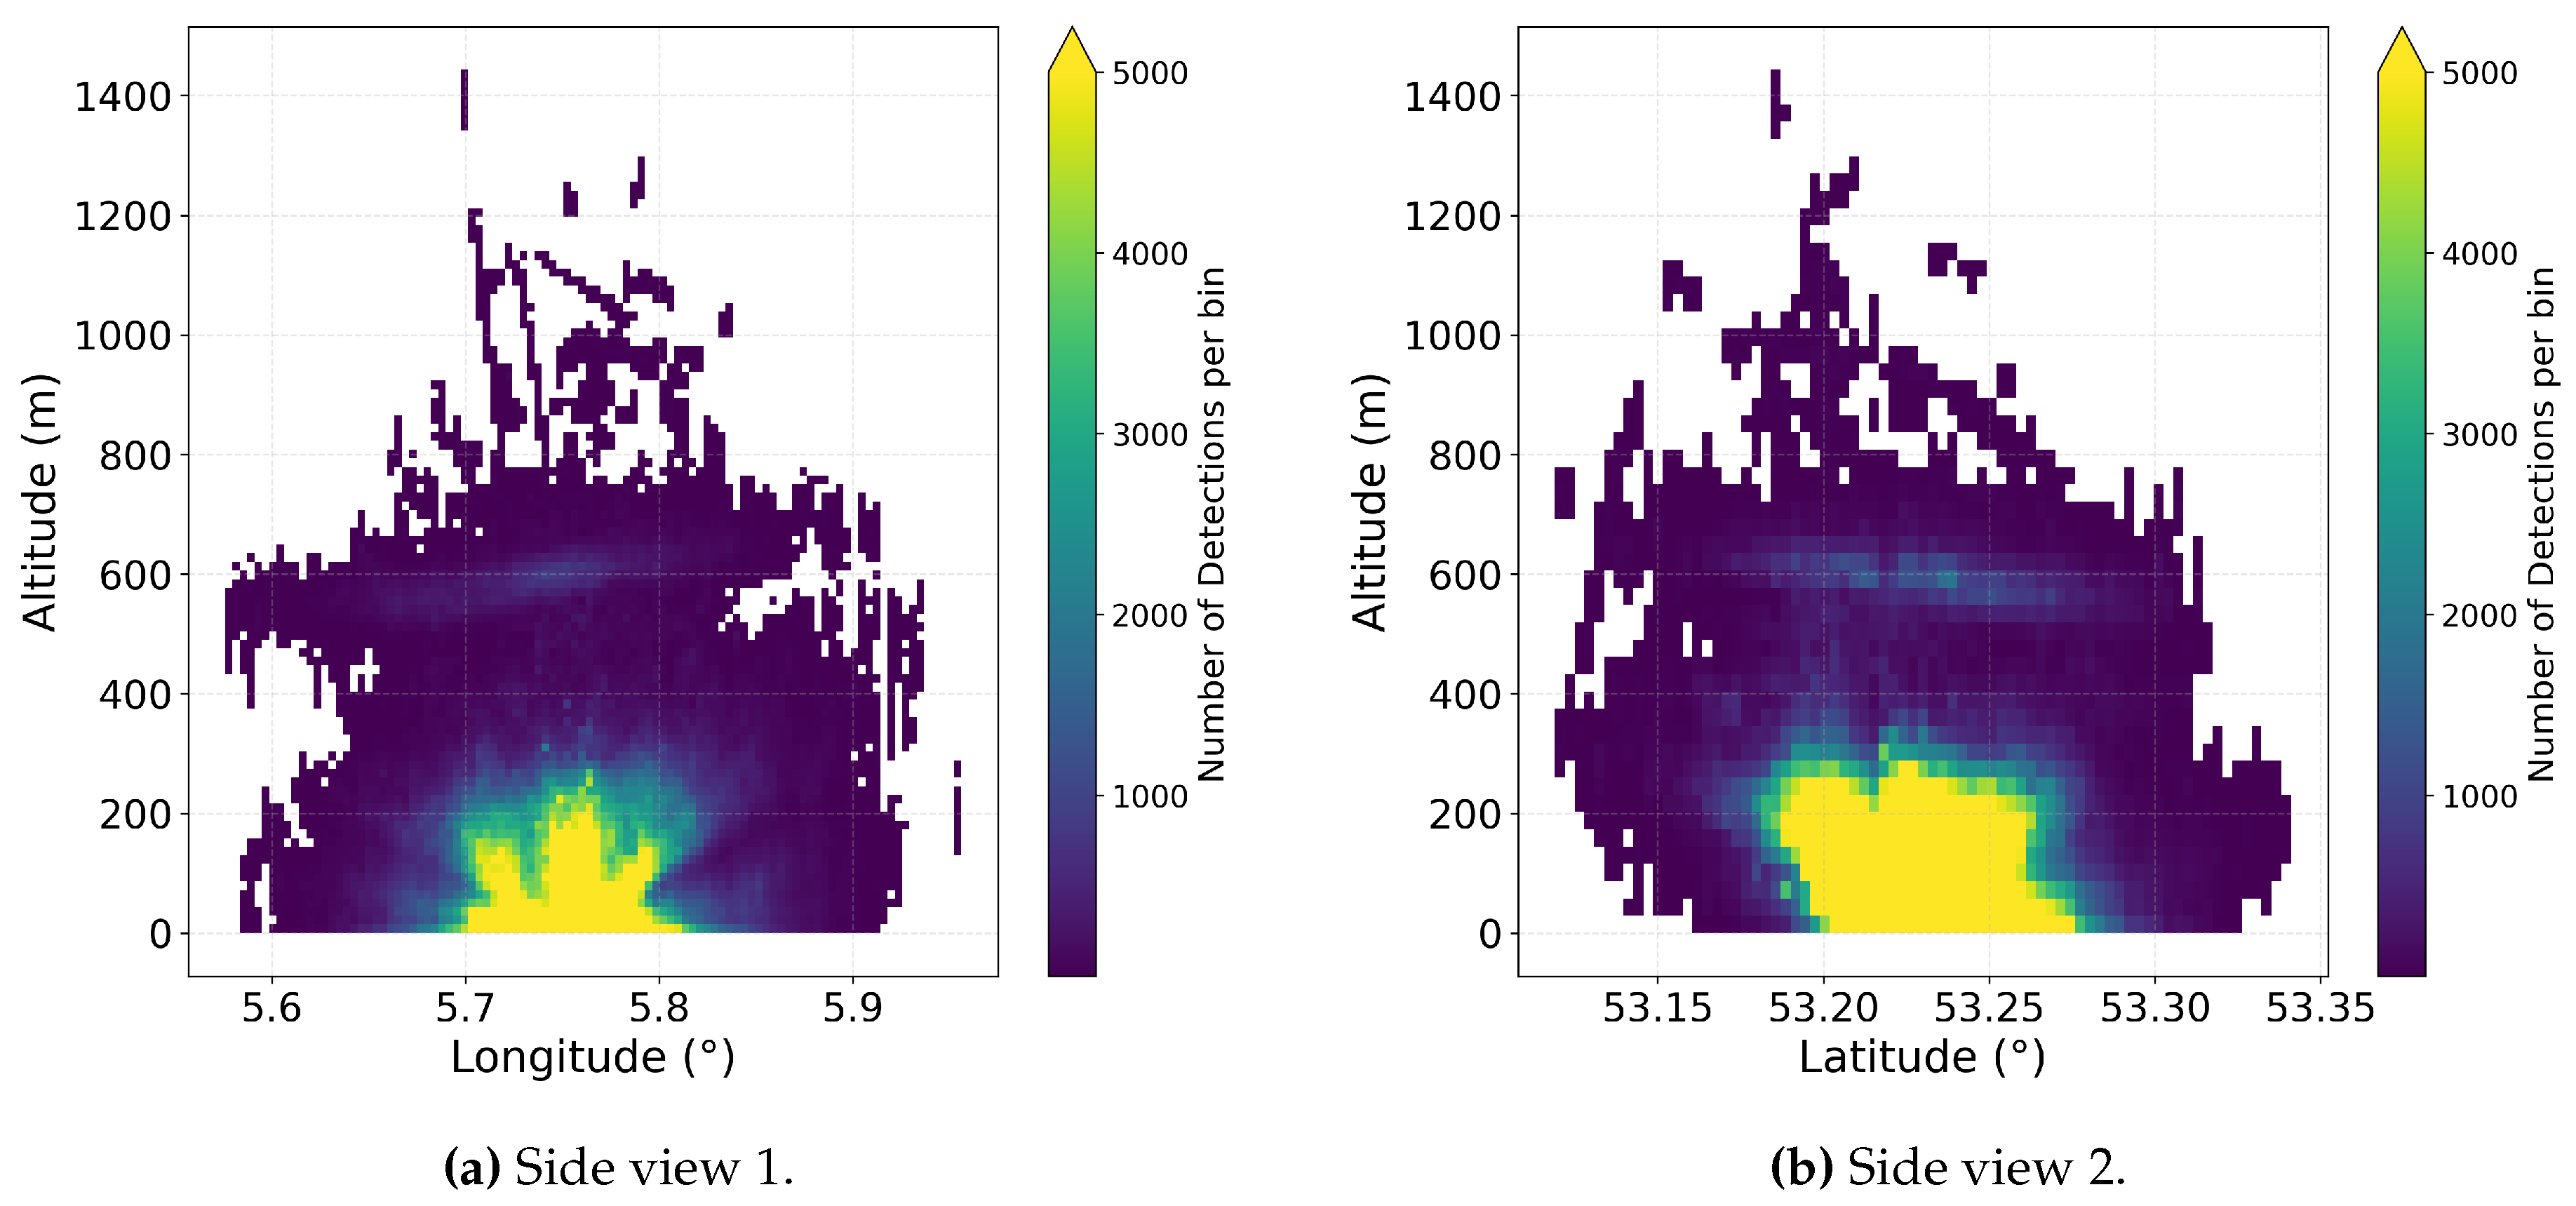
The positioning of the flight plan was performed to avoid areas of radar shadowing, which must be avoided to prevent a lack of bird data in the simulations. In addition, side views (such as those seen in Appendix B) of the bird data were used to assist in positioning the flight plan through high-concentration bird data regions. Considering these requirements, the flight plan was overlaid onto the bird data as shown in Figure 4.
2.3. UAM-CAS Implementation
To evaluate the efficacy of the UAM Collision Avoidance System (UAM-CAS) as conceptualised by Panchal et al. [16], modification of the existing BlueSky bird plugin was required, to dynamically calculate safety envelopes and execute the corresponding avoidance manoeuvres. Moreover, a logging strategy to collect the required data from the simulations was implemented. This section details the implementation of UAM-CAS into BlueSky, covering the safety envelope calculations and the three primary avoidance strategies: strategic, tactical, and emergency avoidance.
2.3.1. UAM-CAS
The UAM-CAS concept, as outlined by Panchal et al., proposes a hierarchical, rule-based approach to collision avoidance, divided into strategic (pre-flight), tactical (in-flight automated), and emergency (in-flight human intervention) phases. At the heart of UAM-CAS are three concentric safety envelopes with respect to a UAM aircraft and a bird: caution (outermost), warning and collision (innermost). These are illustrated in Figure 5. The concept suggests different safety envelope arrangements for forward and vertical flights: intersecting circles meeting at a common point for forward flight, and concentric circles for vertical flight. However, in this study, the envelopes are arranged as concentric circles for all phases of flight to facilitate simulations. As discussed in Section 2.3.3, a frontal angle filter is applied onto the envelopes for bird detection. Therefore, the envelope arrangement in this study is geometrically similar to that illustrated in Figure 5, so any effects due to the envelope geometry in this study compared to that suggested in Figure 5 are likely to be minimal.
2.3.2. Safety Envelopes
While strategic collision avoidance depends on bird presence in the initial flight path segment (cf. Section 2.3.4), tactical collision takes place when one of the safety envelopes around the aircraft is intruded. The safety envelope dimensions are functions of several factors:
- UAM configuration (dimensions and cruise speed). To understand the influence of UAM configuration on collision rates, and the efficacy of the proposed UAM-CAS in reducing them, it is important to consider the differentiating factors between each of the UAM configurations. In this study, these are considered to be the cruise speed and physical dimensions of the UAM aircraft which are presented in Table 1. Four UAM aircraft configurations (multicopter, liftcruise, vectored thrust, tilt rotor) were adopted from the previous study [16], which found that avoidance capabilities can vary substantially between these four common UAM aircraft configurations. In this study, the horizontal dimensions () and cruise speeds of the four UAM configurations are adopted from [16], which sources values from current UAM aircraft in development. These values are shown in Table 1. The vertical dimension () was taken as for all four UAM aircraft configurations, by averaging over the vertical dimensions of two UAM aircraft available in literature [27,28].
- The relative horizontal and vertical speeds between the UAM aircraft and the bird. Calculation of these values was implemented in the BlueSky bird plugin. The UAM-CAS avoidance logic, which currently consists of simple actions such as stopping and hovering, was found to react excessively and/or inappropriately to high-speed and uncharacteristic bird behaviour. As such, birds with vertical speed exceeding 5 / or horizontal speed exceeding 20 / are ignored in envelope calculations, meaning that avoidance with such birds is not carried out. Actual collisions with these birds are still logged. Avenues to improve UAM-CAS to overcome this are discussed in Section 4.2.
- System () and pilot reaction times () to the presence of a bird. is the autonomous system’s reaction time, counted from (caution envelope) incursion to the initiation of the automated tactical manoeuvre. is the pilot’s reaction time counted from (warning envelope) incursion to pilot action [16]. These were set in Panchal et al’s study to be and [16]. The system reaction time () used in [16] was found to be highly conservative, leading to a high number of potentially unnecessary avoidance manoeuvres in preliminary simulations. Hence, was reduced to 5 for this study. was sourced from previous research [29], but in this study was set to 5 . Its reduction is justified by the expectation that the pilot would receive advanced warning of an intruder once the caution envelope is intruded. The reductions of and in this study align with reductions in reaction times derived by Peinecke et al. [30] due to automated systems eliminating pilot latency.
Equations 1 to 6 provide an overview of the spatial dimensions of the safety envelopes.
Caution Envelope:
Warning Envelope:
Collision Envelope:
where , are the horizontal and vertical envelope dimensions respectively with denoting the collision, warning and caution envelopes respectively, and are the aircraft’s horizontal and vertical dimensions, and, and are the relative horizontal and vertical speeds respectively between an aircraft and a bird.
2.3.3. Bird Detection Logic
Within the simulation, intrusion by any bird into one of the safety envelopes is tested at every time step in the simulation as follows.
- Distance Check: The horizontal and vertical distances between the UAM aircraft and each bird were calculated. These distances were then compared against the dynamically computed dimensions of the three envelopes for that specific aircraft-bird pair.
- Frontal Angle Check: For the caution and warning envelopes, an additional frontal angular filter was applied. Only birds within a specified frontal arc relative to the UAM’s heading were considered for triggering tactical or warning alerts to prevent unnecessary reactions to birds that are abeam or behind the aircraft. This angle was set to for the caution envelope and for the warning envelope.
If both conditions were met for any bird, an avoidance manoeuvre as described in the next section was initiated.
2.3.4. Collision Avoidance
The collision avoidance in the strategic and tactical phase as designed by [16] was adapted as follows to facilitate their fully automated simulation in fast-time.
-
Strategic avoidance
- Original concept: Departure is delayed by five minutes if birds are detected close to the take-off area and their movement is classified as critical.
-
Implementation in this study: Strategic avoidance is activated if birds are detected within a “strategic envelope” at the time of departure. This strategic envelope was introduced in this study as a cylindrical 3D space along a certain distance of the initial leg of the flight plan. This yields two parameters which define the strategic envelope, namely a cylindrical length and cross-sectional radius. These were set at 500 and 100 respectively as an initial assumption to enable simulation.In addition, a strategic avoidance delay parameter of 30 seconds was used. This specifies the amount of time to wait, after a delayed take-off due to a strategic envelope intrusion, before trying to take-off again. If birds still intrude the strategic envelope after this delay, the bird plugin restarts the logic by initiating strategic avoidance again. The chosen delay parameter of 30 seconds is shorter than the five minutes of the original concept, to balance safety with service regularity.
-
Tactical avoidance
- Original concept: An automated “hover and descend” tactical manoeuvre is initiated when an intruder enters the outermost caution envelope.
-
Implementation in this study: Similar to the original concept, an automated tactical manoeuvre is initiated when an intruder enters the outermost caution envelope. The length of time for which to maintain the hover manoeuvre was set at 20 . Several changes were made to the original concept to better suit it towards real-world bird data.First, it was identified in test runs that with the default tactical avoidance action of hover and descent, the aircraft may inadvertently descend towards birds which are below the aircraft. To improve this behaviour, if at the point of detection in the caution envelope, the bird is above the UAM aircraft in altitude, then the UAM aircraft will hover and descend. If the bird is below, the UAM aircraft will hover and ascend.Second, if the UAM aircraft is in the ascent or descent phase and tactical avoidance is initiated, it hovers at its current altitude rather than ascending or descending. This maintains predictability and pilot control authority during these critical flight phases.Third, a tactical avoidance delay period is introduced. Upon the tactical avoidance action completing and the aircraft resuming its flight plan, the caution envelope is monitored for 10 . If any bird is detected during this window, tactical avoidance is considered unsuccessful and emergency avoidance is triggered.
-
Emergency avoidance
- Original concept: If the automated tactical avoidance manoeuvre is unsuccessful in resolving the conflict, resulting in an intrusion of the warning envelope, the human pilot must take over to resolve the conflict in the emergency avoidance phase.
-
Implementation in this study: To model the human intervention as a deterministic procedure in a simulation is challenging and beyond the scope of this study. As such, emergency avoidance is applied in this study by assuming the human always successfully resolves the conflict. This is implemented by clearing the aircraft from the simulation and starting the next scheduled flight.In the case of bird(s) intruding the warning envelope, if the aforementioned definition of emergency avoidance were implemented, no bird would reach the collision envelope, so collisions would drop to zero. As such, emergency avoidance was not implemented in this case. Therefore, the number of collisions in the simulations is expected to be larger than in reality.Emergency avoidance in this study is also triggered if, within 10 of resuming the flight plan after tactical avoidance, bird(s) enter the warning envelope. In this case, emergency avoidance was implemented. The assumption of successful resolution in this case was deemed justified because, immediately following tactical avoidance, the UAM aircraft would be travelling at low speeds, and the pilot would have heightened awareness of nearby birds through both visual observation and assistance from automated detection systems.
2.4. Simulation Set-Up
Simulations were set up to cover all four UAM configurations (multicopter, lift cruise, tilt rotor and vectored thrust), across each of the 84 BMP files. Each of the combinations was simulated once with unimpeded flight and once with an activated UAM-CAS. This resulted in a total of 4 (UAM types) × 84 (BMPs) × 2 (UAM-CAS states) = 672 simulation runs. UAM aircraft were programmed to continuously execute the flight plan. Upon reaching its destination, the aircraft is automatically deleted and then immediately re-created to fly the same route in reverse. This reciprocal flight pattern continues for the entire 24-hour duration of the active Bird Movement Plan (BMP) file. Shell/batch (.sh/.bat) scripts, which execute the full set of simulation runs sequentially, were created to automate the running of simulations.
2.5. Simulation Outputs
The efficacy of UAM-CAS is quantified by considering its effect on UAM safety, and the resulting operational impact. To this end, the following parameters were evaluated in this study.
Envelope incursion rates into the collision, warning and caution envelopes. Collision envelope incursions give measurement of the number of collisions. Warning envelope incursions give measurement of how often human intervention is requested. Caution envelope incursions give measurement of how often automated tactical avoidance is initiated. Rates rather than absolute numbers were selected since an overestimate of strikes due to missing bird behaviour in the simulation is expected.
Closest points of approach (CPA) is a key metric used in the Traffic Alert and Collision Avoidance System (TCAS) which aims to prevent mid-air collisions between aircraft [31]. A higher CPA indicates better safety in the context of aircraft in (potential) conflict. Hence, the CPA between UAM aircraft and birds is used as another measure of the effects of UAM-CAS on safety.
Delays as a result of UAM-CAS activation quantify the operational impact of UAM-CAS. Delays are split into delays on the ground due to strategic avoidance and delays in the air due to tactical avoidance.
It was anticipated, prior to running simulations, that the activation of UAM-CAS would lead to an overall increase in safety, via a reduction in envelope incursion rates and CPA. Operational delays were anticipated as a trade-off for safety benefits. It was expected that envelope incursion rates may be larger than in reality, because:
- The reaction of birds to aircraft due to their movement and noise [11] was not modelled. Indeed, in the study by Metz into an Air Traffic Control bird advisory system for current commercial aviation [20], it was found that there was a threefold overestimate of bird strikes which was partly attributed to not modelling the reaction of birds to aircraft.
- Some collisions that occur in the simulation may not occur in reality due to the pilot’s response to birds which enter the warning envelope, which was not modelled in this study.
2.6. Significance of UAM Configuration on Collision Rates
Chi-square tests were performed to investigate whether there were significant pairwise differences in collision rates between the different UAM configurations, for the baseline (non UAM-CAS) simulations. Level 1 chi-square analysis of 2 (collision: yes/no) x 4 (UAM configuration) was conducted to reveal whether any differing collision rates overall. In case of a significant result, level 2 chi-square analysis would be used to investigate which pairwise combination(s) of UAM configurations had differing collision rates. A Bonferroni correction was applied to compensate for the multiple hypotheses arising from testing each pairwise combination.
2.7. Validation of Baseline Simulation and Collision Trends
To bring the simulation results into context, the bird strike rates as observed in this study were compared to bird strike counts from Leeuwarden Air Base. Monthly bird strike rates were available for the period from 2000-2022 (Hans van Gasteren, Royal Netherlands Air Force, personal communication, 19 December 2024).
It is hypothesised that the simulation’s bird-strike ratios and Leeuwarden Air Base’s bird-strike ratios contain some seasonal correlation. Due to the following aspects, a moderate correlation is to be expected the most. It is important to note that a very strong correlation would not be expected because:
- The Leeuwarden Air Base bird-strike data is in relation to typical movements at Leeuwarden Air Base, which are military aircraft, which have much different flight profiles from those of a UAM air taxi service.
- The simulation is performed using 84 days of bird data in the year 2023, whereas the Leeuwarden Air Base bird-strike data is collected over the period 2000 to 2022. Hence, the sample size of the simulation results is relatively small.
- The Leeuwarden Air Base bird strike data does not include reliable data on the year 2023 because the runway was closed for part of that year (RNLAF Bird Strike Database. Hans van Gasteren, personal communication, 19 December 2024).
Results of this validation are presented in the next Section 3.1.
3. Results and Discussion
The goal of this study was to evaluate the efficacy of the UAM-CAS concept to prevent bird strikes to UAM aircraft. After a comparison to real bird strike data of Leeuwarden airbase, the results showing the effects of the algorithm on safety and delays are presented.
3.1. Validation
Figure 6 presents the real-world and simulation strike ratios respectively.
It can be seen that there is a general increase for both datasets from the winter months to the summer months, and then a decrease from the summer months to the winter months. The peak in August is reflected in both datasets, however there are areas of inconsistency such as the bird-strike ratio in November. This is considerably lower than surrounding months in the Leeuwarden Air Base dataset, whereas this trough is not reflected in the simulation’s bird-strike ratios.
The Pearson correlation coefficient between the two datasets is , which indicates moderate correlation. This provides some validation that the simulation captures fundamental aspects of bird activity and their interaction with UAM aircraft at Leeuwarden Air Base. The absolute collision rate in the simulation was higher than in the historical data, which is expected given that the simulation neither models the natural repelling effect of airport noise and activity (cf. e.g., [32,33,34]) on birds, nor considers bird behaviour.
3.2. Envelope Incursion Rates
Figure 7, Figure 8 and Figure 9 show the number of incursions per 10,000 flights into the collision, warning and caution envelopes respectively averaged across all simulation runs, for each UAM configuration, with and without UAM-CAS.
It was hypothesized that the number of collisions occurring without UAM-CAS should simply depend on the aircraft configuration. In Figure 7, it is seen that, as expected, the multicopter configuration, which has the smallest dimensions, experiences the smallest collision rates at 25.66 per 10,000 flights. The lift cruise, tilt rotor and vectored thrust configurations share identical dimensions. Hence, they would be expected to experience similar collision rates. However, the collision rate for the vectored thrust configuration is ∼21.7% higher than the lift cruise configuration. The level 1 chi-square test revealed difference between observed and expected collision frequencies ([3, N = 118,611] = 9.82, p = 0.020). Therefore, level 2 testing was performed for each pair of configurations. Differences were found only between the multicopter and vectored thrust configurations (Table 2).
When evaluating the flight characteristics of the UAM configurations (cf. Table 1), it becomes evident that they travel at, even if slightly, different cruising speeds. While all UAM aircraft are initialised at the same time at the start of each simulation, this leads to increasingly different flight times, as flights are performed continuously throughout the day. The effect further increases as soon as aircraft have to perform avoidance manoeuvres once UAM-CAS is active. Hence, with increasing daytime, the different configurations increasingly encounter various bird activity. Analysis of the bird data revealed peak activities of bird data at certain times of days. Figure 10 (right axis) shows the distribution of bird detections, averaged across all 84 BMPs, with dusk and dawn windows presented for Leeuwarden. As seen, on average across all BMPs, there are peaks in bird activity in the dusk and dawn windows. Because there are only 168 exposures to each BMP file for a given UAM configuration, an aircraft may, by chance, traverse a high-activity bird peak, while another aircraft may, due to differences in their progress along the route (e.g., due to prior avoidance action, differing cruise speeds), entirely avoid high-activity bird peaks. As such, the limited interaction of the UAM aircraft with the bird data may be insufficient to capture enough data.
The activation of UAM-CAS reduced collision and warning envelope incursions, but increased caution envelope incursions, as seen in Figure 7, Figure 8 and Figure 9 respectively. The average collision envelope incursion reduction was 62%; when only considering birds excluded from envelope calculations due to excessive speed, this reduction is 49%, and for birds included in envelope calculations due to nominal speed, this reduction is 66%. The average warning envelope incursion reduction was 61%. The average caution envelope incursion increase was 10%.
In addition, Figure 8 and Figure 9 show that, when UAM-CAS is active, the number of caution envelope incursions that escalate to a warning envelope incursion is decreased. Caution envelope incursions are, across all configurations, 174% more likely to escalate to warning envelope incursions when UAM-CAS is inactive. This shows that UAM-CAS resolves many potential conflicts detected in the caution envelope, and substantially reduces the need for human intervention to resolve conflicts.
The observed increase in caution envelope incursion rates is likely a consequence of the simulation methodology. When UAM-CAS initiates an avoidance manoeuvre, such as descending and hovering, it does so in response to bird presence, inherently stopping the aircraft in a region of heightened bird activity. Unlike simulations without UAM-CAS where the aircraft continues its flight path, the UAM remains in this high bird activity area. Because the current simulation methodology does not model bird reactions to aircraft, birds that might otherwise disperse from a hovering UAM aircraft in reality may, in the simulation, continue on paths that lead to caution envelope incursions. It is therefore anticipated that this simulated increase in caution envelope incursions during avoidance actions would not occur (or be less pronounced) in real-world operations where birds would react to the aircraft’s noise, presence and movement.
3.3. Closest Points of Approach
To provide further insight into the effect of UAM-CAS on aircraft-bird separation, Figure 11 shows the average minimum closest point of approach (CPA) of a bird from the UAM aircraft, for each UAM configuration with and without UAM-CAS. Each value is calculated by averaging - across all simulation runs for a given UAM configuration and UAM-CAS status - the minimum distance recorded between all birds and the UAM aircraft. A consistent increase in the average minimum CPA is observed across all UAM configurations when UAM-CAS is active, providing further evidence of increased safety.
3.4. Delays
The discussed safety benefits of UAM-CAS are inevitably accompanied by operational flight delays. These two factors need to be balanced. Figure 12 shows the average delay per flight incurred due to UAM-CAS activation for each UAM configuration. In all cases, strategic delays (on the ground delays) constituted the majority (>90%) of the average total delay. For context, the average flight times for these configurations without UAM-CAS, is presented in Table 1. Compared to the average flight times of 244 - 281 (Table 1), these delays are small (all <7.5% of their total non-UAM-CAS flight time), and are likely acceptable from an operational standpoint, especially given the >55% reduction in collisions.
While average delays provide a general overview, they can mask occurrences of much longer delays in individual flights. Indeed, as seen in Figure 10, delays were highly variable, with local delay peaks throughout the day and two global delay peaks in the dawn and dusk windows. These show correlation with bird detections in the simulation.
This suggests that, while when averaged across all flights the delays are small, there are certain bird prevalence conditions that may lead to a small number of flights facing substantial delays, sometimes even doubling the flight time compared to when UAM-CAS is deactivated.
Despite these additional delays at peak times, Figure 13 shows that across all simulations, collisions tend to occur more frequently around these peak times. This may suggest that there is little scope to reduce the sensitivity of UAM-CAS, and thus delays at peak delay times, because the number of collisions is already highest during these times.
It is important to note that the remaining number of collisions across the entirety of the UAM-CAS simulations of this study was 143. With this small sample size, the reliability of conclusions regarding distributions with time such as those suggested by Figure 13 should be taken with caution. This is consistent with the rarity of bird strike events, and with the intended effect of UAM-CAS to reduce collisions. At the same time, limitations of the study such as the lack of modelling of bird reactions to aircraft likely increased the number of collisions compared to that expected in reality. These limitations are discussed further in Section 4.2
4. Conclusions
4.1. Key Outcomes
Within this study, a previously proposed UAM-CAS concept was adapted for use in fast-time simulations and real-world bird movement data was used to evaluate its efficacy in bird strike prevention.
The simulation results demonstrated that the implementation of UAM-CAS led to an increase in safety in UAM operations. Specifically, collisions were reduced by an average of 62%; when only considering birds excluded from envelope calculations due to excessive speed, this reduction is 49%, and for birds included in envelope calculations due to nominal speed, this reduction is 66%. These figures indicate a direct increase in safety. Incursions into the warning envelope, and therefore the need for human intervention to resolve conflicts, were reduced by an average of 61%. The average minimum closest point of approach of birds from the UAM aircraft increased by an average of 20%, further demonstrating increased safety. Incursions into the outermost caution envelope increased by an average of 10%, likely due to the UAM aircraft initiating avoidance manoeuvres and temporarily hovering in areas of bird activity. It is anticipated that, should real-world bird reactions to aircraft be implemented, this increase would not occur or be less pronounced since most birds aim at avoiding collisions with aircraft [35].
Operationally, the use of UAM-CAS caused average flight delays of approximately 1.25 seconds for in-flight tactical avoidance and 14.4 seconds for on-the-ground strategic avoidance. Compared to the baseline flight times ranging from 244 seconds to 281 seconds, these delays are generally modest (less than 7.5% of total flight time) and likely acceptable from an operational standpoint, especially considering the substantial safety benefits. However, the analysis also revealed that a small percentage of flights (∼1%) experienced substantially longer delays (over 100 ), particularly during periods of peak bird activity. If the UAM-CAS system as tested in this study were to be used, it may be prudent to consider times of peak activities of birds already when scheduling flights, such as e.g., already done at some Australian airports for commercial flights [36,37]. Although not solving the issue of delays, it is preferable from a safety and energy-consumption perspective to keep delays a) schedulable and b) on the ground rather than in the air. Furthermore, given the historical seasonal trends in bird strikes, such as those indicated in the data from this study in Figure 6 and, more generally in aviation [38], strategic flight planning and scheduling should take into account these trends, using techniques such as those described in [7].
A key outcome of this study is the development of an adaptable simulation environment for UAM-CAS. The implementation of UAM-CAS was designed to be geographically independent, capable of utilising any bird dataset in BMP format from any location, unlike previous geographically-specific implementations [16]. This is a valuable tool for continued future research into UAM-CAS.
4.2. Limitations and Future Work
This study assumed perfect and instantaneous detection of all birds in the simulation by the UAM aircraft. In reality, sensors will have a defined capability in bird detection. In this study, the largest envelope size of an UAM configuration, and therefore the assumed aircraft-bird distance detection capability, was 1111 . If, in reality, sensors cannot achieve this, a limit should be applied on the birds that the UAM-CAS algorithm can take action upon. If sensors cannot detect birds as early as their entry into the caution envelope, then UAM-CAS would have less time to react to birds, which may reduce the overall effectiveness of UAM-CAS. To the contrary, if sensors can provide the necessary coverage to detect birds as early as their entry into the caution envelope, then the results of this study apply.
In reality, birds react to aircraft due to their movement and noise [11]. Bird reactions were not modelled in this simulation. It was hypothesised, in the discussion, that the increase in caution envelope incursions was due to the lack of bird reaction in the simulation. In this study, the four UAM configurations had differing cruise speeds (from 48 to 174 knots); it would be expected that the overestimate of bird strikes would be more significant for the lower cruise speed configurations, because bird avoidance reactions would be more effective when they have more time to react to an incoming aircraft [39,40]. In addition, it is likely that simulating bird reactions would reduce the rate of collisions and warnings across all aspects of the results. Indeed, in the study by Metz into an Air Traffic Control bird advisory system for current commercial aviation [20], it was found that there was a threefold overestimate of bird strikes which was partly attributed to not modelling the reaction of birds to aircraft. Bird reactions should be implemented into simulations. Reactions may include changes in the heading, altitude and speed of birds based on factors like proximity to the UAM aircraft and the noise signature and size of the specific UAM aircraft configuration.
In the original UAM-CAS concept [16], the action defined for bird presence in the warning envelope was for the pilot to intervene and resolve the conflict, as UAM-CAS was deemed unable to resolve the conflict. Pilot intervention was not modelled in this study. Pilot intervention should be implemented, for example by implementing standard aviation right-of-way rules should a bird be present in the warning envelope. Further studies could integrate human-in-the-loop simulations for warning envelope incursions, further increasing the applicability of the simulation results.
In this study, 84 days worth of bird data, across the year 2023, was available as input to simulations. Bird strikes are rare events, and as such, the simulations with UAM-CAS yielded a total of 143 collisions across all configurations and BMPs. This is a relatively small number in the context of performing statistical analysis, such as extracting trends such as the time of day or the months of the year that more collisions occurred. Either a larger bird dataset should be used, or Monte Carlo simulation could be used to randomise flight plans, thus capturing more of the existing bird data in the simulations so that further analysis can be performed. In addition, strategies should be devised to de-couple the results of each UAM configuration to the effect of different cruise speeds causing a given configuration to encounter, or skip, peaks in bird activity. This could be done, for example, by running additional simulations with offsets in the start time.
Several parameters in this study (e.g., UAM aircraft dimensions, system and pilot reaction times, strategic envelope size, strategic avoidance delay duration, tactical avoidance hover duration, frontal angles) were based on estimations or limited available data. The impact of such parameters requires further investigation. The effect of variation of these parameters on the results should be studied by re-running simulations across various sets of parameter values. It may be the case that a selection of differing parameters may yield substantially better UAM-CAS performance in terms of safety improvement and delay reduction. In addition, the addition of further differentiating parameters between UAM aircraft configurations - such as engine/prop exposure, frontal area and others - may lead to more significant pairwise differences in collision rates than those found in this study (Table 2).
As explained in the methodology, to prevent reactions to high-speed and/or uncharacteristic bird behaviour, birds with vertical speed exceeding 5 / or horizontal speed exceeding 20 / were ignored in envelope calculations, meaning that tactical avoidance for such birds was not performed. In the final results, on average across all simulations, the percentage of collisions which resulted from birds that were excluded from envelope calculations due to excessive speed was 27.3% or 39 collisions out of a total of 143 collisions. The tactical avoidance manoeuvre is relatively simple (ascend or descend and stop for a period of time) and not suited to avoid such high-speed birds. Investigation should be made into the effect of alternative avoidance manoeuvres. Rather than abrupt stops, flight path adjustments could be made based on the bird position and current trajectory which would allow the flight to still progress, thus reducing delays. Such manoeuvres could also take advantage of a bird-trajectory prediction algorithm, allowing for more “intelligent” decision making. This could provide suitable avoidance action not just for the case of high-speed birds, but also improve avoidance efficacy more generally.
The collision metrics in this study are binary (collision or no collision). In reality, the effects of bird-aircraft collisions vary from causing superficial damage, to critical damage. Analysis of collisions could be extended to take into account the kinetic energy of the collision, using this to quantify the likely damage effects. This would allow for greater understanding of safety benefits, for example, whether UAM-CAS is more or less effective at preventing high-energy (more damaging) collisions.
Author Contributions
Conceptualization, I.C.M. and S.F.A.; methodology, L.M. and I.C.M.; software, L.M. and I.C.M.; validation, L.M.; formal analysis, L.M., I.C.M. and S.F.A.; data curation, L.M. and I.C.M.; writing—original draft preparation, L.M.; writing—review and editing, I.C.M. and S.F.A.; visualisation, L.M.; supervision, I.C.M. and S.F.A. All authors have read and agreed to the published version of the manuscript.
Funding
This research received no external funding.
Institutional Review Board Statement
Not applicable.
Acknowledgments
We thank Hans van Gasteren for sharing bird movement information as well as strike rates observed at Leeuwarden airbase. We thank him and Niklas Peinecke for reviewing a previous version of this manuscript.
Conflicts of Interest
The authors declare no conflicts of interest.
Appendix A
In order to use the Eindhoven flight plan in conjunction with the Leeuwarden bird dataset, the flight plan coordinates had to be transferred, yielding a new set of translated coordinates which capture the shape and profile of the flight plan but in a different geographical location. To perform this translation, Equirectangular approximation was used; this is an approximation that is only accurate for sets of coordinates which are close together. In the end, the flight plan length of proved to be small enough for high accuracy.
First, the longitude/latitude coordinates of the original flight plan were converted to a local plane tangent to a reference point (the first point on the flight plan) and using Equations A1 and A2 (known as ’Equirectangular Approximation’, equations from [41], pg 91),
where is the change in longitude between a point on the flight plan and the reference point, is the change in latitude between a point on the flight plan and the reference point, R is Earth’s radius and is the average latitude between a point and the reference point.
Second, a rotation of angle is then performed in the Eindhoven frame, to obtain a rotated frame , using Equations A3 and A4. This facilitates the correct positioning of the transformed Leeuwarden flight plan such that it passes close to the radar, and avoids any radar shadowed regions.
Third, the rotated Cartesian coordinates are linearly translated to Leeuwarden. These Leeuwarden cartesian coordinates are then converted to longitude/latitude, using Equations A5 and A6, which perform Equirectangular Approximation in reverse (equations from [41], pg 91),
where and are the latitude and longitude of the new reference point (the start of the flight plan) and and are the Leeuwarden flight plan latitudes and longitudes.
In the end, this method results in a very small error in flight plan ground length of around between the Eindhoven and Leeuwarden flight plans, which, for the original ground length, represents a deviation of approximately .
Appendix B
Figure A1 shows an example, for one BMP, of two side-views of the bird density distribution.
Figure A1.
Density distribution of bird detections for one BMP recorded on 24 Jan 2023, discretised into a 100x100 mesh.
Figure A1.
Density distribution of bird detections for one BMP recorded on 24 Jan 2023, discretised into a 100x100 mesh.
References
- Reuters. Electric planemaker Beta Technologies raises over $300 mln in new funding, 2024. Available online: https://www.reuters.com/business/aerospace-defense/electric-planemaker-beta-technologies-raises-over-300-mln-new-funding-2024-10-31/ (accessed on 22 May 2025).
- Archer Aviation. Archer Raises $300M From Leading Institutional Investors To Accelerate Hybrid Aircraft Platform Development As Defense Opportunities Look Stronger Than Expected, 2025. Available online: https://www.businesswire.com/news/home/20250211879370/en/Archer-Raises-%24300M-From-Leading-Institutional-Investors-To-Accelerate-Hybrid-Aircraft-Platform-Development-As-Defense-Opportunities-Look-Stronger-Than-Expected (accessed on 22 May 2025).
- Joby Aviation. Joby Aviation Announces Closing of $250 Million Investment, 2025. Available online: https://www.jobyaviation.com/news/joby-aviation-announces-closing-250-million-investment/ (accessed on 28 May 2025).
- Joby Aviation. Joby Successfully Conducts First FAA Testing under TIA, Begins Final Phase of Certification Program, 2024. Available online: https://ir.jobyaviation.com/news-events/press-releases/detail/122/joby-successfully-conducts-first-faa-testing-under-tia (accessed on 25 May 2025).
- Archer Aviation. Archer Applauds FAA’s Final Rules for Operating eVTOL Aircraft, 2024. Available online: https://investors.archer.com/news/news-details/2024/Archer-Applauds-FAAs-Final-Rules-for-Operating-eVTOL-Aircraft/default.aspx (accessed on 25 May 2025).
- Rothfeld, R.; Fu, M.; Balać, M.; Antoniou, C. Potential Urban Air Mobility Travel Time Savings: An Exploratory Analysis of Munich, Paris, and San Francisco. Sustainability 2021, 13, 2217. [Google Scholar] [CrossRef]
- Groll, M.F.; Stepanian, P.M.; Metz, I.C. Wildlife Strike Mitigation in AAM: Key Technology Gaps and Proposed Solutions. In Proceedings of the Vertical Flight Society (VFS) 81st Annual Forum & Technology Display, Vertical Flight Society, Virginia Beach, VA, USA, May 2025. [Google Scholar] [CrossRef]
- Metz, I.C.; Henshaw, C.; Harmon, L. Flying in the Strike Zone: Urban Air Mobility and Wildlife Strike Prevention. J. Am. Helicopter Soc. 2024, 69, 1–9. [Google Scholar] [CrossRef]
- Deloitte Consulting LLP. UAM Vision Concept of Operations (ConOps) UAM Maturity Level (UML) 4. Concept of Operations Version 1.0, National Aeronautics and Space Administration (NASA), 2020.
- Dolbeer, R.A.; Begier, M.J.; Miller, P.R.; Weller, J.R.; Anderson, A.L. Wildlife Strikes to Civil Aircraft in the United States 1990–2023. Technical Report Serial Report Number 30, Federal Aviation Administration, U.S. Department of Transportation, Washington, DC, USA, 2024. In cooperation with the U.S. Department of Agriculture, Wildlife Services.
- Blackwell, B.F.; Seamans, T.W.; Fernández-Juricic, E.; Devault, T.L.; Outward, R.J. Avian Responses to Aircraft in an Airport Environment. J. Wildl. Manag. 2019, 83, 893–901. [Google Scholar] [CrossRef]
- European Union Aviation Safety Agency (EASA). Proposed Means of Compliance with the Special Condition VTOL. Public Consultation Document MOC SC-VTOL, European Union Aviation Safety Agency, Cologne, Germany, 2020. Issue: 1.
- European Union Aviation Safety Agency (EASA). Guidelines for the Assessment of the Critical Area of an Unmanned Aircraft. Guidelines Final Issue 01, European Union Aviation Safety Agency, Cologne, Germany, 2024. Issue: 1.
- ICAO. Aerodromes, 8th ed.; Vol. I, ICAO: Montreal, QC, Canada, 2018. [Google Scholar]
- Dolbeer, R.A. Increasing Trend of Damaging Bird Strikes with Aircraft Outside the Airport Boundary: Implications for Mitigation Measures. Human–Wildlife Interactions 2011, 5, 235–248. [Google Scholar] [CrossRef]
- Panchal, I.; Armanini, S.F.; Metz, I.C. Evaluation of Collision Detection and Avoidance Methods for Urban Air Mobility through Simulation. CEAS Aeronautical Journal 2025, 16, 905–920. [Google Scholar] [CrossRef]
- Schalk, L.M.; Peinecke, N. Detect and Avoid for Unmanned Aircraft in Very Low Level Airspace. In Automated Low-Altitude Air Delivery - Towards Autonomous Cargo Transportation with Drones; Dauer, J.C., Ed.; Research Topics in Aerospace, Springer, 2021; pp. 333–351. [CrossRef]
- Hoekstra, J.M.; Ellerbroek, J. BlueSky ATC Simulator Project: An Open Data and Open Source Approach. In Proceedings of the 7th International Conference on Research in Air Transportation (ICRAT), Philadelphia, PA, USA; 2016; pp. 625–634. [Google Scholar] [CrossRef]
- Metz, I.C.; Ellerbroek, J.; Mühlhausen, T.; Kügler, D.; Hoekstra, J.M. Simulating the Risk of Bird Strikes. In Proceedings of the Seventh SESAR Innovation Days, Belgrade, Serbia., 28–30 November 2017. [Google Scholar]
- Metz, I. Air Traffic Control Advisory System for the Prevention of Bird Strikes. Ph.d. thesis, Delft University of Technology, Delft, The Netherlands, 2021. [CrossRef]
- Royal Netherlands Airforce (RNLAF). Data from Robin 3D MAX Radar at Leeuwarden Air Base, 2024. Personal communication with Hans van Gasteren. Data courtesy of the Royal Netherlands Airforce.
- Bruderer, B.; Boldt, A. Flight Characteristics of Birds: I. Radar Measurements of Speeds. Ibis 2001, 143, 178–204. [Google Scholar] [CrossRef]
- Royal Netherlands Meteorological Institute (KNMI). KNMI Data Platform (KDP), 2025. Available online: https://www.knmi.nl/research/observations-data-technology/projects/knmi-data-platform (accessed on 14 August 2025).
- EASA. Study on the Societal Acceptance of Urban Air Mobility in Europe. Technical report, European Union Aviation Safety Agency, Cologne, Germany, 2021. Available online: https://www.easa.europa.eu/sites/default/files/dfu/uam-full-report.pdf (accessed on 31 October 2025).
- Google Earth. Satellite imagery of Eindhoven. Map data: Airbus. Imagery date: 9 May 2022–newer. (accessed on 20 November 2024).
- Panchal, I.; Metz, I.C.; Ribeiro, M.; Armanini, S.F. Urban Air Traffic Management for Collision Avoidance with Non-Cooperative Airspace Users. In Proceedings of the 33rd Congress of the International Council of the Aeronautical Sciences (ICAS 2022), Stockholm, Sweden; 2022; pp. 6801–6817. [Google Scholar]
- Volocopter GmbH. VoloCity Design Specifications, 2024. Available online: https://assets.ctfassets.net/vnrac6vfvrab/3lVLdBP4Wmbv4e8hipNS1V/2adb898d09dbdd784183c26bd8bac960/2025_SpecSheet_VoloCit.pdf (accessed on 21 January 2025).
- EHang Holdings Limited. UAM-Passenger Autonomous Aerial Vehicle (AAV). Available online: https://www.ehang.com/ehangaav/ (accessed on 21 January 2025).
- Federal Aviation Administration. Pilots’ Role in Collision Avoidance. Advisory Circular AC 90-48D, U.S. Department of Transportation, Federal Aviation Administration, Washington, DC, USA, 2016. Available online: https://www.faa.gov/documentLibrary/media/Advisory_Circular/AC_90-48D.pdf (accessed on 31 October 2025).
- Peinecke, N.; Limmer, L.; Volkert, A. Application of “Well Clear” to Small Drones. In Proceedings of the 2018 IEEE/AIAA 37th Digital Avionics Systems Conference (DASC), London, UK; 2018; pp. 1–9. [Google Scholar] [CrossRef]
- U.S. Department of Transportation, Federal Aviation Administration. Introduction to TCAS II Version 7.1. Technical Report HQ-111358, Federal Aviation Administration (FAA), Washington, D.C., 2011.
- Metz, I.C.; Giordano, M.; Ntampakis, D.; Moira, M.; Hamann, A.; Blijleven, R.; Ebert, J.J.; Montemaggiori, A. Impact of COVID-19 on aviation–wildlife strikes across Europe. Human–Wildlife Interactions 2022, 16, 442–459. [Google Scholar] [CrossRef]
- Parsons, D.; Malouf, M.; Martin, W. The Impact of COVID-19 on Wildlife Strike Rates in the United States. Human–Wildlife Interactions 2022, 16, 433–441. [Google Scholar] [CrossRef]
- Altringer, L.; McKee, S.C.; Kougher, J.D.; Begier, M.J.; Shwiff, S.A. The impact of the COVID-19 pandemic on wildlife–aircraft collisions at US airports. Scientific Reports 2023, 13, 11602. [Google Scholar] [CrossRef] [PubMed]
- Bernhardt, G.E.; Blackwell, B.F.; DeVault, T.L.; Kutschbach-Brohl, L. Fatal injuries to birds from collisions with aircraft reveal anti-predator behaviours. Ibis 2010, 152, 830–834. [Google Scholar] [CrossRef]
- Cairns Airport. CAPL Bird Watch Conditions. Presentation at the Australian Aviation Wildlife Hazard Group (AAWHG) Forum, Brisbane, Australia, 22 October 2009, 2009. Available online: https://aawhg.org/wp-content/uploads/2019/07/2009-Forum-capl_bird_watch_conditions_lamont.pdf (accessed on 14 August 2025).
- Brix, J. Northern Territory Airports application of the IBSC Standards, 2013.
- Vaishnav, T.; Haywood, J.; Burns, K.C. Biogeographical patterns in the seasonality of bird collisions with aircraft. Ecological Solutions and Evidence 2024, 5, e12384. [Google Scholar] [CrossRef]
- DeVault, T.L.; Blackwell, B.F.; Seamans, T.W.; Lima, S.L.; Fernández-Juricic, E. Effects of Vehicle Speed on Flight Initiation by Turkey Vultures: Implications for Bird–Vehicle Collisions. PLOS ONE 2014, 9, e87944. [Google Scholar] [CrossRef] [PubMed]
- DeVault, T.L.; Blackwell, B.F.; Seamans, T.W.; Lima, S.L.; Fernández-Juricic, E. Speed kills: ineffective avian escape responses to oncoming vehicles. Proceedings of the Royal Society B: Biological Sciences 2015, 282, 20142188. [Google Scholar] [CrossRef]
- Snyder, J.P. Map Projections: A Working Manual. Professional Paper 1395, USA, 1987. [Google Scholar] [CrossRef]
Figure 1.
Bird strikes and damaging bird strikes to commercial transport aircraft, reported to the Federal Aviation Administration (FAA) between 1990 and 2023. Data sourced from Dolbeer et al. [10].
Figure 1.
Bird strikes and damaging bird strikes to commercial transport aircraft, reported to the Federal Aviation Administration (FAA) between 1990 and 2023. Data sourced from Dolbeer et al. [10].
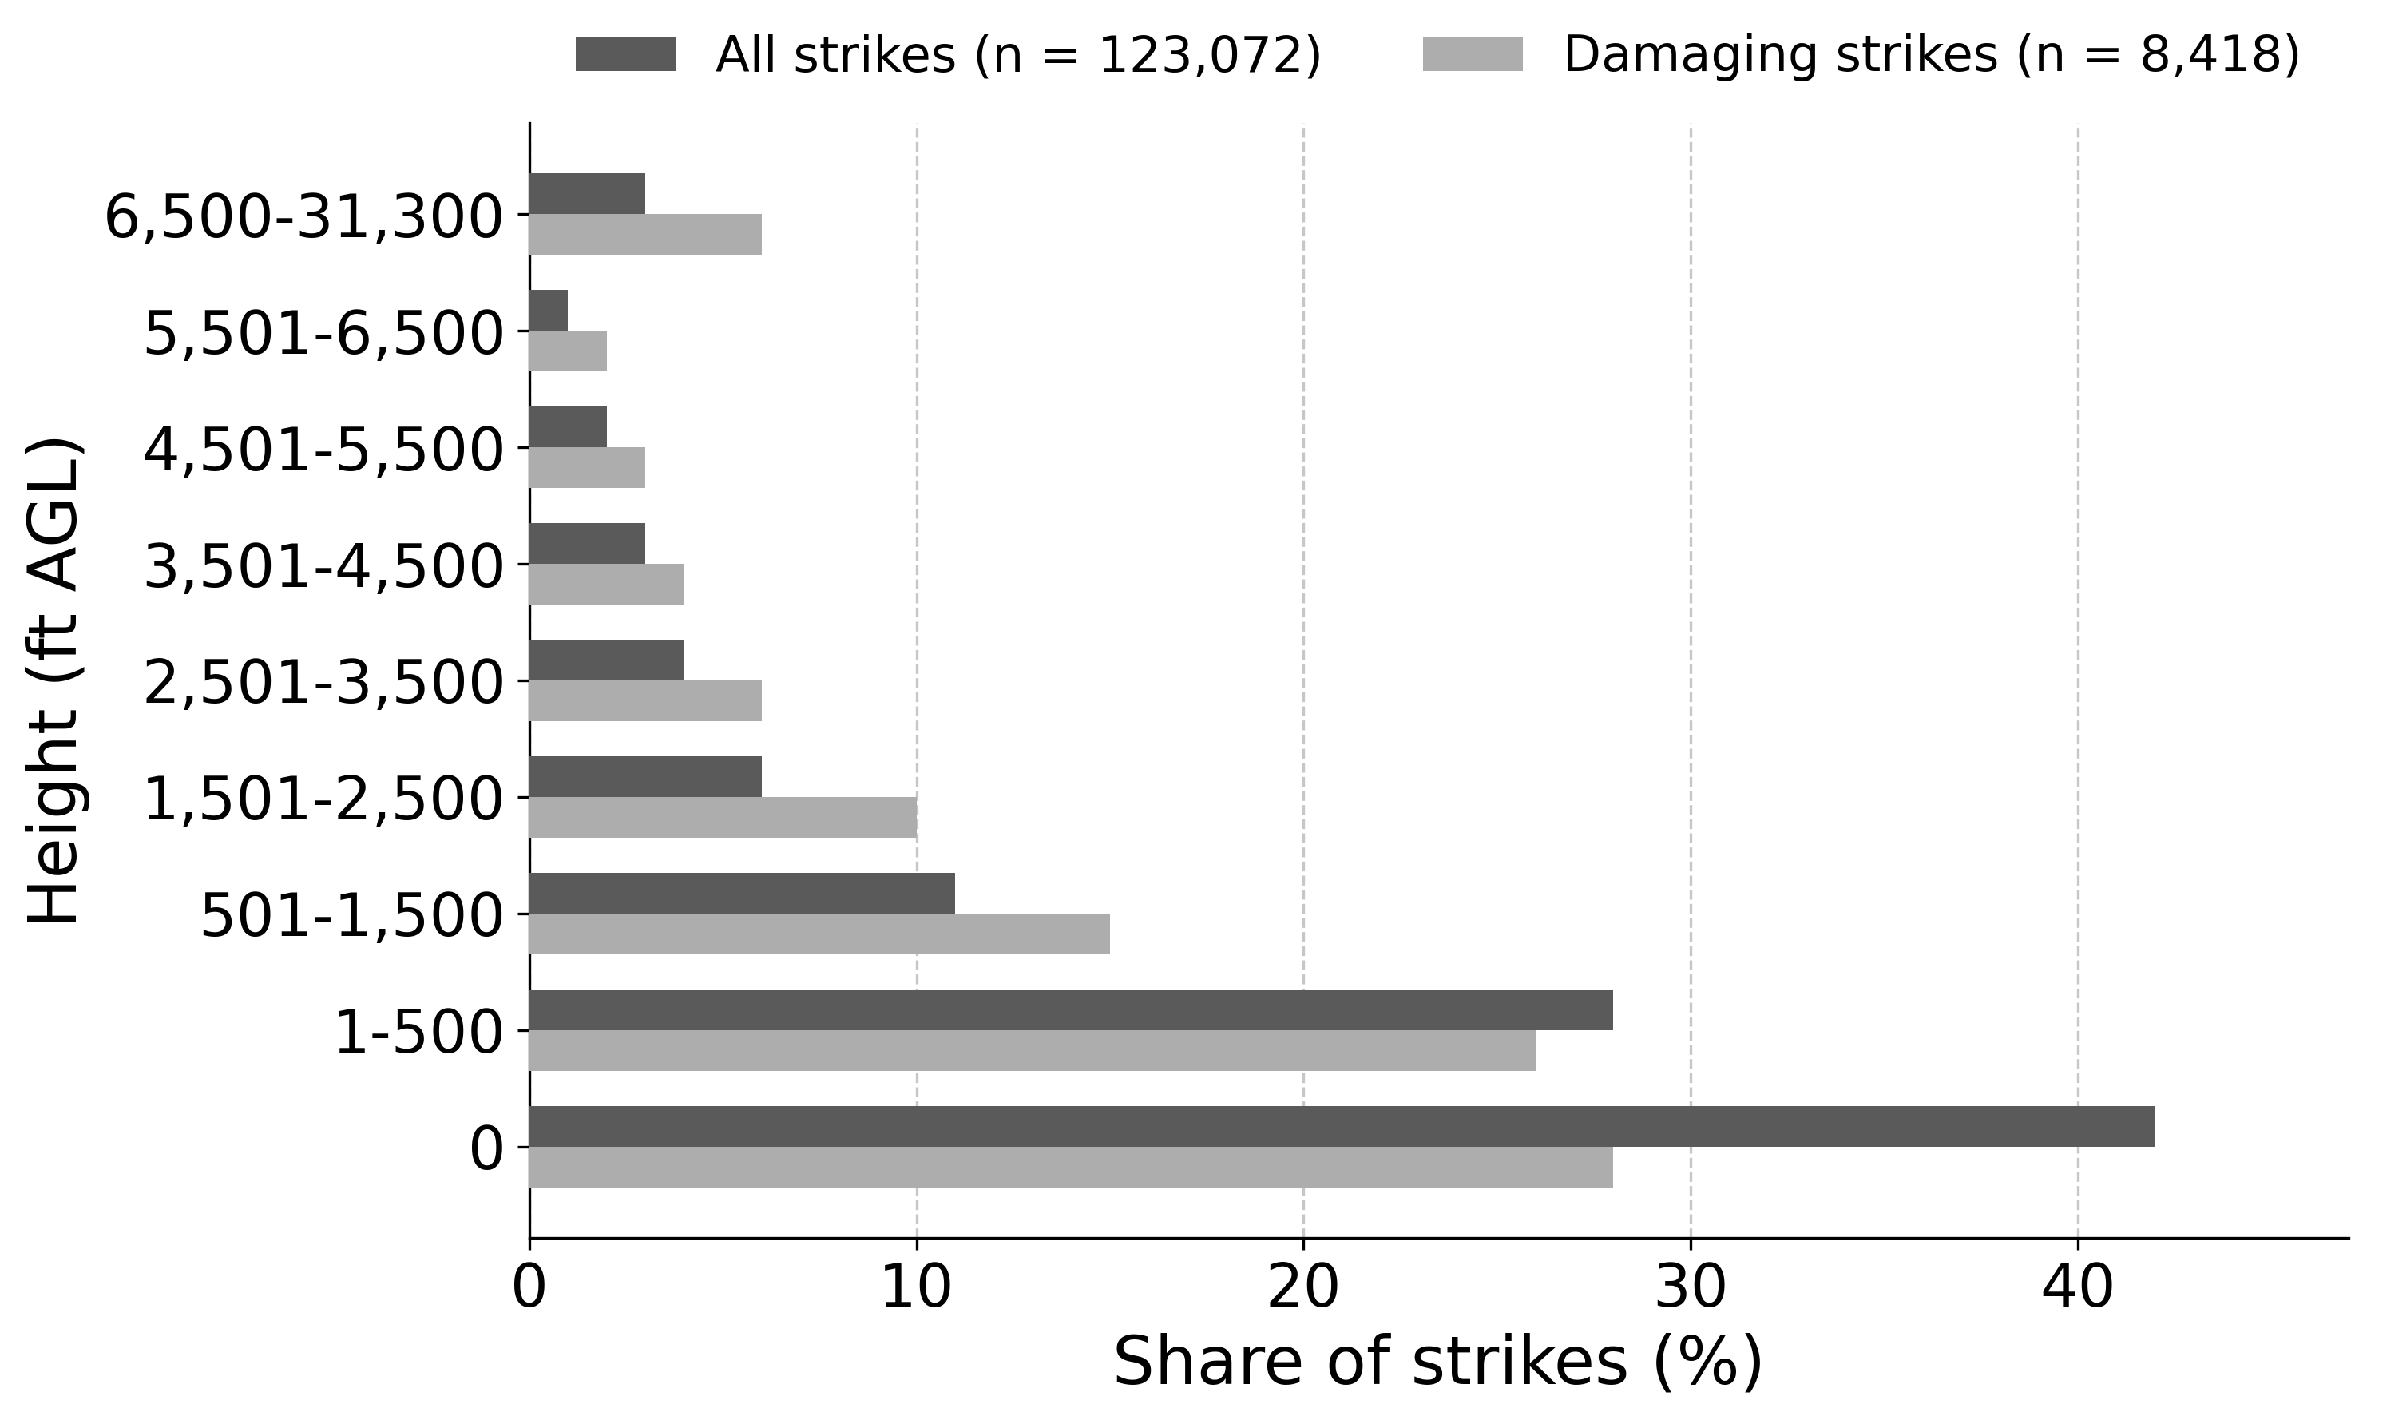
Figure 2.
Minimum altitude heatmap of bird data in one BMP of the dataset recorded on 24 Jan 2023. The region is discretised into a 100x100 mesh, and the minimum altitude bird in each bin is recorded.
Figure 2.
Minimum altitude heatmap of bird data in one BMP of the dataset recorded on 24 Jan 2023. The region is discretised into a 100x100 mesh, and the minimum altitude bird in each bin is recorded.
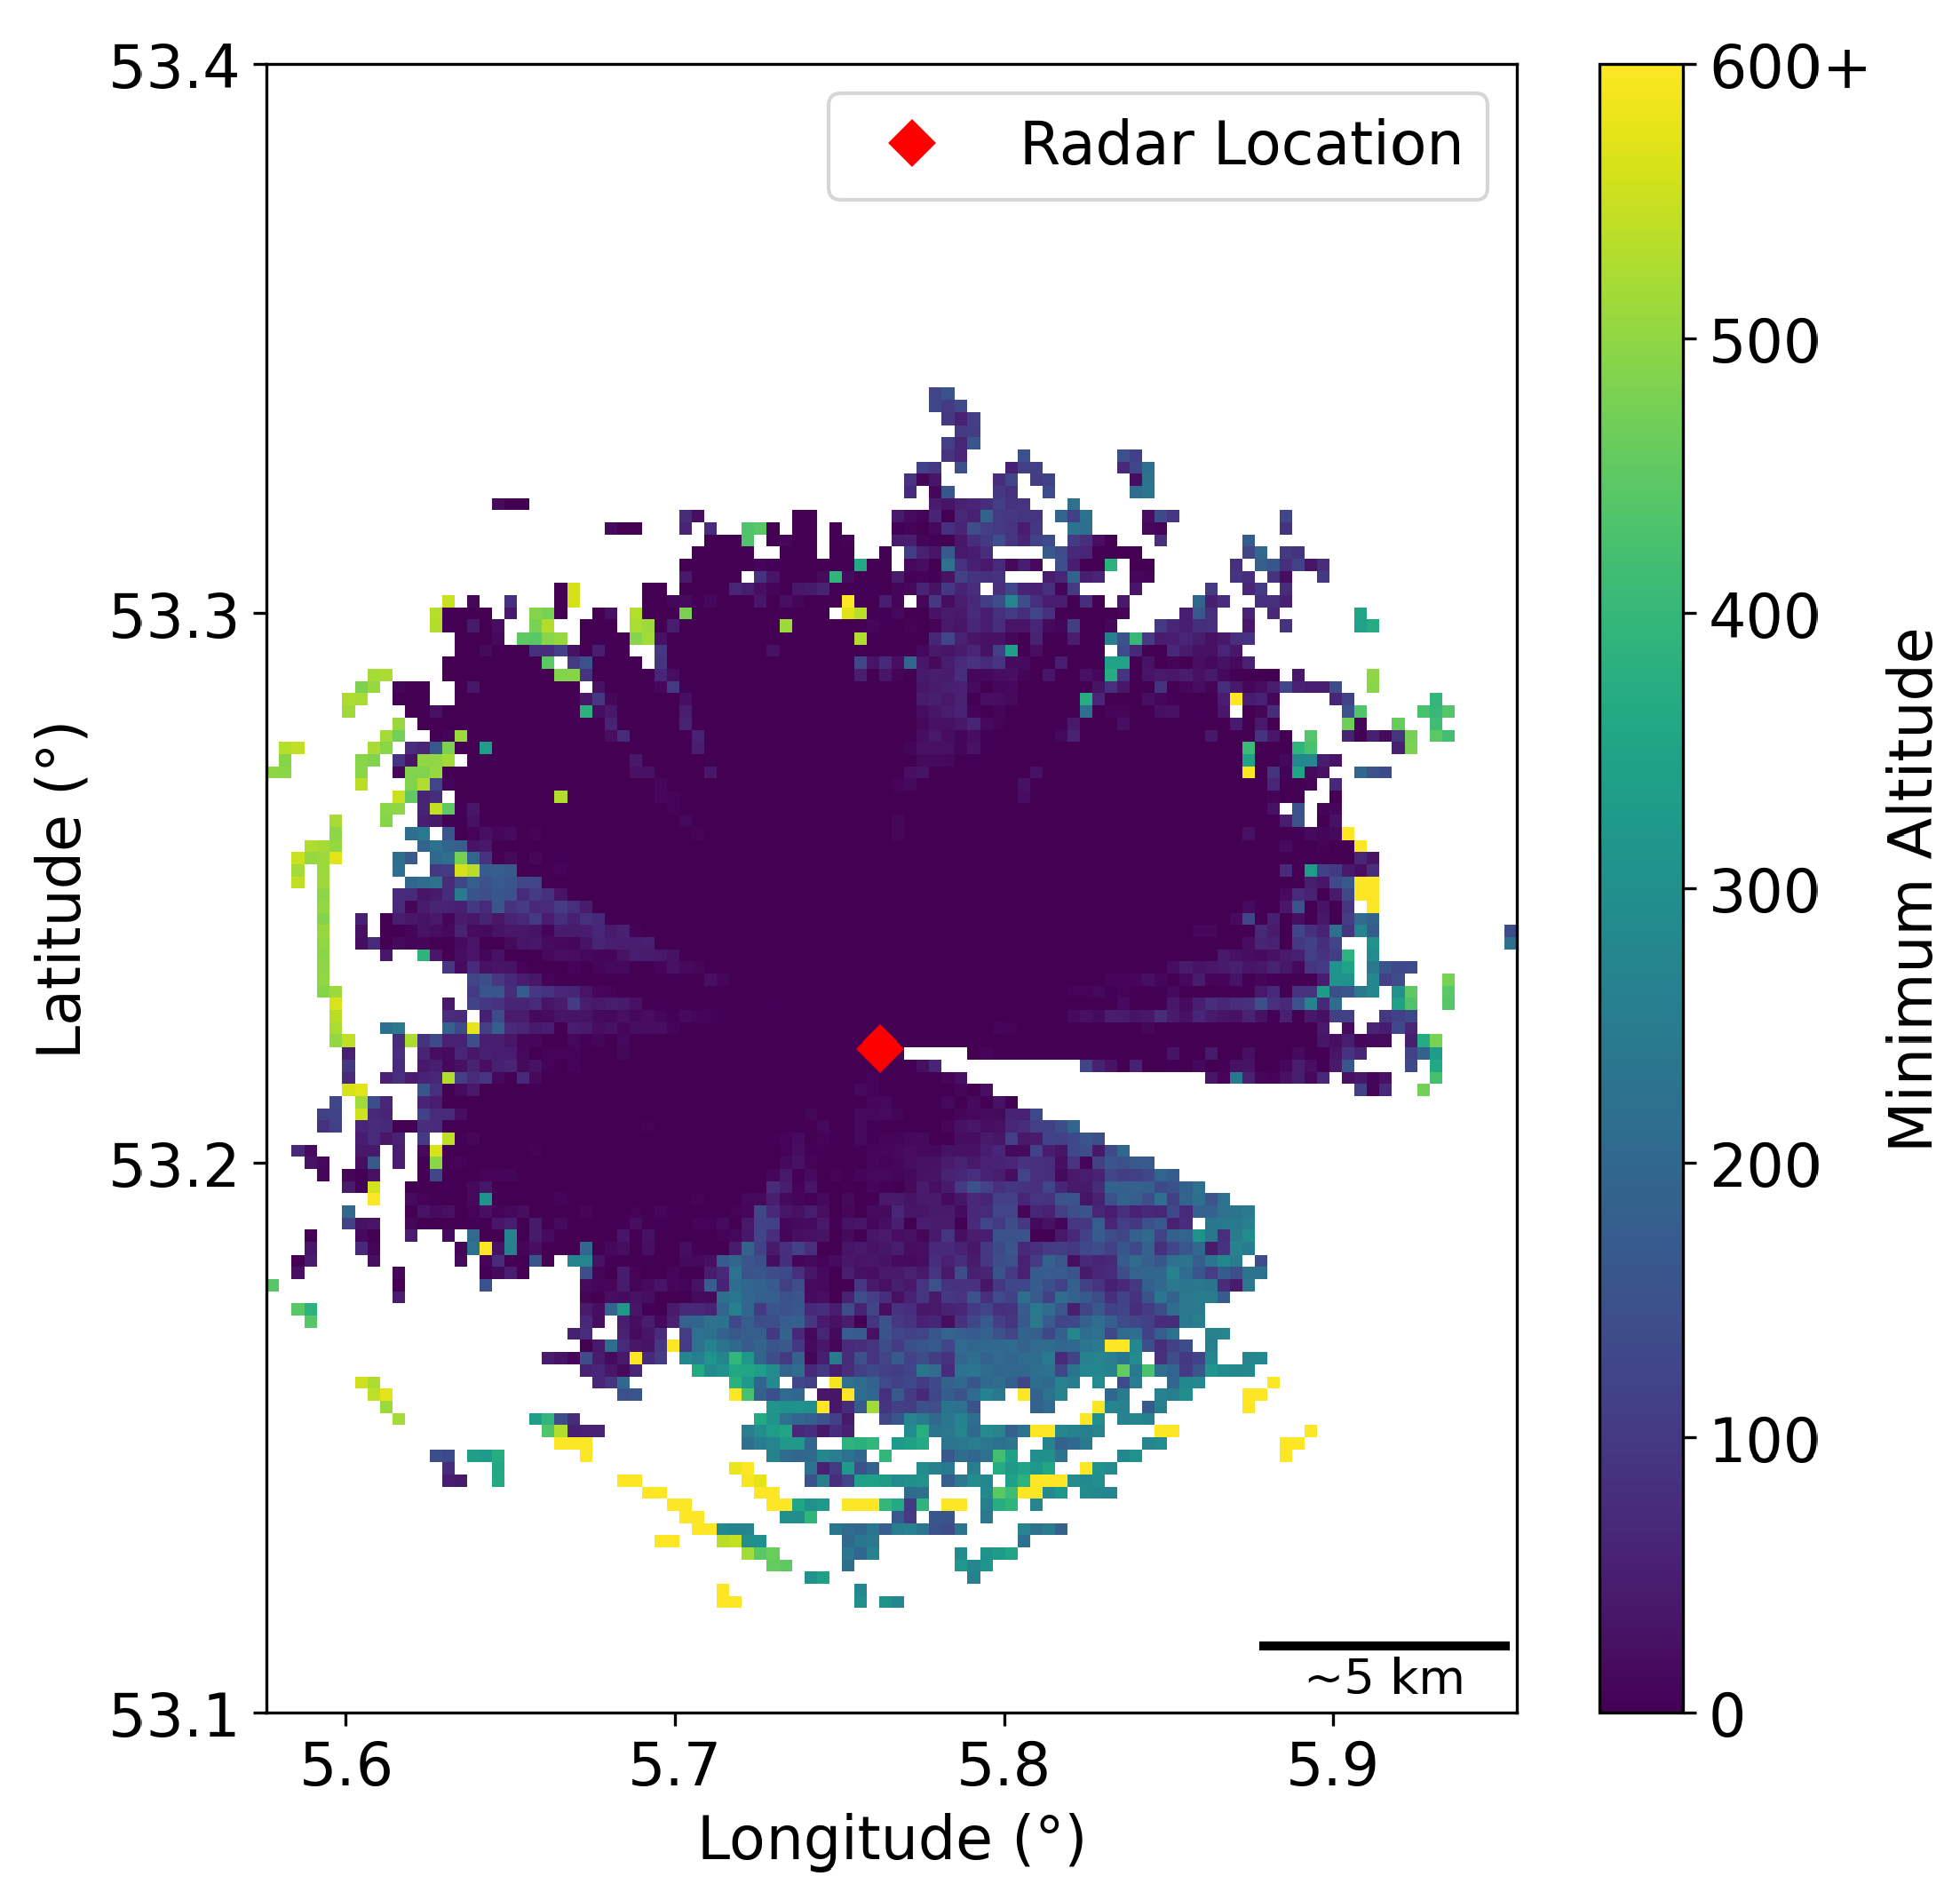
Figure 3.
2D top down UAM air taxi route between Eindhoven Airport and Eindhoven Central Railway Station. Satellite map data in background sourced from [25].
Figure 3.
2D top down UAM air taxi route between Eindhoven Airport and Eindhoven Central Railway Station. Satellite map data in background sourced from [25].
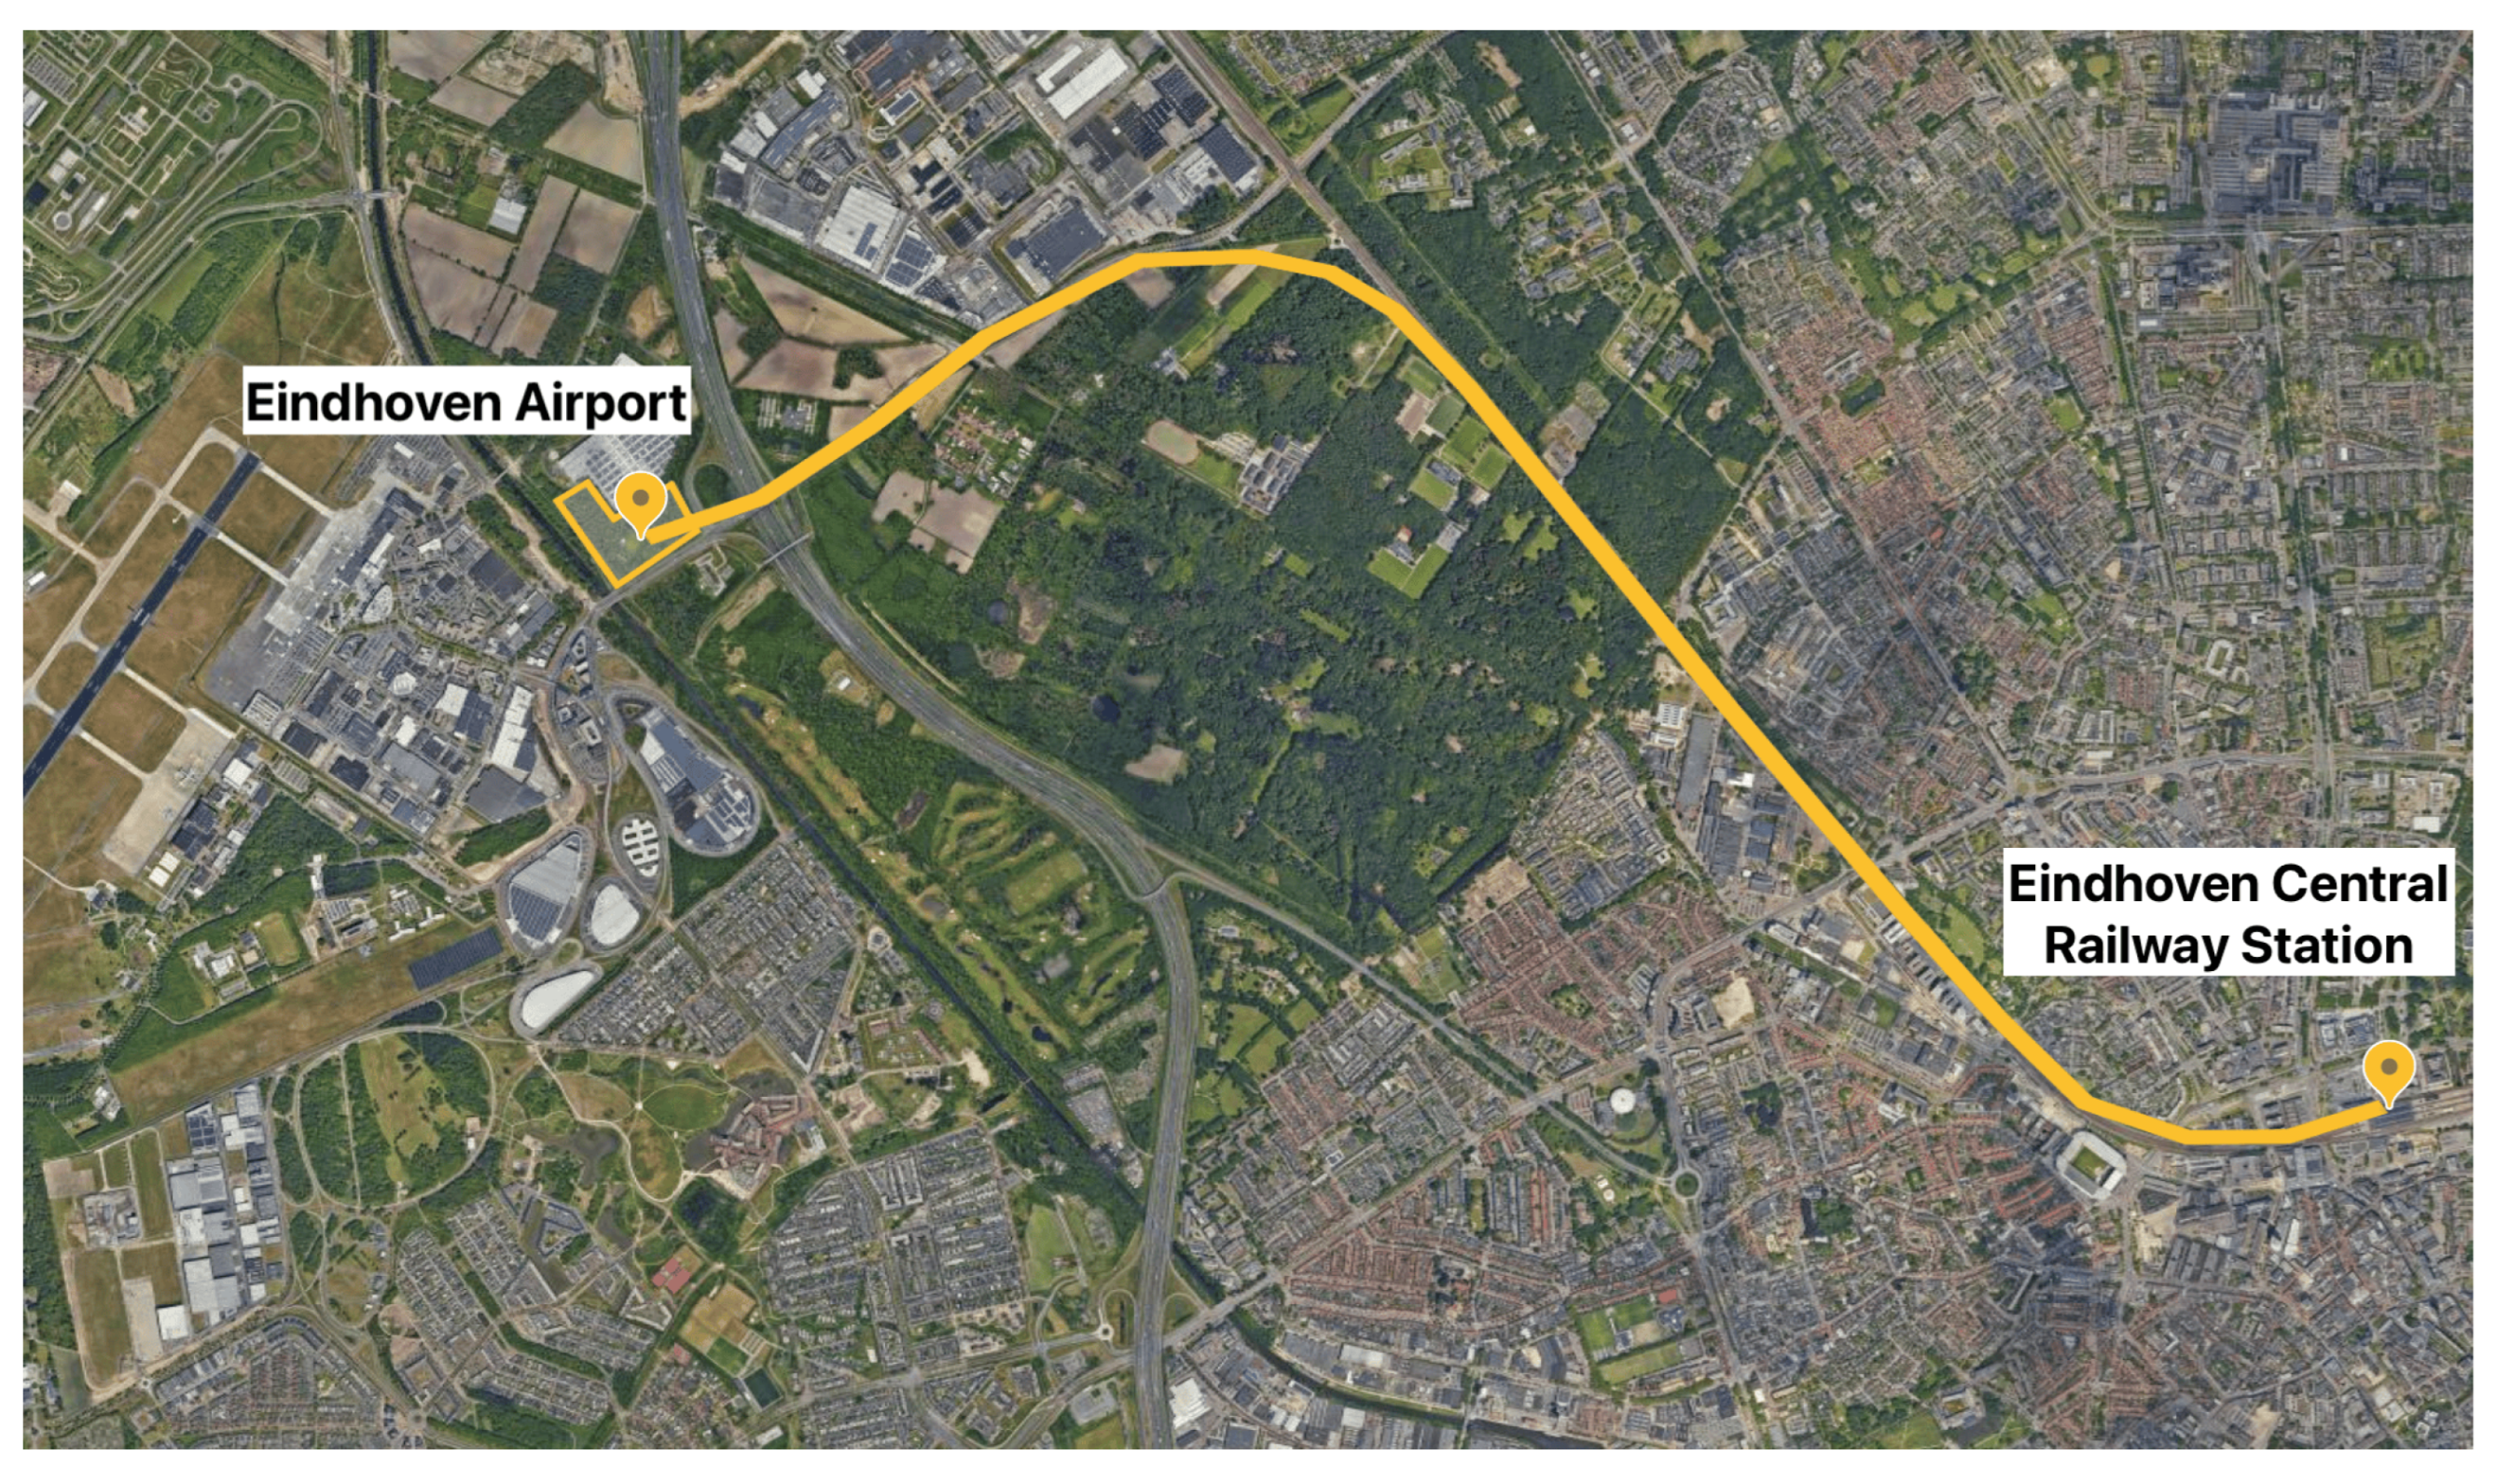
Figure 4.
2D top-down view of the final flight plan overlaid onto one BMP of the dataset recorded on 24 Jan 2023. Each bird observation point represents an entry in the BMP file (a single radar detection).
Figure 4.
2D top-down view of the final flight plan overlaid onto one BMP of the dataset recorded on 24 Jan 2023. Each bird observation point represents an entry in the BMP file (a single radar detection).
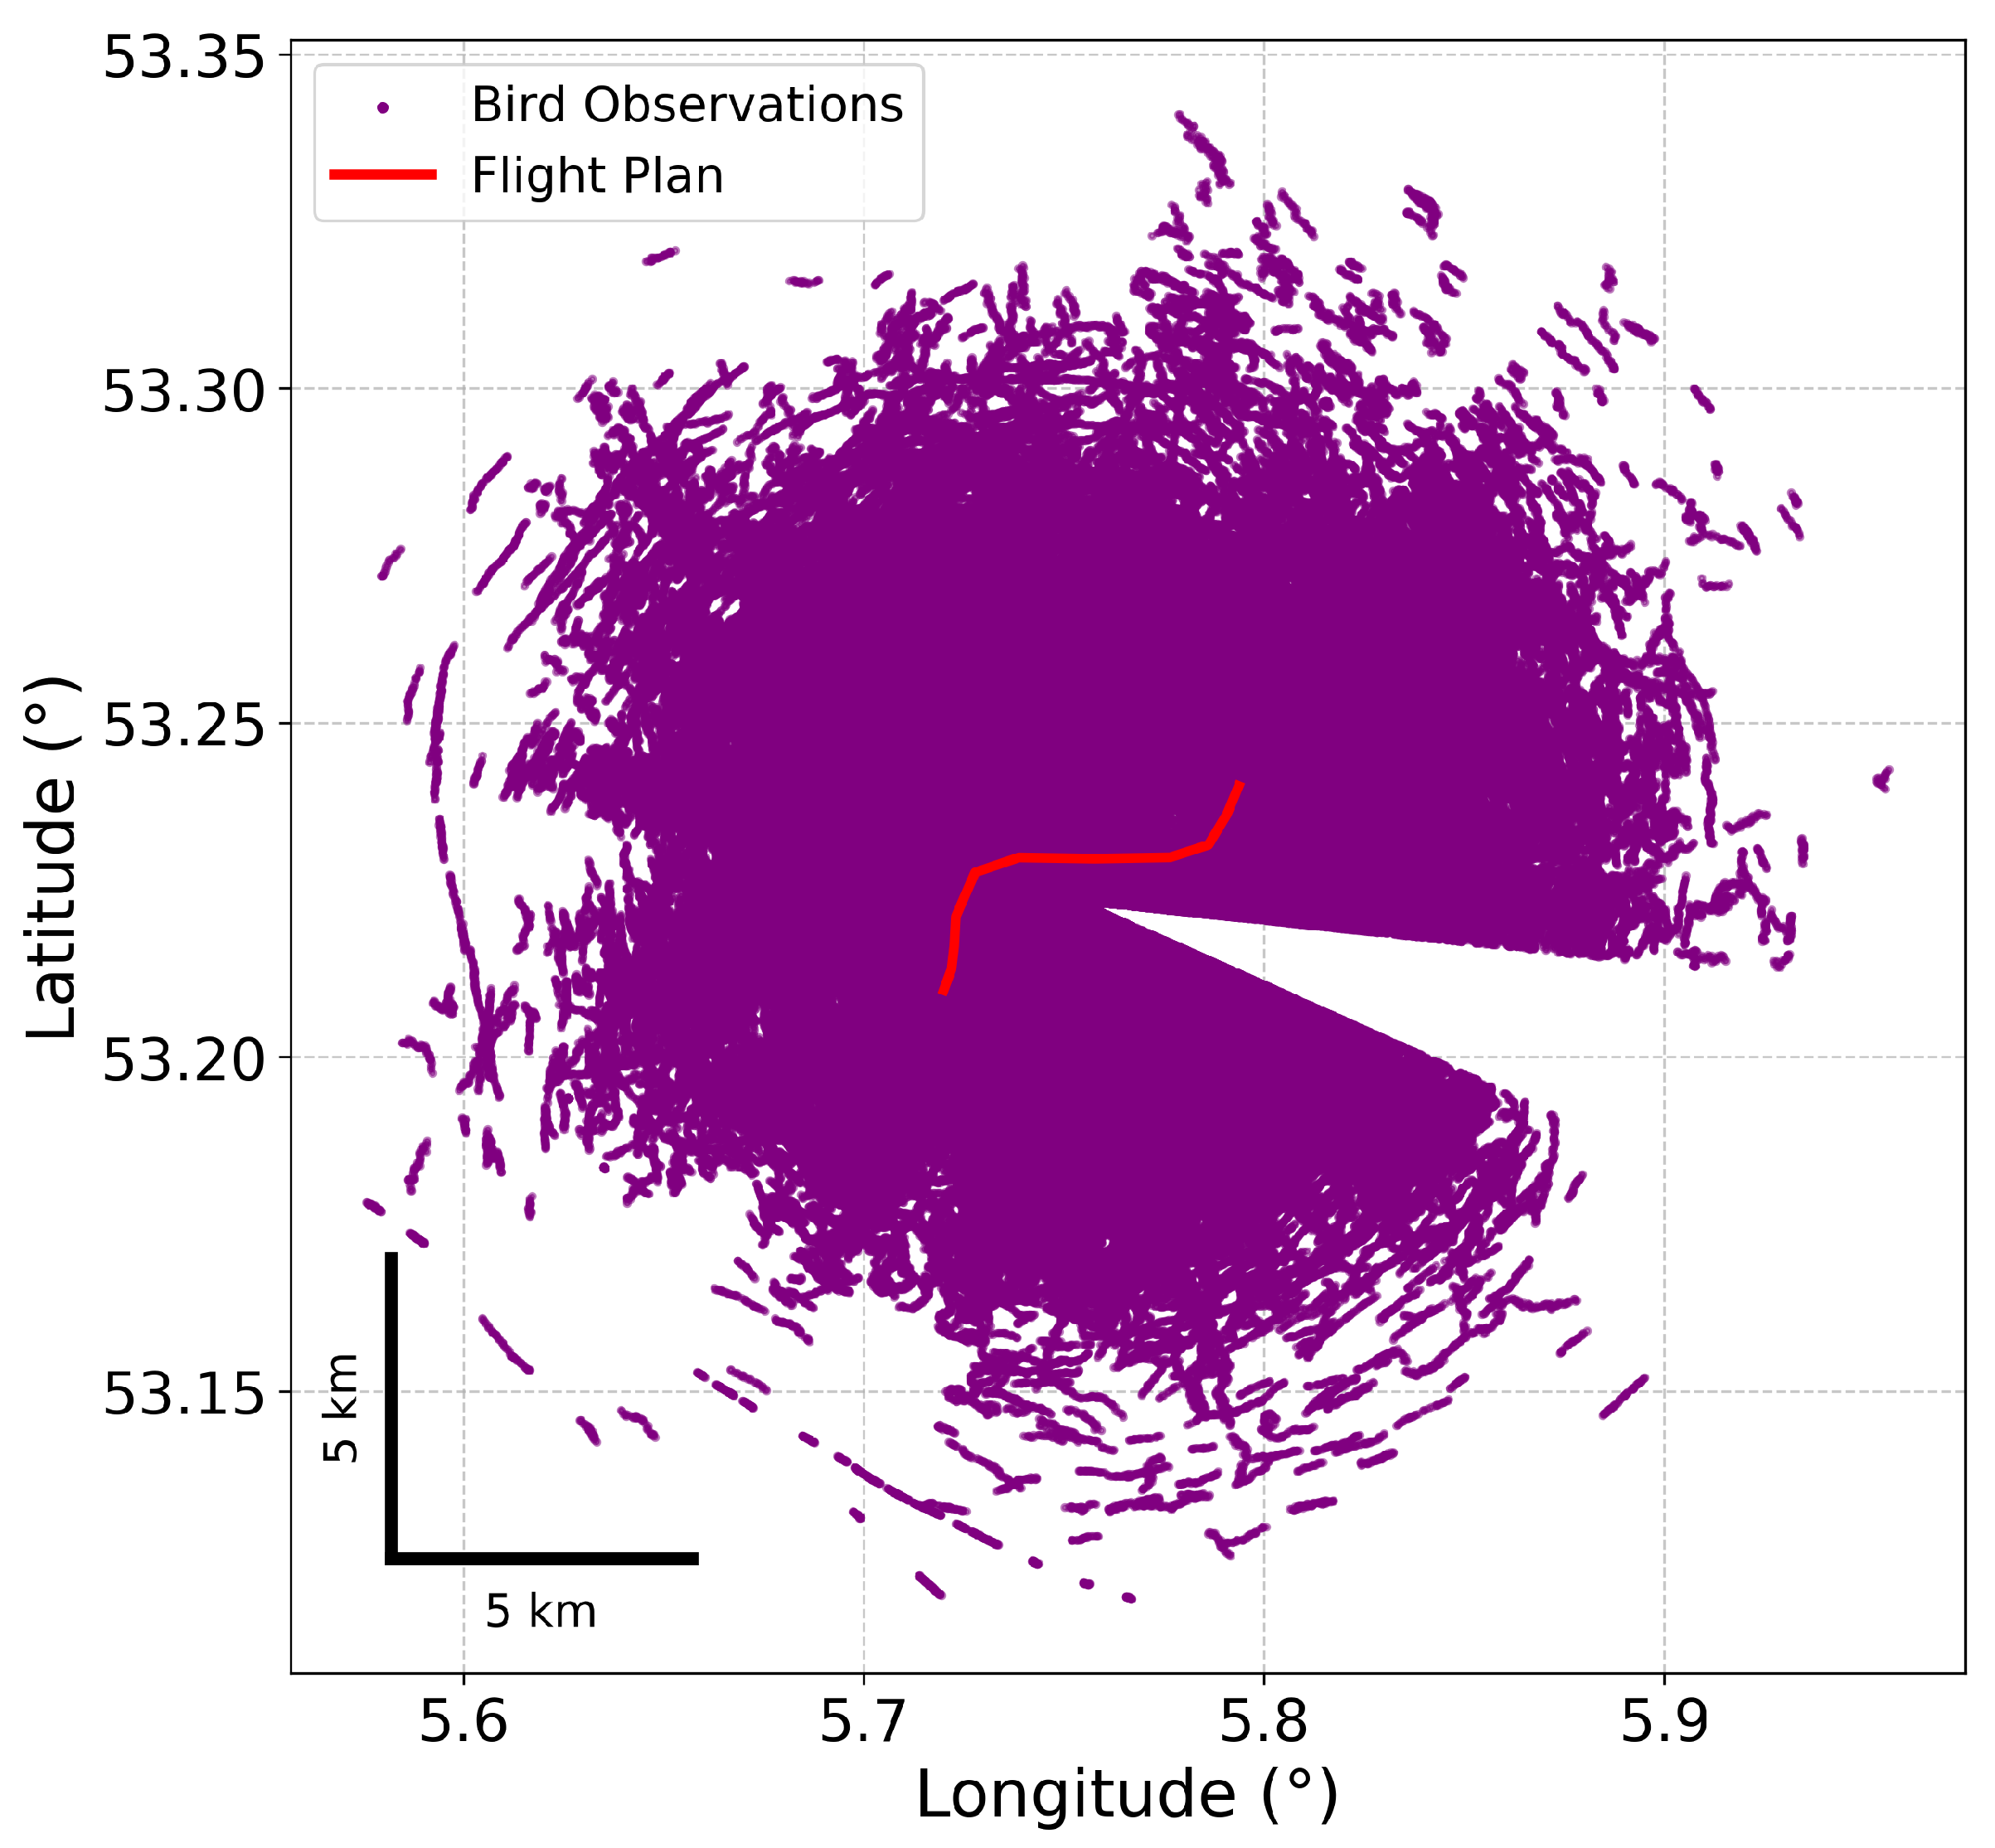
Figure 5.
Collision, warning and caution envelopes for various configurations in forward and vertical flight, source: [26], used with permission.
Figure 5.
Collision, warning and caution envelopes for various configurations in forward and vertical flight, source: [26], used with permission.
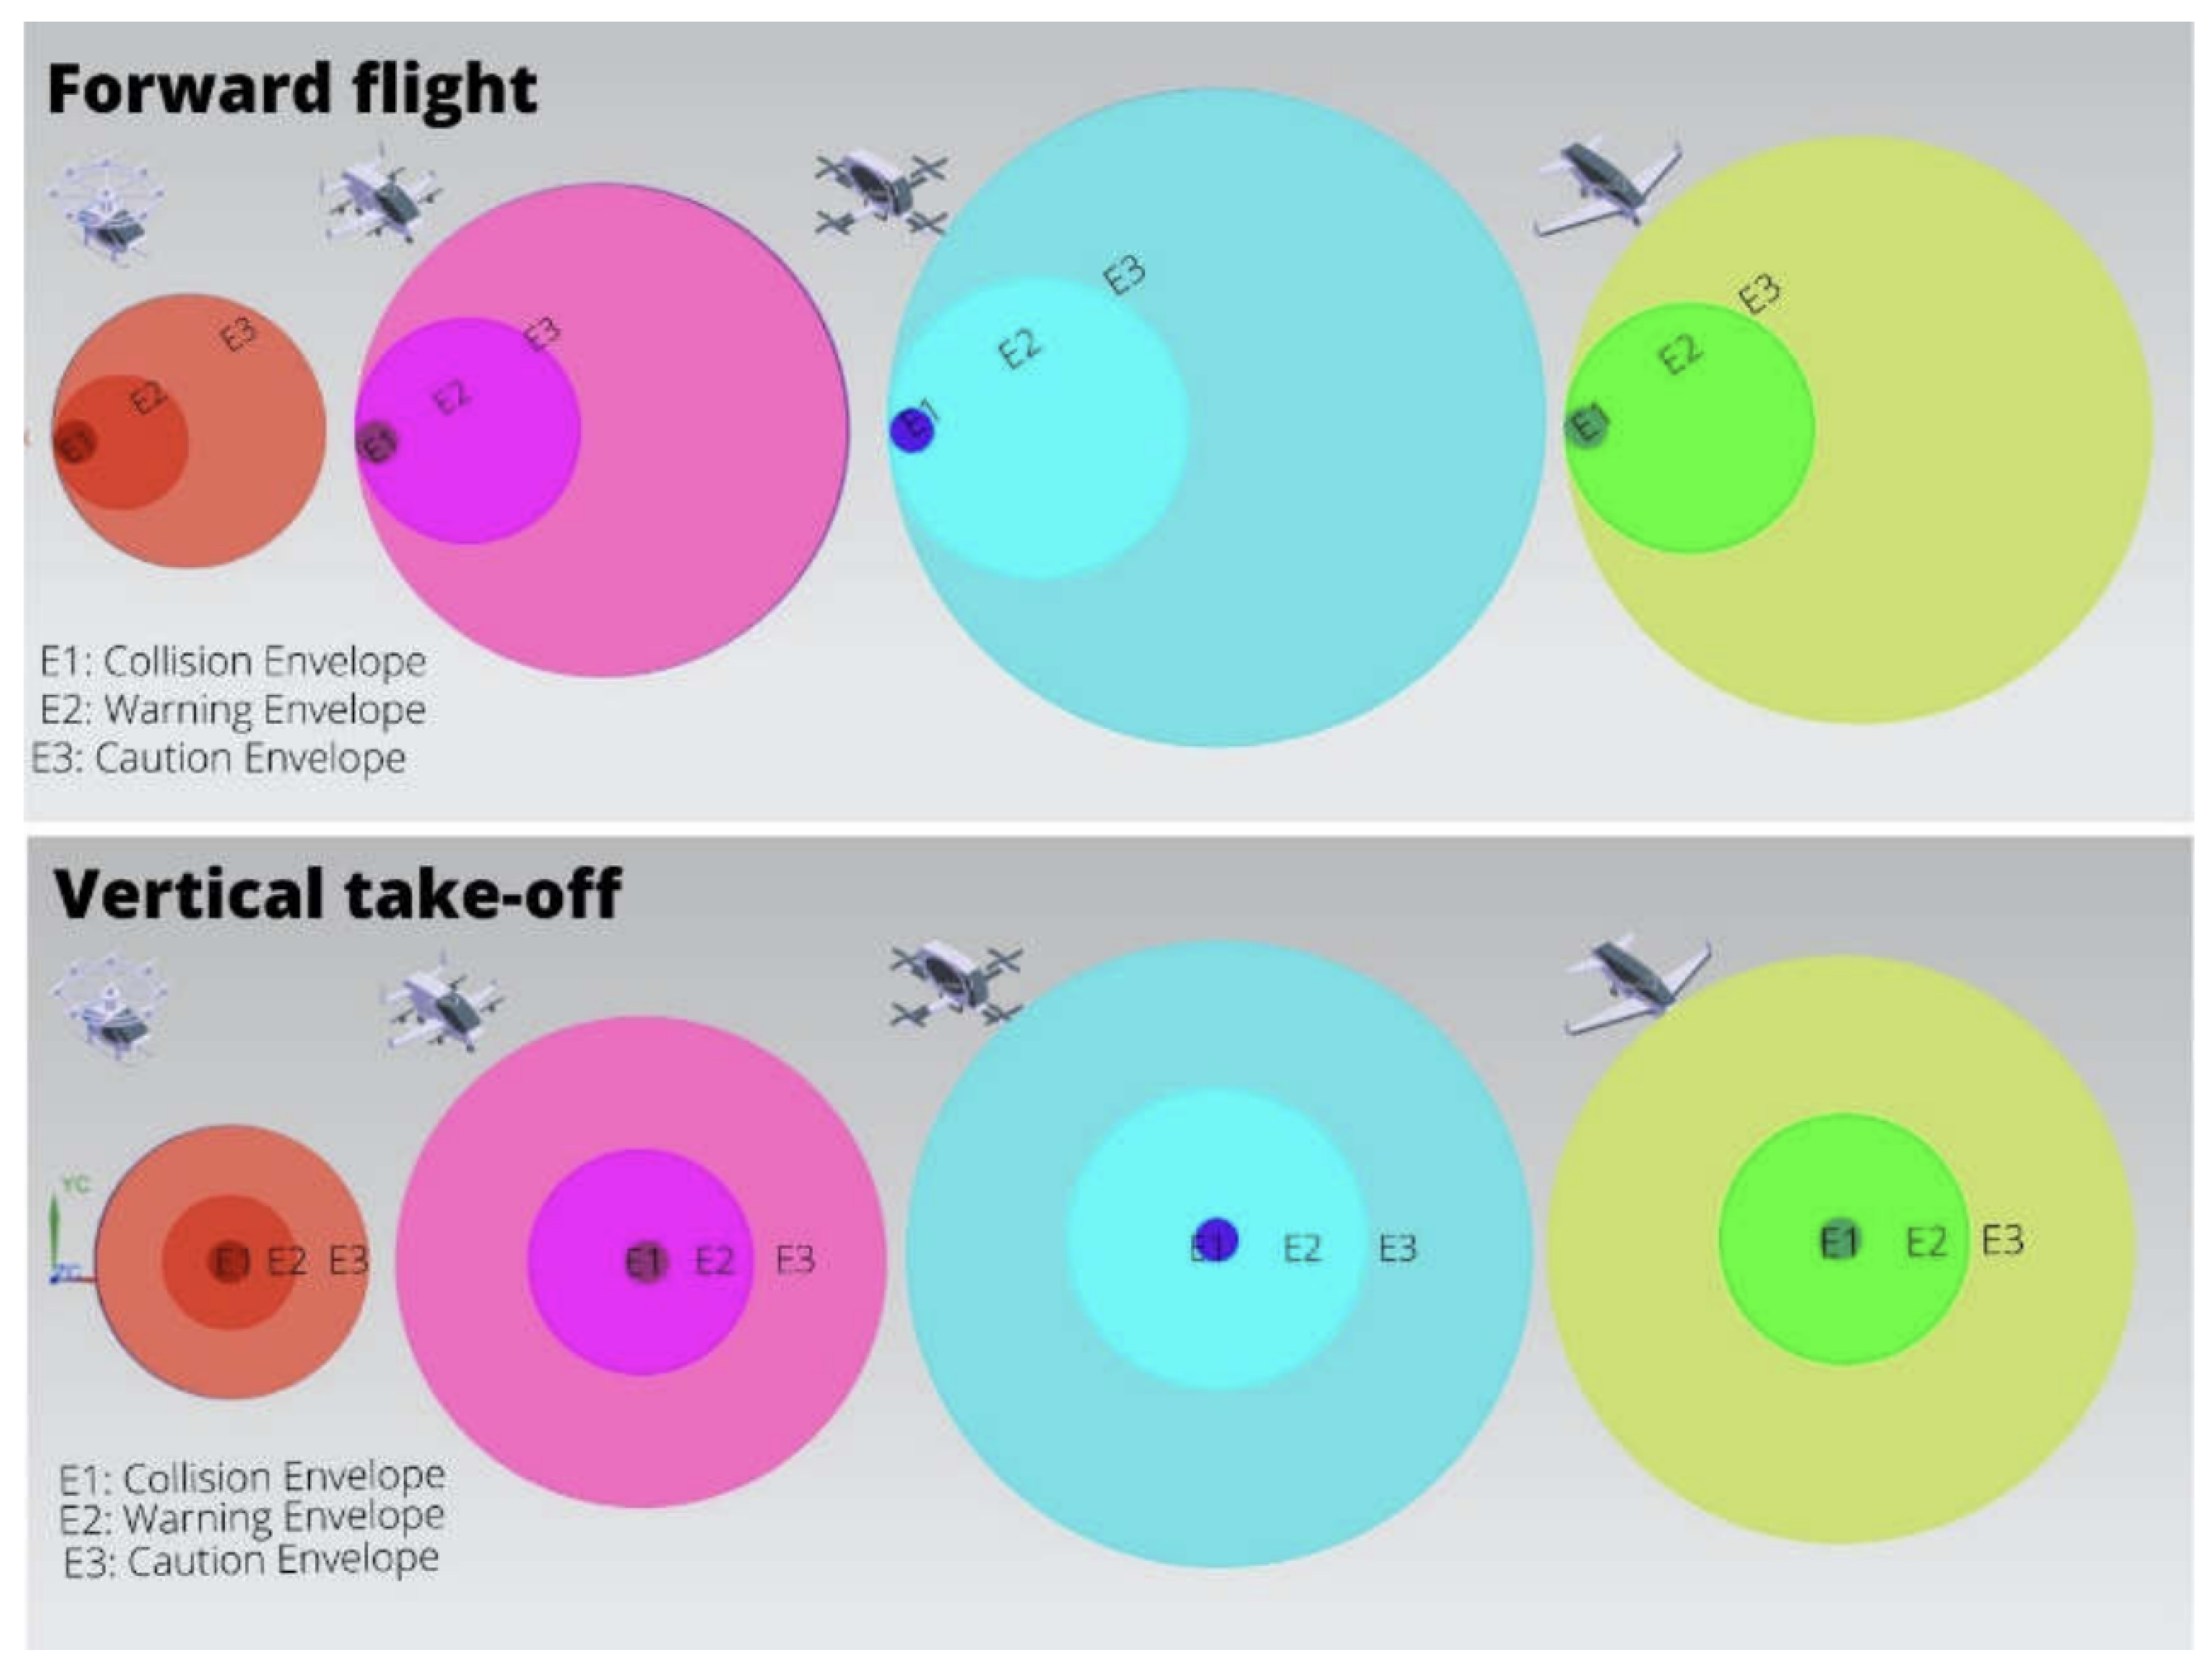
Figure 6.
Simulation: Average number of incursions into the collision envelope (i.e., the number of collisions), without UAM-CAS, by month. Leeuwarden: Average reported monthly bird strikes per 10,000 flight movements at Leeuwarden Air Base from 2000-2022 (RNLAF Bird Strike Database. Hans van Gasteren, personal communication, 19 December 2024).
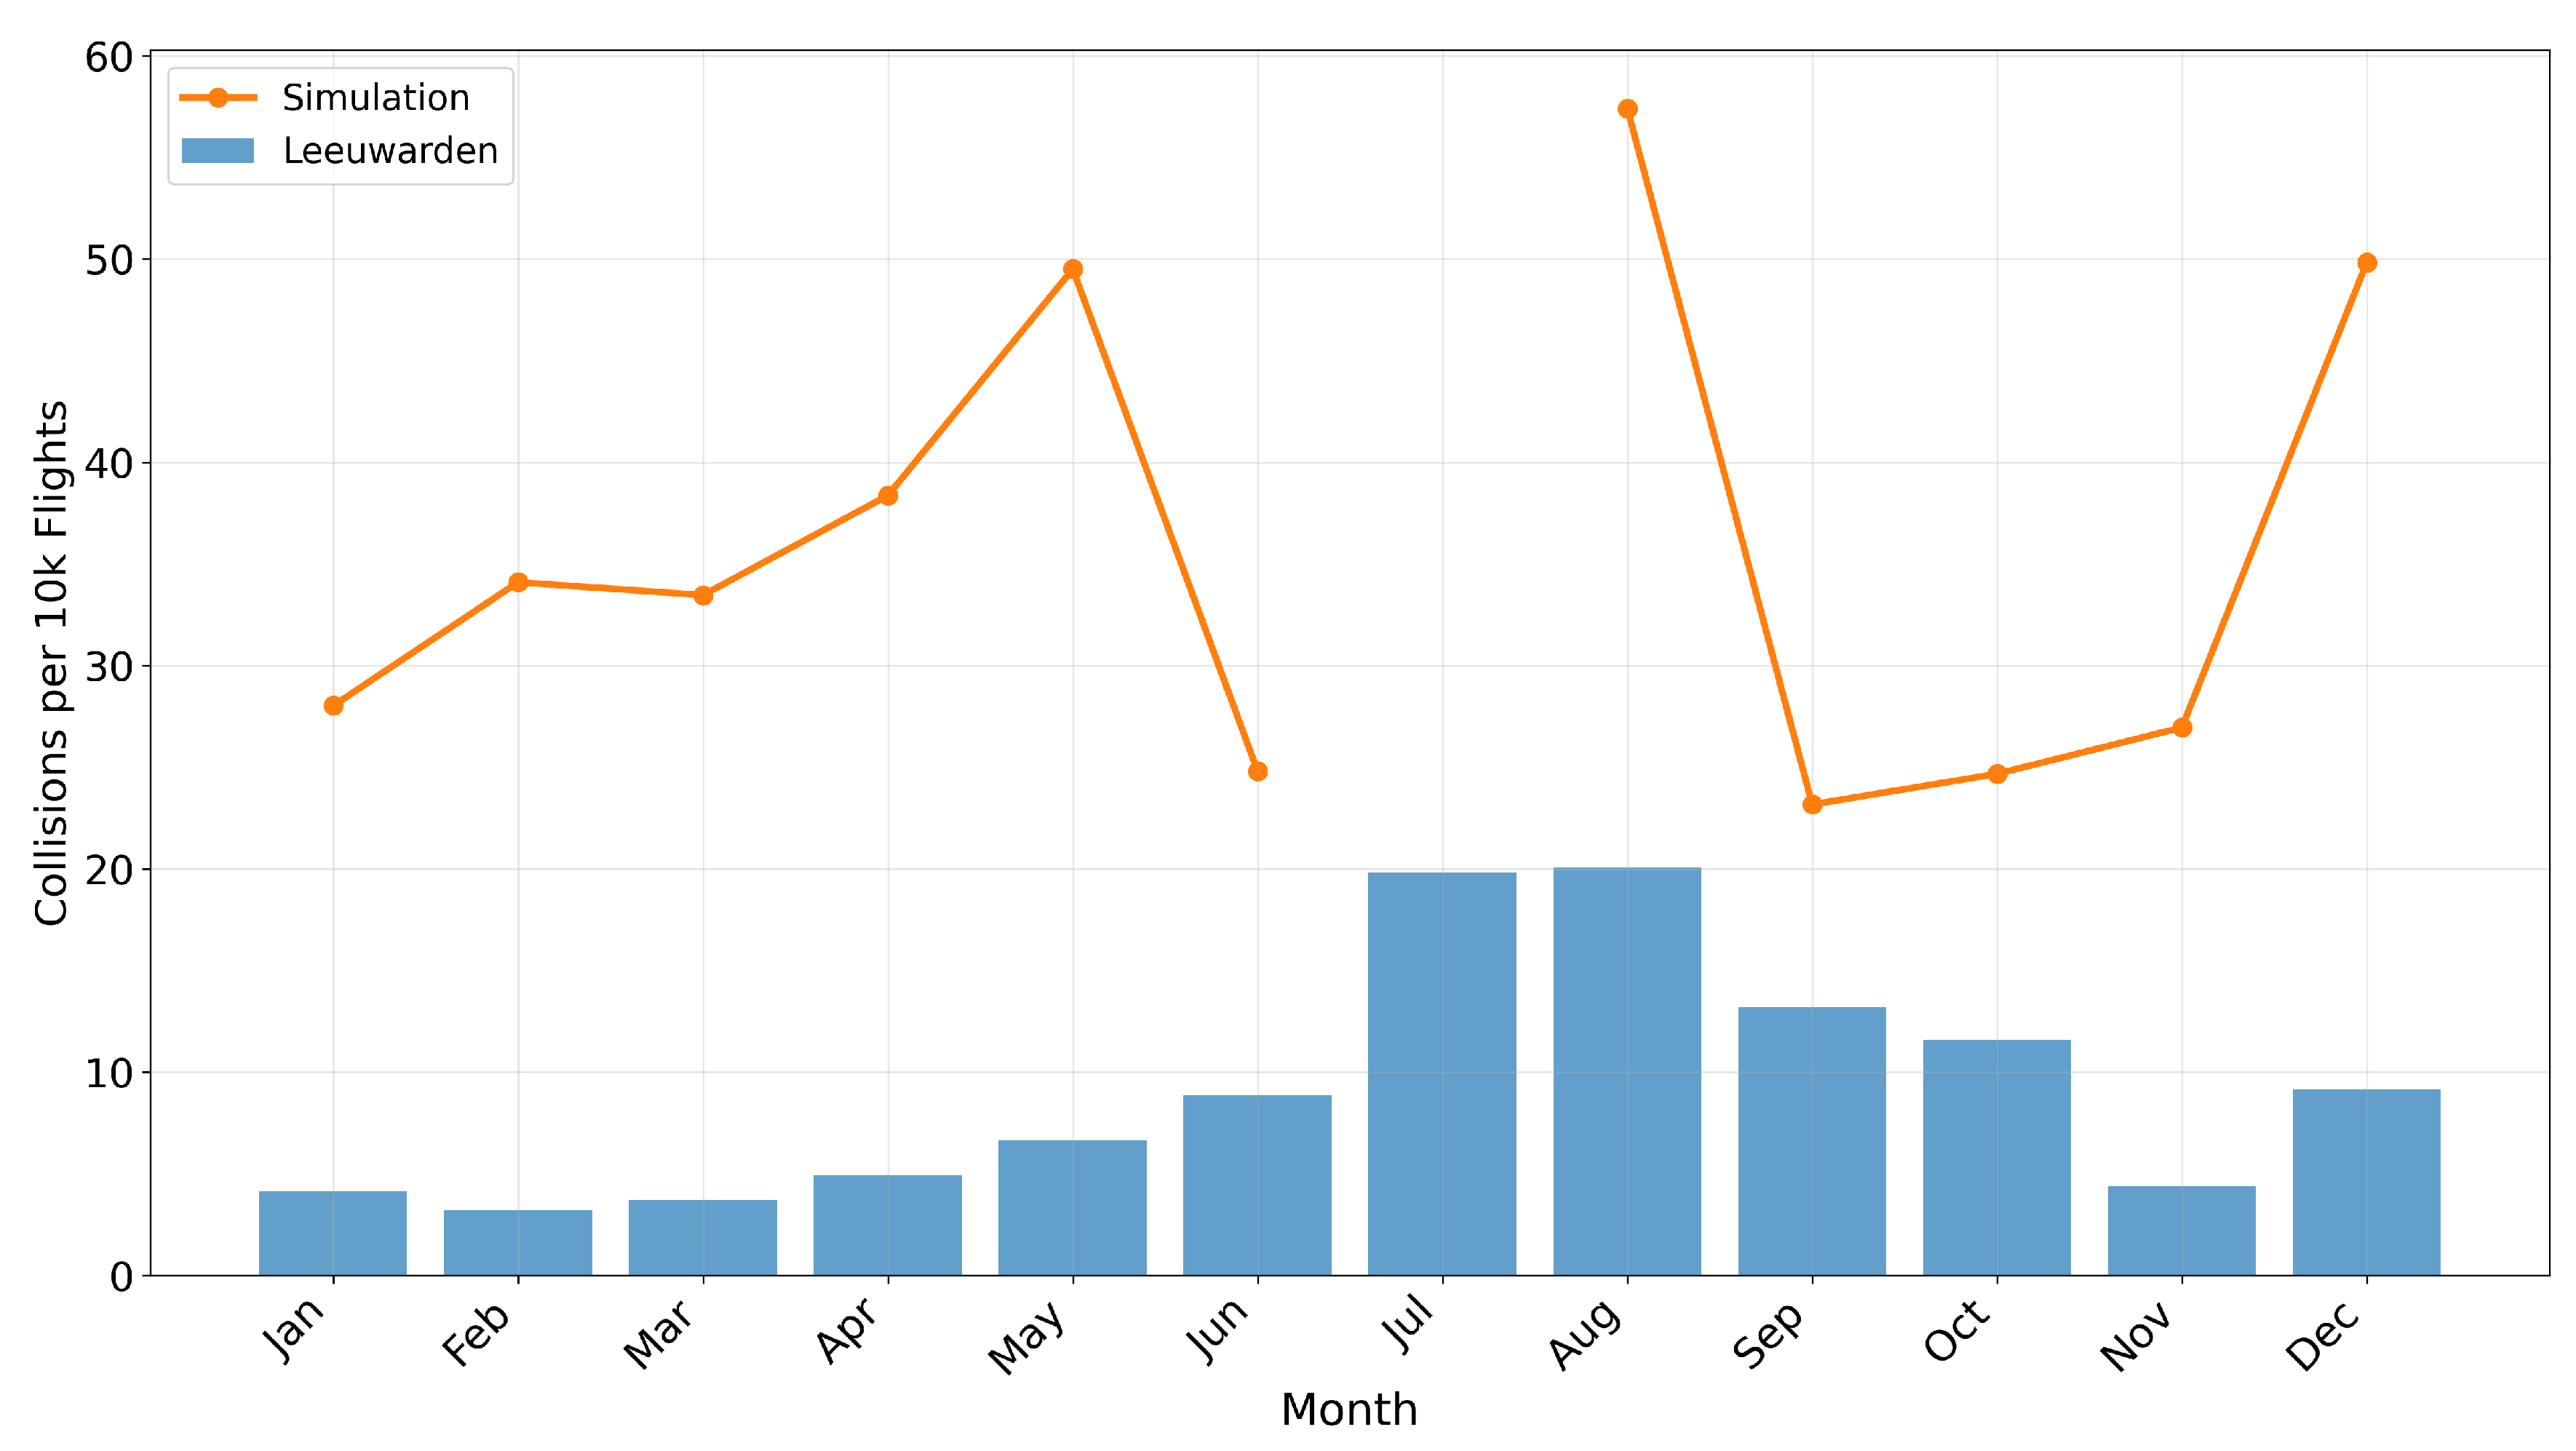
Figure 7.
Distribution of bird incursions into the collision envelope (i.e., actual collisions) for each UAM configuration, per 10,000 flights. Across all configurations: , .
Figure 7.
Distribution of bird incursions into the collision envelope (i.e., actual collisions) for each UAM configuration, per 10,000 flights. Across all configurations: , .
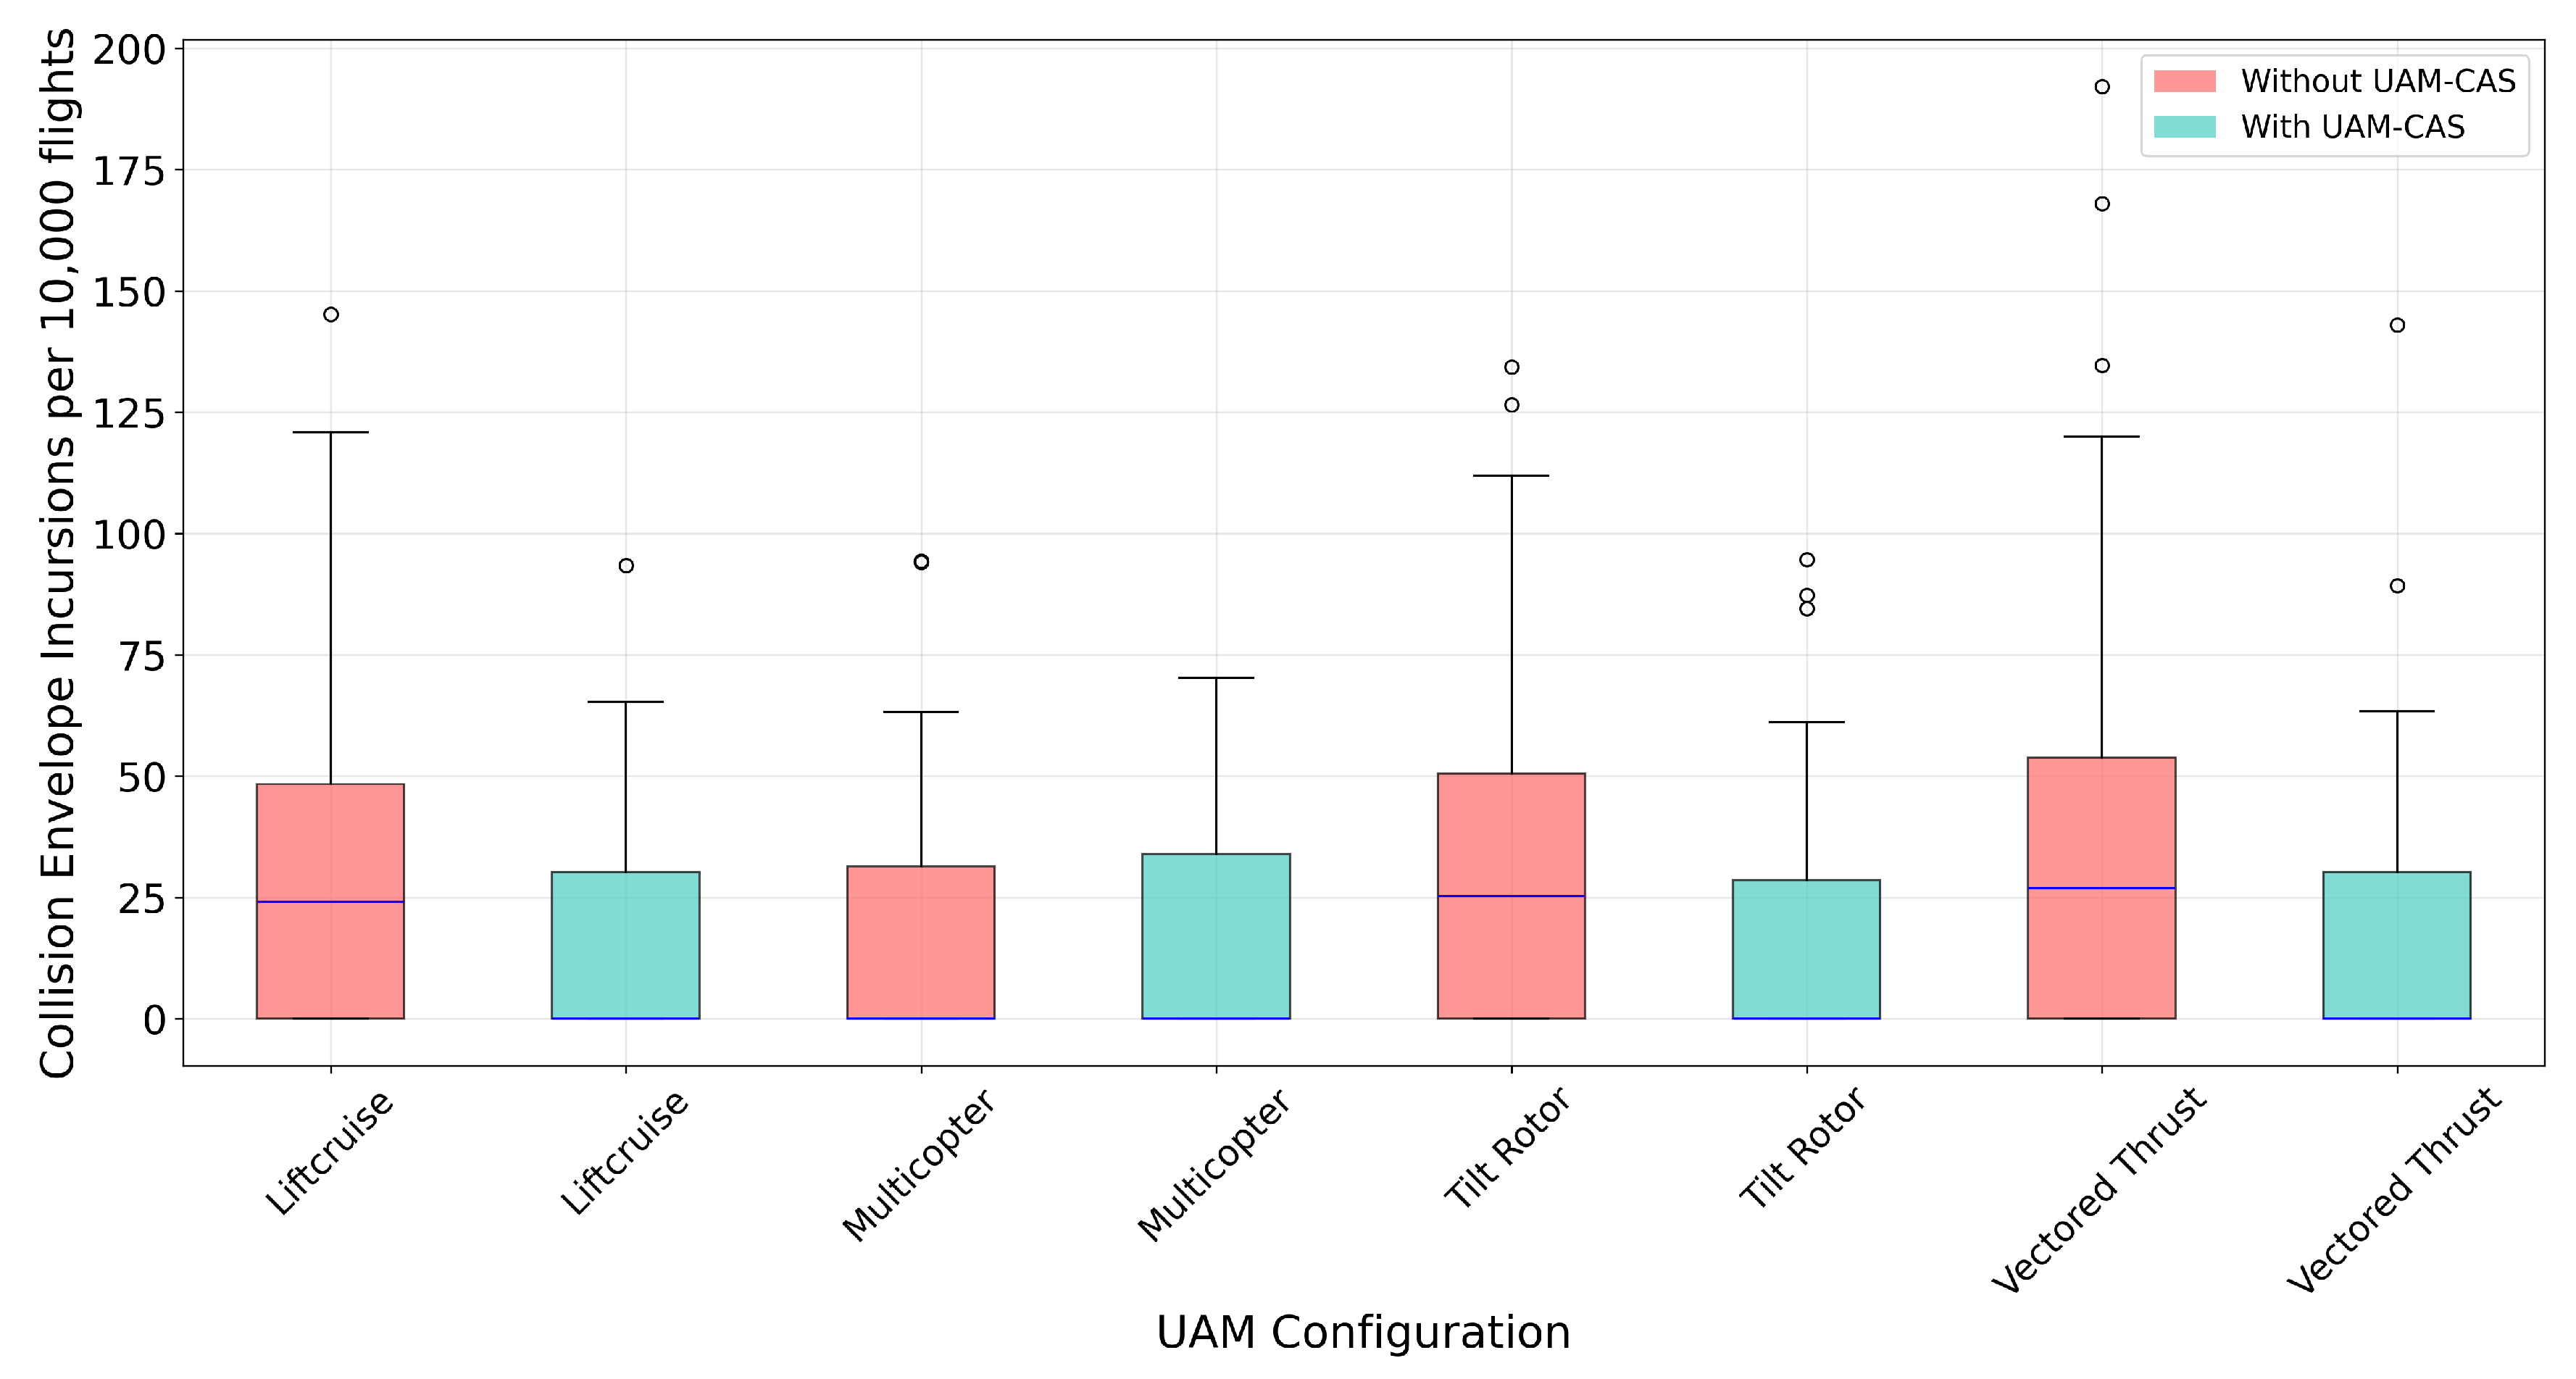
Figure 8.
Distribution of bird incursions into the warning envelope for each UAM configuration per 10,000 flights. Across all configurations: , .
Figure 8.
Distribution of bird incursions into the warning envelope for each UAM configuration per 10,000 flights. Across all configurations: , .
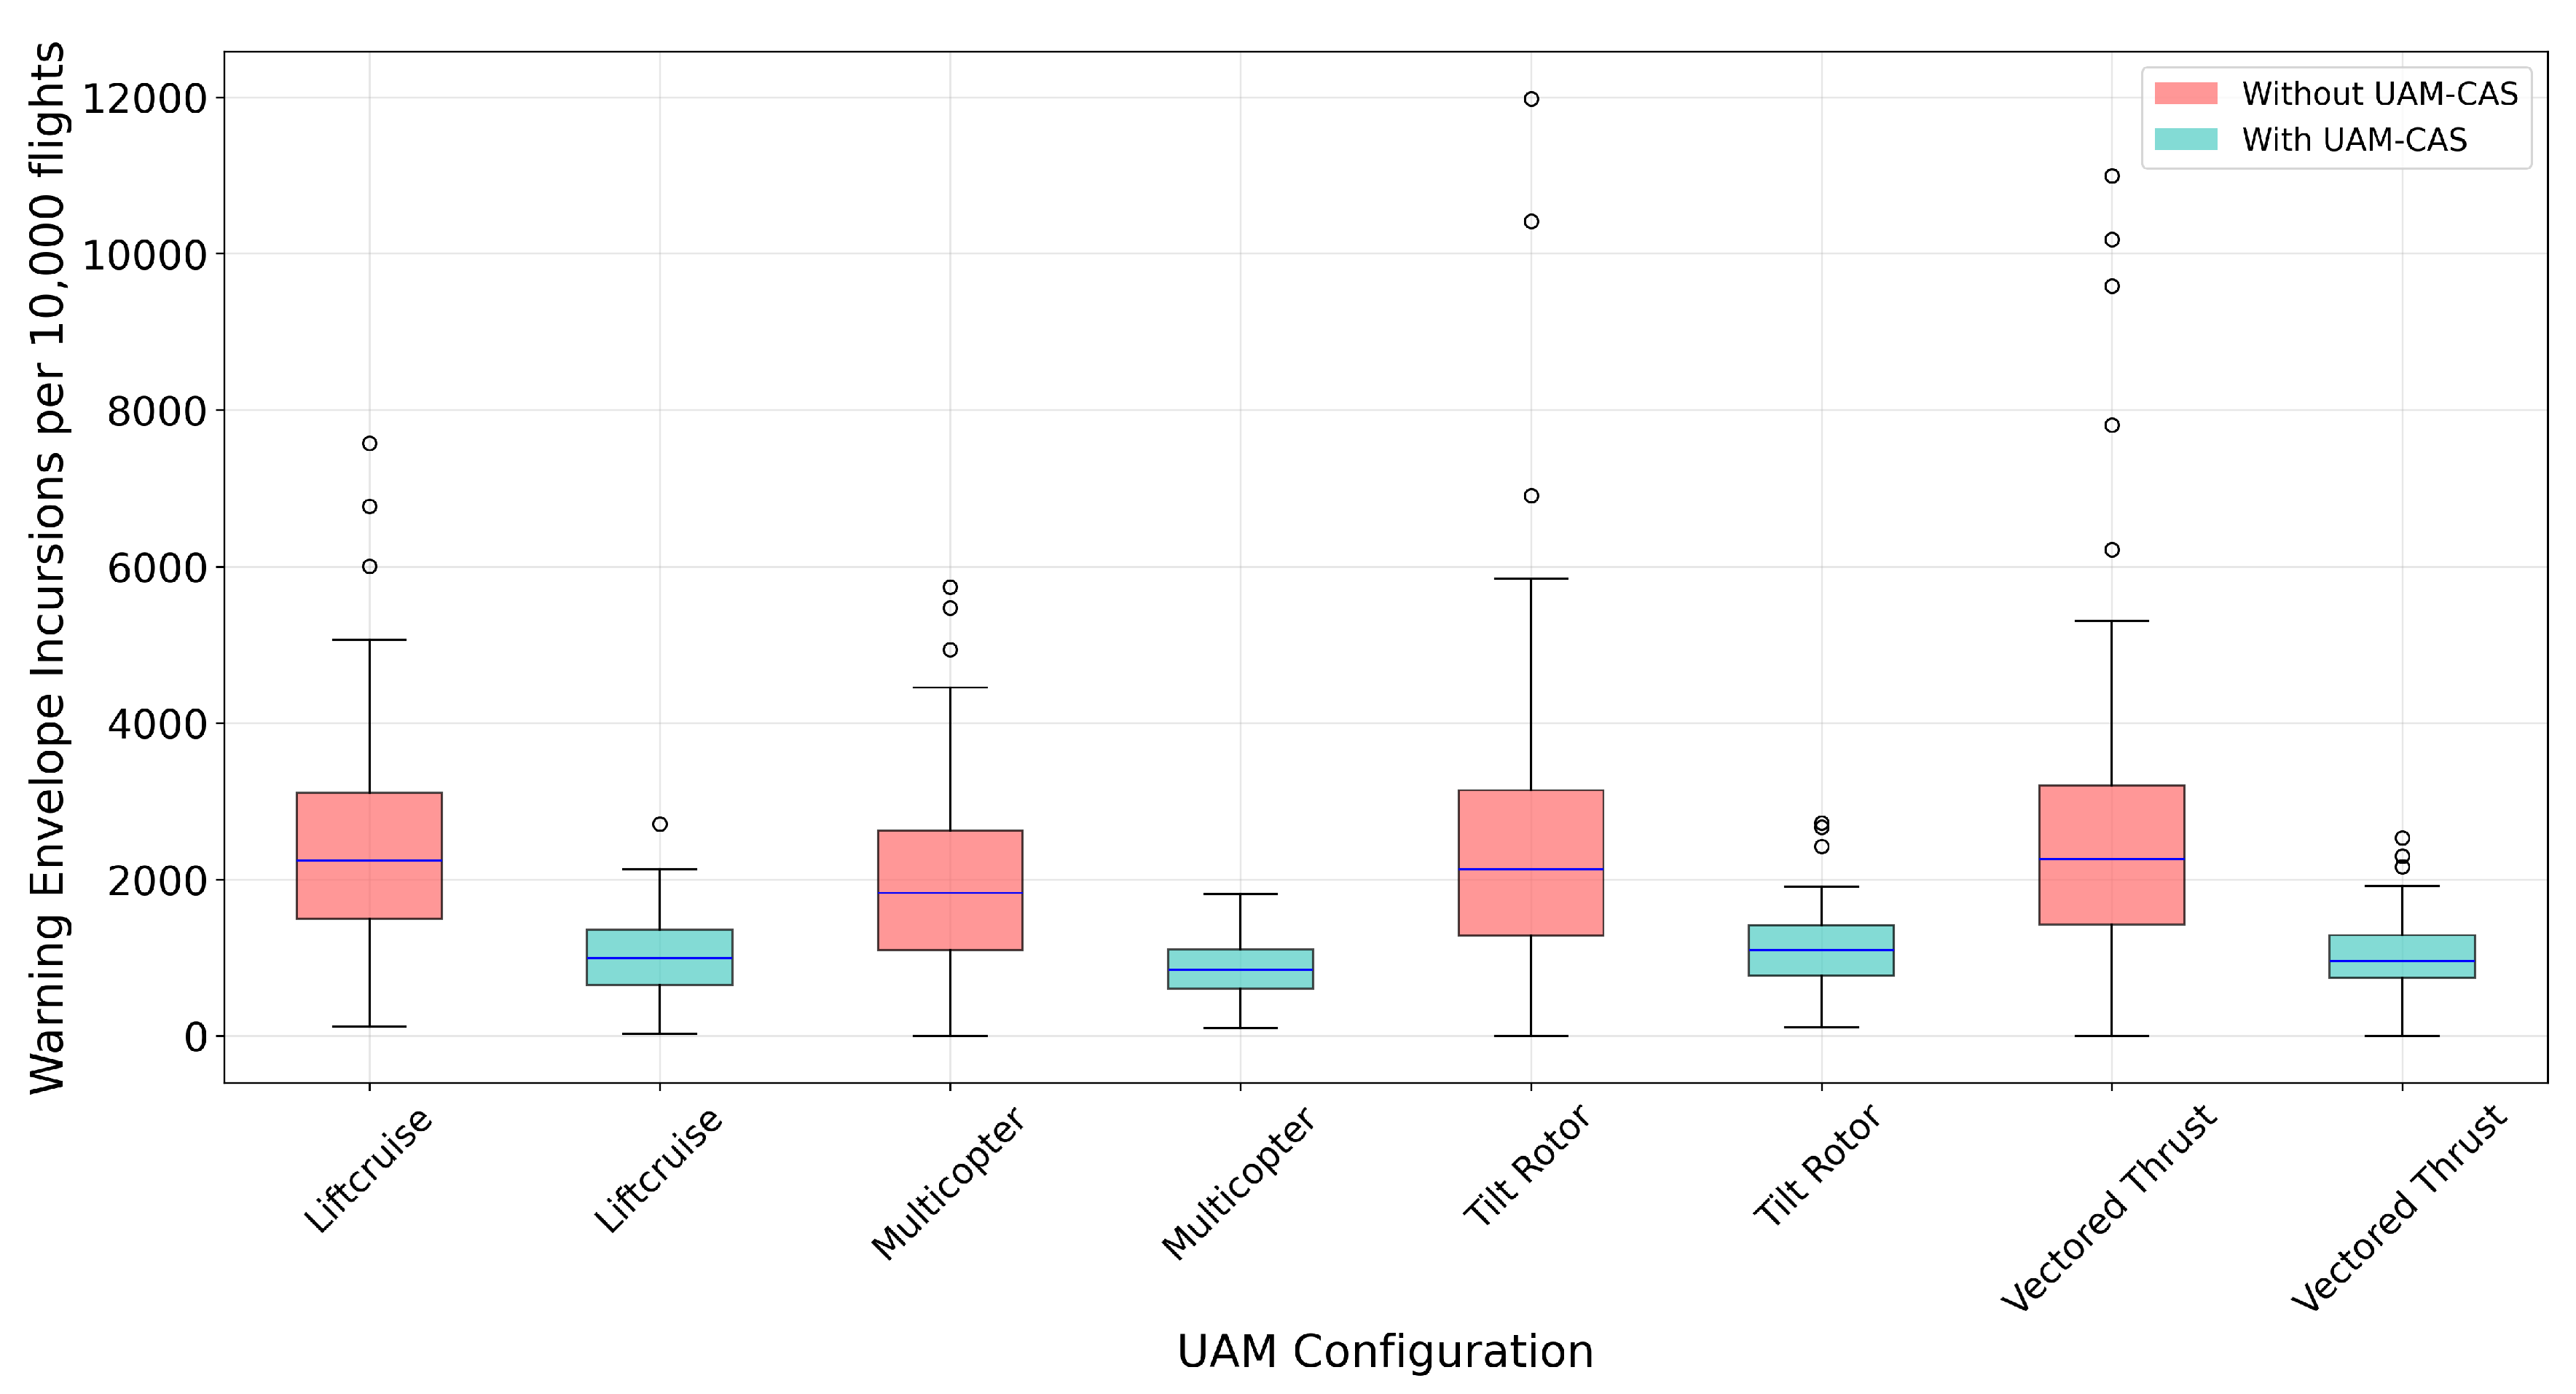
Figure 9.
Distribution of bird incursions into the caution envelope for each UAM configuration per 10,000 flights. Across all configurations: , .
Figure 9.
Distribution of bird incursions into the caution envelope for each UAM configuration per 10,000 flights. Across all configurations: , .
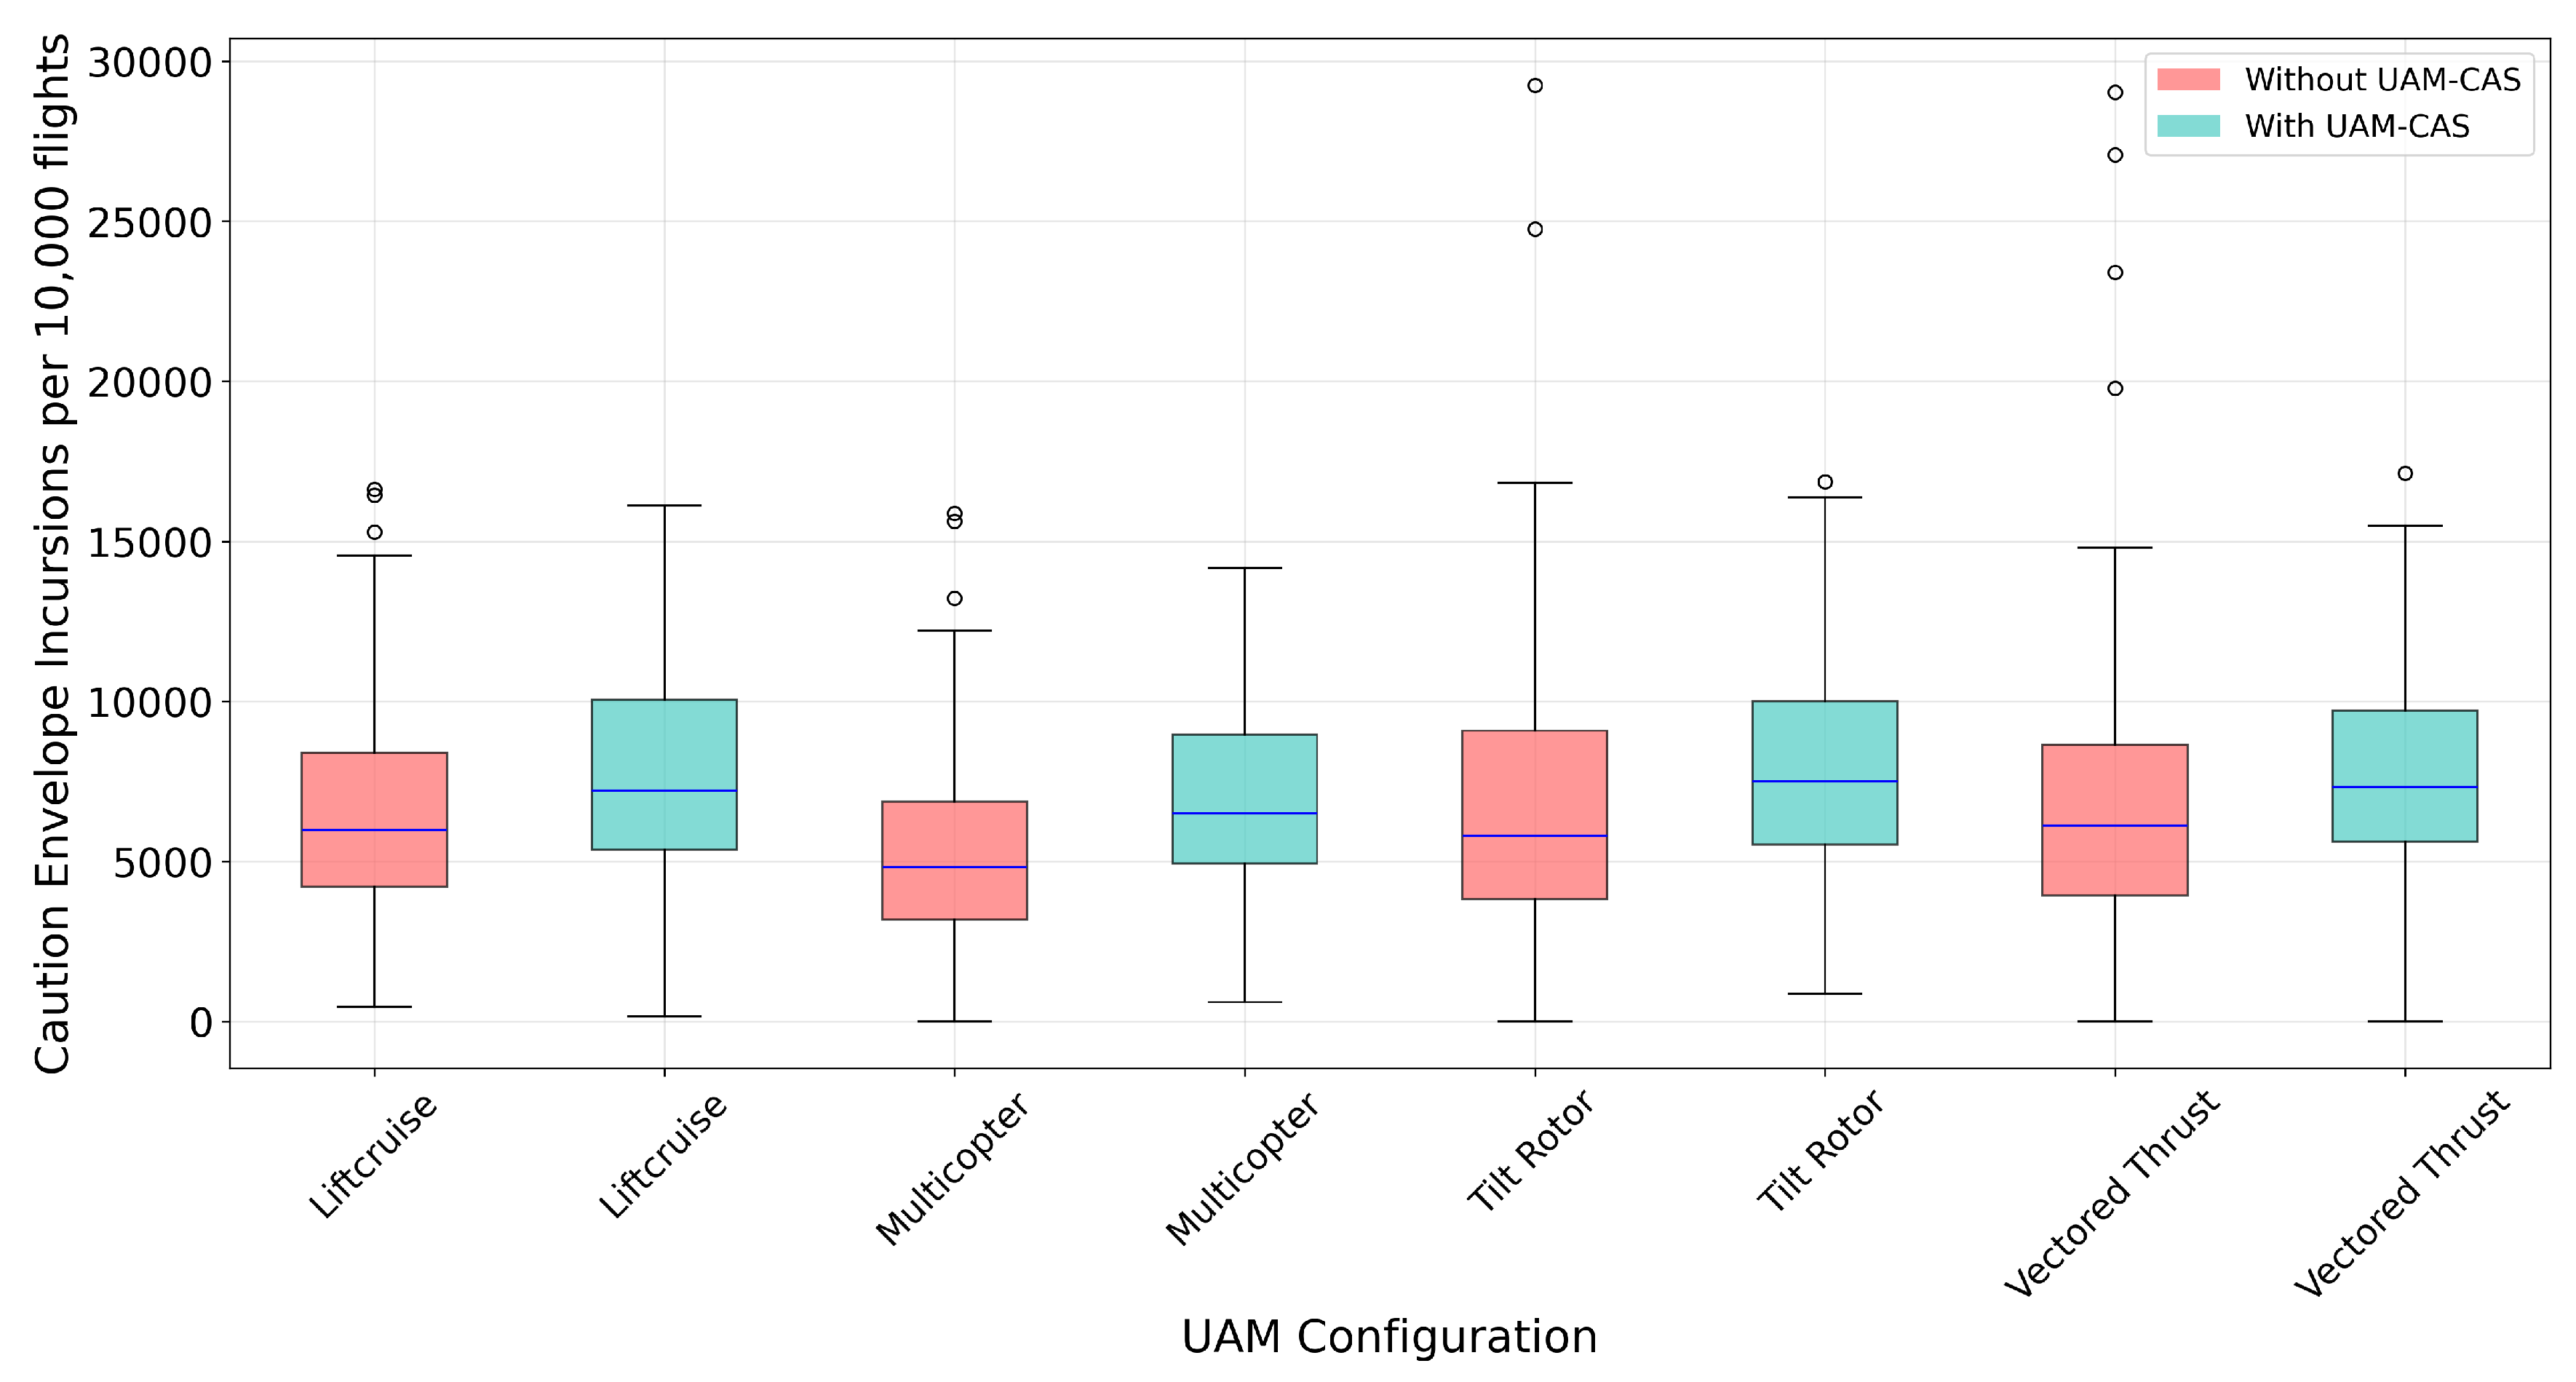
Figure 10.
Left axis: Summed delay of all flights in 10 minute bins. Right Axis: Distribution of radar bird detections, averaged across the 84 BMPs, binned into 10 minute intervals. Dawn and dusk windows are presented for Leeuwarden.
Figure 10.
Left axis: Summed delay of all flights in 10 minute bins. Right Axis: Distribution of radar bird detections, averaged across the 84 BMPs, binned into 10 minute intervals. Dawn and dusk windows are presented for Leeuwarden.
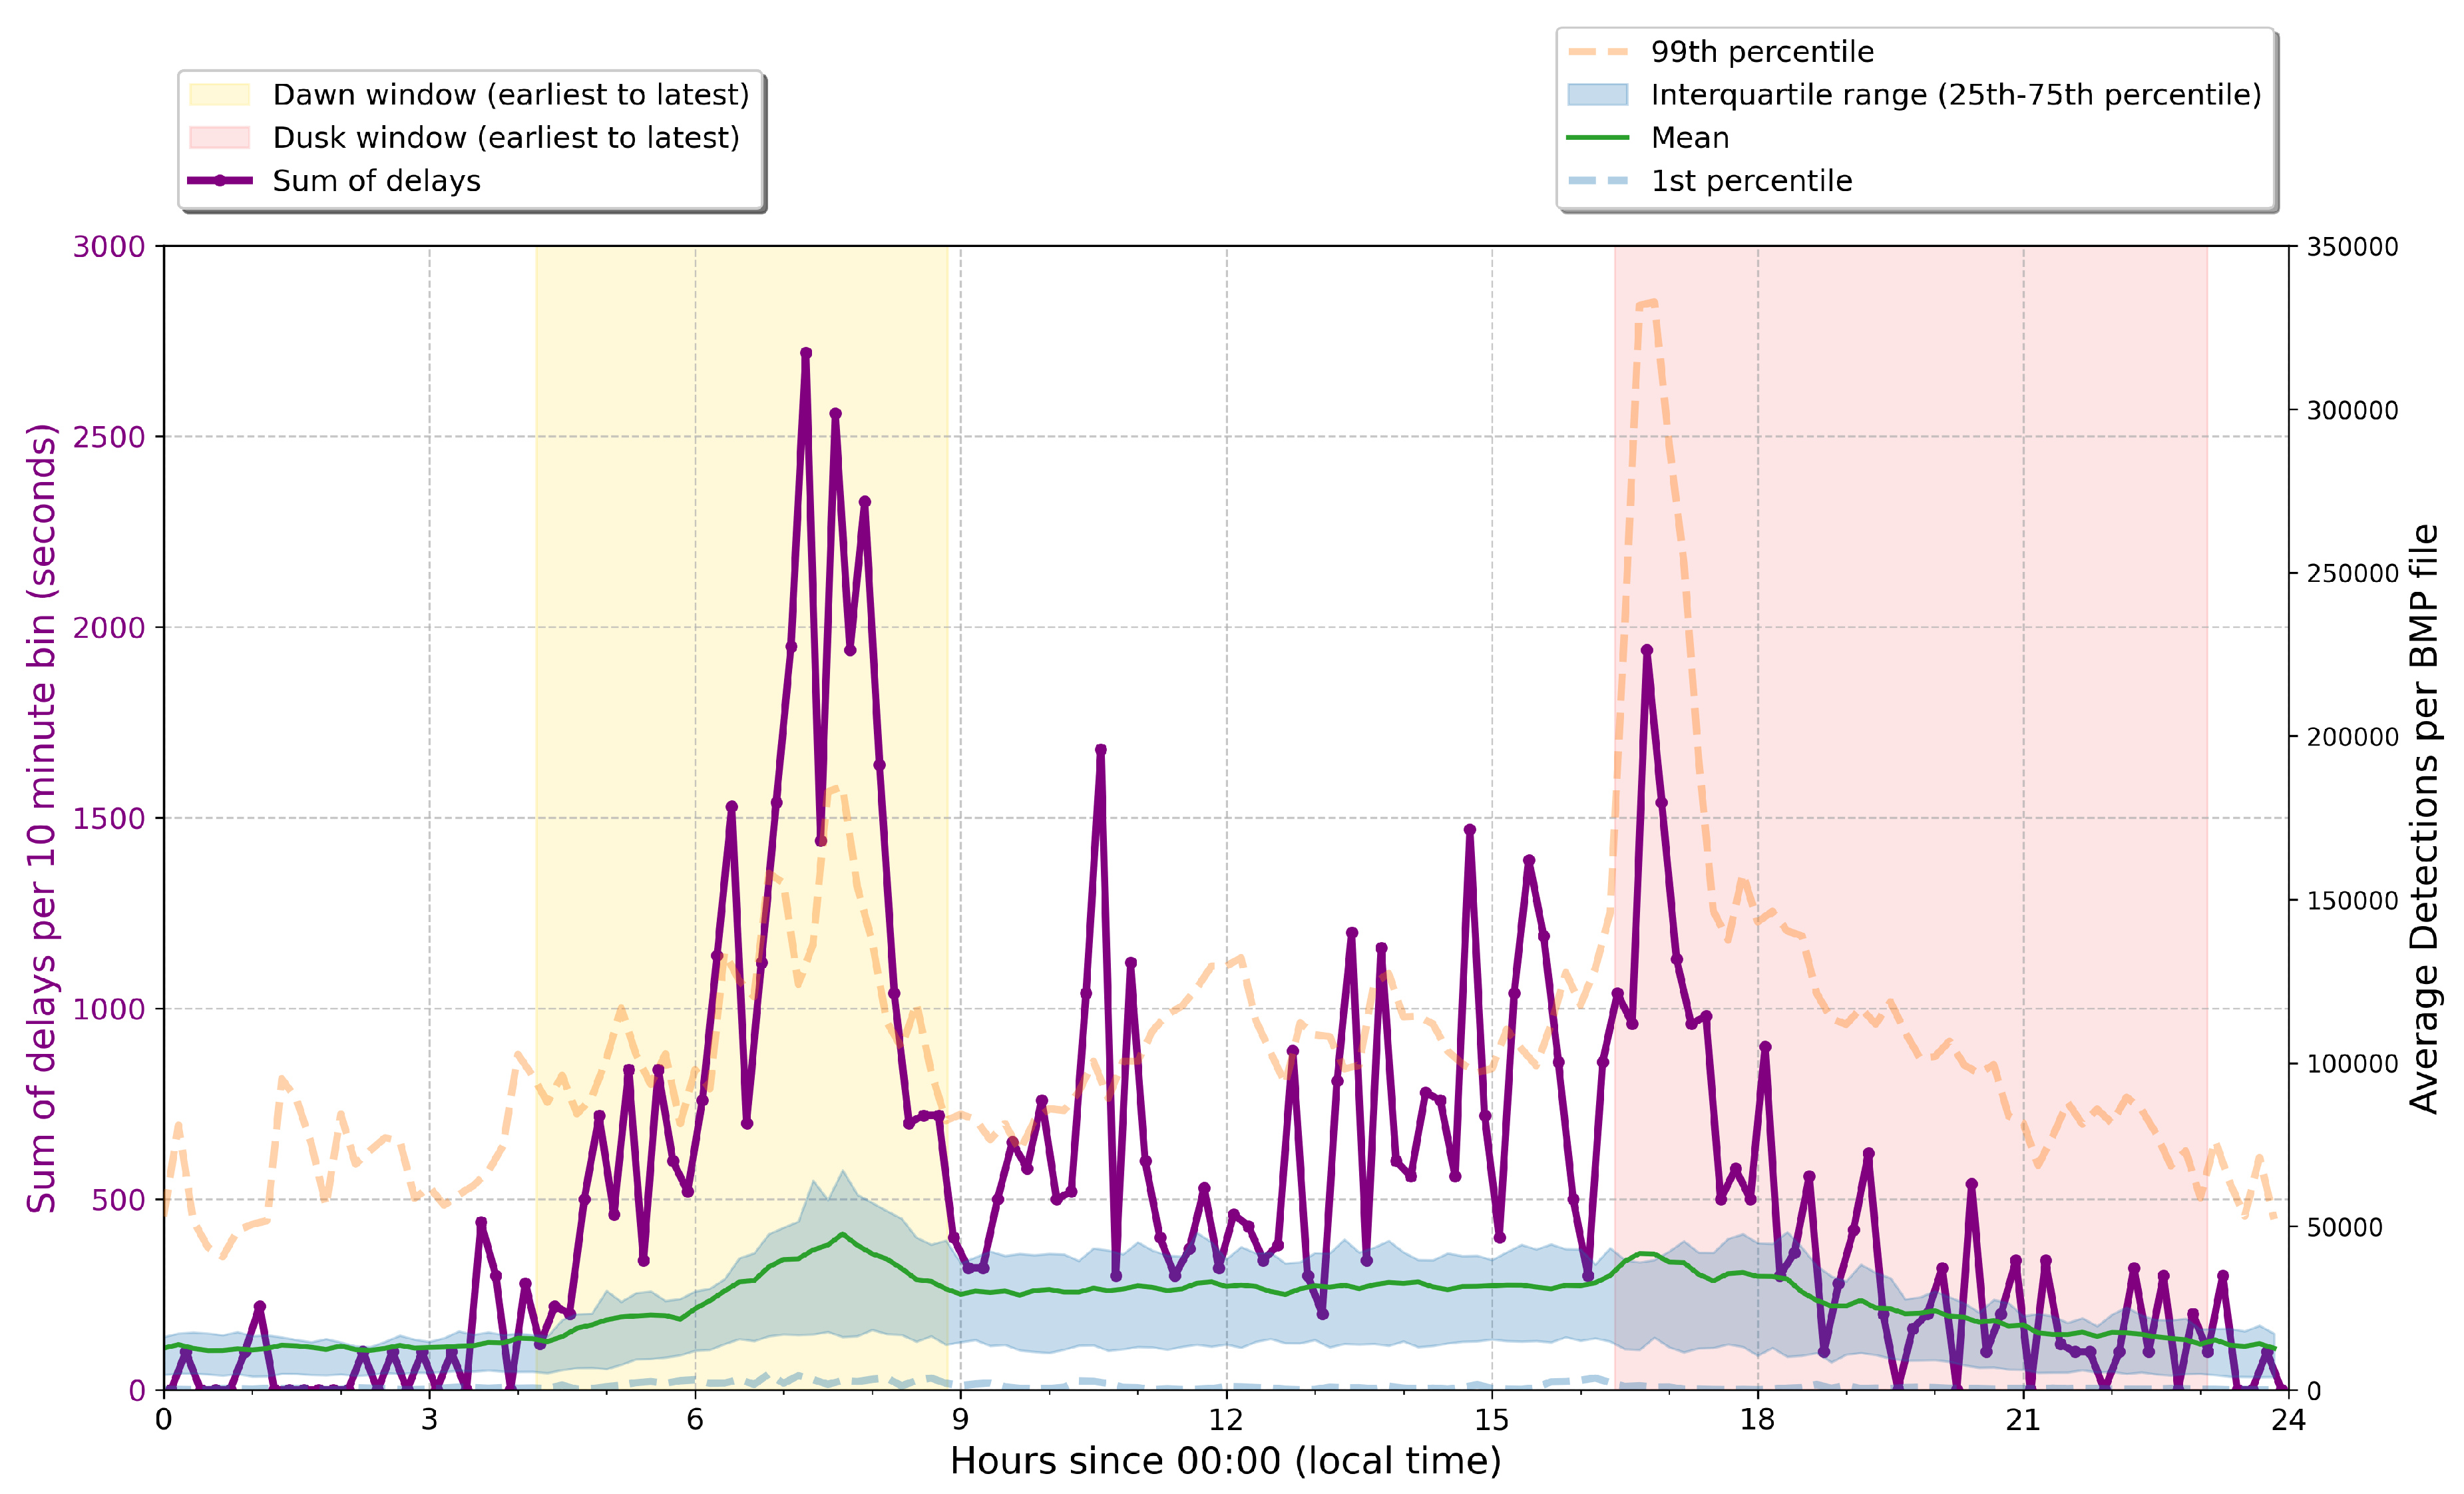
Figure 11.
Minimum closest point of approach, of birds who enter the aircraft’s envelopes, from the UAM aircraft, averaged over all simulation runs.
Figure 11.
Minimum closest point of approach, of birds who enter the aircraft’s envelopes, from the UAM aircraft, averaged over all simulation runs.
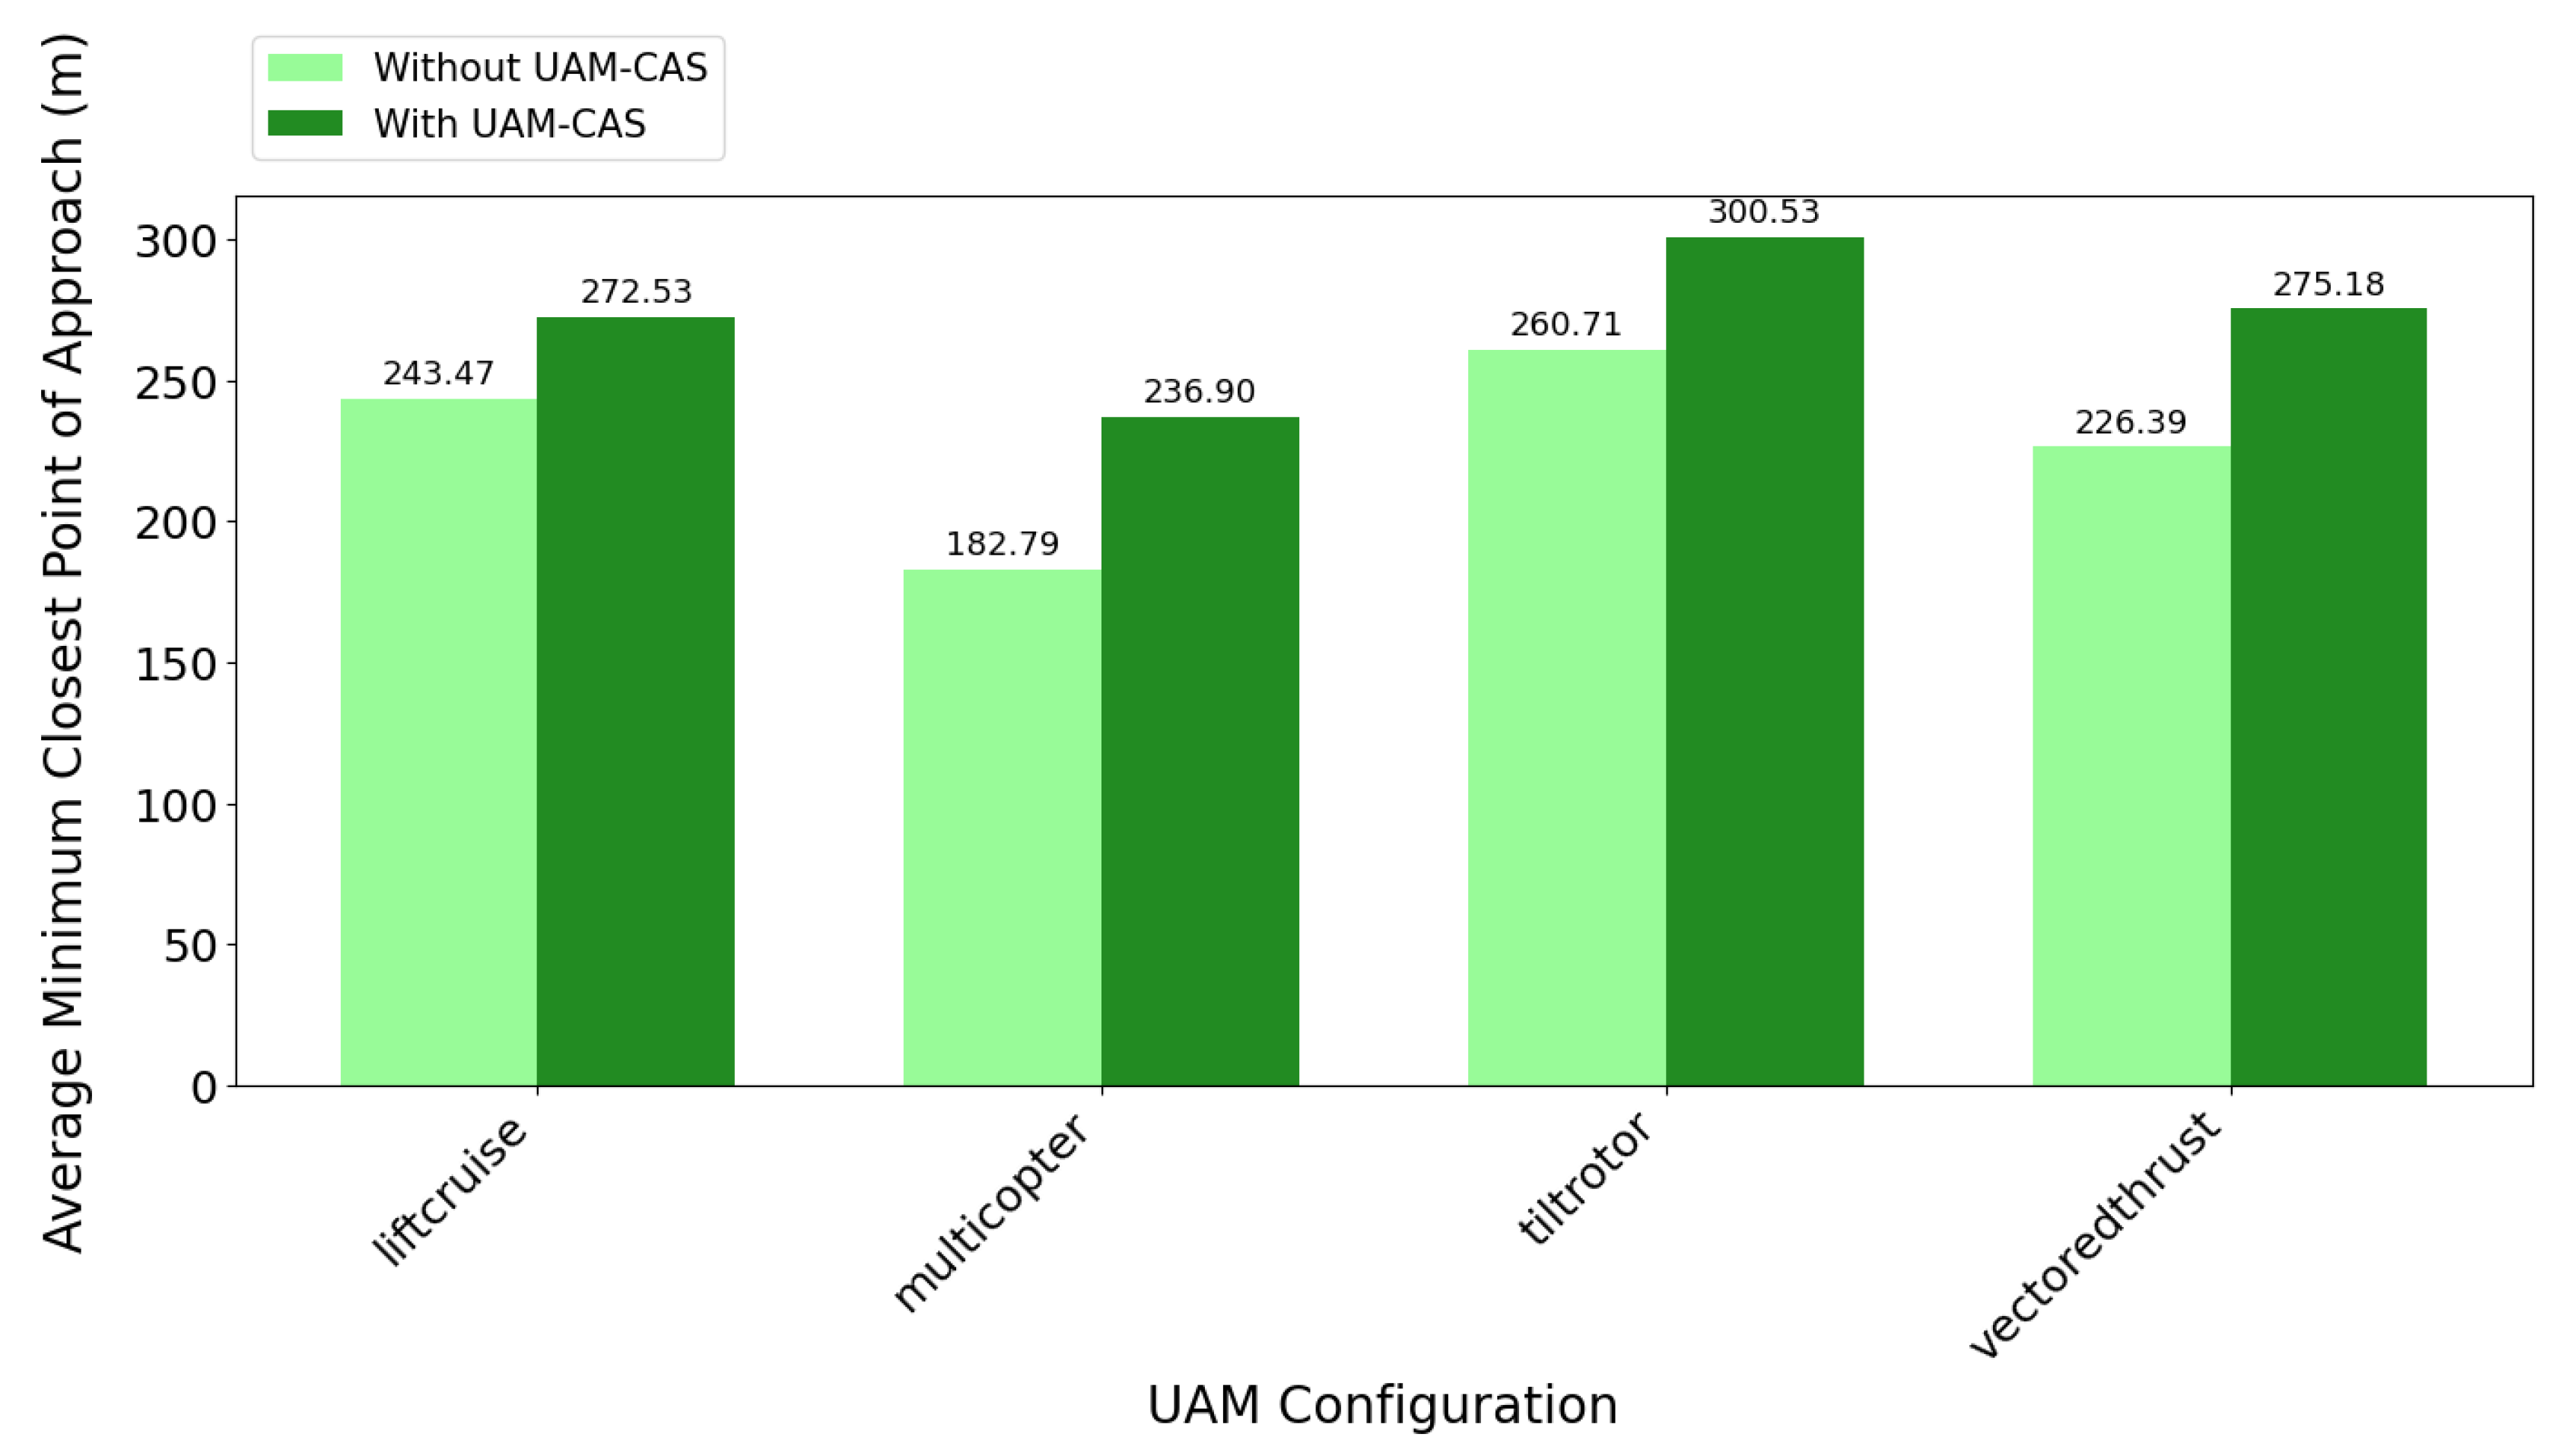
Figure 12.
Average UAM-CAS flight delay for each UAM configuration
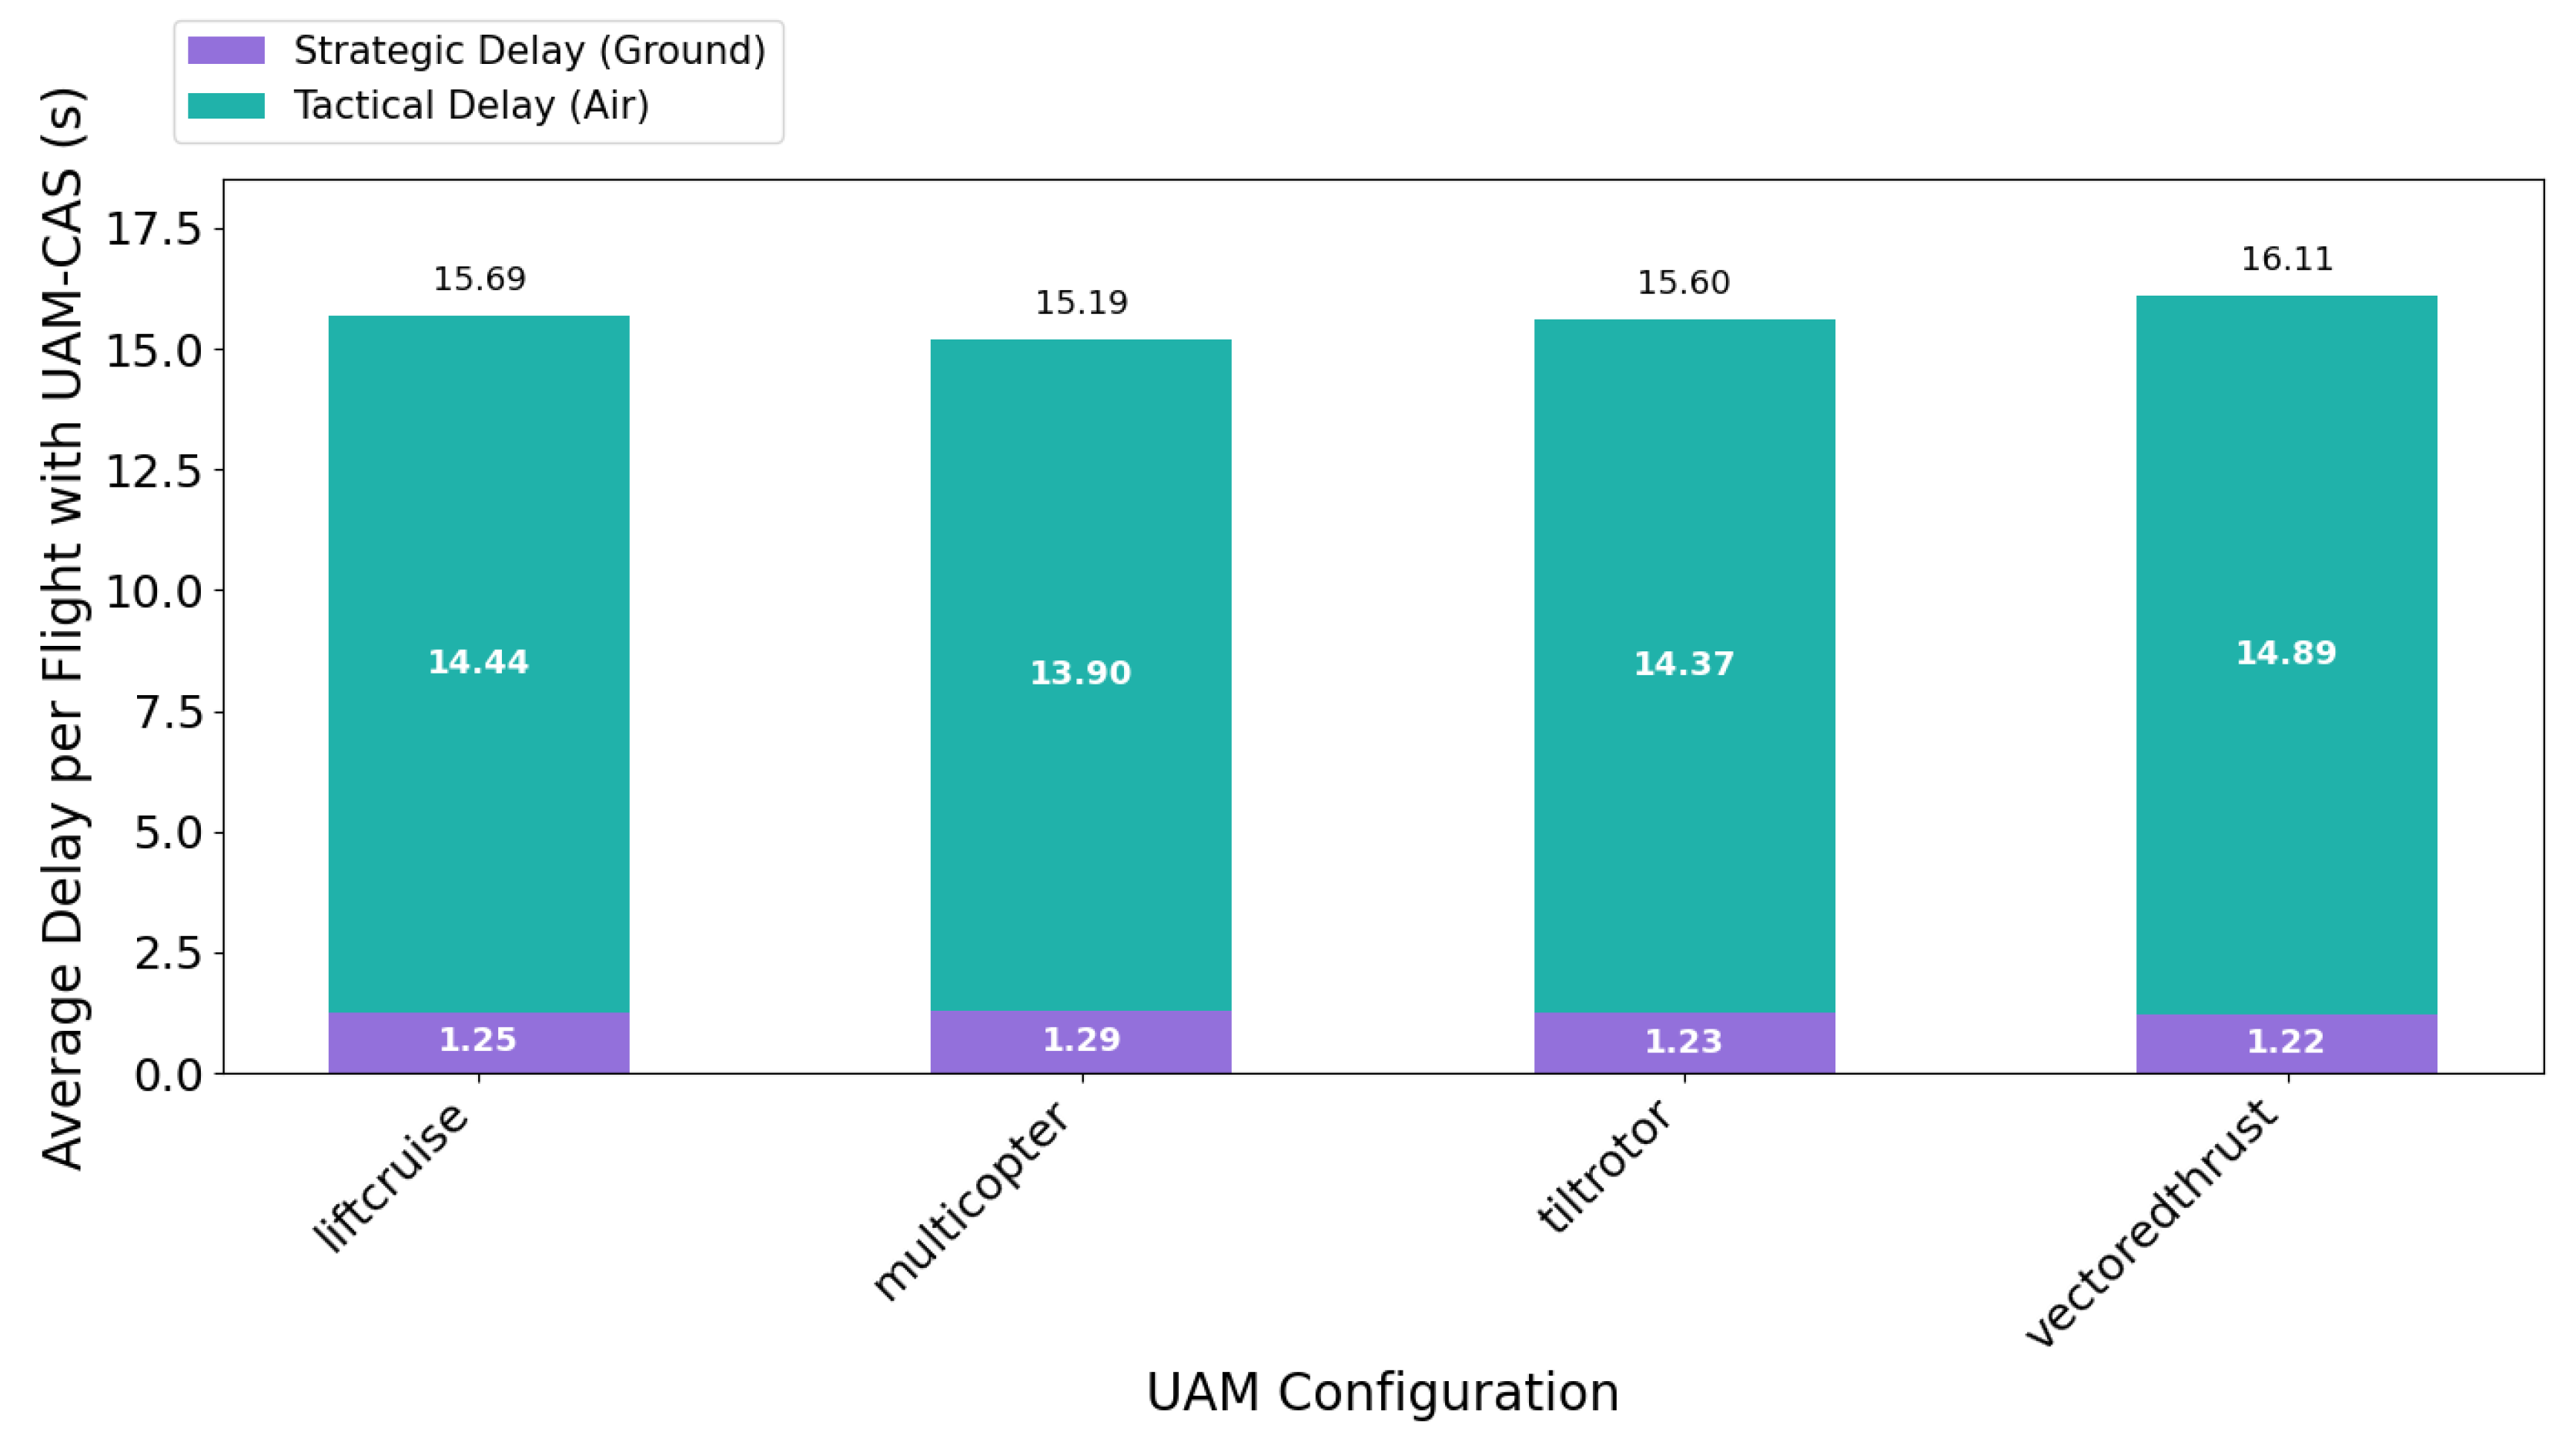
Figure 13.
Number of collisions across all UAM-CAS activated simulations, binned into hourly bins. .
Figure 13.
Number of collisions across all UAM-CAS activated simulations, binned into hourly bins. .
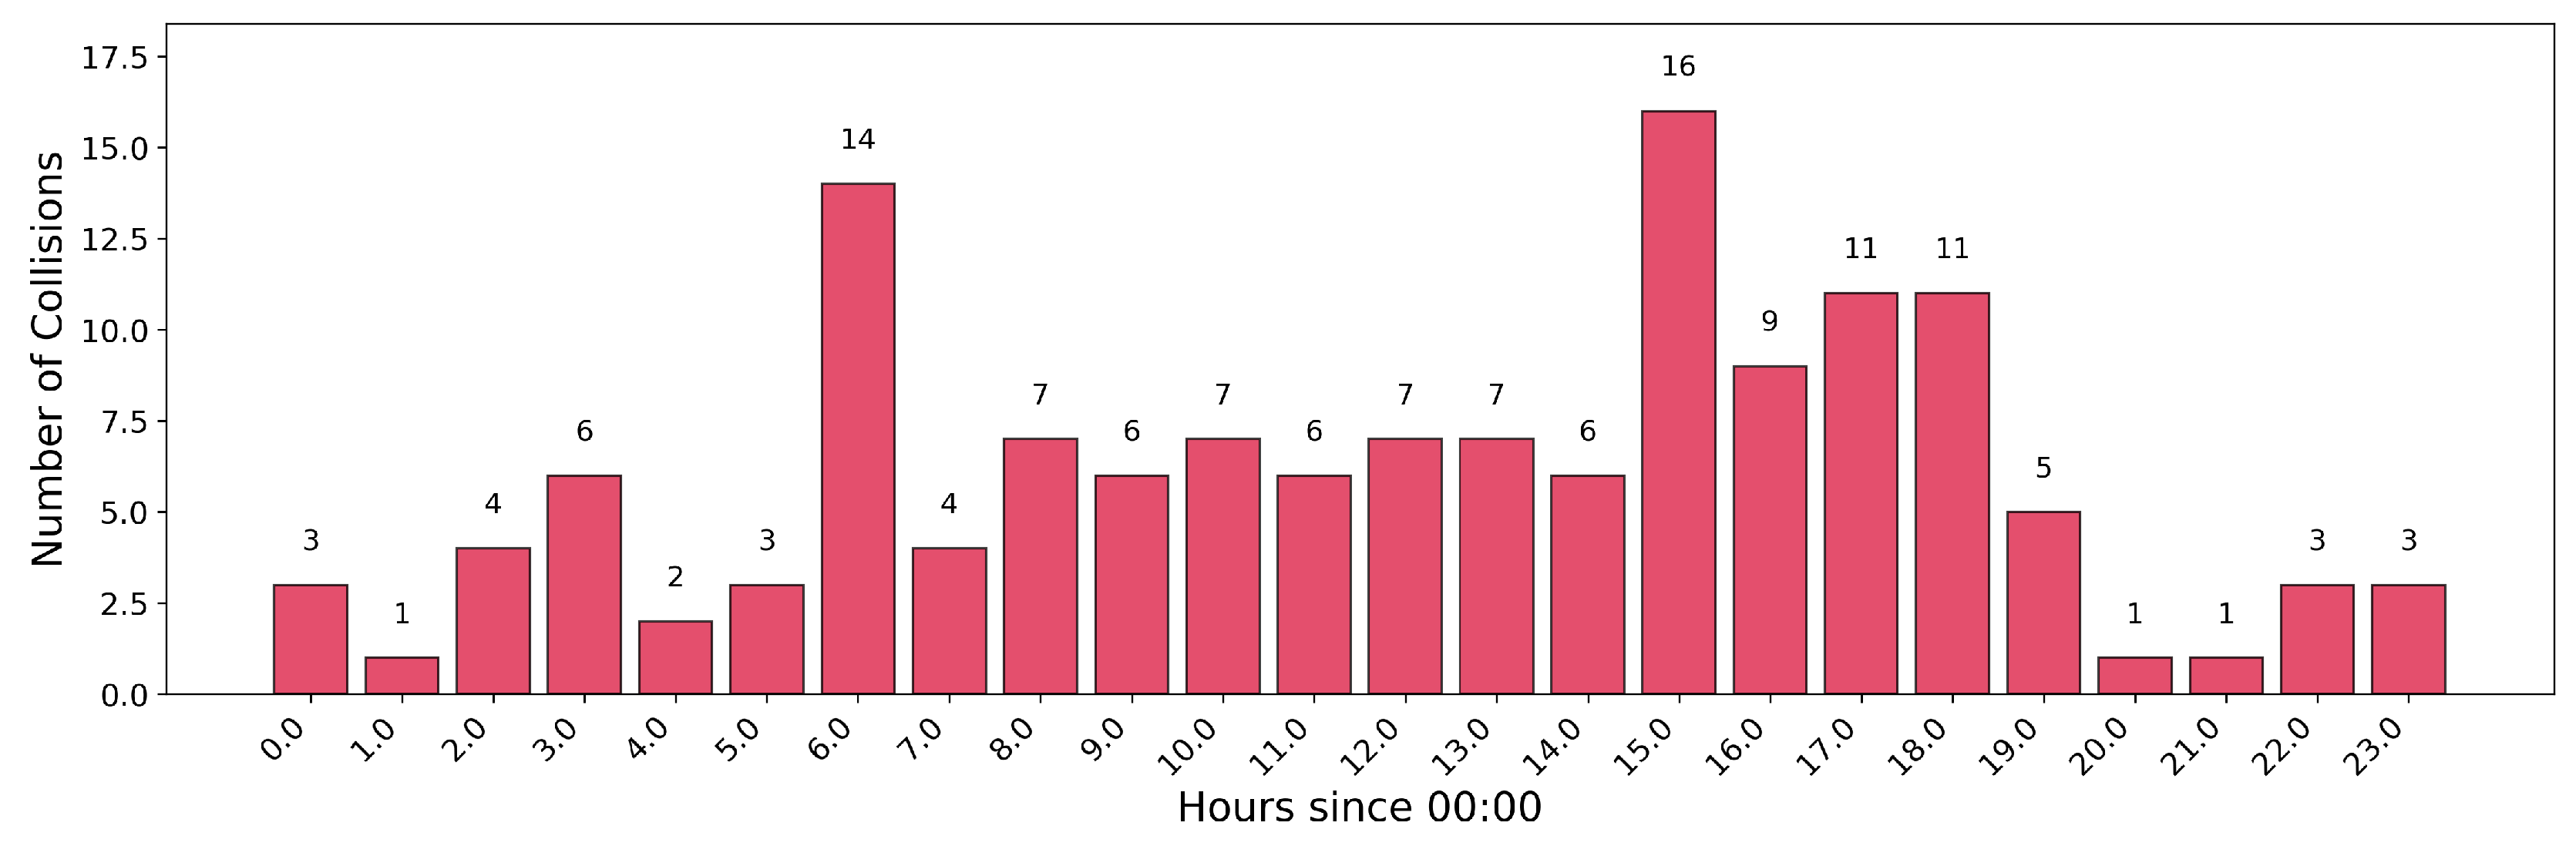

Table 1.
UAM Configurations.
| UAM | Horizontal | Vertical | Cruise | Non UAM-CAS |
|---|---|---|---|---|
| Configuration | Dimension (m) | Dimension (m) | Speed (knots) | Flight Time (s) |
| Multicopter | 12 | 2.3 | 48 | 280.67 |
| Liftcruise | 14 | 2.3 | 130 | 248.42 |
| Vectored Thrust | 14 | 2.3 | 134 | 247.85 |
| Tilt Rotor | 14 | 2.3 | 174 | 243.64 |
Table 2.
Results of Level 2 (pairwise comparison of UAM aircraft configurations) chi-square tests for configuration. Bonferroni correction for all level 2 pairs: . Significant comparison(s) marked in bold.
Table 2.
Results of Level 2 (pairwise comparison of UAM aircraft configurations) chi-square tests for configuration. Bonferroni correction for all level 2 pairs: . Significant comparison(s) marked in bold.
| Pair | p | |
|---|---|---|
| Multicopter vs Lift Cruise | 2.81 | 0.0937 |
| Multicopter vs Tilt Rotor | 6.50 | 0.0108 |
| Multicopter vs Vectored Thrust | 8.69 | 0.0032 |
| Lift Cruise vs Tilt Rotor | 1.12 | 0.2896 |
| Lift Cruise vs Vectored Thrust | 2.27 | 0.1315 |
| Tilt Rotor vs Vectored Thrust | 0.17 | 0.6806 |
Disclaimer/Publisher’s Note: The statements, opinions and data contained in all publications are solely those of the individual author(s) and contributor(s) and not of MDPI and/or the editor(s). MDPI and/or the editor(s) disclaim responsibility for any injury to people or property resulting from any ideas, methods, instructions or products referred to in the content. |
© 2025 by the authors. Licensee MDPI, Basel, Switzerland. This article is an open access article distributed under the terms and conditions of the Creative Commons Attribution (CC BY) license (http://creativecommons.org/licenses/by/4.0/).
Copyright: This open access article is published under a Creative Commons CC BY 4.0 license, which permit the free download, distribution, and reuse, provided that the author and preprint are cited in any reuse.


