Submitted:
10 November 2025
Posted:
11 November 2025
You are already at the latest version
Abstract
Mangrove forests provide essential climate regulation and coastal protection, yet fine‐scale quantification of carbon dynamics remains limited in the Sundarbans due to spatial heterogeneity and tidal influences. This study estimated canopy structural and photosynthetic dynamics from 2019 to 2023 by integrating high-resolution remote sensing with a light use efficiency modeling framework. Leaf Area Index (LAI) was retrieved at 10 m resolution using the PROSAIL radiative transfer model applied to Sentinel-2 data. Gross Primary Productivity (GPP) was estimated using Sentinel-2 vegetation indices and MODIS fPAR with temperature and water availability constraints. Solar-induced chlorophyll fluorescence (SIF) was derived at 10 m resolution and compared with TROPOMI observations to assess correspondence with photosynthetic activity. LAI and GPP exhibited pronounced seasonal and interannual variability, with higher values during the monsoon growing season and lower values during dry periods. Mean NDVI declined from 2019 to 2023 and modeled annual carbon uptake ranged from approximately 43 to 65 Mt CO₂ eq, with lower sequestration in 2022–2023 associated with climatic stress. Strong correlations among LAI, NDVI, GPP, and SIF indicated consistent coupling of canopy structure and function. These results provide a fine-scale assessment of mangrove carbon dynamics relevant for conservation and climate mitigation planning.
Keywords:
mangrove forest
; ecosystem
; chlorophyll fluorescence
; carbon sequestration
; gross primary production
1. Introduction
Mangrove forests are significant ecosystems in global climate change mitigation, possessing substantial potential for carbon sequestration and the provision of diverse ecosystem services [1,2]. These tropical coastal forests function as critical carbon sinks by assimilating atmospheric carbon dioxide (CO2) through photosynthesis and storing it within above-ground biomass and carbon-rich soils, facilitating long-term carbon sequestration. Sundarbans, the world’s largest mangrove forest, constitute a major carbon reservoir for Bangladesh and understanding the processes that control carbon sequestration in these forests is crucial for assessing their role under changing climatic conditions [3,4,5]. Remote sensing enables large-scale assessment of carbon sequestration, while a fundamental challenge persists in bridging the observational gap between canopy structure and true physiological function [6,7].
Vegetation conditions in mangrove forests serve as a primary indicator of their carbon sequestration capacity. Reflectance-based Vegetation Indices (VIs), such as the Normalized Difference Vegetation Index (NDVI), and biophysical parameters like the Leaf Area Index (LAI), provide essential information on forest growth and productivity [8,9]. While NDVI indicates vegetation greenness, LAI offers an integrated measure of forest structure and canopy density. These structural canopy metrics provide only partial insights into ecosystem carbon assimilation, as the linkage between canopy architecture and actual photosynthetic uptake is often weakened or modulated by external environmental factors such as water stress, nutrient limitation, and temperature extremes [10]. This decoupling means that structural characteristics alone cannot reliably capture physiological function under variable conditions [11]. Moreover, the efficacy of these metrics is sensitive to the spatial resolution of the data and is affected by seasonal changes in reflectance and atmospheric variability, which can introduce significant error or bias into remote sensing-based productivity assessments [12,13]. This research applies the PROSAIL radiative transfer model to simulate LAI from very high-spatial-resolution (10-meter) Sentinel-2 imagery. Coarse-resolution products, such as the 500-meter LAI from MODIS, can obscure fine-scale heterogeneity within mangrove stands, leading to less precise VIs estimates due to confounding effects from the land-water interface [14,15]. By calculating LAI at a 10-meter resolution, this research aims to produce a more precise estimate of mangrove vegetation structure as a foundational step for functional analysis.
Ecosystem carbon sequestration is mechanistically driven by Gross Primary Productivity (GPP), the total rate of photosynthetic carbon fixation by the canopy [1,16,17]. Although direct GPP measurement is possible using the Eddy Covariance (EC) technique, the high cost, logistical constraints, and sparse distribution of flux towers make this approach unfeasible for continuous monitoring in inaccessible mangrove regions [18,19]. Consequently, satellite remote sensing provides a more viable solution for estimating GPP over large spatial and temporal scales [19,20]. However, widely used GPP products, often derived from MODIS data at a 500-meter resolution, are inadequate for resolving the structural heterogeneity inherent to mangrove forests, introducing significant uncertainty into carbon dynamics monitoring [21,22,23,24]. This scale variance signifies the need for high-resolution GPP estimates to accurately capture carbon fluxes in these complex ecosystems, particularly in regions vulnerable to natural disasters where traditional monitoring is unviable [25].
The relation between vegetation indices and GPP is complicated by the dynamic regulation of photosynthesis. Photosynthetic activity in mangroves is governed by environmental factors such as light availability, temperature, and hydro-pedological characteristics [18,26,27]. Under optimal light conditions, a fraction of absorbed photonic energy is not used for photochemistry but is instead dissipated as heat through non-photochemical quenching (NPQ) [12,28,29,30,31,32]. This photoprotective mechanism prevents damage to the photosystems, ensuring their functional integrity under variable irradiance, but it also decouples the quantity of absorbed light from the rate of carbon fixation [32]. This physiological reality highlights the limitations of structural indices and necessitates a more direct probe of photosynthetic function to accurately assess carbon dynamics.
Remote sensing of Solar-Induced Chlorophyll Fluorescence (SIF) provides such a direct proxy for photosynthetic activity [33]. When chlorophyll absorbs photons, a small portion of the energy is re-emitted as fluorescence in the red (~680 nm) and far-red (~740 nm) wavelengths (Pettai et al., 2005; Magney et al., 2019; Mohammed et al., 2019). SIF is emitted directly from the photosynthetic machinery; its intensity is mechanistically linked to the gross photosynthetic rate and serves as a robust indicator of ecosystem-level carbon uptake [34]. Satellite sensors such as GOME-2, TROPOMI, and OCO-2 can detect SIF globally [35,36,37]. Crucially, however, their coarse spatial resolution (ranging from 7 to 80 km) is unable to resolve individual mangrove stands and is heavily contaminated by signals from adjacent water bodies, rendering these products unsuitable for this application [33,36]. To overcome this fundamental scale mismatch, this study employs Light Use Efficiency (LUE)-based models to calculate SIF at a high spatial resolution of 10 meters using Sentinel-2 data, representing a significant methodological advance for functionally monitoring these vital ecosystems [2,38].
The central novelty of this study is the development of a framework to calculate high-resolution (10 m) carbon sequestration and chlorophyll fluorescence responses in the Sundarbans mangrove ecosystem using a synergistic combination of the PROSAIL and LUE models with Sentinel-2, MODIS, and TROPOMI satellite data. The specific objectives are to: (i) estimate vegetation indices (NDVI) and calculate high-resolution (10 m) LAI from Sentinel-2 using the PROSAIL model; (ii) quantify carbon sequestration through LUE-based GPP simulations at 10 m resolution; and (iii) explore photosynthetic activity by simulating high-resolution SIF. By generating high-resolution SIF and GPP data, this work provides a detailed view of canopy-level photosynthetic function at a scale relevant to the inherent heterogeneity of the mangrove ecosystem. This study will enhance the understanding of carbon dynamics in the Sundarbans and contribute to developing more effective conservation strategies [39]. Ultimately, this research offers a comprehensive and scalable approach for monitoring and managing the role of mangrove ecosystems in climate change mitigation, with applicability to both the Sundarbans and similar tropical mangrove regions globally.
2. Materials and Methods
Study Area
The present study was conducted in the Bangladesh portion of the Sundarbans, the largest contiguous mangrove forest in the world, situated within the active Ganges delta [40]. The forest extends between 21°30′–22°30′ N and 88°19′–89°3′ E, covering approximately 6,200 km2 in the lower deltaic plain (Figure 1). This region is characterized by a dynamic coastal setting that is highly exposed to tropical cyclones, tidal surges, and associated disturbances [4,41,42]. The mangrove landscape has formed over extensive mudflats and deltaic sediments deposited by the Ganges–Brahmaputra–Meghna River system, with sediment inputs derived largely from the Himalayan piedmont [43,44]. Tidal amplitudes vary seasonally between 0 and 3 m, shaping hydrological and salinity regimes across the forest [5,45]. The climate is tropical monsoonal, with winter temperatures ranging from 12–24 °C and summer temperatures between 25–35 °C. Annual rainfall averages 1500–2000 mm, concentrated during the southwest monsoon (May–October), while the dry season extends from November to April. The Sundarbans also support remarkable biological diversity, including about 334 plant species, of which nearly 50 are classified as true mangroves [46,47]. Given its ecological significance and exposure to recurrent extreme events, the Sundarbans provide a critical setting for examining the resilience of mangrove ecosystems and their capacity for carbon sequestration under environmental stress. This study therefore emphasizes the assessment of vegetation dynamics and photosynthetic carbon uptake in relation to cyclone-induced disturbances and broader climatic variability.
Experimental Design and Data Sources
This study evaluates ecosystem productivity and carbon sequestration in the Sundarbans mangrove forest from 2019 to 2023. This period was selected to ensure complete and overlapping data availability, including consistent in-situ measurements and satellite observations from Sentinel-2, MODIS, and TROPOMI. Sentinel-2 imagery was used to derive the NDVI and the Normalized Difference Water Index (NDWI), providing indicators of vegetation condition and water availability. MODIS products, including the fraction of absorbed photosynthetically active radiation (fPAR) and land surface temperature (LST), were employed to quantify energy capture by vegetation and to characterize thermal dynamics within the study area. Complementary temperature data were obtained from the Mongla weather station, located adjacent to the Sundarbans. MODIS-based estimates of GPP and LAI were used for validation against model-simulated GPP and LAI, while TROPOMI-derived SIF was compared with simulated SIF to assess photosynthetic activity. Cloud contamination, particularly during the monsoon season, was mitigated using a gap-filling and time-series interpolation approach based on nearest-neighbor and auxiliary data sources. Sentinel-2 data were accessed through the Google Earth Engine Data Catalog platform (https://developers.google.com/earth-engine/datasets/catalog/ sentinel-2; accessed 15 December 2024). TROPOMI-SIF products were retrieved from the dedicated data portal (https://s5p-troposif.noveltis.fr/; accessed 15 December 2024), and MODIS data were obtained from Google Earth Engine Data Catalog platform (https://developers.google.com/earth-engine/datasets/catalog/modis; accessed 15 December 2024). The overall experimental framework and methodological workflow are summarized in Figure 2. In experimental design (Figure 2), fPAR represents the fraction of photosynthetically active radiation (PAR) absorbed by chlorophyll, or as a linear function of the NDVI. LUE (εmax) refers to the maximum light use efficiency, while Tscalar represents the temperature-related downward-parameter scalars that adjust LUE based on temperature (T). These scalars are derived from T, Tmin, Tmax, and Topt, which correspond to the mean, minimum, maximum, and optimal temperatures for photosynthesis, respectively. Wscalar denotes the downward-parameter scalar accounting for the effects of water on LUE, calculated from the NDWI.
Estimate of Leaf Area Index (LAI)
The leaf area index (LAI) was estimated from Sentinel-2 imagery using the PROSAIL radiative transfer model, which combines the PROSPECT leaf optical model [25,48,49] with the Scattering by Arbitrarily Inclined Leaves (SAIL) canopy model [50]. The Prospect component simulates leaf reflectance and transmittance across the 400–2500 nm spectral range, parameterized by leaf biochemical and structural traits that define optical behavior [51]. These leaf-level properties are then incorporated into the SAIL model, which computes canopy-scale reflectance by integrating leaf optical parameters with canopy architecture and illumination geometry [12]. Together, the PROSAIL framework enables the translation of satellite-observed surface reflectance into biophysically meaningful canopy variables. A detailed summary of the input parameters used for leaf optical properties and canopy reflectance in the PROSAIL model is provided in Table 1 [25].
Estimate Gross Primary Productivity (GPP)
GPP was estimated using a Sentinel-2–based LUE model to carbon sequestration in the Sundarbans mangrove ecosystem. The LUE framework has been widely applied and empirically validated for remote sensing–based GPP estimation [35,52]. In this study, temperature (T) was extracted from MODIS LST products, with missing values supplemented by observations from the Mongla weather station. Fraction of absorbed photosynthetically active radiation (fPAR) data were also obtained from MODIS, while a linear regression approach was applied to relate photosynthetically active radiation (PAR) with fPAR and NDVI for subsequent GPP calculation following the LUE framework [25]. The LUE model was implemented according to the following equations:
GPP = APARchl × εg
APARchl = PAR × fPAR
LUE (εmax) = εo × TScalar ×WScalar
NDVI = (RNIR – RRed) / (RNIR+RRed)
NDWI= (RGreen+RSWIR) / (RGreen−RSWIR)
Here, GPP (g C m−2 d−1) represents the total CO2 assimilated by vegetation and provides a primary indicator of ecosystem productivity. Annual cumulative GPP (g C m−2 y−1) was spatially integrated across the Sundarbans mangrove extent. To express GPP in terms of CO2 equivalents, values in g C m−2 were converted using the molecular weight ratio of CO2 to C (44/12 ≈ 3.667). In this formulation, absorbed photosynthetically active radiation (APARchl) defines the energy input for photosynthesis, while its conversion efficiency into biomass is governed by light use efficiency (LUE, εg). The maximum theoretical LUE (ε0) represents photosynthetic efficiency under optimal conditions, whereas environmental stressors reduce efficiency through scalar functions. The temperature scalar (Tscalar) accounts for the influence of minimum (Tmin), optimum (Topt), and maximum (Tmax) temperatures on photosynthesis. The water scalar (Wscalar) reflects vegetation water status, estimated from the Normalized Difference Water Index (NDWI), where NDWImax corresponds to the maximum observed value. Reflectance in specific spectral bands—near-infrared (RNIR), red (RRed), green (RGreen), and shortwave infrared (RSWIR)—was used to derive NDVI and NDWI, which serve as indicators of canopy greenness and water availability, respectively.
2.5. Calculation of Solar-Induced Chlorophyll Fluorescence (SIF)
SIF was calculated using MODIS and Sentinel-2 data at high spatial resolution by examining the relationships among NDVI, LAI, GPP, and SIF. These are the key variables that characterize vegetation productivity, carbon sequestration, and photosynthetic functioning in mangrove ecosystems. The fraction of fPAR quantifies the proportion of solar energy intercepted by the canopy and serves as an indicator of photosynthetic capacity. GPP represents the total carbon fixed by vegetation, is largely determined by absorbed radiation. In parallel, SIF arises from the re-emission of a small fraction of absorbed energy during the photosynthetic process, providing a direct proxy of photosynthetic activity that is sensitive to both physiological status and structural conditions of the canopy [11,53].
The relationship between SIF and ecosystem productivity has been established through its strong association with fPAR, LUE, and GPP. In the present study, SIF simulation was further refined by incorporating environmental constraints, particularly temperature variability and canopy structural parameters, to improve its predictive accuracy. The comparative framework for SIF retrieval applied here follows the enhanced formulations proposed by Guanter et al. (2014) [53], as outlined below.
where, ε0 is the maximum possible fluorescence emission, B is the temperature sensitivity coefficient, Fesc is the fraction of released fluorescence, LAI is Leaf Area Index, fraction of this radiation absorbed by vegetation (fPAR), GPP is Gross Primary Productivity, LST is the Land Surface Temperature, and Topt is the optimal temperature for photosynthesis.
𝑆𝐼𝐹= 𝐹𝑃𝐴𝑅 * 𝑁𝐷𝑉𝐼 * ε0 * (1−𝐵 * (𝐿𝑆𝑇−𝑇𝑜𝑝𝑡)2) * (𝐹𝑒𝑠𝑐+𝐺𝑃𝑃)
𝐹𝑒𝑠𝑐 = 0.5 exp (−0.5⋅LAI)
3. Results
Temporal and Spatial Dynamics of Canopy Properties
Analysis of vegetation indices within the Sundarbans Mangrove Forest from 2019 to 2023 revealed pronounced intra-annual seasonality superimposed upon a significant inter-annual trend in canopy condition (Figure 3 and Figure 4). A consistent and notable decline in mean annual Normalized Difference Vegetation Index (NDVI) was observed, decreasing from 0.506 in 2019 to 0.433 in 2023. This trajectory suggests a progressive reduction in vegetation vigor across the five-year study period.
In contrast, the annual mean Leaf Area Index (LAI), simulated via the PROSAIL model, exhibited greater inter-annual variability. The highest mean LAI occurred in 2021 (2.59 m2m−2), while the lowest was recorded in 2020 (2.12 m2m−2), with 2023 showing a partial recovery (2.35 m2m−2). Both indices demonstrated a strong, coherent seasonal cycle synchronized with regional climatic patterns (Figure 4).
Peak canopy development consistently occurred during the late monsoon season, with the highest monthly NDVI values recorded in August (0.619) and September (0.649) of 2019. Similarly, maximum LAI was observed between July and September, reaching a five-year peak of 3.37 m2m−2 in August. Conversely, the canopy reached its minimum extent and vigor during the cooler, drier post-monsoon period, with the lowest monthly NDVI (0.354) and LAI (1.1 m2m−2) values consistently occurring in December. These seasonal trends reflect the vegetation’s response to fluctuations in weather and hydrological resources.
The spatial distribution of LAI, derived from the PROSAIL model, visually corroborates these temporal dynamics across the landscape (Figure 4). The tight coupling between these two structural metrics was confirmed by a strong, positive correlation between monthly mean NDVI and LAI (R2=0.93, p<0.001), indicating that the indices are congruently capturing forest canopy health. Collectively, these results illustrate that the structural properties of the Sundarbans canopy are governed by pronounced seasonal growth cycles. The observed variations reflect the ecosystem’s response to fluctuating environmental drivers and provide a critical baseline for assessing the functional dynamics of carbon sequestration.
Estimation of GPP
The observed dynamics in canopy structure were directly reflected in the ecosystem’s carbon fixation rates, with Gross Primary Productivity (GPP) exhibiting significant seasonal and inter-annual variation from 2019 to 2023 (Figure 5).
A pronounced intra-annual periodicity characterized the GPP flux, with photosynthetic activity varying by more than threefold throughout the year. The maximum daily carbon uptake was recorded in September 2019 (10.48 g C m−2day−1), whereas the minimum occurred in January 2023 (3.1 g C m−2day−1). This seasonal pattern was consistent across all years, with elevated GPP during the primary growing season from May to September and suppressed rates during the cooler, drier months from November to February. For instance, peak productivity in 2019 was observed in August (9.58 g C m−2day−1), a pattern repeated in 2023 (9.23 g C m−2day−1), coinciding with maximum canopy development. Inter-annual carbon sequestration, assessed through cumulative annual GPP, showed considerable variability rather than a monotonic trend (Figure 6a).
The total annual carbon fixation was 2404 g C m−2y−1 in 2019, peaked in 2020 at 2862 g C m−2y−1, and reached its lowest point in 2022 at 1881 g C m−2y−1, before recovering to 2163 g C m−2y−1 in 2023. This variation in the total annual sink strength delineates the influence of prevailing climatic conditions on the ecosystem’s overall carbon balance. The strong correspondence between seasonal GPP and canopy phenology underscores the primary control of climatic factors on photosynthetic activity in the Sundarbans mangrove ecosystem.
Carbon Sequestration in Mangrove Ecosystems
The Sundarbans mangrove forest contributes considerably to carbon emission reduction in Bangladesh, though its rate of carbon sequestration showed significant annual changes from 2019-2023 (Table 2).
For this analysis, carbon sequestration was estimated by converting the gross primary productivity (GPP) into total carbon uptake, scaled to the forest area, and expressed as CO2 equivalents (Mt CO2 eq) using the molecular weight ratio of CO2 to C (≈3.667). These values were then compared with Bangladesh’s national CO2 emissions. Annual carbon sequestration by the Sundarbans fluctuated, with values of 54.65 Mt CO2 eq in 2019, 65.06 Mt CO2 eq in 2020, 57.61 Mt CO2 eq in 2021, 42.76 Mt CO2 eq in 2022, and 49.17 Mt CO2 eq in 2023. This sequestration offset a substantial portion of Bangladesh’s total emissions, accounting for 25.63% in 2019, 24.18% in 2020, 20.81% in 2021, 15.35% in 2022, and 17.47% in 2023. The data show that the Sundarbans act as a strong carbon sink, but the sharp decline in 2022 and 2023 suggests that environmental stress and climate-induced extreme events may have reduced the forest’s ability to capture carbon. Nevertheless, the carbon sink potential of the Sundarbans remains significant for climate change mitigation in Bangladesh. Further, a strong positive relationship was found between GPP and indicators of vegetation health. Specifically, GPP showed a strong positive correlation with both LAI (R2=0.94) and NDVI (R2=0.95). This statistically significant relationship (p<0.001) indicates that increased vegetation cover, as reflected by higher LAI and NDVI values, has a direct effect on greater carbon capture. The considerable correlations emphasize the critical role played by vegetation cover in modulating carbon uptake. The results therefore confirm that environmental conditions, in conjunction with vegetation health, dictate the seasonal variation in GPP that underlies the carbon capture potential of the mangrove ecosystem.
Calculation of Solar Induced Chlorophyll Fluorescence
The satellite-retrieved Solar-Induced Chlorophyll Fluorescence (SIF) from model simulations for 2019–2023 exhibits significant seasonal and interannual variability (Figure 6b). The SIF values display a clear seasonal trend, with higher values from May to October (Figure 7).
The highest monthly SIF was found to be 1.28 mW·m−2·nm−1·sr−1 in August 2020, followed by 1.16 mW·m−2·nm−1·sr−1 in September of the same year. Conversely, minimum levels were observed in winter, with a notable decline in December 2023 when the value decreased to 0.23 mW·m−2·nm−1·sr−1. Mean annual SIF was highest in 2020 (0.94 mW·m−2·nm−1·sr−1) and lowest in 2023 (0.66 mW·m−2·nm−1·sr−1) (Table 3).
These changes depict the impact of climatic and meteorological conditions on photosynthesis and vegetation health. The seasonal SIF patterns closely follow the dynamics of GPP and LAI. The annual records from 2019 to 2023 indicate that variations in NDVI, LAI, GPP, and SIF are closely linked, collectively reflecting the changing photosynthetic potential in the Sundarbans. For example, favorable growth conditions in 2020 were marked by peak values across all indices: NDVI (0.548), LAI (2.587 m2/m2), GPP (7.84 g C m−2 d−1), and SIF (0.939 mW·m−2·nm−1·sr−1). In contrast, a decline in vegetation health was noted in 2022, with reduced NDVI (0.459), LAI (2.12 m2/m2), GPP (5.15 g C m−2 d−1), and SIF (0.582 mW·m−2·nm−1·sr−1), followed by a partial recovery in 2023. The strong correspondence of SIF with GPP and LAI confirms that chlorophyll fluorescence is a reliable indicator of photosynthetic efficiency in this ecosystem. The accuracy of the Sentinel-2 based modeled SIF was validated against the TROPOMI-observed SIF product, showing a strong and significant relationship (R2=0.88, p<0.001) (Figure 8).
While TROPOMI-SIF offers a spatial resolution of 7 km suitable for large-scale monitoring, the modeled SIF operates at a finer 10 m resolution, enabling more localized observations. The consistency between these datasets emphasizes the potential of satellite-derived SIF for monitoring mangrove ecosystems, while demonstrating the model’s ability to provide more granular insights into photosynthetic dynamics. The simultaneous analysis of high-resolution SIF with GPP and LAI thus permits a fine-scale description of carbon dynamics within the Sundarbans mangrove environment.
4. Discussion
Dynamics of Vegetation Index and Mangrove Leaf Area
Mangrove ecosystems, exemplified by the Sundarbans, are critical for biodiversity conservation, coastal protection, and carbon sequestration. The present study elucidates the spatiotemporal dynamics of mangrove vegetation using NDVI and LAI over 2019–2023. The observed declining trend in annual mean NDVI, together with pronounced seasonal variability, indicates a gradual reduction in vegetation health and productivity. Comparable patterns have been reported in other mangrove systems, where environmental stressors such as salinity intrusion, extreme weather events, and anthropogenic pressures drive vegetation degradation [16]. Seasonal NDVI peaks in August–September and troughs in December align with prior observations on the influence of climatic drivers on mangrove photosynthetic activity and canopy density [42].
Annual and seasonal LAI fluctuations provide complementary insights into growth cycles. Peak LAI values during July–September indicate maximal canopy expansion under favorable monsoon and temperature regimes. Conversely, reduced LAI in cooler and drier months (January–December minima) reflects diminished leaf area and canopy density, corroborating observations by Samanta et al. (2021) [54]. High-resolution LAI simulations (10 m) demonstrated a significant correlation with MODIS-derived LAI at coarser resolution (500 m; R2 = 0.67, p < 0.005), emphasizing the value of fine-scale modeling for site-specific canopy assessment [25]. The strong correlation between NDVI and LAI (R2 = 0.93, p < 0.001) further reinforces their complementary role in monitoring mangrove health [55].
The observed NDVI and LAI trends also highlight the vulnerability of mangroves to climate change and anthropogenic stressors. Declines in NDVI and seasonal variability in LAI may serve as early indicators of ecosystem stress, potentially driven by sea level rise, altered precipitation regimes, and increased frequency of extreme weather events [56]. Spatial heterogeneity in LAI, revealed by PROSAIL-based mapping, underscores the necessity of localized conservation and adaptive management strategies. Integrating high-resolution remote sensing with hydrological modeling and soil carbon assessments in future research could refine our understanding of mangrove resilience under dynamic environmental pressures.
4.2. The LUE Simulated GPP for Carbon Sequestration
The close alignment between observed and model-simulated GPP is fundamental for quantifying the Sundarbans’ carbon sequestration potential, particularly in remote and heterogeneous ecosystems where direct measurements are limited [37]. Seasonal GPP patterns, with maxima during the growing season (May–September) and minima during the non-growing season (November–February), reflect the influence of climate and vegetation phenology, consistent with other mangrove studies [57].
High correlation between modeled and observed GPP (R2 = 0.86, p < 0.001; Figure 8b) indicates the model’s robustness in capturing carbon flux dynamics. This relationship is reinforced by associations with vegetation indices: LAI and NDVI increases corresponded with elevated GPP, highlighting the role of canopy structure and photosynthetic vigor in carbon assimilation [2,58]. Annual carbon sequestration ranged from 42.76 Mt CO2 eq in 2022 to 65.06 Mt CO2 eq in 2020, equating to 15–25% of Bangladesh’s total CO2 emissions over 2019–2023. Declines in 2022–2023 indicate that environmental stressors may limit carbon uptake, yet the Sundarbans remain a substantial carbon sink [59,60]. These findings underscore the essential role of mangroves in regional and global carbon budgets and highlight the importance of integrating GPP modeling with vegetation monitoring for climate mitigation planning.
4.3. Photosynthetic Activity and Carbon Sequestration in Mangrove Ecosystems
Satellite-derived and model-simulated SIF data provide high-resolution insights into photosynthetic activity and carbon sequestration. Seasonal and interannual variations in SIF correspond closely with GPP and LAI trends, reflecting the responsiveness of mangrove photosynthesis to environmental conditions [12,35,61]. Peak SIF during the monsoon-aligned growth period underscores the direct coupling between canopy activity and carbon fixation. For example, the maximum SIF in 2020 (0.94 mW·m−2·nm−1·sr−1) coincided with elevated NDVI, LAI, and GPP, demonstrating optimal photosynthetic performance. Conversely, the 2022 decline in SIF, GPP, and LAI reflects adverse environmental conditions limiting carbon assimilation [62]. Partial recovery in 2023 illustrates ecosystem resilience, though vulnerability to ongoing climatic and anthropogenic stress remains evident [58]. The strong correlation between modeled Sentinel-2 SIF and TROPOMI-observed SIF (R2 = 0.88) confirms the reliability of remote sensing for ecosystem-scale monitoring. Fine-resolution modeling (10 m) allows detailed assessment of local canopy activity, whereas TROPOMI (7 km resolution) provides broader regional context. The agreement between datasets supports integrated multi-scale approaches for monitoring photosynthesis and carbon flux, enabling informed management and conservation strategies [63]. Collectively, these results confirm that SIF, in conjunction with GPP and LAI, constitutes a robust framework for evaluating mangrove carbon sequestration potential and ecosystem function under changing environmental conditions.
4.4. Methodological Advances, Limitations, and Future Directions
A key contribution of this research is the application and validation of high-resolution models to derive functional ecosystem properties. The PROSAIL-based 10 m LAI simulations showed a strong correlation with the coarser 500 m MODIS product (R2=0.67), confirming the utility of downscaling for capturing fine-scale canopy heterogeneity essential for localized ecological studies [25]. Similarly, the high correlation of the 10 m modeled GPP with observed data (R2=0.86) and the 10 m modeled SIF with 7 km TROPOMI SIF observations (R2=0.88) validates our approach. This demonstrates a powerful methodology for generating reliable, high-resolution proxies of photosynthetic function in complex coastal landscapes where direct measurements are sparse [35,63,64].
Nonetheless, this study is subject to the inherent limitations of satellite remote sensing, particularly in tropical regions like the Sundarbans, which are frequently affected by cloud cover, atmospheric aerosols, and data gaps. These factors introduce uncertainty into remote sensing inputs and subsequent model outputs. While our models performed well, the accuracy of carbon flux estimations would be ideally improved by calibration with ground-based measurements from Eddy Covariance (EC) flux towers. However, the high expense and logistical challenges associated with establishing and maintaining EC systems in inaccessible mangrove environments, especially in developing nations like Bangladesh, remain significant barriers.
Future research should focus on integrating multi-source satellite data to mitigate data gap issues and extending the temporal scope of the analysis to better distinguish long-term trends from short-term variability. Furthermore, developing cost-effective, ground-based systems for model validation and incorporating hydrological and soil carbon analyses will be critical for a more holistic understanding of the mangrove carbon cycle.
5. Conclusions
This study successfully leveraged a multi-sensor remote sensing approach integrated with the PROSAIL and LUE models to provide a comprehensive assessment of carbon dynamics in the Sundarbans mangrove ecosystem from 2019 to 2023. By simulating high-resolution Leaf Area Index, Gross Primary Productivity, and Solar-Induced Chlorophyll Fluorescence, we quantified the significant, yet highly variable, role of this ecosystem as a natural carbon sink. Our findings reveal a tightly coupled system where canopy structure and photosynthetic function fluctuate in synchrony, responding directly to seasonal and inter-annual environmental drivers. The research confirms that the Sundarbans sequester a substantial portion of Bangladesh’s national CO2 emissions, but this capacity is vulnerable, as evidenced by a sharp decline in 2022. This highlights the critical need for continuous monitoring over static assessments to manage this vital resource effectively. The successful validation of our high-resolution functional proxies against coarser satellite products represents a key methodological advance for monitoring complex and inaccessible ecosystems. Despite the inherent limitations of satellite data, this work underscores the indispensable role of remote sensing in advancing our understanding of critical ecosystems. Ultimately, effective conservation strategies, informed by robust scientific monitoring, are imperative to safeguard the Sundarbans’ profound contribution to the regional and global carbon cycle in an era of accelerating climate change.
Author Contributions
Conceptualization, Nur Hussain; methodology, Nur Hussain; formal analysis, Nur Hussain; data curation, Nur Hussain; validation, Nur Hussain, Md. Rezaul Karim, and Md. Nazrul Islam; writing—original draft preparation, Nur Hussain; writing—review and editing, Nur Hussain, Md. Adnan Rahman, Md. Rezaul Karim, Parvez Rana, and Md. Nazrul Islam; visualization, Nur Hussain; supervision, Md. Nazrul Islam; project administration, Md. Nazrul Islam; funding acquisition, Anselme Muzirafuti. All authors have read and agreed to the published version of the manuscript.
Funding
The APC was funded by Anselme Muzirafuti.
Data Availability Statement
The datasets generated or analyzed during the current study are available from the corresponding authors upon reasonable request.
Acknowledgments
We sincerely thank Md. Saifuzzaman from the Department of Biology, McGill University, Canada, for his valuable insights on Sundarbans mangrove ecosystem dynamics in Bangladesh, and the Bangladesh Meteorological Department (BMD) for providing access to weather station data. We also acknowledge all data contributors whose support made this study possible. MODIS and Sentinel-2 satellite data were obtained from Google Earth Engine Data Catalog platform (https://developers.google.com/earth-engine/datasets/catalog/). We also thank the School of Earth, Environment & Society at McMaster University, Hamilton, Ontario, Canada, for providing access to MATLAB (Version 2024b) and ArcGIS Pro (Version 3.2).
Conflicts of Interest
The authors declare no conflicts of interest.
References
- Alongi, D.M. Impacts of Climate Change on Blue Carbon Stocks and Fluxes in Mangrove Forests. Forests 2022, 13, 149. [Google Scholar] [CrossRef]
- Choudhary, B.; Dhar, V.; Pawase, A.S. Blue Carbon and the Role of Mangroves in Carbon Sequestration: Its Mechanisms, Estimation, Human Impacts and Conservation Strategies for Economic Incentives. Journal of Sea Research 2024, 199, 102504. [Google Scholar] [CrossRef]
- Donato, D.C.; Kauffman, J.B.; Murdiyarso, D.; Kurnianto, S.; Stidham, M.; Kanninen, M. Mangroves among the Most Carbon-Rich Forests in the Tropics. Nature Geosci 2011, 4, 293–297. [Google Scholar] [CrossRef]
- Hussain, N.; Islam, Md.N. Hot Spot (Gi∗) Model for Forest Vulnerability Assessment: A Remote Sensing-Based Geo-Statistical Investigation of the Sundarbans Mangrove Forest, Bangladesh. Model. Earth Syst. Environ. 2020, 6, 2141–2151. [Google Scholar] [CrossRef]
- Hoque, M.Z.; Cui, S.; Islam, I.; Xu, L.; Ding, S. Dynamics of Plantation Forest Development and Ecosystem Carbon Storage Change in Coastal Bangladesh. Ecological Indicators 2021, 130, 107954. [Google Scholar] [CrossRef]
- Andrieu, J.; Lombard, F.; Fall, A.; Thior, M.; Ba, B.D.; Dieme, B.E.A. Botanical Field-Study and Remote Sensing to Describe Mangrove Resilience in the Saloum Delta (Senegal) after 30 Years of Degradation Narrative. Forest Ecology and Management 2020, 461, 117963. [Google Scholar] [CrossRef]
- Lassalle, G.; De Souza Filho, C.R. Tracking Canopy Gaps in Mangroves Remotely Using Deep Learning. Remote Sens Ecol Conserv 2022, 8, 890–903. [Google Scholar] [CrossRef]
- Xue, J.; Su, B. Significant Remote Sensing Vegetation Indices: A Review of Developments and Applications. Journal of Sensors 2017, 2017, 1–17. [Google Scholar] [CrossRef]
- Gao, S.; Yan, K.; Liu, J.; Pu, J.; Zou, D.; Qi, J.; Mu, X.; Yan, G. Assessment of Remote-Sensed Vegetation Indices for Estimating Forest Chlorophyll Concentration. Ecological Indicators 2024, 162, 112001. [Google Scholar] [CrossRef]
- Zhang, Z.; Xin, Q.; Li, W. Machine Learning-Based Modeling of Vegetation Leaf Area Index and Gross Primary Productivity Across North America and Comparison with a Process-Based Model. J Adv Model Earth Syst 2021, 13, e2021MS002802. [Google Scholar] [CrossRef]
- Dechant, B.; Ryu, Y.; Badgley, G.; Zeng, Y.; Berry, J.A.; Zhang, Y.; Goulas, Y.; Li, Z.; Zhang, Q.; Kang, M.; et al. Canopy Structure Explains the Relationship between Photosynthesis and Sun-Induced Chlorophyll Fluorescence in Crops. Remote Sensing of Environment 2020, 241, 111733. [Google Scholar] [CrossRef]
- Zhu, X.; Hou, Y.; Zhang, Y.; Lu, X.; Liu, Z.; Weng, Q. Potential of Sun-Induced Chlorophyll Fluorescence for Indicating Mangrove Canopy Photosynthesis. JGR Biogeosciences 2021, 126, e2020JG006159. [Google Scholar] [CrossRef]
- Yang, S.; Yang, J.; Shi, S.; Song, S.; Zhang, Y.; Luo, Y.; Du, L. An Exploration of Solar-Induced Chlorophyll Fluorescence (SIF) Factors Simulated by SCOPE for Capturing GPP across Vegetation Types. Ecological Modelling 2022, 472, 110079. [Google Scholar] [CrossRef]
- Castillo, J.A.A.; Apan, A.A.; Maraseni, T.N.; Salmo, S.G. Estimation and Mapping of Above-Ground Biomass of Mangrove Forests and Their Replacement Land Uses in the Philippines Using Sentinel Imagery. ISPRS Journal of Photogrammetry and Remote Sensing 2017, 134, 70–85. [Google Scholar] [CrossRef]
- Tran, T.V.; Reef, R.; Zhu, X. A Review of Spectral Indices for Mangrove Remote Sensing. Remote Sensing 2022, 14, 4868. [Google Scholar] [CrossRef]
- Alongi, D.M. Carbon Cycling and Storage in Mangrove Forests. Annu. Rev. Mar. Sci. 2014, 6, 195–219. [Google Scholar] [CrossRef]
- Adame, M.F.; Cormier, N.; Taillardat, P.; Iram, N.; Rovai, A.; Sloey, T.M.; Yando, E.S.; Blanco-Libreros, J.F.; Arnaud, M.; Jennerjahn, T.; et al. Deconstructing the Mangrove Carbon Cycle: Gains, Transformation, and Losses. Ecosphere 2024, 15, e4806. [Google Scholar] [CrossRef]
- Barr, J.G.; Engel, V.; Fuentes, J.D.; Fuller, D.O.; Kwon, H. Modeling Light Use Efficiency in a Subtropical Mangrove Forest Equipped with CO2 Eddy Covariance. Biogeosciences 2013, 10, 2145–2158. [Google Scholar] [CrossRef]
- Mashala, M.J.; Dube, T.; Mudereri, B.T.; Ayisi, K.K.; Ramudzuli, M.R. A Systematic Review on Advancements in Remote Sensing for Assessing and Monitoring Land Use and Land Cover Changes Impacts on Surface Water Resources in Semi-Arid Tropical Environments. Remote Sensing 2023, 15, 3926. [Google Scholar] [CrossRef]
- Mumby, P.J.; Green, E.P.; Edwards, A.J.; Clark, C.D. The Cost-Effectiveness of Remote Sensing for Tropical Coastal Resources Assessment and Management. Journal of Environmental Management 1999, 55, 157–166. [Google Scholar] [CrossRef]
- Wang, L.; Jia, M.; Yin, D.; Tian, J. A Review of Remote Sensing for Mangrove Forests: 1956–2018. Remote Sensing of Environment 2019, 231, 111223. [Google Scholar] [CrossRef]
- Ghorbanian, A.; Zaghian, S.; Asiyabi, R.M.; Amani, M.; Mohammadzadeh, A.; Jamali, S. Mangrove Ecosystem Mapping Using Sentinel-1 and Sentinel-2 Satellite Images and Random Forest Algorithm in Google Earth Engine. Remote Sensing 2021, 13, 2565. [Google Scholar] [CrossRef]
- Casal, G.; Trégarot, E.; Cornet, C.C.; McCarthy, T.; Van Der Geest, M. A Cost-Effective Method to Map Mangrove Forest Extent, Composition, and Condition in Small Islands Based on Sentinel-2 Data: Implications for Management. Ecological Indicators 2024, 159, 111696. [Google Scholar] [CrossRef]
- Hussain, N.; Arain, M.A.; Wang, S.; Parker, W.C.; Elliott, K.A. Evaluating the Effectiveness of Different Variable Retention Harvesting Treatments on Forest Carbon Uptake Using Remote Sensing. Remote Sensing Applications: Society and Environment 2024, 33, 101124. [Google Scholar] [CrossRef]
- Hussain, N.; Gonsamo, A.; Wang, S.; Arain, M.A. Assessment of Spongy Moth Infestation Impacts on Forest Productivity and Carbon Loss Using the Sentinel-2 Satellite Remote Sensing and Eddy Covariance Flux Data. Ecol Process 2024, 13, 37. [Google Scholar] [CrossRef]
- Moorthy, P. Photosynthetic Efficiency in Rhizophoracean Mangroves with Reference to Compartmentalization of Photosynthetic Pigments. RBT 1969, 21–25. [Google Scholar] [CrossRef]
- Cobacho, S.P.; Janssen, S.A.R.; Brekelmans, M.A.C.P.; Van De Leemput, I.A.; Holmgren, M.; Christianen, M.J.A. High Temperature and Eutrophication Alter Biomass Allocation of Black Mangrove (Avicennia Germinans L.) Seedlings. Marine Environmental Research 2024, 193, 106291. [Google Scholar] [CrossRef] [PubMed]
- Kato, M.C.; Hikosaka, K.; Hirotsu, N.; Makino, A.; Hirose, T. The Excess Light Energy That Is Neither Utilized in Photosynthesis nor Dissipated by Photoprotective Mechanisms Determines the Rate of Photoinactivation in Photosystem II. Plant and Cell Physiology 2003, 44, 318–325. [Google Scholar] [CrossRef]
- Endo, T.; Uebayashi, N.; Ishida, S.; Ikeuchi, M.; Sato, F. Light Energy Allocation at PSII under Field Light Conditions: How Much Energy Is Lost in NPQ-Associated Dissipation? Plant Physiology and Biochemistry 2014, 81, 115–120. [Google Scholar] [CrossRef] [PubMed]
- Mandal, R.; Dutta, G. From Photosynthesis to Biosensing: Chlorophyll Proves to Be a Versatile Molecule. Sensors International 2020, 1, 100058. [Google Scholar] [CrossRef]
- Lal, M.A.; Bhatla, S.C. Photosynthesis. In Plant Physiology, Development and Metabolism; Springer Nature Singapore: Singapore, 2023; pp. 107–154. ISBN 978-981-99-5735-4. [Google Scholar]
- Leister, D. Enhancing the Light Reactions of Photosynthesis: Strategies, Controversies, and Perspectives. Molecular Plant 2023, 16, 4–22. [Google Scholar] [CrossRef]
- Mohammed, G.H.; Colombo, R.; Middleton, E.M.; Rascher, U.; Van Der Tol, C.; Nedbal, L.; Goulas, Y.; Pérez-Priego, O.; Damm, A.; Meroni, M.; et al. Remote Sensing of Solar-Induced Chlorophyll Fluorescence (SIF) in Vegetation: 50 Years of Progress. Remote Sensing of Environment 2019, 231, 111177. [Google Scholar] [CrossRef]
- Sembada, A.A.; Faizal, A.; Sulistyawati, E. Photosynthesis Efficiency as Key Factor in Decision-Making for Forest Design and Redesign: A Systematic Literature Review. Ecological Frontiers 2024, 44, 1128–1139. [Google Scholar] [CrossRef]
- Sun, Y.; Frankenberg, C.; Jung, M.; Joiner, J.; Guanter, L.; Köhler, P.; Magney, T. Overview of Solar-Induced Chlorophyll Fluorescence (SIF) from the Orbiting Carbon Observatory-2: Retrieval, Cross-Mission Comparison, and Global Monitoring for GPP. Remote Sensing of Environment 2018, 209, 808–823. [Google Scholar] [CrossRef]
- Bacour, C.; Maignan, F.; Peylin, P.; MacBean, N.; Bastrikov, V.; Joiner, J.; Köhler, P.; Guanter, L.; Frankenberg, C. Differences Between OCO-2 and GOME-2 SIF Products from a Model-Data Fusion Perspective. JGR Biogeosciences 2019, 124, 3143–3157. [Google Scholar] [CrossRef]
- Gou, R.; Buchmann, N.; Chi, J.; Luo, Y.; Mo, L.; Shekhar, A.; Feigenwinter, I.; Hörtnagl, L.; Lu, W.; Cui, X.; et al. Temporal Variations of Carbon and Water Fluxes in a Subtropical Mangrove Forest: Insights from a Decade-Long Eddy Covariance Measurement. Agricultural and Forest Meteorology 2023, 343, 109764. [Google Scholar] [CrossRef]
- Ahmed, S.; Kamruzzaman, Md.; Rahman, Md.S.; Sakib, N.; Azad, Md.S.; Dey, T. Stand Structure and Carbon Storage of a Young Mangrove Plantation Forest in Coastal Area of Bangladesh: The Promise of a Natural Solution. Nature-Based Solutions 2022, 2, 100025. [Google Scholar] [CrossRef]
- Ali, Y.; Rahman, M.M. Quantifying Forest Stocking Changes in Sundarbans Mangrove Using Remote Sensing Data. Science of Remote Sensing 2025, 11, 100181. [Google Scholar] [CrossRef]
- Hussain, N.; Khanam, R.; Khan, E. Two and Half Century’s Changes of World Largest Mangrove Forest: A Geo-Informatics Based Study on Sundarbans Mangrove Forest, Bangladesh, India. MESE 2017, 03, 419–423. [Google Scholar] [CrossRef]
- Ellison, J.C. Mangrove Retreat with Rising Sea-Level, Bermuda. Estuarine, Coastal and Shelf Science 1993, 37, 75–87. [Google Scholar] [CrossRef]
- Giri, C.; Pengra, B.; Zhu, Z.; Singh, A.; Tieszen, L.L. Monitoring Mangrove Forest Dynamics of the Sundarbans in Bangladesh and India Using Multi-Temporal Satellite Data from 1973 to 2000. Estuarine, Coastal and Shelf Science 2007, 73, 91–100. [Google Scholar] [CrossRef]
- Brammer, H. Bangladesh’s Dynamic Coastal Regions and Sea-Level Rise. Climate Risk Management 2014, 1, 51–62. [Google Scholar] [CrossRef]
- Hussain, N.; Khan, E. Coastline Dynamics and Raising Landform: A Geo-Informatics Based Study on the Bay of Bengal, Bangladesh. IJG 2018, 50, 41. [Google Scholar] [CrossRef]
- Islam, MD.T. Vegetation Changes of Sundarbans Based on Landsat Imagery Analysis between 1975 and 2006. Landscape & Environment 2014, 8, 1–9. [Google Scholar]
- Piazza, M. M., Govil, D. K., & Altrell, D. Brief on National Forest Inventory; Bangladesh, Forestry Department Food and Agriculture Organization of the United Nations.
- Mukul, S.A.; Alamgir, M.; Sohel, Md.S.I.; Pert, P.L.; Herbohn, J.; Turton, S.M.; Khan, Md.S.I.; Munim, S.A.; Reza, A.H.M.A.; Laurance, W.F. Combined Effects of Climate Change and Sea-Level Rise Project Dramatic Habitat Loss of the Globally Endangered Bengal Tiger in the Bangladesh Sundarbans. Science of The Total Environment 2019, 663, 830–840. [Google Scholar] [CrossRef] [PubMed]
- Jacquemoud, S.; Baret, F. PROSPECT: A Model of Leaf Optical Properties Spectra. Remote Sensing of Environment 1990, 34, 75–91. [Google Scholar] [CrossRef]
- Feret, J.-B.; François, C.; Asner, G.P.; Gitelson, A.A.; Martin, R.E.; Bidel, L.P.R.; Ustin, S.L.; Le Maire, G.; Jacquemoud, S. PROSPECT-4 and 5: Advances in the Leaf Optical Properties Model Separating Photosynthetic Pigments. Remote Sensing of Environment 2008, 112, 3030–3043. [Google Scholar] [CrossRef]
- Verhoef, W. Light Scattering by Leaf Layers with Application to Canopy Reflectance Modeling: The SAIL Model. Remote Sensing of Environment 1984, 16, 125–141. [Google Scholar] [CrossRef]
- Xu, X.Q.; Lu, J.S.; Zhang, N.; Yang, T.C.; He, J.Y.; Yao, X.; Cheng, T.; Zhu, Y.; Cao, W.X.; Tian, Y.C. Inversion of Rice Canopy Chlorophyll Content and Leaf Area Index Based on Coupling of Radiative Transfer and Bayesian Network Models. ISPRS Journal of Photogrammetry and Remote Sensing 2019, 150, 185–196. [Google Scholar] [CrossRef]
- Zhang, Y.; Xiao, X.; Wu, X.; Zhou, S.; Zhang, G.; Qin, Y.; Dong, J. A Global Moderate Resolution Dataset of Gross Primary Production of Vegetation for 2000–2016. Sci Data 2017, 4, 170165. [Google Scholar] [CrossRef]
- Guanter, L.; Zhang, Y.; Jung, M.; Joiner, J.; Voigt, M.; Berry, J.A.; Frankenberg, C.; Huete, A.R.; Zarco-Tejada, P.; Lee, J.-E.; et al. Global and Time-Resolved Monitoring of Crop Photosynthesis with Chlorophyll Fluorescence. Proc. Natl. Acad. Sci. U.S.A. 2014, 111. [Google Scholar] [CrossRef]
- Samanta, S.; Hazra, S.; Mondal, P.P.; Chanda, A.; Giri, S.; French, J.R.; Nicholls, R.J. Assessment and Attribution of Mangrove Forest Changes in the Indian Sundarbans from 2000 to 2020. Remote Sensing 2021, 13, 4957. [Google Scholar] [CrossRef]
- Wilson, T.B.; Meyers, T.P. Determining Vegetation Indices from Solar and Photosynthetically Active Radiation Fluxes. Agricultural and Forest Meteorology 2007, 144, 160–179. [Google Scholar] [CrossRef]
- Alatorre, L.C.; Sánchez-Carrillo, S.; Miramontes-Beltrán, S.; Medina, R.J.; Torres-Olave, M.E.; Bravo, L.C.; Wiebe, L.C.; Granados, A.; Adams, D.K.; Sánchez, E.; et al. Temporal Changes of NDVI for Qualitative Environmental Assessment of Mangroves: Shrimp Farming Impact on the Health Decline of the Arid Mangroves in the Gulf of California (1990–2010). Journal of Arid Environments 2016, 125, 98–109. [Google Scholar] [CrossRef]
- Gnanamoorthy, P.; Selvam, V.; Deb Burman, P.K.; Chakraborty, S.; Karipot, A.; Nagarajan, R.; Ramasubramanian, R.; Song, Q.; Zhang, Y.; Grace, J. Seasonal Variations of Net Ecosystem (CO2) Exchange in the Indian Tropical Mangrove Forest of Pichavaram. Estuarine, Coastal and Shelf Science 2020, 243, 106828. [Google Scholar] [CrossRef]
- Zheng, Y.; Takeuchi, W. Estimating Mangrove Forest Gross Primary Production by Quantifying Environmental Stressors in the Coastal Area. Sci Rep 2022, 12, 2238. [Google Scholar] [CrossRef] [PubMed]
- 2023.
- European Commission, Joint Research Centre, Crippa, M., Guizzardi, D., Pagani, F., Banja, M., Muntean, M., Schaaf, E.,; Monforti-Ferrario, F., Becker, W.E., Quadrelli, R., Risquez Martin, A., Taghavi-Moharamli, P., Köykkä, J., Grassi, G., Rossi, S., Melo, J., Oom, D.,; Branco, A., San-Miguel, J., Manca, G., Pisoni, E., Vignati, E. and Pekar, F., GHG Emissions of All World Countries.; Publications Office: LU, 2024.
- Liao, Z.; Zhou, B.; Zhu, J.; Jia, H.; Fei, X. A Critical Review of Methods, Principles and Progress for Estimating the Gross Primary Productivity of Terrestrial Ecosystems. Front. Environ. Sci. 2023, 11, 1093095. [Google Scholar] [CrossRef]
- Qian, L.; Yu, X.; Zhang, Z.; Wu, L.; Fan, J.; Xiang, Y.; Chen, J.; Liu, X. Assessing and Improving the High Uncertainty of Global Gross Primary Productivity Products Based on Deep Learning under Extreme Climatic Conditions. Science of The Total Environment 2024, 957, 177344. [Google Scholar] [CrossRef] [PubMed]
- Lees, K.J.; Quaife, T.; Artz, R.R.E.; Khomik, M.; Clark, J.M. Potential for Using Remote Sensing to Estimate Carbon Fluxes across Northern Peatlands – A Review. Science of The Total Environment 2018, 615, 857–874. [Google Scholar] [CrossRef]
- Tang, Y.; Li, T.; Yang, X.; Chao, Q.; Wang, C.; Lai, D.Y.F.; Liu, J.; Zhu, X.; Zhao, X.; Fan, X.; et al. Mango-GPP: A Process-Based Model for Simulating Gross Primary Productivity of Mangrove Ecosystems. J Adv Model Earth Syst 2023, 15, e2023MS003714. [Google Scholar] [CrossRef]
Figure 1.
Location of the study area: (a) map of Bangladesh showing the position of the Sundarbans in the southwest region, and (b) detailed map of the Sundarbans Mangrove Forest.
Figure 1.
Location of the study area: (a) map of Bangladesh showing the position of the Sundarbans in the southwest region, and (b) detailed map of the Sundarbans Mangrove Forest.
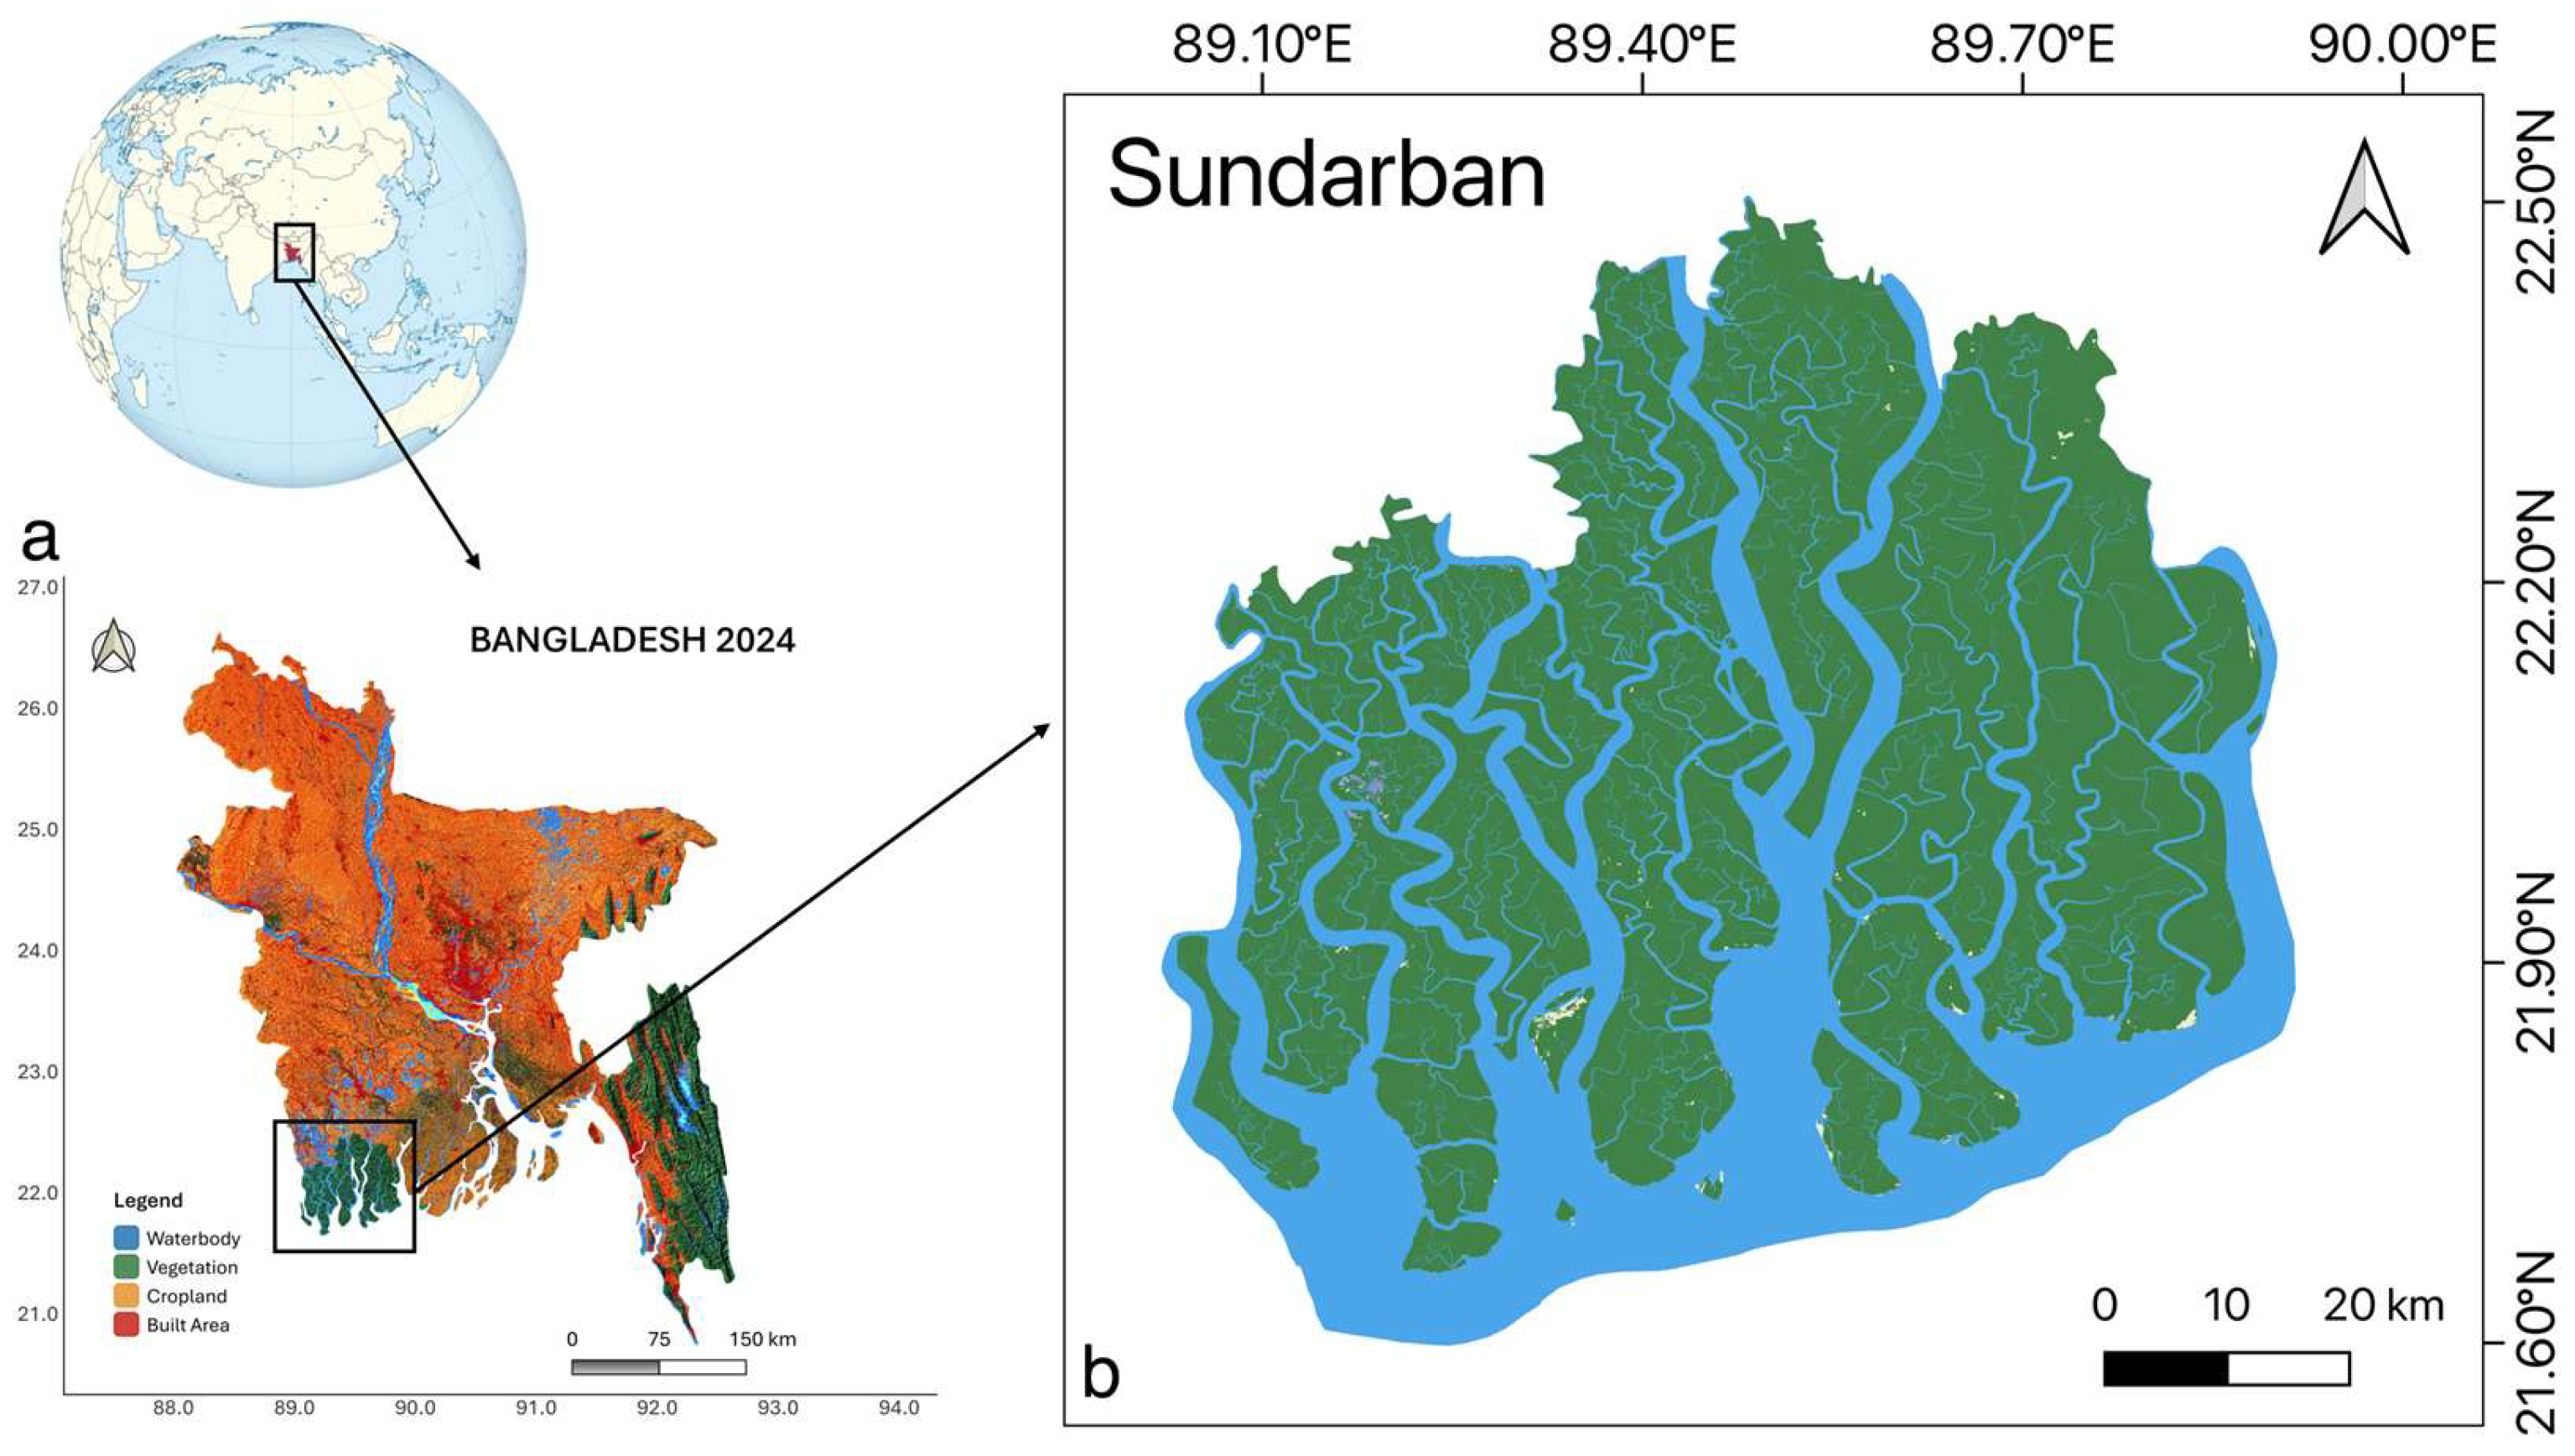
Figure 2.
Workflow illustrating the experimental design and data analysis framework used to estimate satellite-based leaf area index (LAI), gross primary productivity (GPP), and solar-induced fluorescence (SIF).
Figure 2.
Workflow illustrating the experimental design and data analysis framework used to estimate satellite-based leaf area index (LAI), gross primary productivity (GPP), and solar-induced fluorescence (SIF).
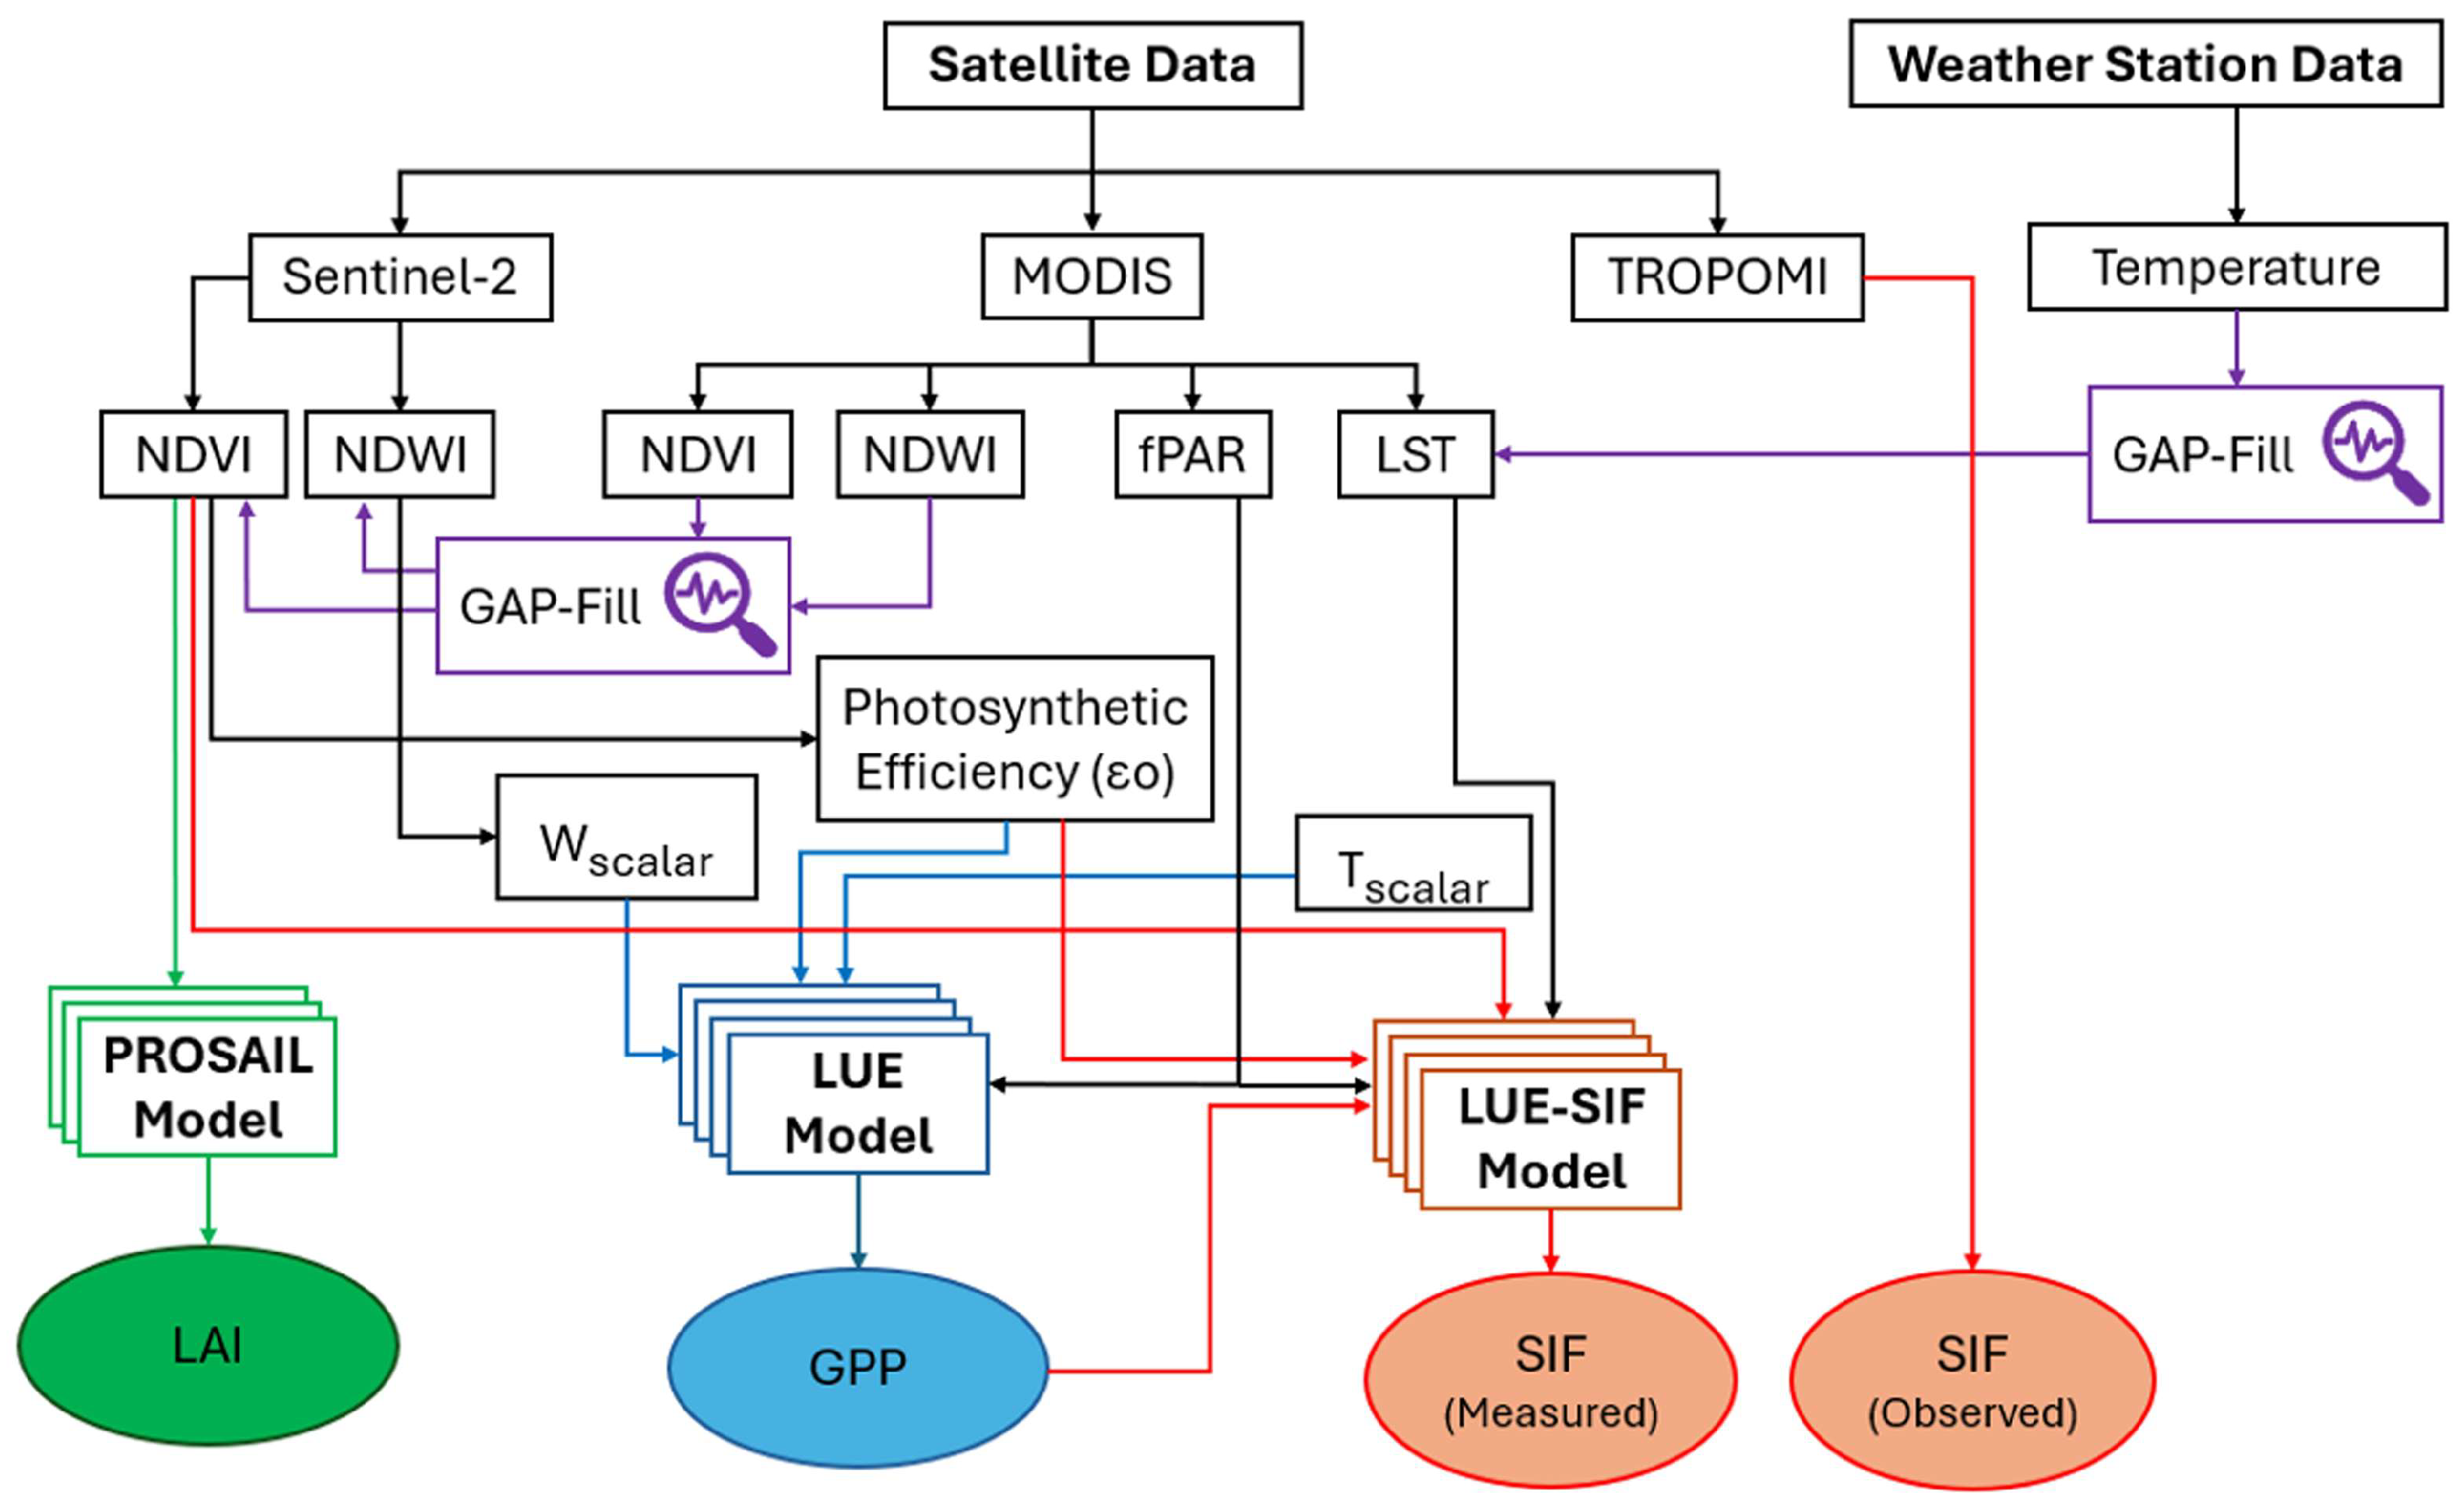
Figure 3.
Daily average NDVI and LAI (m2/m2). (a) Monthly average NDVI from 2019 to 2023, showing seasonal variations in vegetation greenness condition. (b) Monthly average LAI from 2019 to 2023, illustrating changes in forest canopy structure. Green circles represent simulated data, the blue line shows the monthly mean, and the red lines indicate the interquartile range (IQR, Q3–Q1), representing the middle 50% of the data.
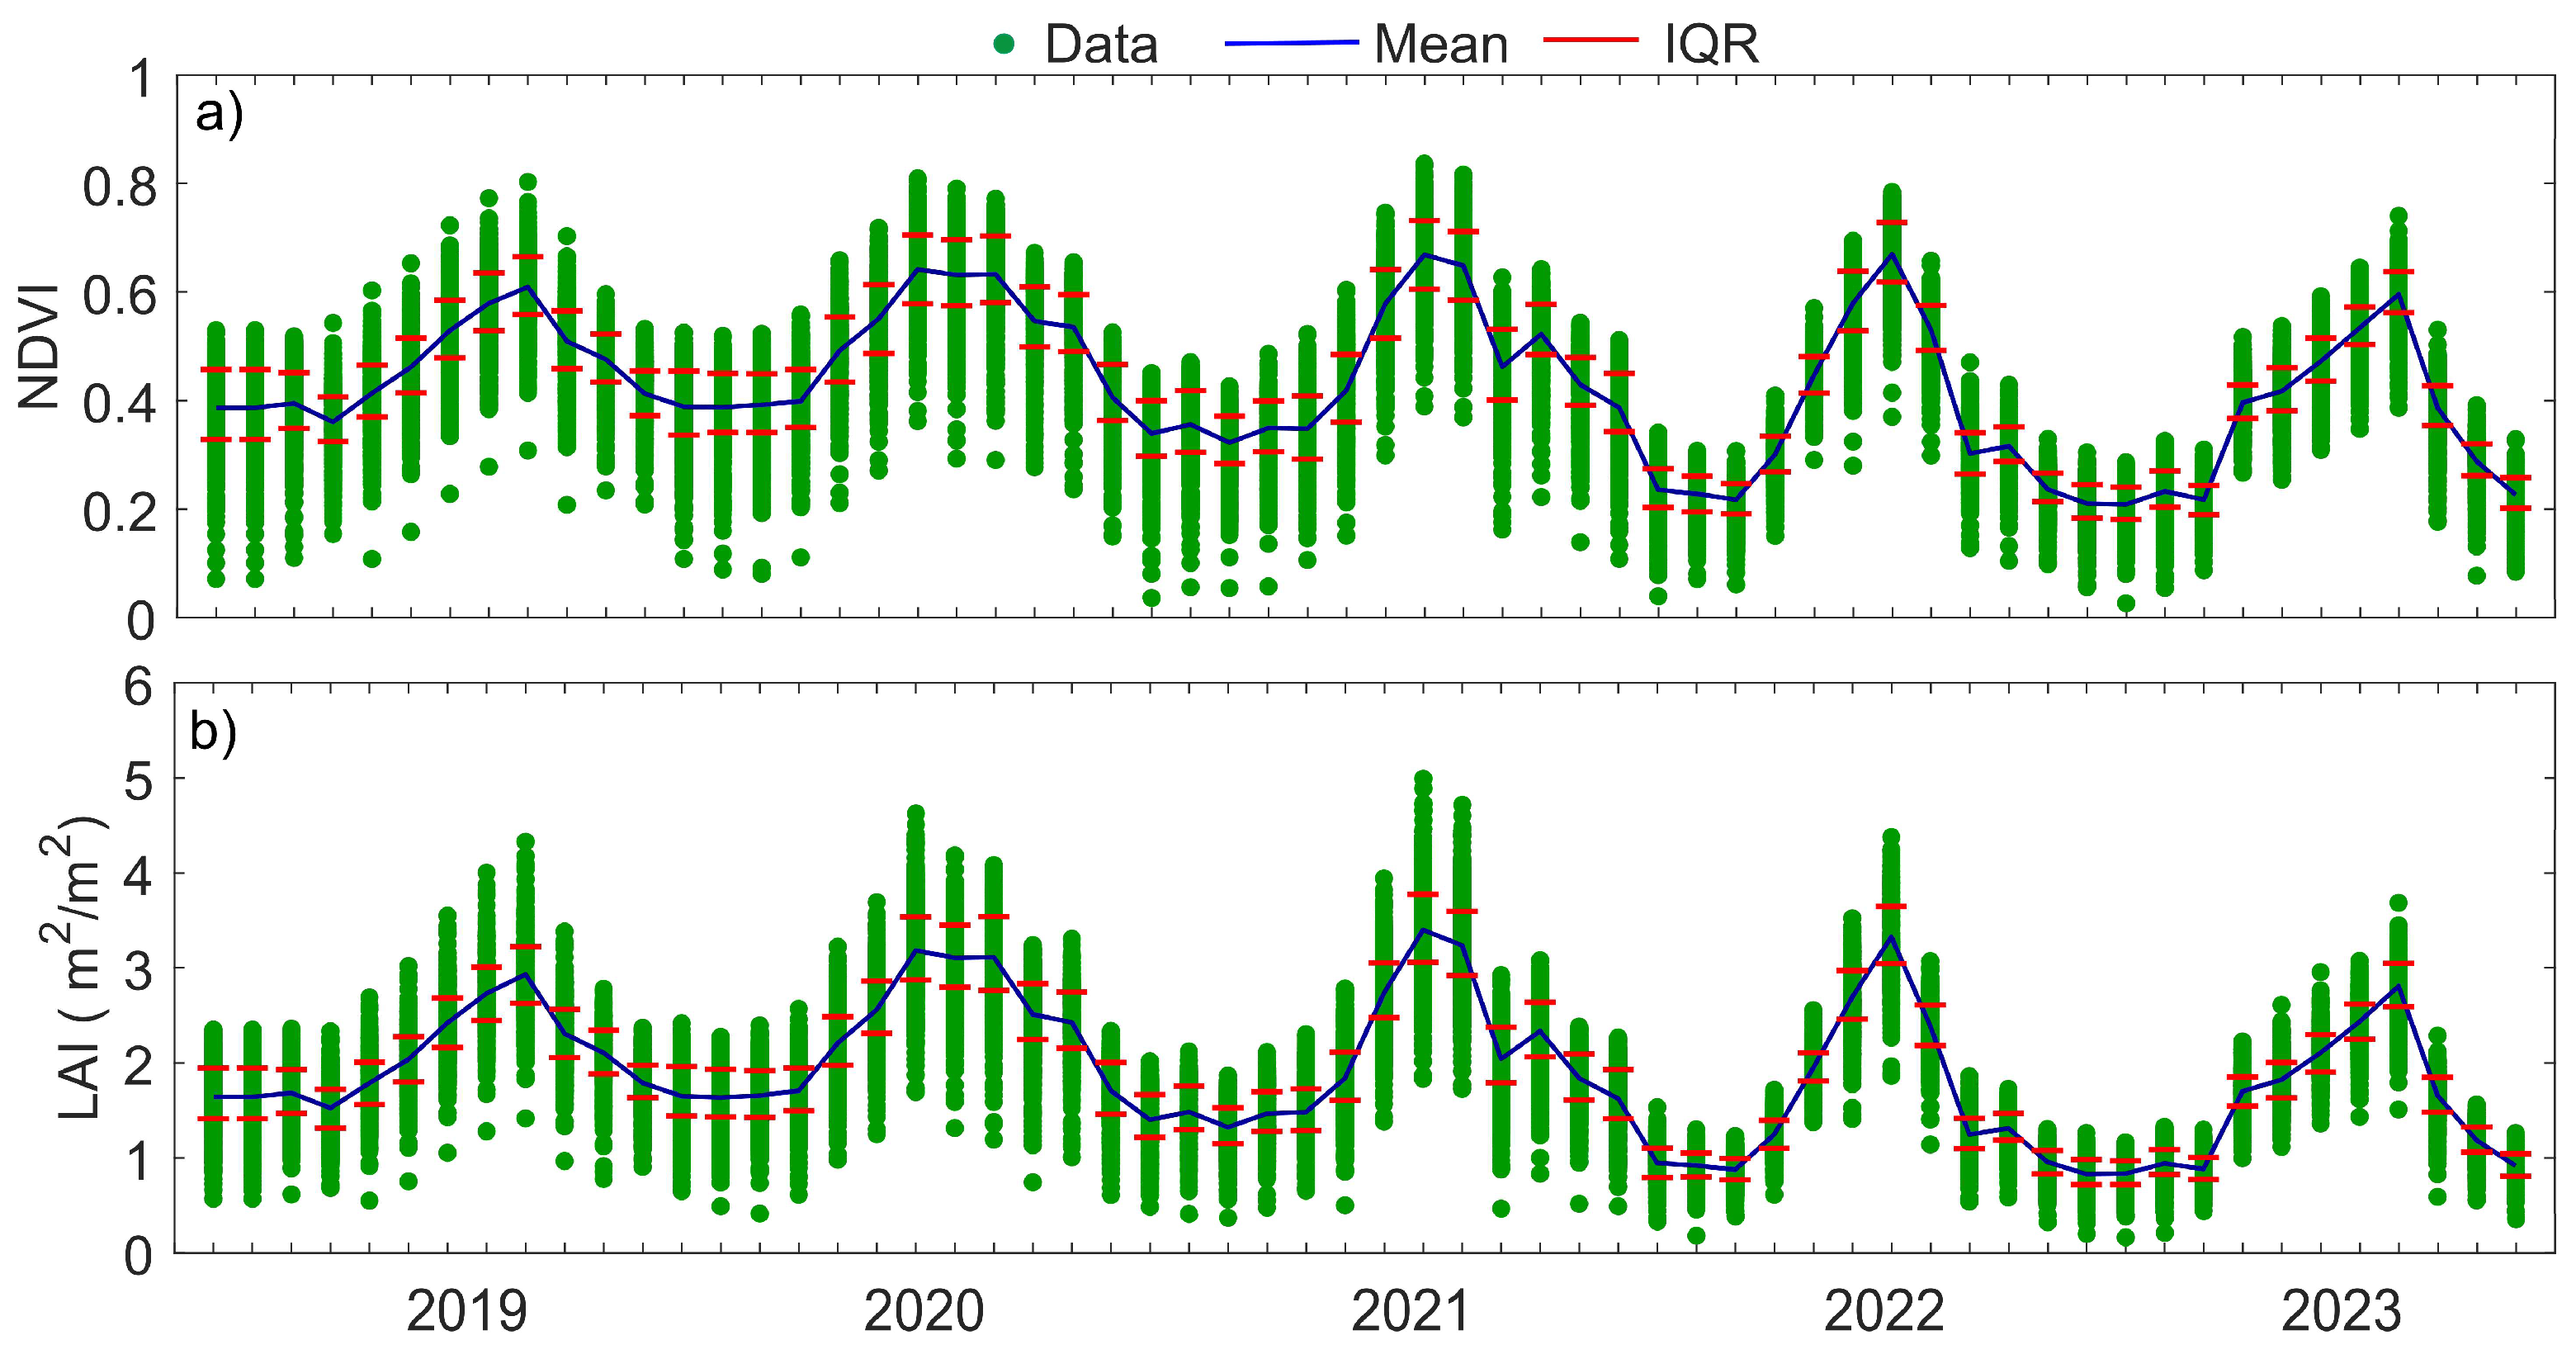
Figure 4.
Monthly mean LAI (m2/m2) time series map. The left to right columns represents the months from January to December, and the rows (from top to bottom) represent the years 2019 to 2023. This figure displays the variation in LAI across the different months and years, providing insights into seasonal and interannual changes in the Sundarbans mangrove forest canopy structure.
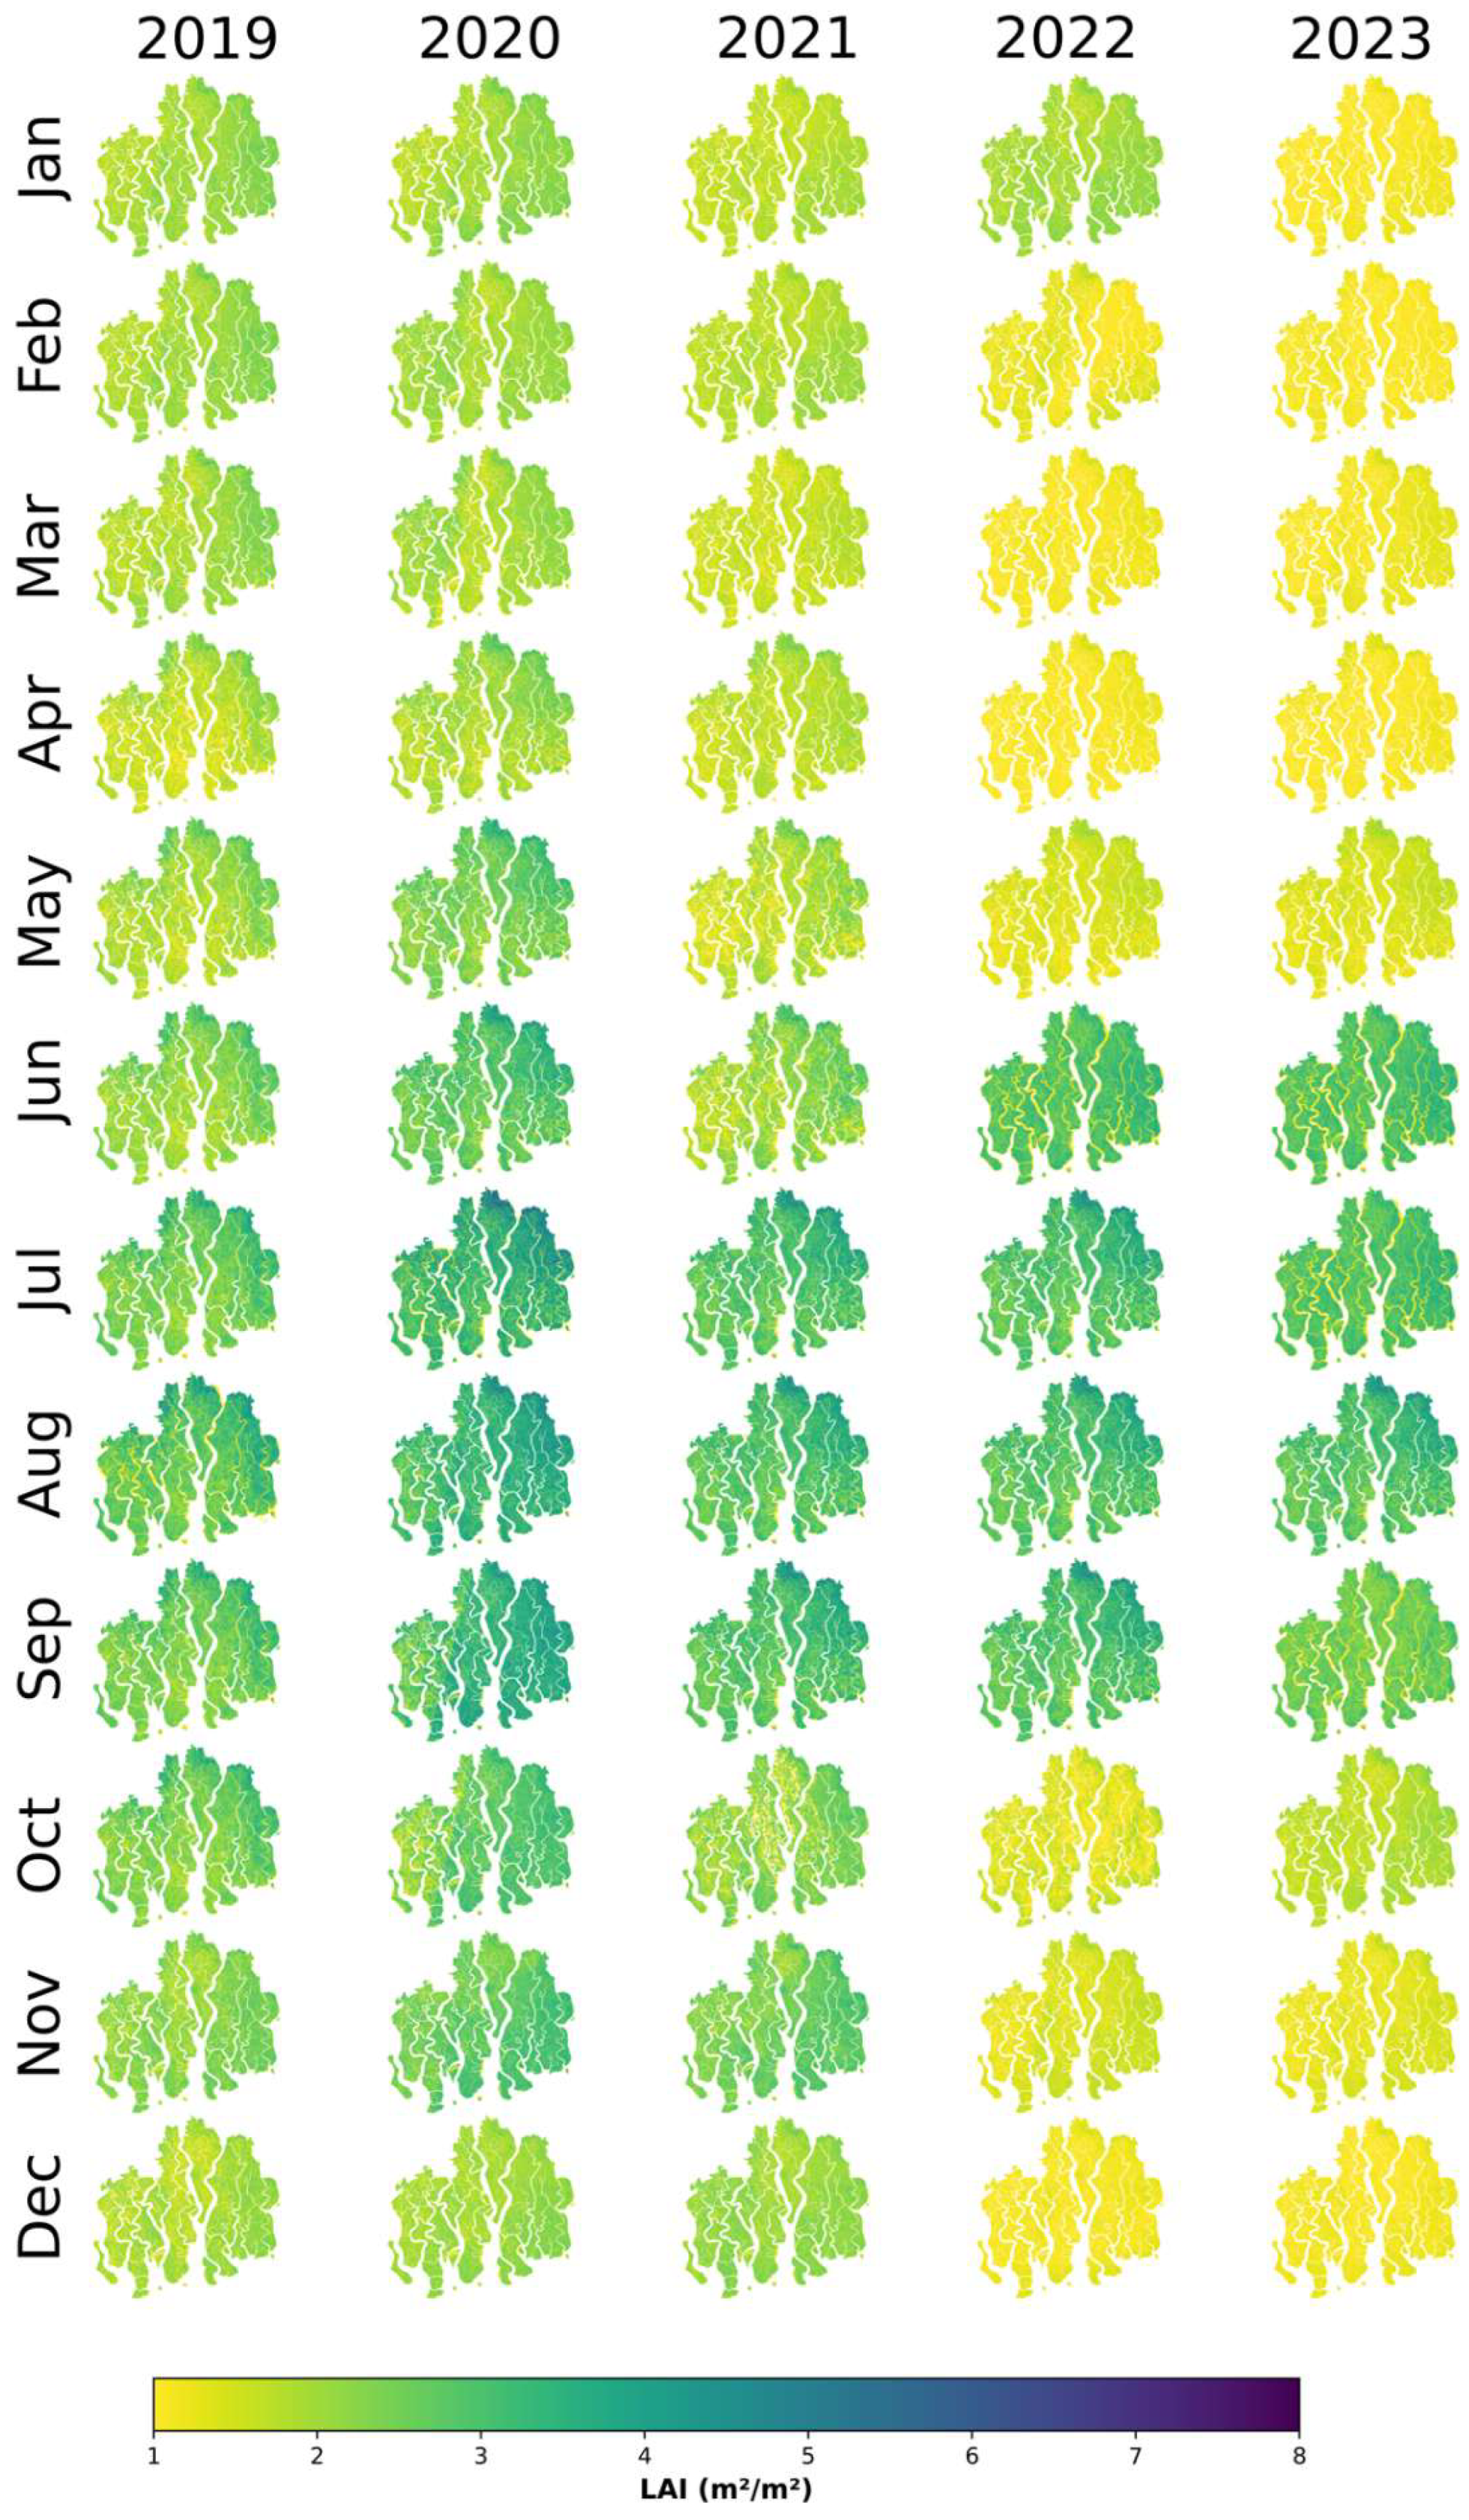
Figure 5.
Daily GPP (g C m−2 d−1) averaged by month. Columns from left to right represent months from January to December, and rows from top to bottom represent years 2019 to 2023. The figure illustrates seasonal and interannual fluctuations in GPP, providing a detailed view of spatio-temporal changes in canopy structure, biomass, and vegetation cover in the Sundarbans mangrove forest.
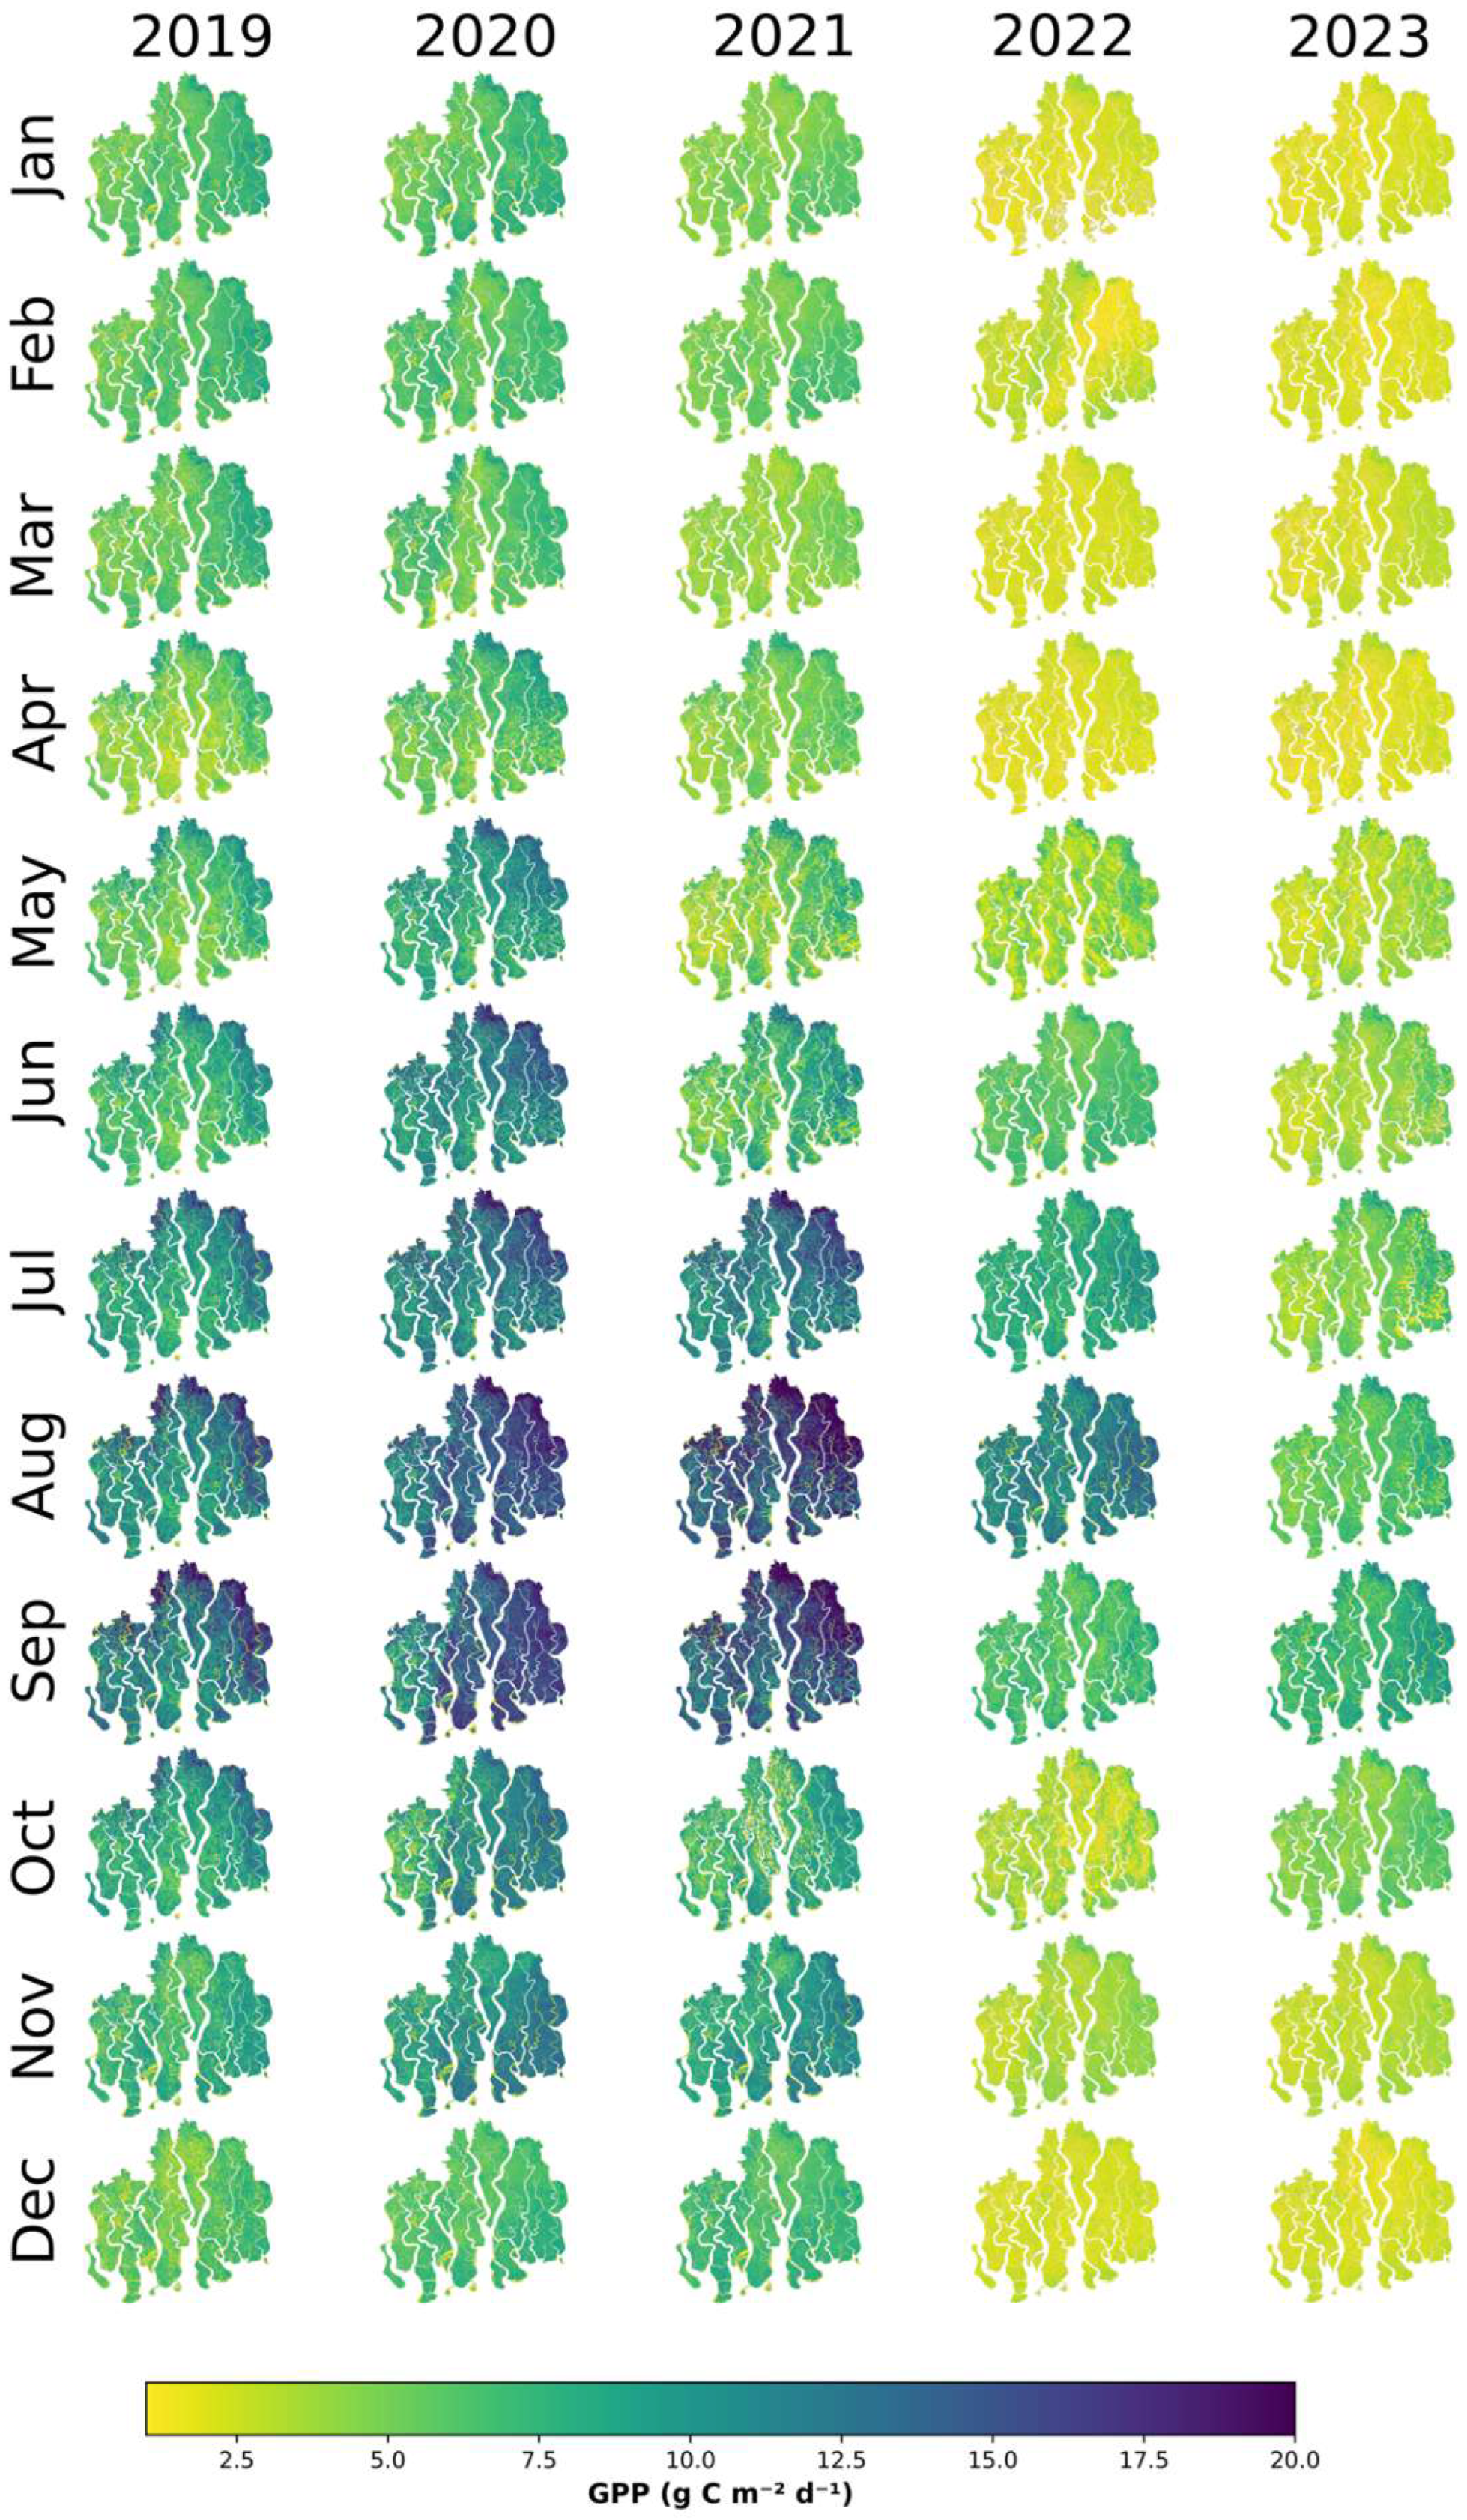
Figure 6.
The monthly time series of carbon sequestration and photosynthetic activity. a) The monthly average GPP (g C m−2) and b) The monthly Solar Induced Chlorophyll Fluorescence (SIF) (mW·m−2·nm−1·sr−1) from 2019 to 2023, illustrating the seasonal and interannual variations. Green circles represent simulated data, the blue line shows the monthly mean, and the red lines indicate the interquartile range (IQR, Q3–Q1), representing the middle 50% of the data.
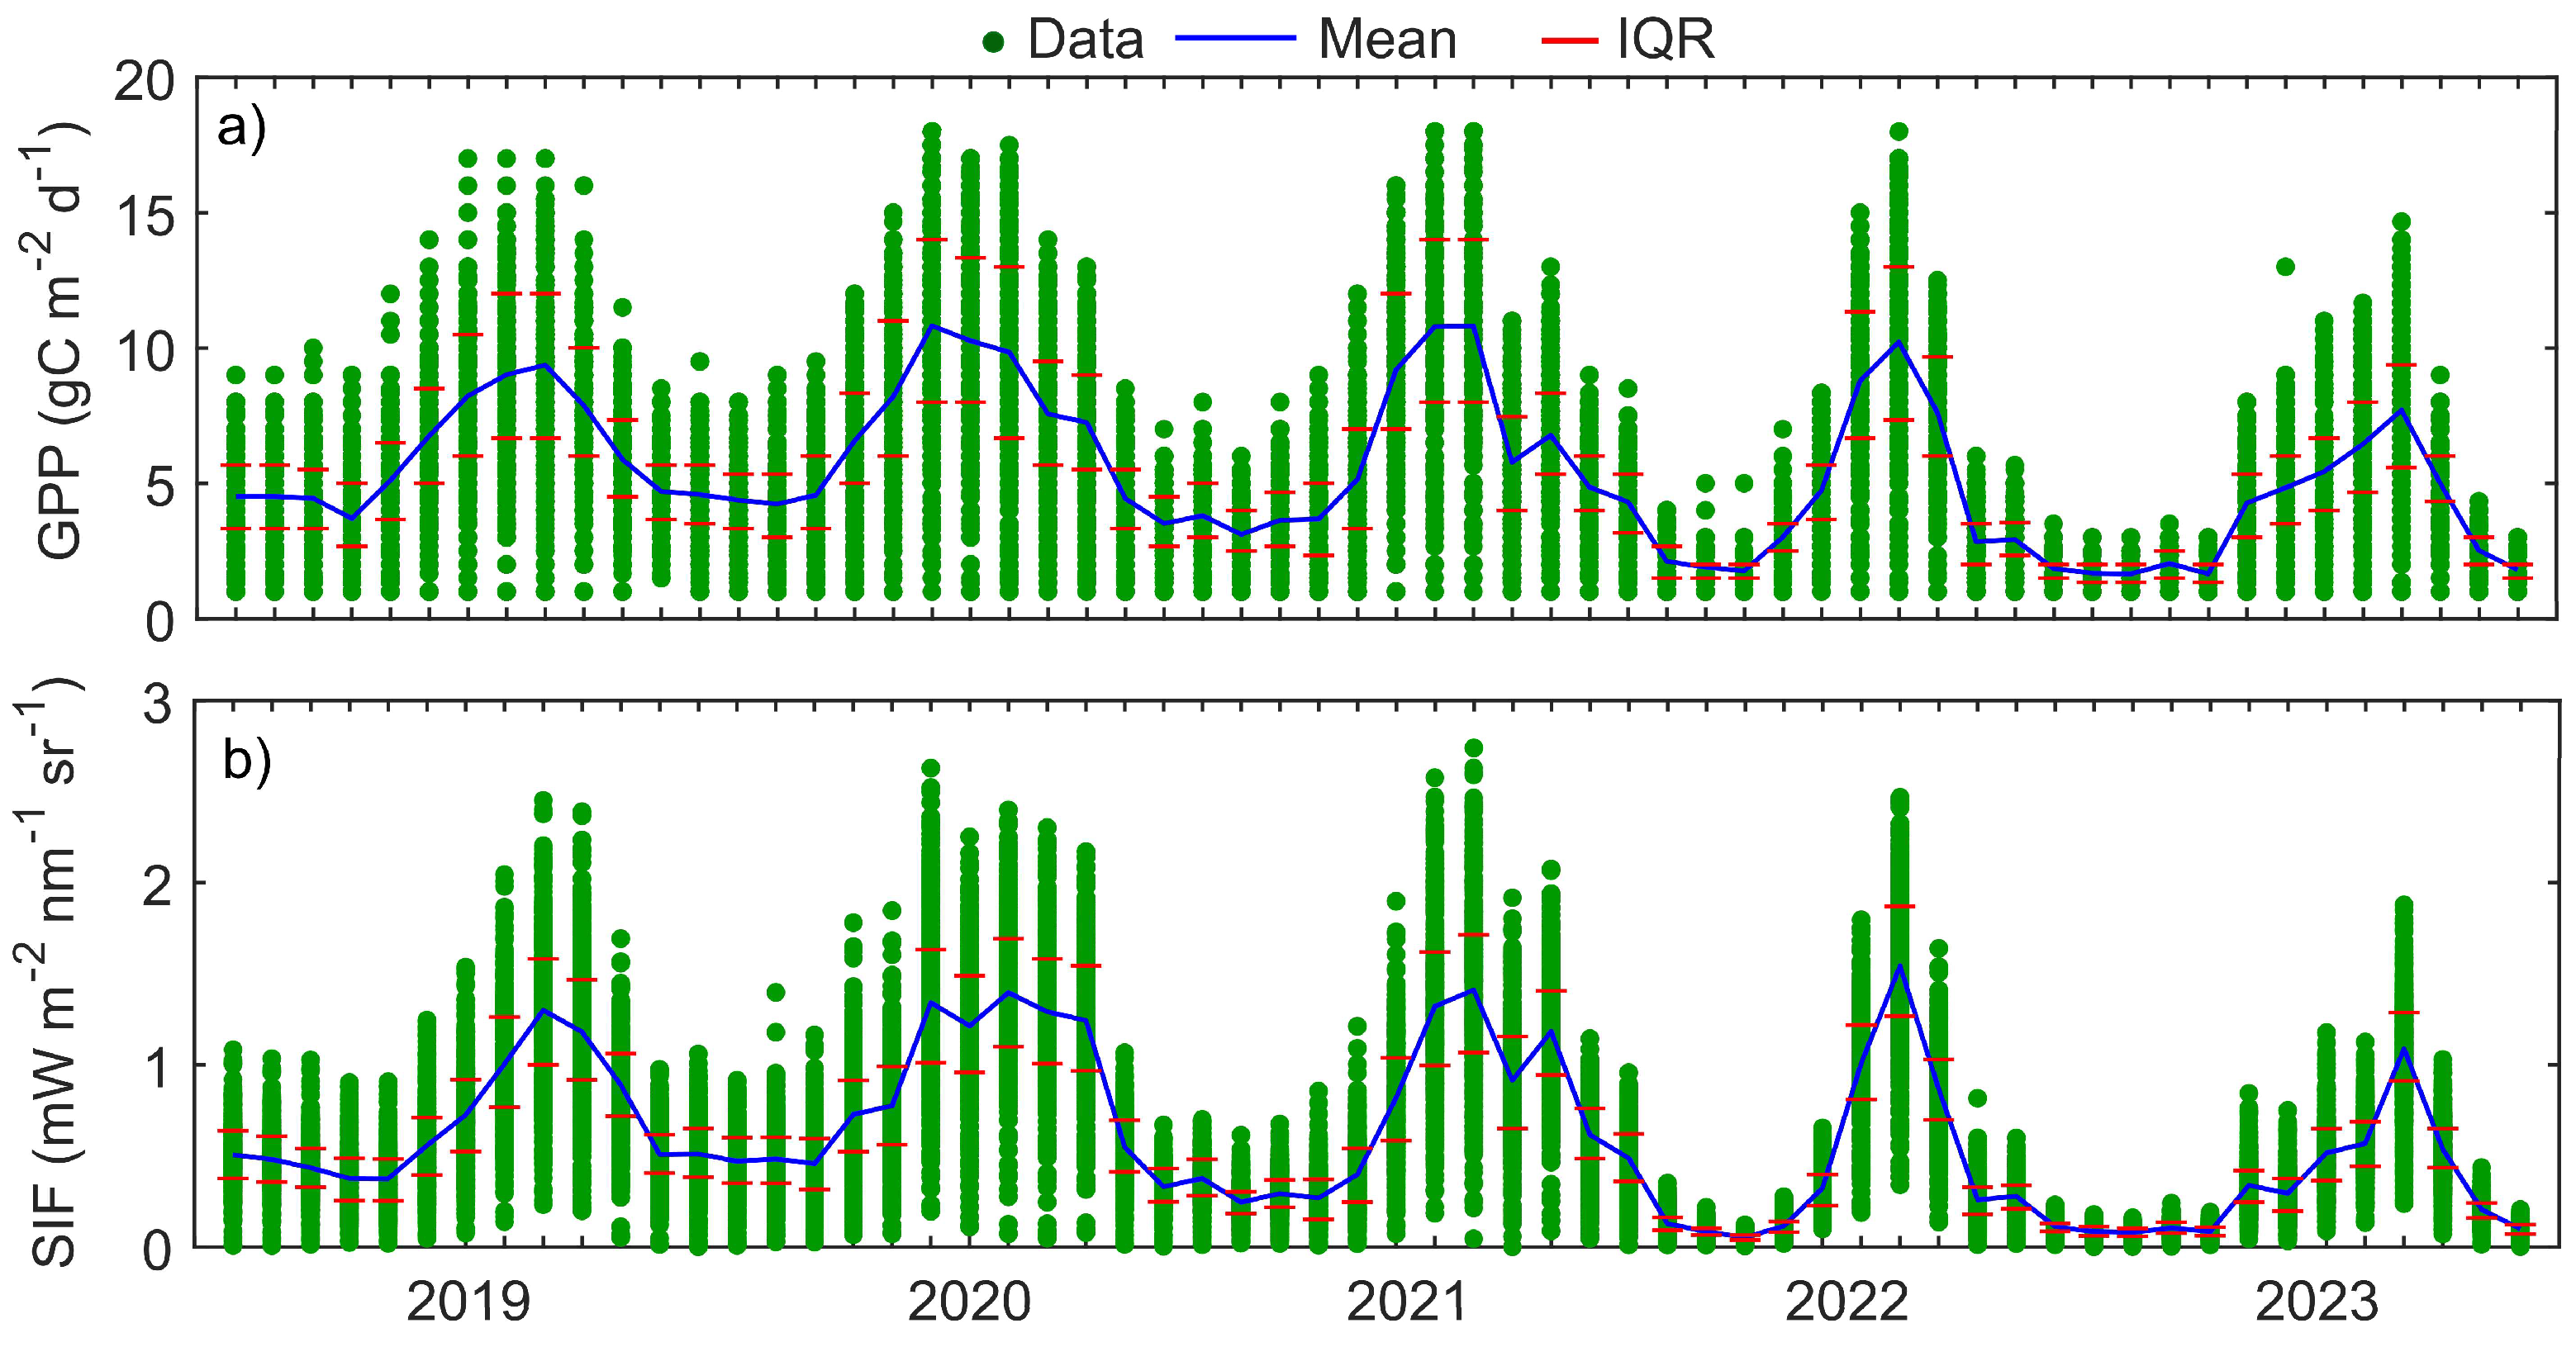
Figure 7.
Monthly time series of Solar Induced Chlorophyll Fluorescence (SIF) (mW·m−2·nm−1·sr−1) spanning from 2019 to 2023. The columns represent each month from January to December, while the rows correspond to the years from 2019 to 2023, arranged from top to bottom.
Figure 7.
Monthly time series of Solar Induced Chlorophyll Fluorescence (SIF) (mW·m−2·nm−1·sr−1) spanning from 2019 to 2023. The columns represent each month from January to December, while the rows correspond to the years from 2019 to 2023, arranged from top to bottom.
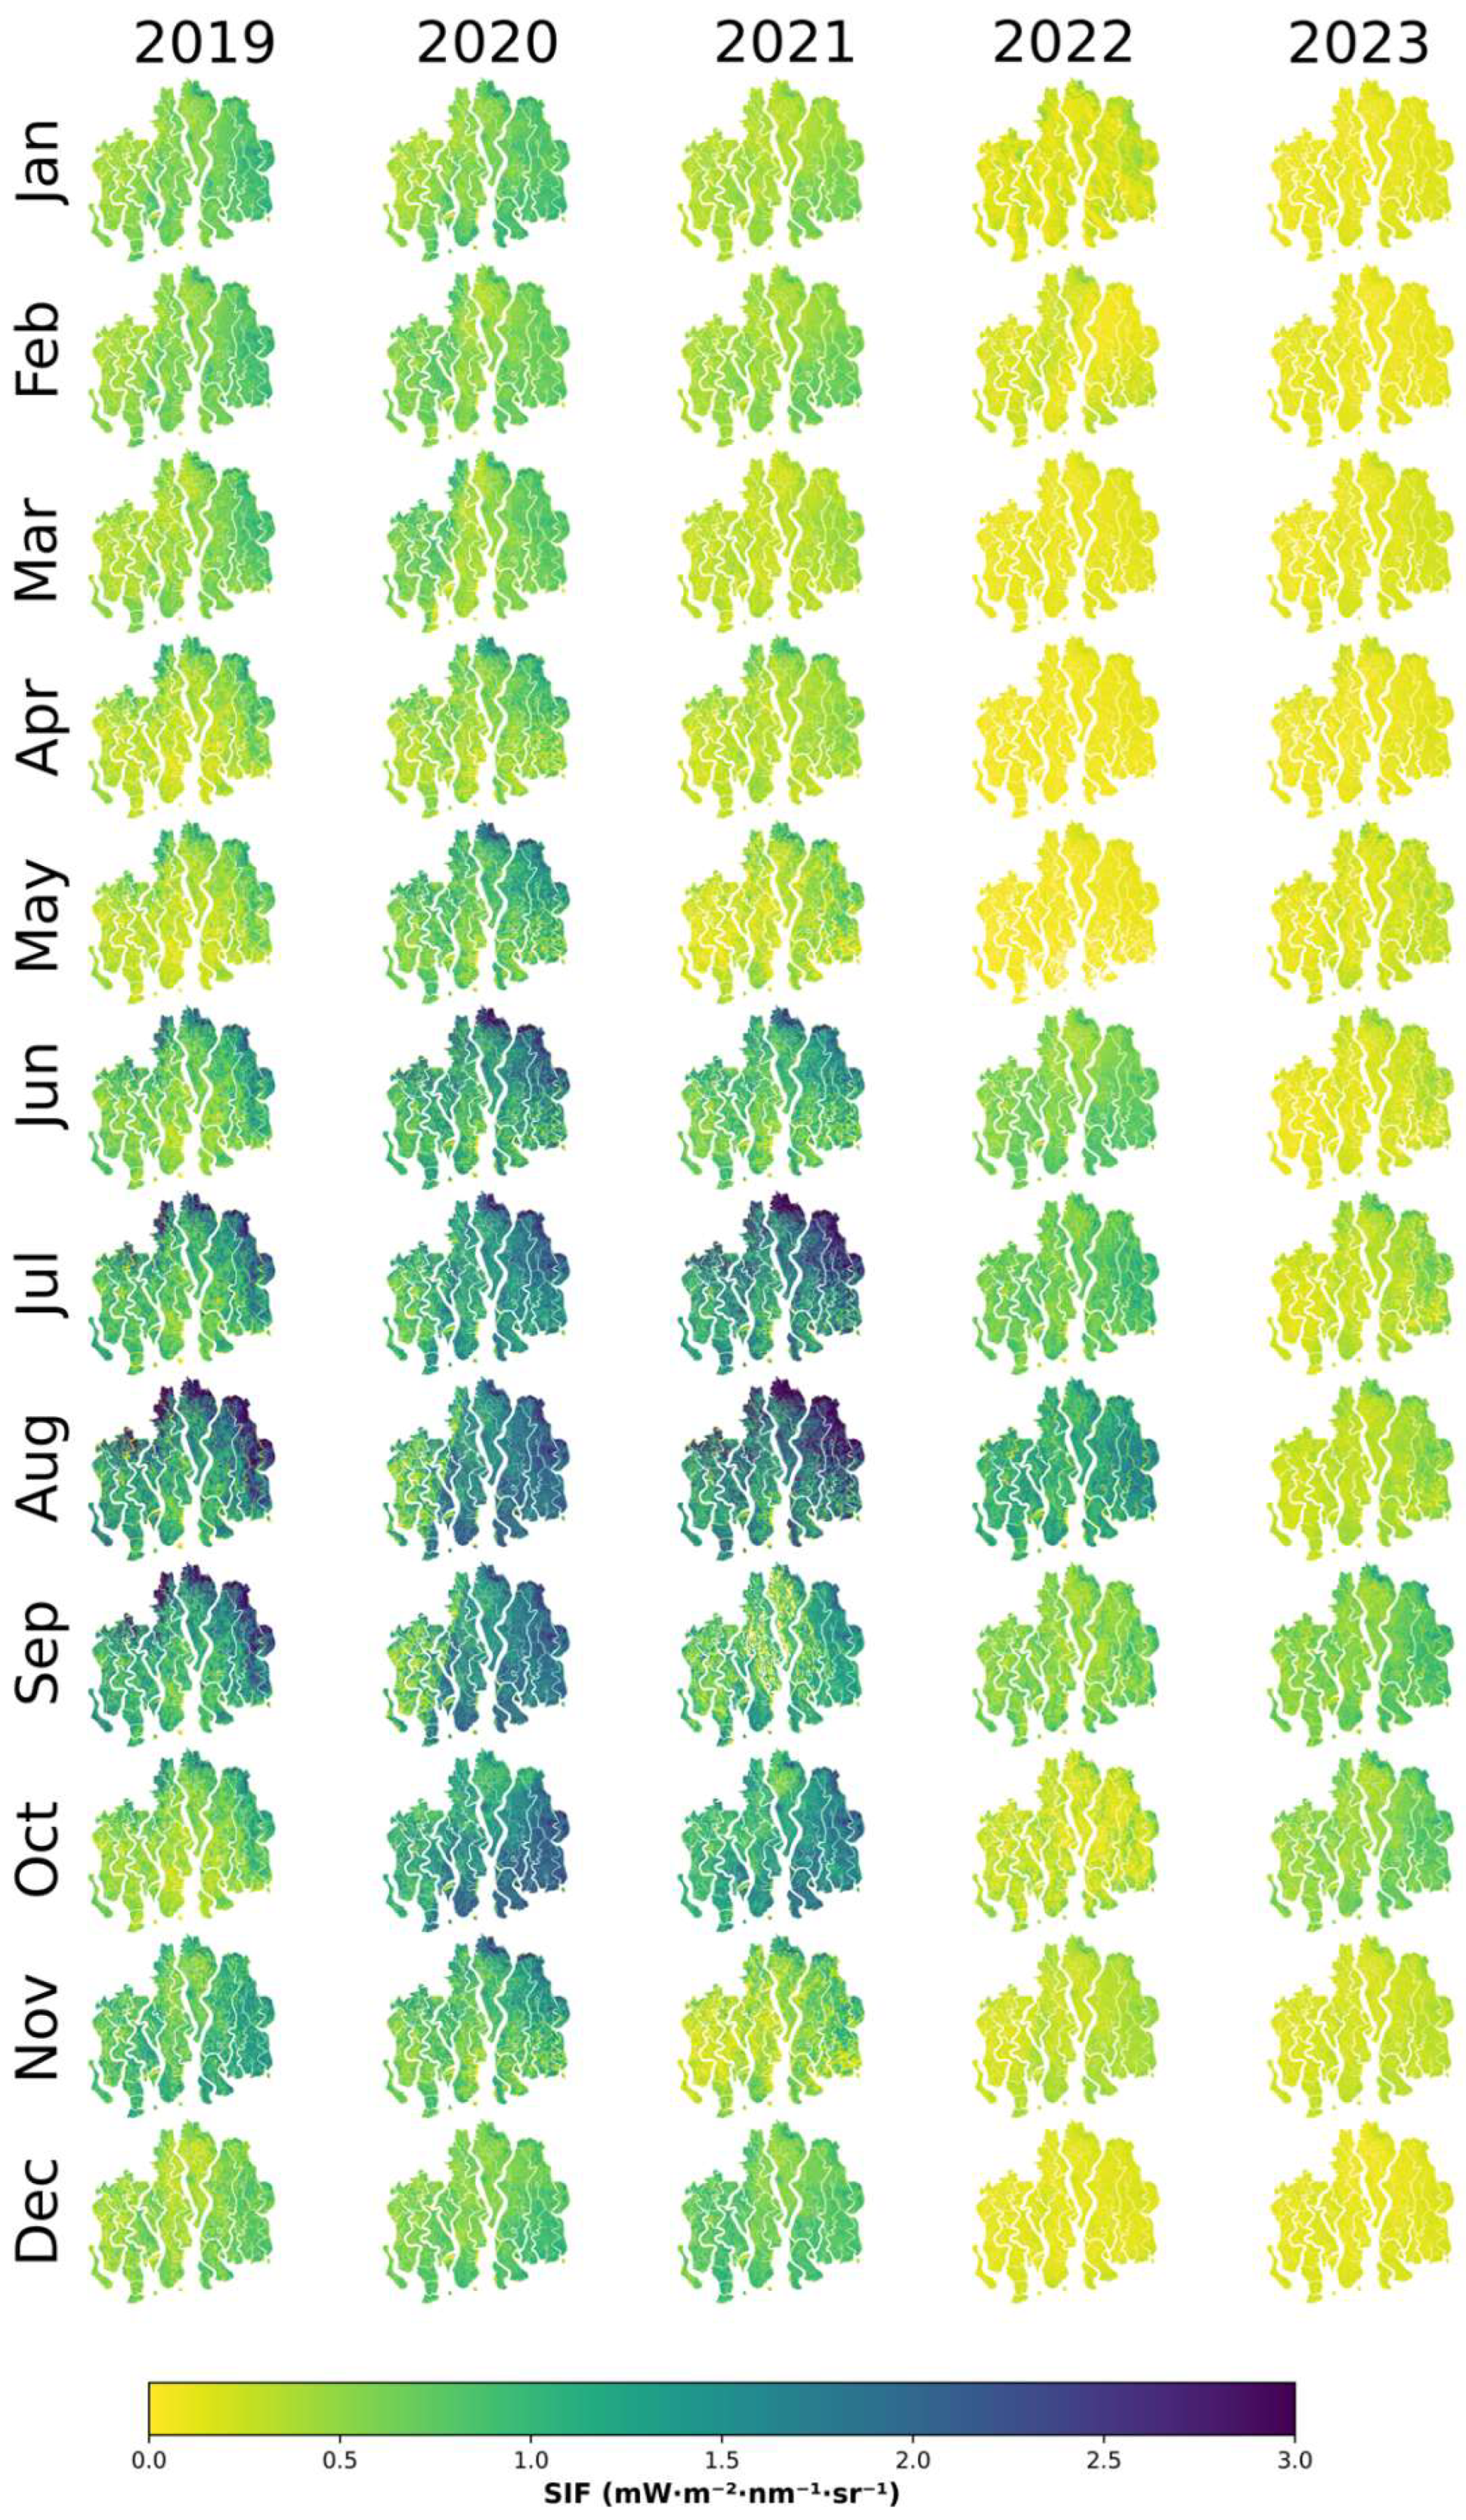
Figure 8.
Relationship between modeled and observed values of (a)SIF, (b)GPP, and (c)LAI. The figure illustrates the agreement between model simulations and observations, showing the model’s accuracy in measured chlorophyll fluorescence, photosynthetic activity, and mangrove leaf area dynamics. The color gradient from cold blue to warm red indicates the density of individual data points, ranging from 2 to 10.
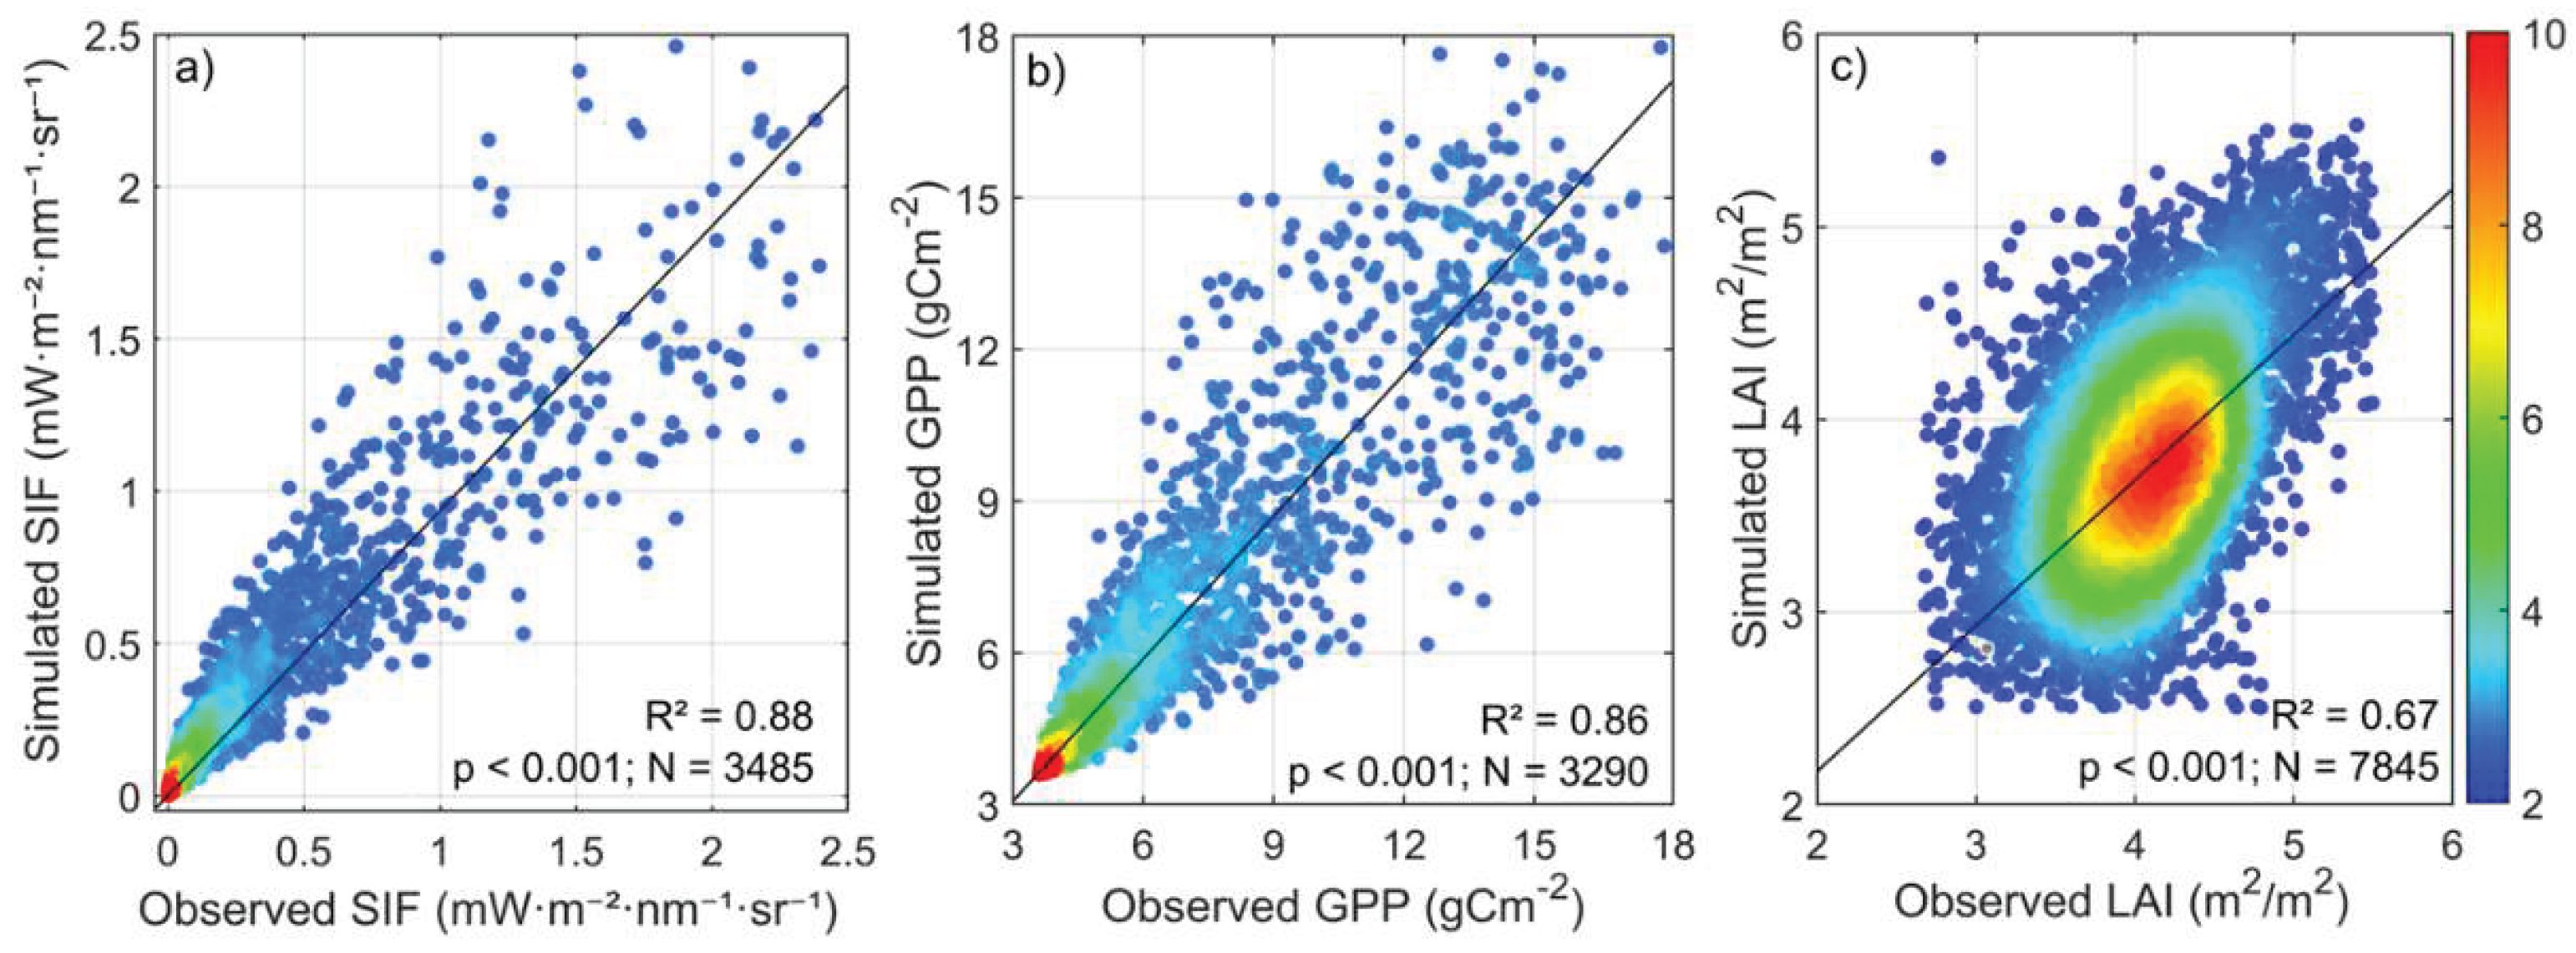

Table 1.
Input parameters of the PROSAIL model used in this study, including parameter definitions, units, ranges, and fixed values applied for leaf optical and canopy structural simulations.
Table 1.
Input parameters of the PROSAIL model used in this study, including parameter definitions, units, ranges, and fixed values applied for leaf optical and canopy structural simulations.
| Model | Input Parameters | Symbol | Unit | Range | Fixed value |
|---|---|---|---|---|---|
| PROSPECT | Leaf structure | N | dimensionless | 1.5 – 3.0 | 1.5 |
| Chlorophyll content | Cab | µg.cm-2 | 10 - 80 | 40 | |
| Carotenoid content | Car | µg.cm-2 | – | 10 | |
| Brown pigment | Cbrown | arbitrary units | – | 0 | |
| Equivalent water thickness | Cw | cm | – | 0.01 | |
| Dry matter content | Cm | g.cm-2 | – | 0.009 | |
| SAIL | Leaf inclination distribution function | LIDF | shape | spherical | spherical |
| LIDFa | slope | -1 to 1 | -0.35 | ||
| LIDFb | Kind of distortion | -1 to 1 | -0.15 | ||
| Leaf Area Index | LAI | m2/m2 | 0 - 8 | ||
| Hot spot parameter | hspot | m/m | 0.03 – 0.1 | 0.01 | |
| Solar zenith angle | tts | (°) | 20 -70 | 30 | |
| View zenith angle | tto | (°) | 0 - 30 | 10 | |
| Relative azimuth angle | psi | (°) | 0 |
Table 2.
Carbon Sequestration by the Sundarbans Mangrove Forest and Comparison with Bangladesh’s total CO2 Emissions (2019-2023) *.
Table 2.
Carbon Sequestration by the Sundarbans Mangrove Forest and Comparison with Bangladesh’s total CO2 Emissions (2019-2023) *.
| Year | Total CO2 Emissions of Bangladesh (Mt CO2 eq) | Total Carbon Sequestration by Sundarbans (Mt CO2 eq) | Emissions Absorbed by Sundarbans |
|---|---|---|---|
| 2019 | 213.19 | 54.65 | 25.63% |
| 2020 | 269.03 | 65.06 | 24.18% |
| 2021 | 276.8 | 57.61 | 20.81% |
| 2022 | 278.49 | 42.76 | 15.35% |
| 2023 | 281.38 | 49.17 | 17.47% |
*Note: The total CO2 emissions data for Bangladesh is sourced from the Ministry of Environment, Forest, and Climate Change, Bangladesh, for 2019 (DoE, 2023), and from the CO2 and GHG Emission Reports by the European Commission for the years 2020 to 2023 (Crippa et al., 2024).
Table 3.
Annual mean values of NDVI, LAI, GPP, and SIF from 2019 to 2023 for the Sundarbans Mangrove Forest.
Table 3.
Annual mean values of NDVI, LAI, GPP, and SIF from 2019 to 2023 for the Sundarbans Mangrove Forest.
| Year | NDVI | LAI (m2/m2) | GPP (gCm-2d-1) | SIF (mWm-2 sr-1 nm-1) |
|---|---|---|---|---|
| 2019 | 0.506 | 2.272 | 6.588 | 0.817 |
| 2020 | 0.548 | 2.587 | 7.841 | 0.939 |
| 2021 | 0.513 | 2.354 | 6.945 | 0.867 |
| 2022 | 0.459 | 2.119 | 5.154 | 0.582 |
| 2023 | 0.433 | 2.152 | 5.927 | 0.663 |
Disclaimer/Publisher’s Note: The statements, opinions and data contained in all publications are solely those of the individual author(s) and contributor(s) and not of MDPI and/or the editor(s). MDPI and/or the editor(s) disclaim responsibility for any injury to people or property resulting from any ideas, methods, instructions or products referred to in the content. |
© 2025 by the authors. Licensee MDPI, Basel, Switzerland. This article is an open access article distributed under the terms and conditions of the Creative Commons Attribution (CC BY) license (http://creativecommons.org/licenses/by/4.0/).
Copyright: This open access article is published under a Creative Commons CC BY 4.0 license, which permit the free download, distribution, and reuse, provided that the author and preprint are cited in any reuse.


