Submitted:
10 November 2025
Posted:
11 November 2025
You are already at the latest version
Abstract
Non-destructive testing (NDT) methods are playing a crucial role in modern agriculture by providing efficient, rapid, and non-invasive means of evaluating agricultural materials. This shift from traditional, often destructive, testing methods is driven by the need for better quality control, improved food safety, and the demands of intelligent and precise agriculture Polarization spectroscopy analysis (PSA) has emerged as an advanced, non-destructive testing method of growing importance in agricultural engineering. By integrating polarization characteristics with spectral data, PSA enables the detailed analysis of various agricultural products and processes.This review provides a systematic overview of the principles and key parameters of polarimetry. Furthermore, it highlights a wide range of PSA applications in agricultural materials, such as crop health assessment, pest detection, chlorophyll estimation, and the evaluation of water, nitrogen, phosphorus, and potassium content. In addition, it sheds light on further applications, including non-destructive testing of seed health and agricultural product quality, soil moisture and pollution monitoring, underwater and nighttime environmental imaging, and integration with hyperspectral and multispectral technologies.Polarization spectroscopy is an analytical technology capable of revealing physical structural information unresolved by traditional spectroscopy, especially in complex environments where it demonstrates greater resistance to interference. With its ability to monitor plant nutrition, predict seed germination, assess fruit and vegetable quality, and detect early pests and diseases, this technology holds great promise for precision agriculture. Future efforts should optimize data fusion, build efficient models, miniaturize intelligent equipment, and enhance the real-time performance and adaptability of non-destructive testing to support smart agriculture..
Keywords:
polarized spectroscopy
; polarization image
; agricultural materials
; non-destructive detection
; precision agriculture
1. Introduction
Agricultural materials, including crops, fruits and vegetables, seeds, and soil, are crucial for both agricultural economy and food safety during production, processing, and storage [1]. In modern agriculture, several key indicators directly influence production efficiency and quality including monitoring crop growth stages, managing water resources effectively [2], assessing the agricultural environment [3], and evaluating the internal and external quality of fruits [4]. By carefully monitoring and managing these key indicators, farmers can enhance productivity, improve resource utilization, and produce high-quality agricultural products. of The advancement of precision and smart agriculture relies on the integration of novel technologies with rapid response capabilities, non-destructive testing features [5],and cost effective across all phases of agricultural production, including cultivation, management and harvesting. These technologies not only enhance real-time monitoring of crop growth and improve the efficiency of agricultural resource utilization, but also enable dynamic evaluation and precise control of crop quality. Consequently, such innovations play a critical role in advancing agricultural modernization and promoting sustainable development.
Traditional destructive detection methods pose several challenges in piratical applications, including resource consumption, time efficiency, and scalability. These methods require destructive sampling rendering the tested samples unusable or unsellable. This practice leads to material waste, and increased costs. Besides, the testing process is time consuming, and labor intensive, involving multiple steps such as sample preparation, laboratory analysis, data processing [6]. This multi-stage approach results I extended testing cycle that are poorly suited to rapid detection and real-time decision-making [7]. Furthermore, efficiency is further affected by reliance on manual operations and complex equipment, making it difficult to conduct large-scale or continuous testing of numerous samples. With the advancement of technology, non-destructive testing (NDT) has gained widespread attention and application due to its real-time capability, low energy consumption, and minimal sample preparation. NDT has significantly improved testing efficiency and reduced costs in various industries such as manufacturing, agriculture, and medical diagnostics. In agriculture, NDT plays a vital role in monitoring crop quality [8], detecting disease at an early stage [9], and assessing plant growth [10]. Among available NDT methods, computer vision and spectral technologies have gained increasing attention and application due to their low cost, high accuracy, and rapid analysis capabilities [11,12,13]. Computer vision technology enable fast and accurate detection of pests and diseases through automated image capture and intelligent image analysis, significantly improving the efficiency and reliability of monitoring [14]. Similarly, spectral technology allows rapid, non-destructive assessment of internal crop attributes such as nitrogen level [15], sugar content [16], and diseased tissues [17], by analyzing how substances reflect, absorb, or scatter light at different wavelengths. The integration of these technologies not only increases the level of automation and intelligence in agricultural testing, but also provides strong technical support for the advancemet of precision and smart agriculture.
Polarization spectroscopy is an advanced analytical technique that combines polarization optical signals with spectral data. It not only provides fundamental spectral characteristics, such as absorption and scattering, but also reveals additional details about molecular structure, orientation, symmetry, and surface characteristics [18]. This technology is non-destructive, allow real-time monitoring, and offers high sensitivity and throughput. It has been widely applied in material science [19], biomedicine [20,21], environmental monitoring [22], and food safety [23]. It also offers a superior solution for intelligent agricultural testing and precision agriculture. (Figure 1).
Polarization spectroscopy can provide structural information that conventional spectroscopic analysis cannot, enhancing the identification of complex biological materials. As a result, it plays a crucial role in seed quality assessment, crop growth monitoring, disease diagnosis, soil nutrient analysis, and the quality inspection of agricultural products. Over the past 20 years, polarization spectroscopy research in agricultural engineering has shown a clear upward trajectory, with a growing emphasis on both the adoption of portable sensor systems and the design of specialized measurement platforms tailored to field conditions (Figure 2).
Since early 21st century, polarization detection has been widely studied for agricultural information monitoring. In 2017, Gastellu et al. [24]reviewed the theory of discrete anisotropic radiative transfer and its modeling mechanisms, focused on atmospheric, polarized light reflection, and chlorophyll fluorescence. Hosseini et al. [25]applied a polarization-based model to estimate biomass and soil moisture in spring wheat fields. The total biomass predication exhibited a root mean square error of 78.834 g/m2 and an average error of 58.438 m3/m2. The soil moisture estimation achieved an RMSE of 0.078 m3/m3 and an accuracy of 0.065 m3/m3. Lunagaria et al. [26]used a polarization spectrophotometer to measure the canopy anisotropy in wheat across 54 observation angles under an incident zenith angle of 60ocovering various growth stages. Results showed that when the polarization detection angle was close to the solar zenith angle, a significant hotspot effect appeared. During the heading to flowering stages, canopy uniformity and emergence rate were higher, making polarization imaging particularly effective for identifying phenological stages in the later growth period. furthermore, In 2019, Xu et al. [27] used a polarization hyperspectral imaging system (400-1000 nm) combined with a PLS-DA model to successfully classify sunflower leaf type, growth stages, and disease conditions. The R-SS index was used for leaf type classification, while R-BS was applied for growth stage identification. vertical polarization spectra provided the best performance in disease detection, achieving a correct classification rate (CCR) of 0.963).
In 2022, Sun Zhongqiu et al. [28] conducted observations of water surfaces under different solar zenith angles and specular reflection directions in the 450–1000 nm wavelength range. By analyzing the Degree of Linear Polarization (DOLP) of reflected light and the Fresnel reflection coefficients, they inverted the refractive index of the water. The results showed that polarization measurements could replace traditional reflectance methods, with an average relative difference of less than 3%. The inverted refractive index was highly correlated with salinity and demonstrated high accuracy, with an uncertainty ranging from 0.9% to 1.8%. Li et al. [29]developed the leaf optical model PROPOLAR, which combines the PROSPECT model with a three parameter function to simulate both polarized and non-polarized and polarized of leaf reflectance, while correlating biochemical and surface structural characteristics. The model was validated using a dataset of 533 samples, demonstrating good simulation performance for light intensity, BPRF, and Dolp with a maximum R ² of 0.98. PROPOLAR showed strong capability in retrieving biochemical parameter (such as chlorophyll, moisture) and estimating surface roughness.
In 2014, Huang Wenjiang et al. [30] used the bidirectional reflectance distribution function (BRDF) derived from polarization detection, to monitor physiological stress in winter wheat leaves. measurement was taken from the upper canopy layer at an elevation angle of 40o and 50o, the middle layer at 30 o and 40 o, and the lower layer at 20 o and 30 o. A regression model based was developed on the nitrogen reflectance index, the normalized chlorophyll index, and combination of both. Among these, the combined index provided the predication accuracy. Wu Di et al. [31]conducted a systematic analysis of the spectral and angular distribution of polarized reflectance from vegetation canopies using ground-based multi-angle hyperspectral polarization, and also estimated parameters of two polarization models. The results demonstrated that polarized reflectance from vegetation canopies is strongly anisotropic and exhibits weak dependence on wavelength, with measured data closely matching the model outputs. (Figure 3).
Based on the current development of polarization imaging technologies both in China and abroad, it is clear that polarization images can reveal information that is difficult to capture using conventional intensity images. This advantage arises from the ability of polarization imaging to sensitively detect variations in surface microstructure and material properties, thereby enhancing surface feature recognition. For instance, when surfaces such as smooth glass and rough wood are coated with the same color paint, their reflected intensity may appear nearly identical, making it difficult to distinguish them using intensity images alone. However, polarization images can effectively differentiate these surfaces because they are highly sensitive to surface roughness, refractive index, and the geometry of the observation angle [32], Current polarization detection mainly target nitrogen level, chlorophyll concentration, and wheat field biomass. These approaches have shown promising results and have established polarization-based fixed-position canopy detection devices. With ongoing advancement in computer technology, hardware systems significantly improved in processing large-scale data, which has accelerated the development of deep learning techniques [33,34,35], particularly in agricultural remote sensing:Mohammed Brahimi et al. [36] investigated deep learning-based methods for plant disease detection and classification. Their analysis revealed that most existing studies adopt CNN architectures such as AlexNet and GoogleNet. To improve accuracy, they evaluated various CNN models, and the results showed that InceptionV3 achieved a high accuracy of 99.76% on a publicly available plant disease dataset (Figure 4).
This review provides a comprehensive overview of recent advancements in polarization spectroscopy technology in agricultural materials research. The focus on its applications in crop growth monitoring, disease diagnosis, seed quality testing, soil nutrient analysis, and agricultural product quality assessment. In addition, this review current trends, key challenges, and potential future research directions of this technology in agriculture [41], with the aim of offering and tutorial review for researchers and beginners in these fields to promote the further development and application of polarization spectroscopy technology in agriculture.
2. The Principle and Advantages of Polarization Spectroscopy Analysis Technology
The principle of polarization detection: Polarization refers to the asymmetry between the direction of light wave vibration and its direction of propagation. All objects on the Earth's surface or in the atmosphere exhibit specific polarization characteristics during the processes of reflection, scattering, transmission, and emission of electromagnetic radiation. These characteristics are influenced by the physical properties of the objects and the basic principles of optics [42], Different objects or different states of the same object, such as roughness, porosity, water content, and the physical and chemical properties of the materials, can lead to distinct polarization effects. When light interacts with object, changes in surface texture, internal structure, or the angle of observation can alter the polarization state of the light. These changes can enhance certain information, making it possible to extract polarization information for more effective identification of objects [43]. Based on the vibration behavior of light waves, polarization can be categorized into natural light, linearly polarized light, elliptically polarized light [44], circularly polarized light, and partially polarized light.
Polarimetric imaging technology captures images by utilizing polarized light that is reflected and scattered from different points on an object's surface. In simple terms, it uses a polarizer to filters light, allowing only light with a specific polarization angle to pass through and be captured by the camera. This process enhances the visibility of the target by increasing contrast. Polarization detection devices, such as polarimeters and ellipsometers, such as polarimeters and ellipsometers, measure the polarization state of light and analyze it using parameters like the Stokes parameters, polarization degree, and polarization angle (Figure 5).
2.1. Stokes Parameters
In 1852, George Gabriel Stokes proposed a vector containing four parameters to fully describe the polarization state of light. The expression of this vector is [45]:
(General light intensity): The total intensity of light, regardless of polarization state.
(Horizontal/vertical polarization components): The difference in intensity of light in the horizontal (0°) and vertical (90°) directions.
(±45° polarization component): indicates the difference in intensity of light in +45° and-45° polarization directions.
(Circularly polarized component): The difference in intensity between left-handed and right-handed circularly polarized light.
Where: are the light intensity in horizontal and vertical directions respectively.
Are the light intensity of polarization direction +45° and-45° respectively.
Are the intensity of left and right circularly polarized light.
Based on the principle of polarization, the polarization state of reflected light can be influenced by factors such as soil type, the maturity of fruits and vegetables, and moisture content. This polarization state can be accurately measured using Stokes parameters. YiJia et al. [47] used a polarization spectroscopy imaging system to obtain multi-angle reflectance data from soybean leaves and established an experimental measurement model using the polarimetric bidirectional reflectance distribution function (pBRDF) to acquire Stokes vector data. By calculating, they successfully differentiate healthy leaves from diseased ones. Common applications of Stokes parameters, polarization degree, and polarization angle for specific agricultural material detection are listed in Table 1.
2.2. Polarization Degree
Polarization degree (DoP) is an indicator to measure the polarization purity of light, which represents the ratio of the polarization part of light to the total light intensity [48]. It is defined as:
When DoP=1: the light is completely polarized (such as a laser).
When DoP=0: the light is completely unpolarized (such as natural light).
When 0<DoP<1: the light is partially polarized.
Xu Xiang et al. [49] successfully demonstrated a rapid and non-destructive method for detecting water content in plant leaves by calculating the degree of linear polarization (DoLP) based on Stokes parameters. Takruri, M et al. [50] generated Degree of Linear Polarization (DoLP) and Angle of Polarization (AoP) images from captured polarization images, and employed Support Vector Regression (SVR) and Gaussian Process Regression (GPR) models to predict the actual age of apples, achieving an average prediction accuracy of up to 92.57%. Shibayama, M et al. [51] examined the polarization characteristics of wheat canopies by calculating the degree of polarization (DoP) for each image pixel and generating polarization images. Their results revealed a clear correlation between DoP and factors such as leaf tilt angle, leaf area index (LAI), and chlorophyll content (SPAD value). In 2024, He, QY et al. [52] developed a pBRDF model for plant canopies, generating fitted images of polarization degree changes with zenith angle. Data inversion on the canopies of Christmas blue cabbage and hibiscus resulted in root mean square errors of 2.3% and 1.1%, respectively (Figure 6).
2.3. Polarization Angle
Polarization Angle (AoP) describes the Angle of the polarization direction of light. The calculation formula is:
It indicates the main vibration direction of polarized light, which is closely related to the structure and orientation of the material. YHKim et al. [53] proposed a rice paddy extraction method using β, POA, and H.

Table 1.
Application of Stokes parameters, polarization and polarization Angle in agricultural material analysis.
Table 1.
Application of Stokes parameters, polarization and polarization Angle in agricultural material analysis.
| application area | Stokes parameter | degree of polarization | polarizing angle |
| Crop health monitoring | Chlorophyll content [54], disease identification [55] | disease detection [38] | Seed germination test [56] |
| Soil quality assessment | Soil moisture content [57] | Soil moisture [58] | Soil pollution [59] |
| Agricultural product maturity testing | Fruit maturity [60] | Maturity, freshness [61] | Surface condition of fruit [62] |
| Food quality testing | Pig's egg quality [63] | Classification of vegetable oils [64] | Quality inspection [50] |
2.4. Differences and Advantages Between Polarized Spectroscopy and Traditional Spectroscopy (Visible Light, Near Infrared, etc.) in Detection Ability
2.4.1. The Difference Between Polarization Spectrum Analysis Technology and Other Typical Nondestructive Testing Technologies
With the advancement of computer and wireless sensing technologies, various rapid non-destructive testing techniques have become a research focus in agricultural engineering [65,66,67,68,69,70]. Compared with traditional spectral techniques such as visible and near-infrared spectroscopy, polarization spectroscopy offers distinct detection mechanisms. Traditional spectroscopy typically relies on variations in spectral reflectance at specific wavelengths to extract information [71]; imaging technology mainly relies on macroscopic physical properties such as color and shape [72]; a and thermal imaging methods capture temperature-related data from leaves or crop canopies [73]. However, these monitoring methods only capture partial characteristics when crops are affected by disease or stress, leading to incomplete or limited data and poor interference resistance, and they cannot fully represent the rich characteristic information of agricultural materials. Moreover, during image or spectral analysis, challenges such as “different spectra from the same object” and “similar spectra from different objects” frequently occur. These issues introduce uncertainty in determining specific parameters, thereby limiting the reliability and practical application of precise crop monitoring technologies. High-spectral technology, as one of the most advanced detection methods, effectively integrates spatial, radiometric, and spectral information, making it a hotspot in research. For instance, the application of high-spectral technology in detecting crop diseases has made progress [74]. Currently, research on using high-spectral technology for detecting crop diseases primarily focuses on the spectral variations that occur after crops are affected by diseases after in infection [75]. This involves identifying the relationship between disease severity and alterations in both original spectra and derivative spectra, determining the sensitive spectral bands for monitoring different crops and diseases, and evolving from qualitative assessments to quantitative and spatial-based monitoring through mathematical models, achieving preliminary results [76]. However, high-spectral disease detection still faces several pressing issues: first, the theoretical understanding of the luminescence patterns under biological molecular stress in fungal diseases is not yet clear; the theoretical analysis techniques for high-spectral images are not fully developed and require further in-depth research; it is also necessary to establish characteristic spectra specific to different diseases to facilitate the practical application of high-spectral imaging technology.
The physical and chemical changes in crops caused by growth, reproduction, nutritional deficit, infection, and disease are complicated [77]. During detection, intensity and polarization information often exhibit a negative correlation: when the reflection intensity is high, the polarization degree is low; conversely, when the reflection intensity is not significantly different, the polarization direction may change markedly. This information's complimentary nature provides new perspectives on crop detection. Effective integration and machine analysis that integrates both intensity and polarization data are still lacking.
2.4.2. Advantages of Polarization Spectrum Analysis Technology
In short, the polarization spectrum analysis technology integrates the dual advantages of spectral analysis and polarization measurement, showing significant technical characteristics and application value in many directions of agricultural material detection. Its core advantages can be summarized as follows:
- 1). High detection sensitivity and revealing microscopic characteristics
By analyzing changes in the polarization state such as polarization direction and ellipticity, after the interaction between light and the target object, it is possible to detect birefringence, stress distribution, surface roughness, and microstructural heterogeneity in agricultural products, thereby revealing physical properties that are invisible to conventional imaging methods and undetectable through intensity-based imaging [78].
- 2). Enhance contrast and anti-interference
By separating polarization state information, background noise (such as greenhouse [38], glass reflection [79], underwater [80], rainy season farmland [81], etc.) can be effectively suppressed, and the recognition accuracy f farmland and fish pond environments can be improved [82]. Moreover, imaging quality can be maintained even under low-light or complex environmental conditions [83].
- 3). Enhance the ability of early diagnosis
By analyzing the polarized reflectance properties of leaves, physiological changes such as water stress and nutrient deficiencies can be detected, and with significantly higher sensitivity than traditional optical methods. For example, in the early detection of water content change in holly leaves, the regression index and the coefficient of determination of water content reached 0.95 [84] (Figure 7).
- 4). Comprehensive information fusion
The integration of polarization spectroscopy with other techniques allows for the combination of multiple data sources. For instance, when combined with high-resolution optical remote sensing images, it can identify crop planting areas [85] and monitor growth conditions [83] more accurately. When integrated with meteorological data, it can help analyze the water requirements and stress levels of crops [86]; When used together with fluorescence polarization imaging, it can detect plant growth conditions. This complementary use of different data sources significantly improves the accuracy and reliability of agricultural monitoring.
2.4.3. Classification of Polarization Spectroscopy Analysis Techniques
Based on the techniques and characteristics of data collection, polarimetric spectroscopy technology can be divided into two primary categories: polarimetric spectrometry and polarimetric imaging spectroscopy. Polarimetric imaging spectroscopy primarily focuses on obtaining polarized information about the spatial distribution and structure of crops, making it suitable for rapid detection and diagnosis of crop growth conditions [10], diseases and pests [38]. On the other hand, polarimetric spectrometry focuses on the analysis and extraction of spectral information, using the spectral characteristics of polarized light to obtain information about the biochemical components and physical structure [87]of crops.
The technology of polarization spectroscopy has a lot of potential uses in field crop monitoring. It is expected that polarization spectroscopy technology will become more significant in agricultural production in the future due to its ongoing development and advancement, which will help to increase agricultural production efficiency and guarantee food security.
3. Application in Crop Health and Disease Detection
3.1. Chlorophyll Content Monitoring
Changes in chlorophyll, which is essential to plant photosynthesis, can reveal information about the health of crops. For accurate nitrogen fertilizer management, a crop's photosynthetic capacity and nutritional status must be evaluated, and this requires an accurate estimate of leaf chlorophyll content (LCC) [88]. Polarized light spectroscopy technology provides information about the surface and internal structure of leaves, particularly the optical properties related to chlorophyll content. Related research is shown in the Table 2. Apple, ginkgo, and pothos leaves were used by Meng Xia et al. [54] for their studies. The multi-angle polarization spectra of the leaves were measured using an ASD FieldSpec Pro FR spectrometer, which has a wavelength range of 400–1800 nm. The multi-angle spectral polarization was then computed using the Stokes vector method. The leaves' chlorophyll content was then reversed using the PROSPECT model. Compared to conventional spectroscopy, polarized light spectroscopy provides a number of benefits for investigations of chlorophyll in aquatic bodies. To develop a model for the inversion of chlorophyll content, Zhu Jin et al. [89] studied the polarization and reflectance spectra in a complex Chaohu Lake water body as well as a single-leaf green algae water body. They examined the correlation between the polarization spectra and the concentration of chlorophyll by measuring them at various angles (e.g., 0o, 60o, and 120o). In order to accurately reflect the concentration of chlorophyll and counteract the influence of other optically active compounds, the study discovered that polarization spectra outperform reflectance spectra. Pang Huifang et al. [90]separated the fluorescence signal from the total scattering spectrum to further determine chlorophyll concentration. They used polarization discrimination technology to analyze the effects of inorganic particles (IOP) and chlorophyll on fluorescence extraction at different concentrations. The findings demonstrated that the fluorescence peak for algae water with varying IOP concentrations declines with increasing concentration. Using remote sensing to further detect the concentration of chlorophyll in coastal waters, this work shows that polarization techniques can also be applied to complicated waters. Yao Ce et al. [91] proposed a new spectral index by combining photometric measurements (bidirectional reflectance factor BRF) with polarization measurements (linear polarization degree inverse 1/DOLP). This index successfully explained over 90% of the changes in leaf chlorophyll content (LCC), significantly improving estimation accuracy. Huang et al. [92]employed multi-angle polarized remote sensing technology to collect canopy reflectance and polarized spectral data at various observation angles, while simultaneously measuring leaf chlorophyll content. By constructing polarization reflectance models (such as the NB and M models) to simulate polarization characteristics, they separated the specular reflection component and applied various vegetation indices for chlorophyll content inversion analysis. Xu Jiayi et al. [93] investigated the application of polarization spectroscopy in non-destructive detection of chlorophyll in jujube leaves. They used near-infrared polarization spectroscopy to quantitatively analyze chlorophyll content and established a predictive model. Under 0° polarization conditions, the prediction effect of chlorophyll was optimal, with a correlation coefficient (Rc) of 0.53646, indicating a low prediction error.
3.2. Leaf Moisture Detection
Water deficiency in crops can lead to the closure of leaf stomata and a decrease in photosynthetic rate, ultimately affecting growth [94]. In 2017, Li Xiaolu et al. [95]used laser polarization imaging technology to measure leaf water content and developed a mapping model between water content and polarization degree, aiming to enhance the stability and accuracy of leaf water content measurements. The study found that within the 15% to 75% water content range, polarization degree increases with increasing water content. At high water content levels, the trend in polarization degree is more pronounced; at low water content levels, the relationship between polarization degree and water content is less significant (Figure 8).
Xie Xin Hao et al .[96]explored the use of polarized active imaging LiDAR technology to measure the water content in wintergreen leaves. They used polarization as a variable to create a mapping model for water content. The polarized pictures were matched using the SURF technique and affine transformation, and the images were denoised using several iterative median filters and Lee filters. The drying process was used to determine the real water content, and the best measurement model was established by building a statistical fitting model. The results of the studies demonstrated a considerable positive correlation between the water content (45% - 75%) and the polarization of wintergreen leaves, which may be represented by an exponential model.
In 2024, Xu Xiang et al. [97] obtained leaf samples with different moisture contents through gradient drying, captured their polarization images, and extracted the degree of linear polarization. The study analyzed the relationship between leaf moisture content and linear polarization under different growth months, leaf parts, and weather conditions. The results showed that the degree of linear polarization increased as the moisture content decreased, exhibiting a significant negative correlation (R = 0.85, MSE = 0.45%). The prediction model achieved an average relative error of 9.50% and an RMSE of 4.53%, verifying the accuracy and application potential of the detection system.
3.3. Nitrogen, Phosphorus and Potassium Content Detection
Plants exhibit subtle changes in their optical properties under conditions such as nitrogen deficiency, nutrient imbalance, and temperature stress. Accurate and timely monitoring of leaf nitrogen content is crucial for assessing the nutritional status of crops [13]. In 2020, Liu Siyuan et al. [98] improved the accuracy of canopy nitrogen content (CNC) estimation by correcting specular reflection interference on leaf surfaces using polarized reflectance (Rp) to refine the scattering coefficient (Wλ). They compared six BPDF models to develop Rp simulation methods suitable for different forest types and employed the iPLSR model to analyze the impact of polarization on Wλ and CNC estimation across the 400–2500 nm spectral range. The results showed that polarization correction significantly enhanced Wλ estimation accuracy in the visible and shortwave infrared regions, with the CNC estimation accuracy improving by an average of 1.19% in RMSECV.In 2021, Liu Ming et al. [99] proposed using non polarized reflectance factor (NpRF) to estimate leaf nitrogen concentration (LNC) based on multi angle, polarization, and hyperspectral measurements of 262 leaves from six plant species. The results showed that NpRF achieved an R ² of 0.82 in the red edge band, which was better than the traditional method (R ² of 0.65). The validation set RMSE was reduced to 0.17 N%, significantly improving the estimation accuracy (Figure 9).
Zhang, ZH et al. [100] used the HySpex hyperspectral sensor to obtain ground data, using root mean square error (RMSE) and coefficient of determination (RSQ) as evaluation indicators. After eliminating polarization reflection and optimizing the algorithm, the average inversion accuracy increased by 244%. Specifically, the accuracy of random forest regression improved by 103% (RSQ=0.803, RMSE=0.252), with a 32% improvement over PLSR and an overall accuracy increase of 440%. In 2023, Xu Tongyu et al. [101]used drones equipped with a polarization spectral imaging system to collect multi-angle polarization spectral data of rice canopies at various angles (-60°, -45°, -30°, -15°, 0°, 15°, 30°, 45°, 60°). By analyzing the nitrogen content data, they found that the correlation between polarization spectral data and nitrogen content was highest at a 15°zenith angle. A linear regression method was used to establish a nitrogen content inversion model, with a coefficient of determination (R²) of 0.7838 and a root mean square error (RMSE) of 0.428mg/g for the training set, and a RMSE of 0.662mg/g for the validation set. Polarization spectral technology significantly enhances the accuracy of nitrogen content detection in rice canopies, providing more reliable data support for nitrogen fertilizer management in precision agriculture (Figure 10).
In 2014, Zhu Wenjing et al. [102] used polarization reflectance spectroscopy to investigate the effects of different growing seasons and nutrient deficiencies on the polarization reflectance characteristics of greenhouse tomato leaves, and analyzed the key parameters affecting polarization reflectance. The study demonstrated the feasibility of using polarization reflectance spectroscopy for rapid nutrient detection at the leaf scale, providing theoretical and practical support for plant nutrition diagnosis. Tomato cultivation is widespread in China's facility horticulture, but nitrogen, phosphorus, and potassium nutrient imbalances are common, and traditional detection methods have many drawbacks. Mao Hanping et al. [103] used a novel polarization reflectance spectroscopy-light distribution angle measurement system combined with appropriate multivariate calibration methods to evaluate the feasibility of measuring nitrogen (N) and potassium (K) content in fresh greenhouse-grown tomato leaves. This method allows for in-depth research and rapid detection of plant nutrient status at the leaf scale.
3.4. Identification and Monitoring of Pests and Diseases
Timely and accurate detection of vegetable diseases is crucial for implementing effective management and mitigation strategies before they cause harm [104]. Many insects are sensitive to specific wavelengths and polarization characteristics of light, allowing the use of polarized light spectra to distinguish between healthy plants and those affected by pests or diseases. The spectral characteristics of diseased leaves change, and polarized light spectroscopy can detect these subtle differences early on. Alireza Pourreza et al. [105] conducted weekly polarized image acquisition of citrus leaves after grafting with infected tissues, and combined it with an image analysis algorithm to detect local variations in gray values. This approach successfully identified pre-symptomatic regions associated with CLas infection, demonstrating the effectiveness and potential of polarized imaging for early non-destructive detection of HLB. Zhu, Shiming et al. [106] reported using a continuous-wave LiDAR system with the Scheimpflug device to monitor flying agricultural pests in South China rice fields. This system achieved distance resolution over several 100m observation paths, and their polarized sensitivity system was used to monitor the diurnal activities of flying insects and the effects of weather conditions. Carla et al. [55]focused on alfalfa and olive tree leaves, which were infected with alfalfa mosaic virus and olive leaf spot fungus, respectively. Using an imaging Mueller matrix polarimeter, polarized images were captured under different wavelengths and configurations. Depolarization parameters such as the indices of polarization purity (IPPs) and purity components (CPs) were calculated. These polarization parameters significantly enhanced the image contrast between healthy and diseased tissues, revealing leaf vein structures and lesion areas that conventional imaging could not detect. Through false-color processing, the visualization of diseased tissues was further improved, showing promise for early and accurate detection of plant diseases. Xu Qian et al. [107] combined 660 nm reflectance imaging and 590 nm polarized transmission imaging to capture the symptoms of mottled flower spots and abnormal starch accumulation in leaves, respectively. Using Stokes vector to calculate the angle of linear polarization (AoLP) and reveal the changes in starch content inside the leaves. Integrating random forest and logistic regression models to achieve high-precision classification (96.67% and 88.33%).
In 2024, Wang Yafei et al. [38]addressed the challenge of identifying airborne spores in greenhouses by proposing a classification method that leverages polarization image features and back propagation neural networks (BPNN). They constructed a polarization imaging system to collect and analyze the polarization degree and angle of spores. After optimizing the image features with Gabor filtering, they used BPNN to establish a classification model. The results showed that the recognition accuracy for cucumber downy mildew, tomato gray mold, and cucumber powdery mildew spores was 75.00%,83.33%, and 96.67%, respectively, with an average recognition rate of 86.67%. This method provides a new approach for monitoring greenhouse diseases (Figure 11).
4. Non-Destructive Testing of Quality of Agricultural Products and Seeds
4.1. Quality Testing of Agricultural Products
Polarimetric spectroscopy mainly uses the polarization properties of light interacting with materials in the examination of agricultural products (Table 3). To determine the freshness and crispness of agricultural products, polarized light can pass through the skin of fruits and vegetables and provide details like the density of the flesh and cell arrangement. In 2014, Huazhong Agricultural University [108]developed a non-destructive testing method based on high-incident-angle polarization imaging. By constructing a polarization imaging system and collecting images of 200 eggs, they extracted image feature parameters and established a model with storage time, achieving a correlation coefficient of 0.995 and an accuracy rate of 92%. In 2016, Lin Fenfang et al. [109] used a field imaging spectrometer equipped with a polarizer (FISS-P) to collect spectral images of corn and five weeds (split-leaf morning glory, reverse-branch amaranth, purslane, goosefoot, and round-leaf morning glory) under laboratory conditions. They set four polarization angles (0°, 60°, 120°, and no polarization) for data collection and performed radiation normalization through whiteboard correction. The recognition models under the four polarization modes all achieved overall accuracy and Kappa coefficients exceeding 90%, with the 0°polarization angle model showing the highest accuracy (overall accuracy 98.2%, Kappa coefficient 0.98). This indicates that polarimetric spectroscopy technology compensates for the limitations of traditional spectroscopy in distinguishing crops from weeds by capturing differences in leaf surface roughness and waxy layers. Yu Yang et al. [62] effectively suppressed glare interference and enhanced feature extraction of damaged areas through multi angle polarization image fusion. The constructed network structure incorporates Ghost module, which has the advantages of efficient recognition and low computational complexity.
In 2020, Huang Shizhao et al. [87] studied red beans and collected polarization images under different polarization directions. They calculated the Stokes vectors (S0, S1, S2) to characterize the polarization characteristics of the target. Normal bean surfaces are smooth, with consistent polarization reflection light direction, resulting in lower brightness in certain polarization directions. Beans with shriveled, wrinkled, or surface defects exhibit less variation in brightness across different polarization directions due to varying surface roughness. Compared to traditional color sorting methods, this method can more effectively identify shape defects, surface wrinkles, and shriveled issues in bean crops. In 2025, Di et al. [110] proposed a spectral inversion correction method based on the BPDF model. They collected spectral data at multiple polarization angles within the 900–1750 nm range and applied corrections using four semi-empirical BPDF models, followed by CARS-PLS modeling. This approach significantly improved the prediction accuracy of water content and soluble solid content (SSC). The Litvinov and Xie–Cheng models performed exceptionally well at specific polarization angles, with the model RPIQ reaching up to 2.64, demonstrating the effectiveness of multi-polarization fusion and BPDF-based correction.
Table 3.
Application of polarization spectrum analysis technology in quality detection of agricultural products.
Table 3.
Application of polarization spectrum analysis technology in quality detection of agricultural products.
| Sample | Research contents | Research technique | Finding | Reference |
| Winter jujube in southern Xinjiang | Improve spectral inversion accuracy under complex outdoor conditions | Collected 900–1750 nm multi-polarization spectral data; corrected using four BPDF models; modeled with CARS-PLS | Rp improved by 10–30%; proportion of models with RPIQ > 2 increased from 40% to 60%; Litvinov and Xie–Cheng models performed best | [110] |
| Corn and five weeds | To explore the feasibility of using polarization spectroscopy to identify crops and weeds | The imaging spectrometer FISS-P with a polarization filter was used to collect images, analyze the spectral response and identify the model accuracy | The overall accuracy and Kappa coefficient of the recognition model are over 90%, and the highest accuracy is achieved when 0° polarization is applied | [109] |
| pulse crops | The design of a polarization detection system based on aperture imaging is designed to extract characteristics of beans | A polarization imaging detection system was built to carry out imaging experiments on red beans | The system based on simultaneous polarization imaging can highlight the detailed features of the target, show the surface defects of beans and other characteristics, and improve the accuracy of target sorting | [87] |
| nectarine | Non-destructive bruise detection of nectarines using polarization imaging | Collected 4-angle polarization images; built ResNet-G18 (ResNet-18 + Ghost) | Accuracy: 96.21%, TPR: 97.69%, Detection time: 17.32 ms | [62] |
Investigating the authenticity and classification of edible oils is crucial. Geng Dechun et al. from Jiangsu University [111]used six types of edible oils—rapeseed oil, soybean oil, peanut oil, sunflower seed oil, camellia oil, and sesame oil—to explore the application of polarization-induced two-dimensional correlation fluorescence spectroscopy in the rapid classification of edible oils. By altering the polarization angle to obtain fluorescence spectra, they used Matlab for two-dimensional correlation analysis to generate synchronous and asynchronous spectra. The results showed that this method significantly enhances spectral resolution, accurately distinguishes different oils, and has high practical value.
4.2. Seed Nondestructive Testing
Seed vitality is a crucial aspect of agricultural research [112]. Seed quality is essential for optimizing crop planting costs. Therefore, it is necessary to develop rapid and non-destructive methods for seed quality testing in the agricultural and seed production sectors [113]. Polarized light detection is a non-contact method that does not cause any physical damage to seeds. Research as shown in the Table 4. In 2016, Cheng Yuqiong et al. [56] proposed using continuous polarized light spectroscopy to achieve rapid and non-destructive detection of rice seed germination rates. They selected three polarization angles (0°,5°,25°) as characteristic polarization angles and extracted the characteristic wavelengths of 576 nm, 620 nm, and 788 nm. A three-dimensional spectral model (polarization angle—wavelength—transmittance) was constructed to reveal the optical response differences of aged rice seeds. By comparing three models—partial least squares regression, BP neural network, and radial basis function neural network—the radial basis function neural network showed the best performance, demonstrating that polarized light spectra have good data sensitivity and modeling capabilities when used to model rice seed germination rates. In 2019, Wang Xinyu et al. [114] developed a portable rice seed rapid germination rate detector based on STM32 microcontroller and polarized light spectra. The detector established a model for rice seed germination rates based on the intensity of polarized light. Experiments showed that the instrument can predict the germination rates of various rice seeds with an accuracy of over 90%. In 2023, Wang et al. [37] developed a detection system based on line laser polarization imaging, combined with an improved YOLOv5 algorithm for real-time identification and classification of foreign fibers. During the experiment, images of 20 common types of foreign fiber samples were collected. The improved network integrated ShuffleNetv2, a modified PANet structure, and a Coordinate Attention (CA) module to enhance detection accuracy and speed for small targets. Results showed that the improved model, YOLOv5-CFD, achieved high recognition accuracy, fast speed, and strong robustness on the test set, making it suitable for practical online detection of foreign fibers in cotton. Q Hu et al. [115] introduced polarization hyperspectral imaging (PHI) technology, collecting spectra from 396.1 to 1044.1 nm and preprocessing the data to build various machine learning models for assessing seed vitality. The results showed that after optimizing the polarization components (I, Q, U), the prediction accuracies increased to 97.17%,98.25%, and 97.55%, respectively. This method enables rapid and non-destructive seed vitality assessment, providing technical support for efficient agricultural management.
5. Soil and Environmental Monitoring
5.1. Soil Moisture
Surface soil moisture is a crucial parameter in climate change research [116]. Remote sensing technology has rapidly advanced over the past 40 years, particularly with the application of different bands (such as visible light and near-infrared) and polarization techniques [117]. By utilizing these bands and polarization information, soil moisture can be effectively inferred and estimated, driving innovations in soil moisture monitoring methods and technologies (Table 5). Luo et al. [118] developed the Radar Vegetation Index (RVI) and incorporated it into the Water Cloud Model (WCM), effectively eliminating the influence of vegetation on backscattering and obtaining a more accurate soil backscattering coefficient, σ(0) (soil). Based on this, a semi-empirical soil moisture (SM) estimation model was established using the Chen model. This method performed well in cloud-covered areas, with a root mean square error (RMSE) of 0.05 and a correlation coefficient (r) of 0.69.H. McNairn et al. [58]used Compact Polarimetry (CP) radar data to estimate soil dielectric constants and retrieve soil moisture by simulating RCM RH and RV polarizations and applying the Integral Equation Model (IEM). Validation at Canadian soil monitoring stations showed that the Hybrid method achieved correlation coefficients of 0.76 and 0.82 for the 0–5 cm and 5 cm soil layers, respectively. Wang Xinqiang et al. [119] collected red soil samples from Guilin and used Stokes parameters and Mueller matrix theory to extract target polarization information. The polarization degree (PPP) was identified as the primary parameter for characterizing soil reflectivity. They found that within the 600-800 nm wavelength range, soil moisture significantly affects the polarization degree of reflected light. When the soil moisture is between 14% and 30%, the polarization degree changes strongly, making it suitable for humidity inversion based on polarization characteristics (Figure 12).
In 2016, Ye Song et al. [120] developed a soil moisture remote sensing method using polarized light spectra, analyzing the correlation between soil moisture and polarized spectra, as well as the impact of observation angles on polarization characteristics. The team used a bromine tungsten lamp as the light source, set the incident angle to 50°, and the reflection angle to 20°-60°, measuring spectral data at three polarization angles (0°,60°,120°) and calculating the polarization degree using Stokes parameters. The study found that when the soil moisture is high, both the polarization degree and reflectance increase with increasing soil moisture; when the soil moisture is low, the reflectance first decreases and then increases with increasing soil moisture. In 2018, Zhang Ying et al. [121] established a semi-empirical polarization reflectance model that accurately describes the reflectivity characteristics of soil surfaces, demonstrating that the method of using polarization information to invert soil moisture is feasible and has high accuracy, providing important references for quantitative polarization remote sensing detection of soil moisture.
Table 5.
Application of polarization spectrum analysis technology in soil moisture monitoring.
| Soil type | Theoretical principle | Research objectives | Measure the band | Humidity range | Application condition | Key findings | Reference |
| Red soil (Guilin, Guangxi) | Stokes vector method was used to analyze the variation of polarization degree with humidity directly | The relationship between polarization spectrum and soil moisture was explored to assist traditional hyperspectral remote sensing | Mainly in 500-700nm | 0%–26% | Medium and high humidity (> 15%) is more suitable | When the humidity is high, the polarization degree is positively correlated with the humidity, which can reach 0.98 | [120] |
| yellow brown earth | Geometrical optics, establish the relationship between refractive index and humidity | The semi-empirical model of soil polarization reflection was established to quantitatively invert soil moisture | Visible spectrum | 0%–33.4% | Medium to high humidity | The inverse humidity error is 4.88%, and the minimum model error can be 1.16% | [121] |
| Red soil (Guangxi) | Stokes vector and Mueller matrix theory are used to analyze the polarization degree variation in different bands | The feasibility of measuring soil moisture by polarization characteristics in visible/near infrared bands was verified | Visible to near-infrared bands (600-800 nm) | 0%–35% | The effect is best in the humidity range of 14%-30%, and the effect is poor in low humidity or saturated humidity | The polarization is linearly related to the humidity within the range of 14%-30%, and the standard deviation is less than 3% | [119] |
5.2. Farmland Pollution Detection
Due to human activities or natural influences, heavy metal pollution in farmland soil has become a critical issue [122]. Pollutants containing heavy metals can change the polarization characteristics of soil as well as its optical qualities. Heavy metal contamination in soil can be detected and an initial pollution level can be determined using polarized light technology. In 2018, Yu Yang et al. [123] used soil heavy metal laser-induced breakdown spectroscopy (LIBS) to examine the polarization properties of characteristic spectral lines and the continuous background radiation for four elements: Fe, Pb, Ca, and Mg. They discovered that the continuous background radiation had a higher degree of polarization than the distinctive spectral lines. Fe, Pb, Ca, and Mg had polarization degrees of 0.27, 0.17, 0.25, and 0.23, respectively, whereas the background radiation had polarization degrees of 0.70, 0.64, 0.69, and 0.67. This indicates that polarized LIBS technology can significantly enhance the detection of heavy metal elements in soil, reduce background interference, and improve the quality of spectral signals (Figure 13).
In 2019, Cheng Dewei [124]investigated the detection technology of soil heavy metals using polarization-resolved laser-induced breakdown spectroscopy (PRLIBS). The experiment utilized a nanosecond pulsed laser and an optical fiber spectrometer to conduct PRLIBS experiments on aluminum alloy samples and soil samples. By adjusting parameters such as energy density, detection angle, wavelength, detection angle, and delay time, the study explored how these parameters affect SBR and polarization degree. Oil-contaminated soil poses a significant challenge, and traditional monitoring methods are inefficient, while remote sensing offers clear advantages.
In response to soil salinization, in 2022,Gu et al. [125] took saline-alkaline soil as the research object and collected multi-angle polarized reflectance (Rp) spectral data in a laboratory environment. They employed semi-empirical BPDF models, including the Nadal–Bréon, Litvinov, and Xie–Cheng models, as well as machine learning methods such as support vector regression (SVR), random forest (RF), and deep neural networks (DNN) for simulation and prediction. By comparing the results with measured values and evaluating the prediction performance using RMSE, R², and correlation coefficient, the study found that BPDF models based on machine learning generally outperformed semi-empirical models, with prediction accuracy improved by 3.06% at 670 nm and 19.75% at 865 nm. These results demonstrate the potential of deep learning in predicting Rp on saline-alkaline soil surfaces.
5.3. Underwater Research
In the agricultural sector, underwater environments include paddy fields, rice paddies, and other water bodies where plants such as rice and lotus grow, along with potential pests, diseases, and weeds [126]. In complex optical conditions, the quality of underwater images significantly deteriorates, with color and brightness features often severely attenuated, making it challenging to improve image quality. Polarimetric imaging not only greatly enhances the remote sensing capabilities of water [127]but also effectively suppresses underwater scattering [128]. In 2015, Guan, JG, et al. [129] proposed a new method based on the difference in polarization angles between background scattered light and target light, combined with the Malus law, to establish a physical model for polarimetric differential imaging. The study found that when the vibration direction of the background scattered light forms a 45-degree angle with the two orthogonal polarization directions of the polarization analyzer, effective suppression of background scattered light can be achieved. By introducing the Stokes vector to describe the polarization state of light, the authors innovatively proposed a computational polarization differential imaging system, replacing the traditional mechanical rotation method. This significantly improved imaging speed and reduced the blurring caused by underwater scattering effects, while also increasing the underwater detection range. Qian et al. [130] integrated a physical degradation model, polarization recovery, and spectral fusion techniques to optimize image reconstruction based on spectral selectivity, thereby achieving simultaneous enhancement of image clarity and color information. This method outperforms traditional approaches in terms of subjective visual quality and multiple image evaluation metrics. It effectively improves the visibility and contrast of objects composed of different materials and at varying imaging distances, making it suitable for image enhancement applications in complex underwater agricultural environments. In 2021, Wang Xiaobin et al. [80] conducted on-site investigations using a self-developed shipborne polarized marine LiDAR, complemented by video surveillance for validation. The study analyzed the optical characteristics and distribution of jellyfish through backscattering rate and signal contrast analysis. The results showed that jellyfish exhibit different backscattering rate distributions in various waters, clustering within the same water body, and following a Gaussian vertical distribution pattern, thus validating the method's feasibility and efficiency in jellyfish monitoring.
In 2022, Pan et al. [131] conducted bottom-up imaging experiments using the Underwater Polarization Imaging System (UPIS), which was integrated with an attitude sensor and equipped with a SALSA polarization camera. Imaging performance under different polarization parameters was evaluated using metrics such as entropy, clarity, and contrast. The results showed that among all parameters, the angle of polarization exhibited the best target detection capability, which may be attributed to the differences in diffuse reflectance of the target surface to the linearly polarized components of the Stokes vector. Gui, Xinyuan et al. [132] captured clear water images and underwater polarization images at different turbidity levels, creating multiple turbidity underwater polarization datasets. They proposed a sliding window superposition method with different steps for various conditions. This method, combining deep learning and polarization imaging technology, can restore underwater images in multi-turbidity environments, overcoming the poor restoration effects of ordinary underwater images. Regarding the impact of underwater bubbles on imaging, Song Qiang et al. [133] analyzed the changes in intensity and polarization information of underwater targets under different bubble thickness conditions. They proposed an image fusion method that extracts polarization features and retains visual information to mitigate the effects of bubbles on underwater target imaging. The experimental results showed that the fused images outperformed the original images in both visual quality and target recognition, demonstrating that using a polarization image fusion method can effectively reduce the impact of bubbles on underwater target imaging and significantly enhance the clarity of the targets.
In aquaculture, traditional methods for identifying fish feeding behaviors in outdoor ponds are not robust enough to meet the precise feeding requirements. Liu Shijing et al. [39] used a polarimetric camera to capture images of grass carp feeding. By obtaining images at different polarization angles (0°,45°,90°,135°) and combining these with image brightness and saturation metrics, they selected the image with the least reflection interference as the analysis sample. This method effectively reduced the impact of outdoor natural light on image quality, improved image clarity and feature extraction accuracy, and provided a reliable data foundation for subsequent optical flow feature analysis and feeding behavior classification.
6. The Combination of Polarized Spectroscopy with Other Technologies
6.1. Polarization and Hyperspectral Combination
High-spectral polarization is a novel technology that combines high-spectral and polarization imaging, making it a research hotspot in multiple scientific fields [134,135]. By simultaneously acquiring spectral information and polarization characteristics of target materials or scenes, this technology provides a more comprehensive and in-depth description of their properties [136]. Polarized spectra can reflect changes in the microscopic structure of leaf surfaces, while high-spectral data offer rich spectral information. The combination of these two technologies enhances the accuracy of nutrient content estimation and improves the ability to detect plant stress conditions (Table 6). In 2014, Zhu Wenjing et al. [137] used the integration of polarized reflectance spectroscopy and high-spectral imaging to extract polarized spectral characteristics and high-spectral texture features from greenhouse tomato leaves under different nitrogen (N), phosphorus (P), and potassium (K) nutrient stress levels. They constructed a quantitative diagnostic model for nutrient levels using support vector regression (SVR). In 2016, Pan Qian et al. [138] evaluated the soil in Northeast China's farmland area using a comprehensive soil fertility index (IFI) model. They found that higher soil fertility resulted in lower polarization reflectance, indicating that polarization information effectively reflects soil nutrient status. They then used a BRDF testing platform combined with an ASD hyperspectral instrument to conduct high-precision multi-angle polarization measurements, analyzing the changes in reflectance and polarization curves under different conditions, providing theoretical support for quantitative remote sensing.
In 2018, Wang Lingzhi et al. [139] explored the advantages of polarization spectroscopy and hyperspectral techniques in soil nutrient detection and analyzed how polarization measurements at different angles affect soil reflection characteristics. Through experiments, they extracted key spectral features and polarization parameters and used machine learning methods to build a soil fertility prediction model. The results showed that the integration of polarization spectroscopy and hyperspectral data could significantly improve the accuracy of soil nutrient content predictions. In 2019,Yang Wei et al. [140] used five types of dry plants (small-leafed thorn, alkali wormwood, sheep grass, tiger tail grass, and reed) and three types of bare soil (black soil, alkali soil, and sandy soil) as research subjects. They collected multi-angle polarization hyperspectral data in the 350-2500 nm range. They proposed a method that combines spectral histogram (Spectral-HOG) and spectral total reflectance (Spectral-E), using hierarchical clustering analysis to accurately identify all eight research subjects. The results showed that this method significantly improved the remote sensing recognition accuracy of dry plants and bare soil. In 2020, Zhu Wenjing et al. [141] from Jiangsu University used polarization hyperspectral data fusion technology to estimate the soluble sugar (SS), total nitrogen (N), and their ratio (SS/N) in greenhouse tomato leaves. They collected fresh tomato leaves at five different growth stages and under five different nitrogen treatments for spectral collection and SS and N determination. The results showed that the SS/N model performed better than the N and SS models, and the support vector machine (SVM) models with N and SS/N had better predictive capabilities than models based on a single type of feature. This study demonstrated that the polarization hyperspectral multi-dimensional information detection method can effectively assess the nutrient stress conditions of tomatoes. Hao Tianyi et al. [142] focused on spider plants, pothos, and golden-edged tiger lily as research subjects. They used a large indoor multi-angle fluorescence observation platform equipped with a polarizing lens and the AvaSpec-ULS2048 spectrometer in a dark room to collect fluorescence spectra under various observation conditions, including different zenith angles, relative azimuth angles, bands, and polarization conditions. The spectra were measured five times and smoothed. The fluorescence polarization was calculated using Stokes parameters. Luo Hua et al. [143] explored methods to enhance the accuracy of remote sensing of jujube canopy using multi-angle polarization hyperspectral imaging technology. By extracting multidimensional features such as angle, polarization, and spectrum, they combined NDVI, DOLP, and other parameters to generate polarization images, which helped characterize the spatial distribution of jujube quality and moisture. They also developed a polarization hyperspectral quantitative remote sensing model, providing technical support for the development of digital intelligent agriculture. Faqeerzada, Mohammad Akbar et al. [144] conducted a study in which polarizing filters were installed in front of both the camera lens and the light sources to effectively eliminate specular highlights and artifacts, achieving uniform illumination. By combining polarized hyperspectral images with a partial least squares regression (PLSR) model, they achieved a determination coefficient of 0.89 for predicting moisture content. Based on selected wavelengths, moisture distribution visualization was also realized. The study demonstrated the potential of the polarized HSI system for rapid and non-destructive moisture detection in agricultural products.
Table 6.
Combination of polarization and hyperspectral.
| Sample | Purpose of research | Key technology/parameter | Experimental equipment and methods | Main data processing | Main conclusion | Reference |
| Farmland soil in northeast China | Relationship between polarization reflection and soil fertility | Polarized reflectance ratio, azimuth, zenith Angle, multi-angle polarization spectrum measurement | Field sampling + laboratory multi-angle polarization hyperspectral measurement | Polarization reflection ratio calculation and correlation analysis between polarization parameters and fertility index | Polarized reflectance ratio is negatively correlated with fertility | [138] |
| Smooth leaves (mulberry, camellia, photinia) | Relationship between polarization characteristics and chlorophyll content | DOP (polarization degree), Rmax, Rmin, polarization reflectivity | Multi-angle platform + polarizer + ASD spectrometer + SPAD chlorophyll measurement | The relationship between DOP and chlorophyll was modeled and analyzed, and the nonlinear fitting and accuracy were evaluated | The correlation between DOP and chlorophyll was the highest | [139] |
| Dry plants and bare soil (8 species) | Distinguish between dry plants with similar spectra and bare soil | Spectral-HOG, Spectral-E and hierarchical clustering | NENULGS platform, ASD FS3 hyperspectral instrument, polarizing mirror | EMD denoising, feature extraction and cluster analysis | The combined features can distinguish all 8 categories of targets | [140] |
| Spider plant, pothos, tiger lily | The variation law of chlorophyll fluorescence and polarization was analyzed | LIF excitation, F685/F740 ratio and polarization modeling | Multi-angle fluorescence platform, AvaSpec spectrometer, laser | Regression analysis, polar coordinate drawing, correlation modeling | Fluorescence and polarization are significantly affected by Angle, and the modeling effect is good | [142] |
6.2. Polarization and Multispectral Combination
By integrating polarization technology with multispectral remote sensing, the complementary strengths of both have greatly enriched the content of remote sensing data. Hao Jinglei et al. [145] used a three-dimensional reconstruction method based on multi-band polarization to integrate spectral and polarization information, achieving a complete three-dimensional reconstruction of the surface of highly reflective, texture-free targets. This technique aids in obtaining high-precision information about crop surface structures. In 2022, Li Siyuan et al. [146] collected multi-angle polarization images to construct a novel polarization-based vegetation index (NPVI) and compared it with traditional indices such as NDVI and PRI. The results showed that NPVI achieved a correlation coefficient of 0.91 with chlorophyll content, outperforming NDVI (0.65) and PRI (0.72). Additionally, NPVI significantly reduced the interference from specular reflection, with a coefficient of variation under mirror effects of only 5.62%, much lower than NDVI’s 32.18%. These findings demonstrate that NPVI offers greater stability and accuracy under varying illumination angles, making it suitable for precise vegetation health monitoring. (Figure 14).
Shanghai University [83]developed a Polarized Multispectral Low Light Imaging System (PMSIS), which combines fusion algorithms for nighttime vegetation health monitoring. By calculating the normalized vegetation index (NDVI), linear polarization degree (DoLP), and polarization angle (AOP), they created a new nighttime plant condition detection index (NPSDI). The NPSDI shows significant correlations with NDVI, SPAD, and nitrogen content, with R² values of 0.968,0.882, and 0.916, respectively, effectively distinguishing different health conditions of vegetation. This method significantly enhances the richness of nighttime vegetation information, providing a new tool for remote sensing monitoring, particularly for assessing the health status of crops and vegetation (Figure 15).
6.3. Polarization and Fluorescence Combination
Polarization and fluorescence combination is an integrated optical detection technology that combines the characteristics of polarized light and fluorescence emission, which has significant applications in agricultural monitoring. Mukhametova, LI et al. [147] developed a rapid and sensitive fluorescence polarization immunological assay (FPIA) for 2,4-D, a commonly used herbicide in agriculture, for detecting residues in fruit juices and water. By synthesizing new tracers and combining them with monoclonal antibodies, the method exhibits high specificity. After optimizing the sample volume, the LODs for fruit juices and water are 8 and 0.4 ng/mL, respectively. The entire detection process takes only 20 minutes, with a recovery rate of 95% to 120%, making it suitable for rapid detection of 2,4-D in agricultural products. Zhou et al. [148] constructed a FPIA based on the IMI-EDF tracer, which shows a significant change in fluorescence polarization under antibody binding, with a detection limit of 1.7μg/L, suitable for rapid detection in the range of 1.7 to 16.3μg/L. In agricultural samples such as paddy water, corn, and cucumber, the added recovery rate is 82.4% to 118.5%, with a RSD of 7.0% to15.9%, demonstrating good sensitivity and accuracy. Lippolis, V et al. [149] studied a fluorescence polarization immunological assay for detecting ochratoxin A (OTA) in wheat, using a synthetic fluorescent tracer, with an IC₅₀ of 0.48 ng/mL, a detection limit of 0.8μg/kg, strong specificity, and a recovery rate of 87%. The method is fast (<20 minutes) and highly precise (RSD <6%), showing a high degree of consistency with HPLC results (r = 0.995), making it suitable for high-throughput agricultural screening of OTA in wheat. Zhang et al. [150] used a dual-wavelength high-throughput fluorescence polarization immunoassay, employing different fluorescently labeled AFB (1) and ZAN, which bind to broad-spectrum antibodies. The detection limits in buffer solutions were 2.68μg/L and 4.08μg/L, respectively, and in cornmeal samples, they were 4.98μg/kg and 11.03μg/kg, with recovery rates ranging from 78.6% to 103.6%, and a coefficient of variation below 19.2%. The detection time was less than 30 minutes, and the results were consistent with HPLC-MS/MS, demonstrating the efficient application of agricultural fluorescence polarization technology. Li et al. [151]performed PCR amplification using fluorescently labeled primers, followed by the binding of single-strand binding protein (SSB) to free primers to restrict fluorophore rotation, thereby enhancing the fluorescence polarization (FP) signal. In the presence of chicken DNA, the primers form double-stranded amplicons, which prevent SSB binding and result in a decreased FP signal. This strategy combines the high specificity of PCR with the high sensitivity of polarization technology, enabling the detection of chicken adulteration as low as 0.035% (wt. %).
7. Other Applications in Agricultural Engineering
7.1. Pesticide Residue Detection
Although pesticides can increase agricultural productivity and harvests, excessive use of them can harm the environment, threaten food safety, and cause ecological harm [152]. These harmful residues can negatively impact consumer health and economic benefits [153]. As a significant chemical pollutant affecting the safety of agricultural products, the on-site efficient detection of pesticide residues has become a global research hotspot and trend [154]. Xin, Z et al. [155] used polarization spectroscopy detection technology, selecting 90 lettuce leaves from five different groups and a total of 450 lettuce samples to collect polarization spectrum information. IRIV, SPA, and CARS were used to determine the ideal wavelengths. A classification model was developed with the help of SVM, KNN, and BP neural networks. With a 100% calibration identification rate and a 97.78% prediction identification rate, the CARS-SVM model was the most effective classification model for the various kinds of pesticide residues found in lettuce leaves. This demonstrates the viability and efficacy of polarization spectroscopy detection technology in identifying various pesticide residues in lettuce leaves. In 2019, Wang Yulong et al. [156] developed a fluorescence polarization immunoassay (FPIA) method using nanoantibodies (Nbs) to detect 3-phenylbenzoic acid (3-PBA), a metabolite of pyrethroid pesticides, which is an important biomarker for assessing pesticide exposure. In practical applications, researchers conducted 3-PBA spiked experiments on urine samples from healthy volunteers, with concentrations of 100 and 400 ng/mL, achieving a recovery rate of 89% and a coefficient of variation of less than 6.7%. In addition, the results of urine samples from people exposed to pesticides were highly consistent with LC-MS, indicating that Nb-FPIA method was sensitive and stable, and suitable for rapid screening and biological monitoring of pesticide residues.
7.2. Application of Polarization Remote Sensing in Agriculture
With the continuous advancement of remote sensing technology, polarization remote sensing has emerged as a key focus in agricultural monitoring due to its unique advantages in detecting surface structure, material, and directional information. Hern á ndez et al. [157] used C-band Sentinel-1 SAR VV polarization data combined with NDVI to monitor the growth status of wheat under soil aluminum stress, and established a regression model between σ °VV and NDVI (R ²=0.70), providing a foundation for the expansion of polarization radar in crop stress monitoring in the future. Hasituya et al. [158]extracted the multipolarized backscattering intensity and polarization decomposition features from farmland areas, using them for classification with random forest (RF) and support vector machine (SVM). The results showed that the overall recognition accuracy was nearly 75%, with H/A/Alpha decomposition features (such as the Alpha angle and entropy) contributing the most to the identification of mulched farmland, outperforming the decomposition features used by Freeman, Krogager, and Yamaguchi (Figure 16).
Sid'ko, A F et al. [159] used a spectrophotometer equipped with a polarizing filter to conduct ground observations in the 400-820 nm wavelength range. By measuring R-max and R-min, they calculated the reflectance factor (Rq) and polarization degree (P), analyzing how these parameters change with wavelength. The experiment was conducted from June to July on a platform at an altitude of 10-18 m, with an observation angle less than 20° from the nadir. The results showed that there were significant differences in polarization response between the two crops in the visible and near-infrared regions, and the polarization degree in the red edge region provided strong recognition capabilities for crop characteristics. Zhang et al. [160] combined optical and SAR data to improve the classification accuracy of urban non-transparent water surfaces in three study areas—Guangzhou, Shenzhen, and Hong Kong—using an optimized random forest method. The results indicated that this method could effectively distinguish non-transparent water surfaces from mixed categories such as bare soil and water bodies, especially in low-resolution images. The research findings are of significant reference value for the identification of water bodies and soil farmland and the fusion of multi-source remote sensing. Theres Kuester et al. [161] used the HySimCaR system to simulate structural changes during different growth stages (such as tillering to heading) through 3D canopy modeling and Monte Carlo ray tracing (drat). The results showed that canopy structure significantly affects the reflectance of visible light, near-infrared, and short-wave infrared, and the crop row direction is clearly visible in the BRDF three-dimensional morphology. Iris Heine et al. [162] utilized TerraSAR-X dual-polarization (HH, VV) time series and polarization decomposition methods to classify and monitor phenological changes in the reed beds of natural lakes in northeastern Germany. They calculated various indicators, including the HH/VV intensity ratio, HH-VV intensity difference, polarization coherence, α scattering angle, entropy, and anisotropy, and validated their findings using a random forest classifier with high-resolution orthoimages. Sun Zhongqiu et al. [163] combined Fresnel reflection theory and polarization reflection models to systematically analyze the role of polarization information in vegetation remote sensing. The study found that polarization reflection can serve as a noise reduction technique, improving the accuracy of bidirectional reflectance models, while also reflecting vegetation structure characteristics, particularly canopy roughness. By separating the specular reflection component, the BRF model error was reduced from 30% to 20% (Figure 17).
Drones for remote sensing monitoring are characterized by low cost, convenience, speed, and accuracy [164], making them suitable for various agricultural scenarios with different planting structures and terrains. They can provide real-time, accurate remote sensing data to farmers, managers, and decision-makers in both emergency and non-emergency situations [165]. Equipped with polarization spectral sensors, drones (UAVs) can efficiently, widely, and non-contactly monitor agriculture and the environment. Joshua Larsen et al. [166]collected approximately 30,184 images using a UAV-based system across two growing seasons and multiple locations. They extracted the Degree of Linear Polarization (DOLP) features and compared them with RGB images and traditional nine-point visual scoring. The results showed that combining DOLP with RGB reduced the scoring error to 1.03, outperforming RGB alone (1.09) and DOLP alone (1.34). Dénes Száz et al. [167]conducted UAV-based polarization measurements at three study sites along the shores of Lake Balaton in Hungary. The study found that dark water patches formed by organic matter inflow exhibited high degrees of polarization (60%–80%), significantly differing from the bright lake water (<20%). However, from an aerial perspective, there was no significant difference in the angle of polarization between the dark and bright water areas. Hock Ng et al. [40] measured the intensity of light at four polarization angles (0°,45°,90°,135°) and used analytical or curve fitting methods to calculate the azimuth angle of the target. The experiment utilized a drone equipped with a polarization camera, achieving a ground resolution of 3.33 millimeters and successfully detecting a 3D-printed target with a line width of 0.5 millimeters, surpassing the system's resolution limit. This technology has potential for future applications in agricultural monitoring, offering new insights into high-resolution remote sensing. Larsen Joshua C et al. [168] conducted a field trial in North Carolina in 2021, using a drone-mounted polarization imaging system to evaluate the potential of polarization imaging for automatically identifying the timing of peanut leaf shedding, compared with manual scoring methods. The results showed that polarization imaging can provide a more automated and geometrically sensitive method for analyzing disease resistance in breeding.
7.3. Research on Dehazing Enhancement and Image Clarity
In underwater environments, the scattering and absorption of particles are key factors affecting the quality of underwater images, leading to issues such as decreased contrast and image blurriness [169]. In 2022, Ren, QM, et al. [170] introduced a deep learning-based active polarization dehazing imaging method for underwater applications. By integrating the powerful feature extraction capabilities of deep learning models with the advantages of polarization dehazing imaging technology, they developed a lightweight dehazing convolutional neural network (CNN). This network has four input channels, each corresponding to 0°,45°,90°linear polarization, and circular polarization images. Experimental results showed that compared to traditional dehazing methods, this approach can achieve higher-quality dehazing imaging in a shorter time, significantly enhancing the contrast and clarity of underwater images. To address the need for dehazing in foggy or rainy weather, Sun, CS, et al. [171] proposed a method that combines polarization and contrast enhancement in 2023. By identifying areas with high average intensity, low contrast, and high average polarization, they can locate target-free regions. As an alternative, this method shows excellent dehazing performance under different conditions by defining weight functions and evaluating whether the dehazed image can achieve high contrast and minimal information loss. Moreover, the theoretical and practical scope of intelligent underwater polarization dehazing imaging is expanded by optimizing the parameter estimation process of the underwater polarization dehazing imaging model using deep learning techniques, which improves the speed of dehazing imaging. Lastly, research was finished on target recognition and positioning technology based on the distribution of polarization features in turbid underwater environments.
Haze weather can blur images, decreasing the sharpness of visual sensors and making it harder for computers to effectively extract relevant information. In 2024, Liu, S et al. [172] introduced a new method that uses the polarization state and gradient of the sky to estimate atmospheric light. This method enhances the results of existing dehazing algorithms, allowing for the photography of farmland under haze conditions. Zhang, X et al. [173] developed a low-light enhancement module based on polarization to remove noise in polarized images and improve image brightness. They then designed a low-light polarization dehazing module that combines the polarization characteristics of scenes and objects to eliminate fog, thereby restoring the intensity and polarization information of the scene and enhancing image contrast. Experimental results showed better performance. Liang, J et al. [174]proposed a polarization dehazing method based on the analysis of polarization angle distribution. This method significantly improved the contrast and visibility of images in dense fog and severe sea fog by estimating atmospheric light intensity with high precision. In particular, visibility could be increased by at least 74% in dense fog scenarios. The method is both versatile and efficient, suitable for image enhancement tasks in various harsh fog conditions.
8. Development Trend
Through a comprehensive review of the application of polarization spectroscopy in agricultural material testing, it is evident that this technology has shown significant potential and value in modern agricultural testing. It provides robust technical support for quality control [175], monitoring and management of agricultural inputs [176], ensuring the safety of the agricultural production environment [177], and enhancing production efficiency. Additionally, it plays a crucial role in advancing the intelligence and precision of agriculture.
Although polarization spectroscopy analysis technology has shown great prospects in the field of agricultural engineering, it will be further developed in the following aspects:
The main goal is to deepen technological innovation and integration, which calls for interdisciplinary teams to work closely together to integrate cutting-edge technologies like artificial intelligence, spectrum detection, and image processing. Through multi-sensor data fusion, we may create detection systems that are more accurate and efficient while utilizing the complementing benefits of several non-destructive testing methods. Maximizing the polarization feature differences of the detecting object is the fundamental problem. We seek to modify and integrate multi-source information in space-time and remove duplicate information interference based on the best possible combination of information. This involves exploring the different spatiotemporal attributes of the integrated data, addressing the separation between qualitative spatiotemporal reasoning and quantitative spatiotemporal operations in traditional optical information analysis. The goal is to organically combine light information with multiple spatiotemporal attributes, simplify and reduce the effective feature space, and find the optimal integration method for polarization and hyperspectral information under optimized polarization detection angles. This will enable seamless integration of multi-source heterogeneous information at different levels, thereby enhancing detection and recognition capabilities.
Secondly, with the rise of deep learning, researchers quickly began to explore its application in various areas of image processing, including image fusion [178]. Deep learning fusion methods have, to some extent, addressed the limitations of traditional fusion techniques, demonstrating unique advantages and showing significant performance in both subjective evaluation and objective analysis. This has made it a primary research focus in polarization spectrum analysis technology [179]. Intelligent data fusion methods, which integrate advanced modeling strategies based on artificial intelligence with innovative algorithms, show great potential in overcoming existing bottlenecks and challenges. Despite the vast potential of this field, current comprehensive application cases remain scarce. There is an urgent need for collaboration between academia and industry to intensify research and development efforts, thereby promoting the thriving development of this field.
Finally, how to reduce expenses while encouraging broad usage. Large-scale production and technical innovation can be used to lower the cost of testing equipment, making it more affordable and more appropriate for a variety of farmers' and companies' demands. It is crucial to provide portable, adaptable devices that satisfy a range of testing needs. Fast evaluation of the safety and quality of agricultural supplies will be greatly aided by the development of affordable, portable, broadly applicable, low-sample preparation, high-sensitivity, and precise testing equipment. To encourage its wider adoption and application, it is necessary to actively create low-cost, multifunctional testing equipment based on data fusion technology, as the development of low-cost instruments is still limited.
This review examines the principles, advantages, and disadvantages of polarization spectroscopy analysis technology in recent years, with a focus on its advancements in agricultural material testing. Spectroscopic imaging technology, known for its non-destructive, efficient, and reliable results, has significantly advanced the field of non-destructive testing of agricultural materials [180]. When intensity information is lacking or not readily apparent, polarization detection uses its technical advantages to introduce polarization information, making it a potent tool for certain testing objects. The creation of multi-sensor data fusion techniques, which combine various data to achieve high-precision, multi-dimensional testing of agricultural commodities, is a result of the limitations of single technology. By lowering data uncertainty via chemometric techniques or clever algorithms, this improves perception and decision-making skills in intricate farming situations and increases system robustness. Despite the challenges of complex data processing, high computational resource requirements, sensor synchronization issues, and data inconsistency, achieving seamless integration of multi-source heterogeneous information across different levels remains a significant challenge. Therefore, future research should focus on enhancing the portability and commercialization of equipment, optimizing intelligent data processing algorithms, and exploring efficient and universal integrated testing devices and solutions to reduce costs and improve efficiency, thus fully meeting the diverse needs of agricultural material testing.
Acknowledgments
The research is financed by Key Laboratory of Modern Agricultural Equipment and Technology Project (MAET202322) and the National Natural Science Foundation of China (32071905).
References
- Kumari, R., Kalpana Suman, S. Karmakar, V. Mishra, Sameer Gunjan Lakra, Gunjan Kumar Saurav, and B. K. Mahto. "Regulation and Safety Measures for Nanotechnology-Based Agri-Products." Frontiers in Genome Editing 5 (2023).
- Lee, Jaenam, and Hyungjin Shin. "Agricultural Reservoir Operation Strategy Considering Climate and Policy Changes." Sustainability 14, no. 15 (2022): 9014.
- Chamara, Nipuna, Md Didarul Islam, Geng Frank Bai, Yeyin Shi, and Yufeng Ge. "Ag-Iot for Crop and Environment Monitoring: Past, Present, and Future." Agricultural systems 203 (2022): 103497.
- Xuan, Guantao, Chong Gao, and Yuanyuan Shao. "Spectral and Image Analysis of Hyperspectral Data for Internal and External Quality Assessment of Peach Fruit." Spectrochimica acta part A: molecular and biomolecular spectroscopy 272 (2022): 121016.
- Xu, Sai, Hanting Wang, Xin Liang, and Huazhong Lu. "Research Progress on Methods for Improving the Stability of Non-Destructive Testing of Agricultural Product Quality." Foods 13, no. 23 (2024): 3917.
- Sun, Zhaoxiang, Bin Li, Akun Yang, and Yande Liu. "Detection the Quality of Pumpkin Seeds Based on Terahertz Coupled with Convolutional Neural Network." Journal of Chemometrics 38, no. 7 (2024): e3547.
- WANG, Xuejiao, Yuan XUE, Quan ZHANG, Jiawen YUAN, Longhua LI, Chi WU, and Zhenjiang LIU. "Research Progress on the Application of Manganese-Based Nanoenzyme in the Detection of Organophosphorus Pesticide Residues." Chinese Journal of Pesticide Science 27, no. 2 (2025): 207–20.
- Wen, Jing, Guoqian Xu, Ang Zhang, Wen Ma, and Gang Jin. "Emerging Technologies for Rapid Non-Destructive Testing of Grape Quality: A Review." Journal of Food Composition & Analysis 133, no. 000 (2024): 13.
- Lacotte, Virginie, Sergio Peignier, Marc Raynal, Isabelle Demeaux, François Delmotte, and Pedro da Silva. "Spatial–Spectral Analysis of Hyperspectral Images Reveals Early Detection of Downy Mildew on Grapevine Leaves." International Journal of Molecular Sciences 23, no. 17 (2022): 10012.
- Kim, Jongyoon, Yu Kyeong Shin, Yunsu Nam, Jun Gu Lee, and Ji Hoon Lee. "Optical Monitoring of the Plant Growth Status Using Polarimetry." Scientific Reports.
- Khan, Zohaib, Hui Liu, Yue Shen, and Xiao Zeng. "Deep Learning Improved Yolov8 Algorithm: Real-Time Precise Instance Segmentation of Crown Region Orchard Canopies in Natural Environment." Computers and Electronics in Agriculture 224 (2024): 109168.
- Liu, Xiaoyang, Weikuan Jia, Chengzhi Ruan, Dean Zhao, Yuwan Gu, and Wei Chen. "The Recognition of Apple Fruits in Plastic Bags Based on Block Classification." Precision agriculture 19, no. 4 (2018): 735–49.
- Xu, Sizhe, Xingang Xu, Qingzhen Zhu, Yang Meng, Guijun Yang, Haikuan Feng, Min Yang, Qilei Zhu, Hanyu Xue, and Binbin Wang. "Monitoring Leaf Nitrogen Content in Rice Based on Information Fusion of Multi-Sensor Imagery from Uav." Precision agriculture 24, no. 6 (2023): 2327–49. [CrossRef]
- Ding, Weiping, Mohamed Abdel-Basset, Ibrahim Alrashdi, and Hossam Hawash. "Next Generation of Computer Vision for Plant Disease Monitoring in Precision Agriculture: A Contemporary Survey, Taxonomy, Experiments, and Future Direction." Information science 665, no. 000 (2024): 30.
- Rui, Yu-Kui, Shu-Zhen Xin, and Jun-Hui Li. "Application of Nirs to Detecting Total N of Cucumber Leaves Growing in Greenhouse." Spectroscopy and Spectral Analysis 31, no. 8 (2011): 2114–16.
- Tan, Baohua, Wenhao You, Chengxu Huang, Tengfei Xiao, Shihao Tian, Lina Luo, and Naixue Xiong. "An Intelligent near-Infrared Diffuse Reflectance Spectroscopy Scheme for the Non-Destructive Testing of the Sugar Content in Cherry Tomato Fruit." Electronics 11, no. 21 (2022): 3504.
- Lin, Fenfang, Sen Guo, Changwei Tan, Xingen Zhou, and Dongyan Zhang. "Identification of Rice Sheath Blight through Spectral Responses Using Hyperspectral Images." Sensors 20, no. 21 (2020): 6243.
- Oprisescu, Serban, Radu-Mihai Coliban, and Mihai Ivanovici. "Polarization-Based Optical Characterization for Color Texture Analysis and Segmentation." Pattern Recognition Letters 163 (2022): 74–81.
- Lin, Yi-Hsin, Hao-Hsin Huang, Yu-Jen Wang, Huai-An Hsieh, and Po-Lun Chen. "Image-Based Polarization Detection and Material Recognition." Optics Express 30, no. 22 (2022): 39234–43.
- Guan, Caizhong, Nan Zeng, and Honghui He. "Review of Polarization-Based Technology for Biomedical Applications." Journal of Innovative Optical Health Sciences 18, no. 02 (2025): 2430002.
- Tukimin, Siti Nurainie, Salmah Binti Karman, Mohd Yazed Ahmad, and Wan Safwani Wan Kamarul Zaman. "Polarized Light-Based Cancer Cell Detection Techniques: A Review." IEEE Sensors Journal 19, no. 20 (2019): 9010–25.
- Zhu, Xinlong, Xiaohan Guo, Fang Kong, Farhad Banoori, Wenli Ren, Fangzheng Ding, and Yinjing Guo. "A Review of Underwater Skylight Polarization Detection." Optics & Laser Technology 192 (2025): 113505.
- Duan, Changfei, Yingjie Zhang, Peipei Li, Qiang Li, Wenbo Yu, Kai Wen, Sergei A Eremin, Jianzhong Shen, Xuezhi Yu, and Zhanhui Wang. "Dual-Wavelength Fluorescence Polarization Immunoassay for Simultaneous Detection of Sulfonamides and Antibacterial Synergists in Milk." Biosensors 12, no. 11 (2022): 1053.
- Gastellu-Etchegorry, Jean Philippe, Nicolas Lauret, Tiangang Yin, Lucas Landier, Abdelaziz Kallel, Zbynek Malenovsky, Ahmad Al Bitar, Josselin Aval, Sahar Benhmida, and Jianbo Qi. "Dart: Recent Advances in Remote Sensing Data Modeling with Atmosphere, Polarization, and Chlorophyll Fluorescence." IEEE Journal of Selected Topics in Applied Earth Observations and Remote Sensing (2017): 2640–49.
- Hosseini, Mehdi, and Heather McNairn. "Using Multi-Polarization C-and L-Band Synthetic Aperture Radar to Estimate Biomass and Soil Moisture of Wheat Fields." International Journal of Applied Earth Observation and Geoinformation 58 (2017): 50–64.
- Lunagaria, Manoj M, and Haridas R Patel. "Changes in Reflectance Anisotropy of Wheat Crop during Different Phenophases." International Agrophysics 31, no. 2 (2017): 203.
- Xu, Jun-LiGobrecht, AlexiaHeran, DaphneGorretta, NathalieCoque, MarieGowen, Aoife A.Bendoula, RyadSun, Da-Wen. "A Polarized Hyperspectral Imaging System for in Vivo Detection: Multiple Applications in Sunflower Leaf Analysis." Computers and Electronics in Agriculture 158 (2019).
- Sun, Zhongqiu, Di Wu, and Yunfeng Lv. "Effects of Water Salinity on the Multi-Angular Polarimetric Properties of Light Reflected from Smooth Water Surfaces." Applied Optics 61, no. 15 (2022): 4527–34.
- Li, Xiao, Zhongqiu Sun, Shan Lu, and Kenji Omasa. "A Radiative Transfer Model for Characterizing Photometric and Polarimetric Properties of Leaf Reflection: Combination of Prospect and a Polarized Reflection Function." Remote Sensing of Environment 318 (2025): 114559.
- Huang, Wenjiang, Qinying Yang, Ruiliang Pu, and Shaoyuan Yang. "Estimation of Nitrogen Vertical Distribution by Bi-Directional Canopy Reflectance in Winter Wheat." Sensors 14, no. 11 (2014): 20347–59.
- Di, Wu, and Sun Zhongqiu. "Research on Polarization Spectral Reflectance Characteristics of Vegetation Canopy Based on Field Measurements." Spectroscopy and Spectral Analysis 37, no. 08 (2017): 2533–38. [CrossRef]
- Zhang, Feizhou, Xufang Liu, Yun Xiang, Zihan Zhang, Siyuan Liu, and Lei Yan. "Estimation of Rock Characteristics Based on Polarization Spectra: Surface Roughness, Composition, and Density." Photogrammetric Engineering & Remote Sensing 87, no. 12 (2021): 907–12.
- Huang, Longqian, Ruichen Luo, Xu Liu, and Xiang Hao. "Spectral Imaging with Deep Learning." Light: Science & Applications 11, no. 1 (2022): 61.
- Shen, Ying, Wenfu Lin, Zhifeng Wang, Jie Li, Xinquan Sun, Xianyu Wu, Shu Wang, and Feng Huang. "Rapid Detection of Camouflaged Artificial Target Based on Polarization Imaging and Deep Learning." IEEE Photonics Journal 13, no. 4 (2021): 1–9.
- Zuo, Chao, Jiaming Qian, Shijie Feng, Wei Yin, Yixuan Li, Pengfei Fan, Jing Han, Kemao Qian, and Qian Chen. "Deep Learning in Optical Metrology: A Review." Light: Science & Applications 11, no. 1 (2022): 39.
- Brahimi, Mohammed, Marko Arsenovic, Sohaib Laraba, Srdjan Sladojevic, and Abdelouhab Moussaoui. "Deep Learning for Plant Diseases: Detection and Saliency Map Visualisation." (2018).
- Wang, Rui, Zhi-Feng Zhang, Ben Yang, Hai-Qi Xi, Yu-Sheng Zhai, Rui-Liang Zhang, Li-Jie Geng, Zhi-Yong Chen, and Kun Yang. "Detection and Classification of Cotton Foreign Fibers Based on Polarization Imaging and Improved Yolov5." Sensors 23, no. 9 (2023): 4415.
- Wang, Yafei, Ning Yang, Guoxin Ma, Mohamed Farag Taha, Hanping Mao, Xiaodong Zhang, and Qiang Shi. "Detection of Spores Using Polarization Image Features and Bp Neural Network." International Journal of Agricultural and Biological Engineering 17, no. 5 (2024): 213–21. [CrossRef]
- Liu, Shijing, Xueying Tu, and Cheng Qian. "Classification of Grass Carp Feeding Status Based on Inter-Frame Optical Flow Features and Improved Rnn." Acta Hydrobiologica Sinica 46, no. 06 (2022): 914–21. [CrossRef]
- Ng, Soon Hock, Blake Allan, Daniel Ierodiaconou, Vijayakumar Anand, Alexander Babanin, and Saulius Juodkazis. "Drone Polariscopy—Towards Remote Sensing Applications." Engineering Proceedings 11, no. 1 (2021): 46.
- Xu, Chenyi, YANG Jiaxin, JIN Zhongyu, and YU Fenghua. "Research Progress in Polarization Spectroscopy in the Inversion of Agronomic Parameters of Field Crops." Acta Agriculturae Zhejiangensis 36, no. 11 (2024): 2596. [CrossRef]
- Wang, Yong, Yuqing Su, Xiangyu Sun, Xiaorui Hao, Yanping Liu, Xiaolong Zhao, Hongsheng Li, Xiushuo Zhang, Jing Xu, and Jingjing Tian. "Principle and Implementation of Stokes Vector Polarization Imaging Technology." Applied Sciences 12, no. 13 (2022): 6613.
- Bi, Hongru, Wei Chen, and Yi Yang. "Extracting Illuminated Vegetation, Shadowed Vegetation and Background for Finer Fractional Vegetation Cover with Polarization Information and a Convolutional Network." Precision agriculture 25, no. 2 (2024): 1106–25.
- Kulchin, Yuriy N, Sergey O Kozhanov, Alexander S Kholin, Vadim V Demidchik, Evgeny P Subbotin, Yuriy V Trofimov, Kirill V Kovalevsky, Natalia I Subbotina, and Andrey S Gomolsky. "The Ability of Plants Leaves Tissue to Change Polarization State of Polarized Laser Radiation." Brazilian Journal of Botany 47, no. 2 (2024): 463–72.
- Wang, Wei. "Statistical Properties of the Integrated Stokes Parameters of Polarization Speckle or Partially Polarized Thermal Light." Journal of the optical society of america a 40, no. 5 (2023): 914–24.
- Kuratsuji, Hiroshi, and Satoshi Tsuchida. "Evolution of the Stokes Parameters, Polarization Singularities, and Optical Skyrmion." Physical Review A 103, no. 2 (2021): 023514.
- Yi, Jia, Huilin Jiang, and Yong Tan. "The Detection of Soybean Bacterial Blight Based on Polarization Spectral Imaging Techniques." Agronomy 15, no. 1 (2024): 50.
- Cheng, Qian, Ying-min Wang, and Ying-luo Zhang. "Analysis of the Polarization Characteristics of Scattered Light of Underwater Suspended Particles Based on Mie Theory." Optoelectronics Letters 17, no. 4 (2021): 252–56.
- Xu, Xiang, Zenghui Liu, and Zhijian Chen. "Detecting Early Changes in Plant Leaf Moisture Content Using Polarization Imaging." Transactions of the Chinese Society of Agricultural Engineering 39, no. 11 (2023): 175–82. [CrossRef]
- Takruri, Maen, Abubakar Abubakar, Noora Alnaqbi, Hessa Al Shehhi, Abdul-Halim M Jallad, and Amine Bermak. "Dofp-Ml: A Machine Learning Approach to Food Quality Monitoring Using a Dofp Polarization Image Sensor." IEEE Access 8 (2020): 150282–90.
- Shibayama, Michio, Toshihiro Sakamoto, and Akihiko Kimura. "A Multiband Polarimetric Imager for Field Crop Survey:―Instrumentation and Preliminary Observations of Heading-Stage Wheat Canopies―." Plant Production Science 14, no. 1 (2011): 64–74.
- He, Qingyi, Juntong Zhan, Xuanwei Liu, Chao Dong, Dapeng Tian, and Qiang Fu. "Multispectral Polarimetric Bidirectional Reflectance Research of Plant Canopy." Optics and Lasers in Engineering 184 (2025): 108688.
- Kim, Yong-Hyun, Duk-Jin Kim, Jae-Hong Oh, and Yong-Il Kim. "Paddy Field Extraction Using Beta and Polarization Orientation Angles." Paper presented at the 2015 IEEE 5th Asia-Pacific Conference on Synthetic Aperture Radar (APSAR) 2015.
- Meng, Xia, Donghui Xie, and Yan Wang. "Experimental Study on Influencing Factors of Multi-Angle Polarized Spectral Characteristics of Plant Leaves." Spectroscopy and Spectral Analysis 34, no. 03 (2014): 619–24. [CrossRef]
- Rodríguez, Carla, Enrique Garcia-Caurel, Teresa Garnatje, Mireia Serra i Ribas, Jordi Luque, Juan Campos, and Angel Lizana. "Polarimetric Observables for the Enhanced Visualization of Plant Diseases." Scientific Reports 12, no. 1 (2022): 14743.
- Cheng, Yuqiong, Wei Lu, and Delin Hong. "Detection Method for Rice Seed Germination Rate Based on Continuous Polarized Spectroscopy." Spectroscopy and Spectral Analysis 36, no. 07 (2016): 2200–06. [CrossRef]
- Germann, Peter, Andreas Helbling, and Tomaso Vadilonga. "Rivulet Approach to Rates of Preferential Infiltration." Vadose Zone Journal 6, no. 2 (2007): 207–20.
- McNairn, Heather, Amine Merzouki, Yifeng Li, George Lampropoulos, Weikai Tan, Jarrett Powers, and Matthew Friesen. "Retrieval of Field-Scale Soil Moisture Using Compact Polarimetry: Preparing for the Radarsat-Constellation." Paper presented at the IGARSS 2018-2018 IEEE International Geoscience and Remote Sensing Symposium 2018.
- Kong, Zheng, Jiheng Yu, Zhenfeng Gong, Dengxin Hua, and Liang Mei. "Visible, near-Infrared Dual-Polarization Lidar Based on Polarization Cameras: System Design, Evaluation and Atmospheric Measurements." Optics Express 30, no. 16 (2022): 28514–33.
- Sarykar, Mukul, and Maher Assaad. "Measuring Perceived Sweetness by Monitoring Sorbitol Concentration in Apples Using a Non-Destructive Polarization-Based Readout." Applied Optics 60, no. 19 (2021): 5723–34.
- Sarkar, M, N Gupta, and M Assaad. "Monitoring of Fruit Freshness Using Phase Information in Polarization Reflectance Spectroscopy." Applied Optics 58, no. 23 (2019): 6396–405.
- Yang, Yu, Liang Wang, Min Huang, Qibing Zhu, and Ruili Wang. "Polarization Imaging Based Bruise Detection of Nectarine by Using Resnet-18 and Ghost Bottleneck." Postharvest Biology and Technology 189 (2022): 111916.
- Wang, F., Y. Wen, Z. Tan, F. Cheng, and W. Yi. "Nondestructive Detecting Cracks of Preserved Eggshell Using Polarization Technology and Cluster Analysis." Nongye Gongcheng Xuebao/transactions of the Chinese Society of Agricultural Engineering 30, no. 9 (2014): 249–55.
- Mu, Taotao, Meng, Fandong, Zhang, Yinchao, Guo, Pan, Liu, and Xiaohua. "Fluorescence Polarization Technique: A New Method for Vegetable Oils Classification." Analytical Methods 7, no. 12 (2015): 5175–79. [CrossRef]
- Deng, Yutong, Hongchun Qu, Ansong Leng, Xiaoming Tang, and Shidong Zhai. "Methods and Challenges in Computer Vision-Based Livestock Anomaly Detection, a Systematic Review." Biosystems Engineering 253 (2025): 104135.
- Gu, Haiyang, Riqin Lv, Xingyi Huang, Quansheng Chen, and Yining Dong. "Rapid Quantitative Assessment of Lipid Oxidation in a Rapeseed Oil-in-Water (O/W) Emulsion by Three-Dimensional Fluorescence Spectroscopy." Journal of Food Composition and Analysis 114 (2022): 104762.
- Huang, Xing-yi, Si-hui Pan, Zhao-yan Sun, Wei-tao Ye, and Joshua Harrington Aheto. "Evaluating Quality of Tomato during Storage Using Fusion Information of Computer Vision and Electronic Nose." Journal of Food Process Engineering 41, no. 6 (2018): e12832.
- Li, Yating, Jun Sun, Xiaohong Wu, Bing Lu, Minmin Wu, and Chunxia Dai. "Grade Identification of Tieguanyin Tea Using Fluorescence Hyperspectra and Different Statistical Algorithms." Journal of food science 84, no. 8 (2019): 2234–41.
- Wang, Junyi, Zhiming Guo, Caixia Zou, Shuiquan Jiang, Hesham R El-Seedi, and Xiaobo Zou. "General Model of Multi-Quality Detection for Apple from Different Origins by Vis/Nir Transmittance Spectroscopy." Journal of Food Measurement and Characterization 16, no. 4 (2022): 2582–95.
- Wang, Yafei, Hanping Mao, Xiaodong Zhang, Yong Liu, and Xiaoxue Du. "A Rapid Detection Method for Tomato Gray Mold Spores in Greenhouse Based on Microfluidic Chip Enrichment and Lens-Less Diffraction Image Processing." Foods 10, no. 12 (2021): 3011.
- Li, Xu, Jingming Wu, Tiecheng Bai, Cuiyun Wu, Yufeng He, Jianxi Huang, Xuecao Li, Ziyan Shi, and Kaiyao Hou. "Variety Classification and Identification of Jujube Based on near-Infrared Spectroscopy and 1d-Cnn." Computers and Electronics in Agriculture 223 (2024): 109122.
- Zheng, Yuanhao, Ying Zhou, Penghui Liu, Yingjie Zheng, Zichao Wei, Zetong Li, and Lijuan Xie. "Improving Discrimination Accuracy of Pest-Infested Crabapples Using Vis/Nir Spectral Morphological Features." Journal of Food Measurement and Characterization 18, no. 10 (2024): 8755–66.
- Zhang, Xijia, Hongbin Pu, and Da-Wen Sun. "Photothermal Detection of Food Hazards Using Temperature as an Indicator: Principles, Sensor Developments and Applications." Trends in Food Science & Technology 146 (2024): 104393.
- Terentev, Anton, Viktor Dolzhenko, Alexander Fedotov, and Danila Eremenko. "Current State of Hyperspectral Remote Sensing for Early Plant Disease Detection: A Review." Sensors 22, no. 3 (2022): 757.
- Adetutu, Awosan Elizabeth, Yakubu Fred Bayo, Adekunle Abiodun Emmanuel, and Agbo-Adediran Adewale Opeyemi. "A Review of Hyperspectral Imaging Analysis Techniques for Onset Crop Disease Detection, Identification and Classification." Journal of forest and environmental science 40, no. 1 (2024): 1–8.
- Ni, Jiheng, Yawen Xue, and Jialin Liao. "Dynamic Changes and Spectrometric Quantitative Analysis of Antioxidant Enzyme Activity of Tylcv-Infected Tomato Plants." Computers and Electronics in Agriculture 232 (2025): 110109.
- Xue, Yingbin, Shengnan Zhu, Rainer Schultze-Kraft, Guodao Liu, and Zhijian Chen. "Dissection of Crop Metabolome Responses to Nitrogen, Phosphorus, Potassium, and Other Nutrient Deficiencies." International Journal of Molecular Sciences 23, no. 16 (2022): 9079.
- Li, Daoliang, Zhaoyang Song, Chaoqun Quan, Xianbao Xu, and Chang Liu. "Recent Advances in Image Fusion Technology in Agriculture." Computers and Electronics in Agriculture 191 (2021): 106491.
- Takács, Péter, Adalbert Tibiássy, Balázs Bernáth, Viktor Gotthard, and Gábor Horváth. "Reflection–Polarization Characteristics of Greenhouses Studied by Drone-Polarimetry Focusing on Polarized Light Pollution of Glass Surfaces." Remote Sensing 16, no. 14 (2024): 2568.
- Wang, Xiaobin, Hongkai Zhao, and Yudi Zhou. "Polarization Ocean Lidar Detection of Characteristics of Yellow Sea Jellyfish." Infrared and Laser Engineering 50, no. 06 (2021): 122–28. [CrossRef]
- Hoshikawa, Keisuke, Takanori Nagano, Akihiko Kotera, Kazuo Watanabe, Yoichi Fujihara, and Osamu Kozan. "Classification of Crop Fields in Northeast Thailand Based on Hydrological Characteristics Detected by L-Band Sar Backscatter Data." Remote Sensing Letters 5, no. 4 (2014): 323–31.
- Liu, Shijing, Xueying Tu, Cheng Qian, Jie Zhou, and Jun Chen. "Feeding Behavior Classification of Grass Carp Based on Inter-Frame Optical Flow Features and an Improved Rnn." Acta Hydrobiologica Sinica 46, no. 06 (2022): 914–21. [CrossRef]
- Li, Siyuan, Jiannan Jiao, and Chi Wang. "Research on Polarized Multi-Spectral System and Fusion Algorithm for Remote Sensing of Vegetation Status at Night." Remote Sensing 13, no. 17 (2021): 3510. [CrossRef]
- Xu, Xiang, Zenghui Liu, and Zhijian Chen. "Early Detection of Leaf Water Content Variation in Plants Using Polarization Imaging. ." Transactions of the Chinese Society of Agricultural Engineering 39, no. 11 (2023): 175–82. [CrossRef]
- Wei, Yang, Hou Kun, and Zhao Yunsheng. "Identification of Withered Plants and Bare Soil Using Polarization Spectra Based on Histogram of Oriented Gradients." Journal of Infrared and Millimeter Waves 38, no. 03 (2019): 365–70. [CrossRef]
- Huang, Yufeng, Xianfeng Zhou, Yunrui Lin, Pengtao Shi, Daoyou Pan, and Jingcheng Zhang. "Evaluation of Tea Tree Leaf Chlorophyll Content Retrieval Using Multi-Angle Polarized Remote Sensing." Paper presented at the 2024 7th International Conference on Pattern Recognition and Artificial Intelligence (PRAI) 2024.
- Huang, Shizhao, and Yanhui Tao. "Feature Extraction Method for Legumes Based on Polarization Information. ." Journal of Jiamusi University (Natural Science Edition) 38, no. 02 (2020): 130–32. [CrossRef]
- Zhang, Liyuan, Aichen Wang, Huiyue Zhang, Qingzhen Zhu, Huihui Zhang, Weihong Sun, and Yaxiao Niu. "Estimating Leaf Chlorophyll Content of Winter Wheat from Uav Multispectral Images Using Machine Learning Algorithms under Different Species, Growth Stages, and Nitrogen Stress Conditions." Agriculture 14, no. 7 (2024): 1064.
- Zhu, Jin, Xianhua Wang, Banglong Pan, and Hanhan Ye. "Polarized Spectral Characteristics of Chlorophyll in Water Bodies." Geomatics and Information Science of Wuhan University 38, no. 05 (2013): 538–42. [CrossRef]
- Pang, HF, Lin Wang, LL Jiang, YL Chen, BQ Wang, and DQ Xiong. "Separation of Chlorophyll Fluorescence from Scattering Light of Algal Water Based on the Polarization Technique." Guang pu xue yu Guang pu fen xi= Guang pu 37, no. 2 (2017): 486–90.
- Yao, Ce, Shan Lu, and Zhongqiu Sun. "Estimation of Leaf Chlorophyll Content with Polarization Measurements: Degree of Linear Polarization." Journal of Quantitative Spectroscopy and Radiative Transfer 242 (2020): 106787.
- Huang, Yufeng, Xianfeng Zhou, Yunrui Lin, Pengtao Shi, Daoyou Pan, and Jingcheng Zhang. "Evaluation of Tea Tree Leaf Chlorophyll Content Retrieval Using Multi-Angle Polarized Remote Sensing." Paper presented at the 2024 7th International Conference on Pattern Recognition and Artificial Intelligence (PRAI) 2024.
- Xu, Jiayi, Huaping Luo, and Yuting Suo. "Application of Polarized Spectroscopy in Non-Destructive Detection of Jujube Leaves." Xinjiang Agricultural Mechanization, no. 01 (2021): 23–26. [CrossRef]
- Abdalla, Mohanned, Mutez Ali Ahmed, Gaochao Cai, Fabian Wankmüller, Nimrod Schwartz, Or Litig, Mathieu Javaux, and Andrea Carminati. "Stomatal Closure during Water Deficit Is Controlled by Below-Ground Hydraulics." Annals of Botany 129, no. 2 (2022): 161–70.
- Li, Xiaolu, Yunye Li, Xinzhao Xie, and Lijun Xu. "Research on a Laser Polarization Imaging Model Based on Leaf Water Content." Infrared and Laser Engineering 46, no. 11 (2017): 121–26. [CrossRef]
- Xie, Xinhao, Lijun Xu, and Xiaolu Li. "Leaf Moisture Content Measurement Using Polarized Active Imaging Lidar." Paper presented at the 2017 IEEE International Conference on Imaging Systems and Techniques (IST) 2017.
- Xu, Xiang, J. I. Yeqin, Zhijian Chen, Zenghui Liu, Bo Sun, and Dengxin Hua. "Rapid Nondestructive Detection of the Moisture Content of Holly Leaves Using Focal Plane Polarization Imaging." Transactions of the Chinese Society of Agricultural Engineering 40, no. 3 (2024): 219–26. [CrossRef]
- Liu, Siyuan, Bin Yang, Zihan Zhang, Yun Xiang, Taixia Wu, Yunsheng Zhao, and Feizhou Zhang. "Influence of Polarized Reflection on Airborne Remote Sensing of Canopy Foliar Nitrogen Content." International Journal of Remote Sensing 41, no. 13 (2020): 4879–900.
- Liu, Ming, Zhongqiu Sun, Shan Lu, and Kenji Omasa. "Combining Multiangular, Polarimetric, and Hyperspectral Measurements to Estimate Leaf Nitrogen Concentration from Different Plant Species." IEEE Transactions on Geoscience and Remote Sensing 60 (2021): 1–15.
- Zi-han, Zhang, Yan Lei, Liu Si-yuan, Fu Yui, Jiang Kai-wen, Yang Bin, Liu Sui-hua, and Zhang Fei-zhou. "Leaf Nitrogen Concentration Retrieval Based on Polarization Reflectance Model and Random Forest Regression." Spectroscopy and Spectral Analysis 41, no. 9 (2021): 2911–17.
- Xu, Tongyu, Jiaxin Yang, and Jucheng Bai. "Inversion Model of Rice Canopy Nitrogen Content Based on Uav Polarimetric Remote Sensing." Transactions of the Chinese Society for Agricultural Machinery 54, no. 10 (2023): 171–78. [CrossRef]
- Zhu, Wen-Jing, Han-Ping Mao, Hong-Yu Liu, Xiao-Dong Zhang, and Ji-Heng Ni. "Study on the Polarized Reflectance Characteristics of Single Greenhouse Tomato Nutrient Deficiency Leaves." Spectroscopy and Spectral Analysis 34, no. 1 (2014): 145–50.
- Hanping, Mao, Zhu Wenjing, and Liu Hongyu. "Determination of Nitrogen and Potassium Content in Greenhouse Tomato Leaves Using a New Spectro-Goniophotometer." Crop and Pasture Science 65, no. 9 (2014): 888–98.
- Mahmood ur Rehman, Muhammad, Jizhan Liu, Aneela Nijabat, Muhammad Faheem, Wenyuan Wang, and Shengyi Zhao. "Leveraging Convolutional Neural Networks for Disease Detection in Vegetables: A Comprehensive Review." Agronomy 14, no. 10 (2024): 2231.
- Pourreza, Alireza, Won Suk Lee, Ed Etxeberria, and Yao Zhang. "Identification of Citrus Huanglongbing Disease at the Pre-Symptomatic Stage Using Polarized Imaging Technique." IFAC-PapersOnLine 49, no. 16 (2016): 110–15.
- Zhu, Shiming, Elin Malmqvist, Wansha Li, Samuel Jansson, Yiyun Li, Zheng Duan, Katarina Svanberg, Hongqiang Feng, Ziwei Song, and Guangyu Zhao. "Insect Abundance over Chinese Rice Fields in Relation to Environmental Parameters, Studied with a Polarization-Sensitive Cw near-Ir Lidar System." Applied Physics B 123, no. 7 (2017): 211.
- Xu, Qian, Jian-Rong Cai, Wen Zhang, Jun-Wen Bai, Zi-Qi Li, Bin Tan, and Li Sun. "Detection of Citrus Huanglongbing (Hlb) Based on the Hlb-Induced Leaf Starch Accumulation Using a Home-Made Computer Vision System." Biosystems Engineering 218 (2022): 163–74.
- Tan, Zuojun, Fei Cheng, Pengfei Wu, and Fang Wang. "Detection of Egg Freshness Throughpolarization Imaging." Applied Engineering in Agriculture 30, no. 2 (2014): 317–23.
- Fenfang, Lin, Zhang Dongyan, Wang Xiu, Wu Taixia, and Chen Xinfu. "Identification of Corn and Weeds on the Leaf Scale Using Polarization Spectroscopy." Infrared and laser Engineering 45, no. 12 (2016): 1223001–01 (10).
- Di, Yabei, Jinlong Yu, Huaping Luo, Huaiyu Liu, Lei Kang, and Yuesen Tong. "Study on Outdoor Spectral Inversion of Winter Jujube Based on Bpdf Models." Agriculture 15, no. 13 (2025): 1334.
- Geng, Dechun, Bin Chen, and Mingjie Chen. "Polarization Perturbation 2d Correlation Fluorescence Spectroscopy of Edible Oils: A Pilot Study." Journal of Food Measurement and Characterization 13, no. 2 (2019): 1566–73.
- Xing, Muye, Yuan Long, Qingyan Wang, Xi Tian, Shuxiang Fan, Chi Zhang, and Wenqian Huang. "Physiological Alterations and Nondestructive Test Methods of Crop Seed Vigor: A Comprehensive Review." Agriculture 13, no. 3 (2023): 527.
- Rahman, Anisur, and Byoung-Kwan Cho. "Assessment of Seed Quality Using Non-Destructive Measurement Techniques: A Review." Seed Science Research 26, no. 4 (2016): 285–305.
- Xinyu, Wang, Guo Yangming, and Lu Wei. "Portable Rapid Detection Device for Rice Seed Germination Rate Based on Polarized Spectroscopy." Measurement and Control Technology 38, no. 01 (2019): 89–92. [CrossRef]
- Hu, Qingying, Wei Lu, Yuxin Guo, Wei He, Hui Luo, and Yiming Deng. "Vigor Detection for Naturally Aged Soybean Seeds Based on Polarized Hyperspectral Imaging Combined with Ensemble Learning Algorithm." Agriculture 13, no. 8 (2023): 1499.
- Rasheed, Muhammad Waseem, Jialiang Tang, Abid Sarwar, Suraj Shah, Naeem Saddique, Muhammad Usman Khan, Muhammad Imran Khan, Shah Nawaz, Redmond R Shamshiri, and Marjan Aziz. "Soil Moisture Measuring Techniques and Factors Affecting the Moisture Dynamics: A Comprehensive Review." Sustainability 14, no. 18 (2022): 11538.
- Cheng, Guangliang, Yunmeng Huang, Xiangtai Li, Shuchang Lyu, Zhaoyang Xu, Hongbo Zhao, Qi Zhao, and Shiming Xiang. "Change Detection Methods for Remote Sensing in the Last Decade: A Comprehensive Review." Remote Sensing 16, no. 13 (2024): 2355.
- Luo, Dayou, Xingping Wen, and Junlong Xu. "All-Sky Soil Moisture Estimation over Agriculture Areas from the Full Polarimetric Sar Gf-3 Data." Sustainability 14, no. 17 (2022): 10866.
- Wang, Xinqiang, Xiaobing Sun, and Lijuan Zhang. "Experimental Study on Spectral Polarization Characteristics of Soil Moisture in the Visible/near-Infrared Region." Infrared and Laser Engineering 44, no. 11 (2015): 3288–92. [CrossRef]
- Ye, Song, Dongfeng Deng, and Xiaobing Sun. "Experimental Study on a Remote Sensing Method for Soil Moisture Using Polarized Spectroscopy." Spectroscopy and Spectral Analysis 36, no. 05 (2016): 1434–39. [CrossRef]
- Zhang, Ying, Yanqiang Yu, and Huijie Zhao. "Soil Moisture Retrieval Method Based on Polarization Information." Infrared and Laser Engineering 47, no. 01 (2018): 206–11. [CrossRef]
- Wenlong, Qiu, Ting Tang, Song He, Zheng Zeyong, Lv Jinhong, Guo Jiacheng, Zeng Yunfang, Lao Yifeng, and Weibin Wu. "Inversion Studies on the Heavy Metal Content of Farmland Soils Based on Spectroscopic Techniques: A Review." Agronomy 15, no. 7 (2025): 1678.
- Yang, Yu, Zhao Nanjing, and Meng Deshuo. "Research on Soil Heavy Metal Detection Based on Polarization-Resolved Libs Technology " Chinese Laser 45, no. 08 (2018): 267–72. [CrossRef]
- Cheng, DeWei. Soil Heavy Metal Detection Based on Polarization-Resolved Laser-Induced Breakdown Spectroscopy. 硕士, Wuhan University of Technology, 2019. [CrossRef]
- Gu, Qianyi, Yang Han, Yaping Xu, Haiyan Yao, Haofang Niu, and Fang Huang. "Laboratory Research on Polarized Optical Properties of Saline-Alkaline Soil Based on Semi-Empirical Models and Machine Learning Methods." Remote Sensing 14, no. 1 (2022): 226.
- Manikandan, TT, Rajeev Sukumaran, M Radhakrishnan, MR Christhuraj, and M Saravanan. "Network Layer Communication Protocol Design for Underwater Agriculture Farming." International journal of communication systems 35, no. 6 (2022): e5088.
- Yue, Wei, Li Jiang, Xiubin Yang, Suining Gao, Yunqiang Xie, and Tingting Xu. "Optical Design of a Common-Aperture Camera for Infrared Guided Polarization Imaging." Remote Sensing 14, no. 7 (2022): 1620.
- Shen, Linghao, Mohamed Reda, Xun Zhang, Yongqiang Zhao, and Seong G Kong. "Polarization-Driven Solution for Mitigating Scattering and Uneven Illumination in Underwater Imagery." IEEE Transactions on Geoscience and Remote Sensing 62 (2024): 1–15.
- Guan, Jin Ge, Jing Ping Zhu, Heng Tian, and Xun Hou. "Real-Time Polarization Difference Underwater Imaging Based on Stokes Vector." Acta Physica Sinica -Chinese Edition- 64, no. 22 (2015).
- Qian, Jiamin, Jianxin Li, Yubo Wang, Jie Liu, Jiaxin Wang, and Donghui Zheng. "Underwater Image Recovery Method Based on Hyperspectral Polarization Imaging." Optics Communications 484 (2021): 126691.
- Pan, Tianfeng, Xianqiang He, Xuan Zhang, Jia Liu, Yan Bai, Fang Gong, and Teng Li. "Experimental Study on Bottom-up Detection of Underwater Targets Based on Polarization Imaging." Sensors 22, no. 8 (2022): 2827.
- Gui, Xinyuan, Ran Zhang, Haoyuan Cheng, Lianbiao Tian, and Jinkui Chu. "Multi-Turbidity Underwater Image Restoration Based on Neural Network and Polarization Imaging." Laser Optoelectron. Prog 59 (2022): 0410001.
- Song, Qiang, Xiaobing Sun, and Xiao Liu. "Investigation on the Influence of Bubble Groups in Underwater Environment on Target Imaging Based on Polarization Information " Acta Physica Sinica 70, no. 14 (2021): 210–25. [CrossRef]
- Fan, Axin, Tingfa Xu, Jianan Li, Geer Teng, Xi Wang, Yuhan Zhang, and Chang Xu. "Compressive Full-Stokes Polarization and Flexible Hyperspectral Imaging with Efficient Reconstruction." Optics and Lasers in Engineering 160 (2023): 107256.
- Tan, Jian, Junping Zhang, and Ye Zhang. "Target Detection for Polarized Hyperspectral Images Based on Tensor Decomposition." IEEE Geoscience and Remote Sensing Letters 14, no. 5 (2017): 674–78.
- Xie, Jun, Jiaolei Di, and Yuwen Qin. "Application of Deep Learning in Underwater Imaging Technology (Special Invited) " Journal of Photonics 51, no. 11 (2022): 9–56. [CrossRef]
- Zhu, Wen Jing, Han Ping Mao, Qing Lin Li, Hong Yu Liu, Jun Sun, Zhi Yu Zuo, and Yong Chen. "Study on the Polarized Reflectance-Hyperspectral Information Fusion Technology of Tomato Leaves Nutrient Diagnoses." Spectroscopy and Spectral Analysis 34, no. 9 (2014): 2500–05.
- Pan, Qian, Yang Han, and Lingzhi Wang. "Polarized Hyperspectral Reflectance Characteristics and Fertility Analysis of Soils in Northeast China's Farmland Area." Infrared 37, no. 08 (2016): 33–40. [CrossRef]
- Wang, Lingzhi, Yang Han, and Qian. Pan. "A Study on a Multi-Angle Polarization Hyperspectral Model for Soil Fertility in Farmland." Spectroscopy and Spectral Analysis 38, no. 01 (2018): 240–45. [CrossRef]
- Yang, Wei, Kun Hou, and Yunsheng Zhao. "A Study on the Identification of Withered Plants and Bare Soil Using Gradient Direction Histograms." Journal of Infrared and Millimeter Waves 38, no. 03 (2019): 365–70. [CrossRef]
- Zhu, Wenjing, Jinyang Li, Lin Li, Aichen Wang, Xinhua Wei, and Hanping Mao. "Nondestructive Diagnostics of Soluble Sugar, Total Nitrogen and Their Ratio of Tomato Leaves in Greenhouse by Polarized Spectra-Hyperspectral Data Fusion." International Journal of Agricultural and Biological Engineering, no. 2 (2020).
- Hao, Tianyi, Yang Han, and Zeping Liu. " Spatial Variation Distribution and Model Establishment of Chlorophyll Fluorescence Based on Multi-Angle Spectral and Polarization Spectroscopy." Spectroscopy and Spectral Analysis 40, no. 12 (2020): 3692–98. [CrossRef]
- Luo, Huaping, Luying Yi, Ling Guo, and Wei Li. "Based on Hyperspectral Polarization to Build the Quantitative Remote Sensing Model of Jujube in Southern Xinjiang." Paper presented at the Sixth Symposium on Novel Optoelectronic Detection Technology and Applications 2020.
- Faqeerzada, Mohammad Akbar, Anisur Rahman, Geonwoo Kim, Eunsoo Park, Rahul Joshi, Santosh Lohumi, and Byoung-Kwan Cho. "Prediction of Moisture Contents in Green Peppers Using Hyperspectral Imaging Based on a Polarized Lighting System." Korean Journal of Agricultural Science 47, no. 4 (2020): 995–1010.
- Hao, Jinglei, Yongqiang Zhao, Haimeng Zhao, and Peter BREZANY. "3d Reconstruction of High-Reflective and Textureless Targets Based on Multispectral Polarization and Machine Vision." Acta Geodaetica et Cartographica Sinica 47, no. 06 (2018): 816–24. [CrossRef]
- Li, Siyuan, Jiannan Jiao, Jinbo Chen, and Chi Wang. "A New Polarization-Based Vegetation Index to Improve the Accuracy of Vegetation Health Detection by Eliminating Specular Reflection of Vegetation." IEEE Transactions on Geoscience and Remote Sensing 60 (2022): 1–18.
- Mukhametova, Liliya I, Marya K Kolokolova, Ivan A Shevchenko, Boris S Tupertsev, Anatoly V Zherdev, Chuanlai Xu, and Sergei A Eremin. "Fluorescence Polarization Immunoassay for Rapid, Sensitive Detection of the Herbicide 2, 4-Dichlorophenoxyacetic Acid in Juice and Water Samples." Biosensors 15, no. 1 (2025): 32.
- Zhou, Liangliang, Jiachuan Yang, Zhexuan Tao, Sergei A Eremin, Xiude Hua, and Minghua Wang. "Development of Fluorescence Polarization Immunoassay for Imidacloprid in Environmental and Agricultural Samples." Frontiers in Chemistry 8 (2020): 615594.
- Lippolis, Vincenzo, Michelangelo Pascale, Stefania Valenzano, Anna Chiara Raffaella Porricelli, Michele Suman, and Angelo Visconti. "Fluorescence Polarization Immunoassay for Rapid, Accurate and Sensitive Determination of Ochratoxin a in Wheat." Food Analytical Methods 7, no. 2 (2014): 298–307.
- Zhang, Xiya, Qianqian Tang, Tiejun Mi, Sijun Zhao, Kai Wen, Liuchuan Guo, Jiafei Mi, Suxia Zhang, Weimin Shi, and Jianzhong Shen. "Dual-Wavelength Fluorescence Polarization Immunoassay to Increase Information Content Per Screen: Applications for Simultaneous Detection of Total Aflatoxins and Family Zearalenones in Maize." Food Control 87 (2018): 100–08.
- Yao, Li, Jianguo Xu, Wei Qu, Dongqing Qiao, Sergei A Eremin, Jianfeng Lu, Wei Chen, and Panzhu Qin. "Performance Improved Fluorescence Polarization for Easy and Accurate Authentication of Chicken Adulteration." Food Control 133 (2022): 108604.
- Sindhu, Sindhu, and Annamalai Manickavasagan. "Nondestructive Testing Methods for Pesticide Residue in Food Commodities: A Review." Comprehensive Reviews in Food Science and Food Safety 22, no. 2 (2023): 1226–56.
- Guo, Zhiming, Xinchen Wu, Heera Jayan, Limei Yin, Shanshan Xue, Hesham R El-Seedi, and Xiaobo Zou. "Recent Developments and Applications of Surface Enhanced Raman Scattering Spectroscopy in Safety Detection of Fruits and Vegetables." Food Chemistry 434 (2024): 137469.
- Xu, Lingyuan, AM Abd El-Aty, Jong-Bang Eun, Jae-Han Shim, Jing Zhao, Xingmei Lei, Song Gao, Yongxin She, Fen Jin, and Jing Wang. "Recent Advances in Rapid Detection Techniques for Pesticide Residue: A Review." Journal of agricultural and food chemistry 70, no. 41 (2022): 13093–117.
- Xin, Zhou, Sun Jun, Lu Bing, Wu Xiaohong, Dai Chunxia, and Yang Ning. "Study on Pesticide Residues Classification of Lettuce Leaves Based on Polarization Spectroscopy." Journal of Food Process Engineering 41, no. 8 (2018): e12903.
- Wang, Yulong, Zhenfeng Li, Bogdan Barnych, Jingqian Huo, Debin Wan, Natalia Vasylieva, Junli Xu, Pan Li, Beibei Liu, and Cunzheng Zhang. "Investigation of the Small Size of Nanobodies for a Sensitive Fluorescence Polarization Immunoassay for Small Molecules: 3-Phenoxybenzoic Acid, an Exposure Biomarker of Pyrethroid Insecticides as a Model." Journal of agricultural and food chemistry 67, no. 41 (2019): 11536–41.
- Hernández, Mercedes, Andrés A Borges, and Desiderio Francisco-Bethencourt. "Mapping Stressed Wheat Plants by Soil Aluminum Effect Using C-Band Sar Images: Implications for Plant Growth and Grain Quality." Precision agriculture 23, no. 3 (2022): 1072–92.
- Hasituya, Zhongxin Chen, Fei Li, and Hongmei. "Mapping Plastic-Mulched Farmland with C-Band Full Polarization Sar Remote Sensing Data." Remote Sensing 9, no. 12 (2017): 1264.
- Sid’ko, AF, I Yu Botvich, TI Pisman, and AP Shevyrnogov. "Analysis of the Polarization Characteristics of Wheat and Maize Crops Using Land-Based Remote-Sensing Measurements." Biophysics 60, no. 4 (2015): 668–71. [CrossRef]
- Zhang, Yuanzhi, Hongsheng Zhang, and Hui Lin. "Improving the Impervious Surface Estimation with Combined Use of Optical and Sar Remote Sensing Images." Remote Sensing of Environment 141 (2014): 155–67.
- Kuester, Theres, and Daniel Spengler. "Structural and Spectral Analysis of Cereal Canopy Reflectance and Reflectance Anisotropy." Remote Sensing 10, no. 11 (2018): 1767.
- Heine, Iris, Thomas Jagdhuber, and Sibylle Itzerott. "Classification and Monitoring of Reed Belts Using Dual-Polarimetric Terrasar-X Time Series." Remote Sensing 8, no. 7 (2016): 552.
- Sun, Zhongqiu, Yunsheng Zhao, and Shan Lu. "The Role of Polarized Reflectance Information in the Study of Bidirectional Reflection in Vegetation Remote Sensing." Remote Sensing Journal 22, no. 06 (2018): 947–56. [CrossRef]
- Wang, Limin, Jia Liu, Lingbo Yang, Zhongxin Chen, Xiaolong Wang, and Bin Ouyang. "Applications of Unmanned Aerial Vehicle Images on Agricultural Remote Sensing Monitoring." Transactions of the Chinese Society of Agricultural Engineering 29, no. 18 (2013): 136–45.
- Zhang, Zhengxin, and Lixue Zhu. "A Review on Unmanned Aerial Vehicle Remote Sensing: Platforms, Sensors, Data Processing Methods, and Applications." drones 7, no. 6 (2023): 398.
- Larsen, Joshua, Jeffrey Dunne, Robert Austin, Cassondra Newman, and Michael Kudenov. "Drone-Based Polarization Imaging System for Leaf Spot Severity Determination in Peanut Plants." The Plant Phenome Journal 8, no. 1 (2025): e270018.
- Száz, Dénes, Péter Takács, Balázs Bernáth, György Kriska, András Barta, István Pomozi, and Gábor Horváth. "Drone-Based Imaging Polarimetry of Dark Lake Patches from the Viewpoint of Flying Polarotactic Insects with Ecological Implication." Remote Sensing 15, no. 11 (2023): 2797.
- Larsen, Joshua C, Robert Austin, Jeffrey Dunne, and Michael W Kudenov. "Drone-Based Polarization Imaging for Phenotyping Peanut in Response to Leaf Spot Disease." Paper presented at the Polarization: Measurement, Analysis, and Remote Sensing XV 2022.
- Liu, Fei, SJ Sun, PL Han, K Yang, and X Shao. "Development of Underwater Polarization Imaging Technology." Laser & Optoelectronics Progress 58, no. 6 (2021): 0600001.
- Ren, Qiming, Yanfa Xiang, Guochen Wang, Jie Gao, Yan Wu, and Rui-Pin Chen. "The Underwater Polarization Dehazing Imaging with a Lightweight Convolutional Neural Network." Optik 251 (2022): 168381.
- Sun, Chunsheng, Zhichao Ding, and Liheng Ma. "Optimized Method for Polarization-Based Image Dehazing." Heliyon 9, no. 5 (2023).
- Liu, Shuai, Hang Li, Jinyu Zhao, Junchi Liu, Youqiang Zhu, and Zhenduo Zhang. "Atmospheric Light Estimation Using Polarization Degree Gradient for Image Dehazing." Sensors 24, no. 10 (2024): 3137.
- Zhang, Xin, Xia Wang, Changda Yan, Gangcheng Jiao, and Huiyang He. "Polarization-Based Two-Stage Image Dehazing in a Low-Light Environment." Electronics 13, no. 12 (2024): 2269.
- Liang, Jian, Liyong Ren, Haijuan Ju, Wenfei Zhang, and Enshi Qu. "Polarimetric Dehazing Method for Dense Haze Removal Based on Distribution Analysis of Angle of Polarization." Optics Express 23, no. 20 (2015): 26146–57.
- Schlund, Michael, and Stefan Erasmi. "Sentinel-1 Time Series Data for Monitoring the Phenology of Winter Wheat." Remote Sensing of Environment 246 (2020): 111814.
- Zapotoczny, Piotr, Jacek Reiner, M Mrzygłód, and Piotr Lampa. "The Use of Polarized Light and Image Analysis in Evaluations of the Severity of Fungal Infection in Barley Grain." Computers and Electronics in Agriculture 169 (2020): 105154.
- Nguyen-Do-Trong, Nghia, Jean Claude Dusabumuremyi, and Wouter Saeys. "Cross-Polarized Vnir Hyperspectral Reflectance Imaging for Non-Destructive Quality Evaluation of Dried Banana Slices, Drying Process Monitoring and Control." Journal of Food Engineering 238 (2018): 85–94.
- Jin, DUAN, ZHANG Hao, SONG Jingyuan, and LIU Ju. "Review of Polarization Image Fusion Based on Deep Learning." Infrared Technology 46, no. 2 (2024): 119–28.
- Pierangeli, Davide, Giovanni Volpe, and Claudio Conti. "Deep Learning Enabled Transmission of Full-Stokes Polarization Images through Complex Media." Laser & Photonics Reviews 18, no. 11 (2024): 2400626.
- Zhang, Xiaodong, Yafei Wang, Zhankun Zhou, Yixue Zhang, and Xinzhong Wang. "Detection Method for Tomato Leaf Mildew Based on Hyperspectral Fusion Terahertz Technology." Foods 12, no. 3 (2023): 535.
Figure 1.
Principle and Applications of Polarization Spectrum Analysis in Agriculture.
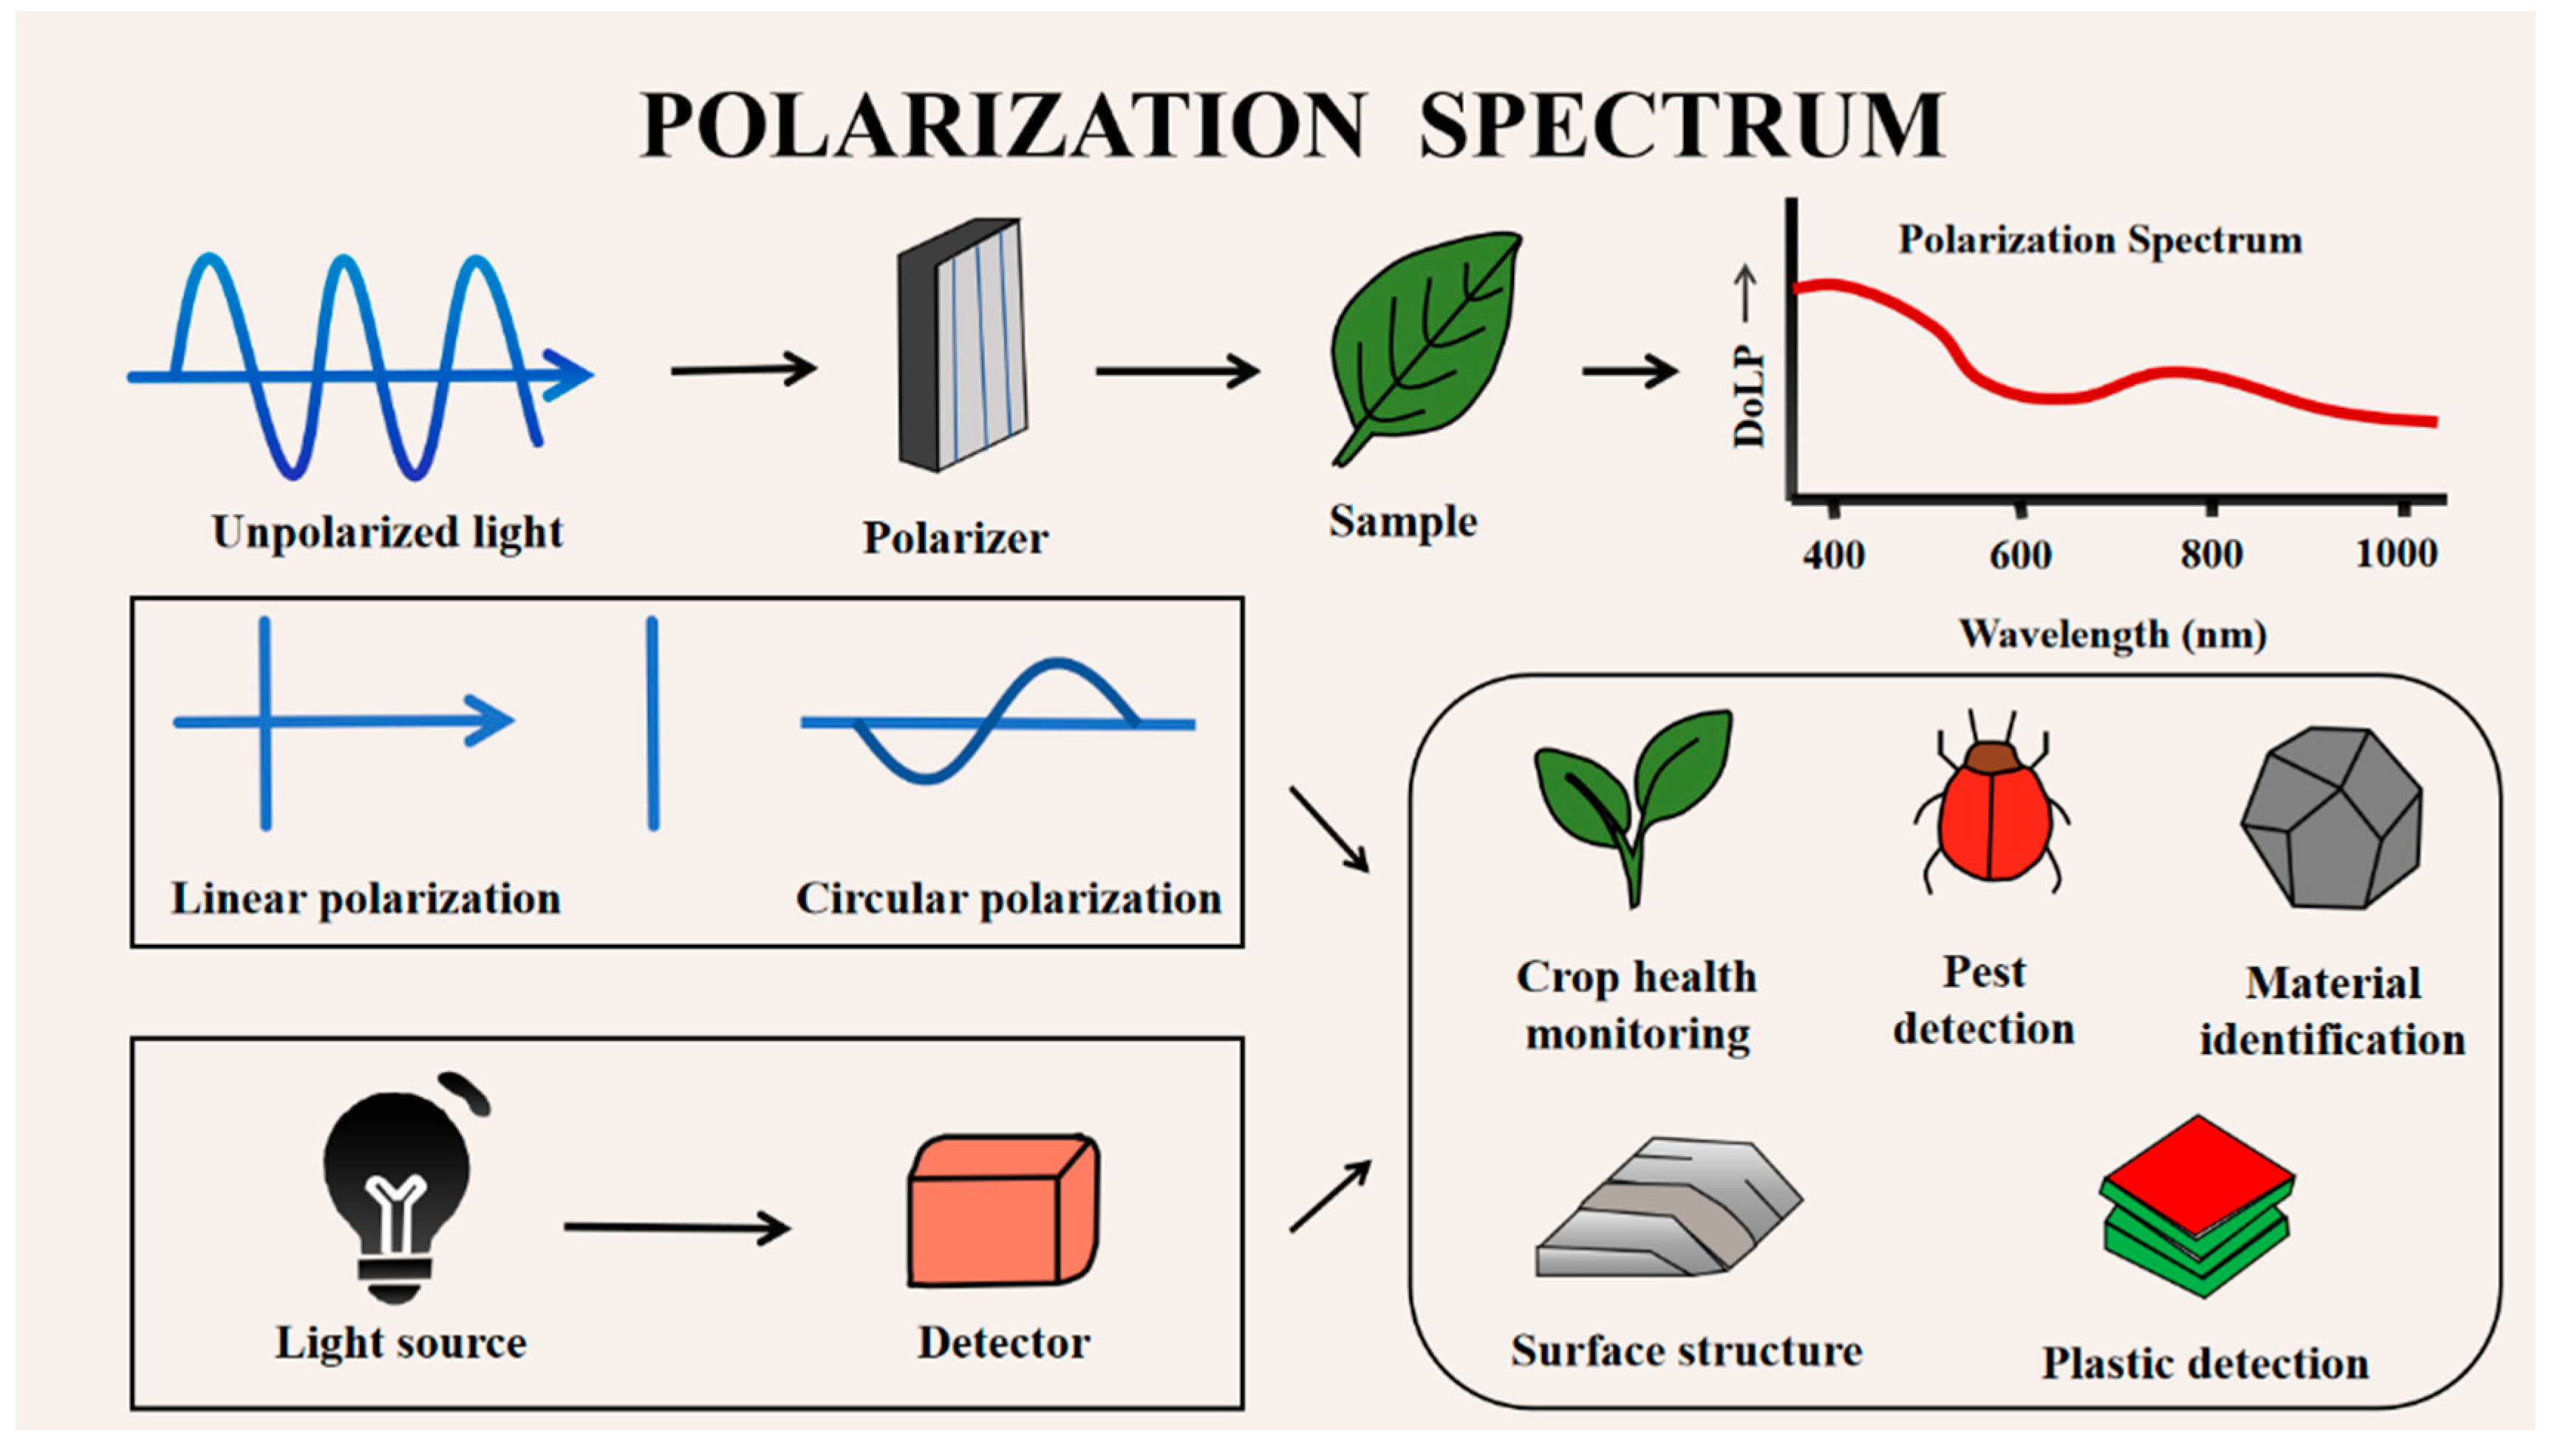
Figure 2.
Research Trends in Polarization Spectroscopy of Agricultural Engineering (2006-2025).
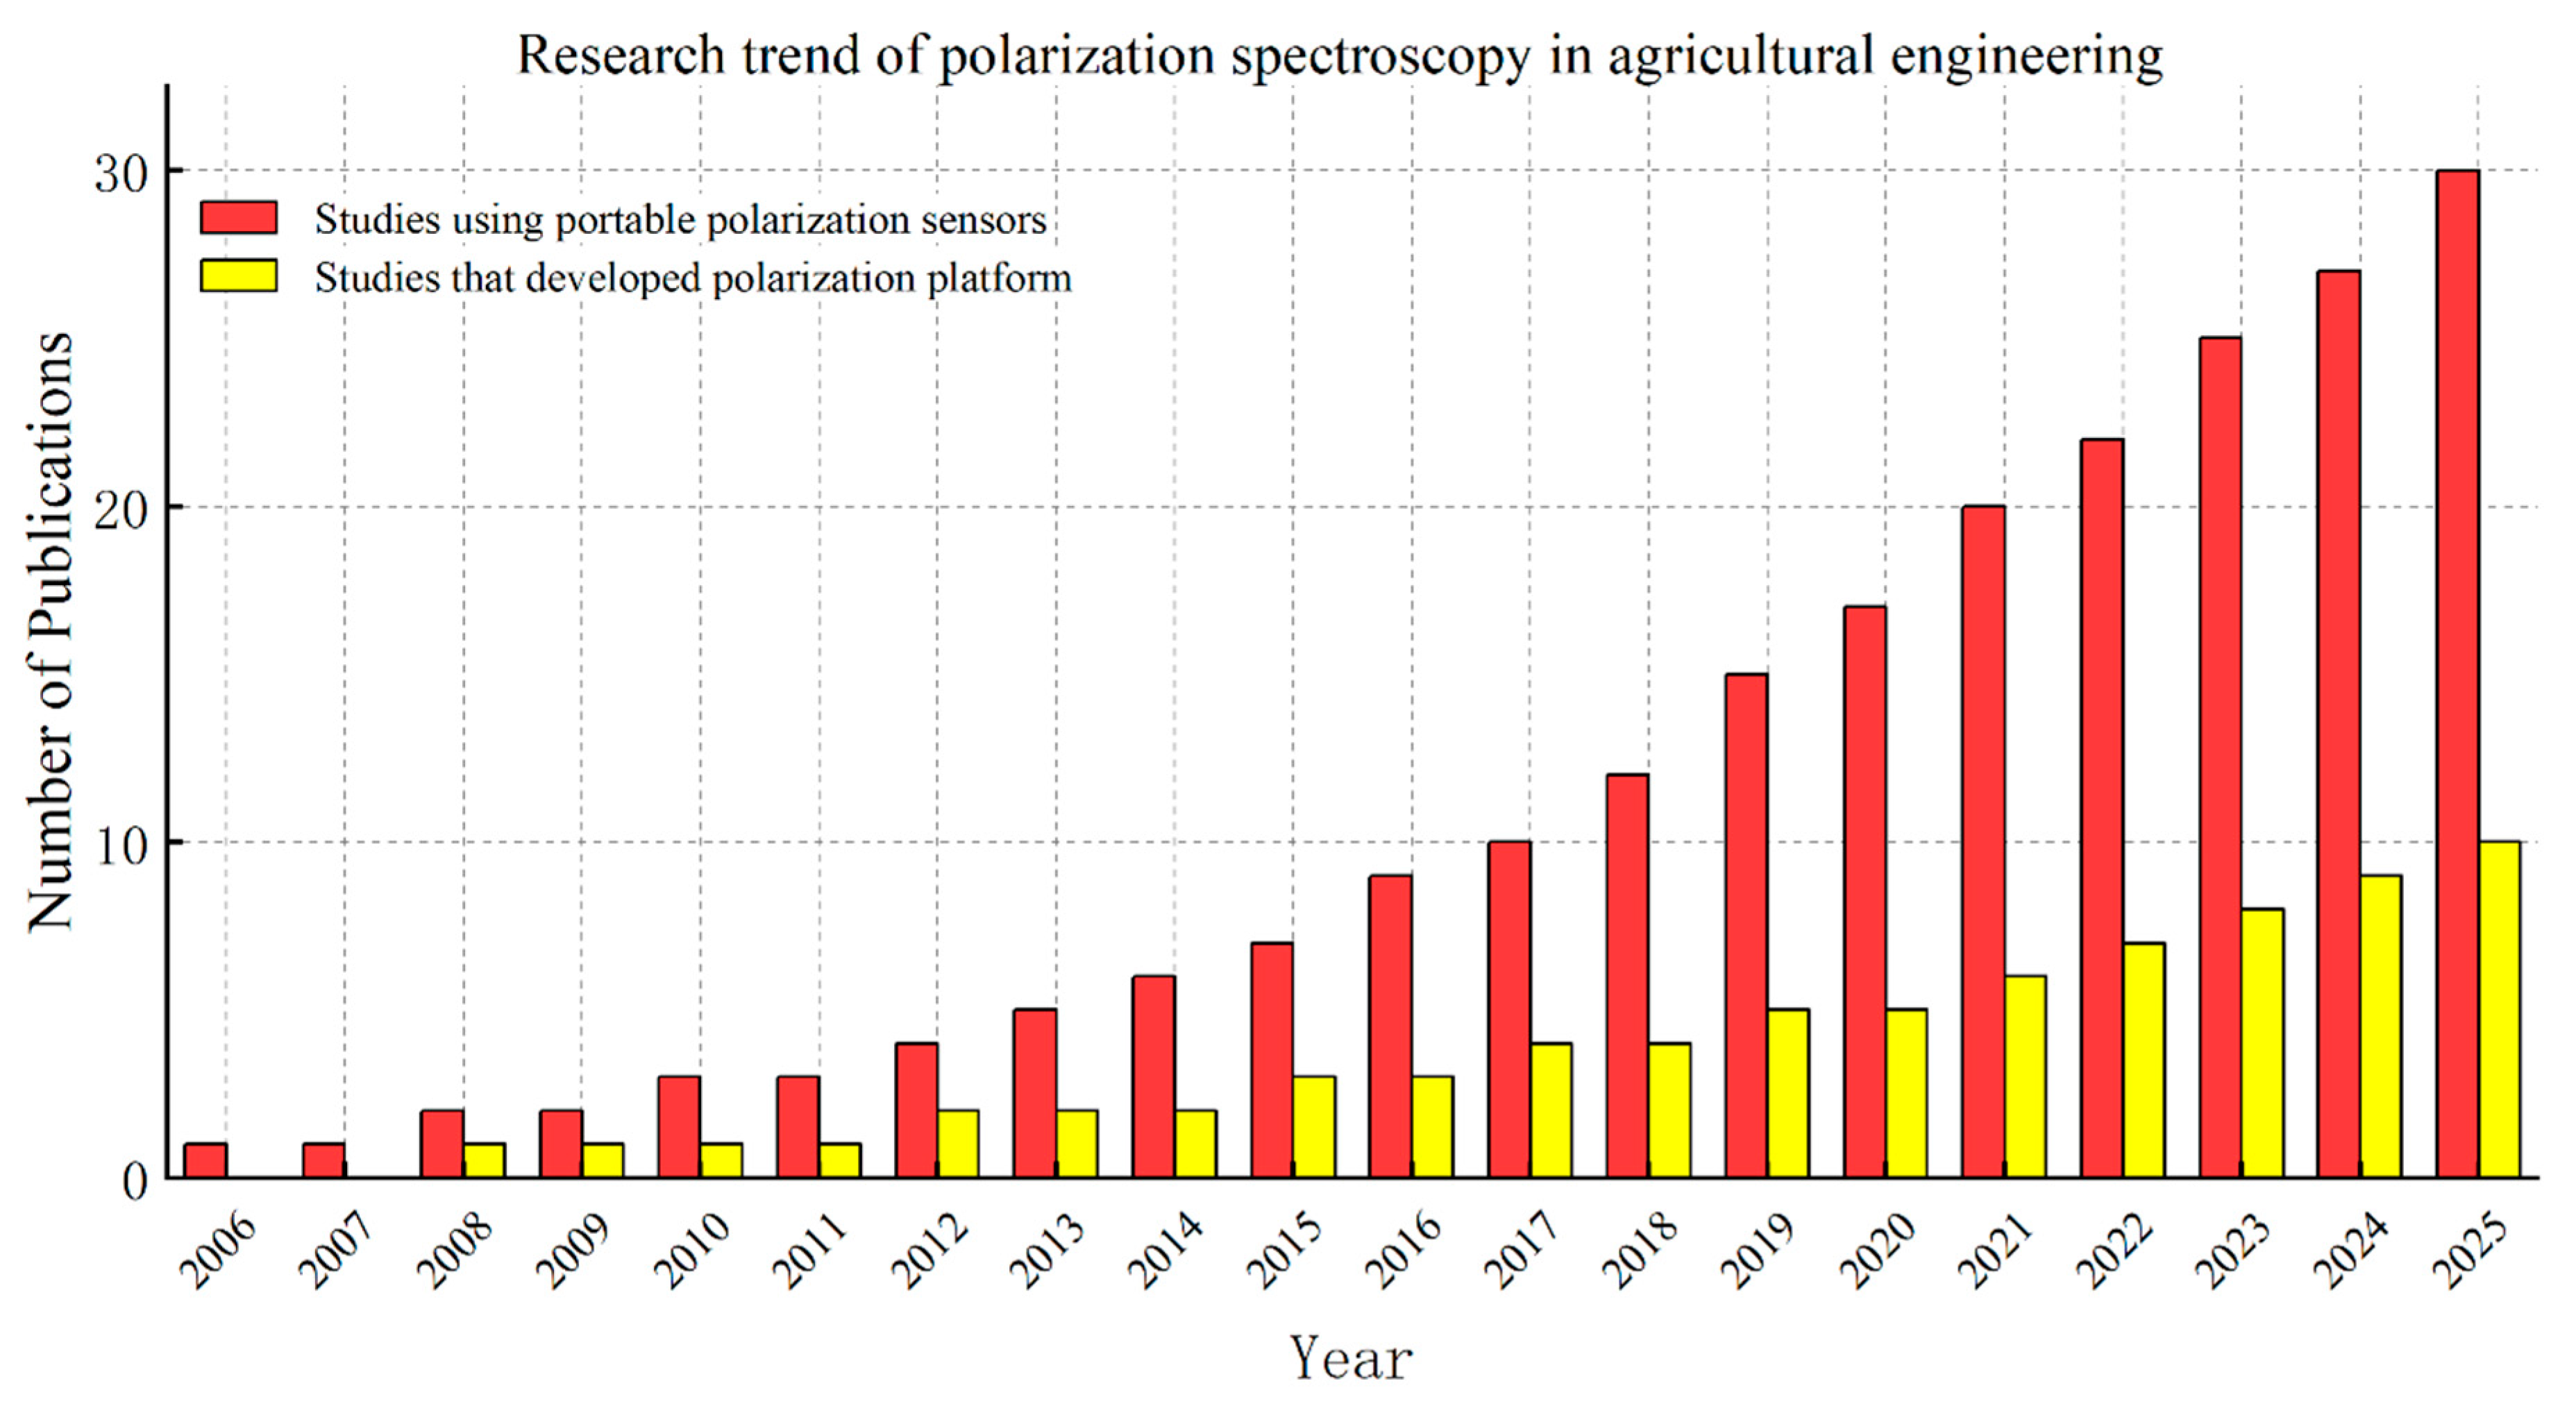
Figure 3.
Polarized reflectance spectrum curve of the vegetation canopy [31].
Figure 3.
Polarized reflectance spectrum curve of the vegetation canopy [31].
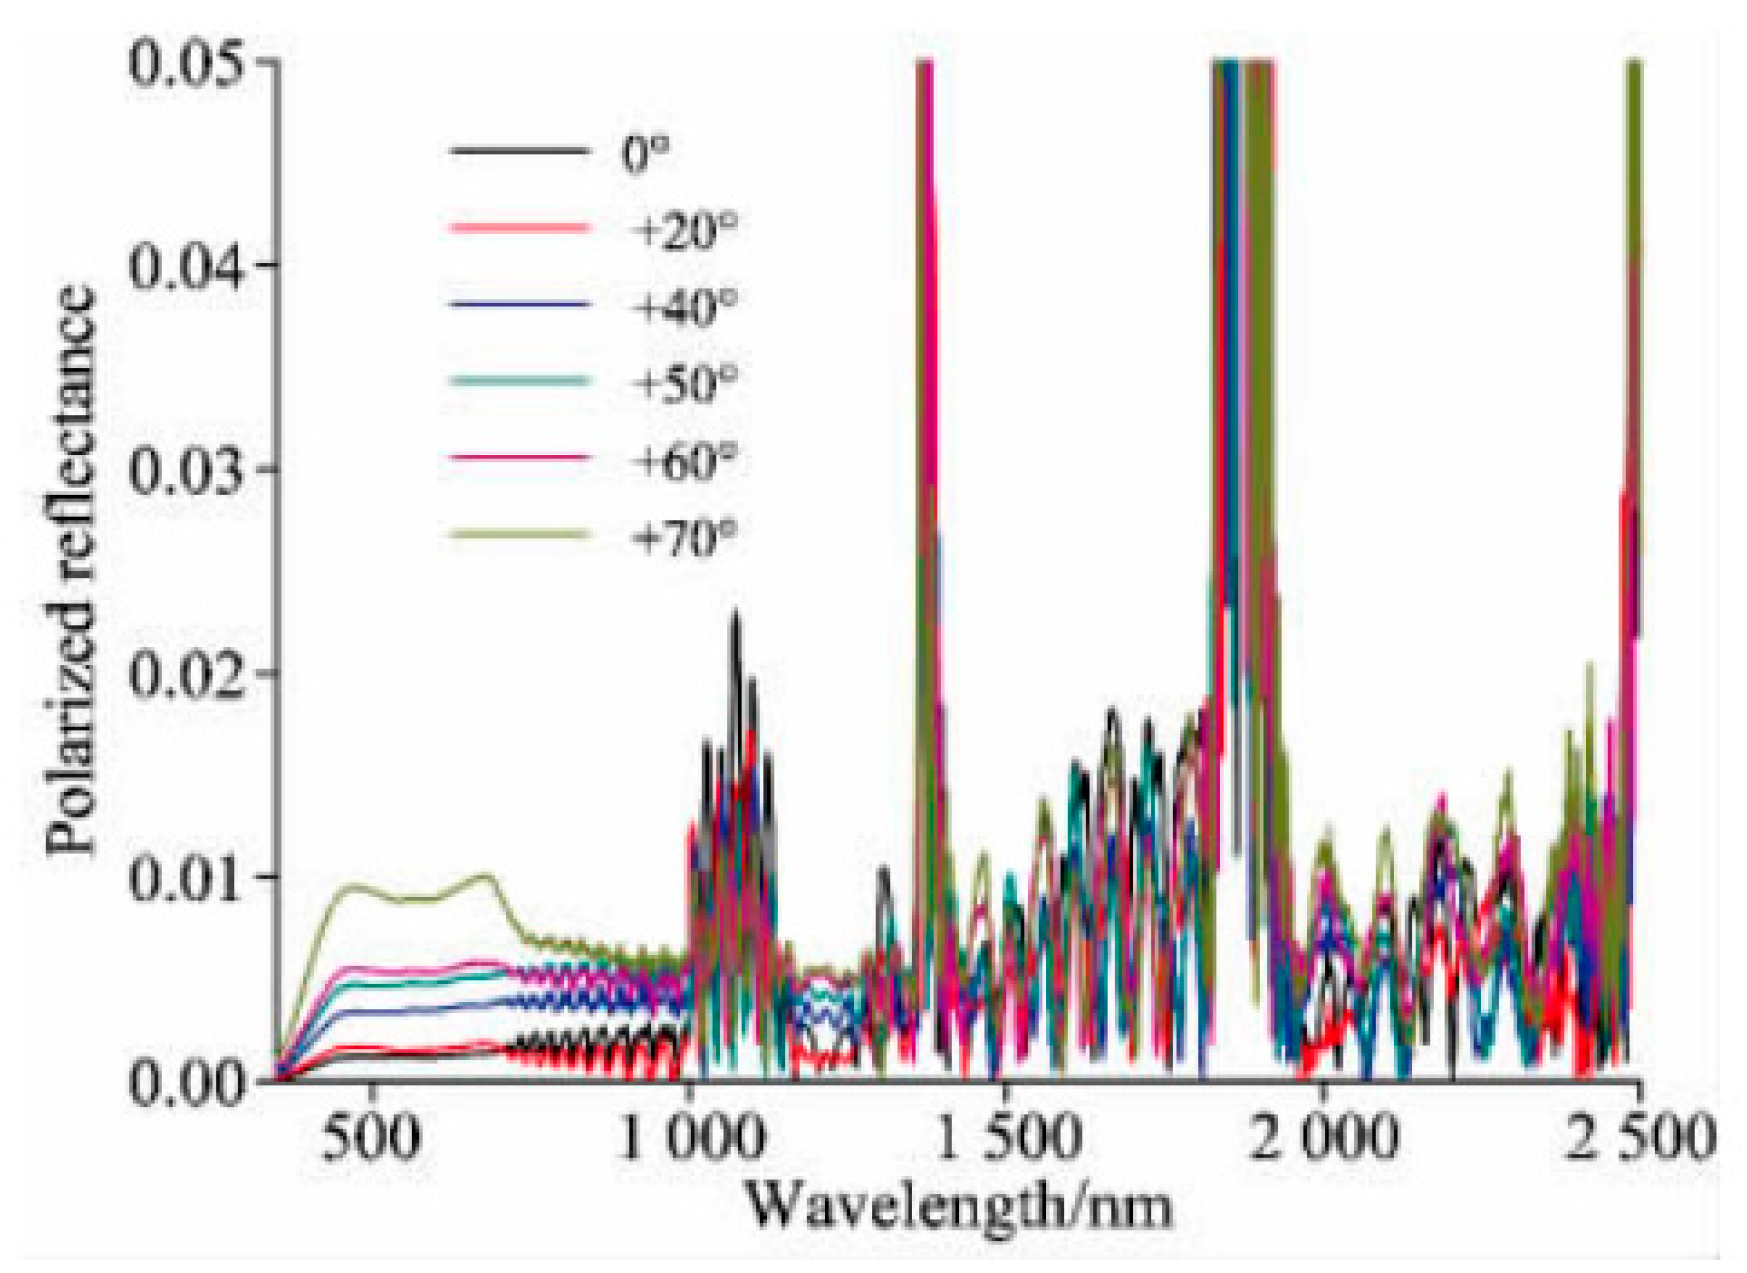
Figure 4.
Different polarization experimental systems a) Physical image of cotton foreign fiber polarization imaging detection device [37]. (b) Disease spores micro polarization image acquisition system [38]. (c) Grass carp feeding system based on polarization camera [39]. (d) Octocopter drone with polarization camera module [40].
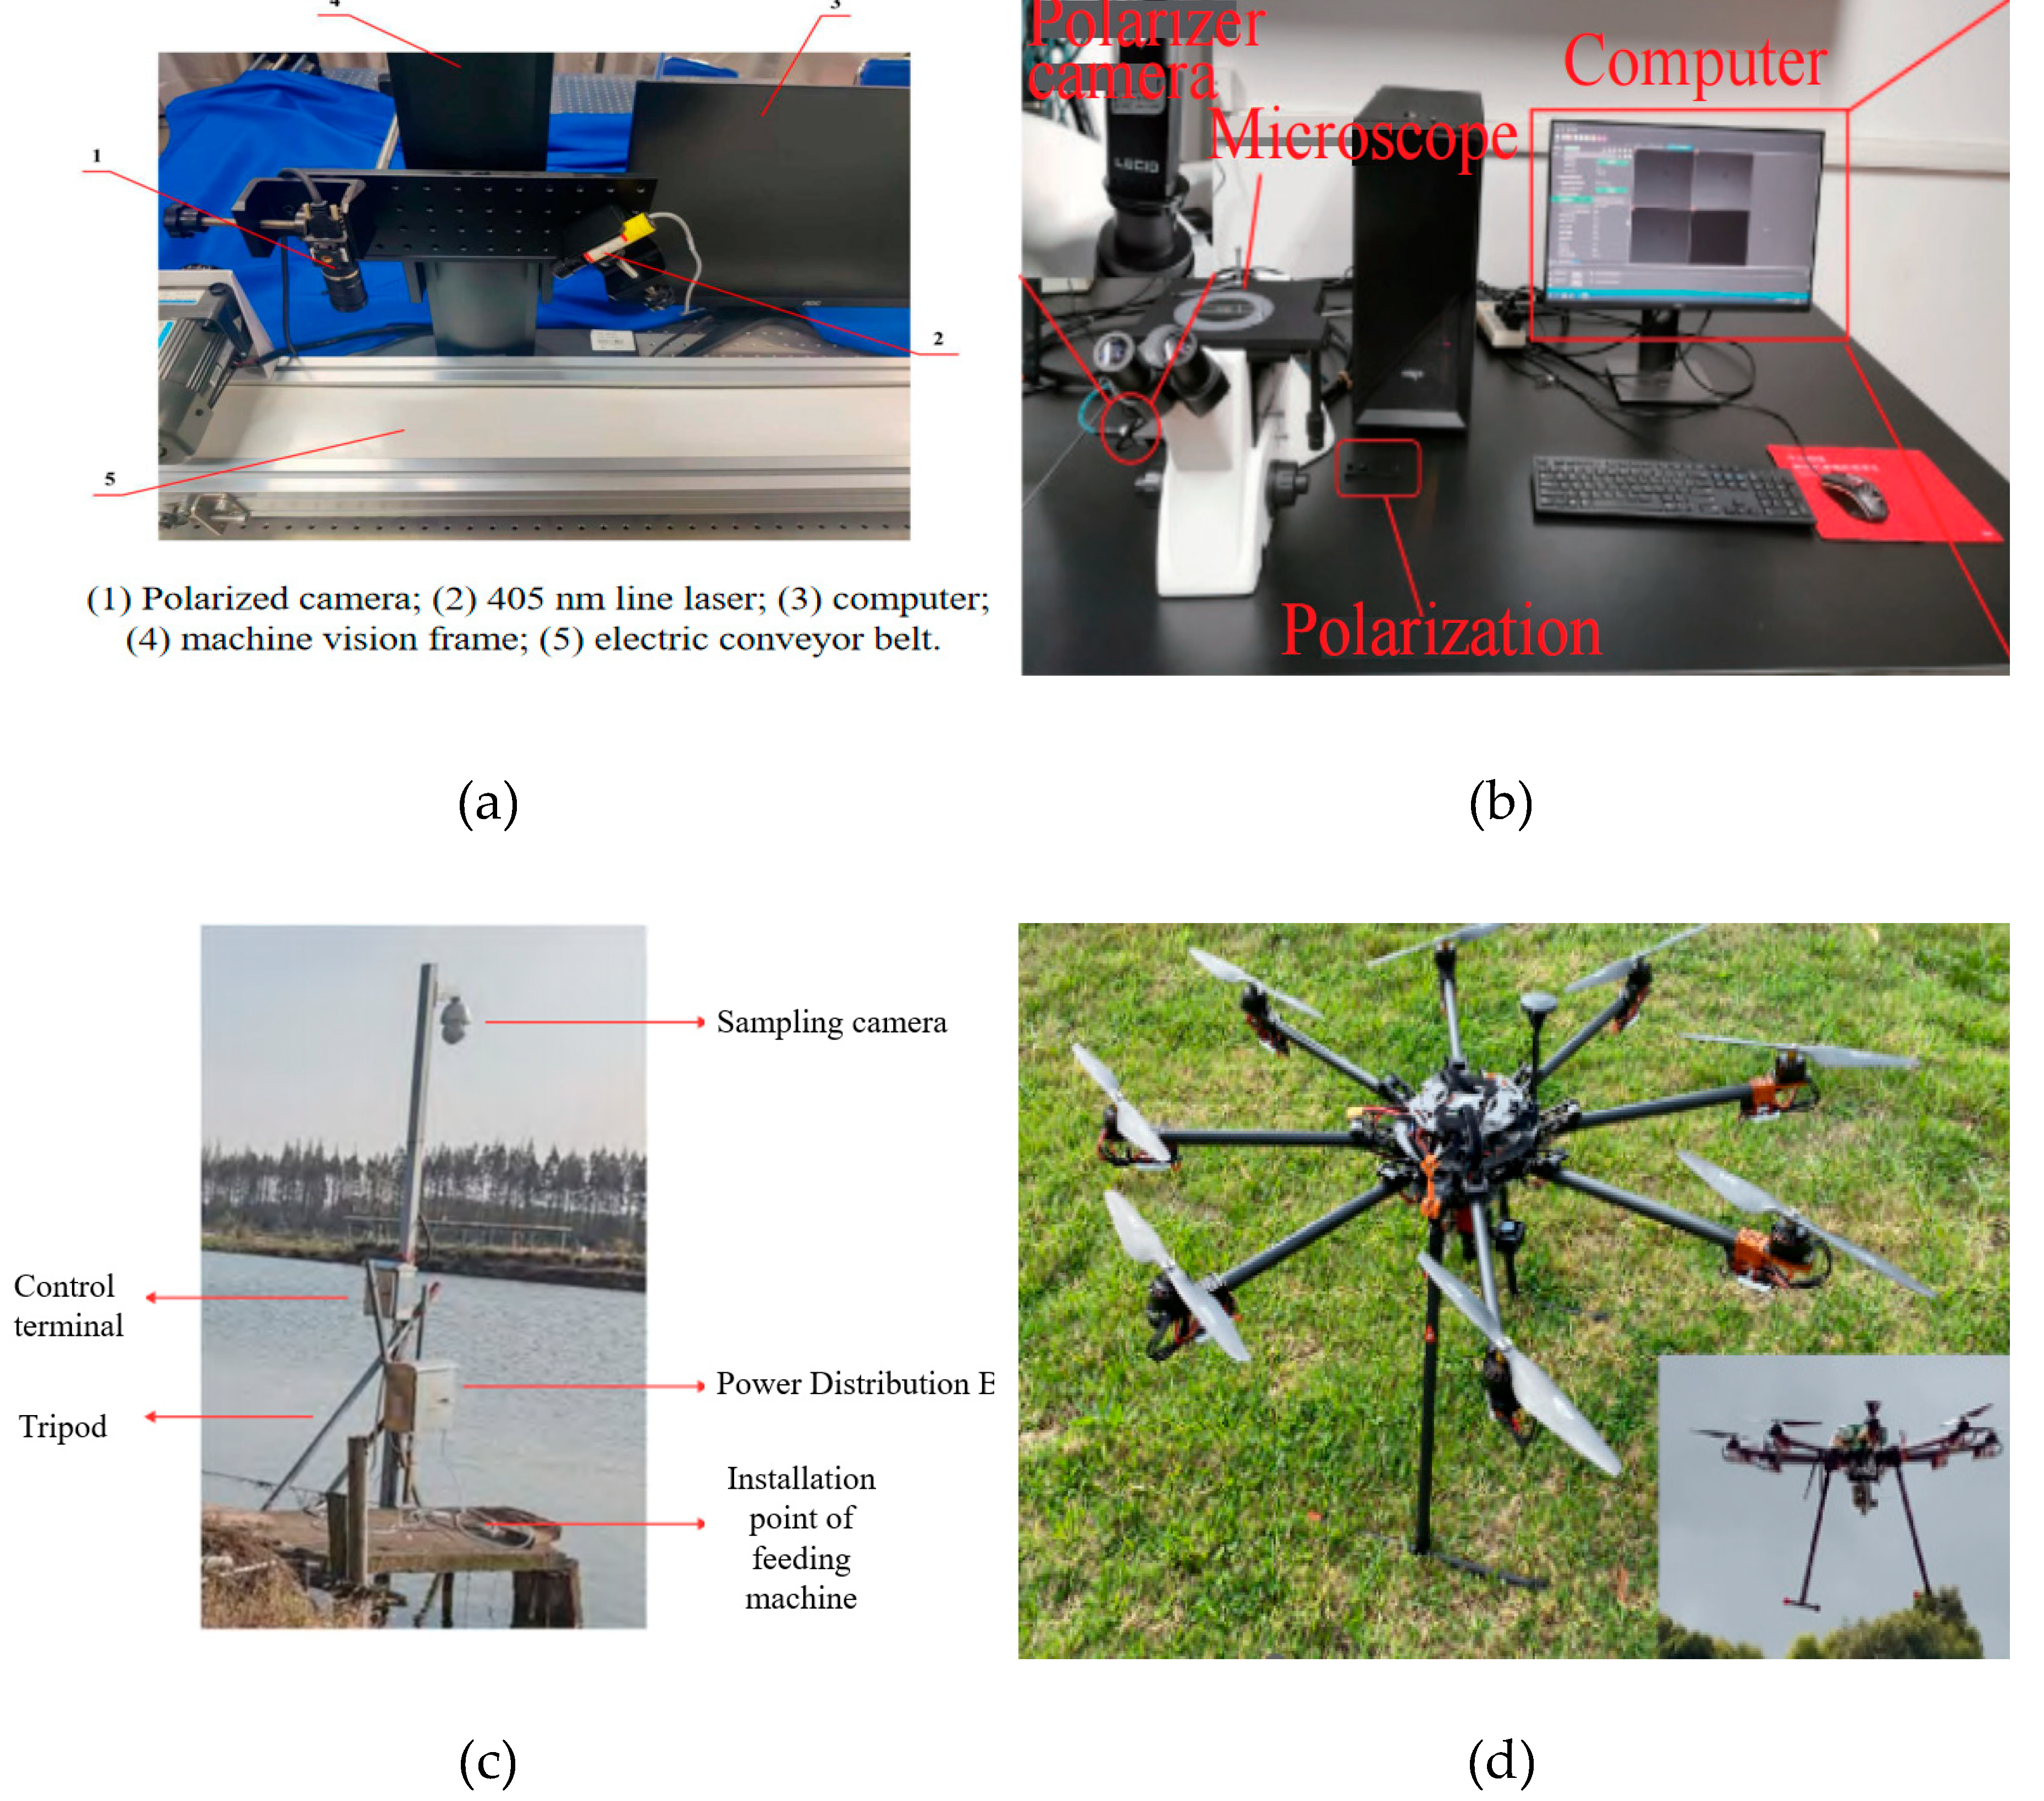
Figure 5.
Polarization principle diagram.
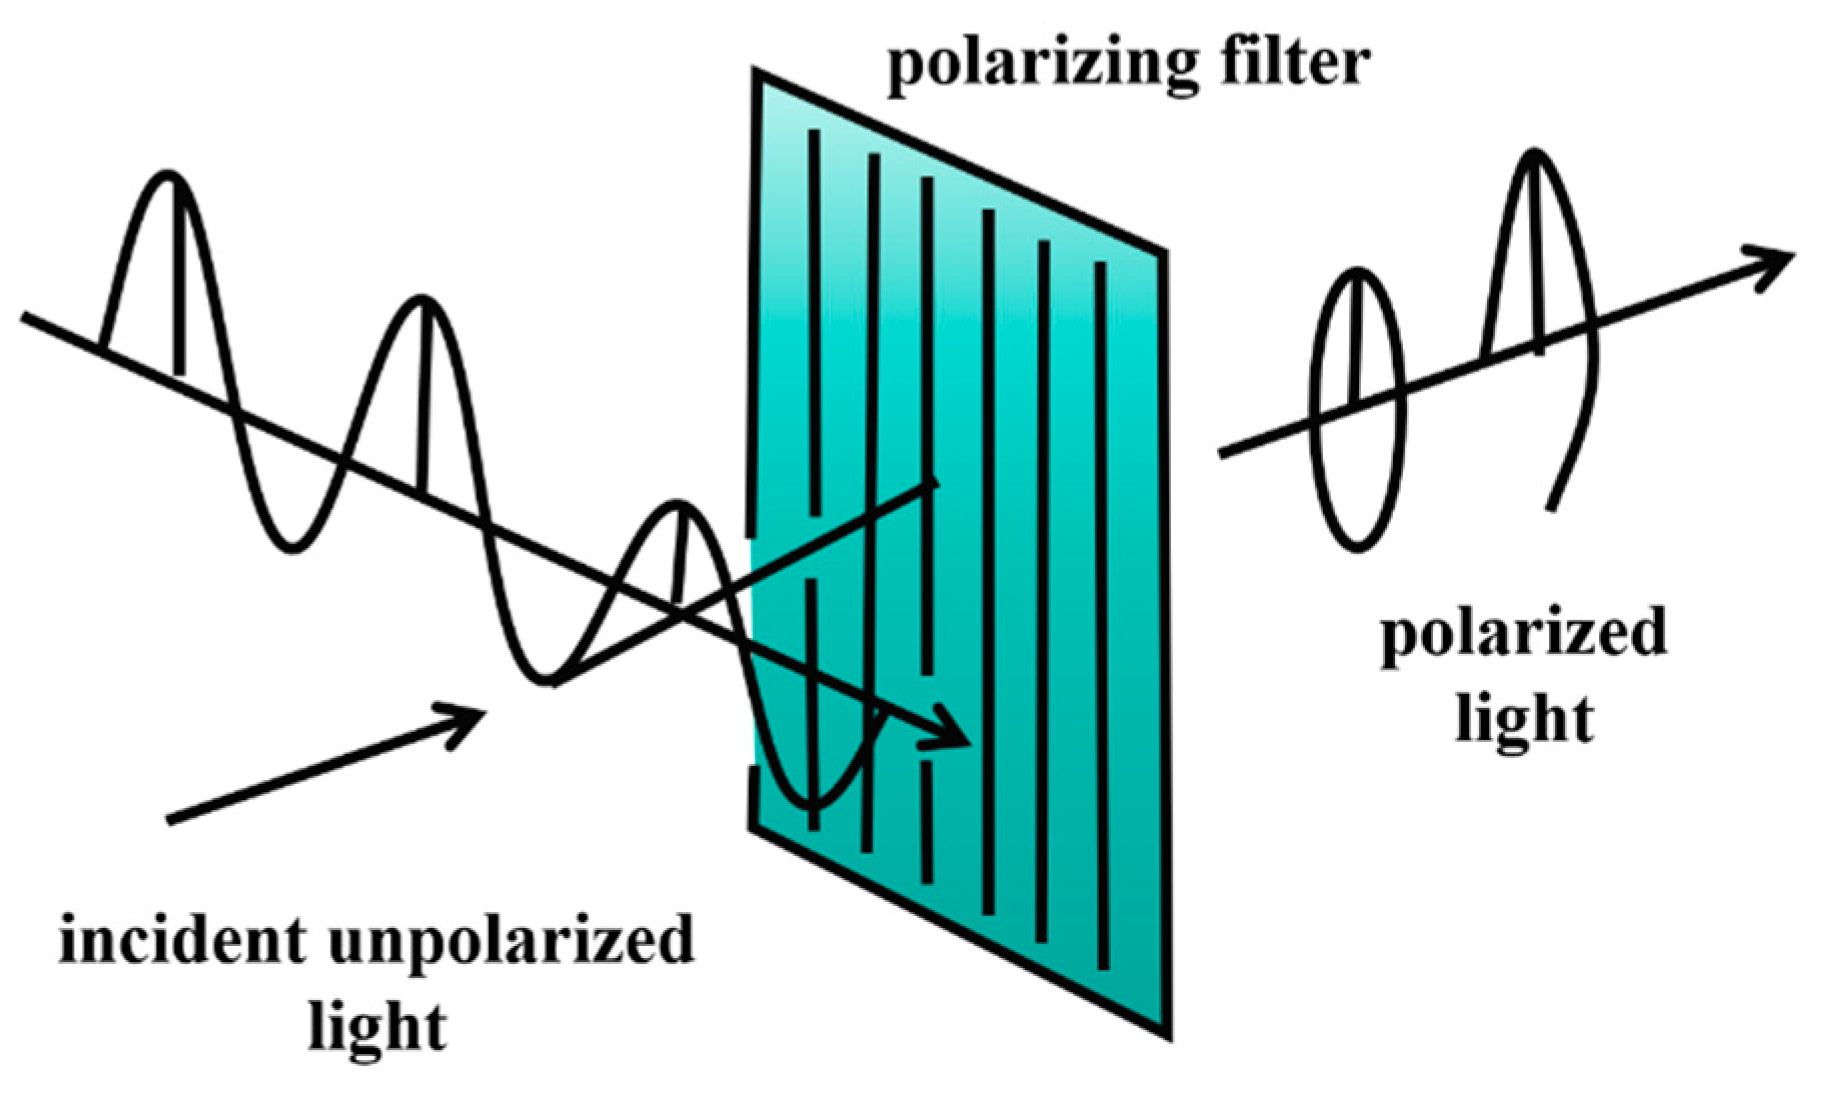
Figure 6.
Fitting image of polarization degree with zenith angle variation. [52].
Figure 6.
Fitting image of polarization degree with zenith angle variation. [52].
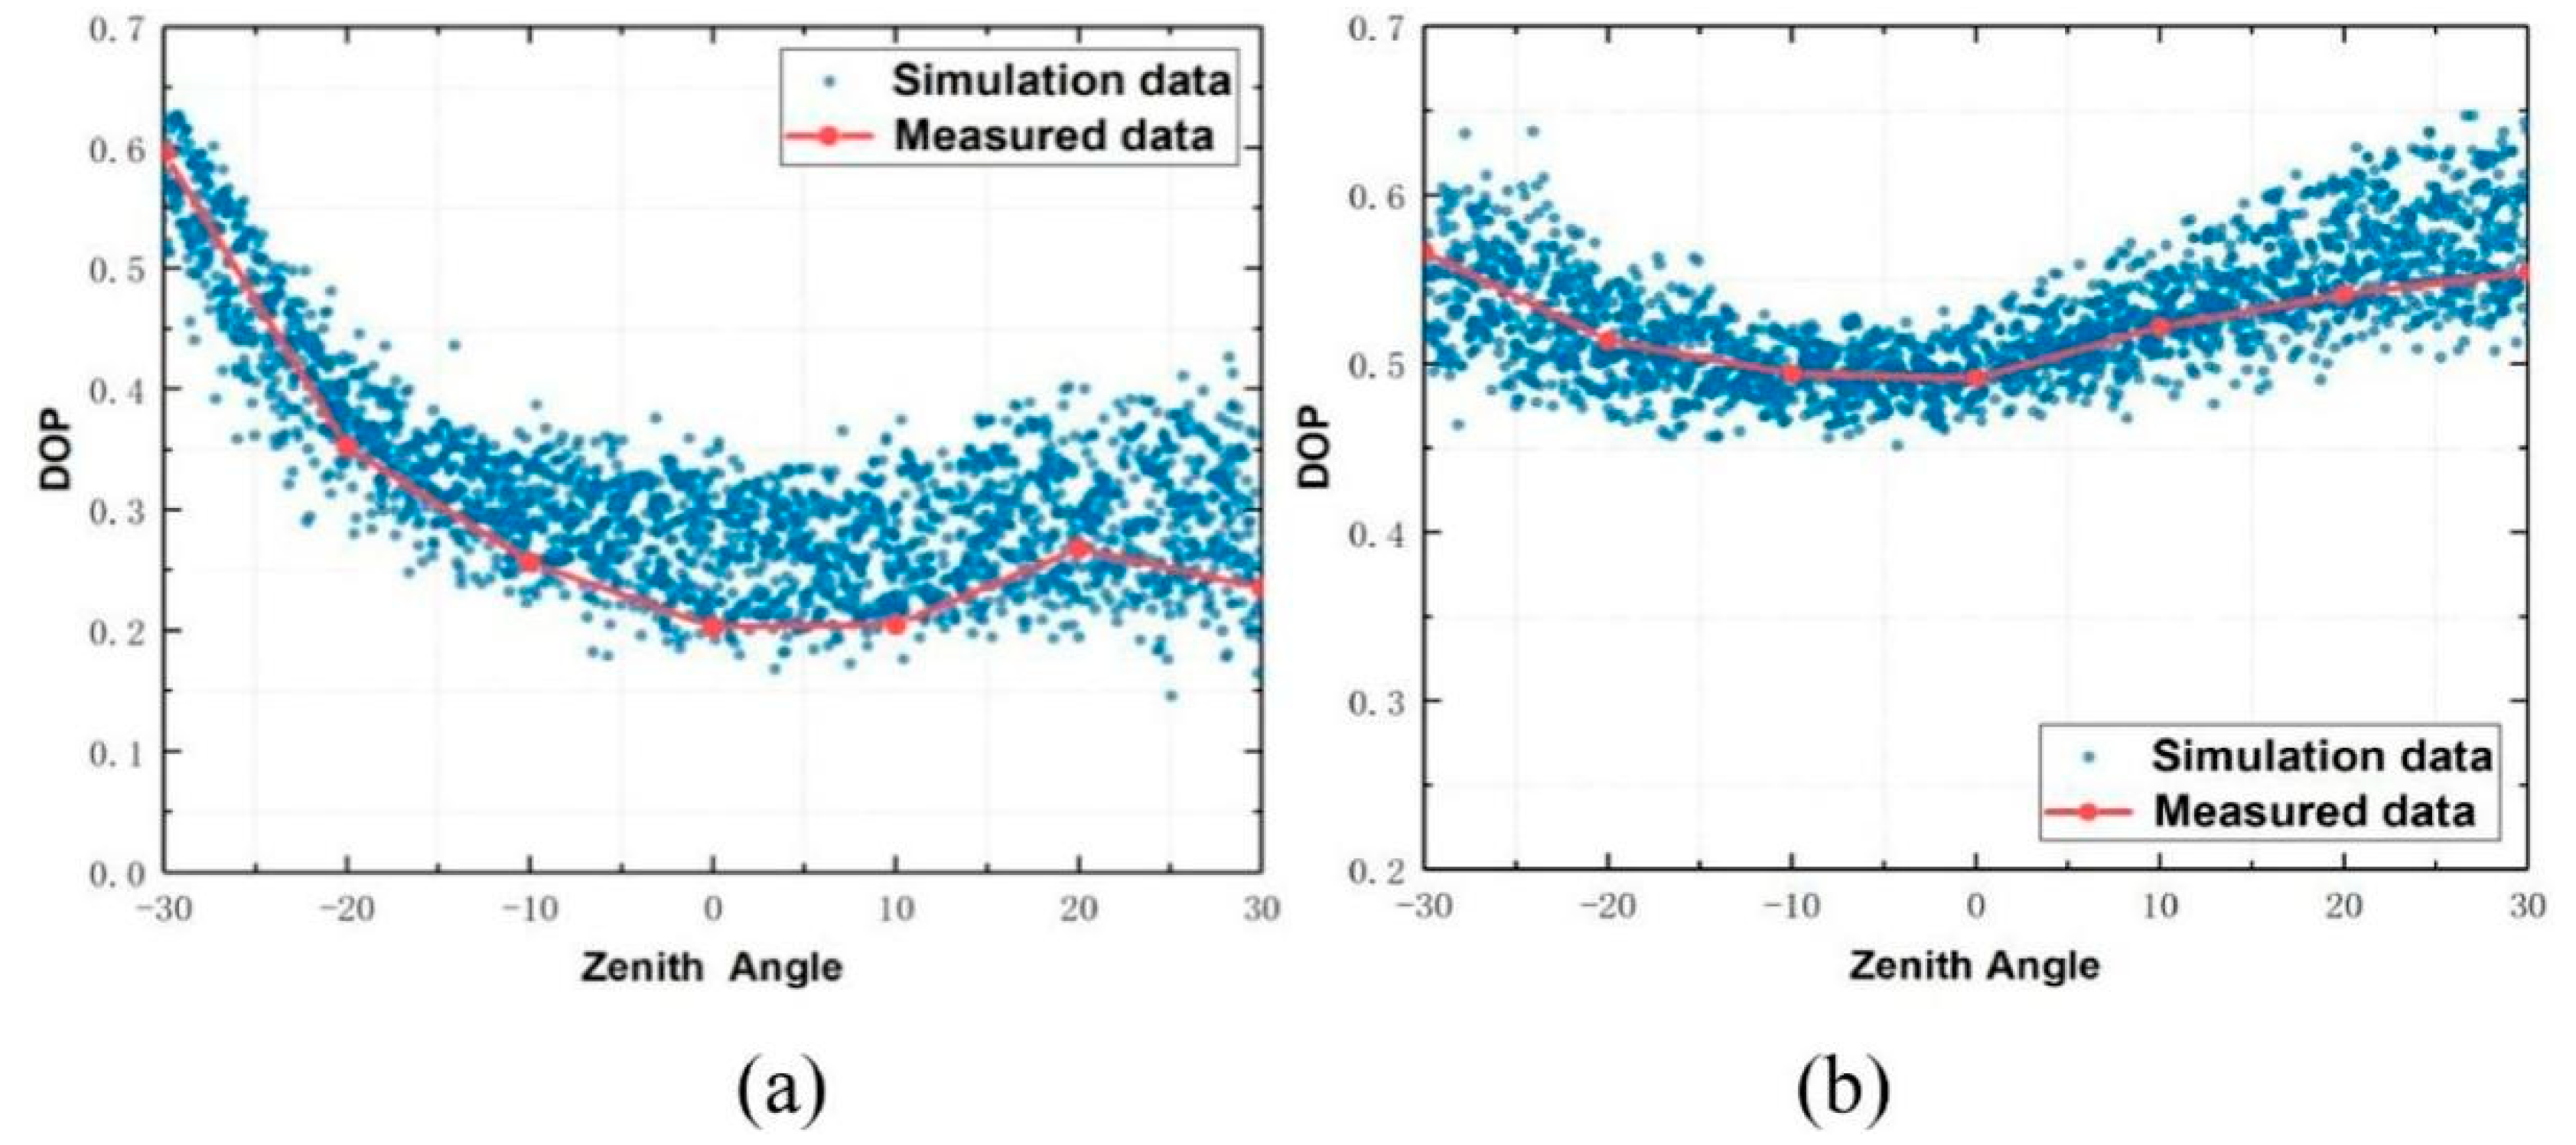
Figure 7.
Optical images and corresponding local deflection index images of leaves with different water contents [84].
Figure 7.
Optical images and corresponding local deflection index images of leaves with different water contents [84].
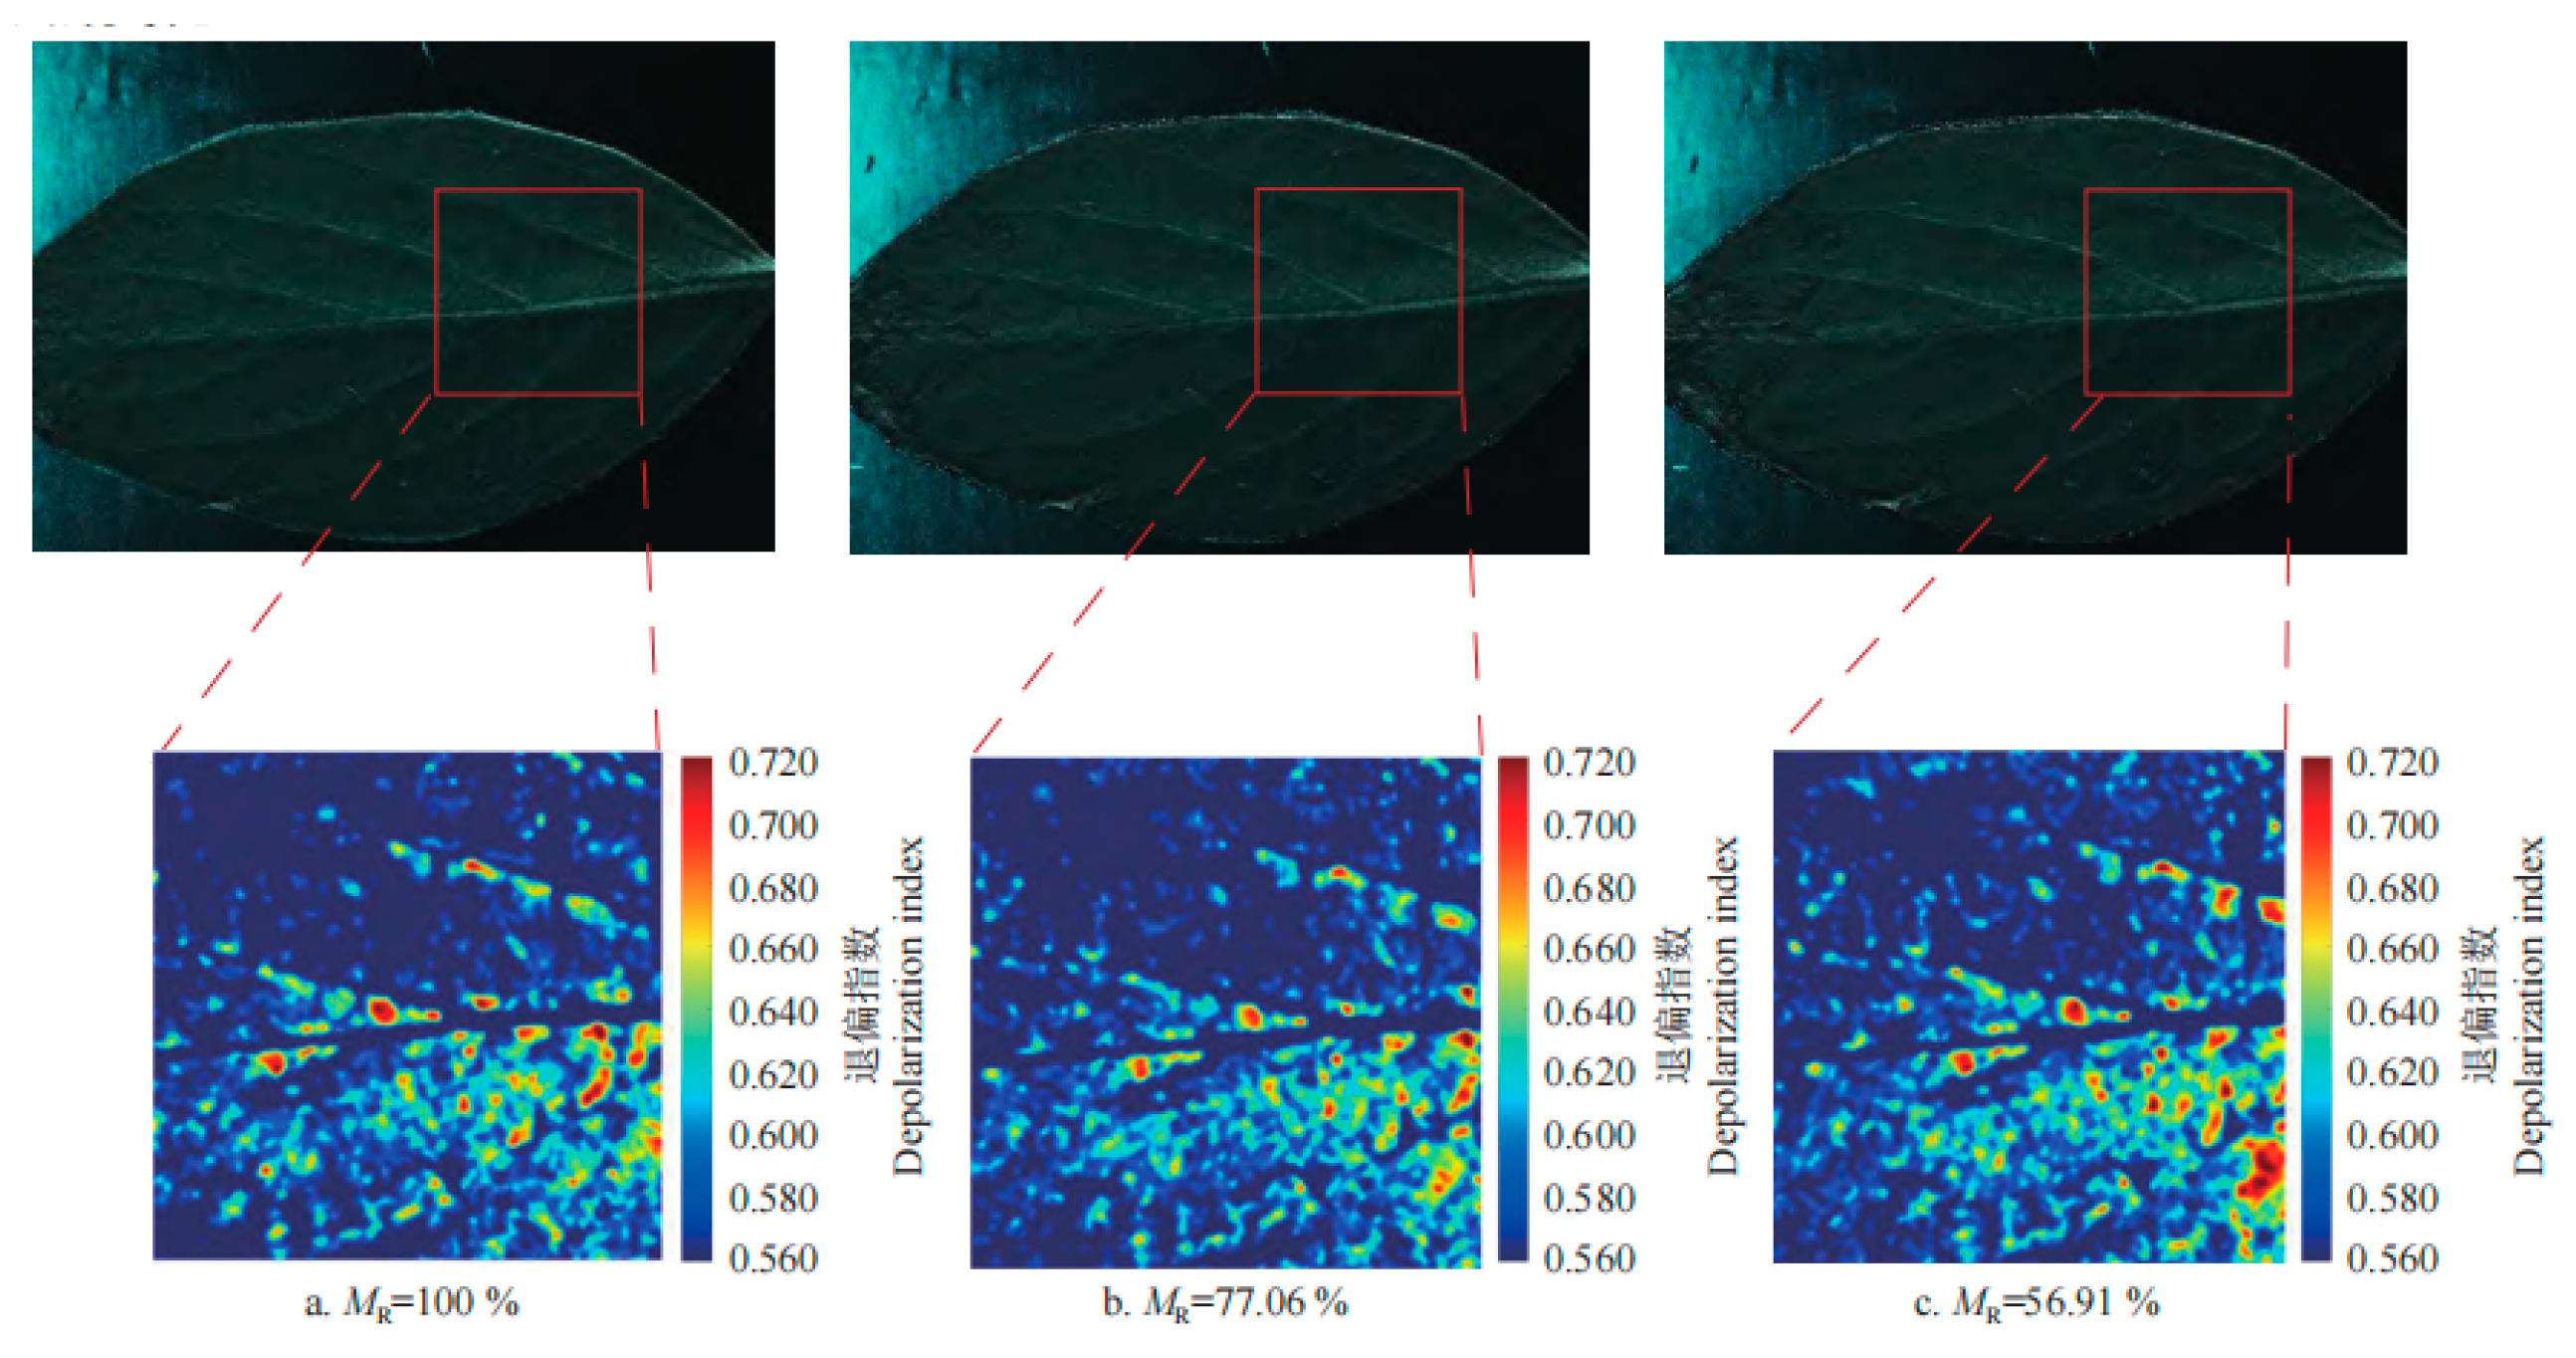
Figure 8.
Measurement of moisture content using laser polarization system (a) Optical path of laser polarization imaging measurement system [95]. (b) Optical path of the polarized active imaging system [96].

Figure 9.
(a) Laboratory measurements. (b) System diagram of measurements in the principal plane, where φv=180∘ corresponds to the forward scattering direction. SZA and VZA correspond to SZA and VZA, respectively. (c)–(e) Multiangle photometric and polarimetric measurements under different incident conditions in the principal plane in the field. The two ASD spectrometers are used to measure photometric and polarimetric signals from leaves and to measure the reflected radiance from a Spectralon panel with the same measurement geometry, respectively [99].
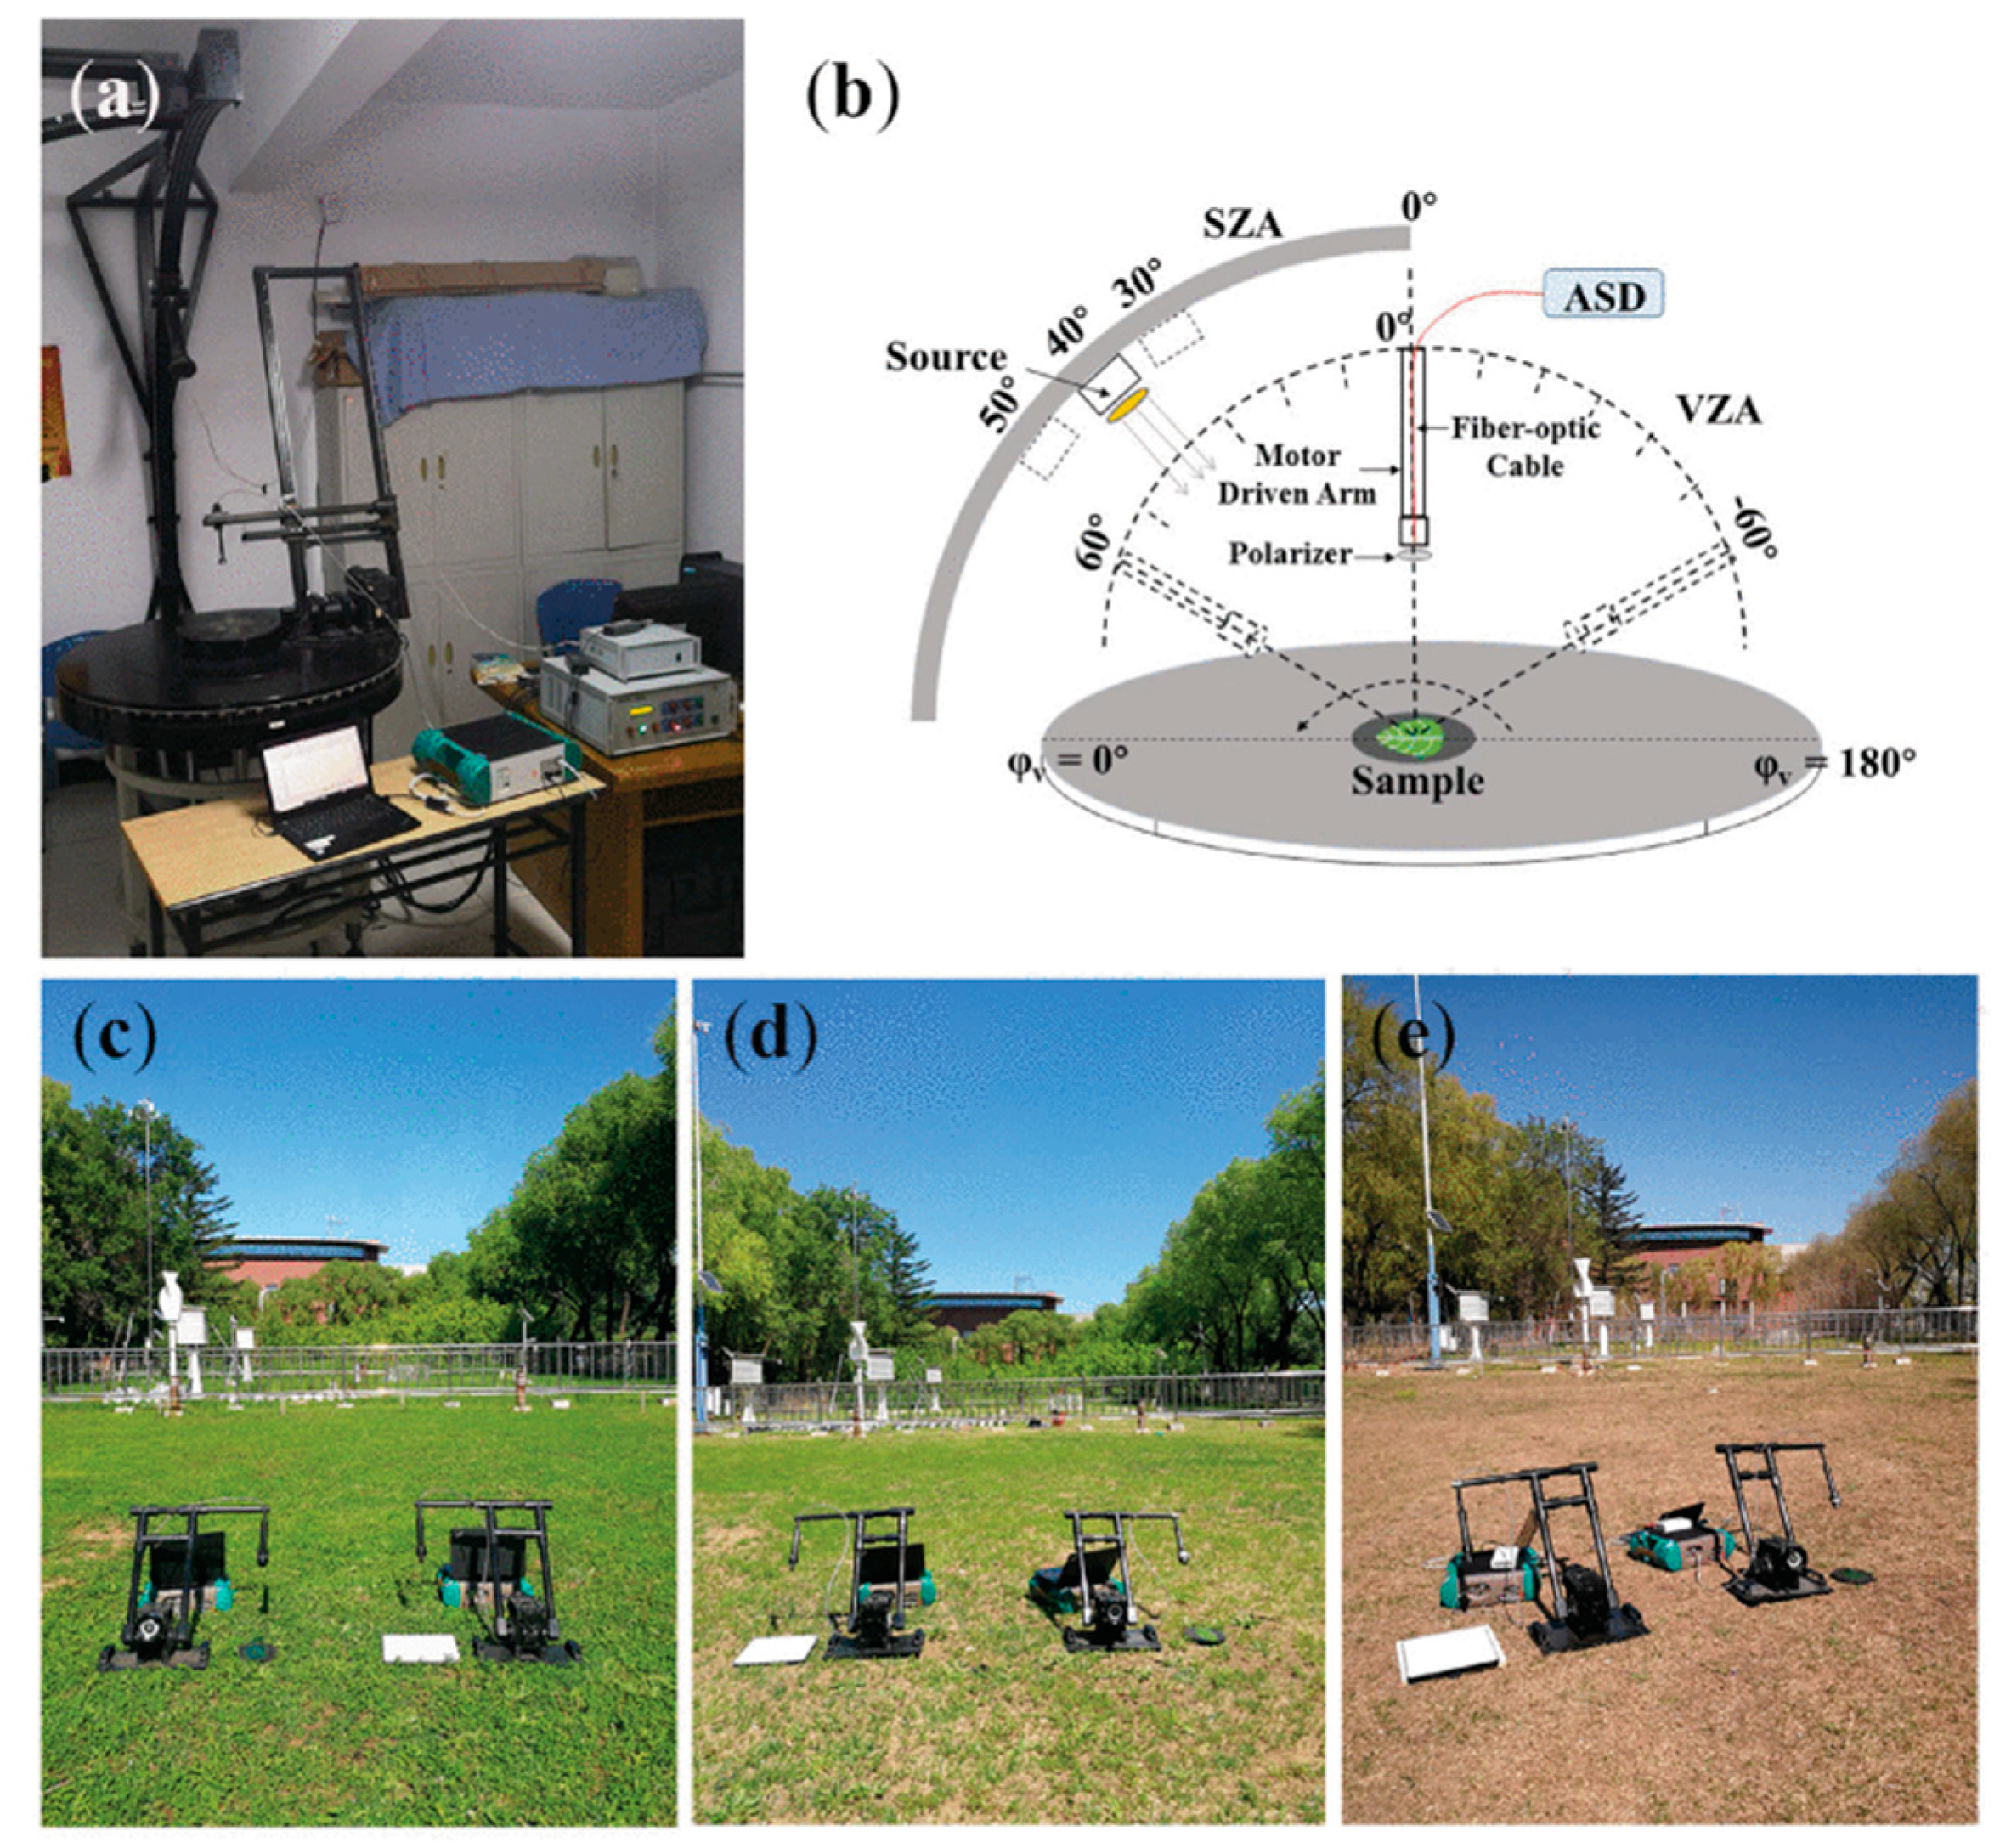
Figure 10.
Schematic diagram of multi-angle observation of rice canopy polarization spectrum [101].
Figure 10.
Schematic diagram of multi-angle observation of rice canopy polarization spectrum [101].
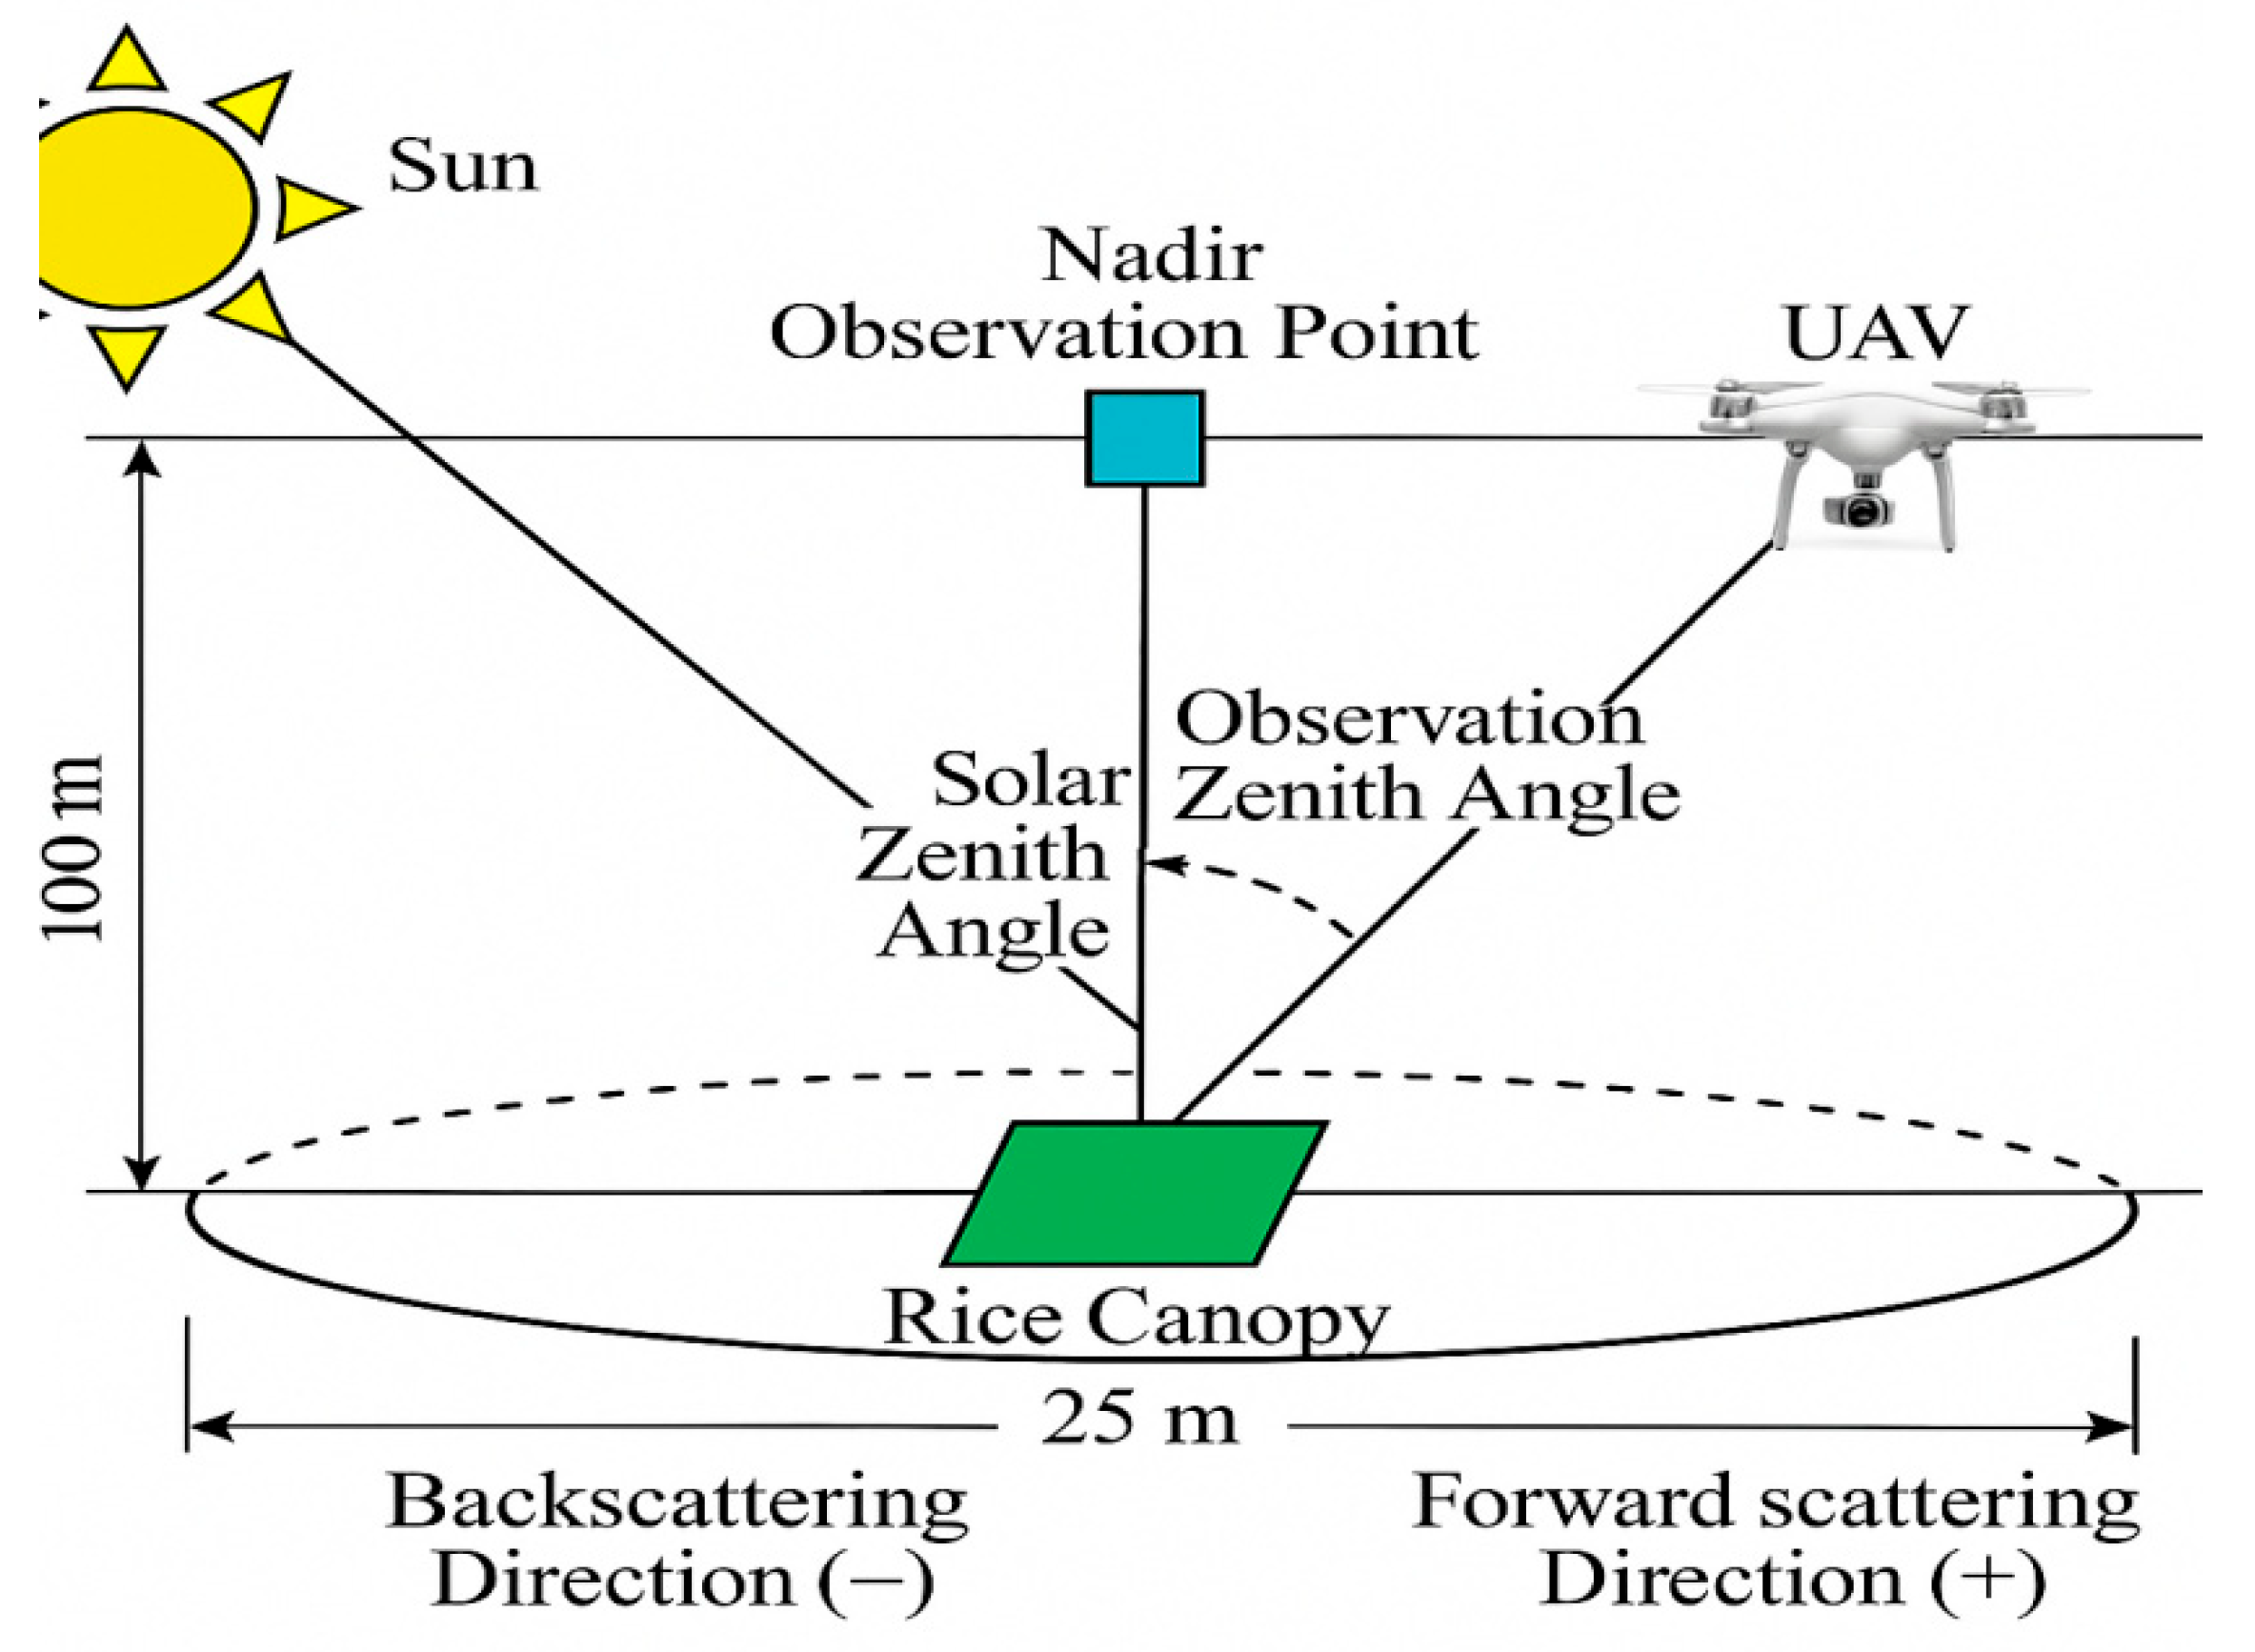
Figure 11.
Relative light intensity distribution of polarization images of diseased spores [38].
Figure 11.
Relative light intensity distribution of polarization images of diseased spores [38].
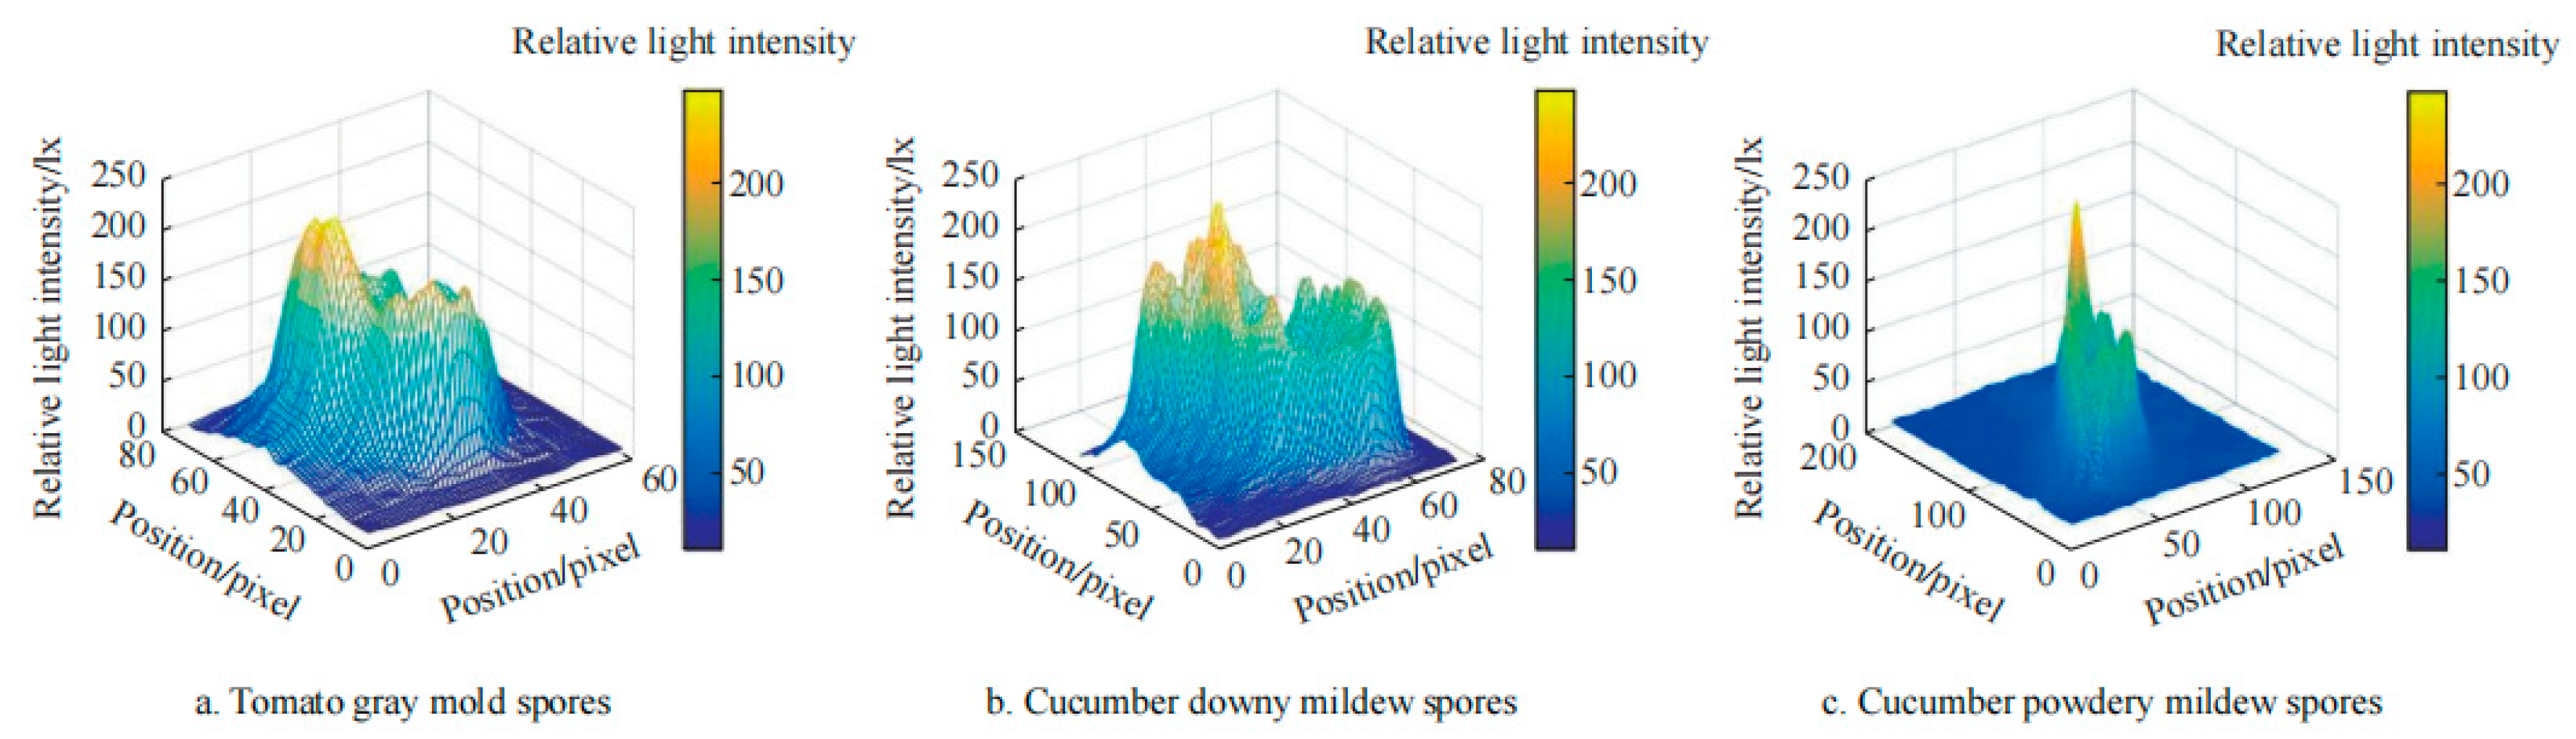
Figure 12.
Structure diagram of polarization measurement system [119].
Figure 12.
Structure diagram of polarization measurement system [119].
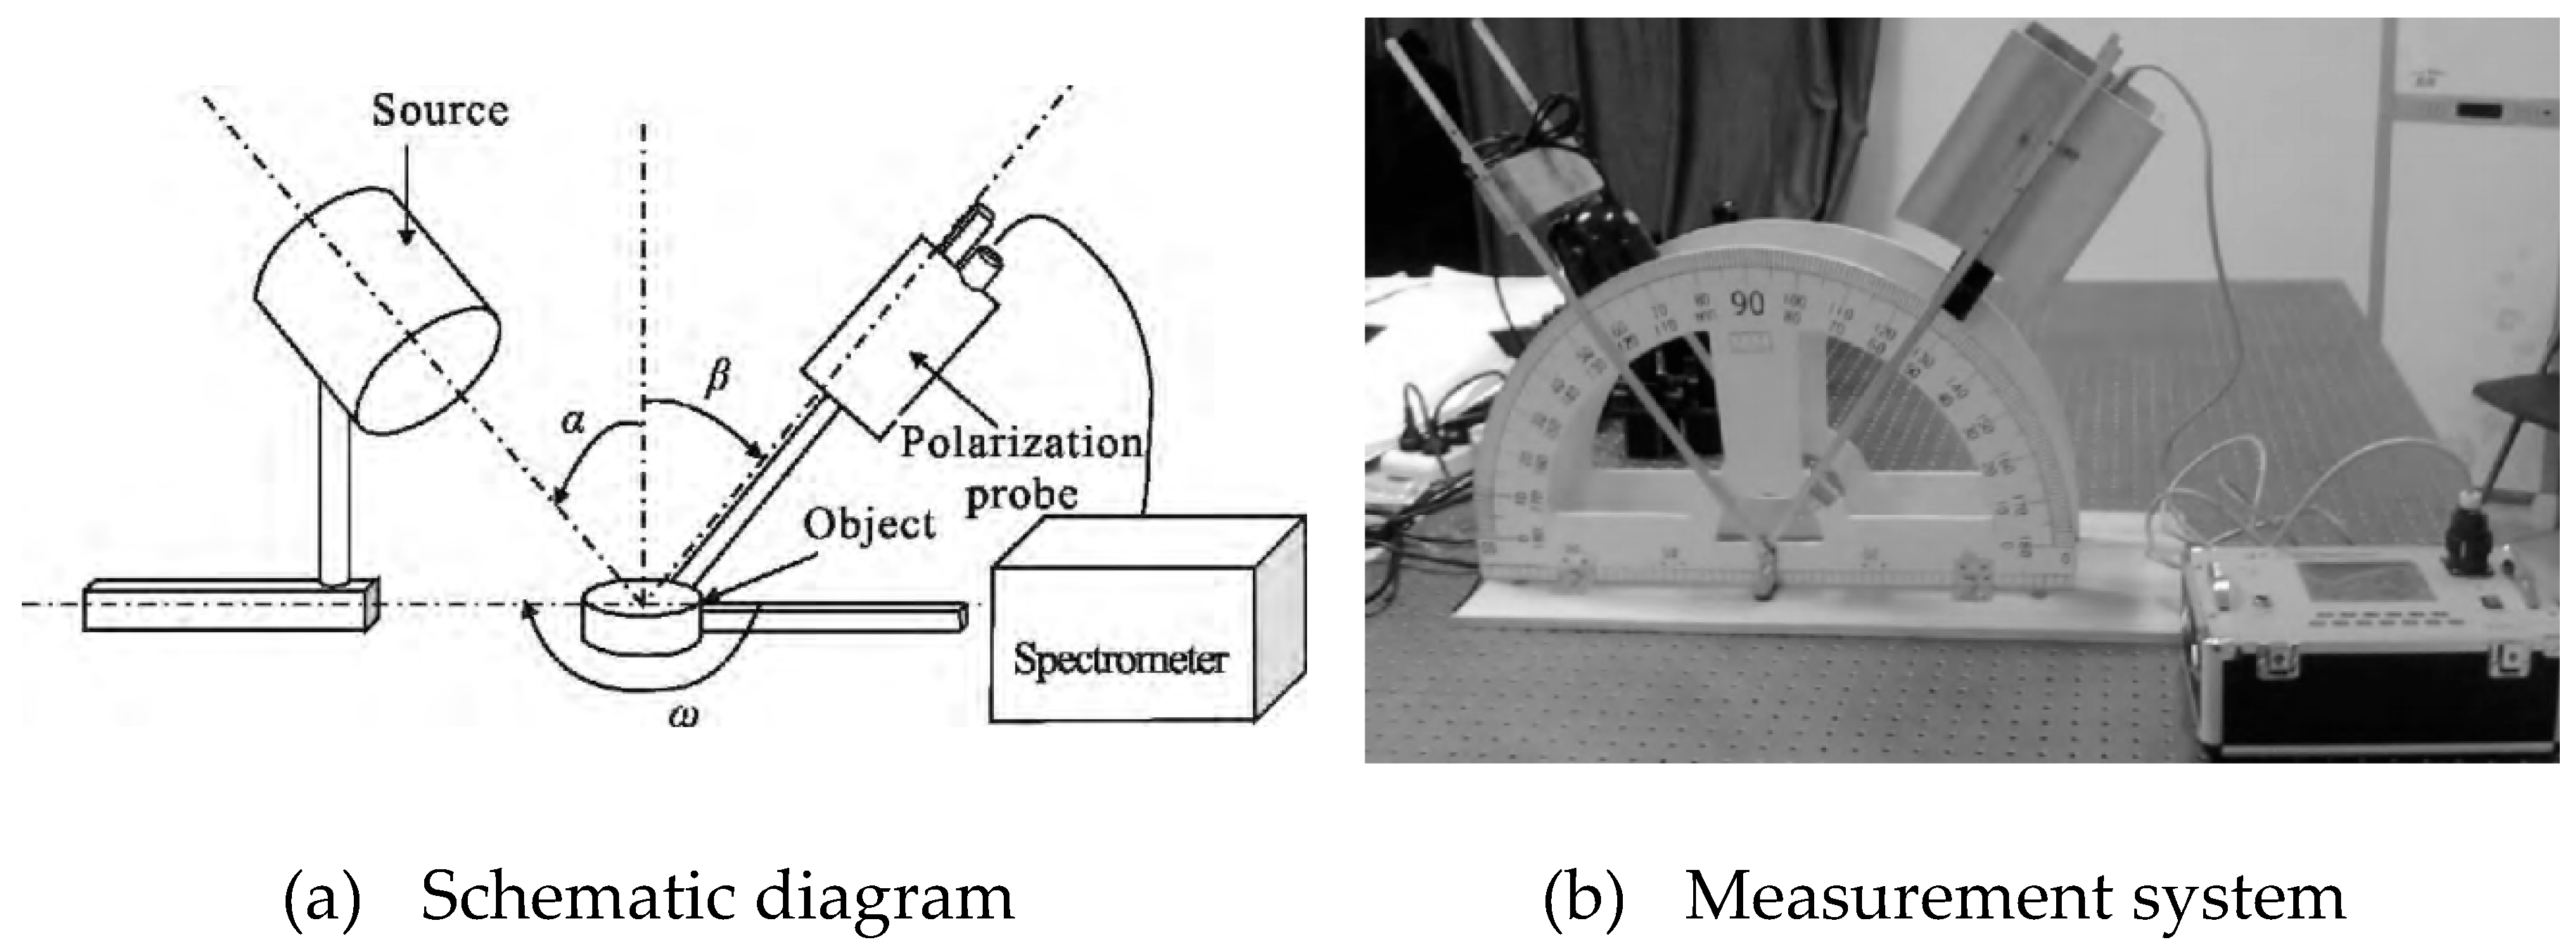
Figure 13.
Schematic Diagram of Experimental Setups for LIBS and PRLIBS (a) Schematic diagram of LIBS polarization experimental system [123] (b) The experimental system of PRLIBS [124].
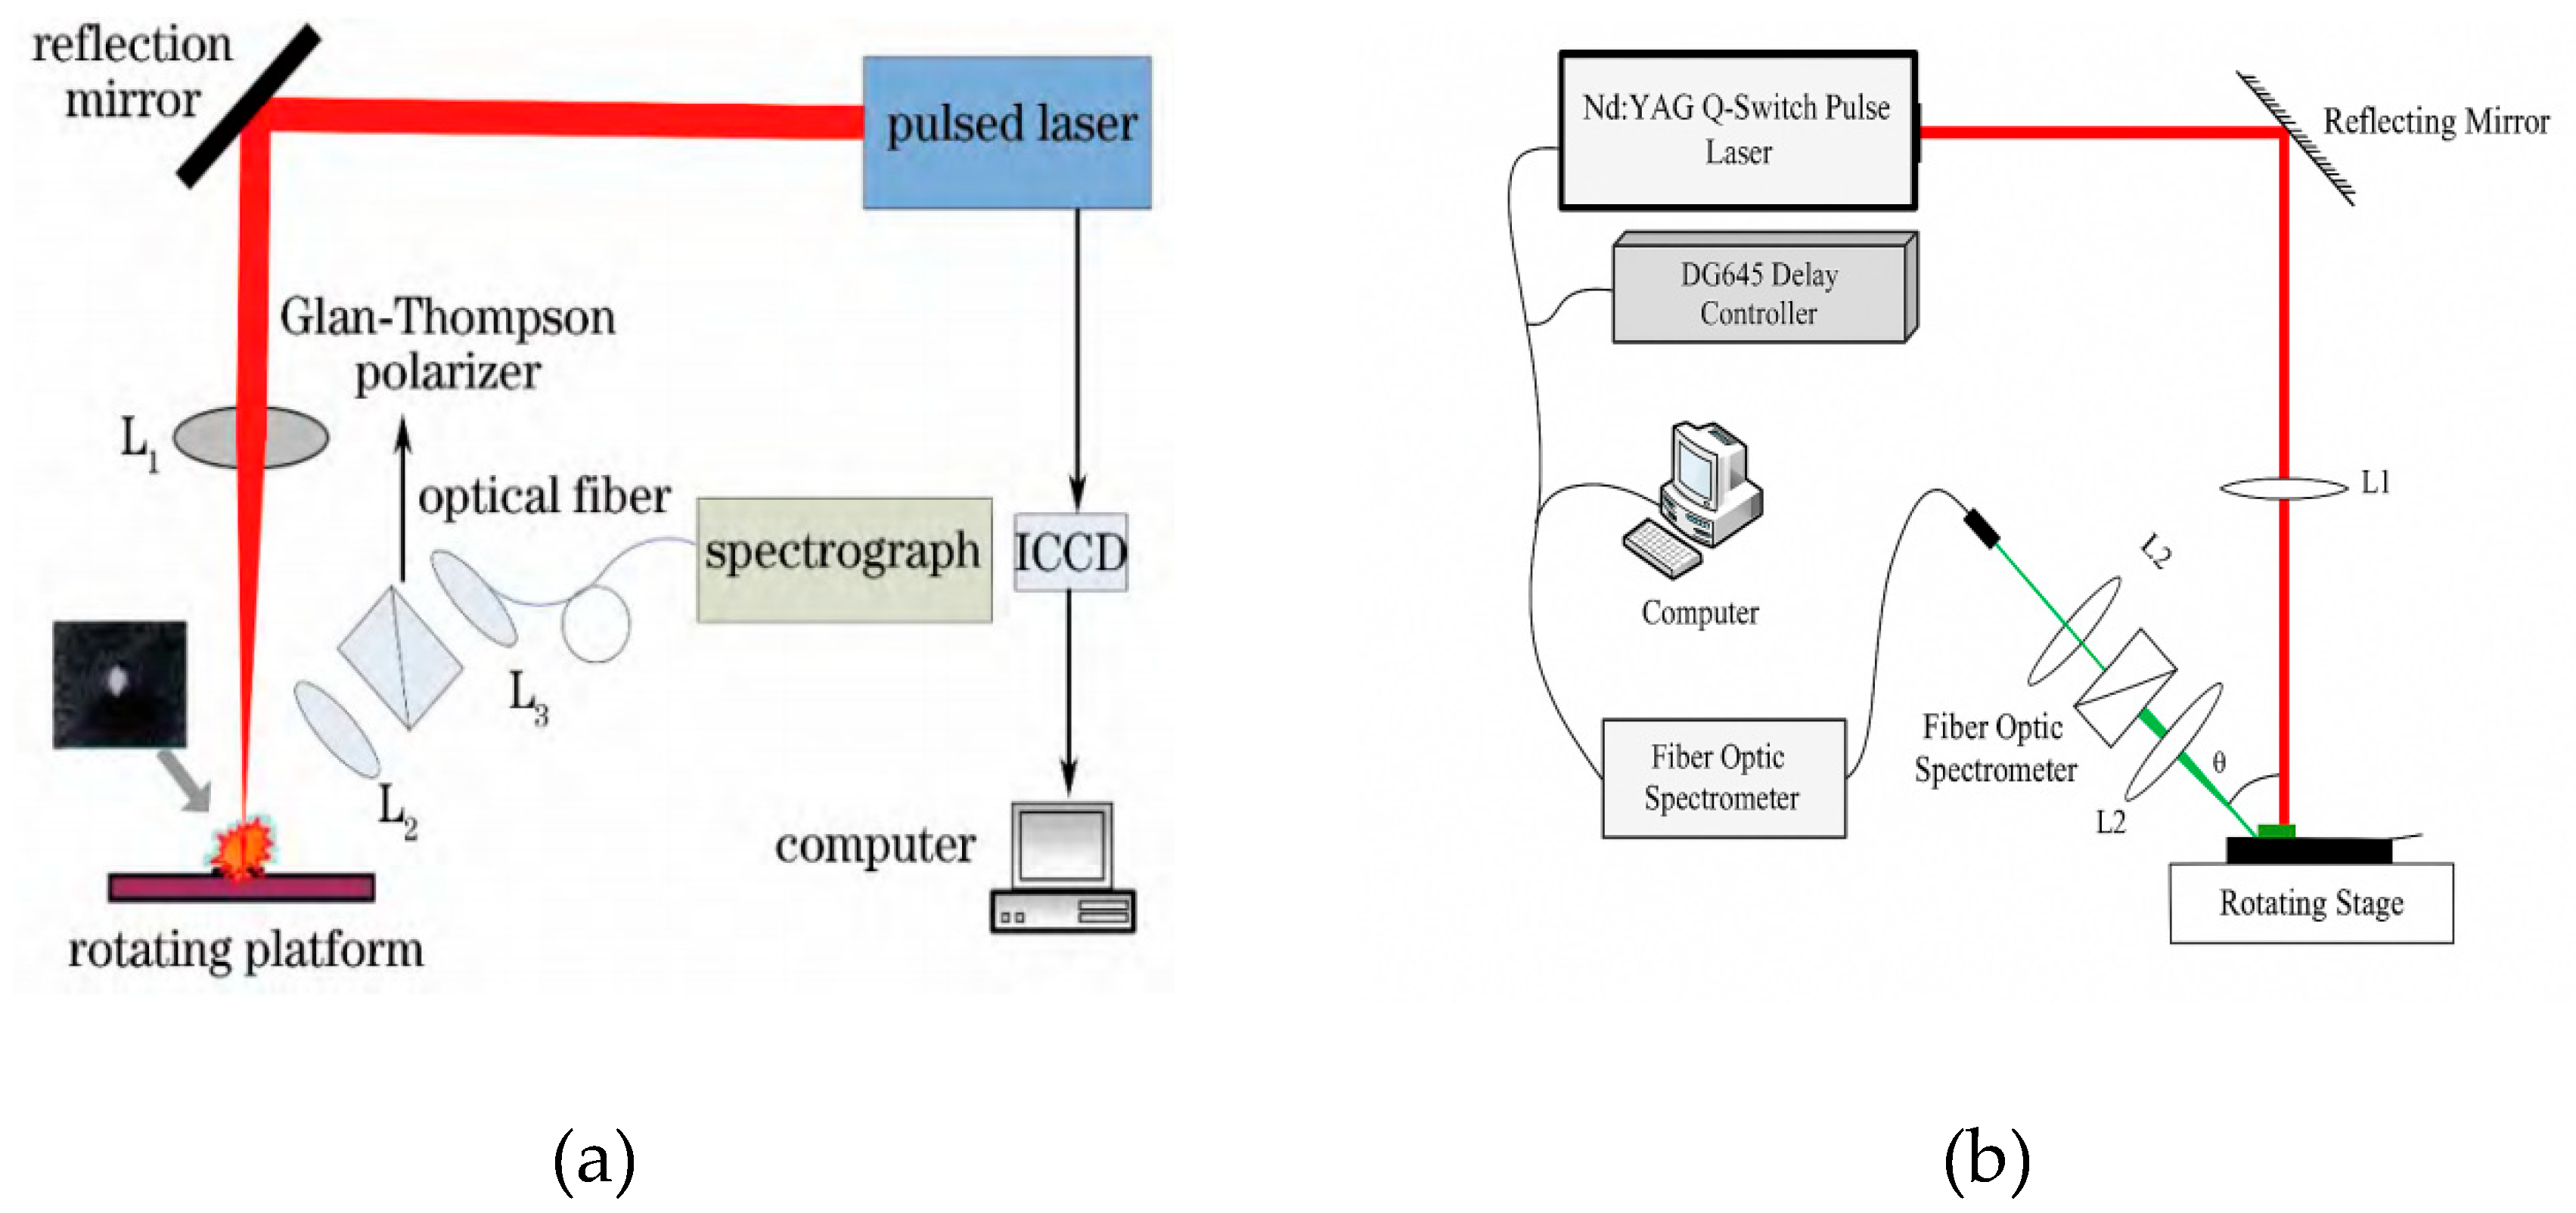
Figure 14.
Polarized multispectral low-light-level imaging system [146].
Figure 14.
Polarized multispectral low-light-level imaging system [146].
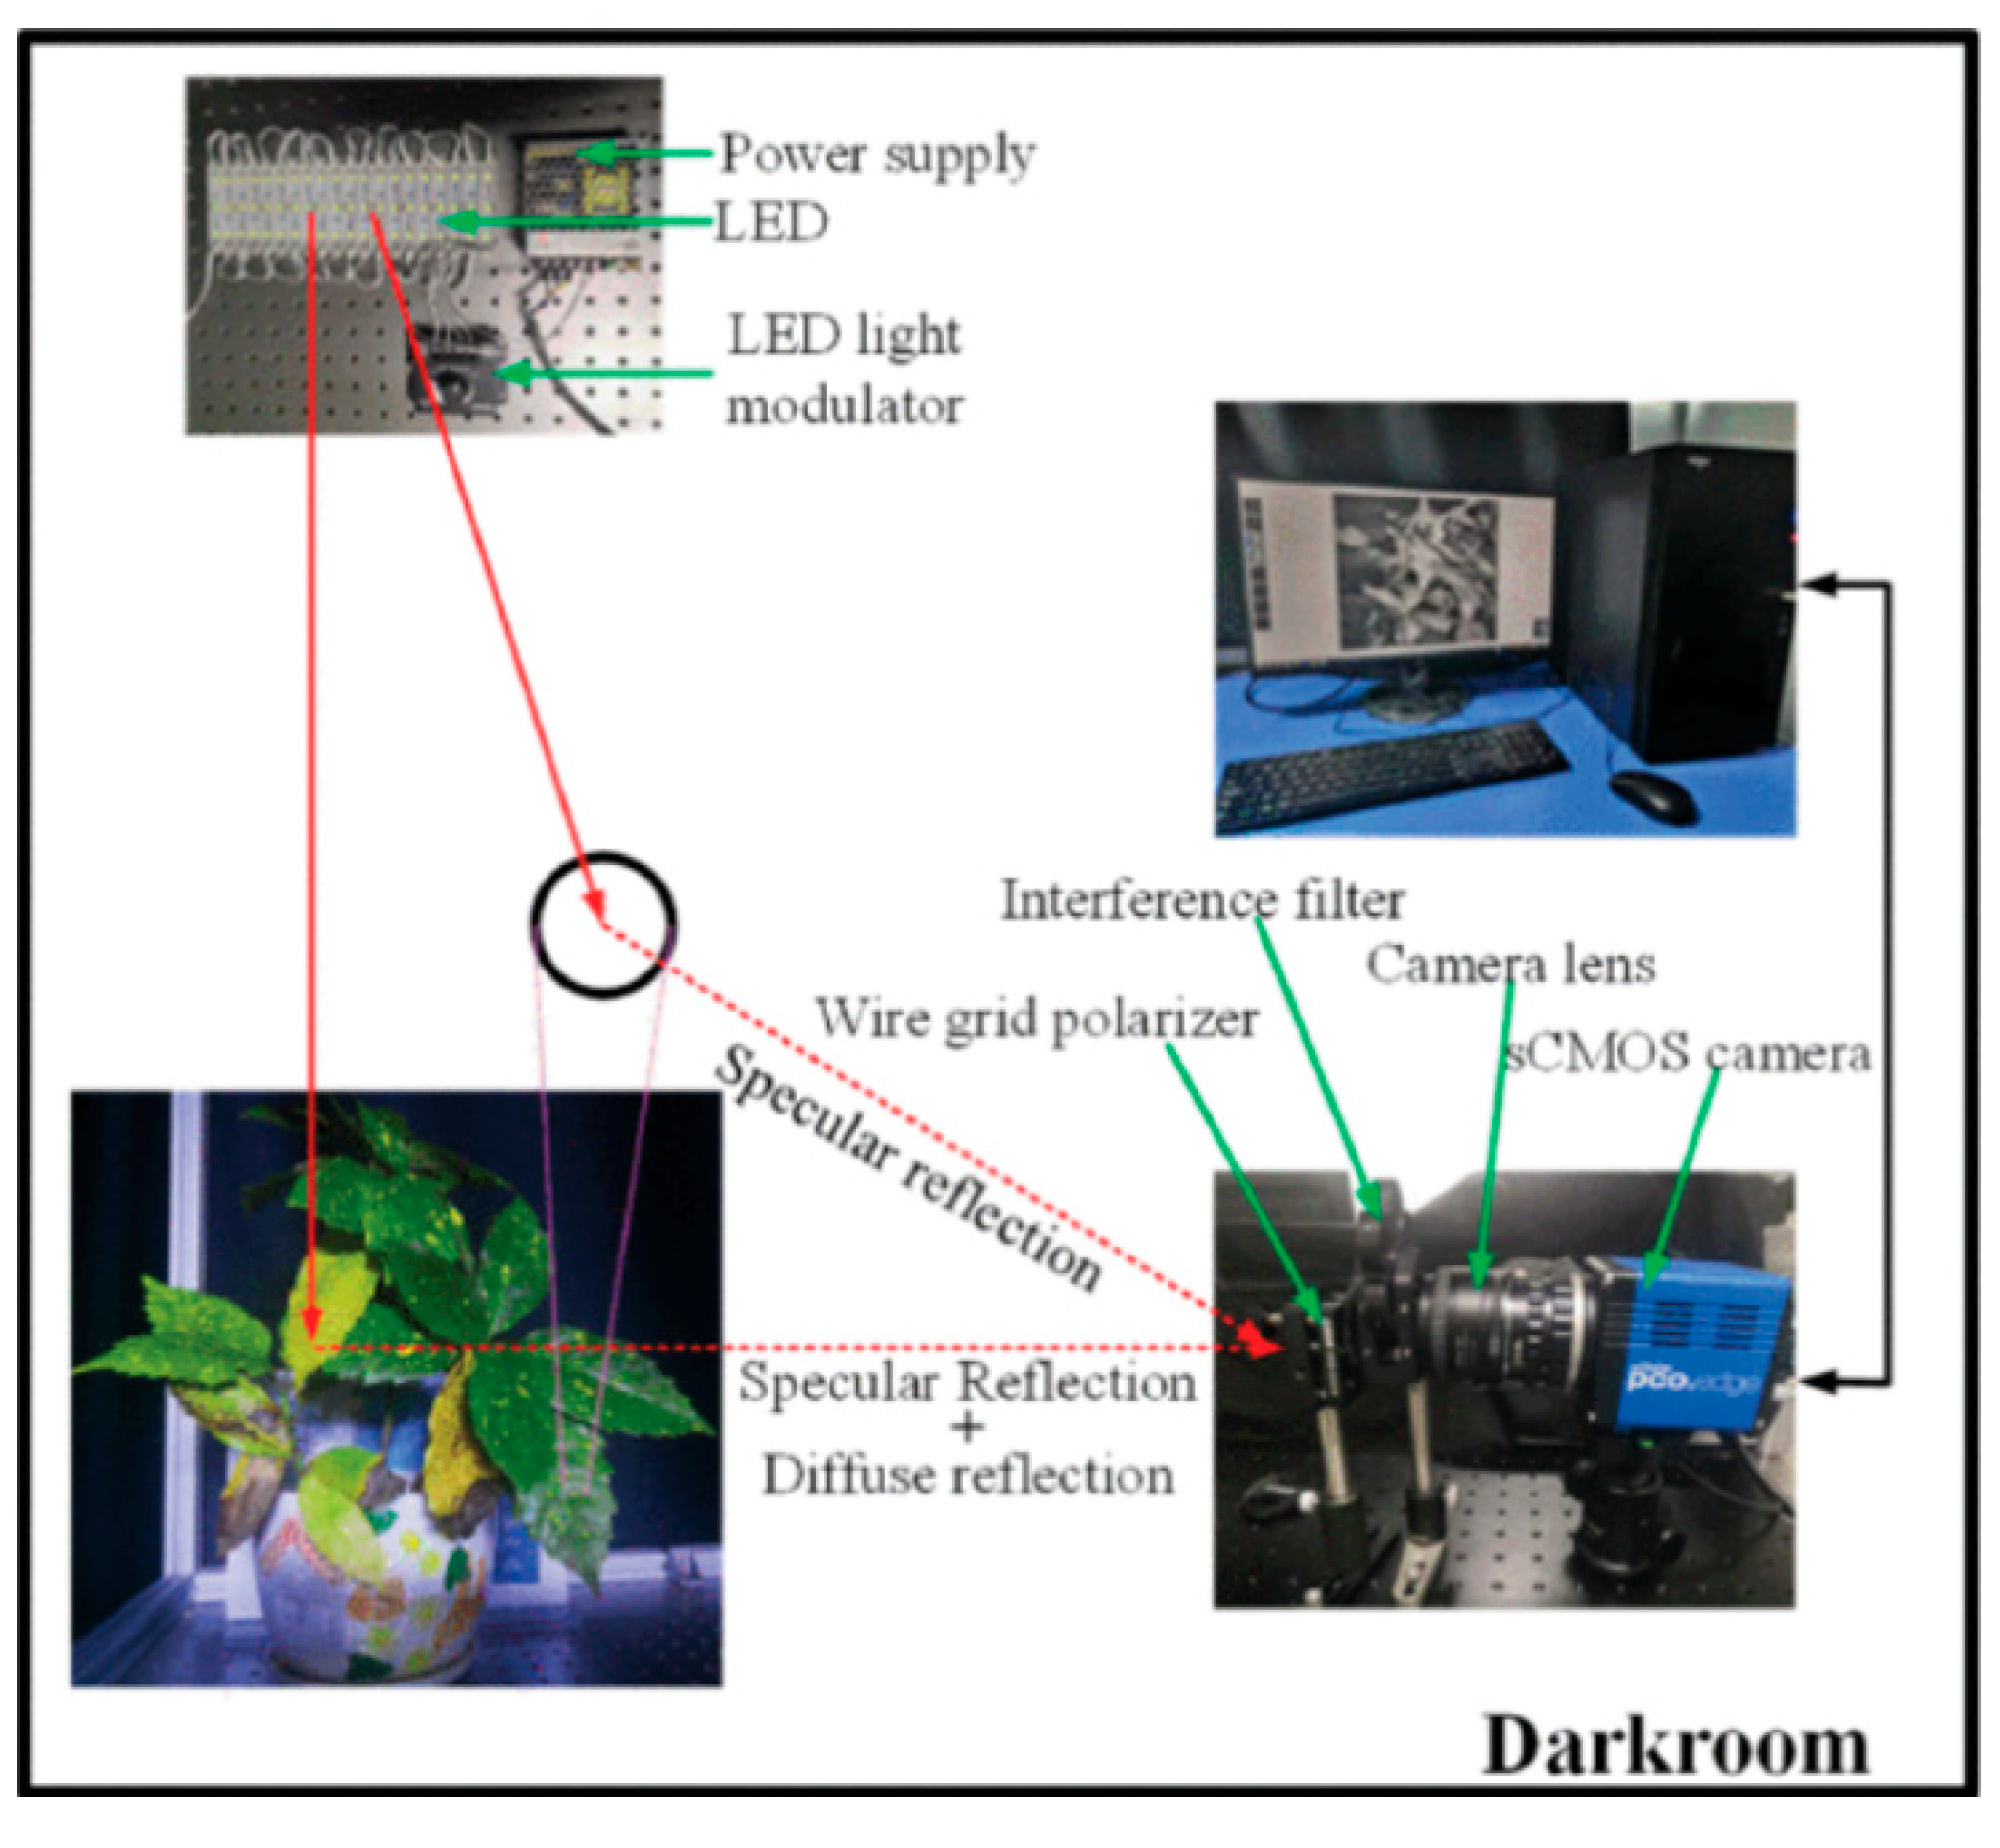
Figure 15.
(a) Indoor polarization multispectral system of low illumination imaging system. (b) Outdoor polarization multispectral system of low illumination imaging system [83].
Figure 15.
(a) Indoor polarization multispectral system of low illumination imaging system. (b) Outdoor polarization multispectral system of low illumination imaging system [83].
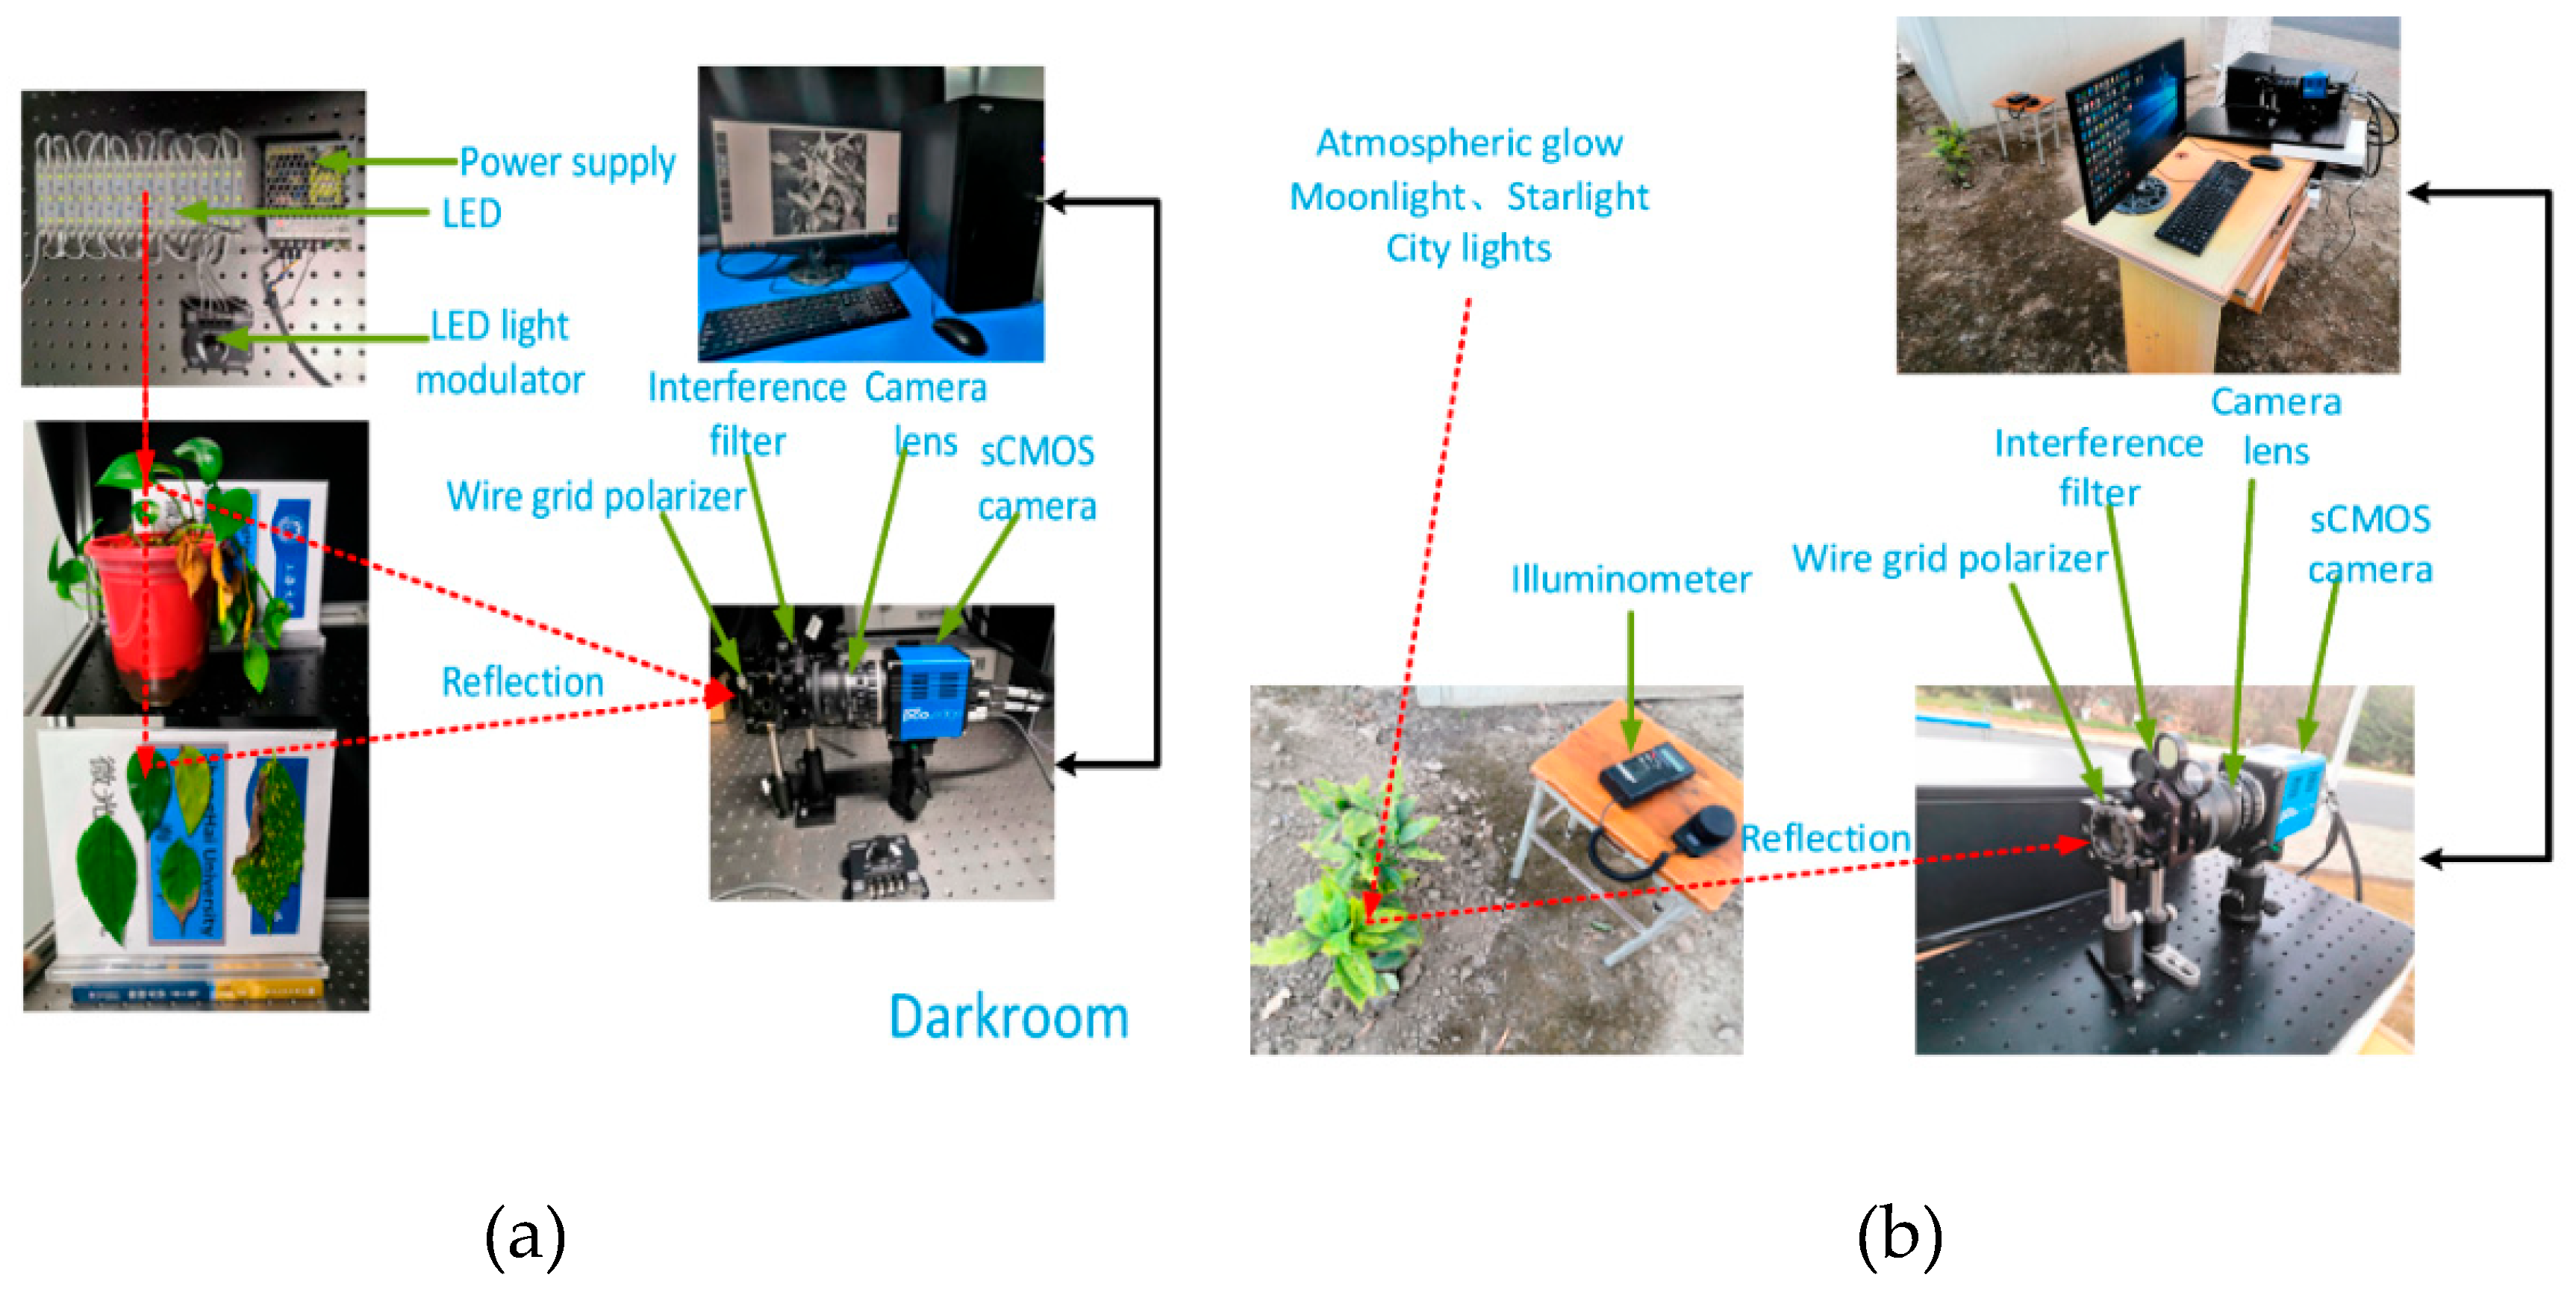
Figure 16.
Photos and GF-1 images of PMF in Ji Zhou and Guyuan: (a) on-site photos of PMF in Ji Zhou and GuyuanGuyuan; (b) PMF site photo of Ji Zhou; (c) PMF GF-1 image of Guyuan; (d) PMF GF-1 image of Jizhou; two GF-1 images are synthesized with false color (R: NIR, G: red, B: green. [158].
Figure 16.
Photos and GF-1 images of PMF in Ji Zhou and Guyuan: (a) on-site photos of PMF in Ji Zhou and GuyuanGuyuan; (b) PMF site photo of Ji Zhou; (c) PMF GF-1 image of Guyuan; (d) PMF GF-1 image of Jizhou; two GF-1 images are synthesized with false color (R: NIR, G: red, B: green. [158].
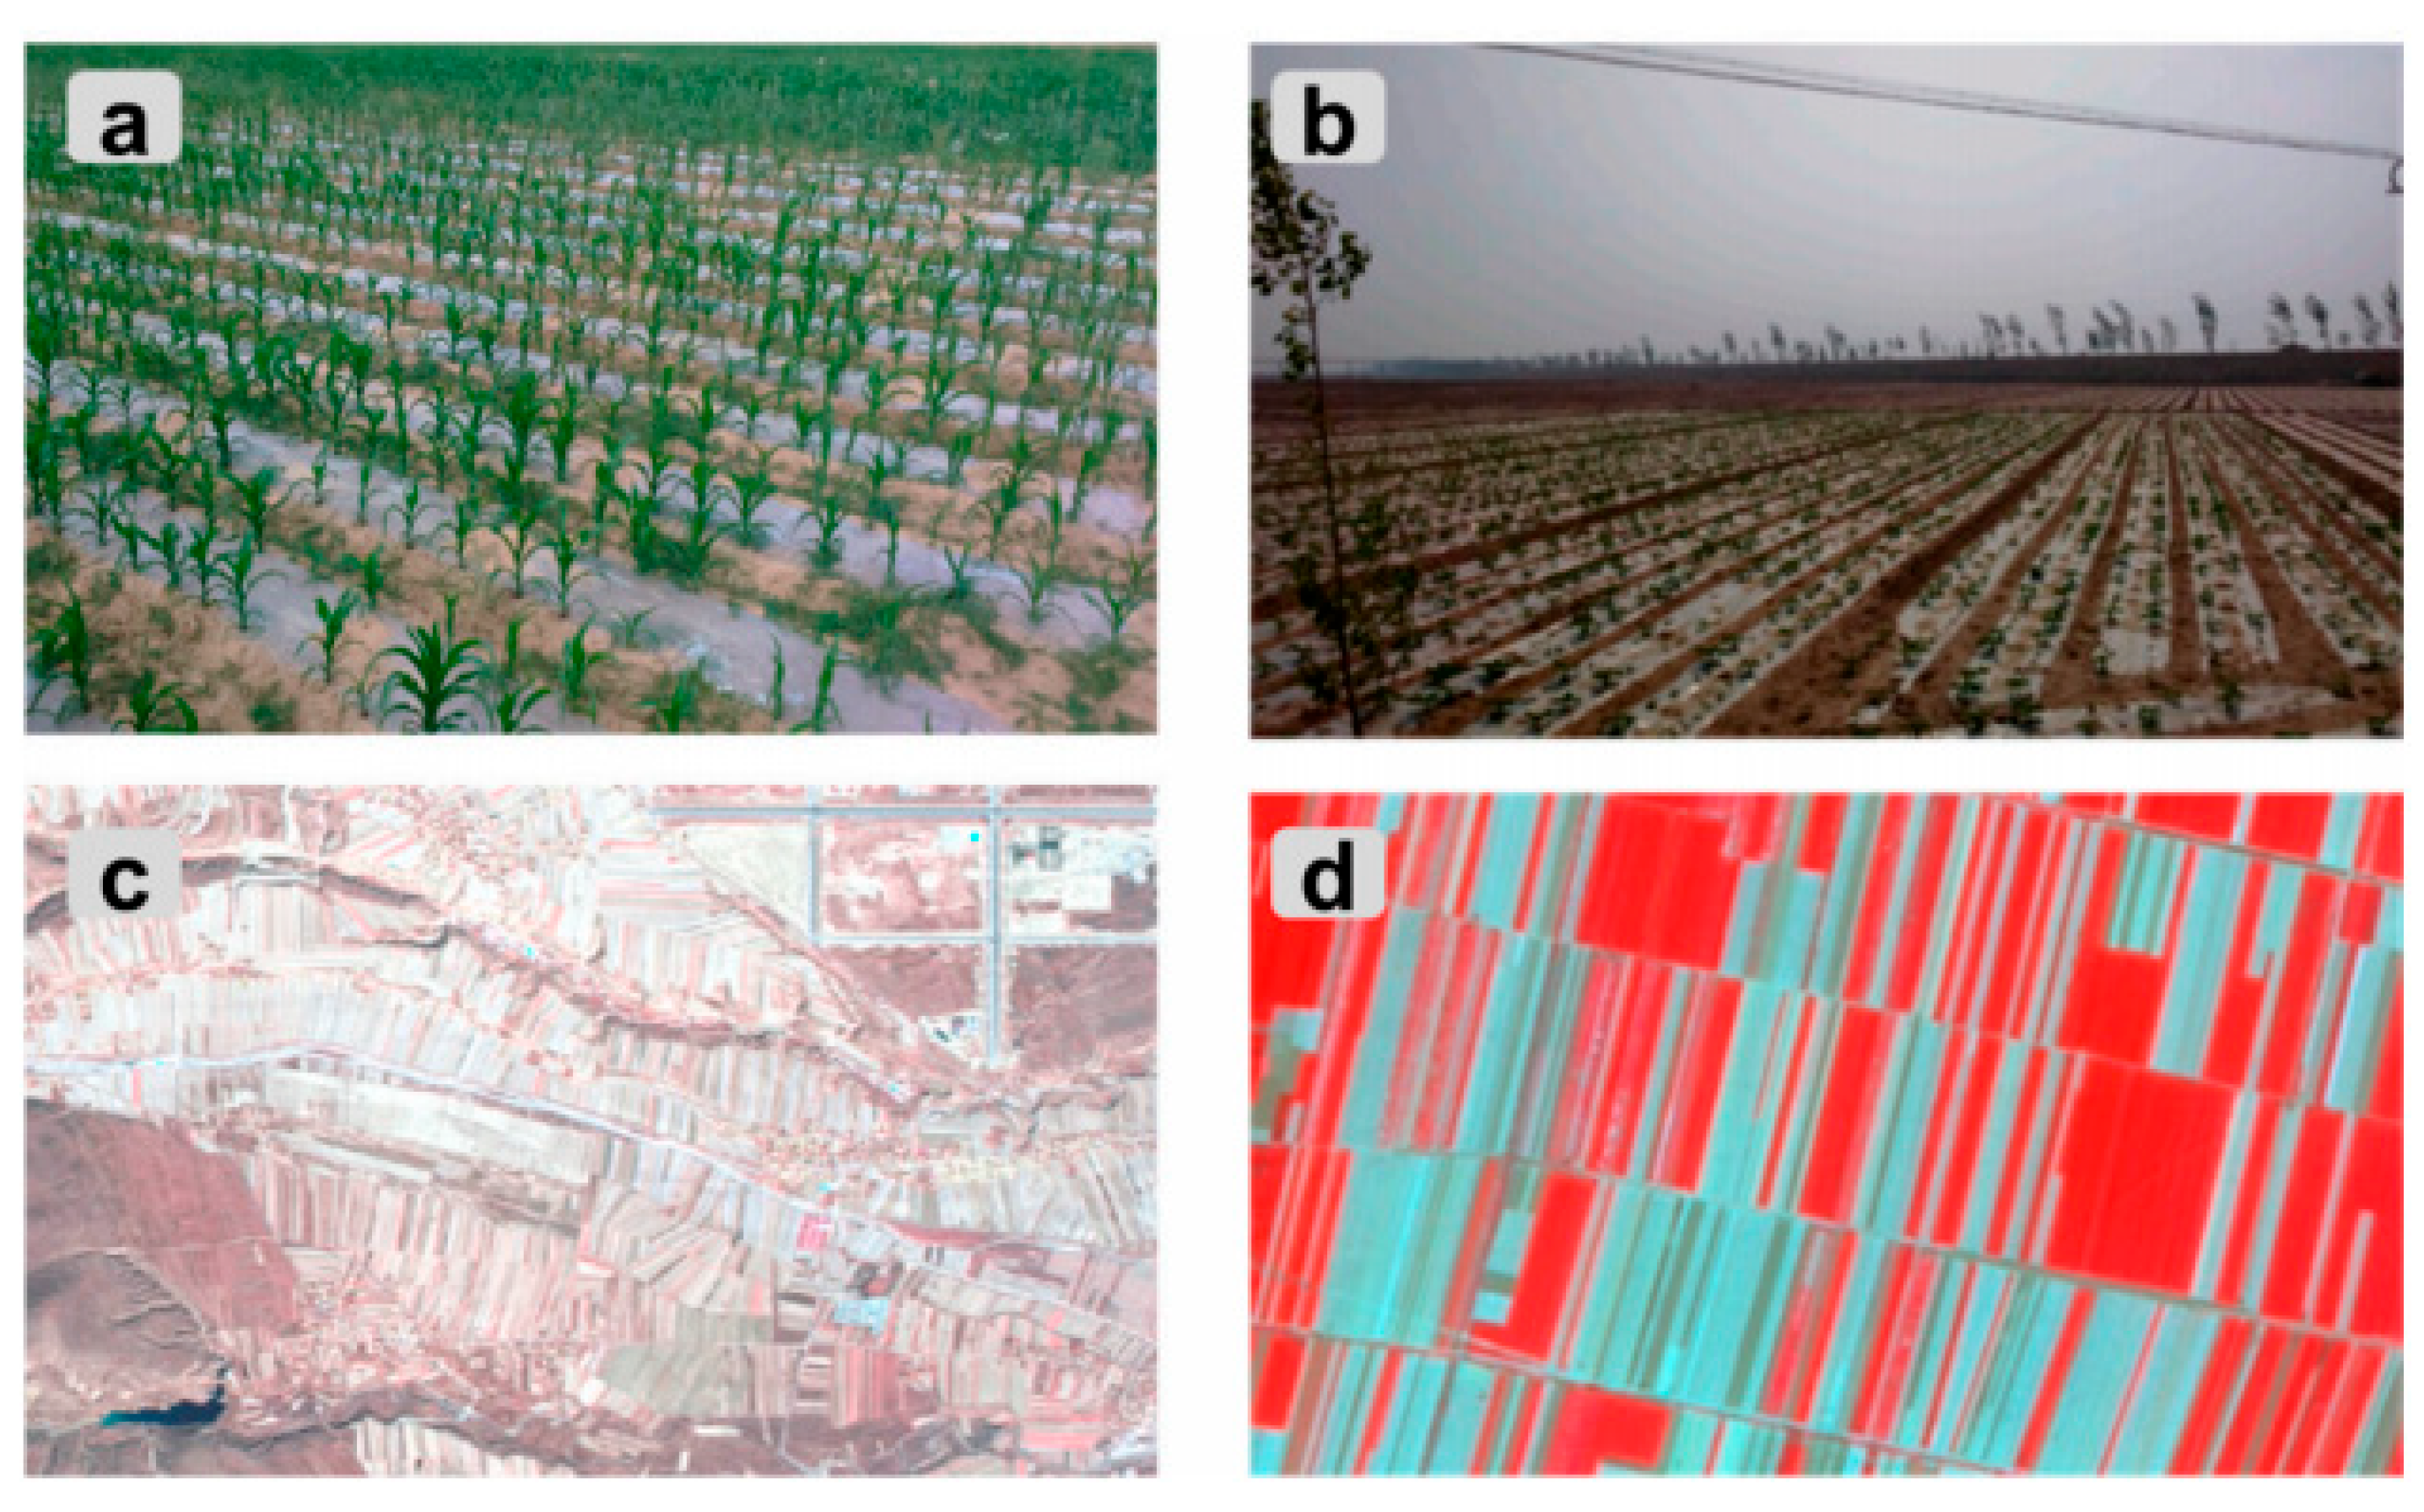
Figure 17.
Polar plot of dolp of vegetation samples at 670 nm [163].
Figure 17.
Polar plot of dolp of vegetation samples at 670 nm [163].
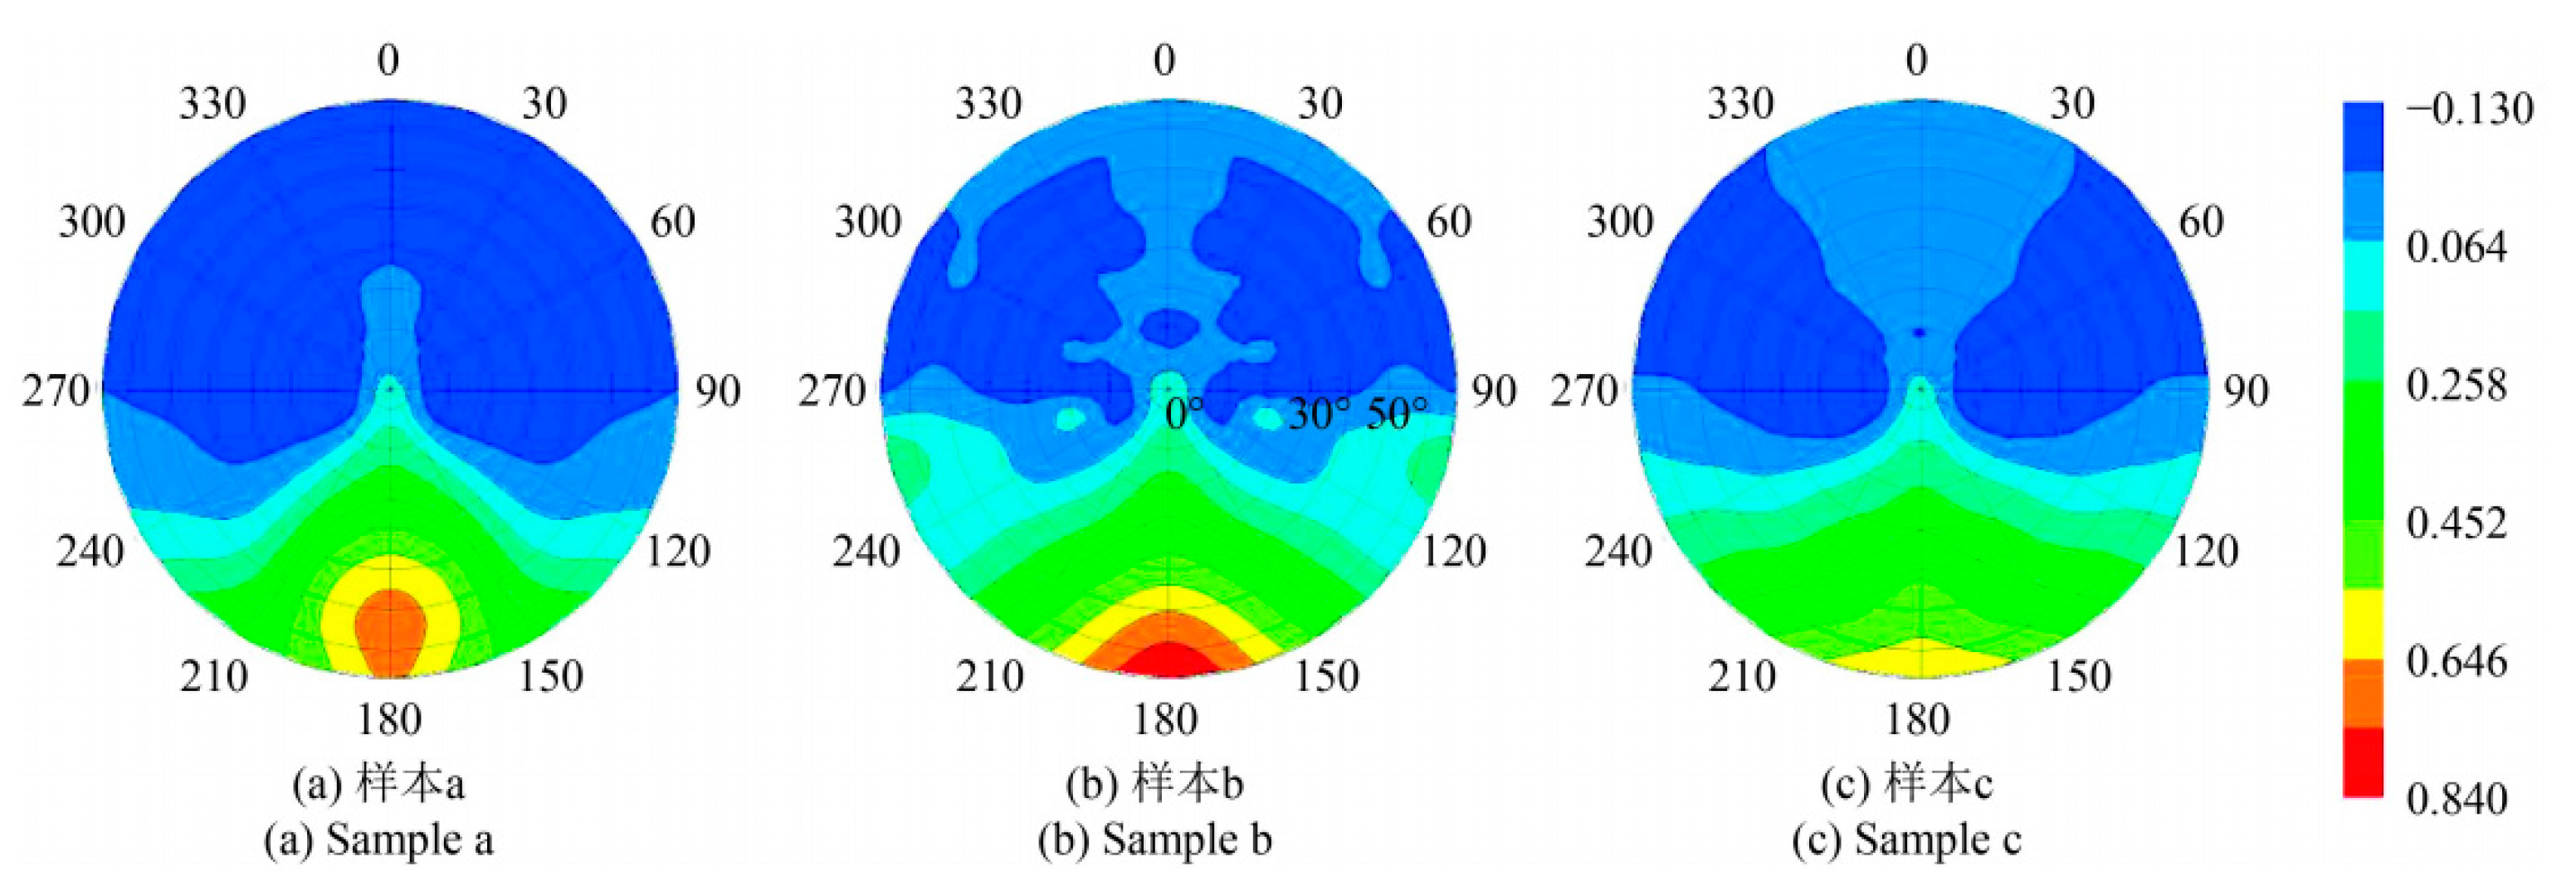
Table 2.
Application of polarization spectrum analysis technology in the detection of chlorophyll.
| Sample | Direction of application | Core method | Best performance | Reference | |
| The laboratory prepared water and Chaohu lake water | Remote sensing inversion of chlorophyll concentration in water | Polarization and reflectivity spectrum comparison modeling | The correlation between blue and green polarization models is high (R²=0.948) | [89] | |
| Tea tree leaves | Remote sensing estimation of chlorophyll content | Multi-angle polarized remote sensing, Maignan model, specular separation | NDVI model R² improved from 0.22 to 0.53, RMSE reduced from 16.11 to 12.67 μg/cm² (≈25% improvement) | NDVI model R² improved from 0.22 to 0.53, RMSE reduced from 16.11 to 12.67 μg/cm² (≈25% improvement) | [92] |
| NDVI model R² improved from 0.22 to 0.53, RMSE reduced from 16.11 to 12.67 μg/cm² (≈25% improvement) | |||||
| Green leaves, ginkgo and apple leaves | Remote sensing inversion of vegetation canopy structure | Stokes vector and PROSPECT model analysis | The polarization degree of red light band is stable, the near infrared band is sensitive to the Angle, and water has no significant effect | [54] |
Table 4.
Application of polarization spectrum analysis technology in seed nondestructive testing.
| Sample | Technical method | Model method | Main conclusion | Reference |
| Rice seeds after aging treatment | Continuous polarization spectrum(different polarization angles and wavelengths) | PLSR、BPNN、RBFNN | RBFNN has the highest accuracy (r = 0.976) | [56] |
| Foreign fibers in cotton | Line laser polarization imaging | Improved YOLOv5 (with Shufflenetv2, PANet optimization, and CA attention) | YOLOv5-CFD achieved 96.9% accuracy, 385 FPS, and 0.75 MB model size | [37] |
| Rice seeds in soaking solution | STM32 control system and polarization spectroscopy device | Modeling based on changes in polarization intensity | A portable detector was constructed to adapt to a variety of rice varieties, and the prediction accuracy reached more than 90% | [114] |
Disclaimer/Publisher’s Note: The statements, opinions and data contained in all publications are solely those of the individual author(s) and contributor(s) and not of MDPI and/or the editor(s). MDPI and/or the editor(s) disclaim responsibility for any injury to people or property resulting from any ideas, methods, instructions or products referred to in the content. |
© 2025 by the authors. Licensee MDPI, Basel, Switzerland. This article is an open access article distributed under the terms and conditions of the Creative Commons Attribution (CC BY) license (http://creativecommons.org/licenses/by/4.0/).
Copyright: This open access article is published under a Creative Commons CC BY 4.0 license, which permit the free download, distribution, and reuse, provided that the author and preprint are cited in any reuse.


