Submitted:
08 November 2025
Posted:
10 November 2025
You are already at the latest version
Abstract
Over the past three decades, Turkish cities have experienced significant increases in terms of building densities. This densification is evident not only through taller buildings and increased floor numbers, but also through the deterioration of the balance between built areas and open spaces and the reduction of amenity areas. While this phenomenon is widely observed and discussed, there is a need for empirical analysis using quantitative data to verify and measure these changes systematically. This study examines the relationship between building density and land use in mass housing projects through objective, measurable, and comparable parameters. The research focuses on eight publicly developed mass housing projects in Kocaeli-Izmit. The methodology employs direct measurements of realized Floor Area Ratio (FAR), Building Coverage Ratio (BCR), and Building Proximity Index as primary density indicators. Additionally, per-dwelling-unit calculations for green spaces, parking areas, playgrounds, and sports facilities provide comprehensive data on amenity provision. The quantitative findings are supplemented by semi-structured interviews with fifteen sector professionals. The study demonstrates that primary objectives of the sector is prioritized as production maximization resulting increasingly higher building densities in housing projects. These results highlight the need to review land and urbanization policies that have evolved to cause density intensification.
Keywords:
building density
; mass housing projects
; housing policy
; amenity areas
; İzmit
1. Introduction
The evolution of modern urbanism has been accompanied by an enduring effort to discipline both construction and planning processes through an intricate framework of legal instruments and urban development plans. Yet, the ever-increasing allure of urban centers—driven by economic opportunity, infrastructural concentration, and social dynamism—has far exceeded initial expectations, triggering extensive waves of migration from rural to urban areas. This unprecedented influx has rendered the housing question not merely a planning concern but a structural challenge, as cities have expanded well beyond their intended capacities. The resultant escalation in urban density has been governed not only by the elementary dynamics of supply and demand but also by the commodification of housing, the reconfiguration of economic paradigms, and the transformative influence of urban transformation policies.
In Turkey, the modern formation of housing policy coincided with the nation’s rapid industrialization, urbanization, and internal migration. From the early Republican era onward, the trajectory of housing policies has mirrored the social, economic, and political metamorphoses of the country. Within this historical continuum, Mass housing has emerged as a pivotal instrument—both in satisfying the shelter needs of low- and middle-income populations and in mitigating spatial and social inequalities while reinforcing the ideals of modern urbanism. Over time, the shifting definitions and interpretations of Mass housing have precipitated corresponding transformations in design methodologies, resulting in perceptible alterations within the physical and social fabric of urban environments.
Particularly in recent decades, the acceleration of housing density—most notably within large-scale Mass housing projects—has become a phenomenon observable at tangible spatial and temporal scales. The quantitative articulation of this process, expressed through measurable parameters, holds significant value for scientific inquiry and policy development. Accordingly, this study endeavors to examine, through a quantitative and comparative lens, the interrelationship among Land use, building density, and amenity areas within the context of Mass housing developments in Kocaeli–Izmit, Turkey. By focusing on projects constructed within the Izmit district boundaries after 1990, the research scrutinizes the temporal and spatial transformations of Land use, FAR (Floor Area Ratio), BCR (Building Coverage Ratio), and amenity areas within publicly developed Mass housing schemes.
Through this analytical framework, the study aims to contribute to the growing body of literature by providing empirically grounded insights and interpretative inferences for urban planning and design within the Kocaeli–Izmit context. Moreover, an enhanced comprehension of the intricate relationship between Mass housing density and both technical and social amenity areas is expected to offer valuable guidance for local administrations in formulating informed and equitable urban development and housing policies. By bridging the quantitative and qualitative dimensions of spatial analysis, this study aspires to illuminate how density, design, and public provision interact to shape the lived experience within Turkey’s evolving urban landscape.
2. Historical Development of Mass Housing Areas in the World
Mass housing districts, as pivotal elements within the trajectory of modern urbanization, have experienced continuous evolution from the 19th century to the contemporary era. A meticulous examination of the historical progression of their spatial organization, their interrelation with the urban fabric, configurations of open spaces, and infrastructural frameworks allows for the elucidation of the distinctive characteristics and design philosophies inherent to each epoch.
The unprecedented urban population surge precipitated by the Industrial Revolution catalyzed the emergence of the first systematically organized mass housing developments. In this period, worker settlements were typically arranged according to rigid grid plans in close proximity to industrial facilities, characterized by repetitive street patterns and functional monotony [1]. Exemplary instances include industrial villages such as Saltaire (1853) and Bournville (1879) in England, which embodied early mass housing planning principles through closed-block configurations and centrally located green areas [2]. The physical attributes of these early developments encompassed narrow streets, high-density construction, and minimal green space provision. The “dumbbell tenement” typology in New York epitomizes housing blocks organized around confined courtyards [3].
The conceptualization of Ebenezer Howard’s “Garden City” fundamentally reoriented approaches to mass housing design. The garden cities of Letchworth (1903) and Welwyn (1920) introduced radial layouts, extensive green spaces, and low-density residential configurations, prompting a reassessment of the open space-to-built area ratio in mass housing districts [4].
Concurrently, continental examples such as Hellerau (1909) in Germany and Betondorp (1923) in the Netherlands garnered attention for their geometric plans, central squares, and integrated social amenities [5]. The period’s hallmark physical characteristics included organically arranged streets, heterogeneous housing typologies, and the systematic integration of green corridors.
The advent of the Modernist movement introduced the “open block” system as an alternative to traditional closed-block configurations. Ernst May’s Römerstadt (1927–1928) and Praunheim (1929) complexes in Frankfurt exemplified this paradigm, with row housing arrangements designed to optimize natural light penetration and enhance ventilation [6].
Bruno Taut’s Hufeisensiedlung (1925–1930) in Berlin represents a successful integration of central green spaces within horseshoe-shaped housing blocks [7]. These projects were distinguished by elongated housing blocks, parallel alignments, expansive green strips, and adherence to functional zoning principles.
The CIAM (Congrès International d’Architecture Moderne) congresses of the period popularized the doctrine of functional segregation within mass housing. J.J.P. Oud’s Kiefhoek (1925–1929) in Rotterdam manifested the era’s defining characteristics, featuring standardized housing units alongside systematically arranged open spaces [8].
Post-World War II urban expansion and acute housing shortages necessitated the development of large-scale mass housing complexes. Le Corbusier’s “Radiant City” concept advanced the organization of high-rise residential blocks within park landscapes, redefining the balance between density and open space [9]. London’s Alton Estate (1955–1959) exemplified this period, combining slab and point block typologies and emphasizing generous open areas, children’s playgrounds, parking facilities, and integrated social amenities [10].
In the United States, New York Housing Authority projects under the direction of Robert Moses, such as Stuyvesant Town (1947) and Peter Cooper Village (1947), established new standards for large-scale mass housing, featuring superblocks, centralized parklands, and principles of functional separation [11].
The 1960s witnessed the emergence of the “megastructure” concept, introducing novel spatial configurations in mass housing. Moshe Safdie’s Habitat 67 (1967) in Montreal exemplified compact, three-dimensional modular housing arrangements, offering multi-tiered open space systems as alternatives to conventional street patterns [12]. Denys Lasdun’s Ziggurats (1962–1968) at the University of East Anglia illustrated topographically responsive terraced housing with multi-level terraces, internal streets, and vertical gardens [13].
Kenzo Tange’s Tsukiji Redevelopment (1963) in Japan manifested the metabolist ethos, proposing modular growth potential, multifunctional platforms, and infrastructure integration within mass housing developments [14].
By the 1970s, the social shortcomings of large-scale mass housing prompted critical reassessment of prevailing design paradigms. The demolition of the Pruitt-Igoe complex (1972) in St. Louis epitomized the limitations of Modernist design [15]. Concurrently, the “defensible space” theory emphasized the nexus between security, social control mechanisms, and physical design. Herman Hertzberger’s Diagoon Houses (1971) in the Netherlands introduced flexible plan schemes and user participation, facilitating individualized spatial experiences [16]. Ralph Erskine’s Byker Wall (1969–1982) in the UK demonstrated an organic design approach responsive to topography and social structures, incorporating varied open spaces and systematically integrated social interaction areas [17].
The 1990s “New Urbanism” movement reinvigorated traditional urban fabric principles. Projects such as Andrés Duany and Elizabeth Plater-Zyberk’s Seaside (1981) and Celebration (1994) foregrounded street-centered organization and mixed-use principles [18]. In Germany, the IBA Berlin (1987) program facilitated mass housing compatible with existing urban patterns, integrating variable building heights and green courtyard systems within Kreuzberg and Prenzlauer Berg.
China’s “Danwei” system, emerging during rapid urbanization, exemplified integration of residential, work, and social functions within self-contained work-unit compounds, characterized by enclosed campuses, central green spaces, and controlled entry systems [19].
Entering the 21st century, environmental sustainability and climate resilience have become paramount criteria in mass housing design. Bjarke Ingels Group’s 8 House (Denmark) exemplifies integrated housing with sustainable mobility and green roof systems [20]. Freiburg’s Vauban (1998–2006) demonstrates a car-free, energy-conscious neighborhood with organic street patterns, green corridors, and renewable energy integration [21]. MVRDV’s Parkrand (2006) in the Netherlands maximizes green space in dense urban contexts through vertical gardens and multi-level park areas, emphasizing minimal carbon footprint, resource efficiency, and ecological infrastructure integration [22].
In sum, the historical evolution of mass housing globally has been indelibly shaped by the interplay of technological innovation, societal transformation, and environmental imperatives. From the monotonous industrial-era worker neighborhoods to contemporary smart, sustainable complexes, profound transformations in plan organization, open space configuration, infrastructure systems, and ecological integration have continuously redefined the essence of mass housing design.
3. Historical Development of Mass Housing Areas in Turkey
The period from the proclamation of the Republic in 1923 to the establishment of the State Planning Organization in 1961 is when the foundations of Turkey’s housing policies were laid. Although the concept of mass housing had not yet been established in the modern sense during this period, the first steps towards low-income groups were taken through state-supported cooperative models. Cooperative movements that began in the 1930s aimed to facilitate access to affordable housing for civil servant and worker families [23]. For example, the Bahçelievler Cooperative established in 1935 presented a planned settlement model for civil servants and middle-income families in Ankara and became one of the early examples of mass housing [24]. However, during this period, social housing policies focused more on state employees and remained limited in meeting the needs of low-income groups.
The years 1961-1980 represent the beginning of Turkey’s planned development period. During this period, industrialization accelerated, rural-to-urban migration increased, and urbanization became a serious issue. However, the lack of a planned urbanization strategy triggered the squatter housing problem [25]. Squatter settlements, especially in large cities such as Istanbul, Ankara, and Izmir, emerged as an informal solution to meet the housing needs of low-income groups, but this situation led to urban form and infrastructure problems.
During this period, housing policies began to be addressed more systematically. With the establishment of the State Planning Organization in 1963, housing policies were shaped within the framework of five-year development plans [26]. In 1967, the term “mass housing” was used for the first time as an official term in the second development plan, and the state focused on social housing production for low-income groups [27]. The General Directorate of Land Office, established in 1969, was an important step in mass housing production. The Land Office aimed to facilitate access to housing for low-income groups by providing affordable land and developing infrastructure services [28]. Additionally, increasing municipalities’ authority in housing production contributed to the spread of social housing policies [29].
The post-1980 period is when Turkey’s economic policies underwent a neoliberal transformation and the housing sector was deeply affected by this transformation. With the transition to a free market economy, the state’s role in housing policies was redefined. The Mass Housing Administration (TOKI), established in 1984, became a central actor in social housing production. TOKI aimed to solve the housing problem through mass housing projects for low and middle-income groups and supported modern urbanization processes [30].
Neoliberal policies increased the role of the private sector in housing production, but mass housing projects continued with state support. Within the framework of five-year development plans, the housing sector was addressed in line with general development goals, with projects for low-income groups being prioritized. Mass housing projects implemented by TOKI aimed to provide housing that met modern living standards, had completed infrastructure, and was affordable. However, the accessibility and inclusiveness of social housing projects during this period became a subject of debate. TOKI’s projects were criticized for appealing to middle and upper-income groups rather than low-income groups [31]. Additionally, problems such as displacement of existing neighborhood residents and damage to social fabric emerged in urban transformation projects. Nevertheless, TOKI’s social housing projects played an important role in Turkey’s urbanization processes and were effective in meeting housing needs.
Social housing-oriented mass housing applications in Turkey have occupied a central place in the evolution of housing policies. Social housing applications that began in the early Republican period with a limited scope for civil servants and bureaucrats were addressed in a broader framework for low-income groups with the planned development period. In the post-1980 period, social housing production accelerated under TOKI’s leadership and was integrated with modern urbanization processes.
The importance of mass housing in the evolutionary process is not limited to meeting housing needs. Through social housing projects, it has been used to solve social and economic problems brought by urbanization, reduce social inequalities, and spread modern living standards. However, the success of social housing policies depends on factors such as accessibility, appropriate pricing, and inclusiveness. Especially in the neoliberal period, the inability of mass housing projects to adequately reach low-income groups and the disregard for social justice concerns in urban transformation processes have led to criticism of policies [32].
The spatial organization of housing production in Turkey has undergone fundamental changes from the 1970s to the present. This change demonstrates not only the differentiation of architectural and urban design understanding but also the transformation of social lifestyles and urban culture. Mass housing projects that emerged in the 1970s, when the social state understanding was strong, were shaped with an approach that prioritized public space use, supported social solidarity, and targeted urban integration. However, especially since the 2000s, with the influence of neoliberal policies, a closed and segregating mass housing understanding dominated by security concerns has begun to prevail. This approach has brought measurable changes in the spatial organization of mass housing projects with different features.
The most distinctive feature of mass housing projects implemented in Turkey in the 1970s and 1980s is the importance given to socialization spaces. Housing complexes built during this period were designed not only as units meeting housing needs but as spatial organizations supporting social life. Common use areas, children’s playgrounds, sports facilities, cultural centers, and green spaces located between housing blocks functioned as spaces where residents encountered each other and interacted in their daily lives. These socialization spaces supported the development of neighborhood relations while enabling people of different age groups to come together and allowed the strengthening of social cohesion. Social and technical amenity areas were evaluated as one of the most important elements in solving cities’ cultural and social problems during this period and had great importance in increasing quality of life [33].
Another important characteristic of these early-period mass housing projects is the sensitivity regarding solid-void balance. In these projects where construction ratios were kept quite balanced compared to today’s standards, open spaces were evaluated not as spaces meeting functional needs but as elements increasing urban life quality. According to Trancik’s (1986) solid-void theory, the relationship between buildings and open spaces in the city is critically important in increasing the integrity and functionality of urban space [34]. Practical applications of this theory are seen in mass housing projects implemented in the 1970s. This open space organization supported by large green areas, pedestrian paths, seating areas, and recreation fields aimed to alleviate the negative effects of dense urban life.
The density policies applied in mass housing projects during this period reflect a quite different understanding compared to today. Although FAR (Floor Area Ratio) and BCR (Building Coverage Ratio) ratios were used as basic criteria in determining construction density, social and environmental factors were also taken into account in determining these ratios [35]. Distances between buildings were kept much wider than today’s standards, thus aiming to protect privacy and provide adequate ventilation and sun exposure conditions. The importance of the building-land relationship emphasized by Alexander (1993) is clearly seen in projects implemented during this period [36].
In the 1970s, the approach of implementing mass housing projects in larger urban areas was adopted in the planning process. This understanding stemmed from viewing mass housing as the driving force of urban development. Large-scale projects contributed significantly to the physical development of cities by enabling the opening of new transportation routes, realization of infrastructure investments, and expansion of urban services. Planning these projects at the urban scale also enabled more effective organization of social amenity areas. As stated by Sönmez (2022), having access to social activity opportunities is a fundamental right for city residents, and comprehensive planning approaches are needed to ensure this right [37].
One of the most valuable features of mass housing projects during this period is that they achieve a high level of integration with the city. Special importance was given to harmony with the existing urban fabric in the design process of projects, and physical and social connections with surrounding neighborhoods were targeted. Mass housing areas were positioned not as islands disconnected from the surrounding urban fabric but as organic parts of urban life. This integration approach facilitated mass housing residents’ access to urban services while minimizing social exclusion risks. Thanks to the effective organization of urban voids, entrance foyers served as transition areas, inner block voids as semi-private use areas, and main streets and squares as centers of public life.
From the end of the 1990s, significant changes began to occur in mass housing production approaches in Turkey. This transformation, which accelerated especially from the beginning of the 2000s, is a reflection of the impact of neoliberal economic policies on urban space production processes. The new mass housing understanding that emerged during this period had a closed and segregating character dominated by security concerns. These new types of mass housing projects called gated communities were shaped as spatial organizations surrounded by physical barriers and supported by controlled access systems.
During this transformation process, socialization spaces of the previous period largely disappeared or were greatly restricted. Common use areas in gated communities became spaces isolated from the outside world, accessible only to site residents. This change caused the weakening of social solidarity and neighborhood relations, leading to increased individualization in urban life. Additionally, the diversity and scope of social amenity areas in these projects were significantly reduced. As emphasized by Köse and Akkaya (2022), increasing building density causes a decrease in social amenity areas and restriction of their diversity [33].
Fundamental changes also occurred during this period in terms of solid-void balance. In this process where land value and economic concerns came to the fore, construction ratios increased dramatically and open spaces were minimized. As stated by Harper (2013), not widening the distance between tall buildings negatively affects urban life with problems such as sun radiation and wind barriers. In mass housing projects implemented during this period, FAR and BCR ratios were used at maximum levels, and distances between buildings were reduced to minimum levels [38].Contrary to the basic principles of solid-void theory emphasized by Gülpınar (2021), in these projects the solid ratio was kept at much higher levels than the void ratio [39]
In mass housing projects of the 2000s, the understanding of implementation in large urban areas was also largely abandoned. Projects that emerged during this period began to be implemented as point interventions in small parcels in the existing urban fabric. This approach restricted urban infrastructure investments and social amenity areas, minimizing the contribution of mass housing projects to urban development. Additionally, the lack of urban-scale planning of these projects caused increased transportation problems and difficulties in accessing urban services.
A dramatic decline also occurred during this period in terms of level of integration with the city. Gated communities were positioned by design as islands disconnected from the surrounding urban fabric, with physical and social connections with surrounding neighborhoods largely cut off. This closed structure caused increased social segregation, minimizing interaction between different socioeconomic groups. As stated by Sola (2019), considering that population density is an important factor affecting social amenity areas, the negative effects on social life quality of density increases in these projects become even more pronounced [40].
The transformation of mass housing design elements in Turkey from the 1970s to the present reflects not only changes in architectural and planning understanding but also fundamental changes in social lifestyles. The loss of importance of socialization spaces, disruption of solid-void balance, minimization of distances between buildings, abandonment of urban-scale planning, and decrease in level of integration with the city constitute the main problems of today’s mass housing projects. A critical evaluation of this transformation process is necessary for future mass housing policies to be shaped with a more sustainable approach supporting social life quality.
4. Historical Development of Mass Housing Areas in Kocaeli-Izmit
Located on both the highway and railway axis connecting Istanbul, Turkey’s largest city, with the capital Ankara, Izmit is at an important junction point of transportation axes connecting the Asian and European Continents (Figure 1;[41]). Izmit Bay is a natural harbor and also a busy seaway. With its location next to a metropolis like Istanbul, the highway passing through the city has maintained its importance and activity since the past. As a result of all these factors, it has become one of Turkey’s leading provinces in terms of industrialization speed [41]. Izmit city, where population density and urbanization increase daily, continues to receive migration with its industrial areas.
Although Izmit city constitutes one of the most important examples in terms of the effective causes and spatial consequences in Turkey’s industrialization and urbanization process, there is insufficient research about the spatial development process of Izmit city and the role-position-status-effect of Mass Housing Areas within this process.
It was observed that the first settlement in the city developed mostly in the coastal section and the coastal section was completely built up over the years. The presence of less sloped areas in the east-west direction in the region caused linear spread of development around a narrow coastal band along the Istanbul-Ankara road in the north and the Izmit-Bursa road in the south around the Bay. Another reason for linear spread is that the transportation method preferred in the city’s industrial areas was provided by sea route and railway running parallel to the coastal line. In Kocaeli-Izmit, which was affected by the Marmara Earthquake, which is the breaking point in the physical environment change, growth occurred in the opposite direction from the coast, northward on the north side of the city and southward on the south side due to the suitability of the ground structure. Until that year, the city, which developed linearly in the east-west axis, continued its development in the north-south direction with the destructions. In the following years, new development areas were formed in the north of the city as a result of the organized industrial zones established and newly opened industrial areas and increasing population. Approaching 2020, it was observed to spread in the east and south axis direction. With the current scheme, it is seen in today’s macroform that the northwest and east parts of the city are more built up.
The historical development of mass housing areas in Kocaeli- Izmit has been shaped by the province’s industrial character, strategic location, and natural disasters experienced. This Izmit-centered development has undergone continuous transformation from the 1950s to the present and experienced fundamental changes especially after the 1999 Marmara Earthquake.
The first examples of mass housing areas in Izmit emerged from the 1950s with the worker housing need of industrial facilities established in the region. Worker dormitories created alongside large industrial investments such as TUPRAS (1961) and SEKA (1962) constituted the first planned mass housing examples. During this period, housing areas developed on land reclaimed from the sea in Izmit were organized with a grid plan system and a functional approach was adopted [42].
The third development plan prepared by Kemal Ahmet Aru in 1959 was an important turning point in Izmit’s modern urban development [43]. This plan played a determining role in the location of mass housing areas with the D-100 highway shifting inside the city to the part filled from the sea and planning this strip. The plan envisioned the arrangement of worker housing areas near industrial facilities and proposed regulations to meet the infrastructure needs of these regions.
In the 1980s, rapid industrialization and migration movements in Izmit led to the emergence of unplanned settlement areas. Squatter neighborhoods developing around Izmit during this period were spontaneously formed mass settlement examples due to the inadequacy of official mass housing policies. These settlements, concentrated especially in areas such as Erenler, Kozluk, and Tavsantepe, were characterized by minimum infrastructure facilities. Mass housing projects produced by municipalities and the state during this period remained limited, with housing production largely realized through the cooperative system. Mass housing areas produced for personnel by various public institutions in Izmit generally consisted of 2-3 story block-type structures with minimal green space arrangements [44].
The 1990s mark the period when mass housing areas in Izmit began to be produced by the private sector [45]. During this process, site-type housing complexes began to develop especially in Izmit central areas. These projects differentiated from the traditional mass housing approach with the gated community concept, security services, and integration of social facilities.
The August 17, 1999 Marmara Earthquake was a very important breaking point in the development of mass housing areas in Izmit [46]. In the earthquake, 66,441 houses were heavily damaged throughout the province and approximately 200,000 people became homeless. This disaster revealed the necessity of renewing a large part of the province’s housing stock. In the post-earthquake period, urgent housing needs were met through the establishment of prefabricated temporary housing areas. These temporary settlements established in Gölcük, Değirmendere, and Izmit constituted the first examples of post-disaster mass housing organization. However, although these structures were designed as temporary, they continued to be used for a long time in some areas. Projects initiated under the leadership of TOKI (Mass Housing Administration) and the Municipality’s housing production company “Kentkonut” for permanent housing production brought modern planning to Izmit’s mass housing areas. These projects stood out with earthquake safety standards, open space arrangements, and social facility integration.
From the 2010s, earthquake-resistant housing areas were produced especially in Izmit central areas and renewal of the old building stock was accelerated [47]. Within the scope of urban transformation developed with plan decisions, projects to convert old industrial areas in the city into housing areas brought changes in the city’s spatial structure. Large-scale housing projects produced by the private sector also increased during the same period [48].
5. Materials and Method
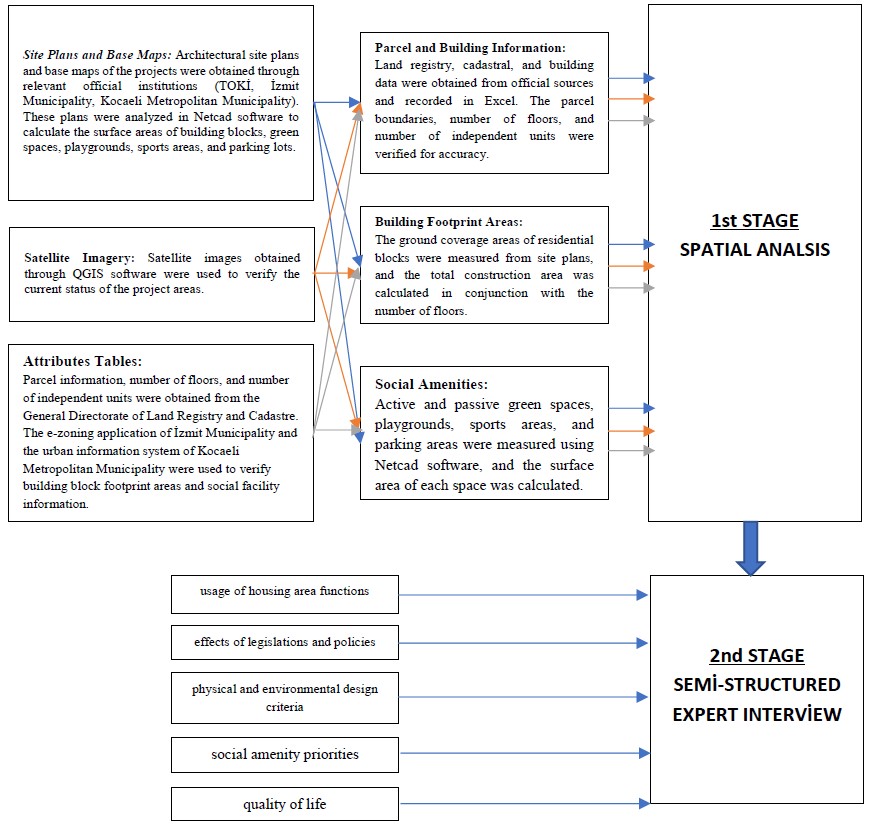
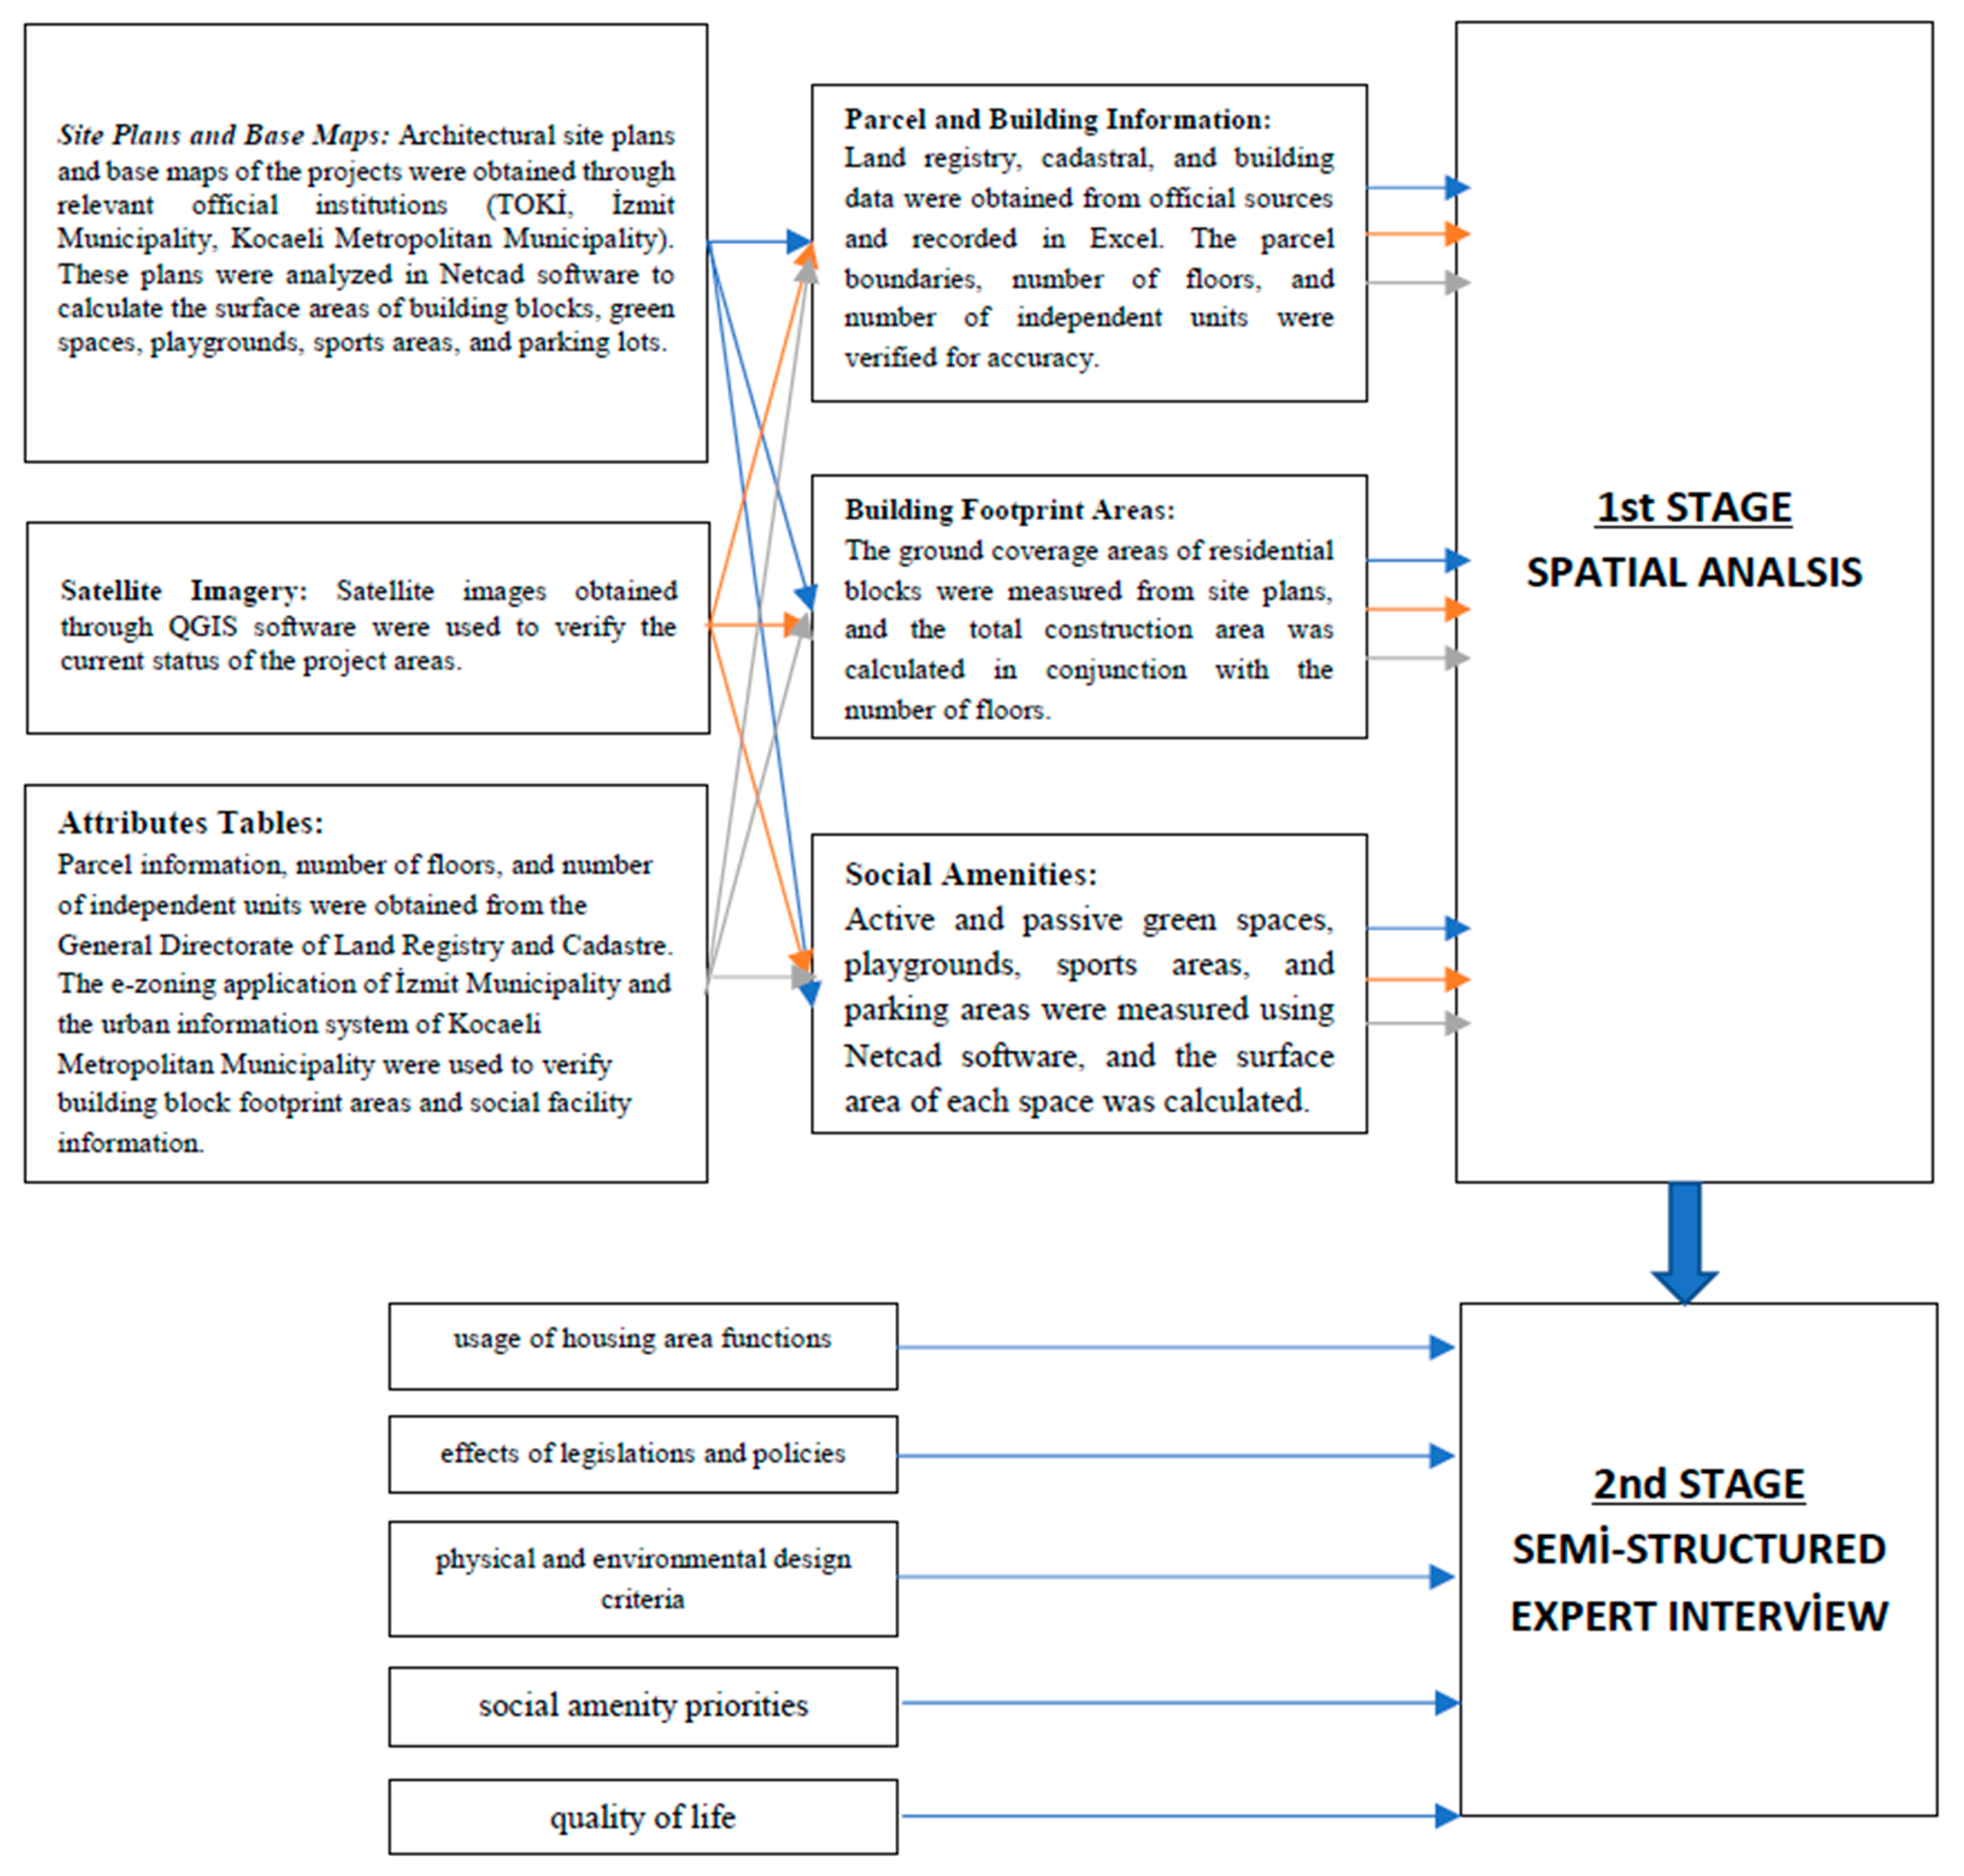
Within the scope of the study, in addition to quantitative data, a two-stage method was designed within the framework of qualitative analysis methods. In the first stage, while differences between sample areas were revealed through spatial identification and analyses for field work, in the second stage, views obtained through semi-structured expert interviews were classified internally in order to reveal the relationship of these differences with mass housing design and changing housing policy.
Within the scope of this study, eight different mass housing projects produced after 1990 in Izmit district of Kocaeli were examined. The projects built publicly by central or local governments were included in the study to minimize comparison handicaps.
- Yahya Kaptan Housing
- Yuvam Akarca Housing
- Izmitkent Housing 1st Stage
- Izmitkent Housing 2nd Stage
- Izmitkent 3rd Stage Housing
- Izmitkent 4th Stage Housing
- Yildiz Housing
- Izmitkent 5th Stage Housing
Within the first stage, the data collection process was structured in a multifaceted way using “Site Plans and Base Maps,” “Satellite Images,” and “Attribute Data,” and on-site observations were carried out by directly interacting with publicly built mass housing areas in Kocaeli-Izmit selected as examples. Yahya Kaptan Housing, Izmit Kent 1-2-3-4, and 5th Stage Housing, Yuvam Akarca Housing, and Yildiz Housing within Izmit were selected as the study area. Physical characteristics of mass housing projects were analyzed through comparatively determined parameters (FAR - Floor Area Ratio, BCR - Building Coverage Ratio, active and passive green areas, playgrounds, sports areas, parking areas, and building proximity index), attempting to reveal changes over the years. Thus, a comprehensive and multi-layered perspective on the research field could be developed.
Parameters used at this stage were defined as: “Realized FAR/Floor Area Ratio (The ratio showing the actual construction area on the ground (including plaster, coating, and areas outside FAR) corresponding to construction conditions in the development plan. Calculated as the ratio of total construction area to project area.)”, “Realized BCR (The ratio of the actual area occupied by housing blocks on the ground to the total project area.)”, “Active Green Areas (Areas suitable for active use for social interaction - housing gardens, public green areas)”, “Passive Green Areas (Areas not suitable for active use - refuges, forested areas, sloped green areas)”, “Playgrounds (Children’s playgrounds and gardens)”, “Sports Areas (Special sports areas such as football, basketball, tennis courts, and public areas with sports equipment)”, “Parking Areas (Open parking lots and underground parking as in the Yildiz Housing example)”, “Building Proximity Index (The ratio of average distance between buildings to building heights. A high index indicates greater distance between buildings and more spacious living spaces)”.
Starting from attribute data, comparison parameters for the physical design of social housing were produced through the following processes:
FAR and BCR were calculated as the ratio of the total building area and the building footprint area to the total project area.
The areas of active greens, playgrounds, sports facilities, and car parkings were measured, and the amount of space per dwelling was calculated.
The Building Proximity Index is the ratio of the distances between building blocks to the height of the block. First, the average distance of each block to the nearest 3-5 blocks was divided by the block’s height, and a proximity values (P) was calculated for each block (Eq.3). The Building Proximity Index (BPI) was obtained by averaging all proximity values within the project area (Eq.4). This index is used to evaluate construction density and spatial spaciousness.
In the second stage involving semi-structured expert interviews, experts were asked open-ended questions on topics such as spatial usage density, legislation and policy impact, physical and environmental design criteria, social amenity priorities, and quality of life, and were asked to make evaluations about the reasons for differences between compared projects.
Interviews were conducted with 15 experts within the scope of the study. Among these experts were five architects, four urban planners, four surveying engineers, and two civil engineers. Interviews were conducted face-to-face individually. Part of the expert architect and engineer group worked in the public sector, part in the private sector, while 3 participants were seen to be contractors.
Figure 5.
Research Model.
6. Findings: Comparative Analysis of Factors Directing Mass Housing Area Design
In the 8 project areas determined within Izmit, comparisons consisting of values of area size, number of building blocks, building block base area size, building block total construction area size, total number of units, active green area size, playground size, sports area size, and parking area size are given in Table 1.
In obtaining qualitative data, digital projects, land surveys, and satellite images were used as supplementary. Site plans created on GIS and CAD platforms and obtained digital data are shown below.
Through analysis of data related to mass housing projects within the study scope, it was aimed to monitor the building-land use relationship and temporal change in amenity areas. Construction sizes given in Table 1 were normalized by proportioning with amenity area sizes, and analyses were conducted on these comparable sizes. In addition to quantitative results, qualitative evaluations were also added to the study by obtaining expert opinions on some headings. The widespread view and observation reflected in expert interviews before the study was that building densities were gradually increasing due to various reasons.
Through analysis of data related to mass housing projects within the study scope, it was aimed to monitor the building-land use relationship and temporal change in amenity areas. Construction sizes given in Table 1 were normalized by proportioning with amenity area sizes, and analyses were conducted on these comparable sizes. In addition to quantitative results, qualitative evaluations were also added to the study by obtaining expert opinions on some headings. The widespread view and observation reflected in expert interviews before the study was that building densities were gradually increasing due to various reasons.
In Table 2, amounts of parking, active green, playground, and sports areas per housing unit, realized BCR/FAR ratios at project completion, and building proximity index values are presented. Although BCR/FAR ratios are determined on the development plan, they can increase significantly in the realized project by taking advantage of exceptional articles such as parts not included in the plan or Regulations. Therefore, to better observe land use, realized BCR/FAR sizes were calculated instead of ratios in the development plan.
When the table is examined overall, a decrease in open spaces and amenity areas and an increase in building masses can be observed temporally. Column graphs of parameters represented by each column in the table were prepared and subjected to regression analysis. Some of these are given as examples within the section. The red curve in the graphs represents the (exponential) slope line obtained by regression analysis.
BCR and FAR are the main parameters used to define building density, and regression curves indicate an increase in density for both magnitudes (Figure 6 and Figure 7).
The area occupied by non-amenity building blocks on the ground, i.e., the BCR value, generally shows an increase in general trend, but when read together with FAR values that include increases in building heights, density increase can be observed more accurately.
By definition of density, an increase in BCR and FAR ratios is expected to correspond to a decrease in amenity areas. In a sense, changes in green areas, parking areas, playgrounds, and sports areas are confirmation of the density study. In Table 1, amenity area sizes obtained from projects and ground measurements were proportioned to the number of housing units to obtain areas per housing unit, thus normalized, comparable sizes independent of project size are presented in Table 2.
When parking values per housing unit are examined, it is noteworthy that the only project not conforming to the decreasing curve is dated 2013 (Figure 8). The 2013 project is the only project for the middle-upper income group among the examined projects, and the high parking area per housing unit is due to it being the only project containing underground parking. Although the ratio of parking areas to project area generally increases (Figure 9), the decrease in the ratio per housing unit is an indicator of the increase in the number of housing units, in other words, an increase in density.
In the 2013 project, parking adequacy was attempted to be achieved with more than one underground floor. However, it should not be overlooked that the high parking value per housing unit in this project has no effect on the solid-void balance, and the void created on land through underground parking use was transformed into building mass rather than open space. This situation can be better understood with the active green area change graph (Figure 10). Indeed, the 2013 project also has the highest BCR/FAR ratios among the examined projects.
In Figure 11, the ratio of active green areas to total construction area is plotted, and in both graphs, the temporal decrease in green areas can be clearly seen. Particularly noteworthy is that green areas per housing unit display a dramatic decline after the 1990 and 2000 projects. In the period after the first two projects, the change curve progresses horizontally. The green area graph confirms the result of decreased open spaces on land and increased building density.
The parameter with the highest power to represent building density is the ratio known as FAR or Floor Area Ratio. Therefore, realized FAR values provide important data in examining density between land and building mass. Since FAR values also include building heights, monitoring proximity between buildings provides meaningful contribution for density and living comfort analysis. The Building Proximity Index (BPI) is the reference source for distances between projections of structures on land. Therefore, monitoring the two parameters together will be healthier in examining the building-land use relationship.
In proximity calculation between buildings, for each block, the average of distances to at least three and at most five nearest blocks was taken and divided by the block’s height. The arithmetic average of proximity values found for each block was used as BPI for that project.
A decrease in building proximity index means narrowing of distance between building blocks and is another indicator of increase in building density. Narrowing of distance between buildings negatively affects living comfort as well as sun and wind privacy.
When Figure 12 is examined, a decreasing trend in BPI index can be seen. Although there is an increase in index value again in the last two projects, very high FAR values in the 2013 project prevent any improvement in density perception. In the 2014 project, due to the rectangular geometry and narrow depth of the parcel, only two rows of blocks could fit, which seems to have prevented the proximity index from decreasing. The 2010 project stands out with low building proximity index despite not having a high FAR value. This situation indicates low-rise but very close blocks, creating a negative solid-void balance.
When the dataset is read holistically, it is not difficult to detect the decrease in building proximity index. The decrease in index values indicates that closer and/or taller buildings are preferred. Narrowing of distance between buildings negatively affects usage comfort as well as benefiting from sun and wind. In this context, it would not be wrong to say that the two projects dated 1990 and 2000 built more spacious housing with higher residential suitability.
In playground and sports area ratios per housing unit given in Table 2, no meaningful temporal change was detected (Figure 13). In the 2013 project, playgrounds reached values in 1990 and 2000 projects, and it can be said that in 2013 and 2014 projects where building proximity index is not very low, the value of playgrounds between buildings was kept relatively high.
In sports areas, it is striking that the 1990 project has a value high enough to create comparison difficulty (Figure 14). Of course, the fact that the 1990 project area is larger, corresponds to a more complex urban area design, and contains more sports areas both in variety and quantity is effective in this. Although a horizontal course is followed in the amount of sports area per housing unit in subsequent projects, the absence of sports areas in 2010 and 2011 projects is also noteworthy.
Although a horizontal course rather than temporal decrease in playgrounds and sports areas is observed, considering the dramatic decrease in open green areas, it is thought that the stability in playgrounds and sports areas allocated in smaller units is not contrary to the finding of increasing land use trend.
Findings numerically reveal the trend toward maximizing building area. However, in order to both interpret the findings and gain insight into the reasons for density increase, results were shared with a sectoral expert group of 15 people consisting of architects, urban planners, and surveying engineers. While 12 professionals in the expert group were project designer’s/control officers in the public or private sector, 3 were contractors.
The first question directed to the expert group was about the existence and causes of density increase. While all 15 experts in the expert group emphasized aggression in land use, 9 experts stated the primary cause of increase as increased floor area ratio permission in development plans, 4 as intense profit desire, and 2 as cost increase (Figure 15).
According to Turkey’s zoning legislation, some parts of buildings such as roof terraces, basement parking, elevator shafts are not included in floor area ratio calculation. To the question about the effect of areas outside floor area ratio on increase in building mass, 11 of 15 experts answered that they were effective in the increase (Figure 16). Four negative responses contain justifications that areas outside floor area ratio are beneficial to housing residents and their effect would be small compared to floor area ratio increase.
Of the 12 experts excluding 3 contractors, they think that the amount of land allocated for buildings is sufficient, and 9 think that housing supply is sufficient.
In expert group interview statements, it was stated that the negative slope in the green area graph points to an increase in FAR ratios. While 15 experts gave the opinion that the floor area ratio increase occurred with both political decisions and legislation effect, they stated the preferences in Table 3. regarding what the three most important amenities in mass housing projects should be. The three most preferred amenities are green areas (12), sports areas (12), and playgrounds (10) (Figure 17).
Among the 8 examined projects, it is not difficult to detect the noticeable (remarkable) advantages of the 1990 project in terms of area size, amount of amenity area per housing unit, and amenity diversity. This situation, which is quantitatively revealed with findings in the study, also coincides with city dwellers’ preferences. Despite being on average twenty years older than other projects, it is in demand, experiences value increase, and is preferred as the most livable housing area for many city dwellers.
Experts were asked about the possibility of repeating the 1990 project under current conditions, and 6 experts stated it would not be possible. Responses given by 15 experts to the question under what conditions a similar project could be made are categorized as in Table 4.
The responses also reveal the reasons for density increase over the intervening period. Experts emphasize costs, public contribution, legislation and planning, rent desire, and administrative will.
Findings show a trend toward increased density in construction through projects between 1990-2014. There is a density realized as total mass increase through number of floors or increase in building frequency. While density increase confirms temporal regression, it is also possible to speak of a noticeable change after the 2000 project. The findings obtained and graphs plotted are consistent with each other and support the density increase inference.
7. Results and Discussion
When examining the transformations undergone by Turkish cities over the past three decades, there exists an observational yet pervasive perception regarding the intensification of building densities. This densification manifests itself not merely through escalating heights and story increments, but equally through the deterioration of the solid-void equilibrium upon the land and the diminution of amenity areas.
The present study endeavors to scrutinize and analyze, through quantitative data, the perception that aggression in land utilization has intensified over time and that conspicuous growth has been observed in building masses. The methodological framework of this investigation is predicated upon presenting the relationship between building density and land use in an objective, measurable, replicable, and comparable manner. A rigorous data collection process has been conducted to preclude the reflection of preliminary observations and discussions upon the findings, and a substantial volume of data has been processed to establish a reliable numerical dataset.
Density analyses have been performed on mass housing developments owing to their provision of a fabric amenable to observation, their components constituting a meaningful totality, and their suitability for obtaining measurable and comparable quantitative magnitudes. To ensure that findings remain unaffected by the variable expectations and objectives of diverse private sector entities, mass housing projects executed by local/central governments, situated within identical administrative boundaries geographically, and capable of establishing temporal sequences have been compiled. Notwithstanding that the obtained findings are circumscribed to eight mass housing projects, their appropriateness for general inference has been corroborated by the expert panel examining the findings.
While the fact that project areas dated 1990 and 2000 constitute larger areas compared to subsequent ones may be perceived as a handicap for comparative purposes, the absence of such comprehensive public projects in subsequent years also constitutes a finding and represents one of the results that absolutely warrants emphasis.
For each project, alongside the realized magnitudes of Floor Area Ratio (FAR), Building Coverage Ratio (BCR), and building proximity index, parameters such as green space per dwelling unit, parking area, playground and sports facilities have been calculated through direct measurements, and temporal variations have been analyzed through quantitative data. In this context, the numerical findings are entirely independent of a priori observations.
Although the findings present quantitative data and generate comprehensible numerical results, collaboration with an expert panel has been undertaken for the purpose of more thoroughly examining the holistic tableau that emerges. The fifteen-member expert panel comprises experienced and competent engineers, architects, and urban planners within the sector; its members hold project or supervisory positions in the public or private sector, with three among them engaged in contracting. Expert interviews have contributed to the comprehension of findings and provided insight regarding the dynamics and causalities of transformation trends.
In the analysis of building density, the realized FAR and BCR values—calculated with post-construction magnitudes—are significant, and the findings demonstrate that both values exhibit an increasing trend with positive correlation over the 24-year period spanning 1990-2014. These ratios constitute the mathematical expression of the perception that building density has increased over time.
The increase in FAR ratio concomitantly brings about the reduction of open and green spaces and the increase in building proximities. When FAR, active green space, and building proximity index graphs are examined conjointly, the horizontal and vertical increases in construction area become more readily observable. There exists a dramatic decline in active green spaces particularly following the 2000-dated project, and green space quantities remain substantially below former values in the subsequent six projects compared to the first two. The holistic interpretation of findings reveals the dominance of maximalist approaches in land utilization over time. The solid-void equilibrium is deteriorating, with amenity areas diminishing in correspondence to increasing building area.
The intra-sectoral expert panel with whom the findings were shared concurs regarding the existence of density intensification. Experts have attributed density increase to augmentation of zoning permits, profitability demands, and costs. Nevertheless, it should not be overlooked that the increase in zoning permits has emerged through sectoral pressure. Escalating land and construction costs, alongside heightened housing demand, are reflected in managerial/political decisions, metamorphosing into elevated development ratios in zoning plans.
Under these circumstances, it would not be erroneous to articulate the fundamental causes of density increase as cost escalations and the expectation of obtaining greater building area with diminished investment. “Felicitous” urban living spaces and elevated quality of life do not rank among the sector’s principal objectives; production surplus is prioritized. Experts’ perspectives regarding the 1990-dated project align with this inference.
The study demonstrates that housing policy in Turkey is focused upon augmenting production. The increase in building density is shaped particularly through the interaction among the state, contractors, and legislation. Escalating construction and land costs diminish profit efficiency, and the necessity to compensate this deficit gives rise to the requirement for increased housing production. This circumstance is typically addressed through floor area ratio increases in zoning plans, with construction being realized above plan-designated values through exceptional plan provisions.
The results elucidate the necessity of reviewing land and urbanization policies that have evolved in such manner as to precipitate density intensification. It is believed that the results obtained through this study may contribute to future investigations in the fields of urban planning, architecture, and urban design.
Author Contributions
Conceptualization, MSÇ, TS ; Methodology, MSÇ, AKK, TS ; Software, TS, AA, MSÇ; Validation, MSÇ, AA ; Formal Analysis, MSÇ, TS; İnvestigation, MSÇ, TS, AKK ; Resources, AA, MSÇ ;Data Curation, AA ;Writing—Original Draft Preparation, MSÇ, TS, SM ; Writing—Review And Editing, MSÇ, TS, AKK ; Visualization, TS, MSÇ, AKK; Supervision, MSÇ, AKK, TS; Project Administration, MSÇ; All authors have read and agreed to the published version of the manuscript.
Data Availability Statement
Data is contained within the article or supplementary material.
Conflicts of Interest
The authors declare no conflicts of interest.
References
- Benevolo, L. (1980). The history of the city. MIT Press.
- Creese, W. L. (1966). The search for environment: The garden city before and after. Yale University Press.
- Plunz, R. (1990). A history of housing in New York City. Columbia University Press.
- Howard, E. (1902). Garden cities of to-morrow. Swan Sonnenschein & Co.
- Bullock, N. (1978). First the kitchen—then the facade. Journal of Design History, 1(3-4), 177-192.
- Henderson, S. R. (2013). Building culture: Ernst May and the new Frankfurt initiative, 1926-1931. Peter Lang.
- Scarpa, L. (1990). Martin Wagner e Berlino: Casa e città nella Repubblica di Weimar, 1918-1933. Officina Edizioni.
- Taverne, E. (1996). J.J.P. Oud: Poetic functionalist, 1890-1963. NAi Publishers.
- Fishman, R. (1977). Urban utopias in the twentieth century: Ebenezer Howard, Frank Lloyd Wright, and Le Corbusier. Basic Books.
- Glendinning, M., & Muthesius, S. (1994). Tower block: Modern public housing in England, Scotland, Wales, and Northern Ireland. Yale University Press.
- Caro, R. A. (1974). The power broker: Robert Moses and the fall of New York. Knopf.
- Safdie, M. (1970). Beyond Habitat. MIT Press.
- Harwood, E. (2015). Space, hope, and brutalism: English architecture, 1945-1975. Yale University Press.
- Lin, Z. (2010). Kenzo Tange and the metabolist movement: Urban utopias of modern Japan. Routledge.
- Newman, O. (1972). Defensible space: Crime prevention through urban design. Macmillan.
- Hertzberger, H. (1991). Lessons for students in architecture. Uitgeverij 010 Publishers.
- Erskine, R. (1973). Byker: Ralph Erskine’s development. Architectural Design, 43(2), 104-109.
- Katz, P. (1994). The new urbanism: Toward an architecture of community. McGraw-Hill.
- Bray, D. (2005). Social space and governance in urban China: The danwei system from origins to reform. Stanford University Press.
- Ingels, B. (2009). Yes is more: An archicomic on architectural evolution. Taschen.
- Nobis, C. (2003). The Vauban quarter in Freiburg: A case study. German Institute of Urban Affairs.
- MVRDV. (2005). KM3: Excursions on capacities. Actar.
- Keleş, R. (2008). Kentleşme politikası. İmge Kitabevi.
- Tekeli, İ. (2010). Türkiye’de kentleşme yazıları. Tarih Vakfı Yurt Yayınları.
- Dik, İ. (2009). Türkiye’de kentleşme ve gecekondulaşma. YEM Yayınları.
- Tercan, E. (2018). Devlet Planlama Teşkilatı ve konut politikaları. Ekin Yayınevi.
- Özgen, C. (2002). Toplu konut politikaları ve Türkiye deneyimi. Der Yayınları.
- Markoç, İ. (2013). Türkiye’de konut politikalarının dönüşümü. Nobel Yayınları.
- Ulusoy, M. (2020). Türkiye’de belediye ve konut politikaları. Beta Yayınları.
- Demir, H., & Palabıyık, H. (2005). Türkiye’de konut politikaları ve TOKİ uygulamaları. Gazi Kitabevi.
- Pérouse, J. F. Pérouse, J. F. (2015). İstanbul’un çeperleri: Kentsel dönüşüm ve sosyal konut. İletişim Yayınları.
- Bayırbağ, M. K. (2013). Kentsel dönüşüm ve sosyal konut politikaları: Türkiye örneği. Planlama Dergisi, 23(2), 45-60.
- K, *!!! REPLACE !!!*. Köse, M., & Akkaya, S. (2022). Kentsel donatı alanlarının yaşam kalitesi üzerindeki etkileri. Kent Araştırmaları Dergisi, 18(4), 112-128.
- Trancik, R. (1986). Finding lost space: Theories of urban design. Van Nostrand Reinhold.
- Çakmak Yetiş, A. (2023). Kentsel yoğunluk ve toplu konut ilişkisi: Türkiye örnekleri. Mimarlık ve Planlama Dergisi, 15(2), 45-62.
- Alexander, C. (1993). A pattern language: Towns, buildings, construction. Oxford University Press.
- Sönmez, R. (2022). Sosyal donatı alanları ve kentsel hizmetler. Yerel Yönetimler Dergisi, 31(2), 89-106.
- Harper, D. (2013). Urban design and the built environment. Routledge.
- Gülpınar, E. K. (2021). Kentsel mekânda doluluk-boşluk dengesi ve tasarım yaklaşımları. Şehir ve Bölge Planlama Dergisi, 12(3), 78-95.
- Sola, J. (2019). Density and urban planning: International perspectives. Cambridge University Press.
- Kocaeli Metropolitan Municipality. (2009). 1/50.000 Kocaeli çevre düzeni planı plan açıklama raporu. Kocaeli Büyükşehir Belediyesi.
- Özcan, H. (2006). Kocaeli’de sanayileşme ve kentsel gelişim. İletişim Yayınları.
- Bayraktar, N. (2013). İzmit’in kentsel gelişimi ve planlama deneyimi. İzmit Belediyesi Kültür Yayınları.
- Gür, S. (2000). Türkiye’de toplu konut politikaları ve uygulamaları. YEM Yayınevi.
- Özdemir, S. (2008). Türkiye’de neoliberal kentleşme ve konut politikaları. Sosyal Araştırmalar Vakfı.
- TOKİ. (2015). Kocaeli ili toplu konut projeleri faaliyet raporu. Toplu Konut İdaresi Başkanlığı.
- Balamir, M. (2002). Deprem üzerine: 1999 Marmara ve Düzce depremlerinin öğrettikleri. ODTÜ Mimarlık Fakültesi Dergisi, 19(1-2), 61-78.
- Kocaeli Provincial Directorate. (2020). Kocaeli ili konut sektörü analizi. Çevre ve Şehircilik Bakanlığı.
Figure 1.
Spatial development of Kocaeli macroform in different time periods.
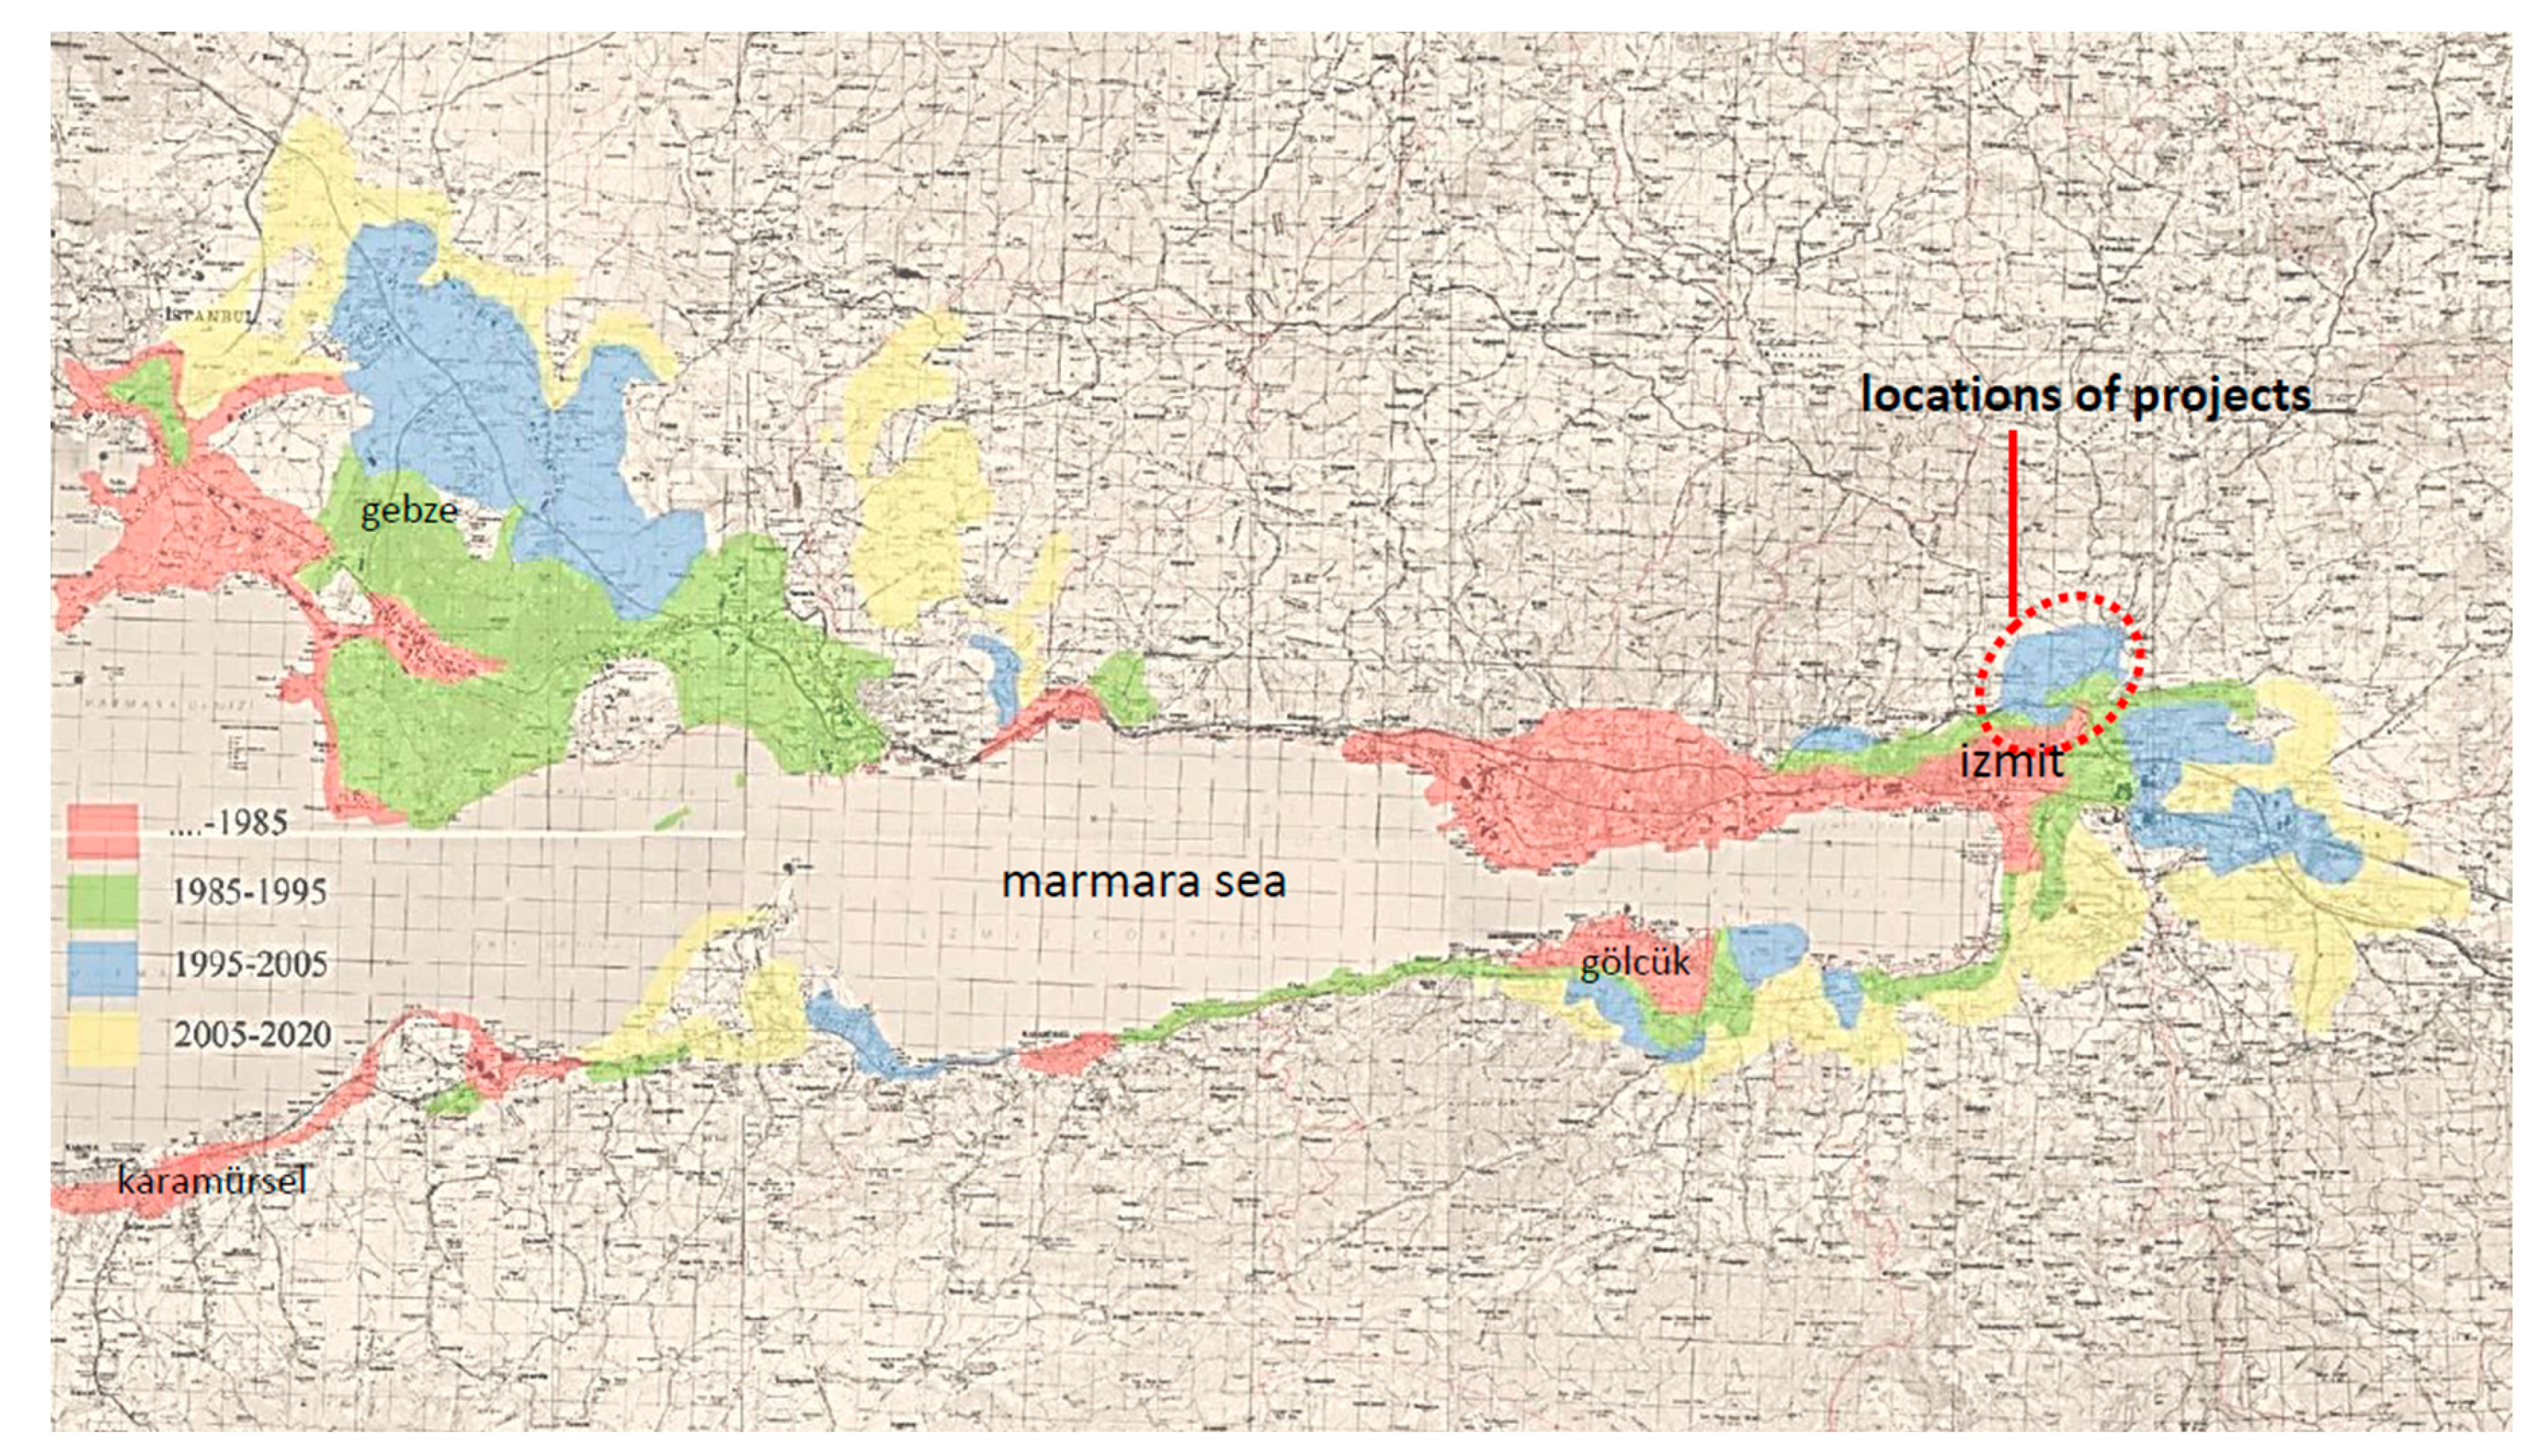
Figure 2.
Locations of Mass Housing Projects in the Study.
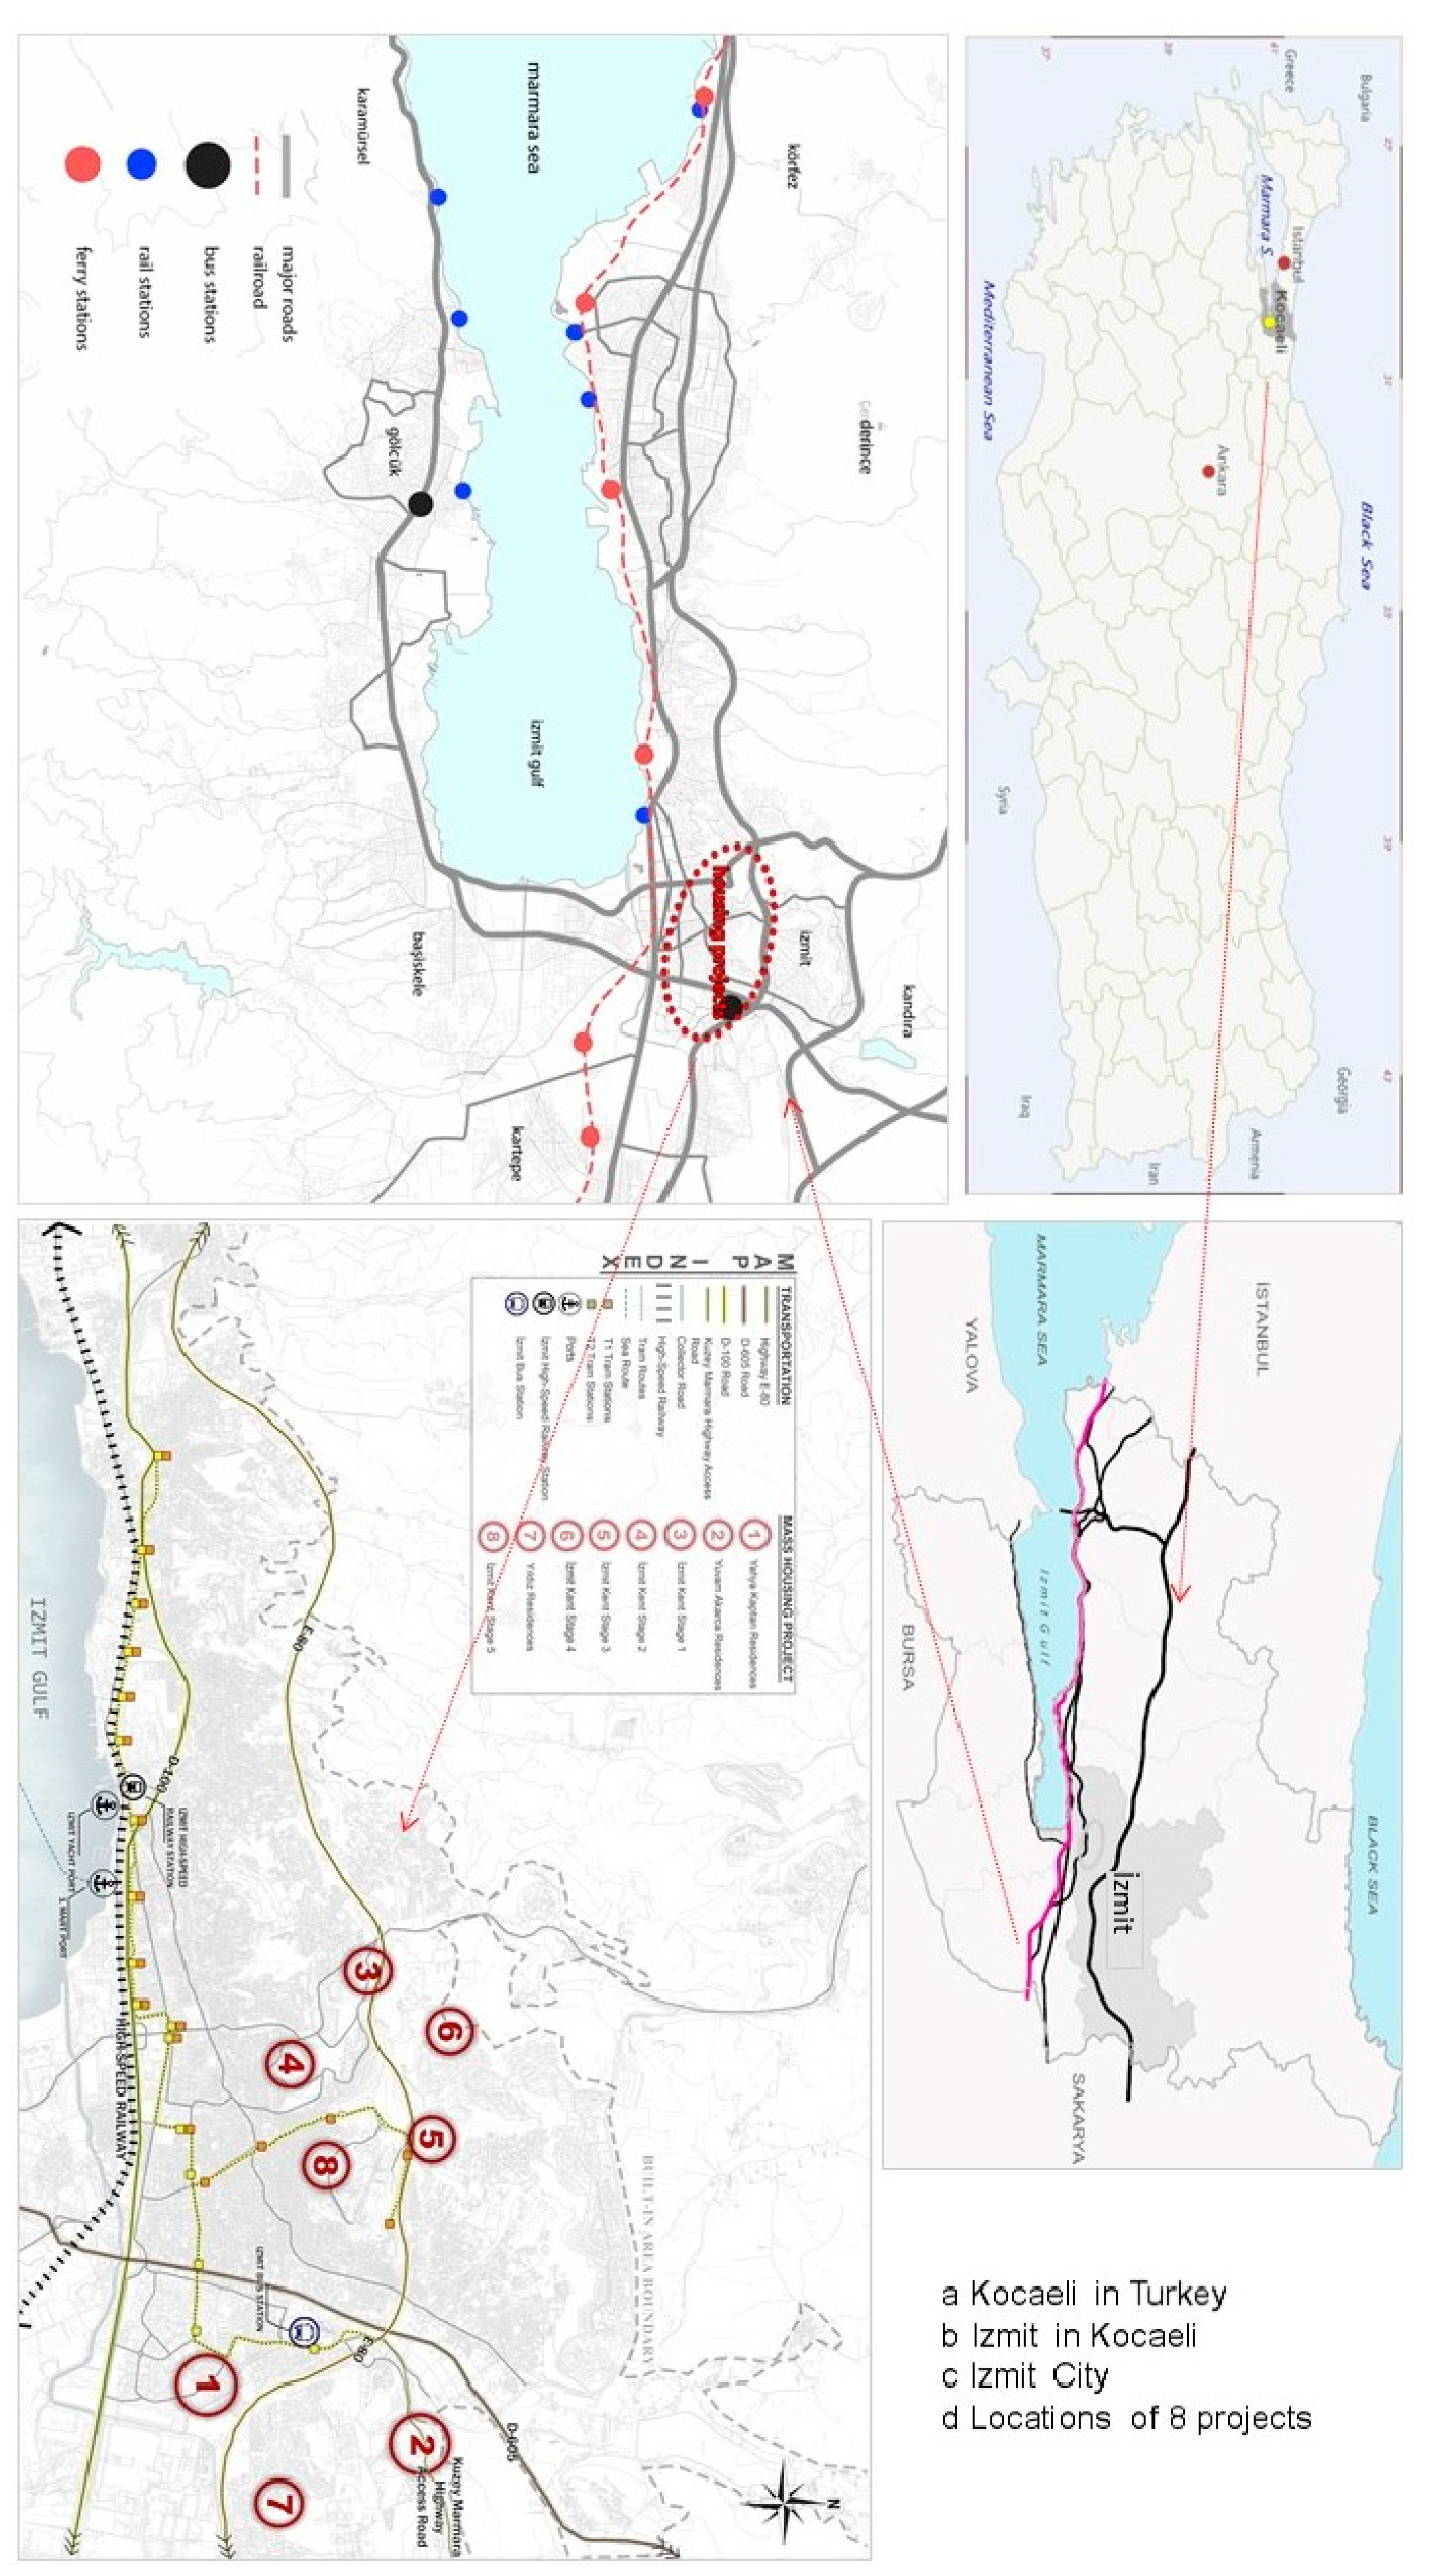
Figure 3.
Photographs of Mass Housing Projects in the Study.
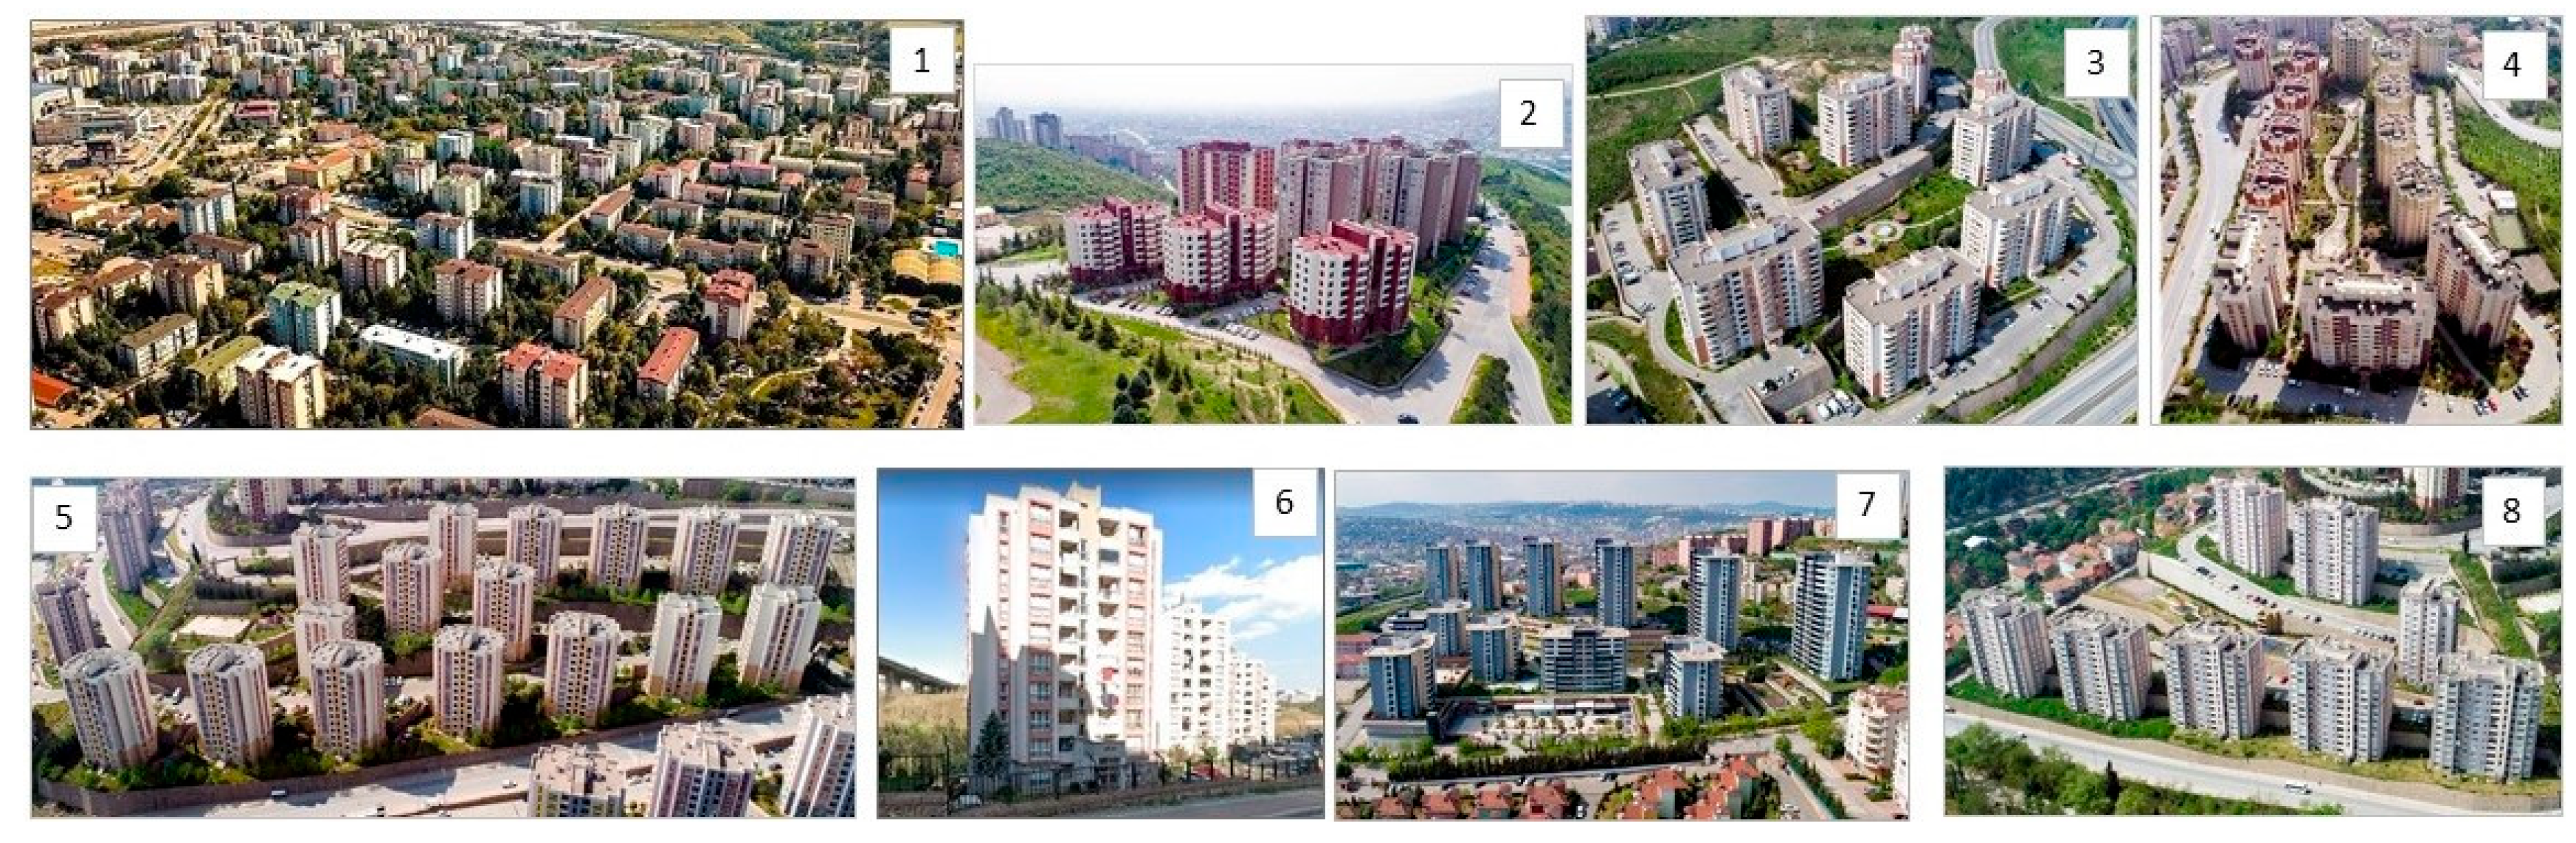
Figure 4.
Site plans.
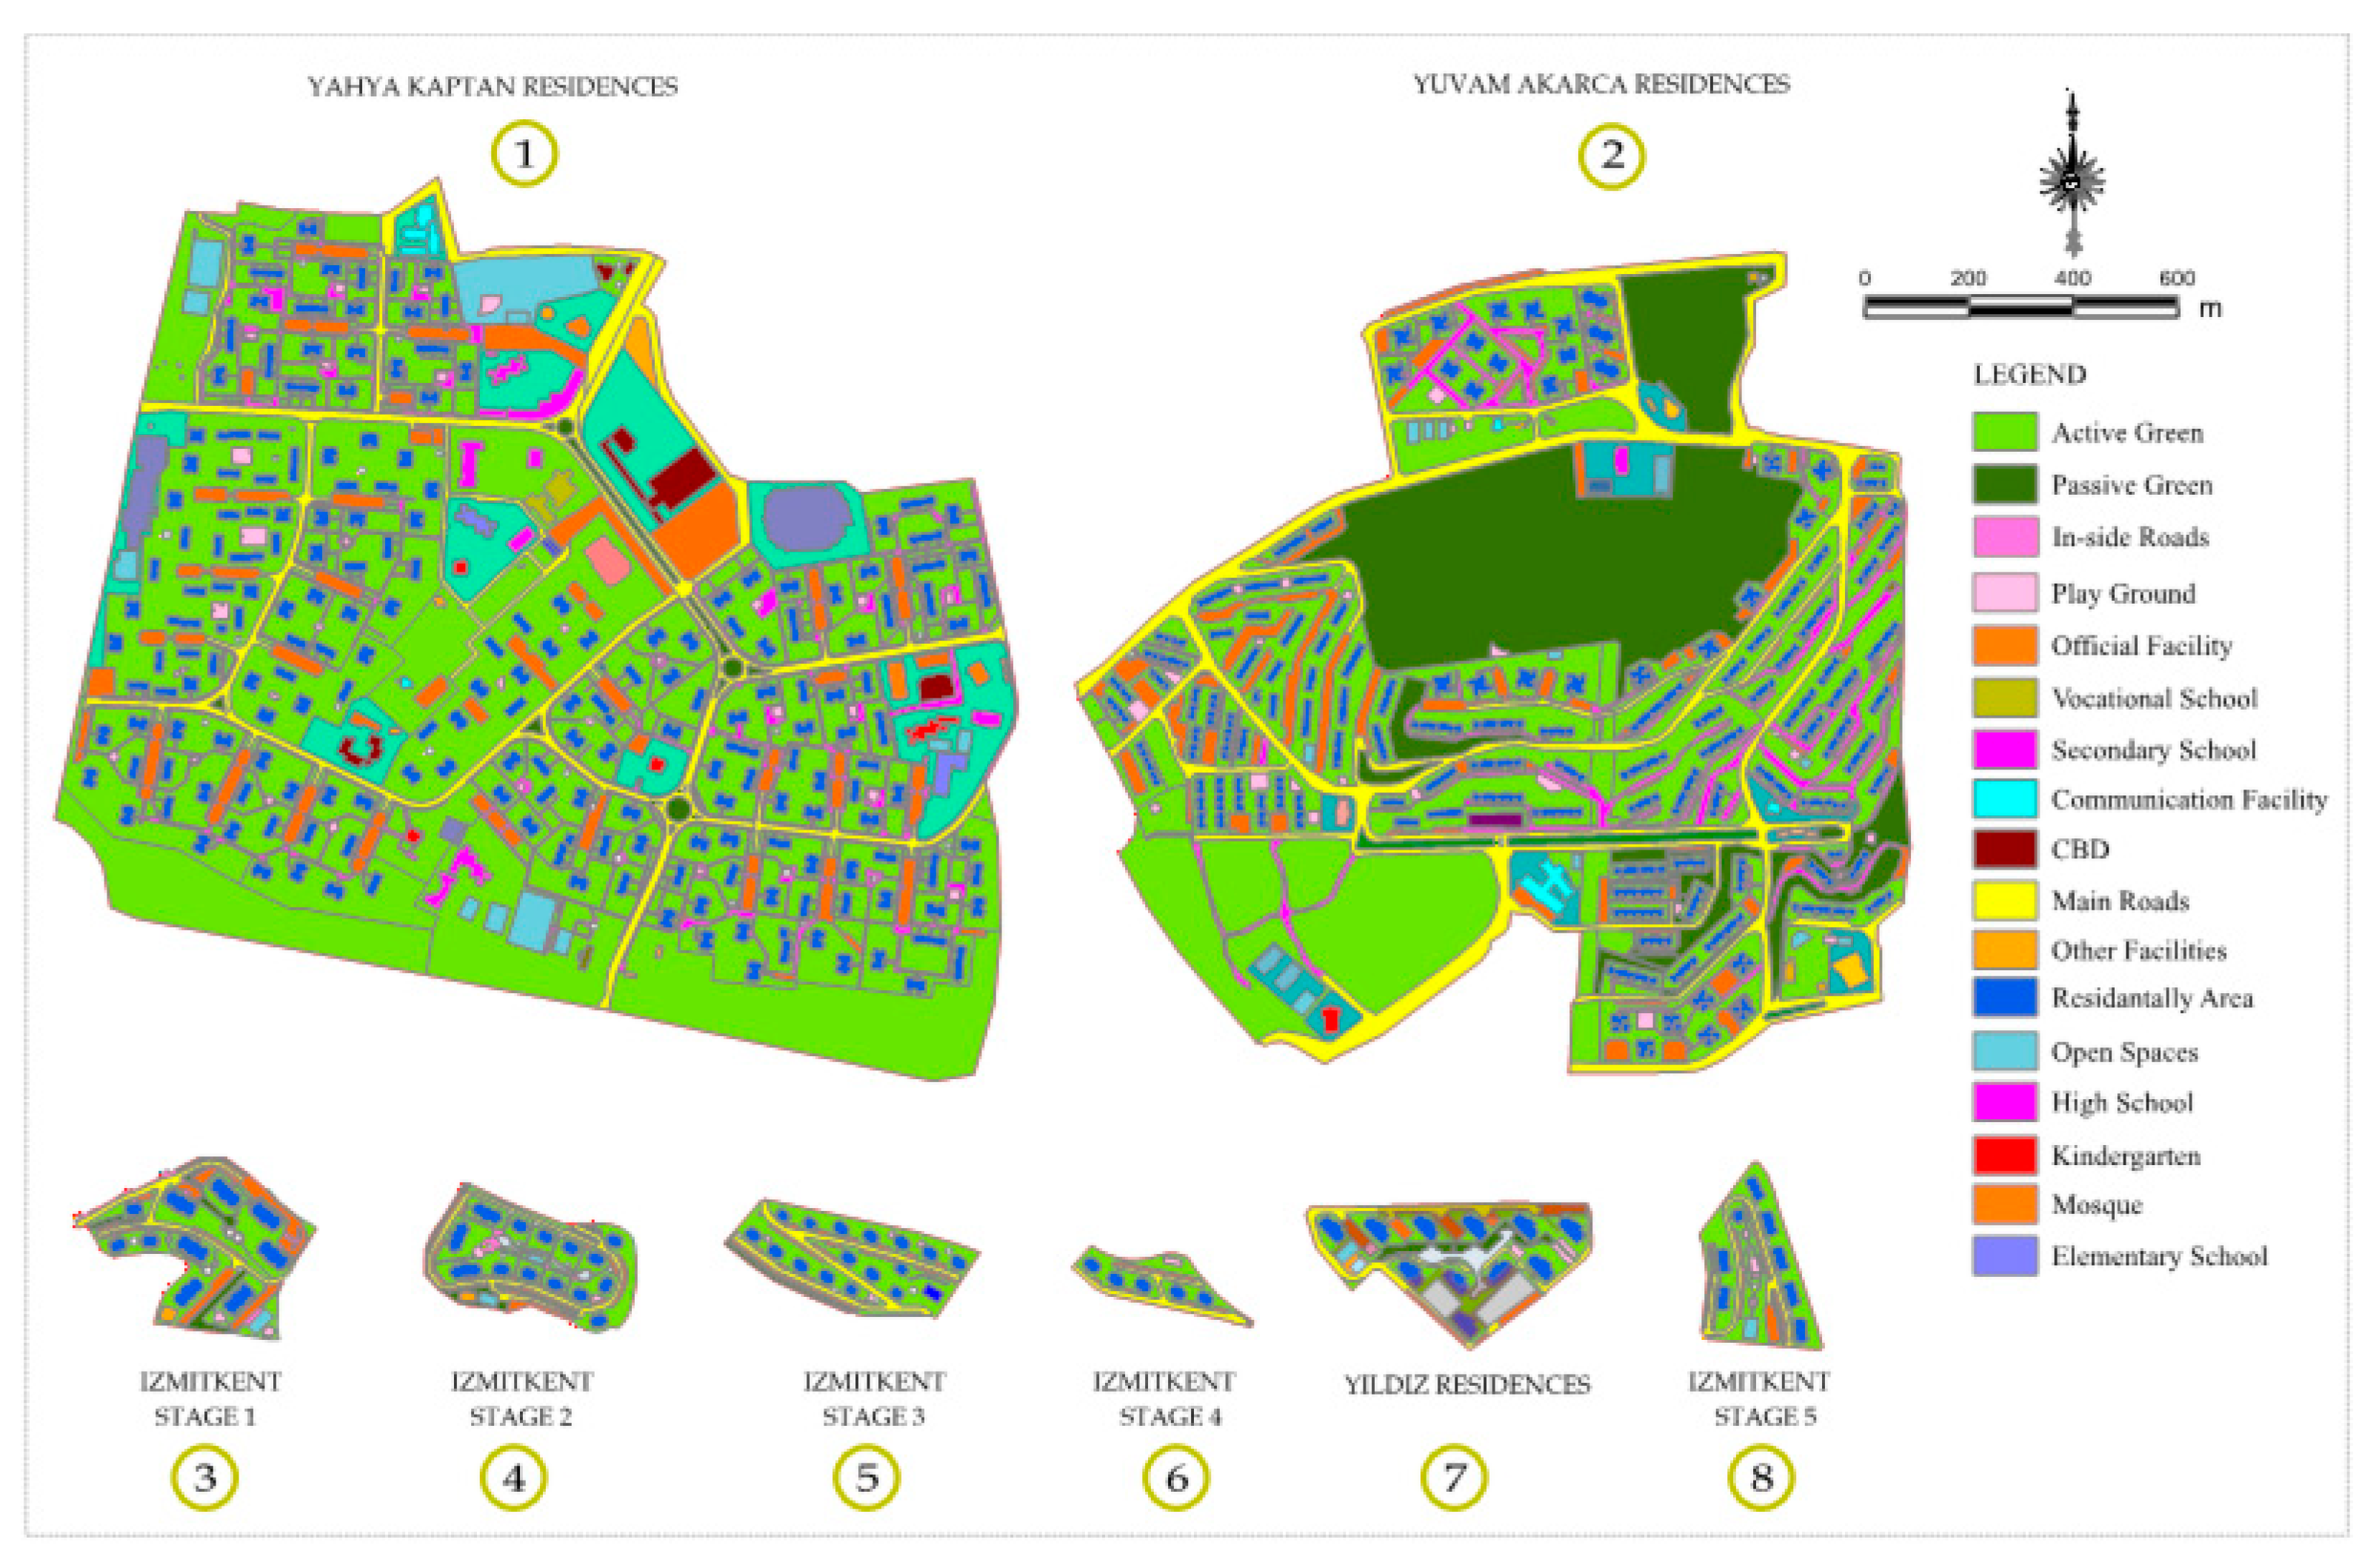
Figure 6.
Realized BCR.
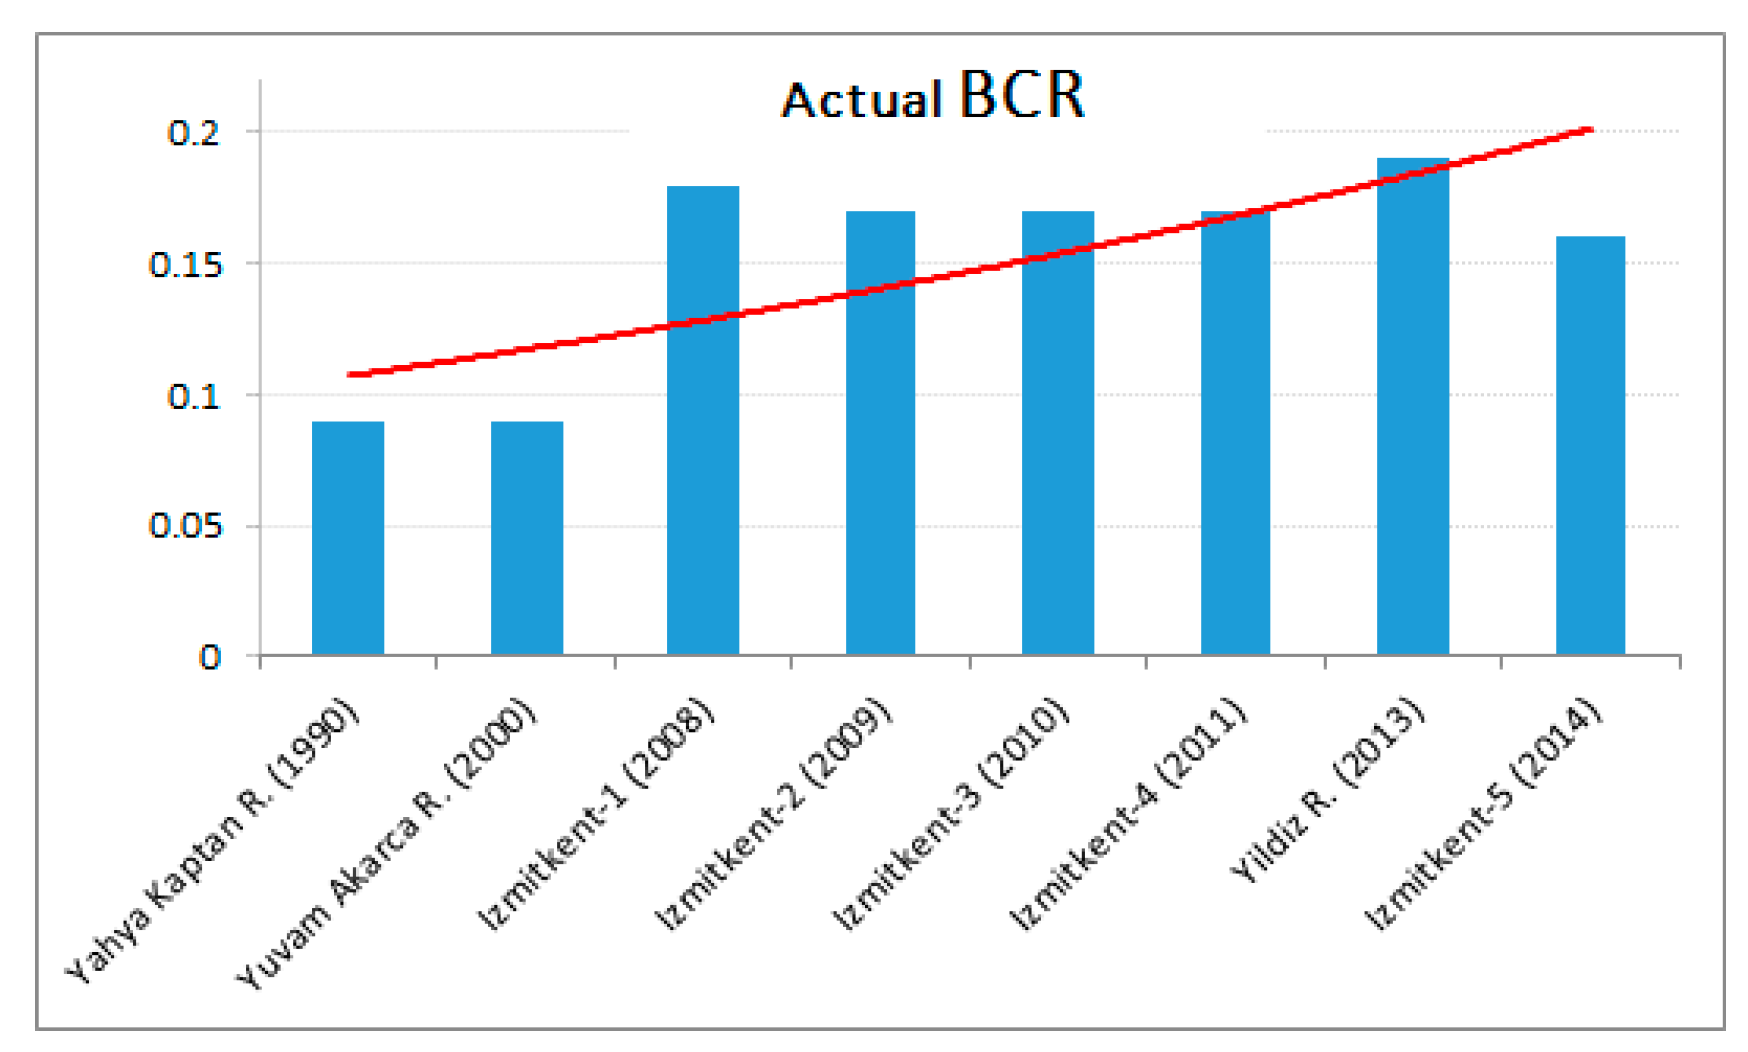
Figure 7.
Realized FAR.
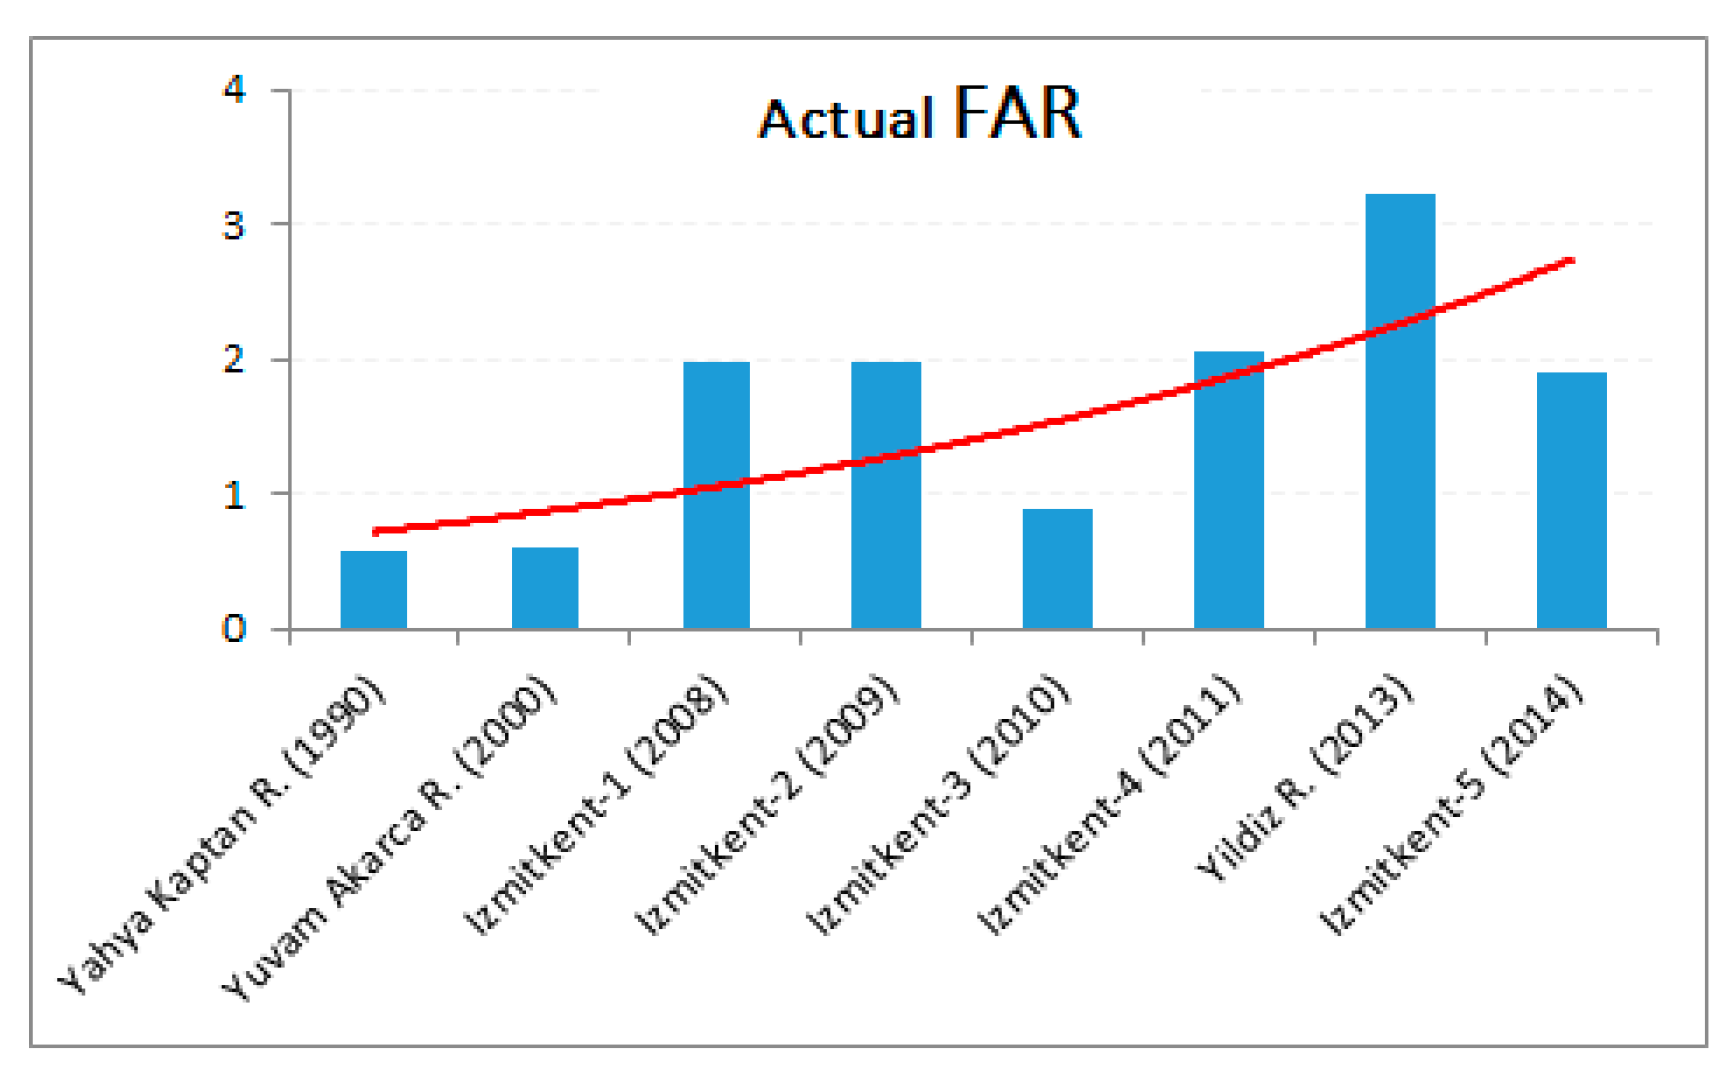
Figure 8.
Number of car parking.
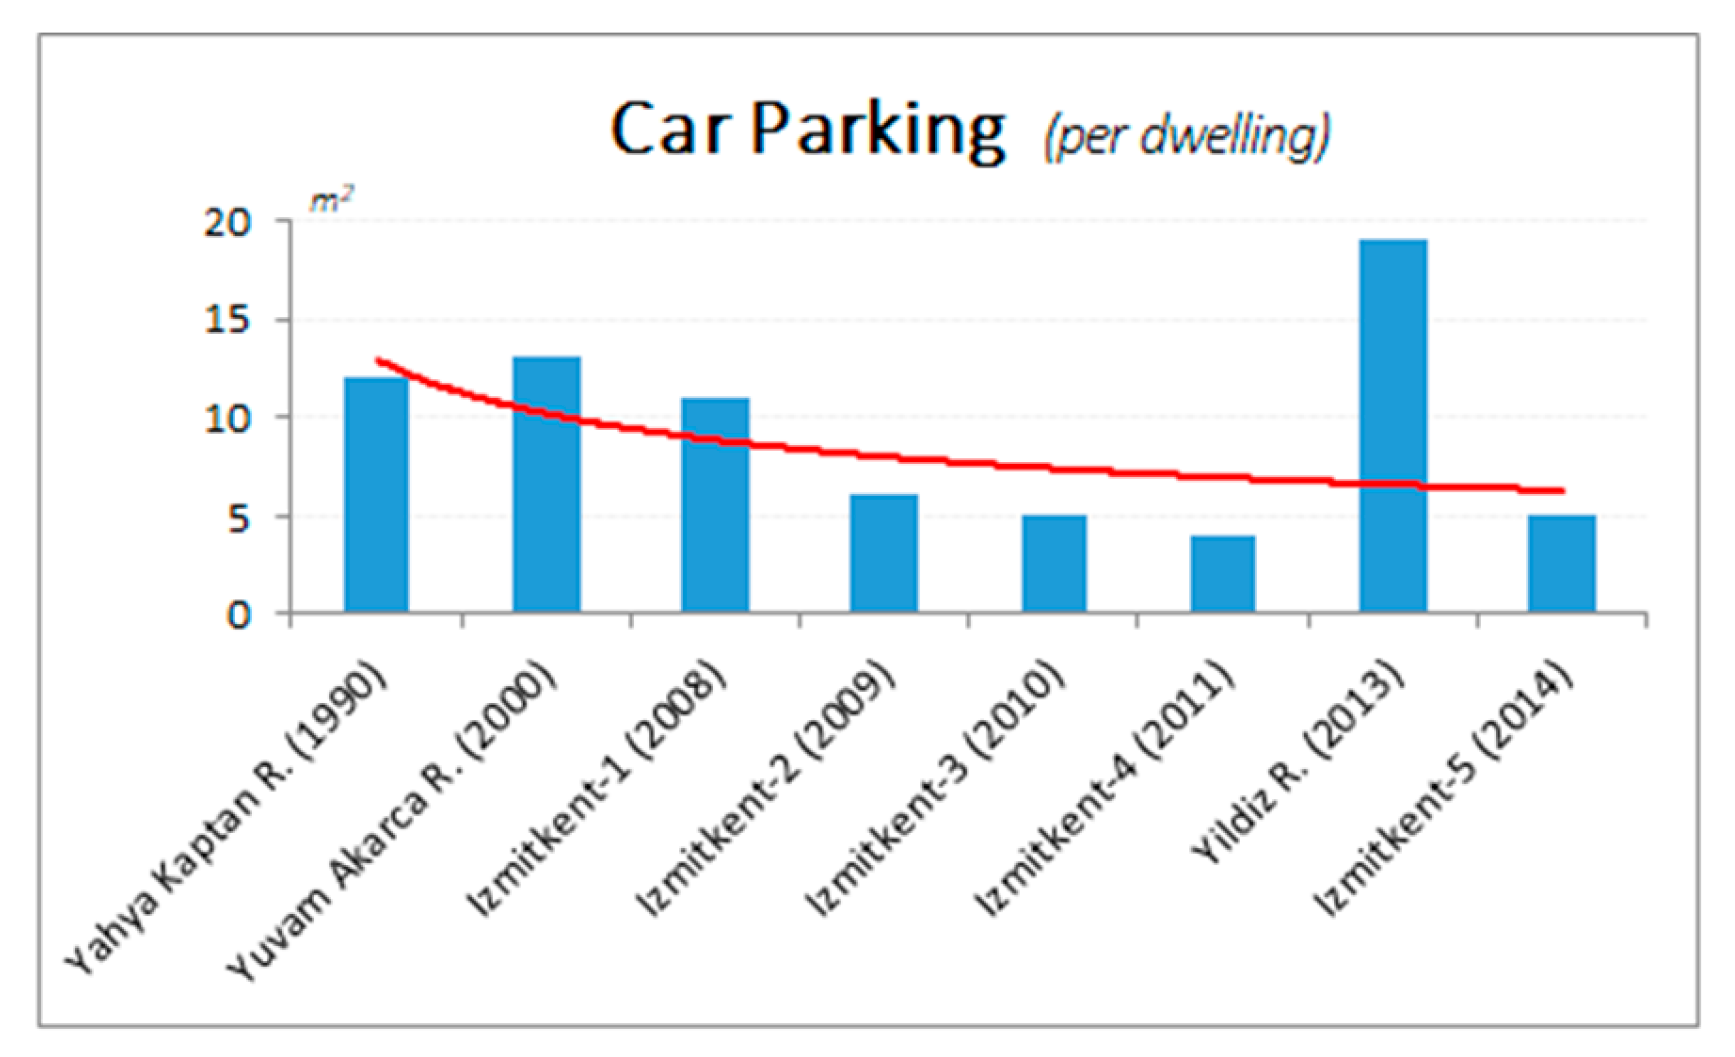
Figure 9.
Ratio of CP to PA.
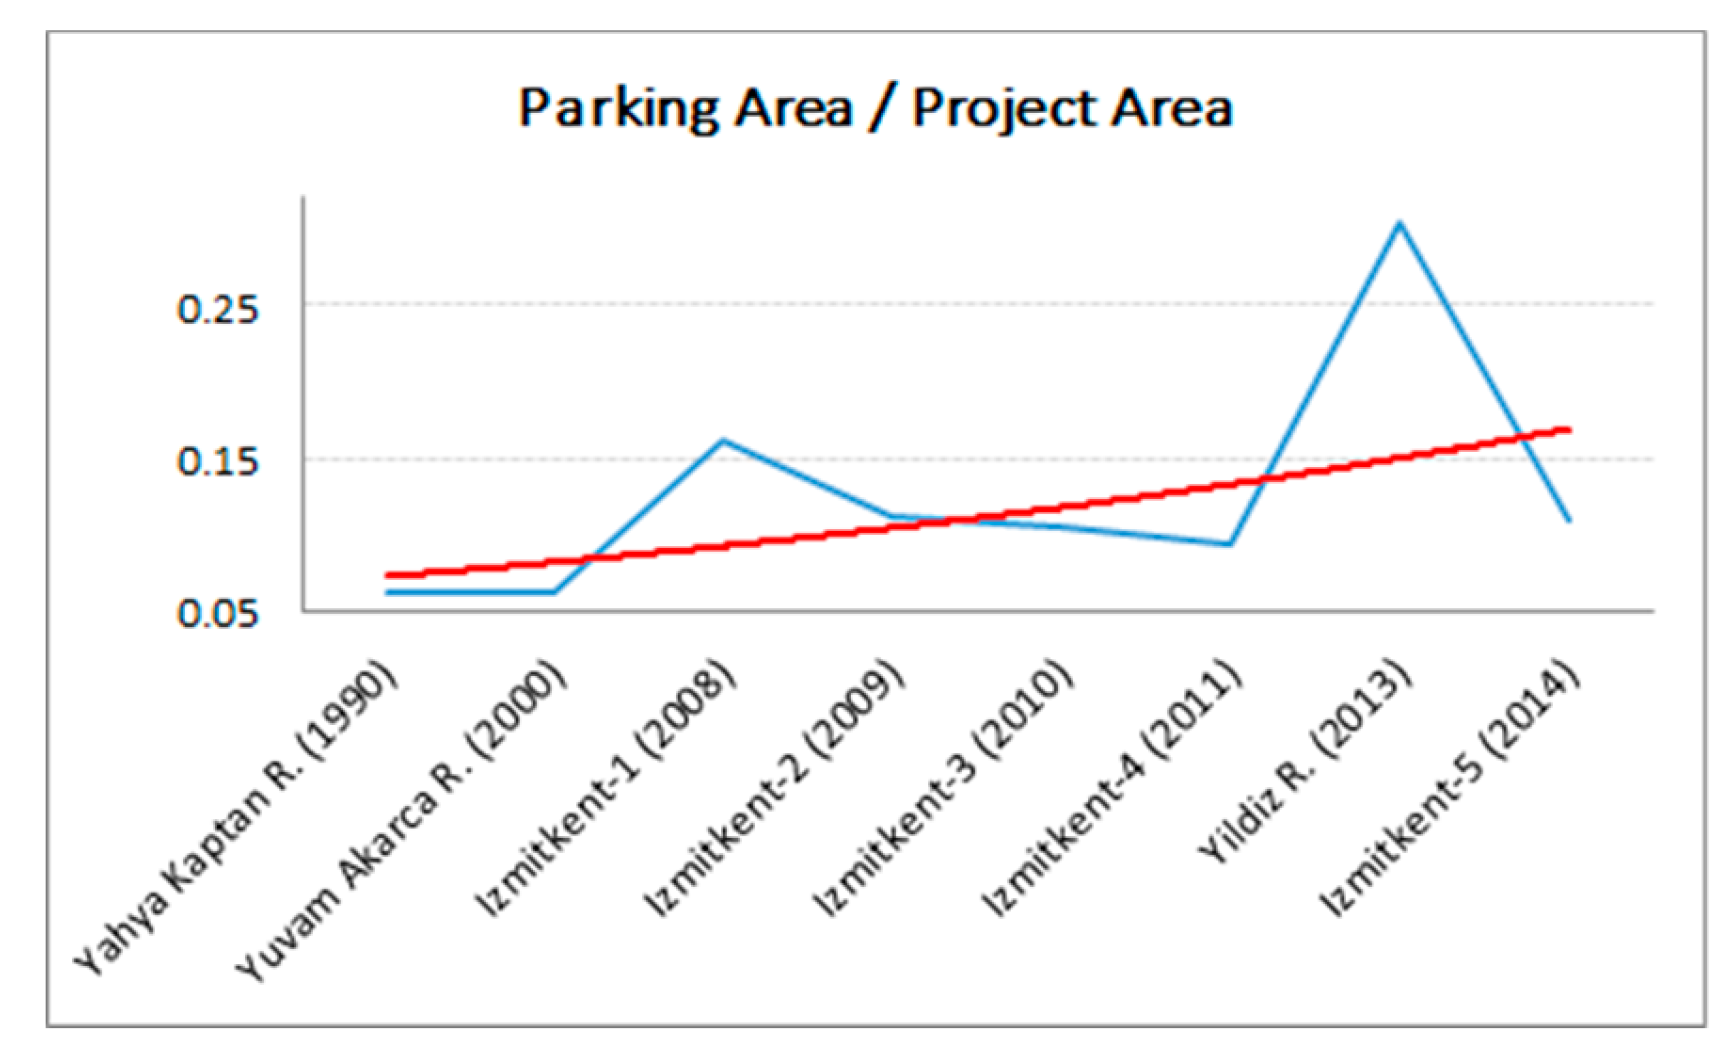
Figure 10.
Temporal change in AG
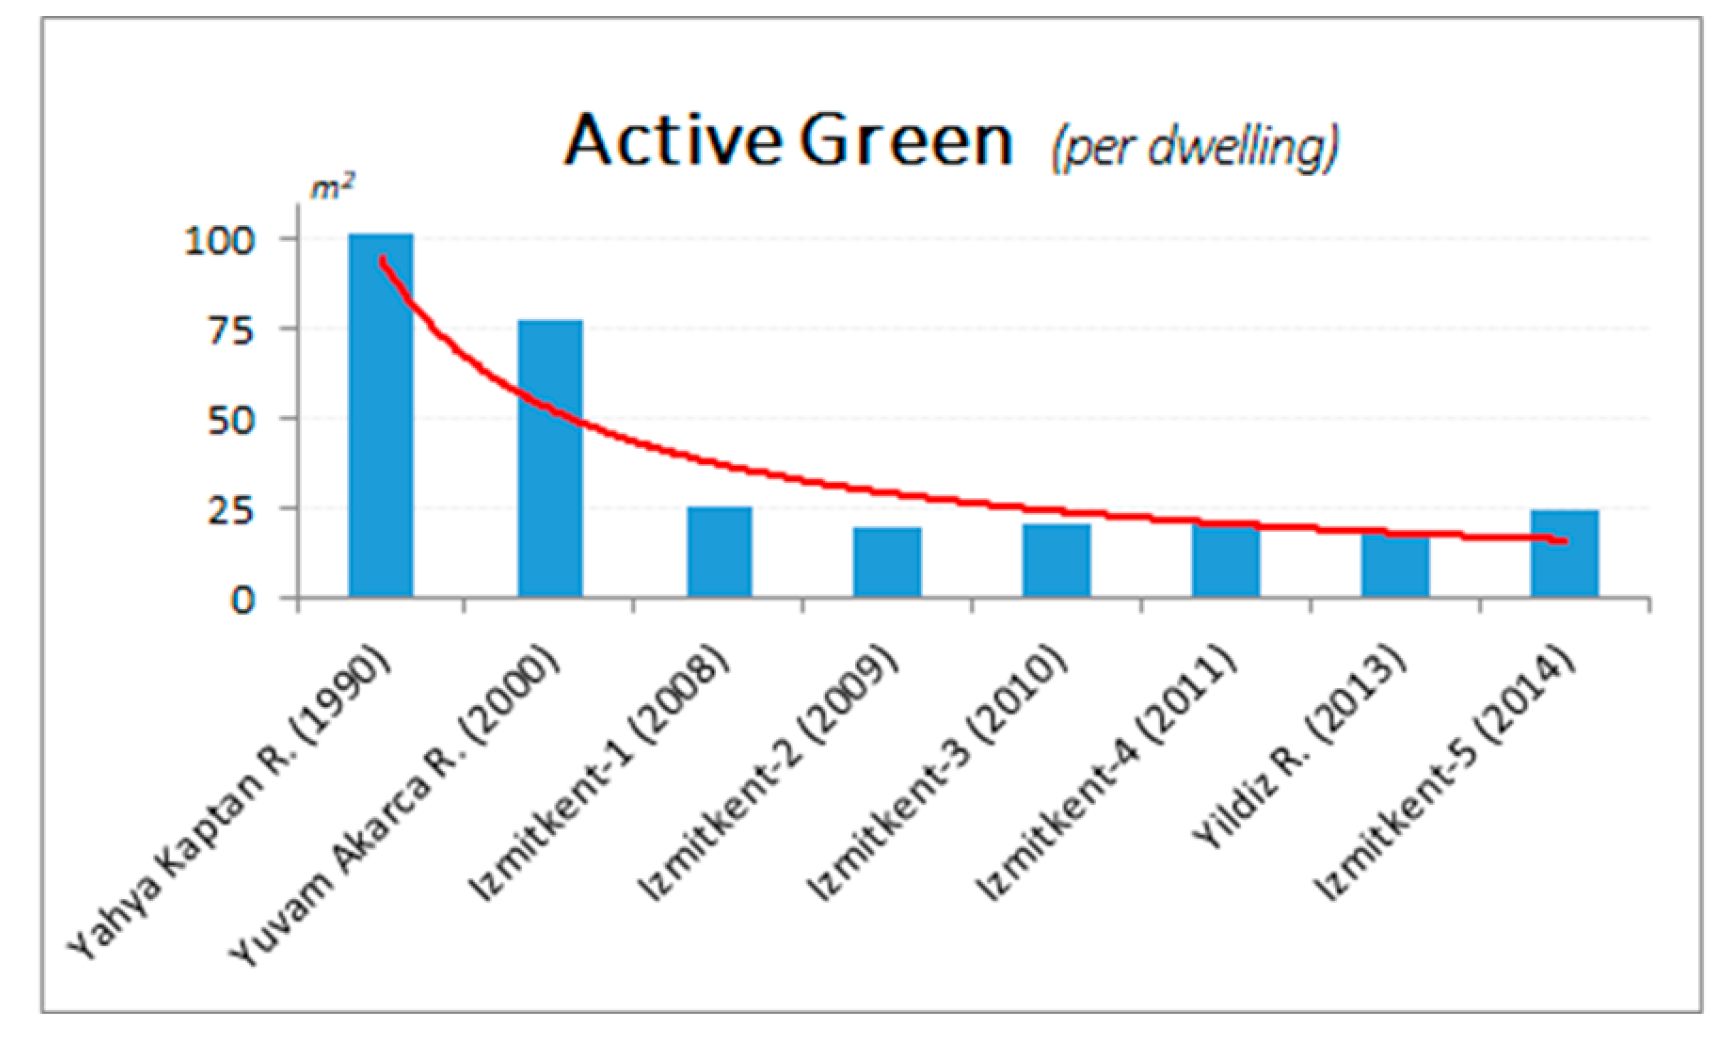
Figure 11.
Ratio of AG to BCA.
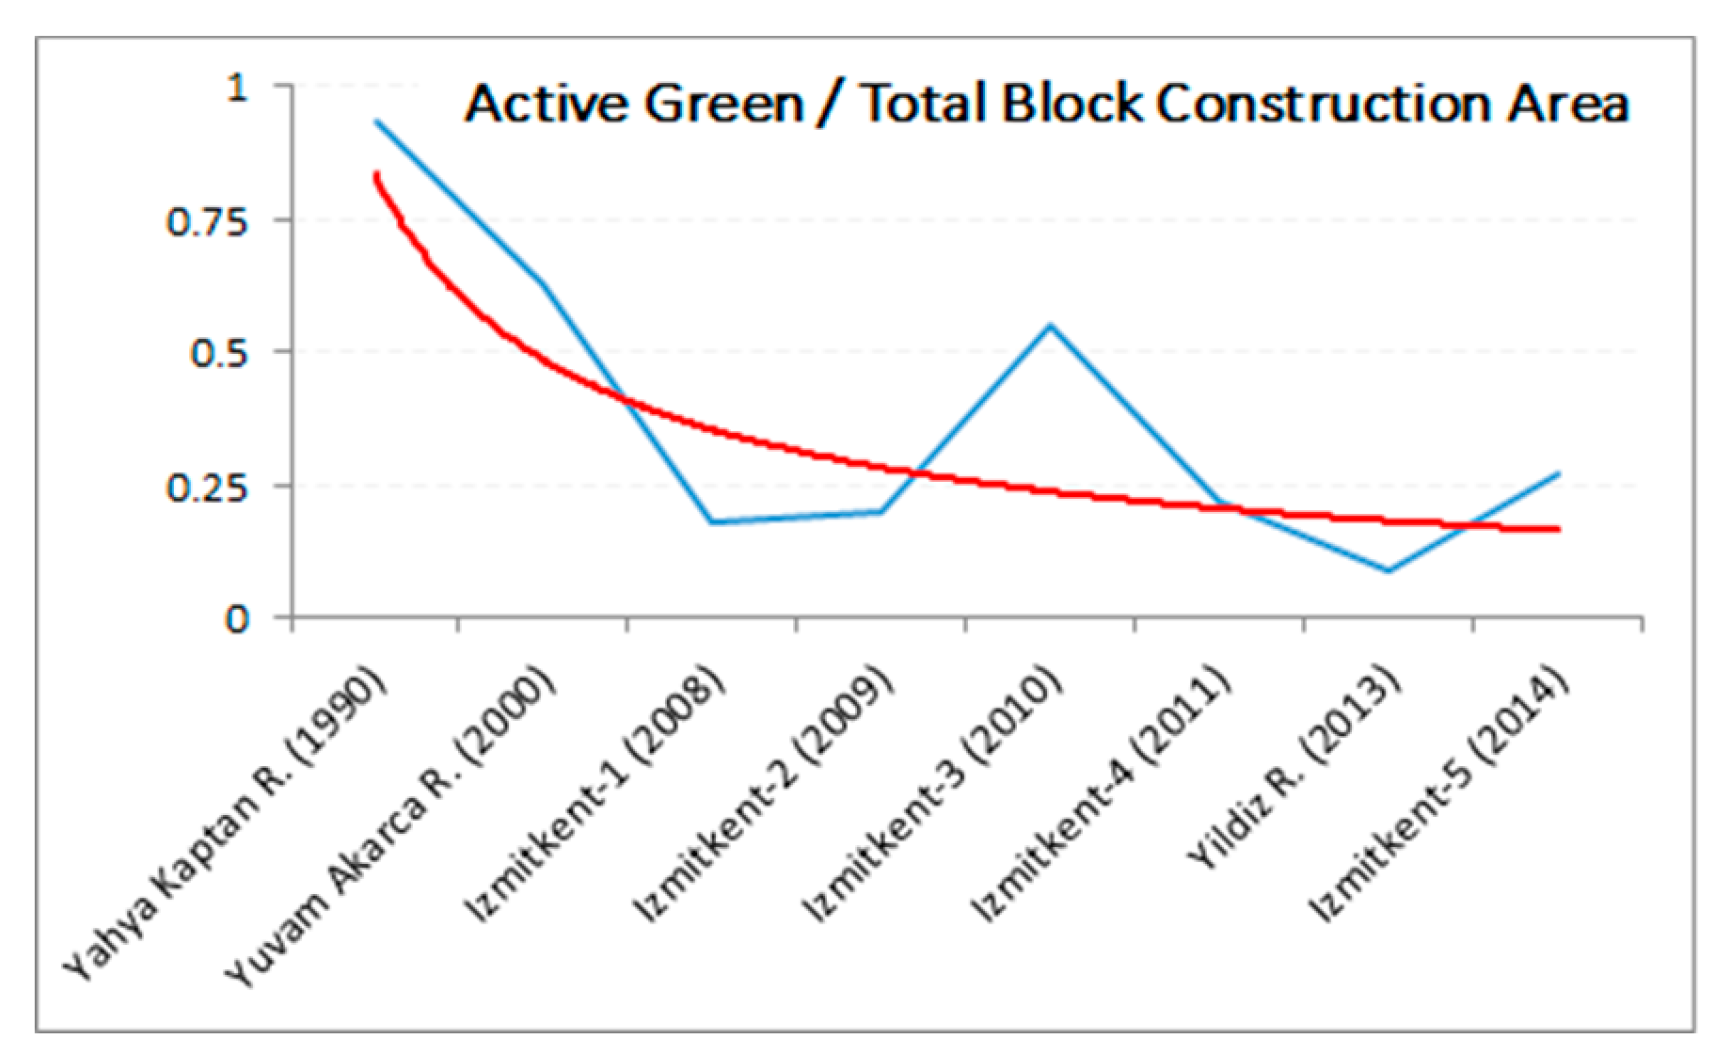
Figure 12.
Trend of BPI.
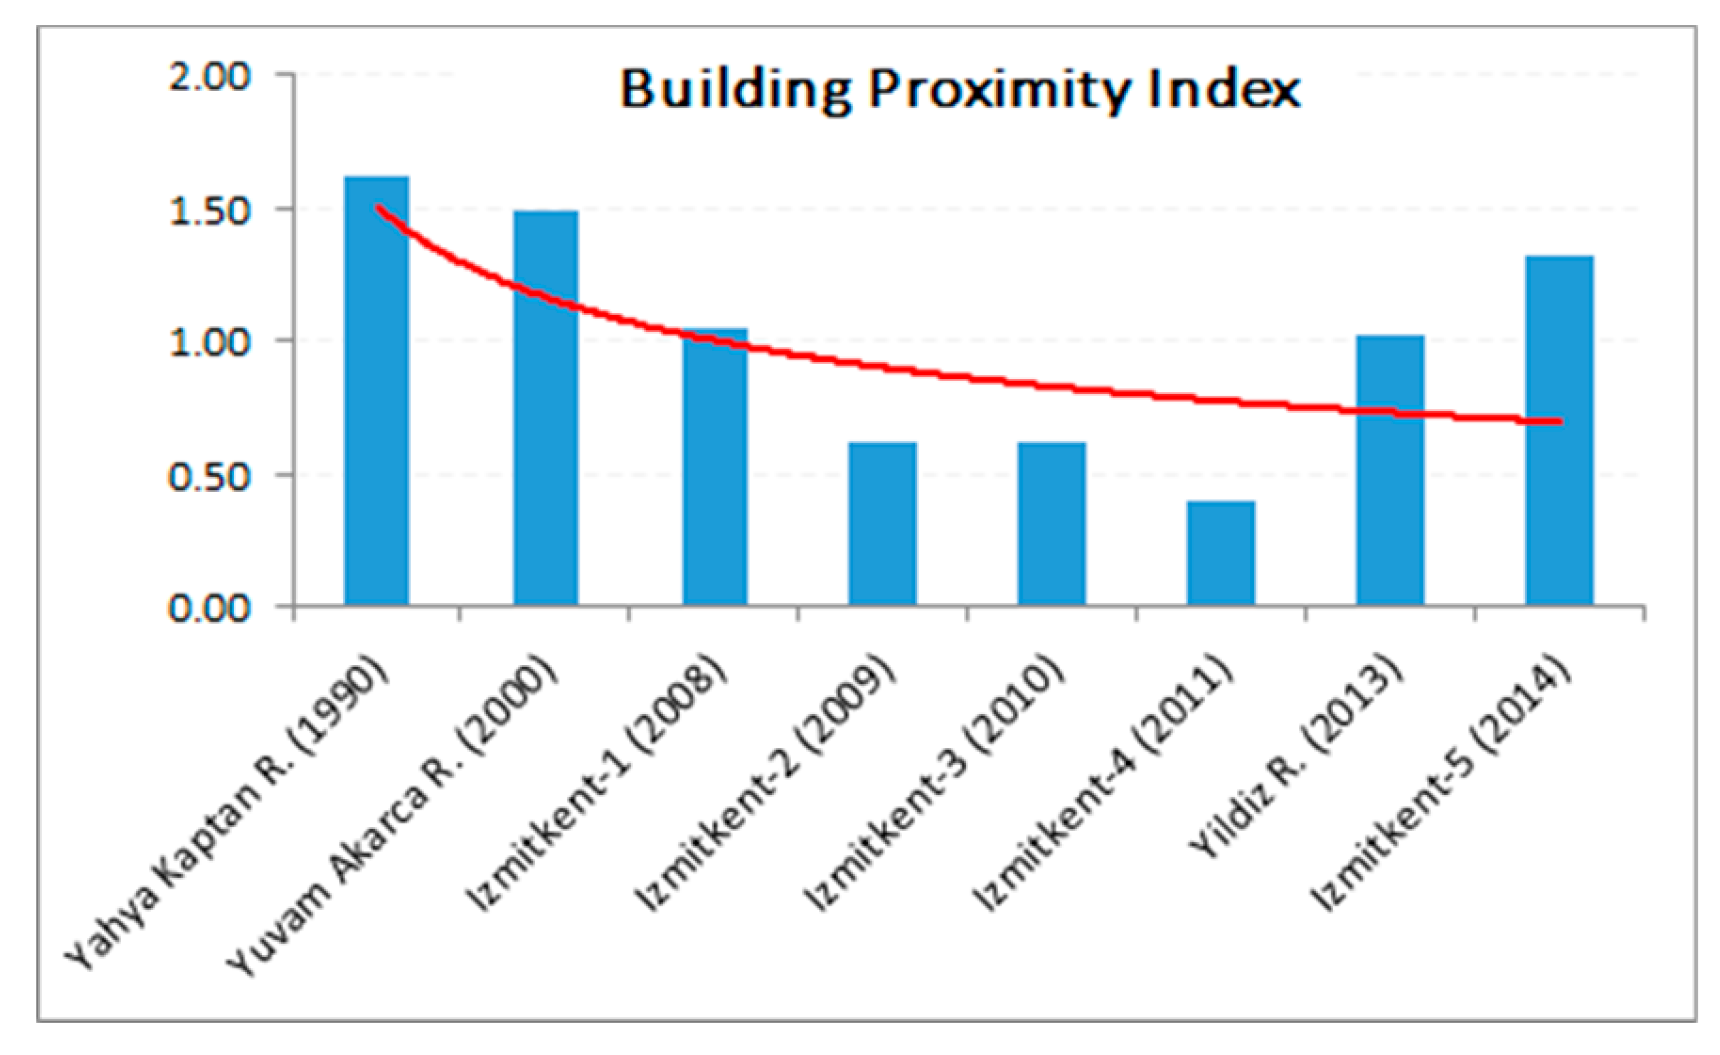
Figure 13.
Ratio of PA to DU.
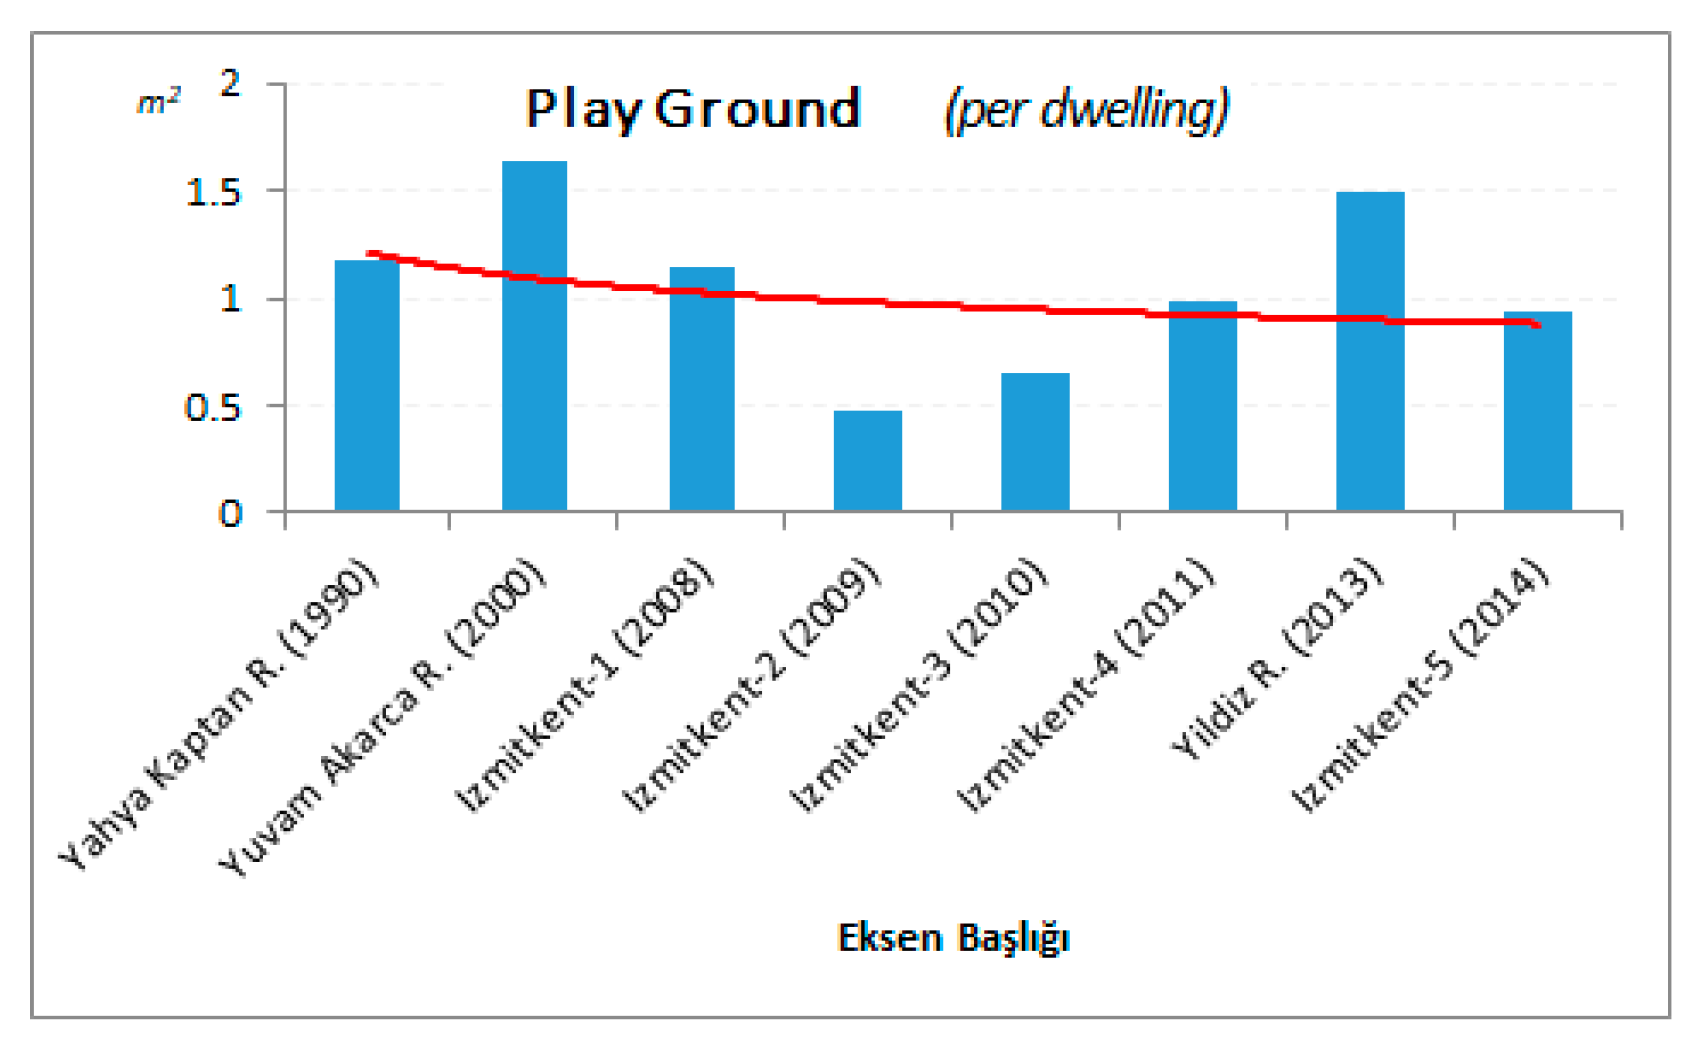
Figure 14.
Ratio of SF to DU.
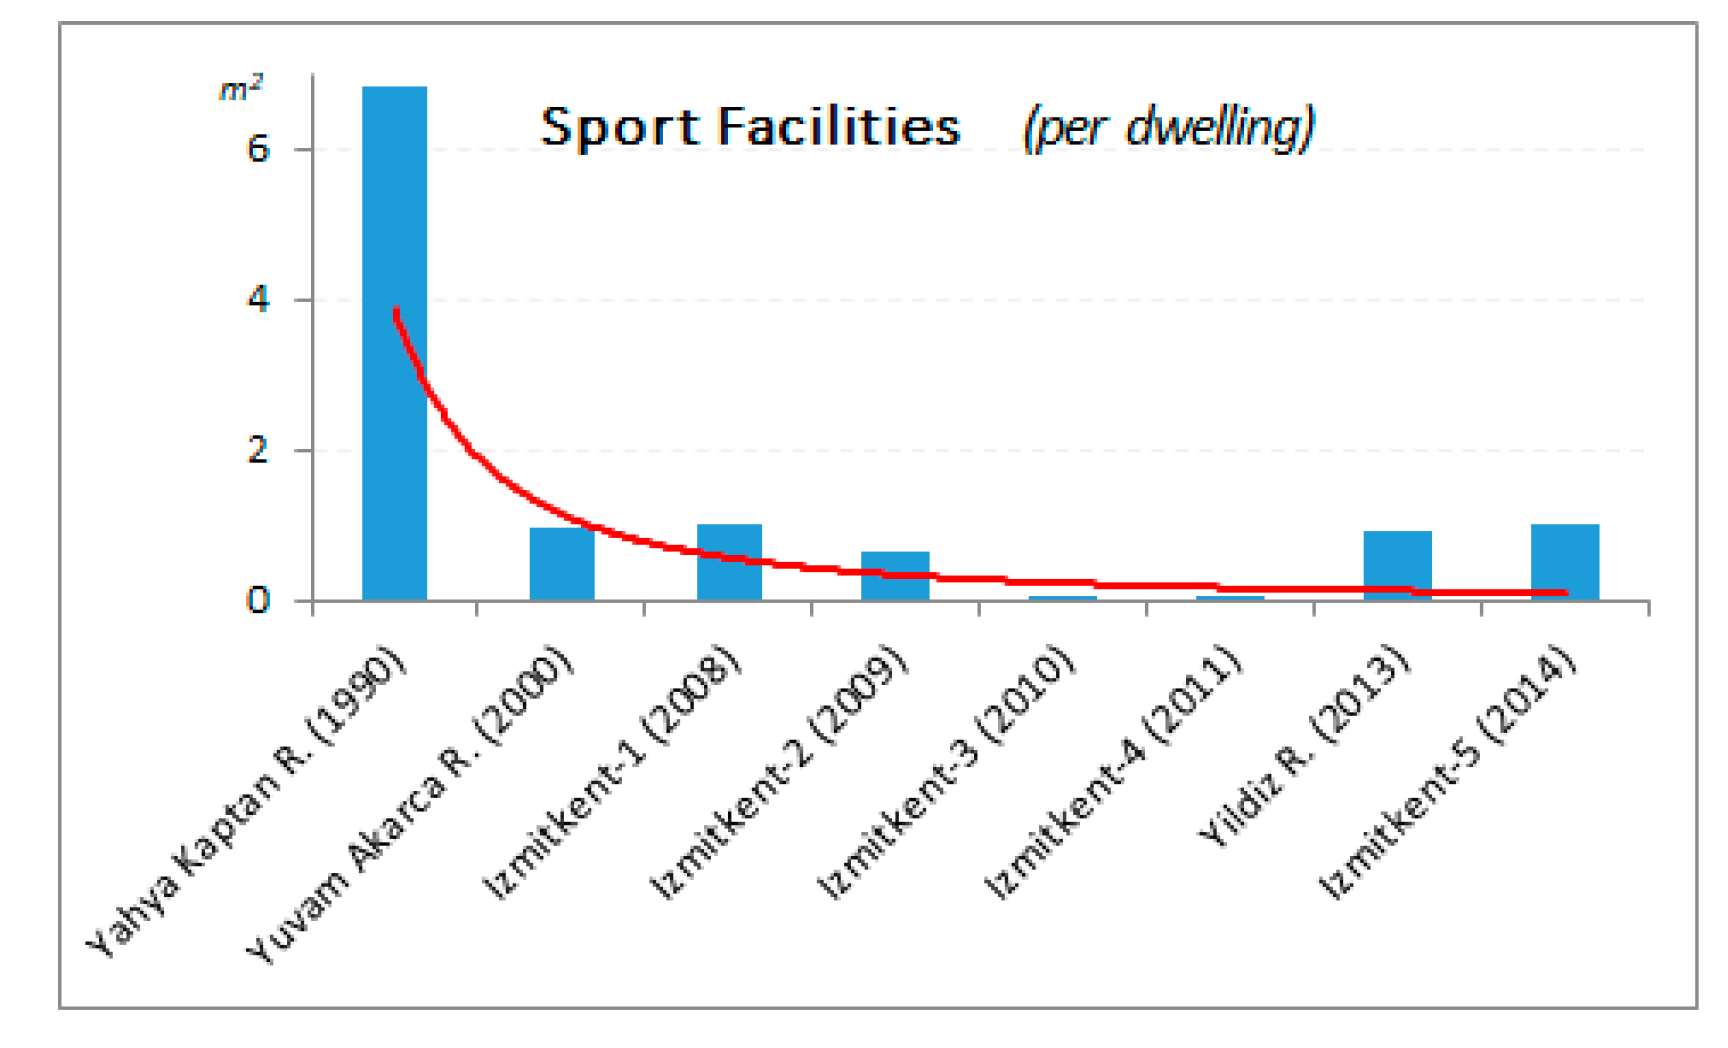
Figure 15.
Reasons of density.
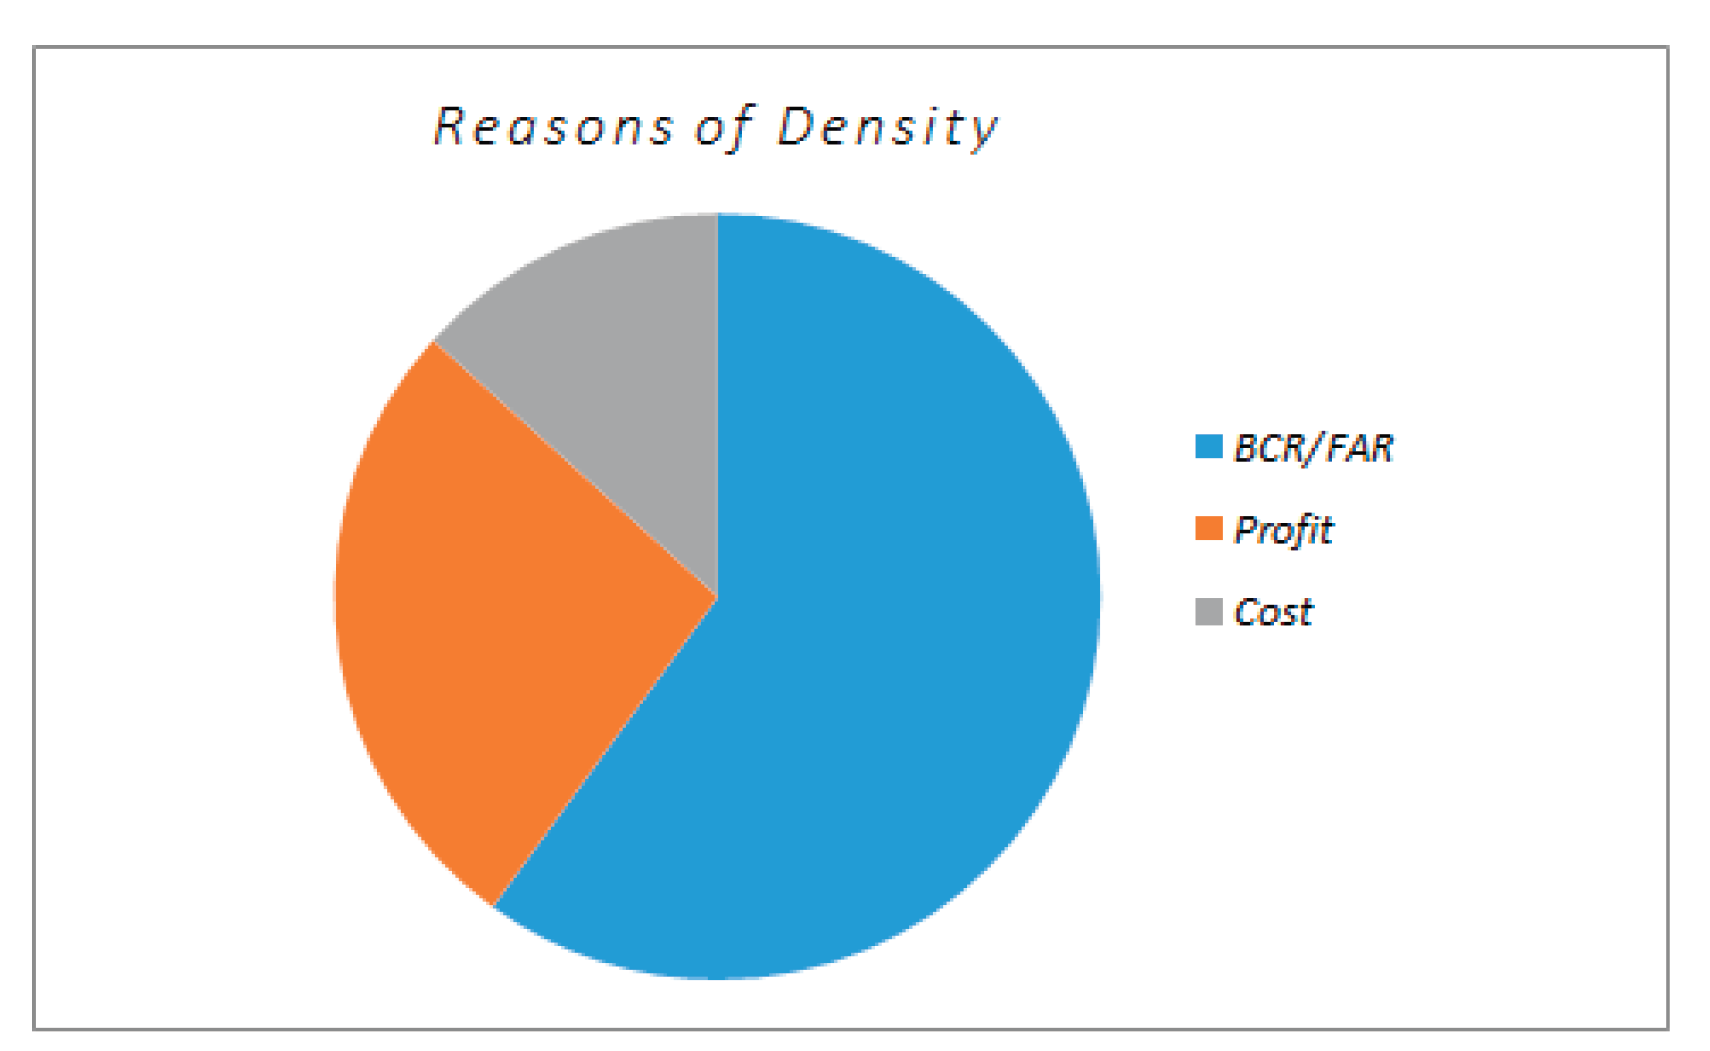
Figure 16.
Excluded parts on BCR.
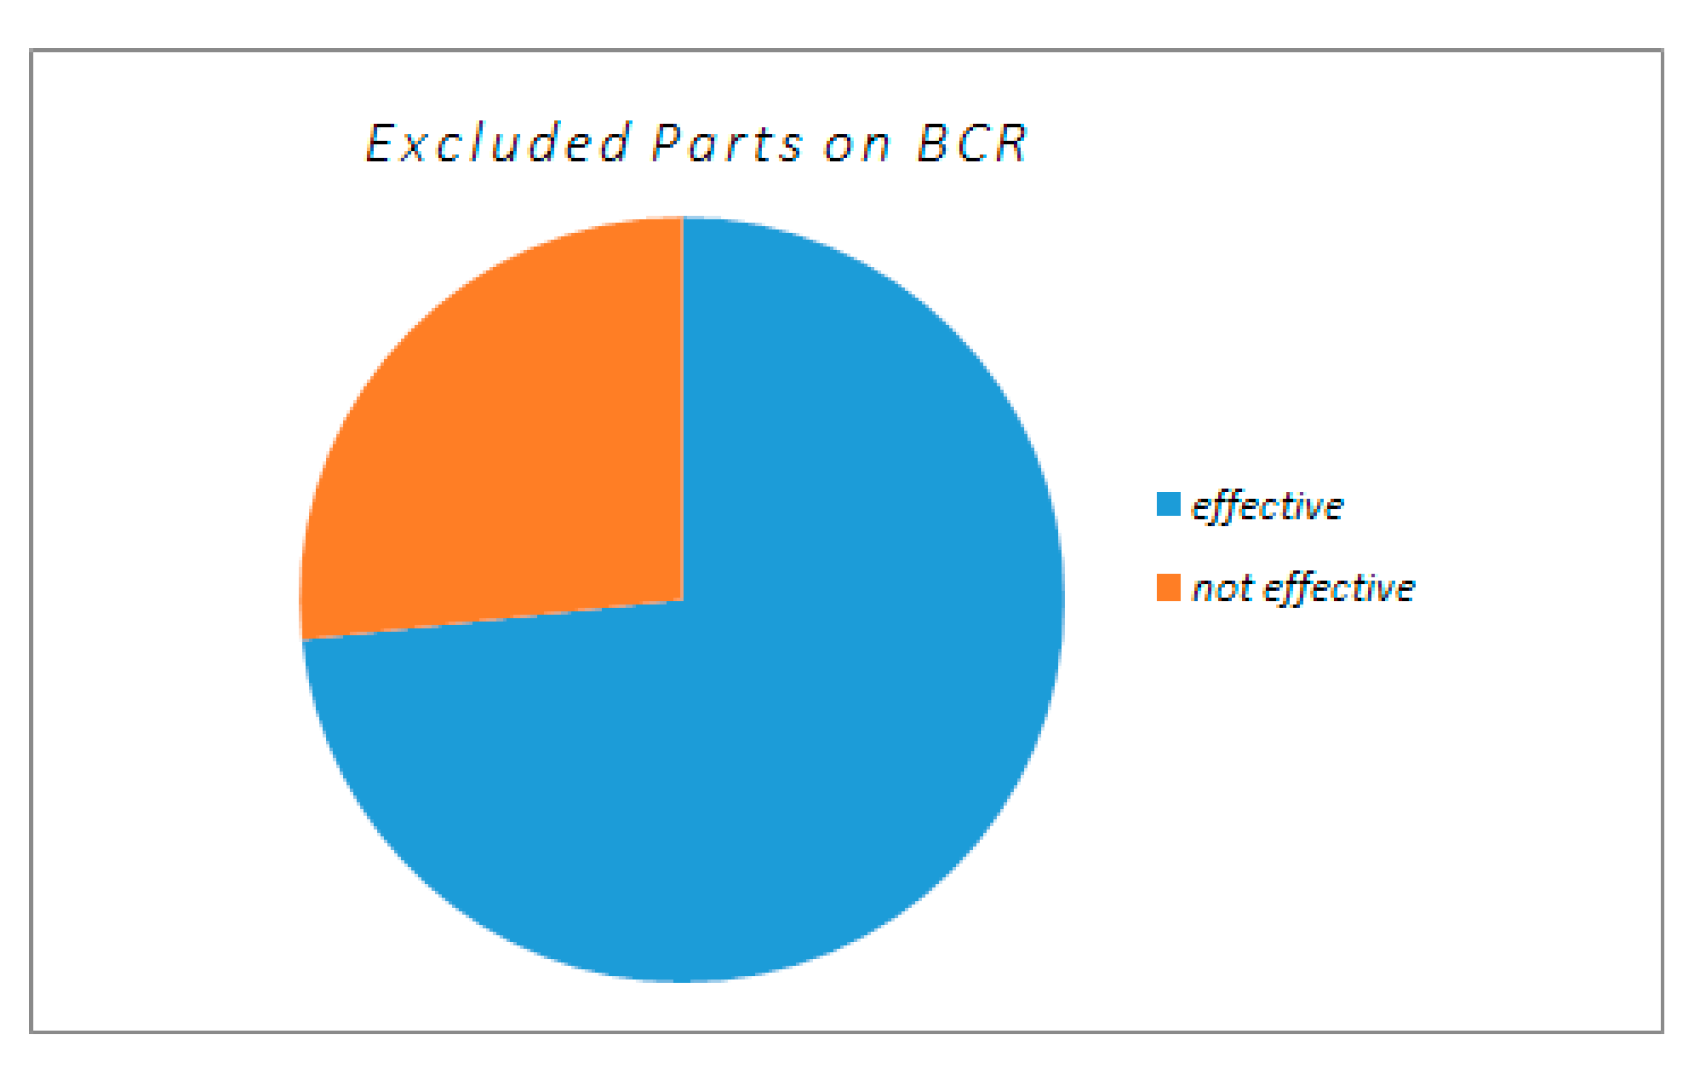
Figure 17.
Expert preferences on amenities.


Table 1.
Comparison of physical characteristics of the project areas in Izmit.
| Projects | PA (m²) | B | BCA (m²) | BFA (m²) | DU | AG (m²) | PG (m²) | SF (m²) | CP (m²) |
|---|---|---|---|---|---|---|---|---|---|
| Yahya Kaptan R. | 1014379 | 210 | 93212 | 590015 | 5386 | 551192 | 6379 | 36887 | 63213 |
| Yuvam Akarca R. | 810760 | 132 | 70244 | 483857 | 3899 | 303416 | 6384 | 3812 | 51694 |
| Izmitkent-1 | 40683 | 10 | 7257 | 80521 | 555 | 14369 | 632 | 573 | 6634 |
| Izmitkent-2 | 34393 | 14 | 5942 | 68151 | 679 | 13790 | 319 | 458 | 3832 |
| Izmitkent-3 | 30726 | 16 | 5129 | 27106 | 696 | 14885 | 449 | 0 | 3237 |
| Izmitkent-4 | 10536 | 5 | 1803 | 21636 | 220 | 4738 | 216 | 0 | 983 |
| Yildiz R. | 43596 | 11 | 8307 | 141226 | 687 | 12401 | 1028 | 622 | 13268 |
| Izmitkent-5 | 24322 | 8 | 3830 | 46467 | 494 | 12467 | 464 | 499 | 2675 |
PA: Project Area, B: Number of Block, BCA: Building Coverage Area, BFA: Block Floor Area; DU: Number of Detached Unit, CP: Car Parking, AG: Active Green, PG: Play Ground, SF: Sport Facilities.
Table 2.
Realized land use indicators in the project areas of Izmit.
| Project. | Year | CP / DU | AG / DU | PG/ DU | SF / DU | A.BCR | A.FAR | BPİ |
|---|---|---|---|---|---|---|---|---|
| Yahya Kaptan R. | 1990 | 12 | 102 | 1,18 | 6,85 | 0,09 | 0,58 | 1,627 |
| Yuvam Akarca R. | 2000 | 13 | 78 | 1,64 | 0,98 | 0,09 | 0,60 | 1,491 |
| Izmitkent-1 | 2008 | 11 | 26 | 1,14 | 1,03 | 0,18 | 1,98 | 1,047 |
| Izmitkent-2 | 2009 | 6 | 20 | 0,47 | 0,67 | 0,17 | 1,98 | 0,622 |
| Izmitkent-3 | 2010 | 5 | 21 | 0,65 | 0,00 | 0,17 | 0,88 | 0,620 |
| Izmitkent-4 | 2011 | 4 | 22 | 0,98 | 0,00 | 0,17 | 2,05 | 0,395 |
| Yildiz R. | 2013 | 19* | 18 | 1,50 | 0,90 | 0,19 | 3,24 | 1,018 |
| Izmitkent-5 | 2014 | 5 | 25 | 0,94 | 1,01 | 0,16 | 1,91 | 1,319 |
A.BCR: Actual Building Coverage Ratio, A.FAR: Actual Floor Area Ratio, BPİ: Building Proximity Index.
Table 4.
What kind of arrangements are needed to implement a project similar to the 1990 Yahya Kaptan Project?
Table 4.
What kind of arrangements are needed to implement a project similar to the 1990 Yahya Kaptan Project?
| Number of Participants | Percentage | |
|---|---|---|
| Construction and land costs should remain low | 9 | %60 |
| Implementation may be possible through government interventions | 8 | %53 |
| Accurately designed and effectively implemented legislations and planning processes are needed | 5 | %33 |
| The land and ownership structure plays a critical role | 4 | %27 |
| Profit-oriented or rent-seeking motives should be avoided | 3 | %20 |
| Political and administrative facilitators are of significant importance | 2 | %13 |
Disclaimer/Publisher’s Note: The statements, opinions and data contained in all publications are solely those of the individual author(s) and contributor(s) and not of MDPI and/or the editor(s). MDPI and/or the editor(s) disclaim responsibility for any injury to people or property resulting from any ideas, methods, instructions or products referred to in the content. |
© 2025 by the authors. Licensee MDPI, Basel, Switzerland. This article is an open access article distributed under the terms and conditions of the Creative Commons Attribution (CC BY) license (http://creativecommons.org/licenses/by/4.0/).
Copyright: This open access article is published under a Creative Commons CC BY 4.0 license, which permit the free download, distribution, and reuse, provided that the author and preprint are cited in any reuse.


