
Submitted:
06 November 2025
Posted:
06 November 2025
You are already at the latest version
Abstract
This study addresses two critical gaps in international energy cost competitiveness. The first is a frequency gap: conventional indicators such as the Real Unit Energy Cost (RUEC) are typically published with delays of 2–5 years, limiting their usefulness for timely policy evaluation. Here, both RUEC and the Real Price Level Index for energy (Real PLI)—the ratio of the Purchasing Power Parity (PPP) for energy to that for GDP—are measured with only a 2–3 month lag for nine countries—four in Asia, four in Europe, and the U.S. The second is a competitiveness gap that calls for policy re-sponses. Real PLIs indicate that the energy price disadvantages of Japan, Korea, France, Germany, Italy, and the UK have widened from about 1.8–2.9 times the U.S. level before the pandemic to 2.2–3.3 times by Q2 2025, with gaps also increasing rela-tive to China and India. Once country-specific thresholds are exceeded, output in en-ergy-intensive and trade-exposed (EITE) industries tends to contract disproportion-ately. These findings highlight that sustainable transitions require not only interna-tionally differentiated burden-sharing but also structural reforms to avoid persistent widening of energy price gaps. The Real PLI framework offers a timely competitiveness indicator and early-warning tool, signaling when growing asymmetries may under-mine policy feasibility.
Keywords:
energy transition
; sustainable growth
; real price level index for energy (Real PLI)
; real unit energy cost (RUEC)
; gross energy productivity (GEP)
; threshold analysis
; energy-intensive and trade-exposed (EITE) industries
1. Introduction
The Stern-Stiglitz framework emphasizes the importance of efficient and equitable carbon pricing as a central policy instrument [1,2], and argues that the green energy transition is coming at a time when the macroeconomic opportunity costs may be especially low and the benefits particularly high [3]. This framing—of low costs and high benefits—has provided a powerful rationale for governments to accelerate energy transitions and green investment worldwide, particularly since the late 2010s.
The sustainability transitions literature had earlier emerged as an academic field to analyze socio-technical change more broadly (Geels [4], Markard et al. [5]). While conceptually distinct from the Stern–Stiglitz framework, parts of this field became more closely aligned with policy agendas as decarbonization accelerated, contributing both to the theoretical articulation of ambitious transitions and to their critical analysis (Köhler et al. [6]). While this view has dominated policy narratives, its empirical validation has remained complex.
Empirical evidence on the relationship between energy prices and industrial competitiveness has tended to shift over time. Earlier work—largely covering data up to the early or mid-2010s—typically found limited or heterogeneous competitiveness effects of environmental regulation and the EU ETS on regulated firms (Dechezleprêtre and Sato [7], Löschel et al. [8]).
Since 2021, however, global energy prices have surged as economies recovered from the pandemic, exposing advanced economies to sharply higher costs. As these increases persisted, energy costs in advanced economies remained elevated relative to international competitors, while industrial performance weakened, and growing evidence emerged of relocation pressures in energy-intensive and trade-exposed (EITE) industries associated with persistent energy price gaps (Chiacchio et al. [9], Jäger [10], Vogel et al. [11], Saussay and Sato [12]). In 2024, the Draghi Report emphasizes that high energy costs pose a serious threat to European competitiveness, advocating structural reforms—including energy market integration and revised cost-sharing mechanisms—to safeguard EITE sectors [13].
Most recently, in September 2025, DIHK [14] estimated that under current policies, the energy transition could impose cumulative costs of up to €5.4 trillion between 2025 and 2049, and called for a ‘Plan B’. These recent developments suggest predominantly adverse impacts in advanced economies and raise questions about whether current policies can ensure truly sustainable energy transitions. They also underscore the need for robust metrics that can capture how energy cost dynamics translate into competitiveness risks.
A key analytical challenge is to identify and measure vulnerabilities in the economic implications of energy transitions. Much of the existing literature relies on the Real Unit Energy Cost (RUEC), which expresses energy costs as a share of value added and has been widely used as an indicator of energy cost competitiveness. However, since RUEC reflects structural shifts such as the relocation of EITE industries, cross-country RUEC gaps can understate energy cost disadvantages. Real energy price differentials, by contrast, offer a more direct gauge of international competitiveness. In this context, this paper introduces the Real Price Level Index for energy (hereafter Real PLI)—a Purchasing Power Parity (PPP)-based indicator of energy prices relative to output prices—as a robust and exchange-rate-independent measure that offers a clearer basis for monitoring competitiveness risks.
The nascent divergence in national energy strategies observed since the mid-2020s has underscored the heterogeneity of policy responses. This divergence risks the hollowing-out of EITE industries—an essentially irreversible process once large-scale facilities contract or relocate—highlighting the urgency of developing timely indicators. Yet existing measures are typically derived from annual national accounts or input–output tables, with time lags of two to five years. This study seeks to close this gap—from multi-year to multi-month intervals—by developing monthly sectoral energy accounts. Through this approach, the Real PLI is positioned not only as a timely tool for cross-country comparison but also as a warning mechanism for emerging competitiveness pressures, enabling continuous monitoring and earlier detection of shifts in real price conditions shaped by policy and institutional responses.
The objectives of this study are fourfold. First, it advances the concept of the Real PLI by addressing the distortions from evaluating energy prices at market exchange rates. Second, it applies this framework to nine countries—four in Asia (China, India, Japan, and Korea), four in Europe (France, Germany, Italy, and the UK), and the U.S.—contrasting the Real PLI with the RUEC gap and examining their implications for competitiveness. Third, it relates Real PLI dynamics to EITE output, assessing whether competitiveness pressures emerge nonlinearly once country-specific thresholds are crossed. Fourth, it draws implications for measurement and policy in monitoring the sustainability of the energy transition. The remainder of the paper reviews the literature (Section 2), sets out the measurement framework (Section 3), presents empirical evidence (Section 4), and concludes with a policy discussion (Section 5) and an overall conclusion (Section 6).
2. Literature Review
The sustainability discourse has long emphasized the three pillars of environmental protection, economic growth, and social welfare (e.g., WCED [15], Elkington [16]). While all three dimensions are essential, the social pillar has historically received relatively less attention. Yet it is indispensable for ensuring broad-based and inclusive transitions (Markard et al. [5], Sovacool [17]). Its relevance has grown in recent decades with rising concerns about income distribution and social equity. These broader socio-economic transformations highlight the need for indicators that capture not only aggregate outcomes but also distributional aspects across social groups. A growing body of research has examined the distributional consequences of energy prices, particularly their disproportionate impact on lower-income households and vulnerable groups, often discussed under the notion of energy poverty (Schulte et al. [18], Bouzarovski [19]). In the past decade, these debates have increasingly been framed under the notions of energy justice and just transition—particularly in the European context (Volodzkiene et al. [20], Shejale et al. [21])—extending the focus from distributional outcomes to procedural fairness in sustainability transitions. While these studies underscore the socio-economic importance of energy costs, systematic indicator frameworks remain limited. Moreover, differences in survey design, welfare definitions, and microdata availability further constrain cross-country comparability.
While progress on the social pillar remains constrained by the lack of robust indicators, the economic pillar has been assessed with measures that are more readily suited to international comparison. These measures, however, remain open to methodological refinement—particularly in applying economic measurement frameworks to energy analysis. Much of the economic and policy literature has focused on competitiveness-related indicators, most prominently RUEC. Often presented as an analogue to the real unit labor cost frequently cited in assessments of labor cost competitiveness, RUEC measures energy costs as a share of value added. It has been used extensively in European Commission reports to evaluate both vulnerability to energy price fluctuations and the challenges of sustaining cost competitiveness in the manufacturing sector (e.g., European Commission [22,23]). Faiella and Mistretta [24] further show that higher unit energy costs significantly reduce export performance in Europe, particularly in EITE sectors. Building on such aggregate indicators, Kaltenegger et al. [25] and Kaltenegger [26] demonstrate that accounting for indirect energy costs, reflected in non-energy intermediate inputs, provides a more comprehensive picture of competitiveness by sector, while RUEC remains useful as an aggregate benchmark of unit energy costs.
Nonetheless, aggregate RUEC can understate the economic burden of high energy prices when structural adjustment reduces the domestic share of energy-intensive activity. In Japan, much of the post-oil-shock decline in aggregate RUEC reflected compositional changes—most notably the contraction of steel and chemical industries—rather than genuine productivity gains within those sectors (Nomura [27]). This mechanism is not unique to Japan: empirical evidence shows that accelerated fossil-fuel phase-outs, combined with rising energy costs, have likewise coincided with contractions in EITE manufacturing in other advanced economies (e.g., UNIDO [28], Lynch et al. [29]). As a result, cross-country RUEC gaps conflate composition and efficiency with prices; the RUEC gap alone is therefore not a clear measure of international cost competitiveness.
A more direct anchor for international cost competitiveness is an aggregate-level PPP for energy. The World Bank’s International Comparison Program (ICP) [30] constructs PPPs primarily for GDP, but because energy is consumed largely as an intermediate input, it has remained outside the ICP’s main scope. In response, Nomura et al. [31] and Jorgenson et al. [32] developed PPPs for intermediate inputs using the detailed U.S.–Japan bilateral input–output table. Building on this approach, they constructed aggregate PPPs for energy—along with capital, labor, materials, and services—within an industry-level bilateral productivity accounting framework. A key finding from this line of work is that Japan’s energy PPP has persistently exceeded PPPs for output and other inputs over a long period, indicating a structural disadvantage that constrained industrial restructuring and productivity growth. This underscores the value of explicitly incorporating energy PPPs into competitiveness analysis.
In conventional energy analysis, international price gaps are measured by product (e.g., IEA end-use prices per MWh/GJ [33]) and aggregate final energy in heat units, which ignores large inter-fuel price differentials—i.e., the often several-fold gap between electricity and major fossil fuels such as gas or heating oil—that reflect differences in quality and economic value. For cross-country comparison, quality- or composition-adjusted index-number aggregation should be applied to energy prices so that PPP-based indicators can provide the clean price component for international comparisons. The next section outlines the measurement framework that implements this approach.
3. Measurement Framework
This section outlines the measurement framework applied in this study, which builds on the Energy Cost Monitoring (ECM) Database. The database was initially reported in preliminary Discussion Papers (Nomura and Inaba [34,35,36]) but has since been substantially revised and refined. Launched in 2022 with Japan as the initial focus, the ECM project has since broadened. It now enables the construction of nominal and real sectoral energy accounts with only a few months’ lag. Key definitions relevant to this study are summarized below, with further details provided in Appendix A and on the ECM website.
3.1. RUEC
The elementary level is defined by the cross-classification of products () and energy-consuming sectors (). At the elementary level, the quantity of final energy consumption is denoted as , and its unit price as , measured in local currency units (LCU). The nominal value is then obtained as . The total national consumption value () is given by .
At the national aggregate level, the quality-adjusted energy input can, in principle, be defined as a weighted growth rate of individual energy quantities. In this study, however, the emphasis is on cross-country comparisons. Accordingly, the detailed translog formulation is omitted, and the aggregate quality-adjusted energy input is simply denoted as , with the corresponding quality-adjusted energy price () implicitly defined by .
As the aggregate output, and represent nominal and real GDP, respectively, and the output (value added) price () is implicitly defined. The nominal unit energy cost (NUEC) is defined as the energy cost per unit of output:
The RUEC is determined by deflating the NUEC by the aggregate output price as:
The RUEC is the nominal share of energy cost in the nominal output value. It can be interpreted as the real energy price, , divided by the inverse of gross energy productivity (GEP), , highlighting the distinction between price and productivity effects.
3.2. Energy PPP
To clarify the overall structure before turning to formal definitions, Figure 1 illustrates the relationship among elementary-level energy prices in reference and comparison countries, PPPs for each product, and aggregate PPPs and PLIs for both energy and output, leading to the Real PLI. This schematic provides an overview of the measurement framework developed in this section.
For a given reference country and comparison country , the bilateral PPP for energy at the elementary level is defined as the ratio of energy unit prices expressed in LCU:
At the aggregate level, differences in the structure of energy consumption across products and sectors are taken into account by weighting quantities with their relative expenditure shares. This weighting scheme ensures that aggregation is quality-adjusted, since the relative economic value of energy types—such as electricity versus gas—is reflected in their prices rather than in purely physical heat units. The Laspeyres PPP for energy is evaluated at the consumption structure of the reference country as:
Similarly, the Paasche PPP for energy is evaluated at the consumption structure of the comparison country as:
The Fisher PPP for energy is then obtained as the geometric mean of the Laspeyres and Paasche measures:
The Fisher index is preferred because it mitigates the upward bias of the Laspeyres and the downward bias of the Paasche, providing a more reliable measure of cross-country energy price disparities.
The bilateral Fisher PPP in Equation (6) by construction satisfies the country reversal test, which requires that the PPP between two countries equals the reciprocal of the PPP when the order is reversed. However, it does not satisfy the transitivity test, which requires consistency in multilateral comparisons. To address this limitation, the Éltető–Köves–Szulc (EKS) method is applied as follows:
where denotes the eight countries covered in the present measurement. Intuitively, the EKS method adjusts bilateral Fisher PPPs by taking the geometric average of all possible indirect comparison paths, thereby ensuring transitivity across countries. In what follows, the EKS-adjusted PPP is simply referred to as PPP.
3.3. Energy PLI
The Price Level Index (PLI) for energy is defined by combining the PPP for energy with the bilateral market exchange rate, expressed as the comparison country’s currency per unit of the reference country’s currency:
Intuitively, the PLI measures how expensive energy is in one country relative to another once differences in currencies are taken into account. For example, suppose the electricity price is 30 yen per kWh in Japan and 0.10 USD per kWh in the U.S. The PPP for electricity in this case is 300 yen per USD, meaning that if the exchange rate were exactly 300 yen/USD, the purchasing power of the two currencies would be equal for electricity. If, however, the actual market exchange rate is 150 yen/USD, the resulting PLI for electricity is 2.0, indicating that Japanese electricity is twice as expensive as in the U.S. In other words, just as a time-series price index tracks changes in prices over time, a cross-sectional PLI captures price differentials between two countries at a point in time.
In international energy analyses, cross-country price differentials are typically reported in USD terms using market exchange rates, which effectively corresponds to a nominal PLI for energy as defined in Equation (8). However, because PLI is prone to an exchange-rate illusion—that is, the tendency for exchange rate fluctuations to alter international price comparisons even when underlying cost structures remain unchanged—and three caveats merit attention.
First, energy PLIs illustrate this illusion through their pronounced sensitivity to exchange rate movements. In fuel-importing economies, depreciation raises the local-currency price of imported fossil fuels, whereas other cost components—such as capital and labor in power generation or the costs of domestically generated electricity (e.g., from nuclear or renewables)—remain relatively stable. As a result, under currency depreciation the electricity PLI may paradoxically fall despite higher import costs, while under appreciation it may rise despite lower import costs. In economies with substantial exchange rate volatility, the measured disparities in PLIs therefore depend heavily on the specific rate applied, creating significant uncertainty in cross-country comparisons. Further complication arises for developing economies, where currencies tend to remain persistently undervalued relative to PPP for GDP. This pattern is not accidental. It reflects both structural factors, such as the Balassa–Samuelson effect—where productivity gaps between tradable and non-tradable sectors translate into systematically lower overall price levels—and financial factors, including risk premia reflecting macroeconomic and policy uncertainty, which tend to keep developing-country currencies persistently undervalued. When combined, these forces systematically bias output PLIs downward, making energy appear less expensive in developing countries than it truly is in terms of economic burden. Moreover, widespread energy subsidies further depress domestic energy prices. Taken together, these mechanisms can lead to an overstatement of cost competitiveness and, in turn, foster overly optimistic assessments of the feasibility of energy transitions in such economies.
Second, this exchange-rate illusion arises in part because the energy PLI is not evaluated relative to the output PLI. Even when currency depreciation raises import fuel costs, the pass-through to domestic output prices may be limited if energy accounts for only a small share of production costs. In such cases, the output PLI may be lower than the energy PLI, implying that the real energy price has in fact increased. In this context, the problem is not illusory: without explicitly linking energy costs to output prices, PLIs risk conveying a distorted view of the effective economic burden.
Third, beyond these considerations of exchange rates and cost pass-through, the energy PLI also fails to capture how competitiveness conditions mediate the impact of energy prices. In advanced economies producing differentiated products and services, high energy prices can be offset by the ability to raise output prices, thereby mitigating the effective impact of high energy costs. By contrast, in developing economies producing largely undifferentiated products, output prices are constrained by competitive markets. In these economies, even if the nominal energy price differential remains unchanged, intensified price competition compresses output prices, increasing the effective burden of energy costs. Taken together, these observations underscore the need for an indicator that links energy prices more directly to output performance and competitiveness.
Such limitations highlight the need for the Real PLI, defined as the ratio of the energy PLI to the output PLI:
A key property of the Real PLI is its immunity to exchange-rate movements, as it is defined solely as the ratio of two PPPs estimated independently of market exchange rates.
The Real PLI can also be linked to the RUEC gap. Since the RUEC is defined as the share of energy costs in value added in Equation (2), its bilateral ratio can be decomposed into the Real PLI and the inverse of the GEP gap—reflecting both within-industry energy productivity and differences in industrial structure.
As discussed in Section 2, the RUEC gap alone does not necessarily provide a reliable assessment of energy cost competitiveness since it conflates pure energy cost differences with broader structural effects. Overall, these properties establish the Real PLI as a particularly relevant indicator for monitoring international competitiveness.
4. Results
While a decline in the RUEC may appear to indicate progress in an energy transition, such changes can also reflect structural adjustments—such as deindustrialization—that reduce energy demand without improving cost competitiveness. The Real PLI provides a clearer measure of cross-country disparities in energy price conditions and represents a necessary economic condition for a sustainable transition. Section 4.1 analyzes the RUEC gap, which combines the Real PLI with the GEP gap as shown in Equation (10), while Section 4.2 and 4.3 examine the evolution of the Real PLI and its implications for competitiveness thresholds in EITE industries.
Before turning to the empirical results, it is important to note that, although nominal PLIs for energy can be measured at a monthly frequency in the ECM Database, all indicators in this paper are reported at a quarterly frequency to ensure comparability with national accounts, as the Real PLI relies on GDP deflators that are available only quarterly. In addition, the analysis focuses on the aggregate economy, since consistent PPPs for industry-level outputs are not available across countries, either quarterly or annually. Further details are provided in Appendix A.1. The empirical coverage spans Q1 2015–Q2 2025.
4.1. RUEC Gaps
Figure 2 provides: (a) the RUEC level for each country, expressed as a percentage share (left panel), (b) the RUEC gap, measured relative to the U.S. (center panel), and (c) the GEP gap, also measured relative to the U.S. (right panel). Bilateral comparisons of (b) and (c) using alternative reference countries are reported in Table 1 for both Q2 2025 and the pre-pandemic average (2015–2019), together with the corresponding log-growth changes.
The left panel shows that values are generally higher in emerging economies such as India and China than in advanced countries. Three factors account for this outcome. First, energy prices () remain relatively low due to heavy reliance on coal and the political need to restrain electricity tariffs in the face of weak consumer purchasing power. Second, GEP () is limited, as the real value added generated per unit of energy input is small. Third, the price of output () is constrained by the limited international competitiveness of their products. Together, these structural elements explain why RUEC levels are persistently higher in emerging economies: low energy prices are insufficient to offset the combination of low GEP and weak output prices.
These structural features illustrate why deep decarbonization remains particularly difficult for emerging economies. First, energy prices are already held artificially low, as reflected in the Nominal PLI in Section 4.2, through tariff controls and heavy reliance on cheap coal, leaving limited room for further cost reductions and making a shift away from low-cost fossil fuels especially challenging. While energy prices may decline temporarily during the early stages of renewable deployment, such benefits are short-lived, as grid infrastructure remains underdeveloped and integration measures take time; beyond this limited window, system integration costs may offset these gains. Second, improvements in GEP have considerable potential, but they require replacement of industrial assets and therefore materialize only gradually over the medium term. Third, raising output prices through upgrading to higher value-added industrial structures is typically a decades-long process. Taken together, these constraints underscore the importance of assessing not only the pace of technological change but also the structural conditions that determine the economic feasibility of deep decarbonization.
The center and right panels of Figure 2 compare RUEC and GEP gaps relative to the U.S. As shown in Equations (9) and (10), the RUEC gap can be expressed as the ratio of the Real PLI to the GEP gap, while the Real PLI itself equals the ratio of the nominal energy PLI to the nominal output PLI. Accordingly, cross-country differences in RUEC reflect the combined influence of price and structural factors.
In Q2 2025, India shows the highest RUEC gap—about twice the U.S. level—driven mainly by a very low output PLI that raises its Real PLI despite moderate energy PLI and a mid-range GEP, the latter reflecting the still-limited role of energy-intensive manufacturing. China’s large gap combines a moderately high Real PLI with relatively low GEP, reflecting the persistence of energy-intensive heavy industries. Italy’s burden, by contrast, stems primarily from high energy prices, although its GEP remains relatively strong. The U.K., where deindustrialization has advanced furthest, shows near parity in its RUEC gap with the U.S., as high energy prices are largely offset by exceptionally high GEP. Japan, Germany, and France occupy intermediate positions among advanced economies.
These contrasts confirm that large RUEC gaps arise for different reasons—high real energy prices, low productivity, or structural composition effects—highlighting the importance of complementary indicators such as the Real PLI (Section 4.2) to isolate the pure price component of energy-cost competitiveness.
4.2. Real PLI
Figure 3 presents three indicators: (a) the quality-adjusted energy price in national currency, expressed as an index with the 2015 average set to 1.0 (left panel), (b) the nominal PLI, measured relative to the U.S. (center panel), and (c) the Real PLI, also measured relative to the U.S. (right panel). Corresponding bilateral comparisons for (b) and (c), using alternative reference countries, are reported in Table 2 for both Q2 2025 and the pre-pandemic average (2015–2019), together with the associated log-growth changes.
Across major economies, aggregate energy prices rose sharply from early 2021 to late 2022, broadly tracking movements in the global crude oil market. For reference, the West Texas Intermediate (WTI) crude oil price index in U.S. dollars is also plotted in the left panel of Figure 3. However, since mid-2024, while crude oil prices have declined, energy prices have remained elevated in most countries except the U.S. and China, partly reflecting country-specific factors such as taxes (including carbon pricing schemes like the EU ETS), subsidies, and power-mix reforms associated with decarbonization policies, as discussed in Section 5.
The nominal energy PLI captures bilateral energy price differentials but remains highly sensitive to currency fluctuations. As shown in the center panel of Figure 3, currency appreciations and depreciations during this period often produced sizable swings in nominal PLIs that did not necessarily correspond to shifts in domestic energy price levels. Over the sample period, the GBP and the euro experienced relatively modest medium-term changes against the U.S. dollar. In contrast, the Japanese yen (–29% against the dollar by Q2 2025 relative to the 2015–2019 average), Indian rupee (–28% vs. USD), Korean won (–23% vs. USD), and Chinese yuan (–9% vs. USD) underwent substantial depreciation. In such cases—most notably Japan, where widening interest rate differentials since 2021 pushed the yen to historically weak levels—the resulting decline in the nominal PLI diverges sharply from what would be inferred as international energy price differentials. For example, in Q2 2025, Japan’s nominal PLI is assessed as about 17% below its pre-pandemic average, a distortion that arises because Japanese output, when expressed in U.S. dollars, is simultaneously devalued. Similar declines in nominal PLIs are also observed in other Asian economies. This effect can only be properly addressed by the Real PLI, underscoring its importance as a more robust indicator.
Real PLI, obtained by dividing the energy PPP by the PPP for GDP, eliminates the influence of exchange rate movements and normalizes energy prices relative to overall output prices, thus reflecting international energy cost differentials in real terms. Three key patterns emerge from the data in the right panel of Figure 3. First, compared with nominal PLIs at the same quarterly frequency, Real PLIs exhibit smaller short-term fluctuations, and cross-country trajectories tend to move within a narrower range, indicating that it provides a more stable measure of international price differentials.
Second, all countries in the sample have faced a substantial real energy price disadvantage relative to the U.S., even before the pandemic, with most showing pre-pandemic Real PLI levels around 1.8–2.9 times higher than the U.S. Notably, even in India and China—both recording nominal PLI levels below the U.S.—the Real PLI indicates a much larger relative gap, reflecting the relatively low value-added price per unit of output. As of Q2 2025, the Real PLIs for India and China stand at 3.3 and 2.0 times the U.S. level, respectively. The PPP for GDP used here relies on ICP 2021 (World Bank [30]), but large subnational price disparities remain, and past ICP revisions have occasionally introduced changes of several tens of percent. Specifically, in successive revisions of the ICP, India’s PPP for GDP was revised by –24% (between the 2005 ICP projection for 2011 and the 2011 ICP benchmark), +16% (between the 2011 and 2017 ICPs), and –6% (between the 2017 and 2021 ICPs), while China’s was revised by –16%, +19%, and –8%, respectively (see APO [37, Box 3]). India’s level may thus be influenced by measurement uncertainties in the PPP for GDP, which has been subject to sizable revisions in successive ICP rounds. Nevertheless, the bottom line from this international comparison is clear: as captured by the Real PLI, India and China continue to face substantially higher energy prices relative to the U.S. in real terms.
Third, in the six advanced countries—Japan, Korea, France, Germany, Italy, and the UK—the pandemic-era surge in energy prices sharply widened the real energy price gap with the U.S., peaking in Q2 2023 at 2.2–3.5 times the U.S. level. Although much of this gap temporarily narrowed by early 2024, it has widened again by Q2 2025 in most countries, while the UK shows a more stable trajectory. In all six countries, however, the Real PLI remains well above pre-pandemic levels. This indicates that the post-pandemic energy price surge, though broadly synchronized across countries, has not merely widened but also entrenched the real energy price disadvantage relative to the U.S. Specifically, compared with their pre-pandemic levels of around 1.8–2.9 times the U.S. level, the Real PLIs of these six countries had increased by 11–24% by Q2 2025, reaching 2.2–3.3 times the U.S. level, despite policy interventions such as subsidies to households and firms.
Fourth, the divergence in the six advanced countries extends beyond comparisons with the U.S.: they have also experienced further widening real energy price gaps relative to India and China. While India’s and China’s Real PLIs relative to the U.S. remained broadly stable, with increases of 4% and 5%, respectively, compared to pre-pandemic levels, the six advanced economies saw their bilateral gaps expand with India by 6–20% and with China by 6–19%. This widening relative disadvantage relative to large emerging economies is particularly relevant in light of its implications for production structures, which will be further discussed in Section 4.3.
4.3. Threshold Analysis
This section examines whether the relationship between energy Real PLI and EITE output exhibits nonlinear (and potentially discontinuous) adjustments, with recurrent regime shifts, once a country-specific critical range is crossed. Descriptive time-series trajectories of EITE output are provided in Appendix B.1 for reference. Unlike the previous subsection, which focused on country-level estimations, the panel threshold framework applied here pools observations across countries to gain statistical power while allowing for cross-country heterogeneity in threshold effects.
Threshold estimation follows Hansen [38], with bootstrap confidence intervals constructed to account for the non-standard distribution of the threshold estimator. The specification is:
where indexes countries, denotes quarters, and and are country and time fixed effects, respectively. The dependent variable is expressed in natural logarithms so that coefficients can be interpreted in percentage terms. The set includes countries for which thresholds were empirically identified in preliminary country-level regressions. Country-specific thresholds () were first identified from single-country regressions using the same specification as in Equation (11), but without fixed effects. For these countries, the coefficient captures the additional log change in EITE output once the Real PLI surpasses the country-specific threshold. For countries not in , only the continuous effect of is included. This approach allows for heterogeneous adjustment dynamics across countries, as nonlinear responses may emerge at different real price levels. The specification uses contemporaneous real price indices; robustness checks with a one-period lag confirm that the main results remain unchanged (Appendix B.2).
Figure 4 provides a visual diagnostic of the country-specific relationship between the Real PLI and EITE output, with observations from 2021 onward shown in red to mark the onset of the post-pandemic surge in energy prices (see Figure 3), and the estimated country thresholds indicated by dashed vertical lines. Thresholds in the figure are obtained by country-by-country grid search, minimizing the profile SSR with a 5–95% trim. In Japan, Korea, France, Germany, Italy, and the UK, EITE output tends to decline once the Real PLI rises above , with the cloud of points shifting downward and showing limited overlap across the threshold. In several of these countries—particularly Japan, Korea, and France—the adjustment appears more gradual rather than a distinct break, consistent with a partial rather than abrupt regime shift. It should also be noted that substantial differences exist in the overall levels of EITE across countries. In economies such as Italy, where the Real PLI has remained persistently high, past deindustrialization likely contributes to lower EITE levels and a more muted response to recent price increases. By contrast, China and India show no visible discontinuity: EITE remains relatively high or even increases in some recent observations despite higher real prices, suggesting that their recent dynamics are shaped more by stage-of-development factors than by a common break at a particular price level. These visual patterns motivate treating the six advanced economies as the set for which fixed country thresholds are introduced in the panel model, while China and India are excluded from .
Figure 5 presents bootstrap confidence intervals for the country-specific thresholds . Italy exhibits the highest threshold (3.05) with a relatively narrow interval, whereas Germany’s point estimate (2.39) shows a wider interval that overlaps with France. France and the UK form a middle group around 2.1–2.2, while Japan and Korea cluster near the lower end of the range, around 1.9–2.0. Given the degree of overlap in confidence intervals, these thresholds should be interpreted as indicative rather than sharply distinct. Overall, the ordering of point estimates can be summarized as >≳{, }≳{, }. Across the six advanced economies in , roughly one-third of observations (median = 0.33) lie above the estimated country-specific thresholds, with post-2021 shares rising to about two-thirds (median = 0.72). The longest continuous spells above range from 12 to 14 quarters, suggesting that the sample provides adequate support on both sides of the thresholds for reliable identification.
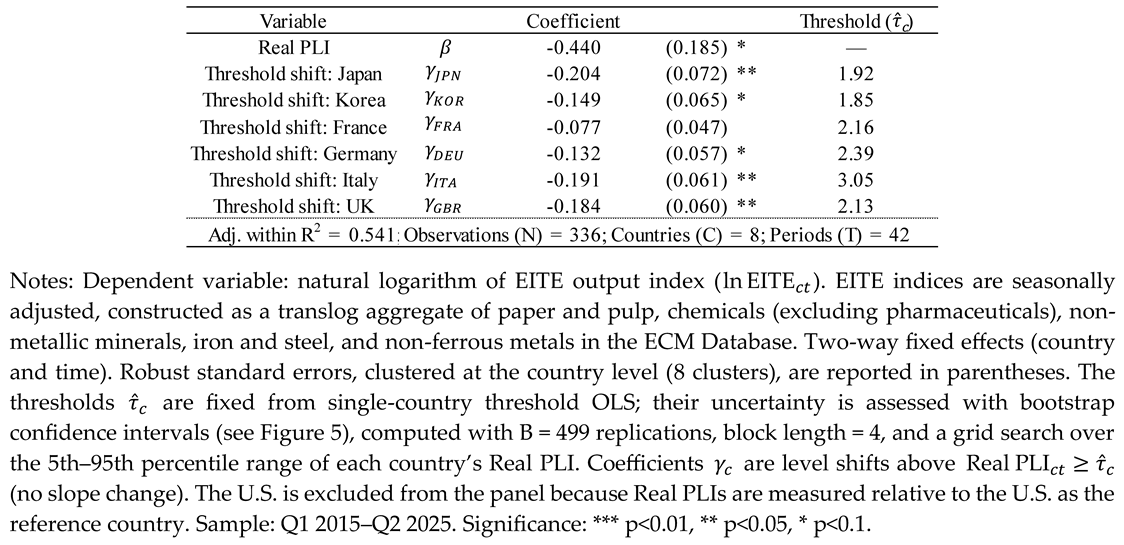
While these confidence intervals underscore that the exact location of is measured with error, the results from the panel estimation of Equation (11) in Table 3 show that crossing the relevant price range is nevertheless associated with statistically significant level shifts in EITE output. The specification includes country and time fixed effects with standard errors clustered by country. The coefficient on the continuous relative-price term (Real PLI) is negative and significant (β = −0.44, s.e. 0.185): evaluated locally, a 0.1 increase in Real PLI is associated with about a 5% decline in EITE output, holding fixed effects constant. Threshold dummies are negative and statistically significant for five of the six advanced economies in : Japan −0.204 (≈−18.5%), Italy −0.191 (−17.4%), UK −0.184 (−16.8%), Korea −0.149 (−13.8%), and Germany −0.132 (−12.4%), while the coefficient for France (−0.077, −7.4%) is smaller and not statistically significant. These magnitudes imply that once the relevant thresholds are crossed, EITE output falls by roughly 7–20% in advanced economies—a sizeable adjustment by the standards of industry-level studies. Taken together with an adjusted within R² of 0.541 (N = 336, C = 8, T = 42), these results indicate that nonlinear responses to relative energy-price conditions are present and substantial, though their magnitudes differ across countries. While Real PLI is likely predetermined with respect to short-run EITE fluctuations, some reverse causality cannot be ruled out—lower EITE output could reduce energy demand, depress PPP for energy, and thereby lower Real PLI. Any such feedback would bias the coefficients toward zero, implying that the estimated negative effects represent conservative lower bounds on the true responses.
5. Discussion
The empirical results carry policy implications at three levels—global governance, industry dynamics, and structural policy design. The discussion remains diagnostic rather than prescriptive, using the Real PLI primarily to characterize relative cost exposure.
5.1. Global Governance
Asymmetric cost exposure and burden-sharing have become central issues in global governance. Under the Paris framework, most advanced economies have pledged net-zero by around 2050, whereas China and India target 2060 and 2070. The Real PLI indicates that this asymmetry is not only political but also economic: energy price differentials relative to major emerging economies widened markedly in Q2 2025 relative to 2015–2019 (by 6–19% against China and by 6–20% against India) for the six advanced economies of Japan, Korea, France, Germany, Italy, and the UK. These gaps are consistent with constraints on domestic price pass-through, where household purchasing power remains limited and EITE reliance is high.
By contrast, notable divergences have also emerged among advanced economies, with Real PLIs relative to the U.S. widening by 11–24%. This partly reflects policy and market expectations: in 2025, the U.S. notified its intention to withdraw from the Paris Agreement, and the EPA proposed rescinding the 2009 Endangerment Finding. Regardless of the ultimate legal outcomes, these moves are likely to contribute to lower regulatory expectations and contain domestic energy costs, thereby widening the gap with other advanced economies. Real PLI-based monitoring thus offers a constructive basis for discussing differentiated burden-sharing and policy sequencing beyond uniform carbon prices, while remaining agnostic about the appropriate global ambition level.
For the six advanced economies, Real PLIs relative to the U.S. have reached markedly high levels by recent standards—around 2.2–3.3 times the U.S. benchmark in Q2 2025, compared with 1.8–2.9 times in the pre-pandemic average (2015–2019). Given the substantial regional price dispersion within the U.S. itself, these international gaps are likely to represent a conservative estimate of the true competitiveness disadvantage for industries. This suggests that widening Real PLIs may already be materializing as structural competitiveness pressures, helping to explain the weak growth performance observed in recent years. The current magnitude indicates that several economies are approaching ranges where transition-related policy trade-offs become increasingly evident. In this sense, cooperation on transition financing and measures against carbon leakage can be more effectively guided by measurable cost exposure rather than by abstract assumptions of symmetry.
5.2. Industry Dynamics
Relocation risks and early-warning signals are increasingly visible at the firm and industry level. Section 4.3 showed threshold-type responses of EITE output to adverse Real PLI conditions. Illustrative corporate decisions are consistent with these pressures, although they do not by themselves constitute causal proof. In 2025, Nippon Steel finalized the U.S. Steel acquisition and committed roughly USD 11 billion in U.S. investments by 2028; Hyundai Steel announced a new Louisiana plant with 2.7 Mt annual capacity; and Germany’s Butting selected Alabama for its first U.S. production facility (USD 61 million). In settings where direct policy advocacy by large firms is uncommon, relocation can operate as what Hirschman [39] described as exit, reducing domestic contestation while quietly re-optimizing their production footprint. Taken together, these moves are consistent with the view that persistent real energy price gaps shape industrial geography alongside tariffs, logistics, and policy stability, and they illustrate the broader relocation dynamics highlighted by the threshold analysis.
Beyond these relocation dynamics, cross-country differences in policy style also shape how competitiveness pressures materialize. In Europe, policy interventions have tended to operate through price mechanisms: higher Real PLIs directly transmit transition costs to firms, inducing behavioral change via energy expenditure. By contrast, in Japan, Korea, and some other coordinated economies, state–industry arrangements have influenced the electricity mix and investment choices in ways that do not necessarily appear as higher energy prices. Instead, firms face implicit constraints on their production behavior, a pattern that is reflected in the relatively low thresholds estimated in Section 4.3. This contrast suggests that competitiveness monitoring cannot rely on real prices alone. Complementary tracking of EITE output indices is needed to capture the broader set of mechanisms—both price-based and non-price—that condition industrial responses during the transition, and this underscores the need to integrate such measures into the longer-term monitoring framework.
5.3. Structural Policy Design
Short-term interventions that mitigate nominal price increases—through levy design or tariff smoothing—may alleviate immediate burdens but do not prevent relative cost disparities from persisting. Medium-term instruments such as capacity mechanisms can support supply security, but they too do not eliminate underlying competitiveness gaps. Likewise, subsidies can ease adjustment in the near term, yet if the Real PLI remains structurally elevated, competitive disadvantages endure. Durable improvement requires attention to fundamental determinants, including market and network design, timely investment in grids and interconnections, diversification and flexibility resources that stabilize marginal costs, secure fuel import infrastructure, and regulatory predictability that reduces capital risk premia. Targeted support measures may have a legitimate role in addressing distributional concerns or facilitating early deployment of new technologies. Temporary price support should therefore be regarded as transitional; absent demonstrable progress in these structural domains, it risks entrenching rather than alleviating competitiveness pressures.
A different category of subsidies aims not to suppress nominal energy prices but to stimulate investment in green technologies. Such measures can foster innovation and accelerate the diffusion of clean energy, yet their growth effects depend critically on broader macroeconomic conditions, particularly on maintaining demand predictability under weak growth and narrowing structural energy price gaps. Moreover, manufacturing of green technologies—such as solar panels, batteries, and other clean-energy equipment—is itself highly energy-intensive, making real energy price disadvantages directly relevant for competitiveness. Without progress on these fundamentals, even technology-oriented subsidies risk leaving advanced economies at a disadvantage, both in emerging clean industries and in their traditional industrial base.
Competitiveness also depends on the ability of industries to enhance the value-added price (, value added per unit of output). Even when energy prices () rise, improvements in value-added prices () can help stabilize the Real PLI, whereas industrial restructuring that reduces EITE output tends to depress aggregate and amplify competitiveness challenges. Structural design for the transition must thus encompass both dimensions: measures that address cost disadvantages and policies that strengthen the capacity of industries to generate value added from energy inputs, particularly in emerging technology sectors where ensuring energy cost affordability must go hand in hand with innovation.
6. Conclusions
Monitoring competitiveness through real energy price gaps provides an important, though necessarily partial, perspective on the transition. Real PLI identifies structural pressures operating through energy price channels, whereas complementary indicators such as EITE output indices capture adjustment through non-price channels. As with any PPP-based indicator, measurement error is inevitable, but ongoing refinement of PPP methodologies and annual benchmarking will enhance reliability over time. In this regard, the objective is not to provide a definitive measure but to establish a timely and consistent reference for policy evaluation as transitions unfold. Future work should also broaden the scope beyond competitiveness by linking Real PLI with distributional outcomes, thereby supporting welfare-based monitoring of the social dimensions of sustainability.
Author Contributions
Conceptualization, K.N.; methodology, K.N.; software, K.N.; validation, K.N.; formal analysis, K.N.; investigation, K.N.; resources, K.N. and S.I.; data curation, S.I.; writing—original draft preparation, K.N.; writing—review and editing, K.N.; visualization, K.N. and S.I.; supervision, K.N.; project administration, K.N.; funding acquisition, K.N. All authors have read and agreed to the published version of the manuscript.
Funding
This research was supported by the Keidanren (Japan Business Federation) Foundation for Environmental Protection Measures (2022–2024) and by the Keidanren under a commissioned research agreement in 2025.
Institutional Review Board Statement
Not applicable.
Informed Consent Statement
Not applicable.
Data Availability Statement
The datasets created or analyzed in this study are available through the ECM Database website and are updated monthly. A comprehensive list of data sources and variables used in the analysis is provided in the Supplementary Materials, which is likewise updated monthly in coordination with the database.
Conflicts of Interest
The authors declare no conflict of interest.
Abbreviations
The following abbreviations are used in this manuscript:
| EITE | Energy-intensive and trade-exposed |
| GEP | Gross energy productivity |
| PPP | Purchasing power parity |
| Real PLI | Real price level index for energy |
| RUEC | Real unit energy cost |
Appendix A
Appendix A.1
This appendix summarizes monthly sectoral energy accounts to bridge the timeliness gap in monitoring energy cost competitiveness. A central challenge is the long publication lags of internationally harmonized energy and economic statistics, which are often available only with several years’ delay. While a few countries, such as the U.S. and the UK, provide relatively detailed monthly energy statistics, most others offer only fragmented monthly information (e.g., electricity or petroleum supply data). This study aims to bridge the timeliness gap—from multi-year to multi-month intervals—by developing monthly national energy accounts based on monthly data on energy, prices, production, and trade. Achieving this requires systematically integrating energy statistics and national accounts, despite their conceptual differences. To this end, a consistent accounting framework is introduced in what follows.
Table A1 presents the structure of the sectoral energy accounts. For each product, consumption is distinguished between the energy transformation sector ( upper panel) and the final consumption sector ( lower panel). Each of these is further divided into domestic products and imported products, reflecting both quality differences and the advantage of fully utilizing timely trade statistics. The sectoral energy accounts are reported both in monetary terms ( and ) and in calorific values ( and ). The energy PLI is measured based on final energy consumption, as shown in the lower panel.

Table A1.
Sectoral Energy Accounts.
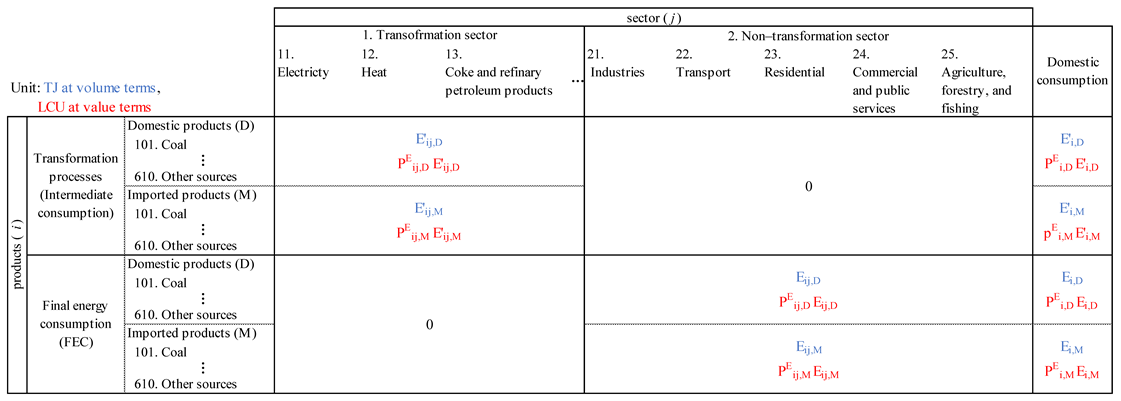
Separating fuel use for transformation from final consumption is primarily intended to ensure consistency with energy statistics. This separation enables benchmarking in both dimensions: by comparing with physical quantities in energy statistics, and by reconciling the aggregated monetary values with intermediate consumption in economic accounts. The monthly sectoral energy accounts in this study are compiled both in monetary terms and in calorific values. The dual representation is essential: calorific values capture the physical volume of energy consumption, while monetary values provide the nominal weights required for appropriate aggregation in Section 3.2. This dual structure ensures that energy consumption is measured in a way that fully accounts for differences in quality across products and sectors.
Table A2 presents the product and sector classifications. The non-transformation sector comprises five industries: 21. Industries, 22. Transport, 23. Residential, 24. Commercial and public services, and 25. Agriculture, forestry, and fishing. Within 21. Industries, 211. EITE industries and 212. Non-EITE industries are distinguished. For consistency with economic statistics, the transport sector is further divided into consumption by households (221) and by non-households (222). In this paper, the elementary level is defined based on the 3-digit sector classification of seven sectors. “Household” is defined as the sum of 221. Transport activities by households and 23. Residential, while “Industry” refers to the sum of the remaining sectors.
Table A2.
Product and Sector Classifications.
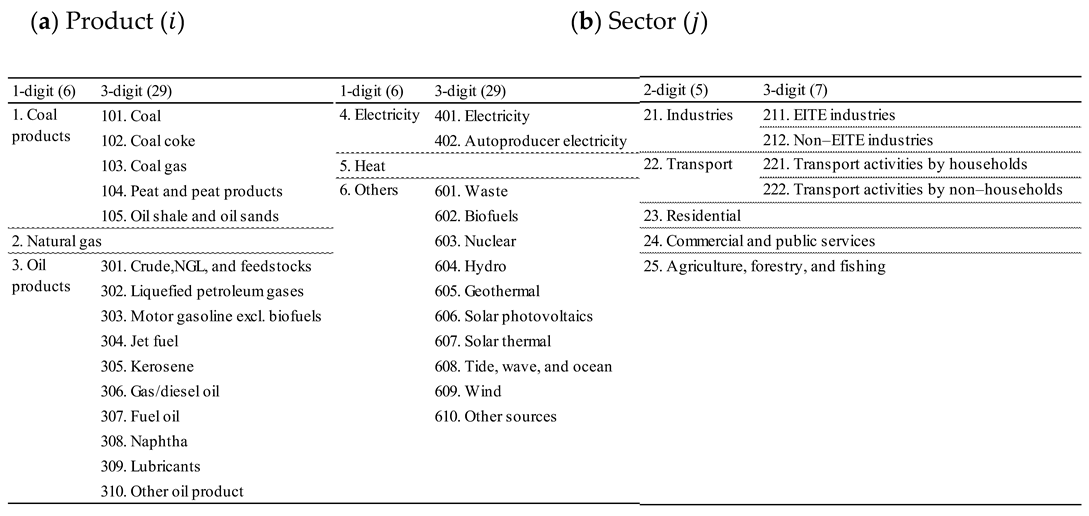
The product classification is defined at the 3-digit level, comprising 29 products at the elementary level. 6. Others includes waste and renewable energy sources directly consumed as final energy. The latter mainly consists of geothermal and solar thermal energy, while electricity generated from solar photovoltaic and wind power is included in 4. Electricity. Statistical data on the prices of such energy sources are highly limited, and their quantities are very small—typically less than 1% of FEC. For 601. Waste, the unit price applied is that of the lowest-cost energy source available in each country (mainly coal), while for the small quantities of renewable energy, the unit price of gas is applied.
While this study constructs monthly sectoral energy accounts, the analysis in Section 4 is confined to the aggregate economy. The primary reason is that consistent PPPs for industry-level outputs are not available across countries, not only at a quarterly frequency but even on an annual basis [30,31,32]. This implies that it is not possible to evaluate energy cost competitiveness at the sectoral level. A further complication is that the indirect effects through non-energy intermediate inputs should also be considered [25,26]. A related limitation applies to households. Although PPP for household consumption is available from the ICP [30] and suitable for welfare-oriented assessment, it does not provide an adequate measure of household “output” in competitiveness-based analysis, since imputed services of durable goods are not incorporated [27]. The analysis is confined to the aggregate economy, where household output is imperfectly captured (with only imputed rents included).
Appendix A.2
This appendix outlines the measurement procedure used to construct monthly and annual sectoral energy accounts in this study. A distinctive feature of this study’s measurement framework is the systematic alignment of energy statistics with economic statistics in nominal value terms. This framework enables direct consistency between energy inputs and macroeconomic indicators such as output values and prices, making it possible to construct internationally comparable measures like the RUEC and the Real PLI. In practice, however, while quality-adjusted energy input price index and energy PLIs can be compiled monthly, output indicators are derived from national accounts and are therefore only available at a quarterly frequency. The measurement procedure consists of the following four steps in each country:
1) Establishing initial benchmarking data: Construct volume and value balances of the annual sectoral energy accounts for the benchmark year (2015), and disaggregate them into monthly tables (January–December 2015) using monthly energy volume and value data (described in step 2), based on the proportional Denton method, which ensures that monthly estimates are consistent with annual totals.
2) Updating monthly estimates: Collect and estimate monthly data for energy consumption volumes and end-use prices, and update the monthly sectoral energy accounts in both volume and value terms up to the most recent month. Each update is connected to the December table of the latest benchmark year—for example, 2016 starts from December 2015, while data for 2024 and beyond start from December 2023, benchmarked in steps 3 and 4. To facilitate consistent economic analysis, a monthly series of both consumption volumes and end-use prices is seasonally adjusted using the X-13ARIMA-SEATS procedure whenever non-adjusted data are provided.
3) Annual volume benchmarking to IEA data: Benchmark the monthly sectoral energy accounts to annual values from the IEA’s World Energy Balances, which are published with a lag of nearly two years, mainly using the proportional Denton method to preserve annual consistency. For example, monthly estimates for 2023 are benchmarked in August 2025 when the IEA releases the 2023 data.
4) Annual value benchmarking to economic statistics: Economic statistics such as the Supply-Use Table (SUT), Input-Output Table (IOT), and national accounts are published with a lag of about two to five years. Significant price differences or subsidies among energy-consuming sectors may reduce the representativeness of average energy prices in the energy statistics. While alignment with economic statistics in value terms is important, several challenges exist—such as separating energy transformation consumption, handling by-product gases, identifying own-use electricity generation included in industrial sectors, classifying headquarters activities, and addressing measurement errors in economic statistics. After considering these issues, the appropriate level of benchmarking is determined, and monthly unit price estimates are adjusted using the proportional Denton method to maintain consistency with energy consumption values in the economic statistics.
The monthly and annual datasets used in this study cover nine advanced or emerging countries, selected based on data availability, with further expansion planned in the future. The datasets in this study span the period from January 2015 to August 2025 and are updated monthly. Annual benchmarking relies on IEA and economic statistics, which are released with a multi-year lag; monthly estimates are extended beyond these benchmarks to provide timely coverage. While such extensions ensure continuity, they are subject to later revisions when annual benchmarks become available.
Data accuracy varies across countries, with particular challenges for emerging economies such as China and India. Where multiple national sources exist, data are selected and adjusted based on consistency with past benchmarked annual series. Moreover, recent subsidy schemes add complexity: for example, in Japan, pre- and post-subsidy energy prices are not officially reported but have been estimated in this study using various information sources. In all cases, prices are treated net of subsidies. While similar adjustments would ideally be applied to other countries, data limitations prevent systematic implementation beyond Japan.
Appendix B
Appendix B.1
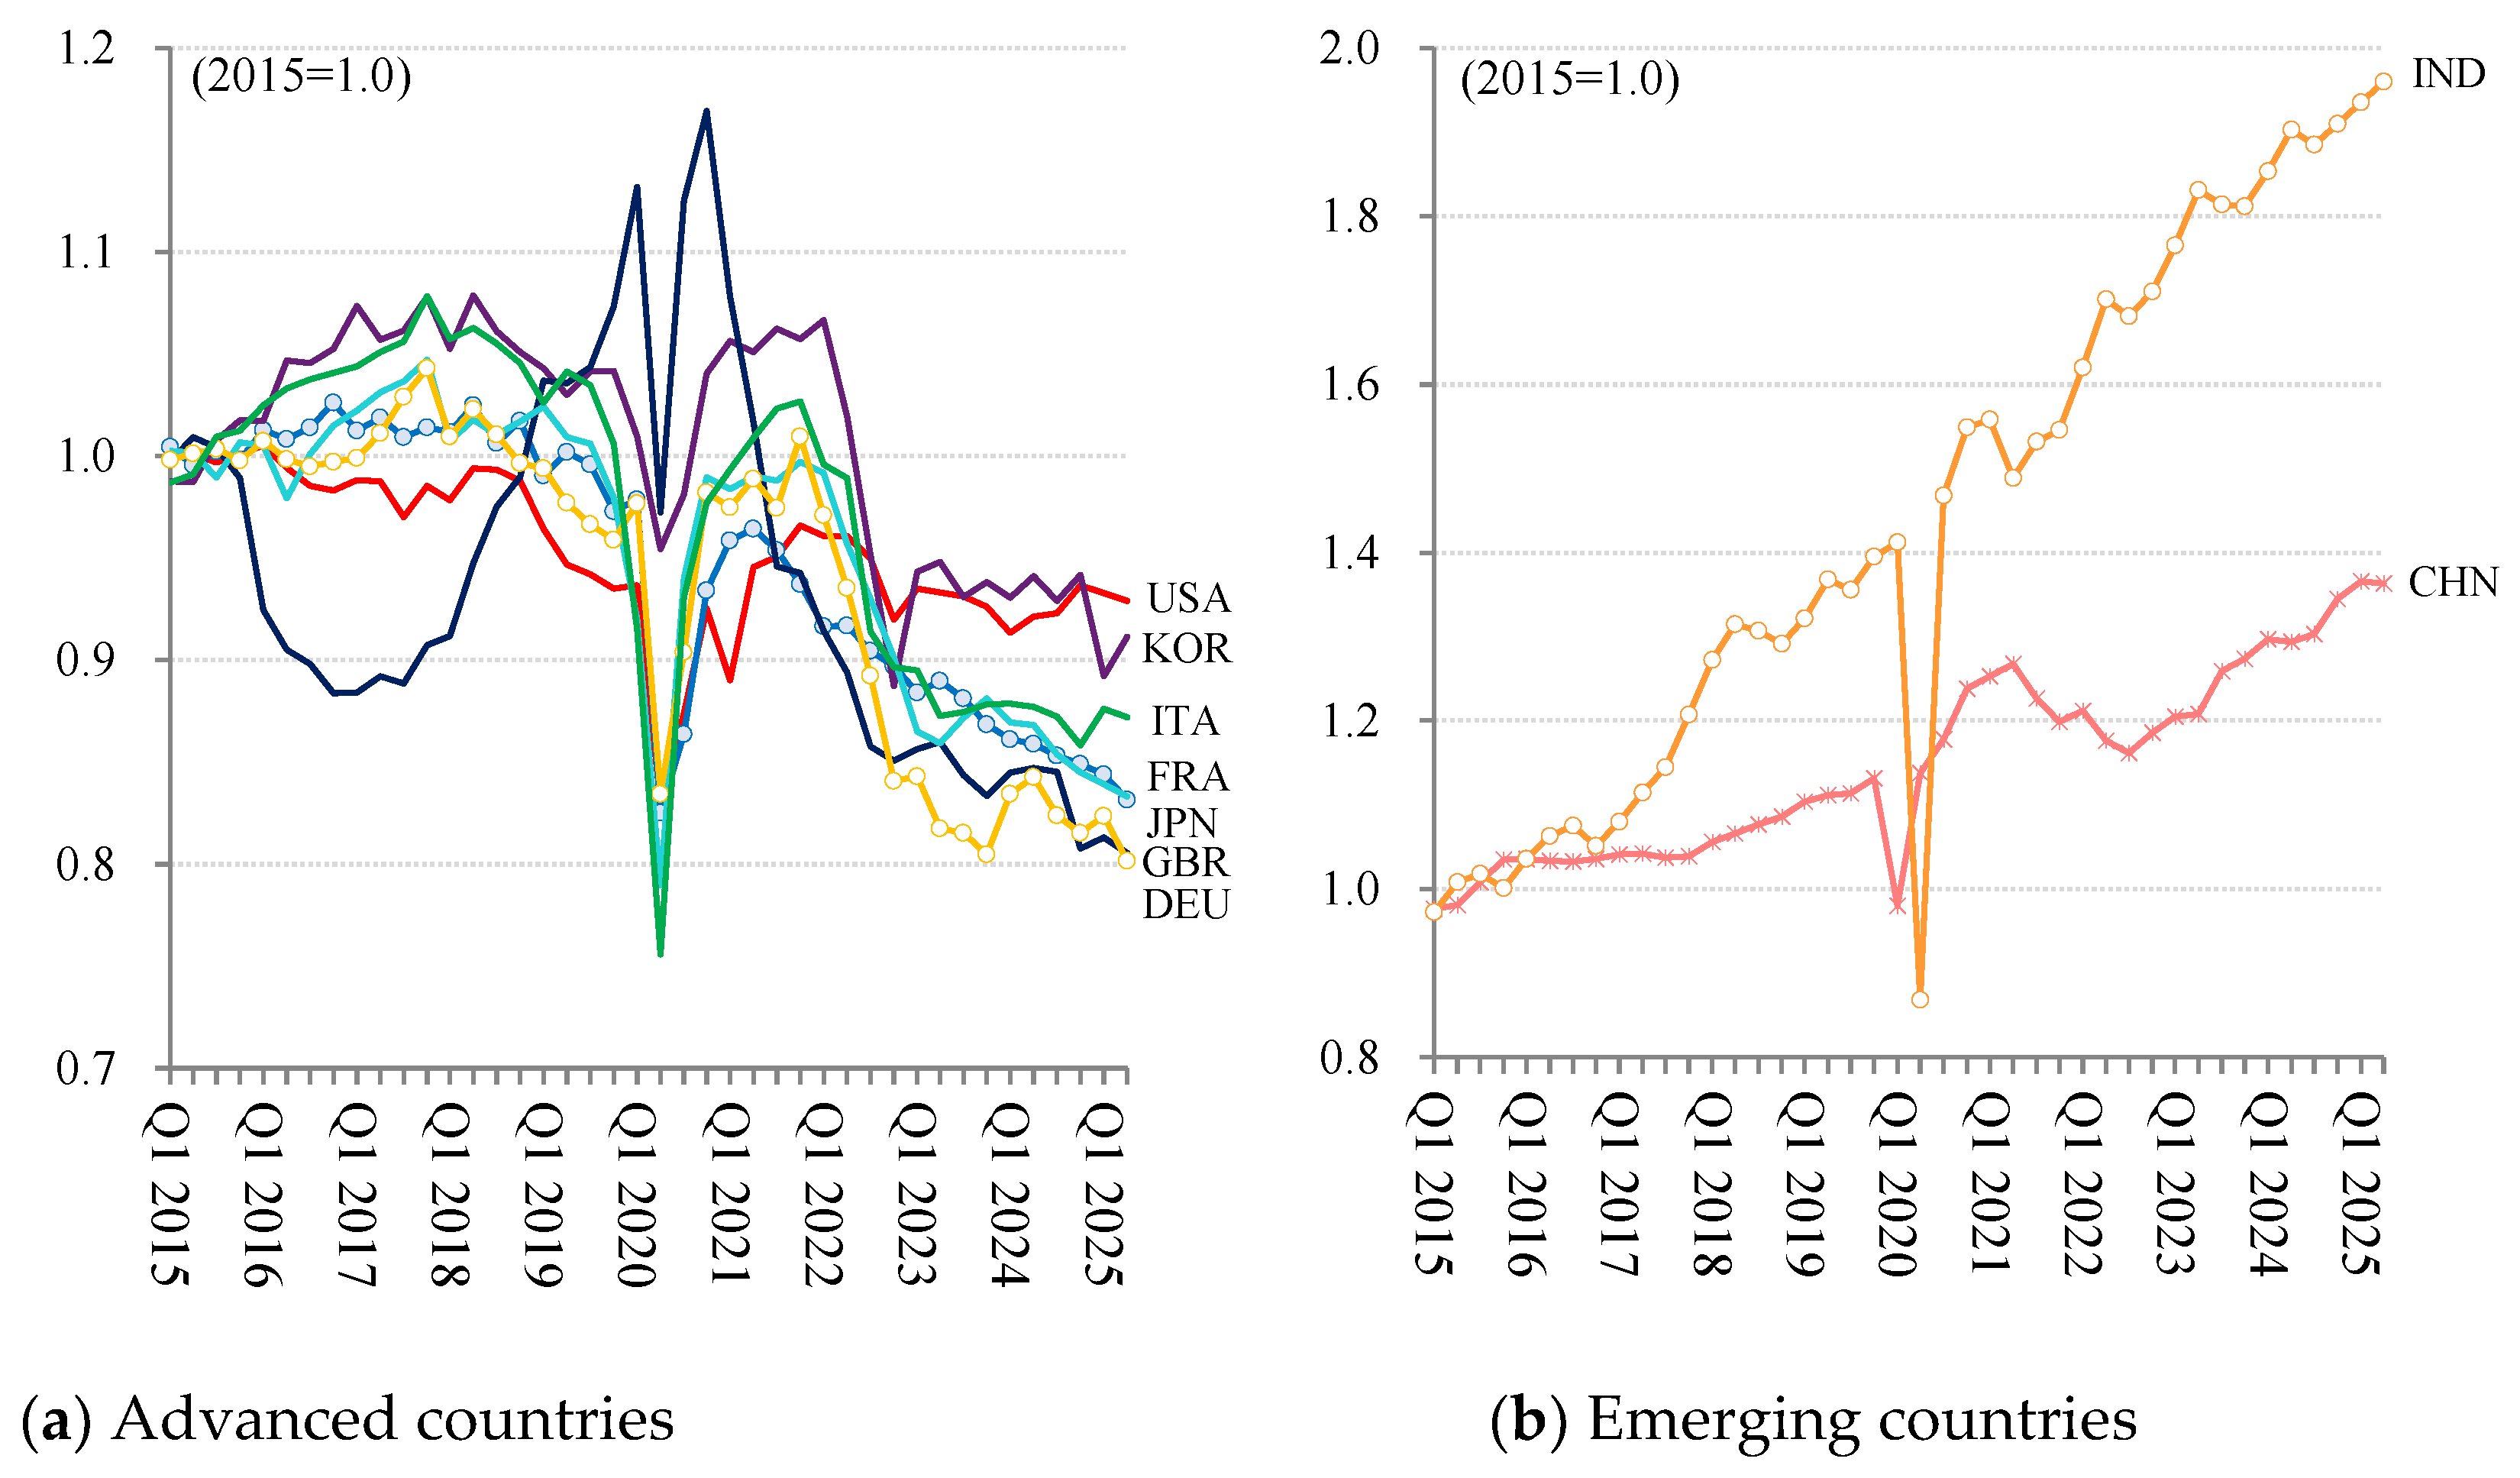
Figure A1 provides EITE output indices. It should also be noted that substantial differences exist in the overall energy scale of EITE industries across countries. As of 2023, China’s total final energy consumption in these sectors exceeds 48,000 PJ, compared with around 8,000 PJ for India, 3,000–4,000 PJ for Japan and Korea, about 2,000 PJ for Germany, around 1,000 PJ for France, and less than 1,000 PJ for Italy and the UK. These wide disparities—up to nearly two orders of magnitude—indicate that changes observed in normalized EITE indices may carry very different aggregate implications across economies.
Figure A1.
Time-series trajectories of EITE output indices: Q1 2015–Q2 2025 (see Table 3 notes for data sources).
Figure A1.
Time-series trajectories of EITE output indices: Q1 2015–Q2 2025 (see Table 3 notes for data sources).
Appendix B.2
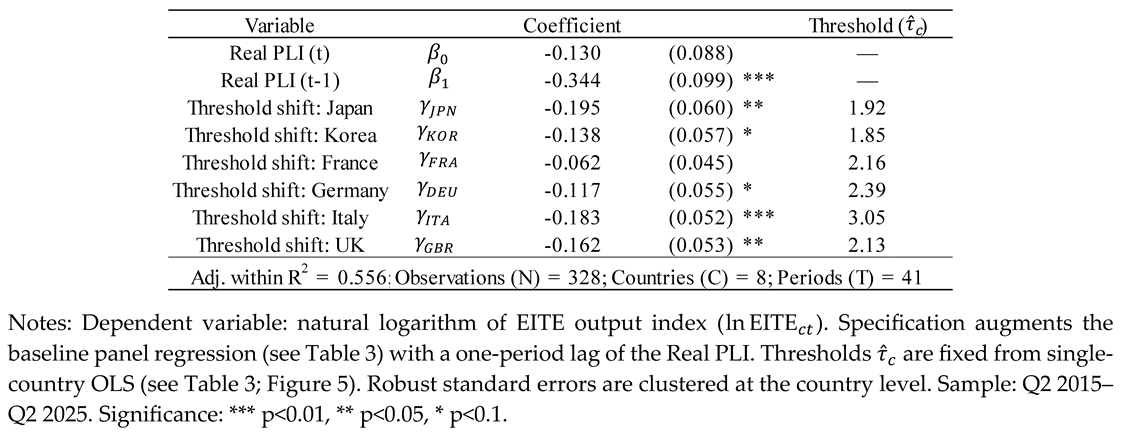
This appendix reports a robustness check incorporating lagged explanatory variables. Table A3 reports results from an alternative specification that augments the baseline panel regression with a one-period lag of the Real PLI. The lagged term enters with a strongly negative and statistically significant coefficient, whereas the contemporaneous effect becomes insignificant. This pattern indicates that EITE output responds with a short delay to changes in real energy prices. Importantly, the threshold-shift coefficients remain negative—and mostly statistically significant—across all six advanced economies, confirming that the nonlinear break structure identified in the baseline specification is robust to the inclusion of lagged explanatory variables.
Table A3.
Panel threshold regression results with a one-period lag of the Real PLI.
References
- Stern, N. The Economics of Climate Change: The Stern Review; Cambridge University Press: Cambridge, UK, 2007. [Google Scholar]
- Stiglitz, J.E.; Stern, N.; Duan, M.; Edenhofer, O.; Giraud, G.; Heal, G.M.; la Rovere, E.L.; Morris, A.; Moyer, E.; Pangestu, M.; Shukla, P.R.; Sokona, Y.; Winkler, H. Report of the High-Level Commission on Carbon Prices. International Bank for Reconstruction and Development and International Development Association/The World Bank: Washington, DC, USA, 2017.
- Stern, N.; Stiglitz, J.E. Climate Change and Growth. Industrial and Corporate Change 2023, 32, 277–303. [Google Scholar] [CrossRef]
- Geels, F.W. Technological Transitions as Evolutionary Reconfiguration Processes: A Multi-level Perspective and A Case-study. Research Policy 2002, 31, 1257–1274. [Google Scholar] [CrossRef]
- Markard, J.; Raven, R.; Truffer, B. Sustainability Transitions: An Emerging Field of Research and Its Prospects. Research Policy 2012, 41, 955–967. [Google Scholar] [CrossRef]
- Köhler, J.; Geels, F.W.; Kern, F.; Markard, J.; Onsongo, E.; Wieczorek, A.; Alkemade, F.; Avelino, F.; Bergek, A.; Boons, F.; Fünfschilling, L.; Hess, D.; Holtz, G.; Hyysalo, S.; Jenkins, K.; Kivimaa, P.; Martiskainen, M.; McMeekin, A.; Mühlemeier, M.S.; Nykvist, B.; Pel, B.; Raven, R.; Rohracher, H.; Sandén, B.; Schot, J.; Sovacool, B.; Turnheim, B.; Welch, D.; Wells, P. An Agenda for Sustainability Transitions Research: State of The Art and Future Directions. Environmental Innovation and Societal Transitions 2019, 31, 1–32. [Google Scholar] [CrossRef]
- Dechezleprêtre, A.; Sato, M. The Impacts of Environmental Regulations on Competitiveness. Review of Environmental Economics and Policy 2017, 11, 183–206. [Google Scholar] [CrossRef]
- Löschel, A.; Lutz, B.J.; Managi, S. The Impacts of the EU ETS on Efficiency and Economic Performance– An Empirical Analysis for German Manufacturing Firms. Resource and Energy Economics 2019, 56, 71–95. [Google Scholar] [CrossRef]
- Chiacchio, F.; De Santis, R.A.; Gunnella, V.; Lebastard, L. How Have Higher Energy Prices Affected Industrial Production and Imports? Economic Bulletin Boxes, European Central Bank: Frankfurt, Germany, 2023. Available online: https://www.ecb.europa.eu/press/economic-bulletin/focus/2023/html/ecb.ebbox202301_02~8d6f1214ae.en.html (accessed on 1 November 2025).
- Jäger, P. Rustbelt Relics or Future Keystone? EU Policy for Energy-intensive Industries. Jacques Delors Centre: Berlin, Germany, 2023. Available online: https://www.delorscentre.eu/fileadmin/2_Research/1_About_our_research/2_Research_centres/6_Jacques_Delors_Centre/Publications/20231221_Jaeger_Industries.pdf (accessed on 1 November 2025).
- Vogel, L.; Neuman, M.; Linz, S.; Calculation and Development of the New Production Index for Energy-Intensive Industrial Branches. WISTA–Scientific Journal 2023, 2. Available online: https://www.destatis.de/EN/Methods/WISTAScientificJournal/Downloads/production-index-energy-intensive-industrial-022023.pdf (accessed on 1 November 2025).
- Saussay, A.; Sato, M. The Impact of Energy Prices on Industrial Investment Location: Evidence from Global Firm Level Data. Journal of Environmental Economics and Management 2024, 127, 102992. [Google Scholar] [CrossRef]
- Draghi, M. The Future of European Competitiveness: A Competitiveness Strategy for Europe. European Commission: Brussels, Belgium, 2024. Available online: https://commission.europa.eu/document/download/97e481fd-2dc3-412d-be4c-f152a8232961_en (accessed on 1 November 2025).
- DIHK. Neue Wege für die Energiewende („Plan B“): Wissenschaftliche Studie im Auftrag der Deutschen Industrie- und Handelskammer [New Paths for the Energy Transition (“Plan B”): Scientific Study Commissioned by the Association of German Chambers of Industry and Commerce]. Deutsche Industrie- und Handelskammer: Berlin, Germany, 2025. Available online:. Available online: https://www.frontier-economics.com/media/u1vbsfop/frontier-dihk-energiewende-plan-b-03092025-stc-update-stc.pdf (accessed on 1 November 2025).
- WCED. Our Common Future (Brundtland Report); Oxford University Press: Oxford, UK, 1987. [Google Scholar]
- Elkington, J. Cannibals with Forks: The Triple Bottom Line of 21st Century Business; Capstone: Oxford, UK, 1997. [Google Scholar]
- Sovacool, B.K. What Are We Doing Here? Analyzing Fifteen Years of Energy Scholarship and Proposing a Social Science Research Agenda. Energy Research & Social Science 2014, 1, 1–29. [Google Scholar] [CrossRef]
- Schulte, I.; Heindl, P. Price and Income Elasticities of Residential Energy Demand in Germany. Energy Policy 2017, 102, 512–528. [Google Scholar] [CrossRef]
- Bouzarovski, S. Energy Poverty: (Dis)Assembling Europe's Infrastructural Divide; Palgrave Macmillan Cham: Cham, Switzerland, 2018. [Google Scholar]
- Volodzkiene, L.; Streimikiene, D. Integrating Energy Justice and Economic Realities through Insights on Energy Expenditures, Inequality, and Renewable Energy Attitudes. Scientific Reports 2025, 15, 27067. [Google Scholar] [CrossRef] [PubMed]
- Shejale, S.; Zhan, M.X.; Sahakian, M.; Aleksieva, R.; Biresselioglu, M.E.; Bogdanova, V.; Cardone, B.; Epp, J.; Kirchler, B.; Kollmann, A.; Liste, L.; Massullo, C.; Schibel, K. Participation as a Pathway to Procedural Justice: A Review of Energy Initiatives across Eight European Countries. Energy Research & Social Science 2025, 122, 103982. [Google Scholar] [CrossRef]
- European Commission. Energy Economic Developments in Europe; Publications Office of the European Union: Luxembourg, 2014. [Google Scholar]
- European Commission. Energy Prices and Costs in Europe. Commission Staff Working Document, 2019. Available online: https://energy.ec.europa.eu/system/files/2019-01/swd_-_v5_text_6_-_part_1_of_4_0.pdf (accessed on 1 November 2025).
- Faiella, I.; Mistretta, A. Energy Costs and Competitiveness in Europe. Bank of Italy Temi di Discussione 2020, 1259. [Google Scholar] [CrossRef]
- Kaltenegger, O.; Löschel, A.; Baikowski, M.; Lingens, J. Energy Costs in Germany and Europe: An Assessment Based on a (Total Real Unit) Energy Cost Accounting Framework. Energy Policy 2017, 104, 419–430. [Google Scholar] [CrossRef]
- Kaltenegger, O. What Drives Total Real Unit Energy Costs Globally? A Novel LMDI Decomposition Approach. Applied Energy 2020, 261, 114340. [Google Scholar] [CrossRef]
- Nomura, K. Energy Productivity and Economic Growth: Experiences of the Japanese Industries, 1955–2019; Springer: Cham, Switzerland, 2023. [Google Scholar]
- UNIDO. Industrial Development Report 2020: Industrializing in the Digital Age; United Nations Industrial Development Organization: Vienna, Austria, 2020. [Google Scholar]
- Lynch, C.; Simsek, Y.; Mercure, J.-F.; Fragkos, P.; Lefèvre, J.; Le Gallic, T.; Fragkiadakis, K.; Paroussos, L.; Fragkiadakis, D.; Leblanc, F.; Nijsse, F. Structural Change and Socio-Economic Disparities in a Net Zero Transition. Economic Systems Research 2024, 36, 607–629. [Google Scholar] [CrossRef]
- World Bank. Purchasing Power Parities and the Size of World Economies: Results from the International Comparison Program 2021; World Bank: Washington, DC, USA, 2024; Available online: https://www.worldbank.org/en/programs/icp/brief/ICP2021 (accessed on 1 November 2025).
- Nomura, K.; Miyagawa, K.; Samuels, J.D. Benchmark 2011 Integrated Estimates of the Japan–US Price Level Index for Industry Outputs. In Measuring Economic Growth and Productivity: Foundations, KLEMS Production Models, and Extensions; Fraumeni, B.M., Ed.; Academic Press: Cambridge, MA, USA, 2019; pp. 251–281. [Google Scholar]
- Jorgenson, D.W.; Nomura, K.; Samuels, J.D. A Half Century of Trans-Pacific Competition: Price Level Indices and Productivity Gaps for Japanese and U.S. In dustries, 1955–2012. In The World Economy: Growth or Stagnation? Jorgenson, D.W.; Fukao, K., Timmer, M.P., Eds.; Cambridge University Press: Cambridge, UK, 2016; pp. 469–507. [Google Scholar]
- IEA. Energy Prices. International Energy Agency: Paris, France, 2025. Available online: https://www.iea.org/data-and-statistics/data-product/energy-prices (accessed on 1 November 2025).
- Nomura, K.; Inaba, S.; Jisshitsuteki na Enerugī Kosuto Futan ni Kansuru Kōhindo Shihyō no Kaihatsu: Getsuji RUEC to Sono Henka Yōin [Development of High-Frequency Indicators of Real Unit Energy Cost in Japan]. RCGW Discussion Paper 2023, 68. Available online: https://www.dbj.jp/ricf/pdf/research/DBJ_RCGW_DP68.pdf (accessed on 1 November 2025).
- Nomura, K.; Inaba, S.; Post-Pandemic Surges of Real Unit Energy Costs in Eight Industrialized Countries. RCGW Discussion Paper 2024, 70. Available online: https://www.dbj.jp/ricf/pdf/research/DBJ_RCGW_DP70.pdf (accessed on 1 November 2025).
- Nomura, K.; Inaba, S. Posuto Pandemikku no Enerugī Kakaku Kōtō to Jisshitsu Kakusa Kakudai—Shuyō Nanaka Koku no Hikaku Bunseki [Energy Price Surge and Widening Real Price Differentials in the Post-Pandemic Era: A Comparative Analysis of Seven Major Countries]. KEO Discussion Paper 2025, 185. [Google Scholar]
- APO. APO Productivity Databook 2025; Asian Productivity Organization, Keio University Press: Tokyo, Japan, 2025. [Google Scholar]
- Hansen, B.E. Threshold Effects in Non-dynamic Panels: Estimation, Testing, and Inference. Journal of Econometrics 1999, 93, 345–368. [Google Scholar] [CrossRef]
- Hirschman, A.O. Exit, Voice, and Loyalty: Responses to Decline in Firms, Organizations, and States; Harvard University Press: Cambridge, MA, USA, 1970. [Google Scholar]
Figure 1.
Measurement framework for constructing Real Price Level Index for energy (Real PLI).
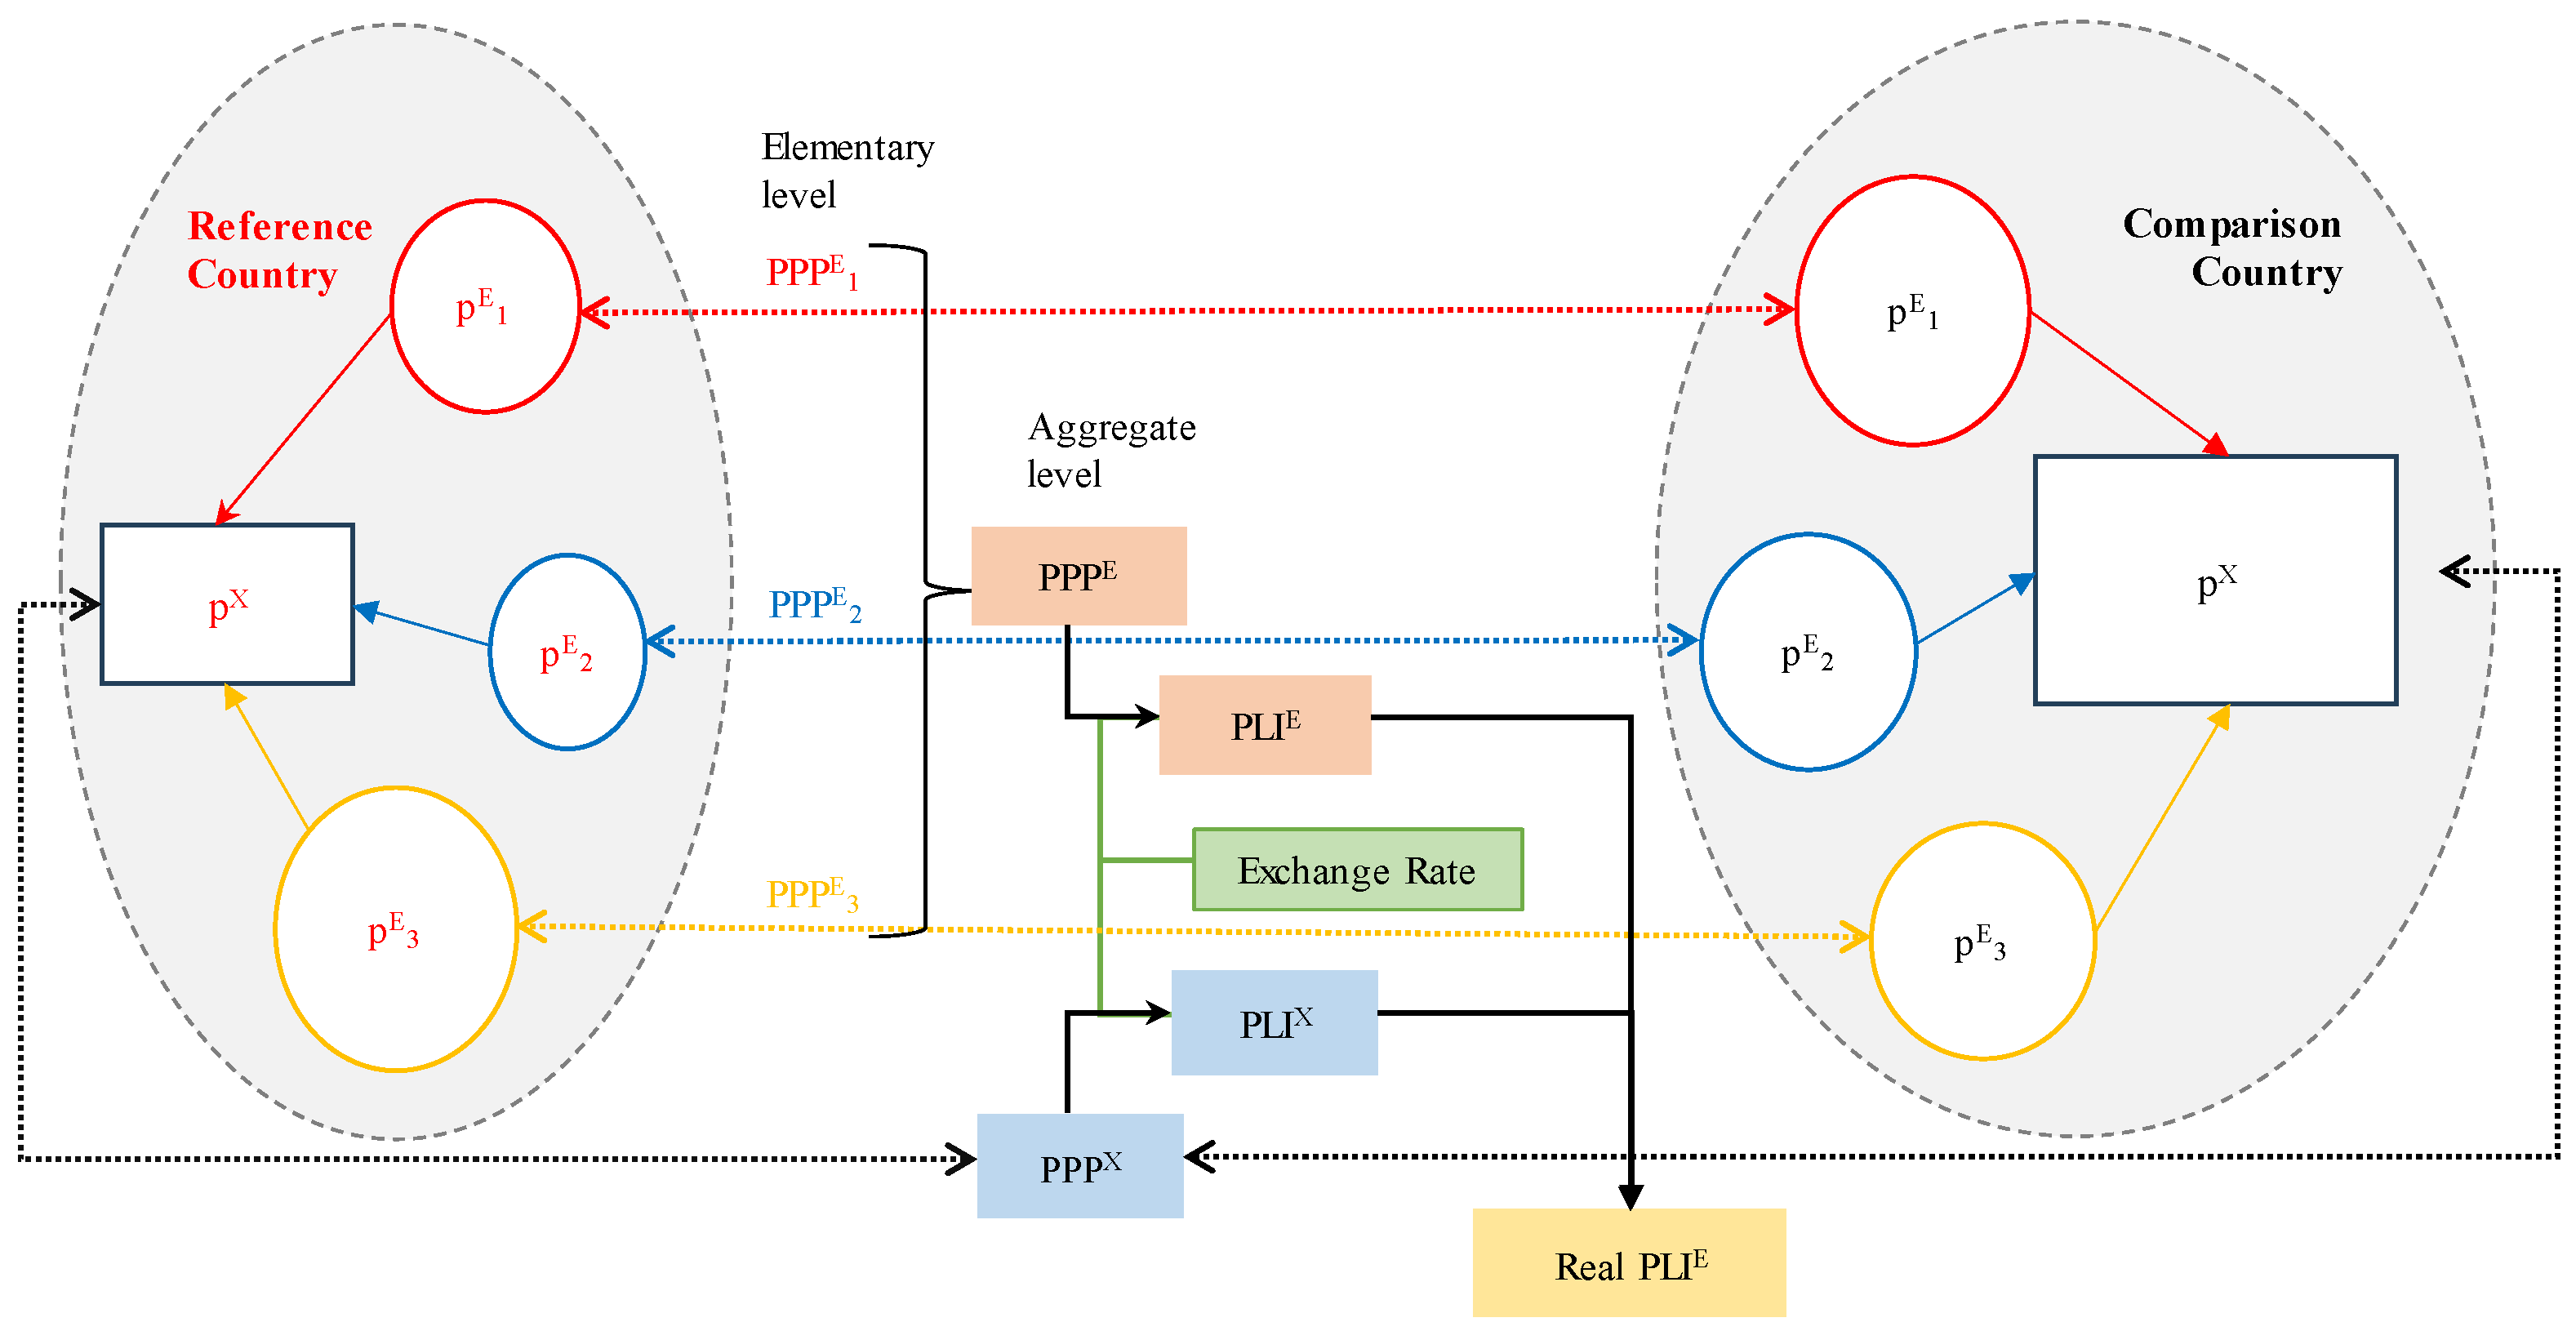
Figure 2.
Real Unit Energy Cost (RUEC) levels, RUEC gaps, and gross energy productivity (GEP) gaps: Q1 2015–Q2 2025.
Figure 2.
Real Unit Energy Cost (RUEC) levels, RUEC gaps, and gross energy productivity (GEP) gaps: Q1 2015–Q2 2025.
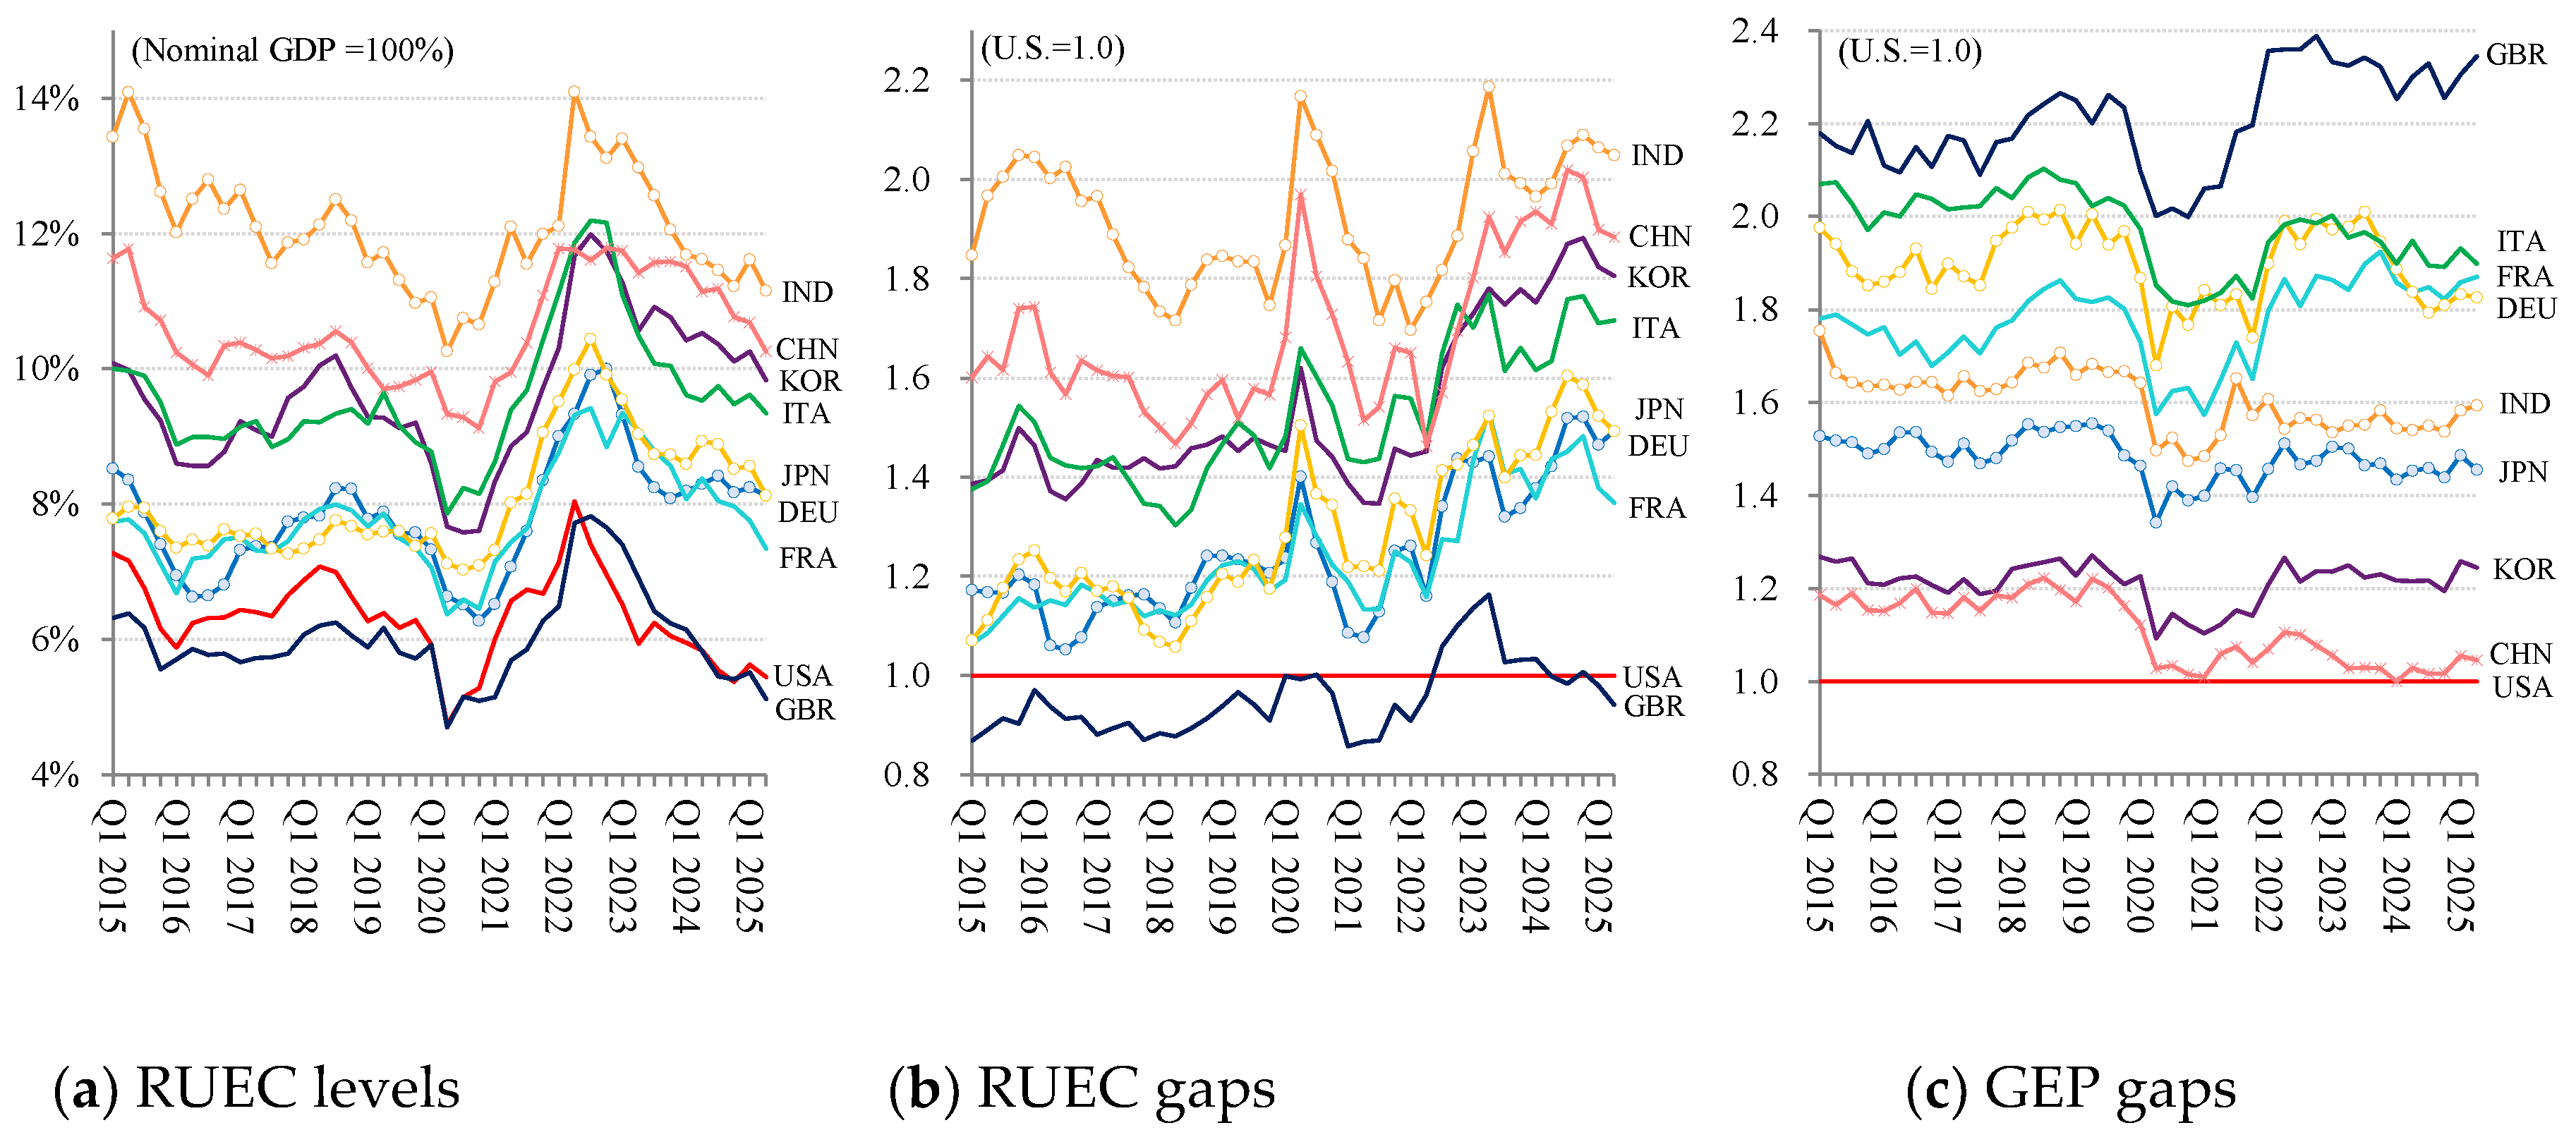
Figure 3.
Quality-adjusted energy prices, Nominal PLIs, and Real PLIs: Q1 2015–Q2 2025.
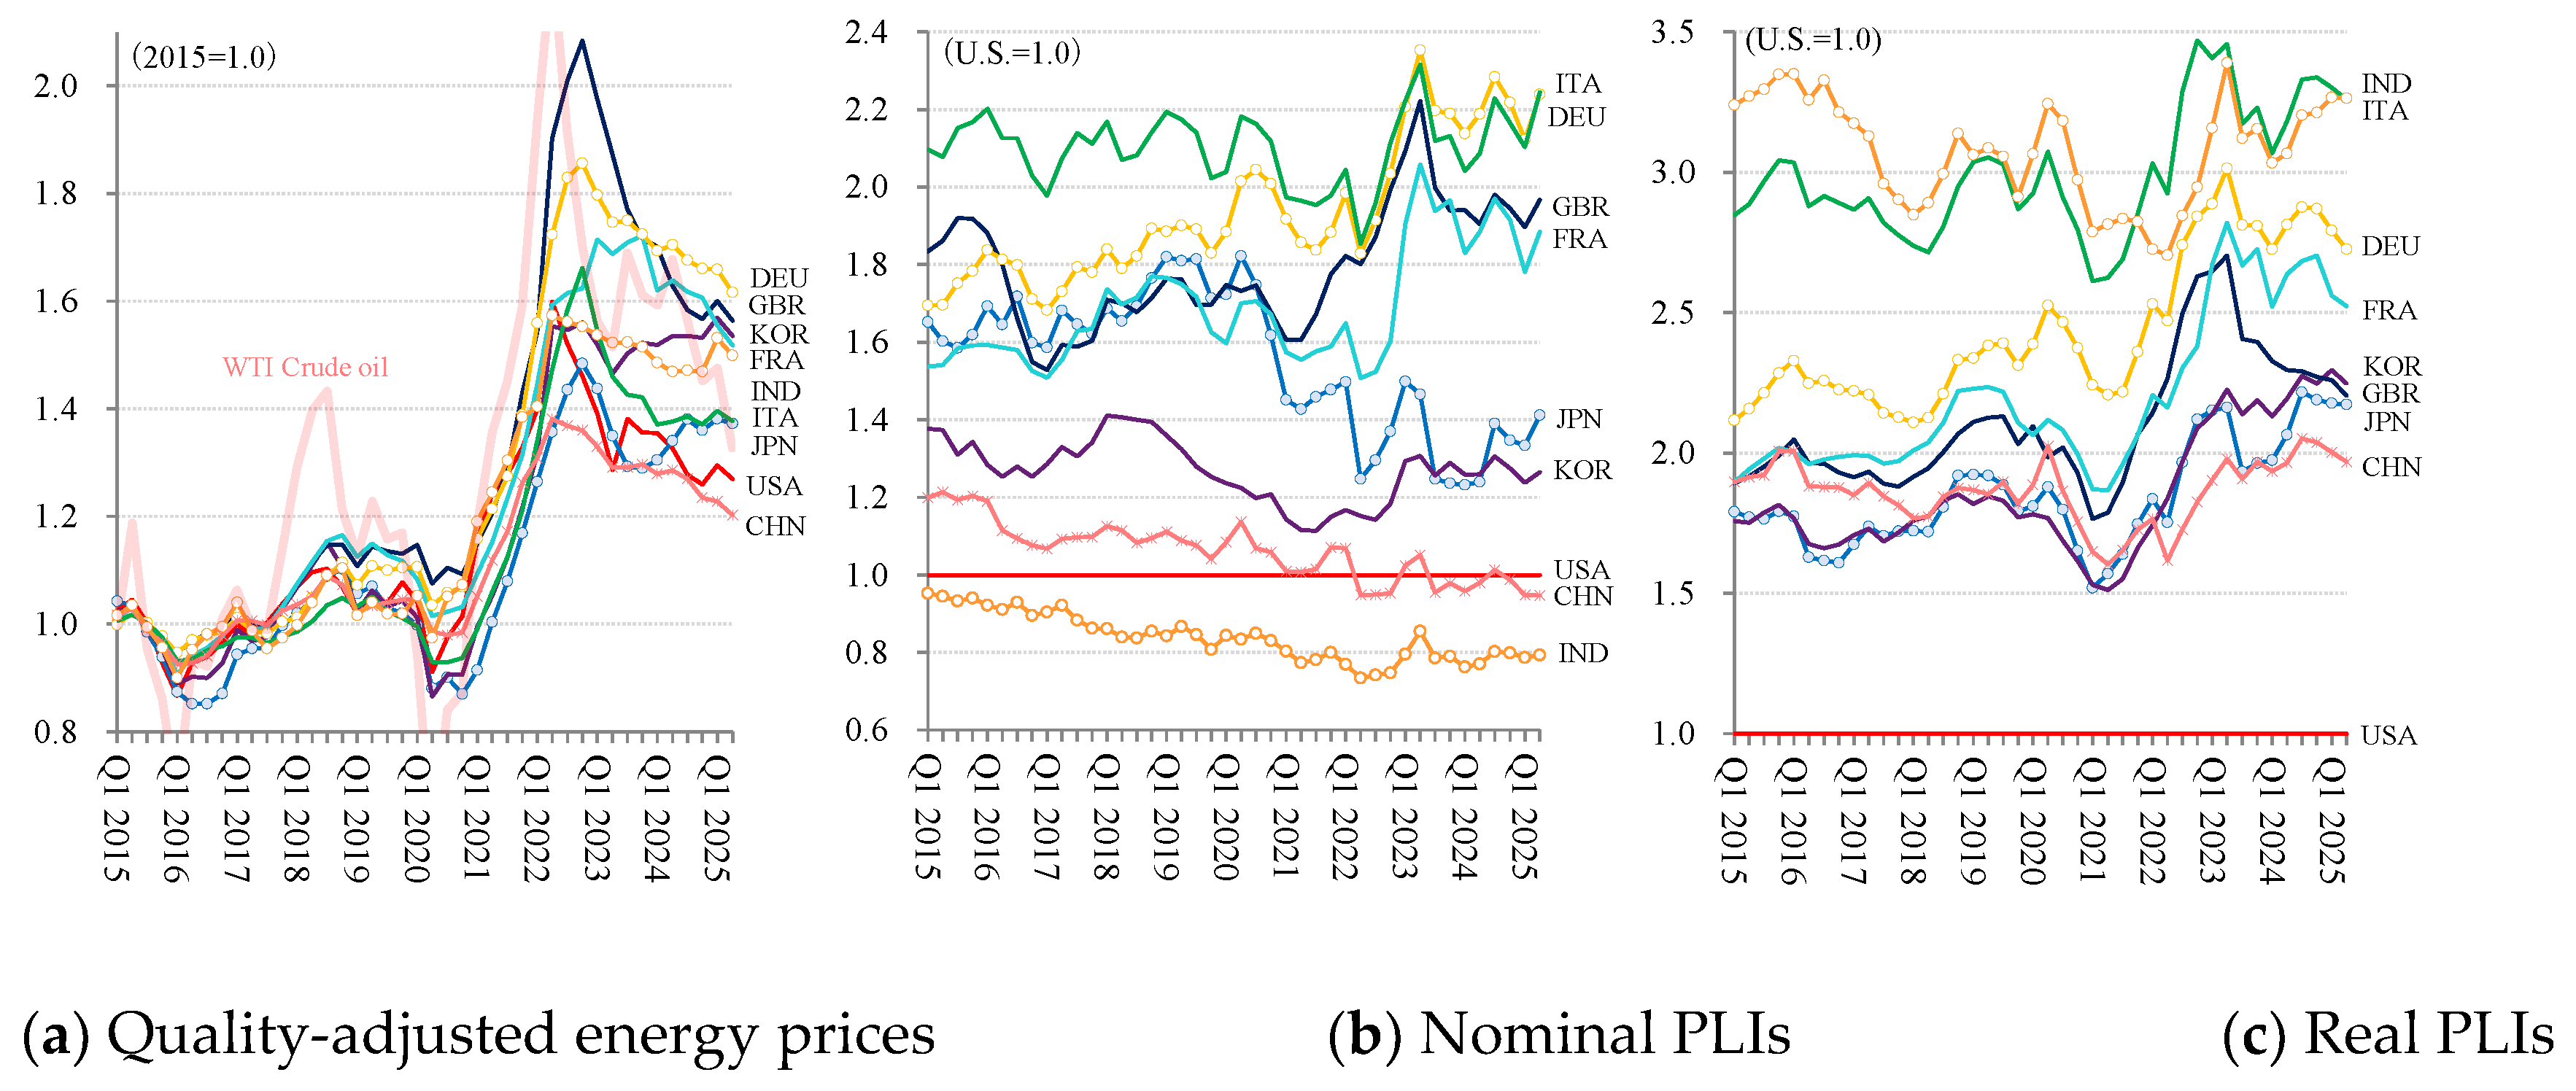
Figure 4.
Real PLIs and energy-intensive and trade-exposed (EITE) output: Q2 2015–Q2 2025 (see Table 3 notes for data sources).
Figure 4.
Real PLIs and energy-intensive and trade-exposed (EITE) output: Q2 2015–Q2 2025 (see Table 3 notes for data sources).
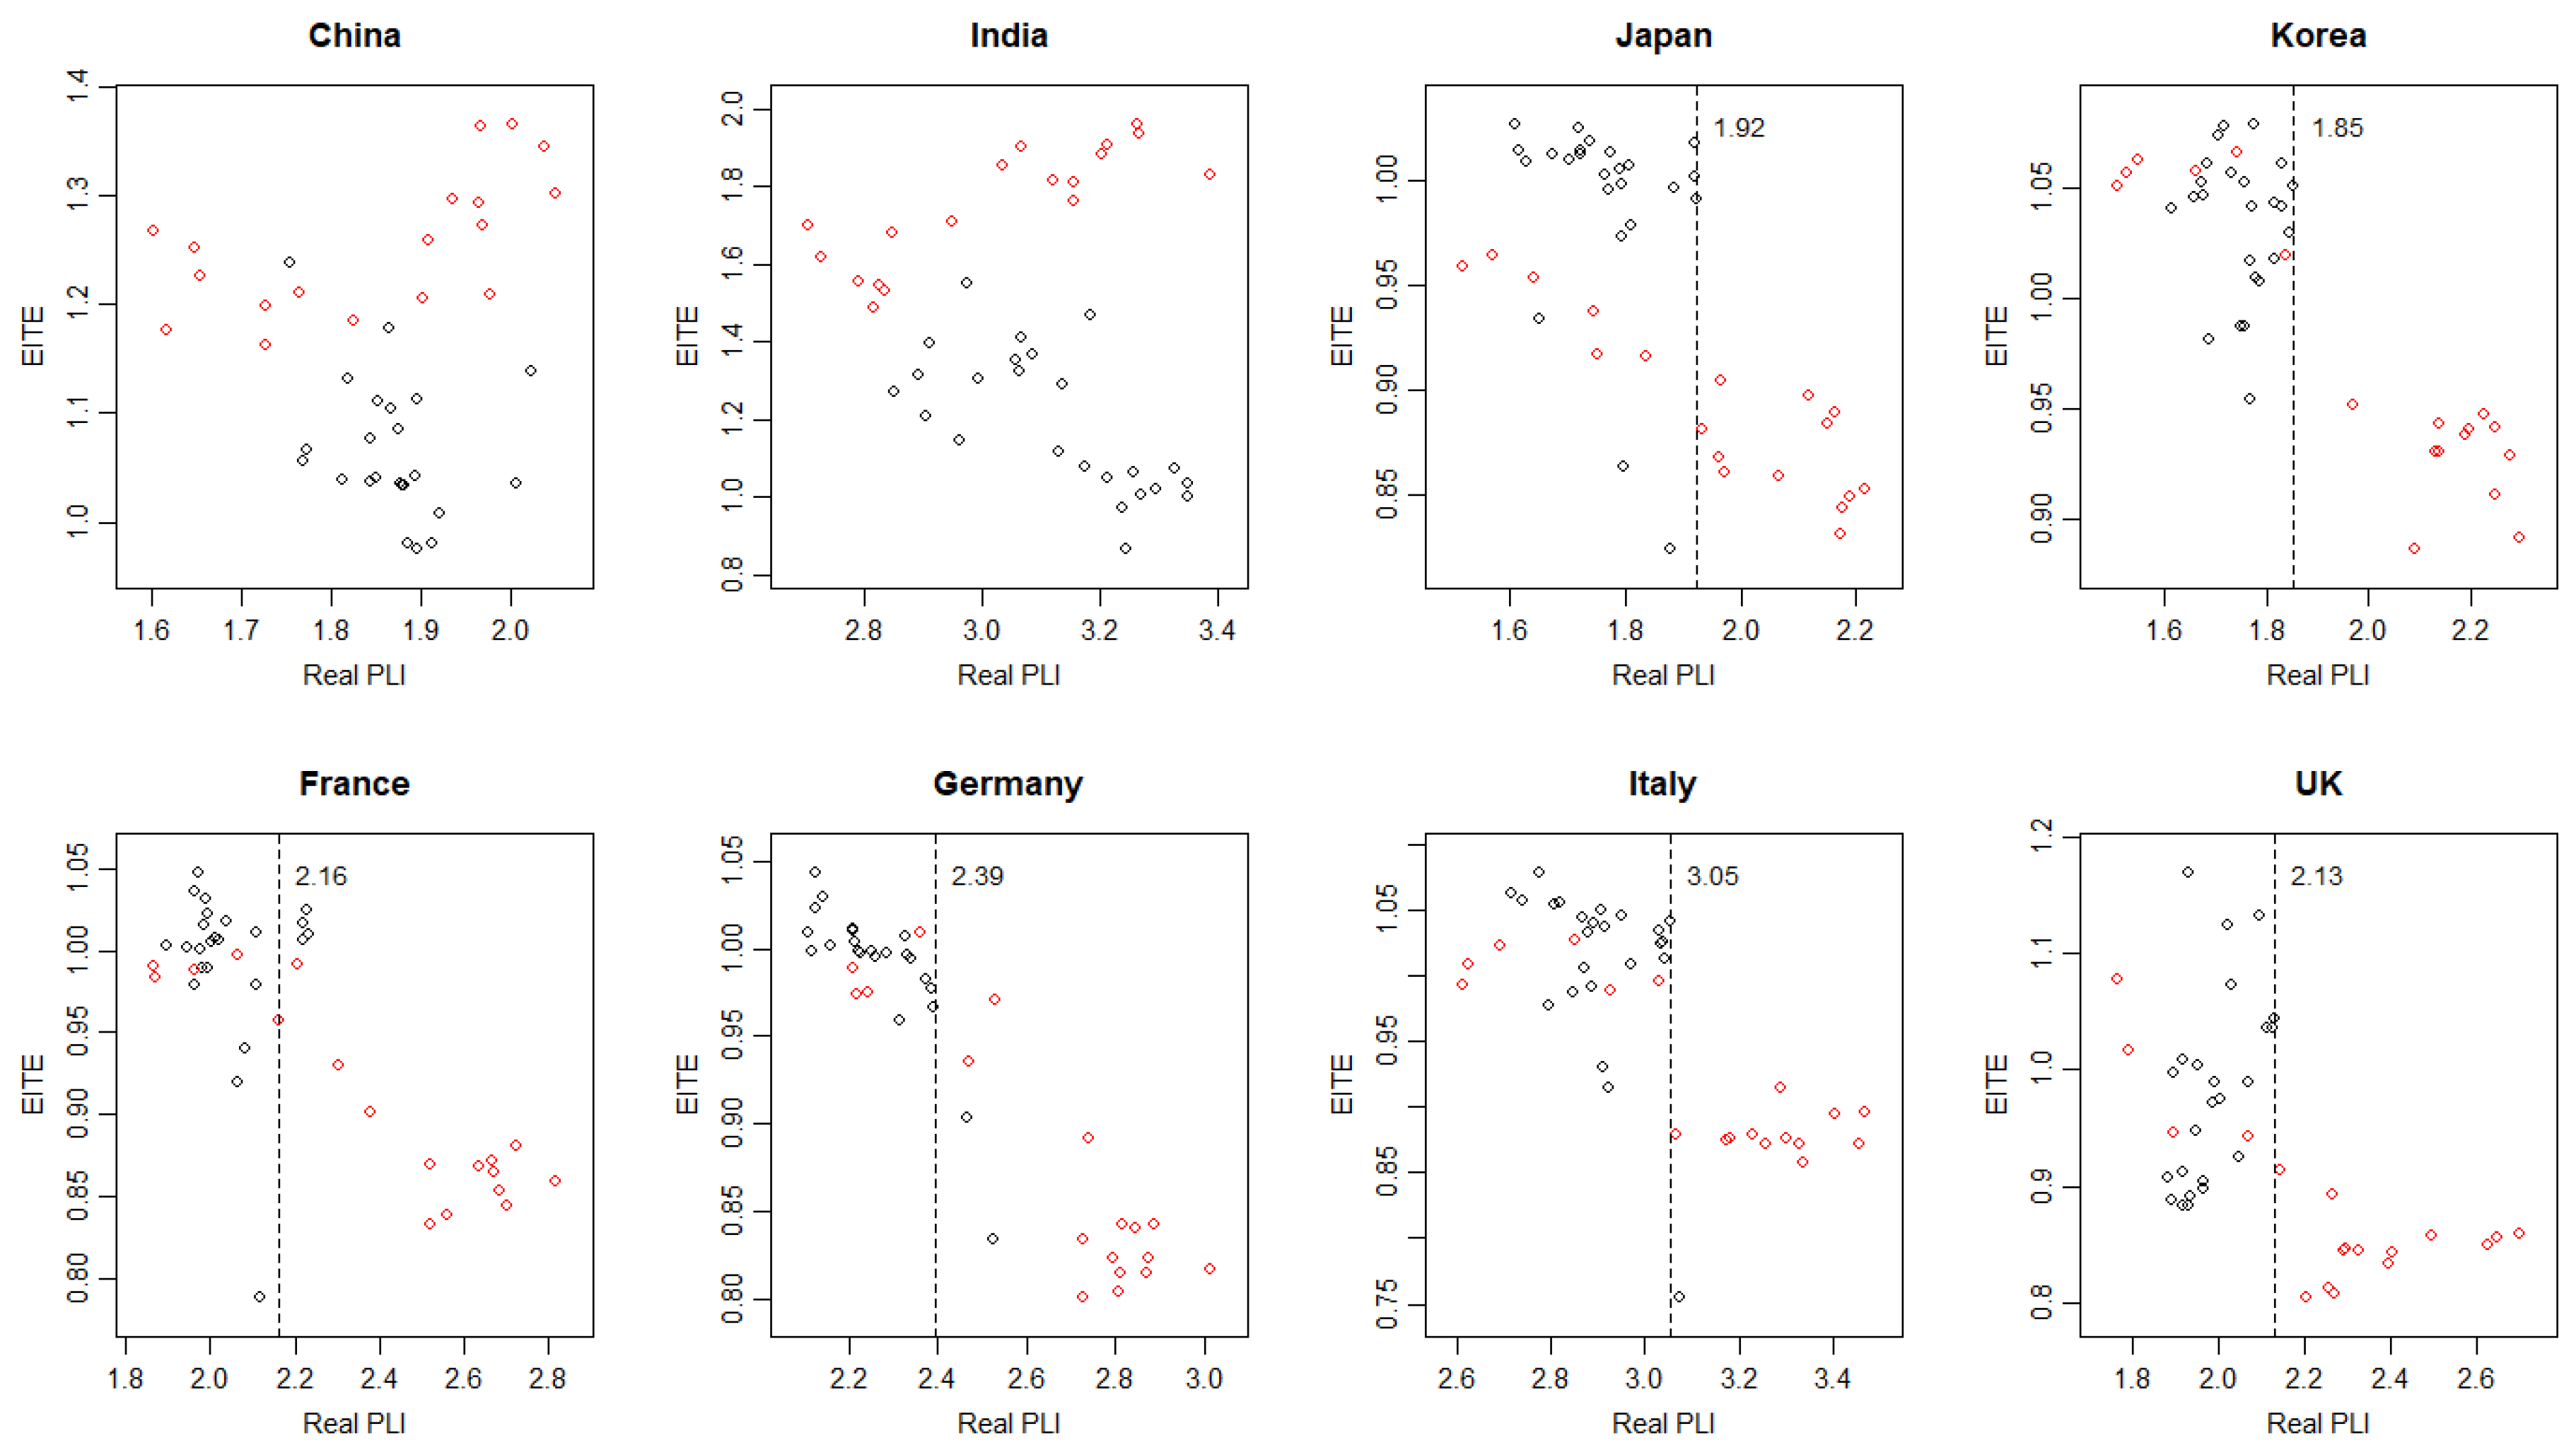
Figure 5.
Bootstrap confidence intervals for the country-specific thresholds (six advanced economies). Points and labels denote profile-OLS estimates; horizontal bars are 95% confidence intervals, with countries ordered by .
Figure 5.
Bootstrap confidence intervals for the country-specific thresholds (six advanced economies). Points and labels denote profile-OLS estimates; horizontal bars are 95% confidence intervals, with countries ordered by .
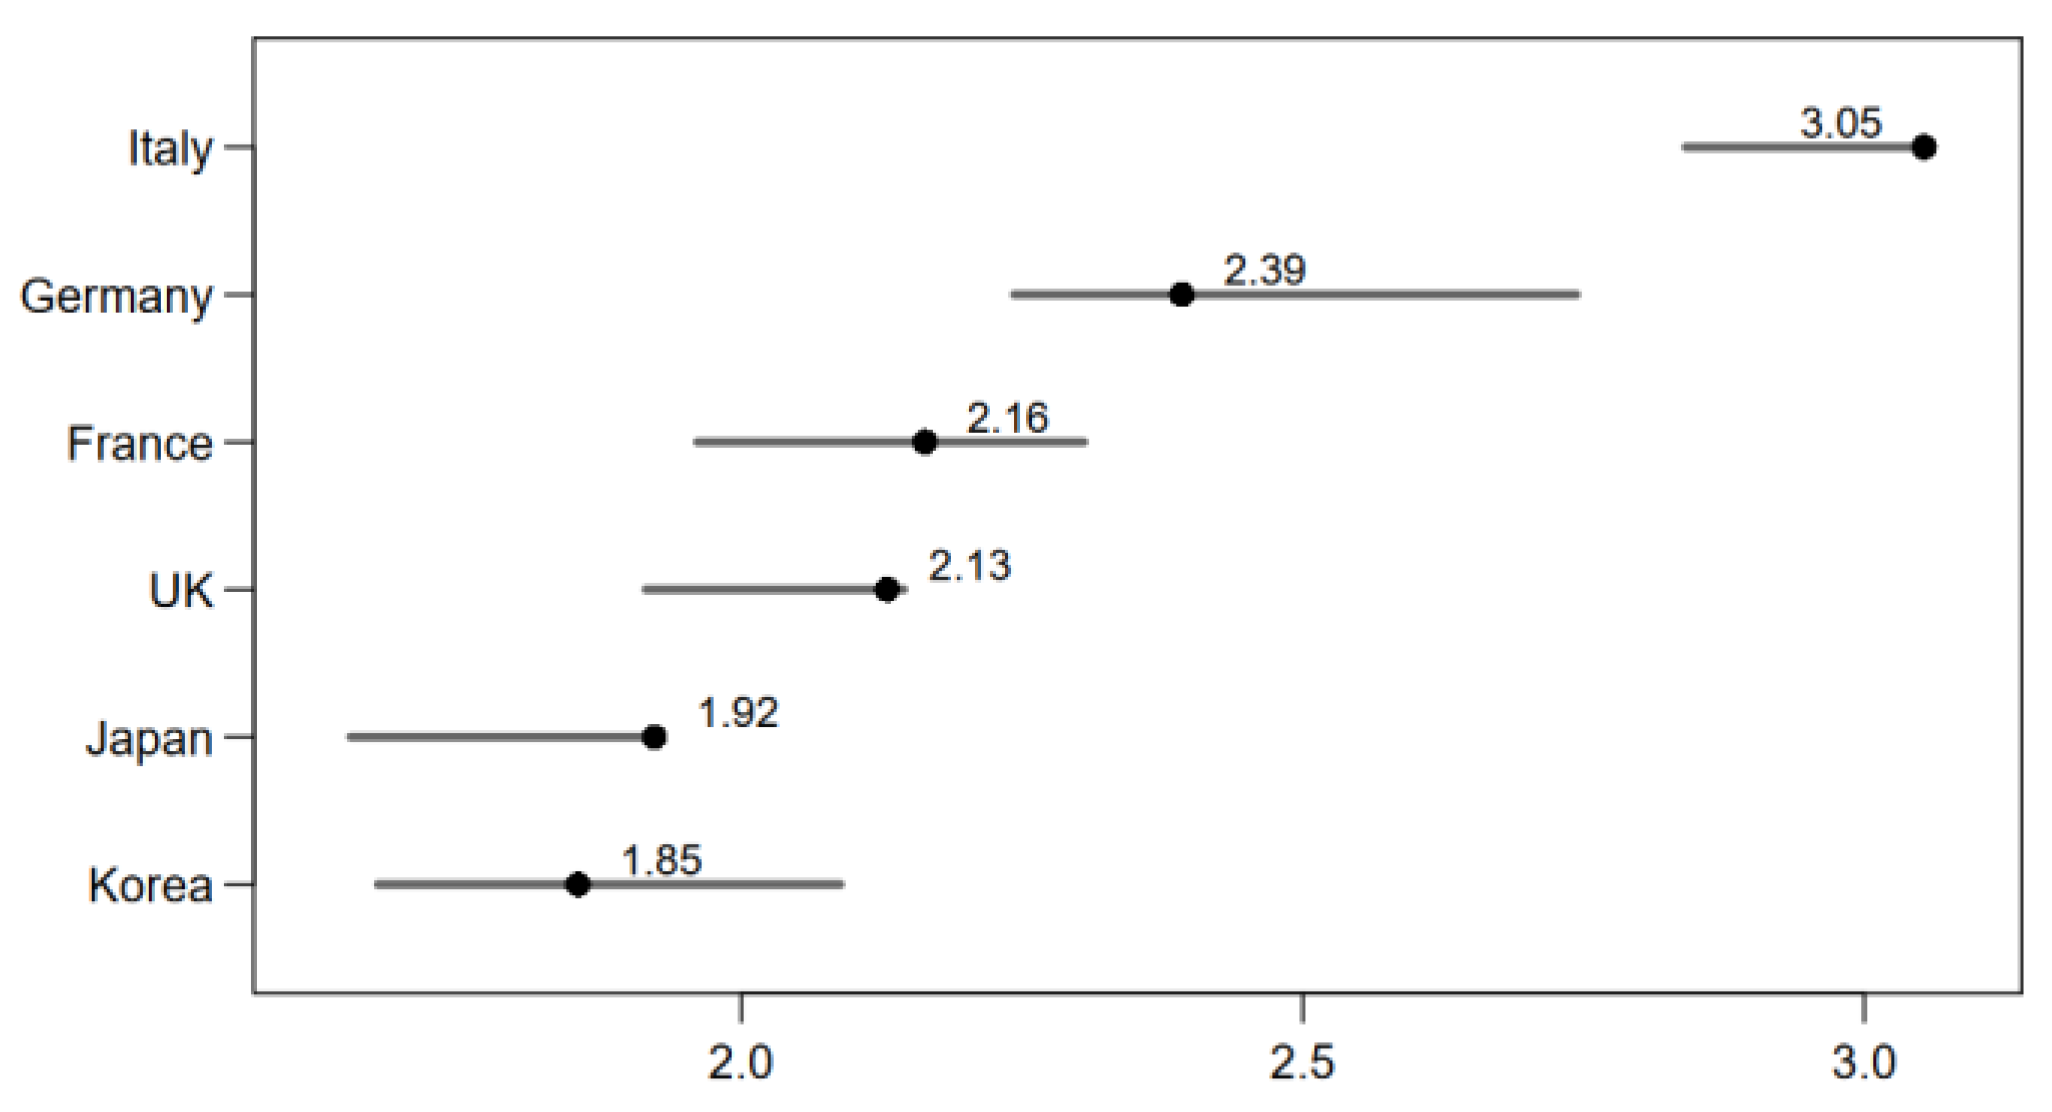
Table 1.
Bilateral RUEC and GEP gaps: Q2 2025 and pre-pandemic average (2015–2019).
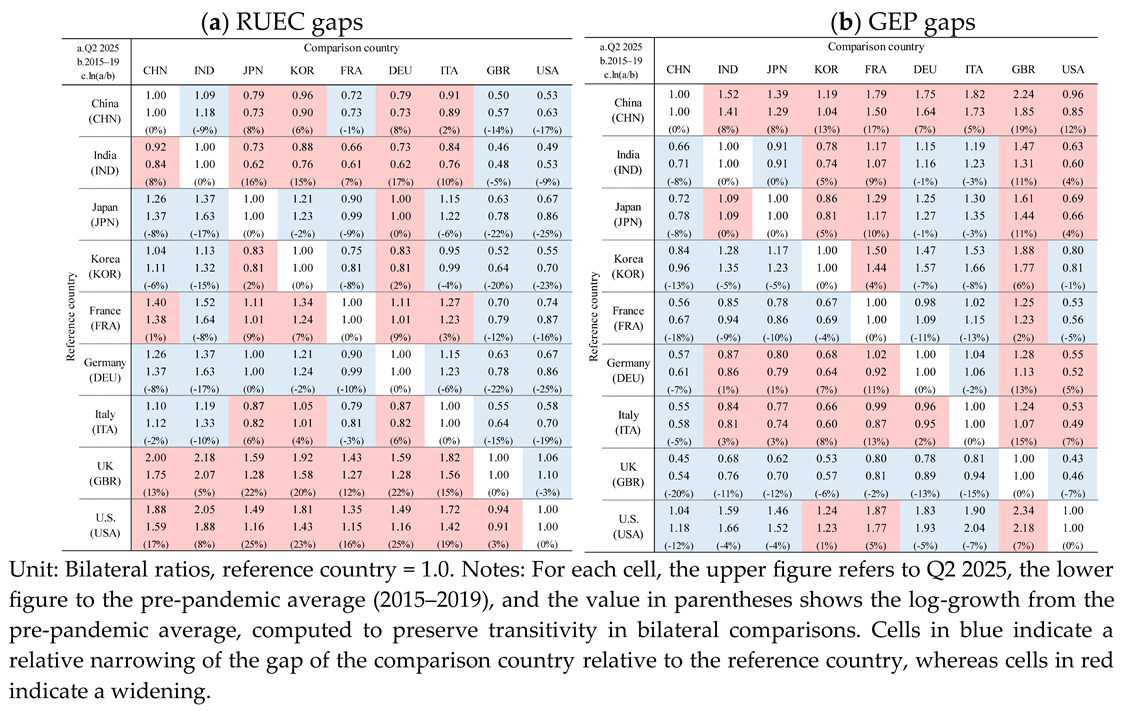
Table 2.
Bilateral Nominal and Real PLIs: Q2 2025 and pre-pandemic average (2015–2019).
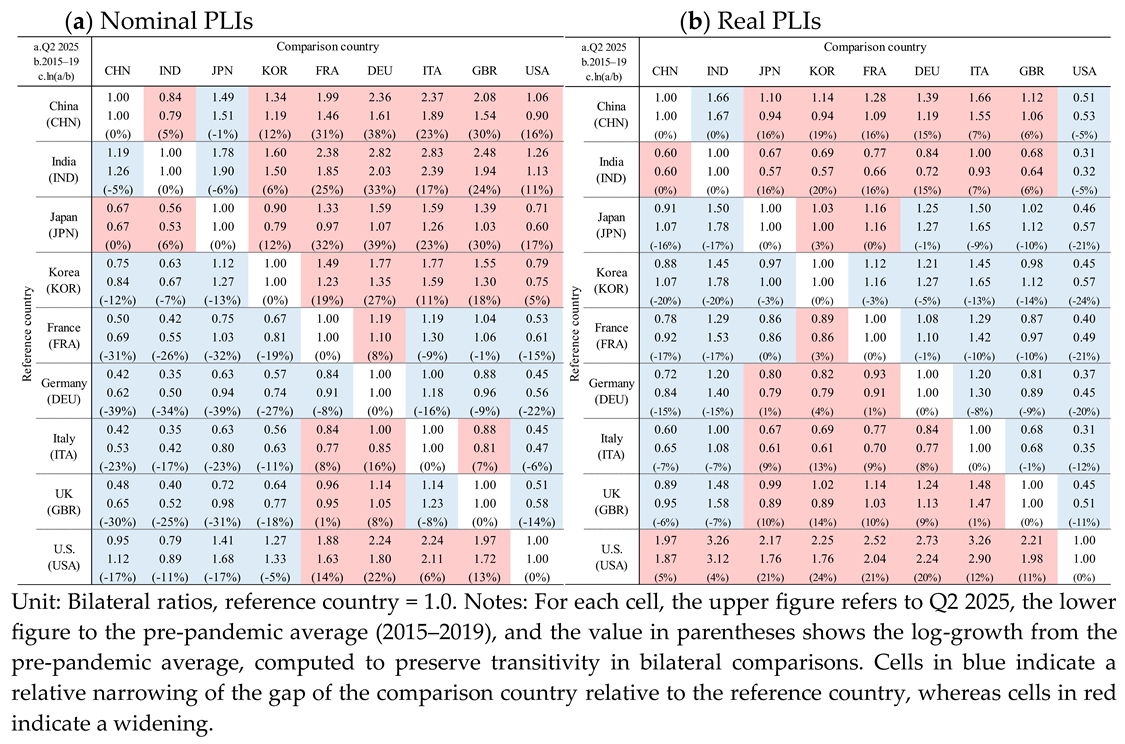
Table 3.
Panel threshold regression results.
Disclaimer/Publisher’s Note: The statements, opinions and data contained in all publications are solely those of the individual author(s) and contributor(s) and not of MDPI and/or the editor(s). MDPI and/or the editor(s) disclaim responsibility for any injury to people or property resulting from any ideas, methods, instructions or products referred to in the content. |
© 2025 by the authors. Licensee MDPI, Basel, Switzerland. This article is an open access article distributed under the terms and conditions of the Creative Commons Attribution (CC BY) license (https://creativecommons.org/licenses/by/4.0/).
Copyright: This open access article is published under a Creative Commons CC BY 4.0 license, which permit the free download, distribution, and reuse, provided that the author and preprint are cited in any reuse.


