
Submitted:
21 October 2024
Posted:
22 October 2024
You are already at the latest version
Abstract
The purpose of this research is to analyze the structural changes in primary energy production across European countries over the period from 1990 to 2022, with a focus on understanding the shifts in energy sources and their implications for energy security and sustainability. By applying clustering methods, the study categorizes European nations into distinct groups based on their primary energy production profiles, revealing significant transitions from fossil fuel-based systems to those increasingly dominated by renewable energy sources. The analysis demonstrates that while some countries have achieved substantial progress in integrating renewable energy, others remain heavily dependent on traditional energy sources such as coal and natural gas. Additionally, the study highlights the growing importance of natural gas as a transitional fuel and the relatively stable role of nuclear energy in certain regions. A key finding of this research is the disparity between energy production and consumption across Europe, with many large economies facing a persistent deficit in domestic energy production, leading to a high reliance on energy imports, particularly of natural gas and oil. This reliance poses significant challenges for energy security, especially in light of recent geopolitical disruptions and fluctuations in global energy markets. The paper also explores the environmental implications of these energy production trends, emphasizing the critical role of renewable energy in meeting the European Union’s decarbonization targets and combating climate change.
Keywords:
primary energy production
; energy transition
; cluster analysis
; renewable energy
; fossil fuels
; energy security
; Europe
; energy
1. Introduction
The primary objective of this paper is to analyze the structure and trends in primary energy production in the European Union and other selected European countries. This article serves as a continuation of a series of studies on primary energy and the application of cluster analysis to describe the energy market in Europe. In the previous work [1], the authors focused on the analysis of primary energy consumption structures across European countries. Building upon that foundation, the present study shifts the focus to the production of primary energy. The analysis is enriched by a k-means clustering of countries into groups similar in terms of primary energy production structure. Primary energy sources are classified according to the Standard International Energy Product Classification (SIEC) into solid fossil fuels, natural gas, crude oil, nuclear energy, renewable energy sources, peat, and non-renewable waste. The analysis utilized data from the Eurostat database for the period from 1990 to 2022 (specifically the table nrg_bal_s) [2]. The clustering analysis aimed to identify groups of similar countries, thereby providing valuable insights into their current energy situation and energy security, as well as changes that have occurred between 1990 and 2022. The cluster analysis was conducted for both the beginning and the end of this period to capture the dynamics over time. As this paper is a continuation, the theoretical introduction to energy security and cluster analysis has been significantly abbreviated, given that these topics were comprehensively addressed in the earlier article [1]. The analysis was conducted using the R programming language [3] and the RStudio IDE [4], supported by the tidyverse framework libraries [5]. The structure of the article is as follows: the introductory section briefly revisits the concept of energy security and its relationship with primary energy production. Subsequently, the author presents primary energy production in selected European countries from 1990 to 2022 and the extent to which consumption is met by domestic production. This is followed by the presentation of the clustering analysis and its results. The article concludes with a summary and conclusions.
1.1. Historical Development of Energy Security
Energy security has been a critical issue throughout history, gaining particular prominence in the latter half of the 20th century. It encompasses various aspects, including the necessity of continuous, secure access to reliable and affordable energy sources as a prerequisite for the development of civilization [6], the pivotal role of energy in socio-economic life [7], and its undeniable influence on economic functioning and development [8], social welfare, and consumption processes [9]. The availability of adequate energy resources underscores the economic and political strength of states and supranational organizations [10], making energy a key element of national and international security [11], with energy dynamics profoundly influencing the modern world [12]. The concept of energy security has evolved over time, identifiable in distinct periods such as the non-politicized, politicized, and securitized stages [10]; significant events like the oil shocks of the 1970s marked the politicization of energy [13]. Initially focused on energy self-sufficiency [14], efficient project management [15], and advanced technologies [16], the definition expanded approaching the new millennium to include international cooperation, equitable energy access, and environmental considerations [17]. Recent events, such as gas price fluctuations in 2021 and the Russian invasion of Ukraine in 2022, have dramatically threatened Europe’s energy security, leading to a renewed emphasis on energy sovereignty and solidarity [18]. Moreover, climate change poses a serious threat to energy security, affecting the availability and affordability of energy, thereby necessitating investments in clean energy technologies [19,20]. Further detailed information on these aspects can be found in the referenced literature.
1.2. Modern Definitions and Components
There is no single, officially approved, and globally accepted definition of energy security; it is often defined as ensuring sufficient supplies at affordable prices [21]. Klare, for instance, views it as guaranteeing the availability of energy resources to meet a state’s fundamental needs, even amidst crises or international conflicts [22]. Similarly, the Asia Pacific Energy Research Centre (APERC) emphasizes timely and sustainable energy supply at prices that do not hinder economic performance [23]. Modern definitions often encompass four key elements, known as the "4 A’s" approach: Availability (ensuring physical access to energy), Accessibility (overcoming geographical, political, demographic, and technological barriers to obtain energy resources), Affordability (ensuring cost-effective energy sources), and Acceptability (prioritizing environmentally and societally acceptable energy sources) [17]. Of these elements, accessibility and affordability are deemed paramount due to their overarching influence on other facets of energy security [24].
1.3. Threats and Challenges
The literature identifies three primary threats to energy security—technical challenges such as infrastructure failures, social behaviors including volatile energy demand or politically motivated supply suspensions, and natural threats like the depletion of fossil fuel reserves or climate change [25]. While energy security is often equated with supply security, organizations such as the International Energy Agency (IEA) define it as the “uninterrupted availability of energy sources at an affordable price” [26], and the European Commission emphasizes the importance of diversifying energy sources to mitigate dependency risks [27]. For many global governments, ensuring stable energy supplies is a top-tier priority [28,29]. The multifaceted nature of energy security, coupled with its evolving definitions and numerous threats, underscores its significance in contemporary geopolitics and economics; as the world grapples with the challenges of sustainable energy, understanding and ensuring energy security becomes extremely important.
1.4. Primary Energy Production and Energy Security
Primary energy sources are natural energy resources that have not yet been transformed into other forms of energy, including coal, crude oil, natural gas, nuclear energy, and renewable sources like wind, solar, and geothermal energy [30]. The structure of primary energy production influences energy security through diversification of energy sources—countries producing energy from various primary sources are less susceptible to supply disruptions, encompassing both traditional and renewable sources [31]; energy self-sufficiency—a high level of domestic primary energy production reduces the need for imports, making countries less vulnerable to external disruptions and price fluctuations [32]; import dependency—countries reliant on imports face significant risks such as price fluctuation sensitivity due to geopolitical factors [33], supply disruption risks from political conflicts or trade decisions [34], and geopolitical dependency that can limit political and economic sovereignty [35]; and investments in energy production technologies—the development of modern technologies like small modular nuclear reactors or advanced renewable technologies enhances efficiency, reliability, reduces CO2 emissions, and improves overall energy security. In summary, efficient and diversified primary energy production is crucial for ensuring a country’s energy security, and energy policies should focus on increasing domestic production, diversifying sources, and investing in modern energy technologies.
2. Primary Energy Production in the European Union and Other European Countries
The production of primary energy in European Union countries has changed significantly over the past thirty years. Throughout this period, there has been a downward trend in total production, decreasing by nearly 7.5 EJ between 1990 and 2021 (Figure 1 and Figure 5). In contrast, consumption has exhibited a horizontal trend over the same period (Figure 2). Consequently, the primary energy deficit has deepened, requiring an increasing amount to be imported. There is also a notable difference between the structure of primary energy production and consumption in EU countries, as well as its dynamics over the analyzed period.
In the early 1990s, solid fossil fuels held the largest share in primary energy production in the EU. However, by the late 1990s, they fell to second place, and by the late 2000s, to third place. At that time, nuclear energy was second, even rising to first place from 1998 to 2015 before returning to second. In 1990, natural gas held the third position in the primary energy production structure but dropped to fourth in 2005. On the other hand, renewable energy sources saw a spectacular rise, advancing from fourth place to first over the analyzed 30 years. The production of primary energy from other sources (including crude oil) remained insignificant (Figure 1).
It is important to note that the structure of primary energy consumption in EU countries differs significantly from the structure of their own production, with substantial changes also occurring within it. Throughout the analyzed period, crude oil remained the largest source of consumption, but significant changes occurred in the subsequent positions. In the early 1990s, solid fossil fuels were the second most popular source of primary energy in EU27 countries, but within a few years, they fell to third place, to fourth in 2018, and fifth a year later, returning to fourth place in 2022. Natural gas replaced solid fossil fuels, ranking second in 1998 and maintaining this position until the end of the described period. This is due to the selection of natural gas as a transitional fuel in the energy transformation process and its significant substitution for nuclear energy, particularly in Germany. Nuclear energy held the fourth position for most of the described period, dropping to fifth from 2015 to 2018, initially yielding to renewable energy sources, then to solid fossil fuels, before returning to fourth place in 2019, and then dropping to fifth in 2022. The growth in the importance of renewable energy sources is noteworthy; they occupied the fifth position in 1990 and moved to third by the end of 2022 (Figure 2).
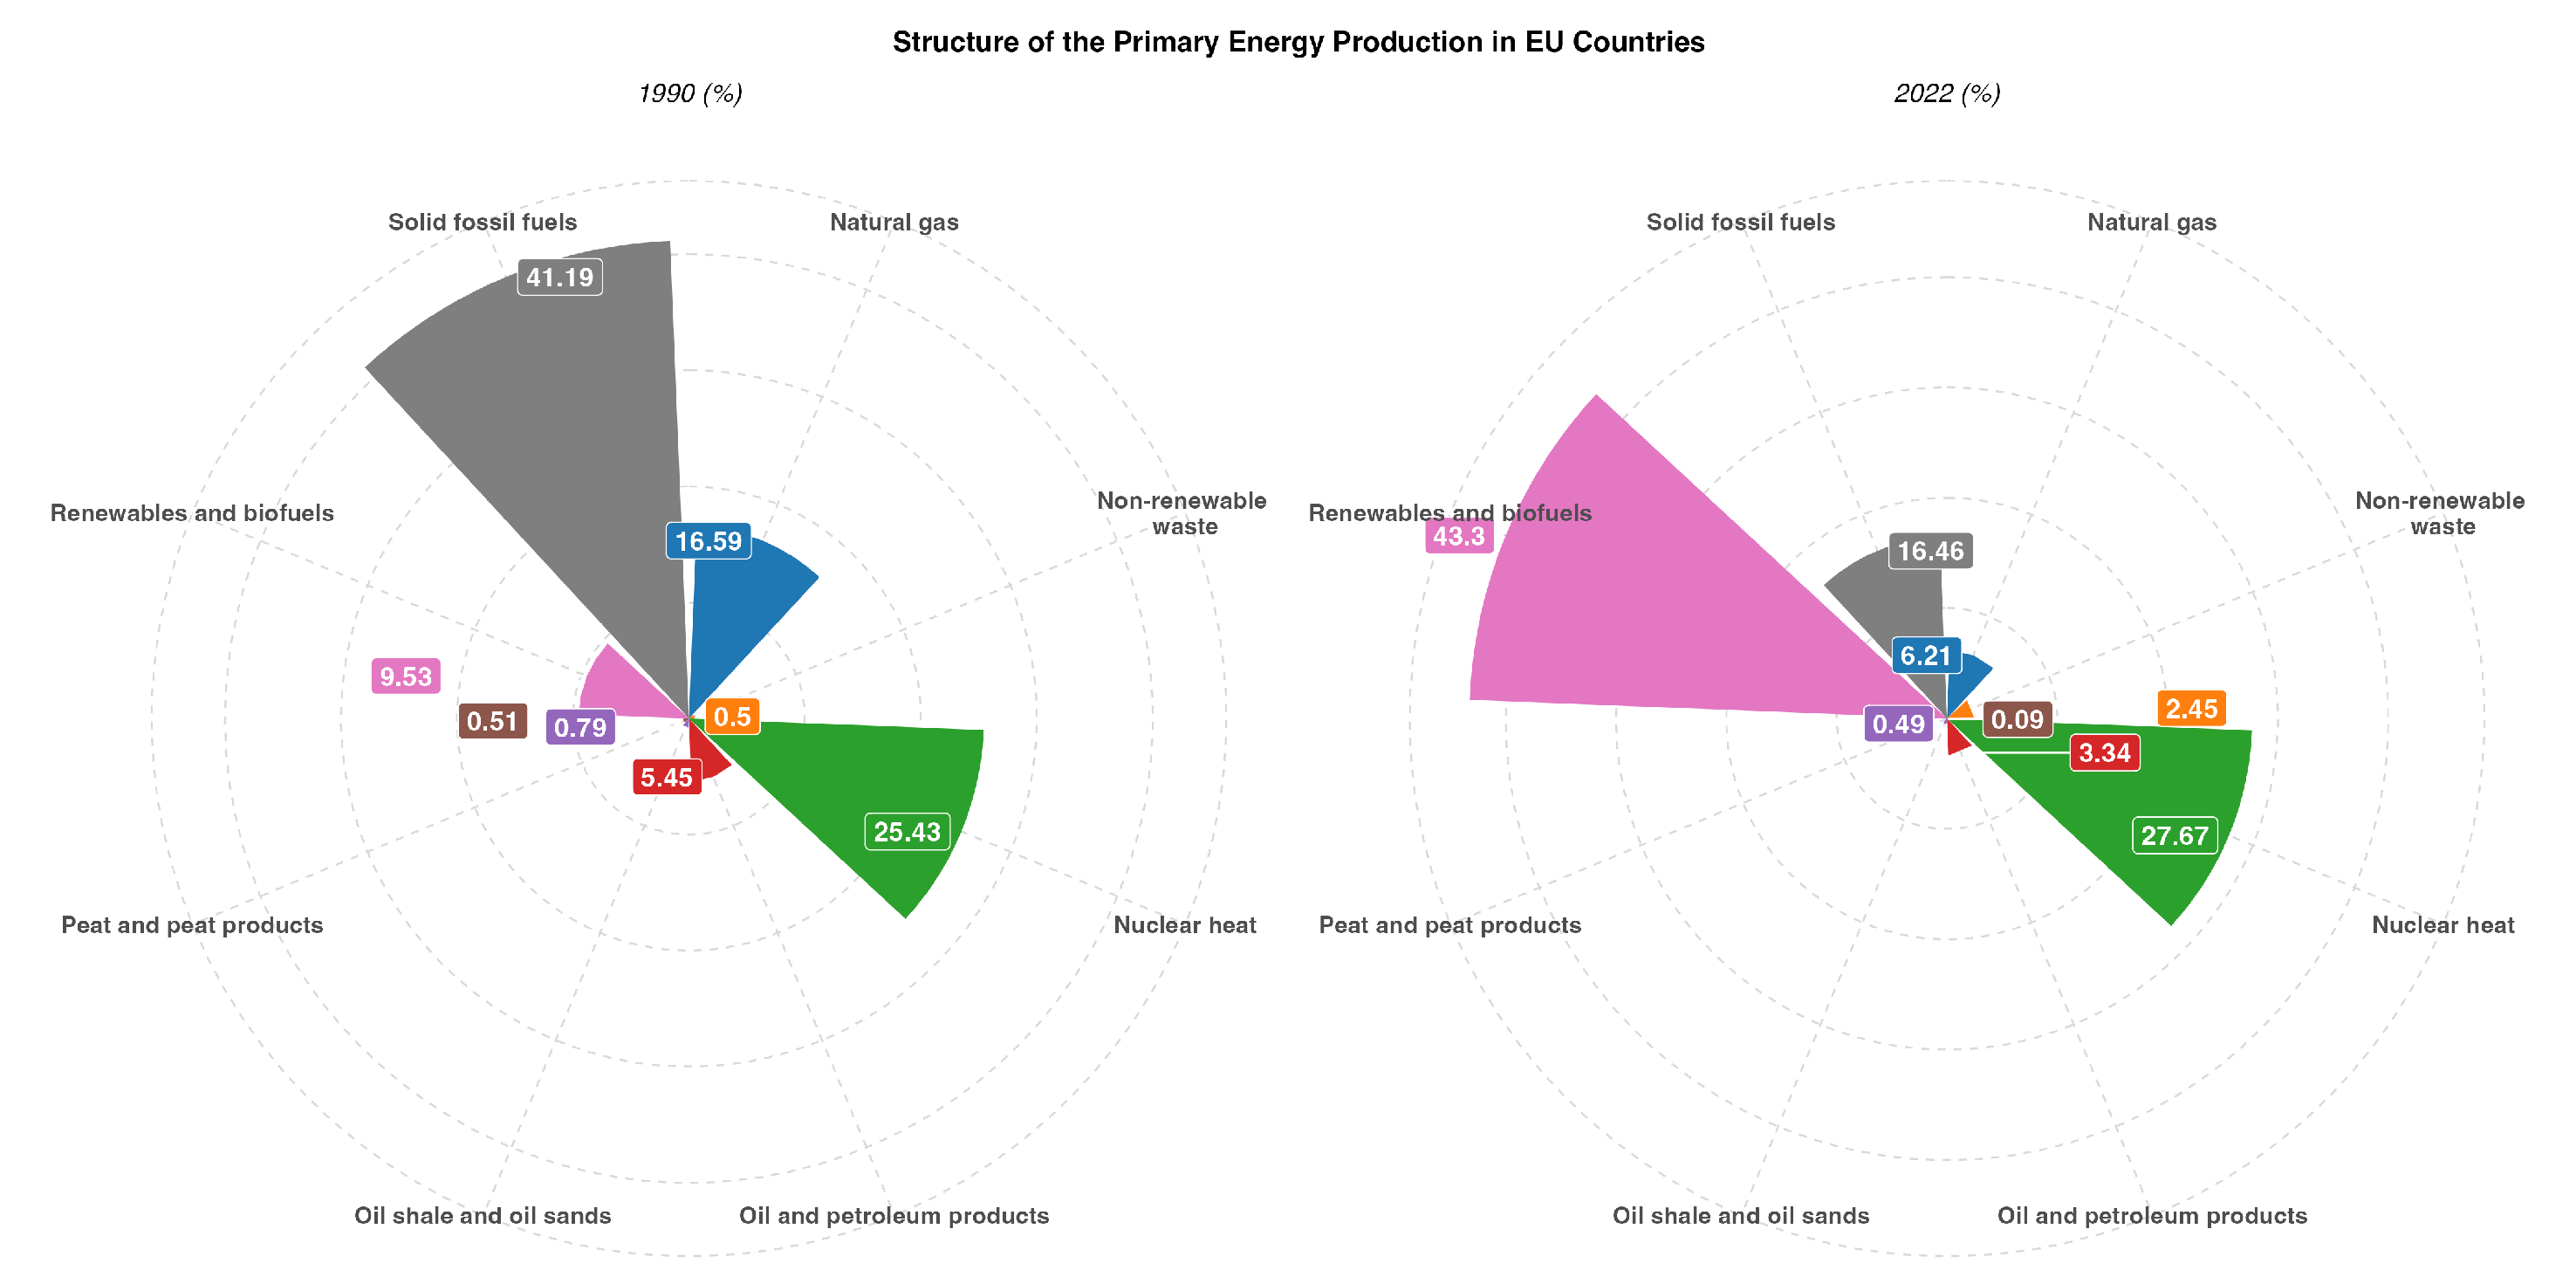
Summarizing the changes in the primary energy production structure in European Union countries, we see that in 1990, the largest source was solid fossil fuels, accounting for 41.2% of total production, followed by nuclear energy (25.4%), natural gas (16.6%), renewable energy sources (9.5%), crude oil (5.5%), and other sources with minor shares. By 2022, the structure of primary energy production had changed dramatically—the largest share was held by renewable energy sources (43.3%), followed by nuclear energy (27.7%), solid fossil fuels (16.5%), natural gas (6.2%), and crude oil (3.3%) (Figure 4).
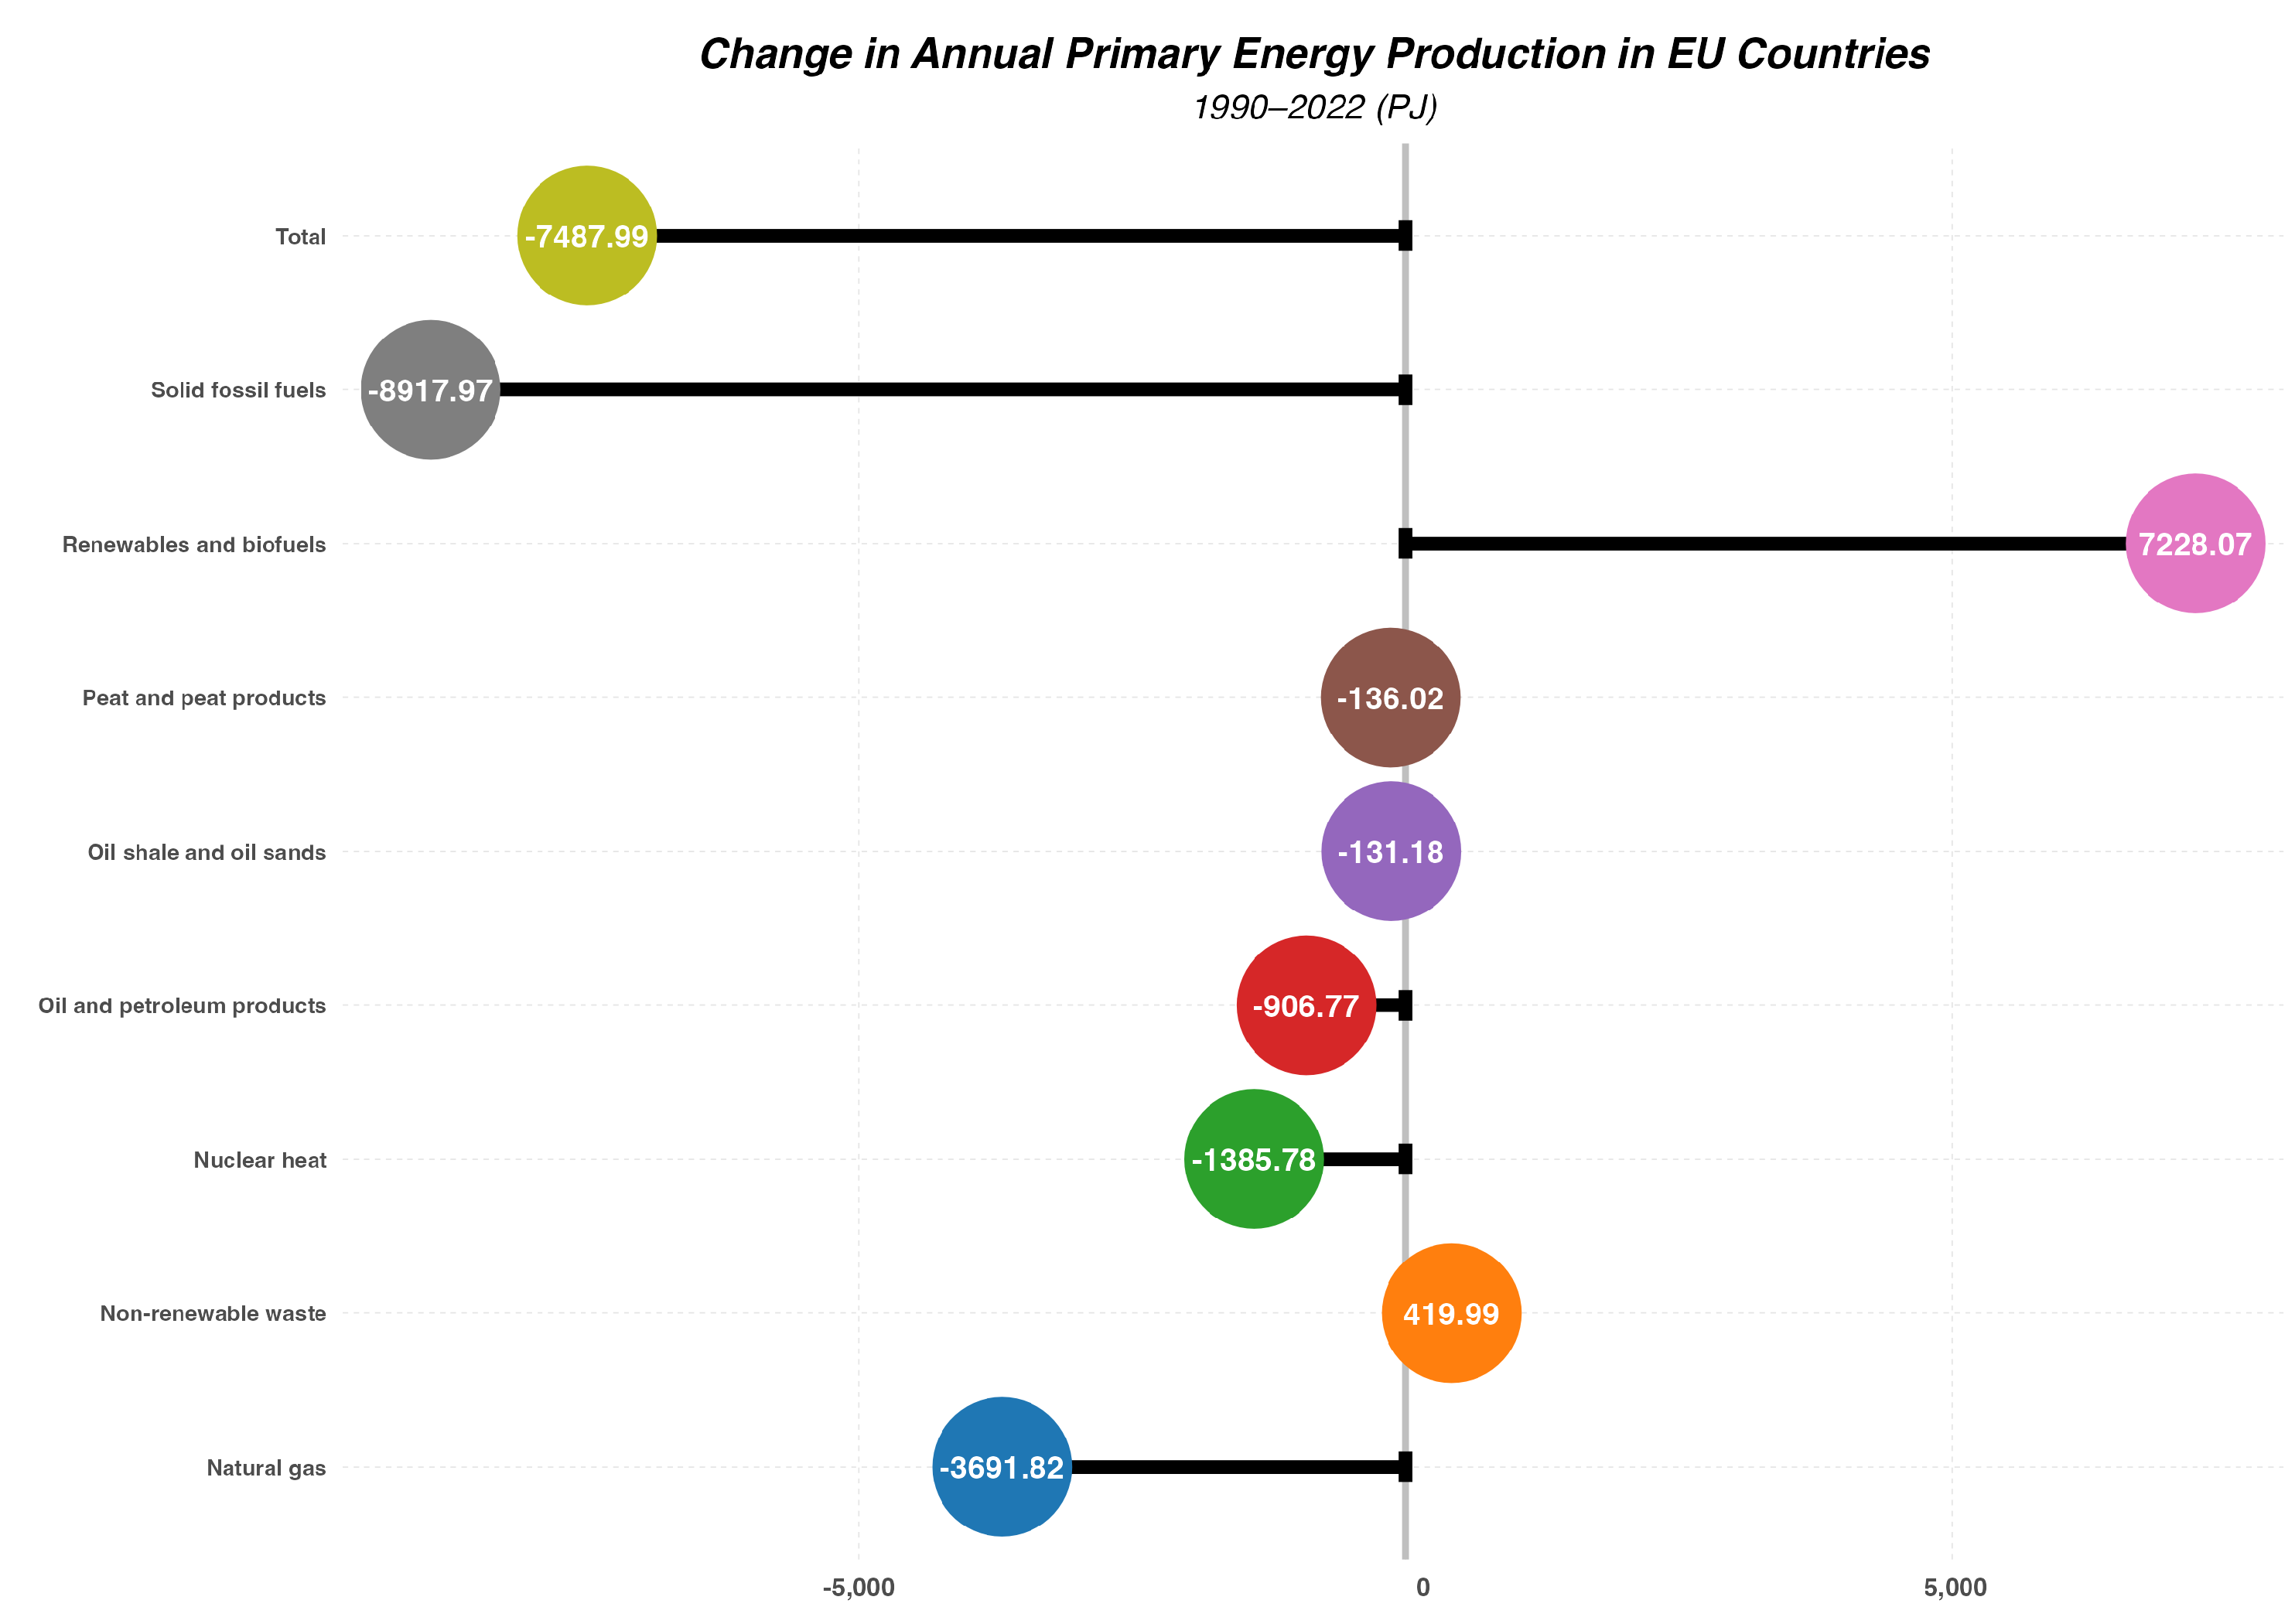
Figure 3 and Figure 5 illustrate changes in the amount of energy obtained from various sources. It is noteworthy that production increased only for renewable energy sources (up by 7.2 EJ) and non-renewable waste (0.4 EJ). Production from other sources decreased. The largest decline was noted for solid fossil fuels (8.9 EJ), natural gas (3.7 EJ), nuclear energy (1.4 EJ), crude oil (0.9 EJ), and the marginal sources of peat (0.1 EJ) and oil shale (0.1 EJ).
Figure 3.
Annual Primary Energy Production in EU Countries by Source (Data Source: Eurostat nrg_bal_s table).
Figure 3.
Annual Primary Energy Production in EU Countries by Source (Data Source: Eurostat nrg_bal_s table).
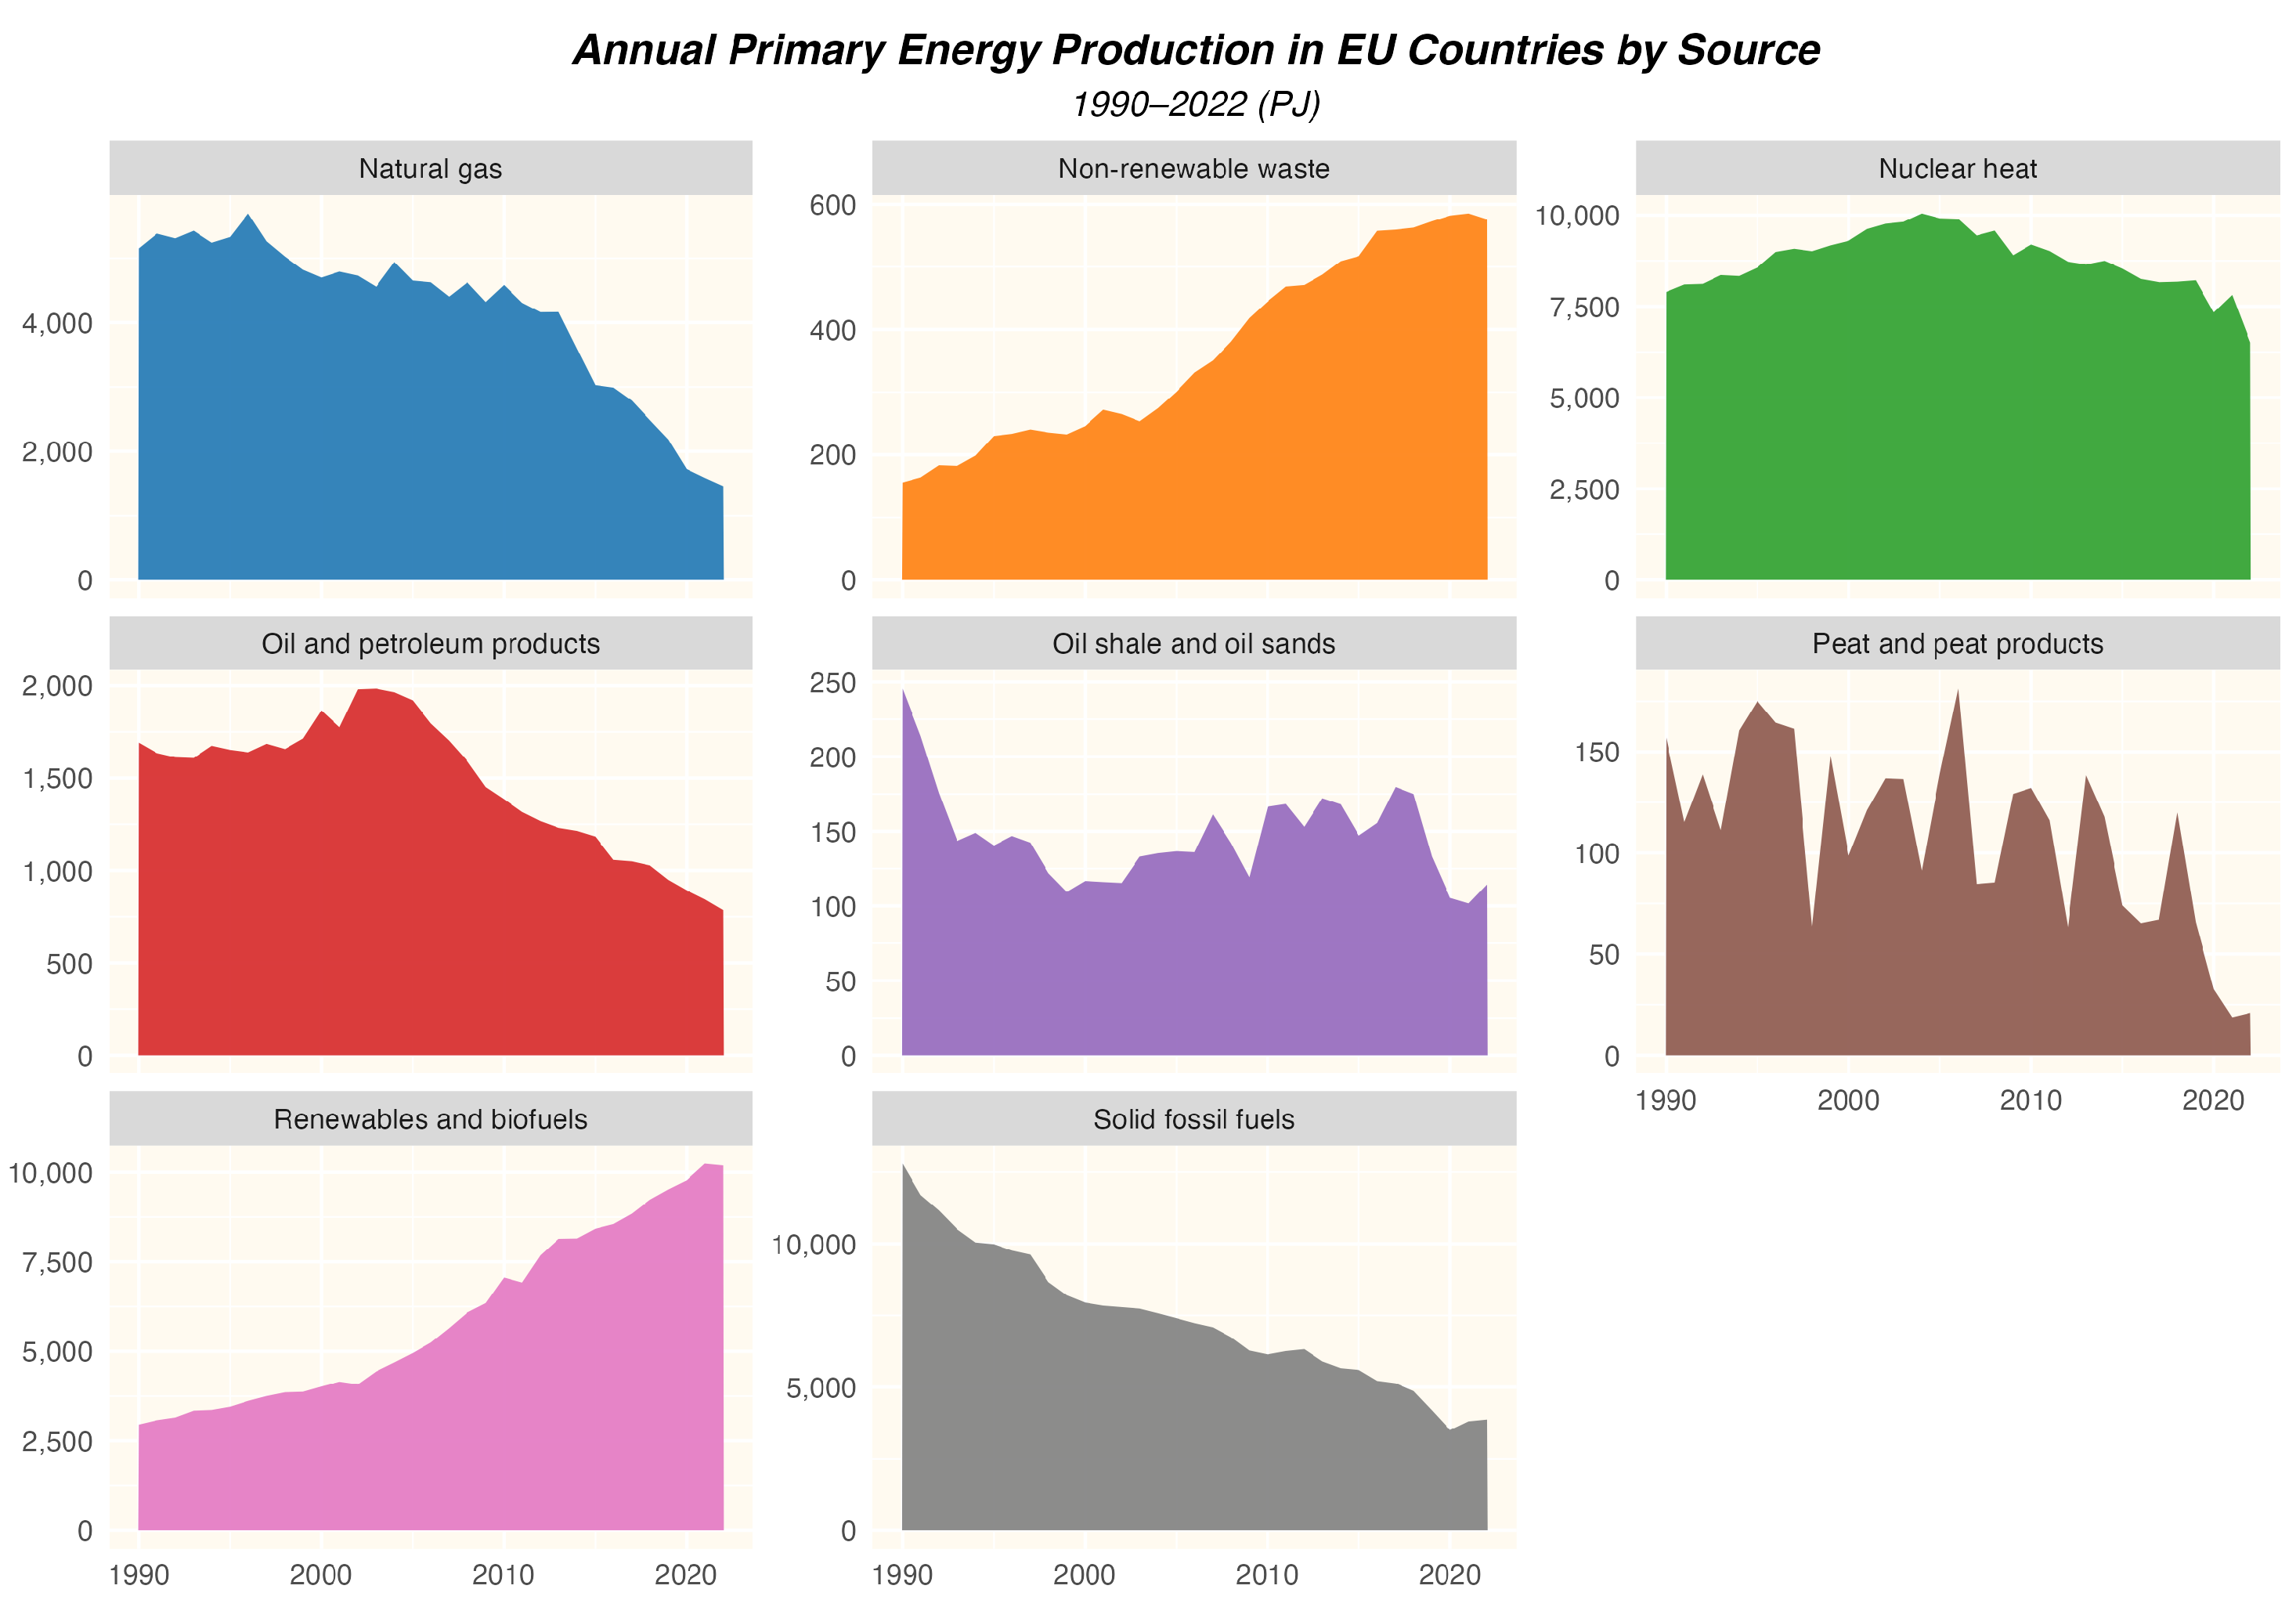
Figure 4.
Structure of Primary Energy Production in EU Countries in 1990 and 2022 (Data Source: Eurostat nrg_bal_s table).
Figure 4.
Structure of Primary Energy Production in EU Countries in 1990 and 2022 (Data Source: Eurostat nrg_bal_s table).
Analyzing changes in primary energy production in individual European countries (Figure 6), it can be observed that it increased in fewer states, typically small producers (except for Norway). The largest increase in primary energy production was noted in small countries such as Malta, Latvia, and Portugal. A significant percentage increase in primary energy production was also observed in Norway, a major global producer of petroleum and natural gas. Most large European economies experienced a decline in primary energy production, including Germany, the Netherlands, and Poland.
Figure 5.
Change in Primary Energy Production in EU Countries (Data Source: Eurostat nrg_bal_s table).
Figure 5.
Change in Primary Energy Production in EU Countries (Data Source: Eurostat nrg_bal_s table).
It is therefore not surprising that the issue of meeting primary energy demand from domestic sources in European Union countries looks very unfavorable. Excluding nuclear energy and renewable energy sources, which are typically consumed in the same country where they are produced, the percentage rates of meeting demand with domestic production are low and continue to decrease (Figure 7). The percentage of total primary energy demand met by domestic sources fell from 51% in 1990 to 42% in 2022. For solid fossil fuels, this value fell from 80% to 57%. In the case of natural gas, demand was met by 49% from domestic sources in 1990, dropping to 12% in 2022. For crude oil, this indicator remained very low throughout the analyzed period, dropping from 7% to 4%. These values illustrate the extent to which European Union countries are dependent on energy imports and how significant a risk factor this is in terms of energy security. Analyzing the average share of various primary energy sources in the production structure of all surveyed countries (Figure 8) listed in the Eurostat database (not limited to European Union members), it is evident that renewable energy sources currently hold the largest average share in the primary energy production structure (rising from 25.1% to 52%). Solid fossil fuels are in second place (declining from 26.1% to 18.3%). Nuclear energy holds the third position (declining from 18% to 13.3%). Natural gas ranks fourth, reducing its share from 13.1% to 6.8%. Crude oil is in fifth place, with its share dropping from 11.6% to 5.7%.
Figure 9 illustrates the proportion of primary energy production in relation to consumption in European countries in 2022, excluding Norway, whose unique characteristics would skew the interpretation of this chart. The highest potential for meeting energy demand through domestic production is observed in Estonia and Sweden. Conversely, countries such as Luxembourg, Malta, and Cyprus exhibit a very low proportion of primary energy production relative to their consumption. It is important to highlight that these are small countries, and two of them are islands, which explains their reliance on importing the majority of the energy they consume.
Notably, large European economies such as Germany, France, Spain, Italy, and Poland have a relatively low proportion of primary energy production in relation to consumption, which corroborates the dependency on energy imports mentioned earlier in the article. For instance, Germany, the largest economy in the EU, meets just over 30% of its primary energy demand from domestic sources.
Summarizing the analysis of primary energy production in European countries over the past 30 years, we can observe that:
- The production of primary energy in the EU has significantly decreased over the last thirty years, with nearly unchanged consumption.
- There are significant differences between the structure of primary energy production and consumption in the EU. For some sources (such as crude oil), almost the entire consumption is met through imports.
- Renewable energy sources have become the dominant source of primary energy production in EU countries, which is a positive trend in terms of sustainable development but increases risks related to the stability of energy supplies and other aspects of broadly defined energy security.
- EU countries, especially large economies, are heavily dependent on energy imports, which poses a challenge to energy security.
- To reduce dependency on imports, further investments in renewable energy sources, energy transmission and storage systems, and improvements in energy efficiency are necessary.
- High dependence on primary energy imports constitutes a significant risk to the energy security of EU countries. Geopolitical changes, supply disruptions, and rising prices of imported energy can negatively impact the region’s energy stability. Therefore, to ensure energy security, it is essential to pursue an appropriate energy policy that combines the continued development of renewable energy sources with the assurance of stable supplies of those primary energy sources that cannot be easily and quickly replaced by renewable energy.
3. Cluster Analysis
3.1. Theoretical Introduction
Cluster analysis is a highly popular and powerful statistical technique classified under unsupervised machine learning methods; it groups objects such that those in the same cluster are more similar to each other than to those in other clusters, without requiring prior knowledge of class labels and is used when the data structure is unknown. Its advantages include identifying natural groups in data, discovering hidden structures and patterns, and enabling dimensionality reduction by simplifying large datasets into smaller, interpretable groups. Cluster analysis methods are widely used across various fields, with extensive literature on different clustering algorithms, their applications, strengths, and weaknesses. MacQueen introduced the k-means algorithm, which remains highly popular and is used in this article [36]. Comprehensive discussions on clustering algorithms and their applications can be found in works by Jain and Dubes [37], Kaufman and Rousseeuw [38], Xu and Wunsch [39], Mirkin [40], Everitt et al. [41], and Hennig [42], who proposed a new criterion for evaluating clustering quality based on the concept of true clusters.
3.1.1. K-Means Algorithm
In this study, the k-means clustering algorithm was utilized. It is a prominent unsupervised machine learning method for dividing data points into distinct clusters by iteratively minimizing within-cluster variance through optimal centroid placement [43,44,45]. The main steps of the k-means algorithm are:
- Initialization: Choose the number of clusters k and randomly initialize k centroids.
- Assignment: Assign each data point to the nearest centroid using a distance metric, typically Euclidean distance, forming k clusters.
- Update: Recompute the centroids by calculating the mean of all data points in each cluster.
- Iteration: Repeat the assignment and update steps until convergence is achieved—when centroids stabilize or a maximum number of iterations is reached.
- Result: Finalize the clustering with each data point assigned to its nearest centroid, partitioning the dataset into k clusters.
Advantages:
- Simplicity: Easy to understand and implement due to its straightforward approach.
- Scalability: Efficiently handles large datasets with linear time complexity, suitable for big data applications.
- Speed: Generally converges quickly because of its simple iterative process.
- Interpretability: Clusters are often interpretable, especially in datasets with low dimensions.
- Versatility: Applicable to various data types, including numerical, categorical, and binary data.
Limitations:
- Sensitivity to Initial Centroids: Different initial centroid placements can lead to varying results.
- Outlier Influence: Susceptible to outliers, which can distort cluster centroids and sizes.
- Assumption of Cluster Shape: Assumes clusters are convex and similar in size, which may not be true for all datasets.
- Determining Optimal k: Selecting the appropriate number of clusters k is subjective and affects clustering quality.
- Feature Scaling Impact: Features with larger scales can dominate distance calculations, potentially biasing the algorithm.
3.1.2. Optimal Number of Clusters
Determining the optimal number of clusters in the k-means algorithm is a significant challenge. Two prevalent methods to address this are the total within-cluster sum of squares (WSS) minimization and the silhouette method. The WSS minimization, commonly known as the elbow method, is a technique for estimating the ideal number of clusters [46]. This approach involves plotting the WSS against different values of k and identifying the point where the rate of decrease sharply changes—the "elbow" point. This point suggests that adding more clusters does not substantially reduce the WSS, indicating an optimal balance between cluster count and variance reduction. To apply the elbow method:
- Run the clustering algorithm (e.g., k-means) for a range of k values.
- For each k, calculate the WSS, which is the sum of squared distances between data points and their cluster centroids.
- Plot k on the x-axis and the corresponding WSS on the y-axis.
- Identify the elbow point where the decrease in WSS becomes less pronounced.
- Choose the k at this elbow point as the optimal number of clusters.
It is important to recognize that the elbow method is heuristic and the elbow point may not always be distinct, especially in complex datasets. Therefore, it should be supplemented with other methods and domain knowledge [45,47].
The silhouette method offers another way to determine the optimal number of clusters by measuring how well each data point fits within its assigned cluster compared to other clusters [38,48]. The silhouette coefficient for a data point i is defined as:
where:
- is the average distance between i and all other points in the same cluster.
- is the minimum average distance from i to all points in any other cluster (the nearest cluster).
The silhouette coefficient ranges from to 1, with higher values indicating better clustering. A coefficient close to 1 means the data point is well matched to its own cluster and poorly matched to neighboring clusters. To use the silhouette method:
- Perform clustering for various values of k.
- For each k, compute the average silhouette coefficient for all data points.
- Select the k that maximizes the average silhouette coefficient as the optimal number of clusters.
This method helps in selecting the number of clusters that provide the best balance between intra-cluster cohesion and inter-cluster separation. It is versatile and can be applied to clustering algorithms beyond k-means.
3.2. Results
The cluster analysis was conducted using the Eurostat database and includes all European countries listed therein. The aim of this analysis was to group these countries based on similarities in their primary energy production structure. The analysis was carried out for two years—1990, marking the beginning of the analyzed period, and 2022, which is the most recent year for which data is available in the database. The Silhouette method was used to assist in selecting the optimal number of clusters, though its indications were treated as a suggestion rather than a definitive number of clusters.
3.2.1. Cluster Analysis for the Year 1990
Figure 10 presents the results of the analysis on the impact of the number of clusters on the Silhouette coefficient. The automatically suggested number of clusters was 4, but 8 clusters were chosen instead, as this allowed for a better description of the groups of countries and more effectively captured the differences between them.
As a result, eight groups of countries with similar primary energy production structures were identified (Table 1). It is important to note that the analysis was conducted based on the current state of countries and their borders, although in 1990, this division may have been different. The data was adjusted to reflect the current division of Europe into countries. The average structure of primary energy production in each group is shown in Figure 11, while the geographical distribution of the clusters is shown in Figure 12.
The identified groups of European countries, derived from the cluster analysis based on the structure of their primary energy production in 1990, can be characterized as follows. Each group has been assigned a name that reflects its specific energy production structure.
Cluster 1: “Coal Countries”
- Characteristics: This cluster is characterized by a very high share of solid fossil fuels (86.49%) with minimal contributions from other energy sources.
- Countries: Czechia, Greece, North Macedonia, Poland, Serbia.
- Interpretation: These countries primarily base their primary energy production on coal and other solid fossil fuels, indicating a strong reliance on traditional, high-emission energy sources.
Cluster 2: “Coal Countries with Nuclear Component”
- Characteristics: A cluster with a diversified production structure, featuring a significant share of nuclear energy (25.77%) and solid fossil fuels (47.97%). Natural gas and renewable energy also play a role.
- Countries: Bulgaria, Germany, Spain, Hungary, Slovenia, Turkey, Ukraine.
- Interpretation: These countries have diverse energy sources, with a notable nuclear component, suggesting a more balanced approach to energy production with less reliance on a single source.
Cluster 3: “Natural Gas Countries”
- Characteristics: Dominant share of natural gas (63.91%) with a contribution from oil (11.05%).
- Countries: Ireland, Italy, Netherlands, Romania.
- Interpretation: These countries primarily base their domestic primary energy production on natural gas, with some reliance on oil.
Cluster 4: “Oil Countries”
- Characteristics: Very high share of oil (54.28%) with a notable addition of natural gas (20.93%).
- Countries: Albania, Denmark, Croatia, Norway, United Kingdom.
- Interpretation: In these countries, most of the primary energy production comes from oil, with natural gas playing a secondary role.
Cluster 5: “Nuclear Countries”
- Characteristics: High share of nuclear energy (78.53%) with minimal contributions from other sources.
- Countries: Belgium, France, Lithuania, Slovakia.
- Interpretation: These countries based their primary energy production largely on nuclear energy in 1990.
Cluster 6: “Nuclear-Renewable Countries”
- Characteristics: High share of nuclear energy (50.41%) and renewable energy sources (41.38%).
- Countries: Finland, Sweden.
- Interpretation: These countries had a balanced and sustainable energy production structure, focusing on both renewable and nuclear energy.
Cluster 7: “Renewable Countries”
- Characteristics: Nearly entirely based on renewable energy sources (85.95%).
- Countries: Austria, Cyprus, Iceland, Luxembourg, Latvia, Portugal.
- Interpretation: These countries show a very high commitment to producing energy from renewable sources, which benefits the environment while reducing reliance on fossil fuels such as hydrocarbons.
Cluster 8: “Oil Shale Country”
- Characteristics: Dominated by production from oil shale (93.73%).
- Countries: Estonia.
- Interpretation: Estonia is a unique case, heavily relying on its significant oil shale resources.
The map of clustered countries in 1990 (Figure 12) illustrates the geographical distribution of eight distinct clusters identified based on primary energy production structures. The clusters reflect the diversity in energy dependency among European nations. For example, Central and Eastern European countries like Poland and the Czech Republic were heavily reliant on solid fossil fuels, forming the “Coal Countries” cluster. In contrast, countries like France and Belgium, with a significant share of nuclear energy, were categorized under the “Nuclear Countries” cluster. This visual representation highlights the concentration of different energy strategies and resource utilizations across Europe, showcasing the regional energy production tendencies prevalent during that period.
3.2.2. Cluster Analysis for the Year 2022
The Silhouette method for 2022 data suggested 10 groups of similar countries, and this number was selected for the analysis (Figure 13). The results of the cluster analysis are presented in Table 2.
The identified groups of European countries, derived from the cluster analysis based on the structure of their primary energy production in 2022, are characterized as follows:
Cluster 1: “Coal Countries”
- Characteristics: High share of solid fossil fuels (69.58%) and renewable energy sources (26.28%).
- Countries: Bosnia and Herzegovina, North Macedonia, Poland, Serbia, Kosovo.
- Interpretation: These countries base their primary energy production mainly on coal, but also have a significant share of renewable energy. It is a combination of traditional and newer energy sources.
Cluster 2: “Renewable-Coal Countries”
- Characteristics: Dominated by renewable energy sources (51.96%) with still a high share of fossil fuels (40.9%).
- Countries: Germany, Greece, Montenegro, Turkey.
- Interpretation: These countries focus their primary energy production on renewable sources and solid fossil fuels.
Cluster 3: “Coal-Nuclear Countries”
- Characteristics: A production structure with a significant share of solid fossil fuels (45.05%) and nuclear energy (31.65%).
- Countries: Bulgaria, Czechia.
- Interpretation: These countries rely on primary energy production from fossil fuels and nuclear energy, with a smaller share of renewable sources.
Cluster 4: “Oil-Gas Countries”
- Characteristics: High share of oil (42.56%) and natural gas (50.46%).
- Countries: Norway.
- Interpretation: Norway bases its primary energy production mainly on natural gas and oil, reflecting its natural resources and role as a major exporter of these commodities.
Cluster 5: “Gas-Renewable Countries”
- Characteristics: Dominated by natural gas (41.52%) and renewable energy sources (38.71%).
- Countries: Ireland, Netherlands, Romania.
- Interpretation: These countries rely primarily on natural gas, but renewable energy sources also play an important role.
Cluster 6: “Renewable-Oil Countries”
- Characteristics: High share of renewable energy sources (54.61%) and a significant share of oil (30.06%).
- Countries: Albania, Denmark, Croatia.
- Interpretation: Energy production in these countries is primarily based on renewable sources, but oil still plays a significant role.
Cluster 7: “Nuclear Countries”
- Characteristics: High share of nuclear energy (56.50%) and renewable energy sources (30.10%).
- Countries: Belgium, France, Hungary, Slovenia, Slovakia.
- Interpretation: These countries rely heavily on nuclear energy, but renewable sources also play a significant role, reflecting their diversified energy strategies.
Cluster 8: “Renewable-Nuclear Countries”
- Characteristics: Dominated by renewable energy sources (61.41%) and a significant share of nuclear energy (36.24%).
- Countries: Spain, Finland, Sweden.
- Interpretation: These countries invest heavily in renewable energy, while also utilizing nuclear energy as an important part of their energy mix.
Cluster 9: “Renewable Countries”
- Characteristics: Nearly entirely renewable energy sources (91.73%) with minimal contributions from other sources.
- Countries: Austria, Cyprus, Georgia, Italy, Lithuania, Luxembourg, Latvia, Moldova, Portugal.
- Interpretation: These countries have a very high share of renewable energy in their primary energy production.
Cluster 10: “Oil Shale Country”
- Characteristics: Dominated by production from oil shale (58.06%) with a significant share of renewable energy sources.
- Countries: Estonia.
- Interpretation: Estonia is a unique case, where the main source of energy production is oil shale, which reflects its natural resources and local energy policy.
The average structure of primary energy production in each group is shown in Figure 14, while the geographical distribution of the clusters is shown in Figure 15, which presents the updated clustering map for the year 2022, illustrating significant shifts in energy production structures among European countries. The clustering analysis in 2022 identifies ten distinct groups, reflecting a substantial increase in the adoption of renewable energy sources. Countries like Germany and Turkey are now part of the “Renewable-Coal Countries” cluster, signifying their dual reliance on both renewables and fossil fuels. In contrast, nations such as Spain, Finland, and Sweden are categorized as “Renewable-Nuclear Countries,” emphasizing their focus on a combination of renewable energy and nuclear power.
3.2.3. Key Changes Between 1990 and 2022
Analyzing the changes between 1990 and 2022, the following key issues can be observed:
Growth of renewable energy sources: One of the most noticeable changes between 1990 and 2022 was the dynamic growth in the importance of renewable energy sources in the primary energy production structure. In 1990, renewable energy sources constituted a relatively small share of primary energy production in most European countries, especially in those relying heavily on fossil fuels, such as Poland, Czechia, and Germany. By 2022, renewable energy sources had gained significant importance in many groups of countries.
Reduction in coal usage: In 1990, many European countries relied on coal for their primary energy production, especially in Central and Eastern Europe. Countries like Poland, Czechia, and Serbia had a very high share of solid fossil fuels. However, over the next three decades, there was a significant decrease in coal’s share in primary energy production.
Increased importance of natural gas: Natural gas, considered a transitional fuel, gained importance in countries that sought to reduce their dependence on coal and oil. The rise in the importance of gas was due to its lower carbon emissions compared to coal, and relatively lower energy production costs, particularly in the context of the European Union’s carbon emission fees.
Stability of nuclear energy: Nuclear energy, which was the foundation of the energy sector in many European countries in 1990, maintained its position in 2022. In many cases, there were no significant changes in its share, although in some countries there was an increased role for renewable energy as a complement. The stability of nuclear energy stemmed from long-term investments in nuclear technologies and the relative resilience of this form of energy to changing economic and political conditions. However, in some countries, such as Germany, decisions were made to phase out nuclear energy as part of a broader strategy to transition away from this energy source.
4. Conclusions
During the period from 1990 to 2022, there were significant changes in the structure of primary energy production in European countries, which affected the differences between energy production and consumption as well as issues related to energy security.
In 1990, renewable energy sources had a marginal share in energy production in most European countries, particularly in those dependent on fossil fuels, such as Poland and Germany. By 2022, renewable energy sources became the dominant energy source in some countries. This growth results from investments in green technologies, technological advancements, and EU regulations supporting the energy transition. In the 1990s, many European countries, especially in Central and Eastern Europe, relied on coal for energy production. Over the next three decades, the importance of coal decreased, reflecting changes in energy strategies and growing pressure to reduce emissions. Although countries such as Poland and the Czech Republic still rely on coal, its share has been systematically reduced. Natural gas has become a key transitional fuel in the energy transition of many countries. Nuclear energy has maintained its significance, but some countries, like Germany, have decided to phase out nuclear energy, in most countries that traditionally relied on this form of energy, it remains a critical element of the energy mix.
The analysis shows significant transformations that have direct implications for energy security across the continent. Understanding these dynamics is essential to addressing current and future challenges related to reliable and stable energy supplies.
Key aspects of energy security
- Dependence on imported energy sources: One of the most pressing issues for many European countries is their heavy reliance on imported fossil fuels, such as natural gas and oil, from non-European countries. This dependency increases their vulnerability to geopolitical tensions and supply disruptions. Events like the Russian invasion of Ukraine in 2022 and the resulting gas supply restrictions illustrate the risks of over-reliance on single suppliers. The need for diversified energy sources has become more urgent to avoid being subject to external political pressures and market volatility.
- Renewable energy and its limitations: While renewable energy sources such as wind, solar, and hydropower have seen substantial growth, they also introduce new challenges to energy security. The variability and intermittency of renewables mean that energy production can be unpredictable, especially in regions where the sun and wind resources are not consistent. Without significant advances in energy storage technologies and grid infrastructure, the over-reliance on renewables could lead to instability in energy supply during peak demand or unfavorable weather conditions.
- Role of natural gas as a transitional fuel: Natural gas has been positioned as a transitional fuel to bridge the gap between high-emission fossil fuels and low-emission renewable sources. Its lower carbon footprint compared to coal makes it a preferred option for many European countries aiming to reduce emissions while ensuring energy security. However, the geopolitical implications of natural gas imports, especially from Russia and other non-EU countries, remain a significant risk factor. Efforts to increase LNG (liquefied natural gas) imports from diverse global suppliers are steps toward mitigating this risk, but infrastructural and logistical challenges persist.
- Nuclear energy’s stability and controversy: Nuclear energy continues to play a pivotal role in ensuring energy security for many European nations due to its ability to provide a stable and continuous energy supply. Countries like France have leveraged their nuclear infrastructure to reduce reliance on fossil fuel imports significantly. However, nuclear energy remains controversial due to concerns about nuclear waste, safety risks, and the high costs associated with plant construction and decommissioning. The decision by some countries, such as Germany, to phase out nuclear energy poses additional challenges in balancing their energy needs with sustainable practices.
- Impact of geopolitical events on energy security: The geopolitical landscape greatly influences Europe’s energy security. Conflicts, such as the situation in Ukraine, have highlighted the vulnerabilities of relying on imported energy resources from politically unstable regions. In response, the European Union has been actively seeking ways to reduce its dependence on external suppliers by promoting energy sovereignty and solidarity among member states. This involves enhancing intra-EU energy cooperation, investing in cross-border energy infrastructure, and developing a unified energy policy that can withstand external shocks.
Strategies to enhance energy security
To address these challenges and enhance energy security, several strategic initiatives are critical:
- Diversification of energy sources: European countries need to further diversify their energy supply sources, both in terms of energy types (e.g., expanding renewables) and supply origins (e.g., reducing dependency on specific countries). This includes increasing investments in alternative technologies such as hydrogen, biomass, and small modular reactors (SMRs), which can provide stable and scalable energy solutions.
- Investment in energy storage and smart grids: The advancement of energy storage technologies is crucial to counteract the intermittency of renewable energy sources. Developing large-scale battery systems, hydrogen storage, and other innovative solutions can significantly enhance grid stability. Moreover, smart grid technologies can help manage energy distribution more effectively, balancing supply and demand in real time.
- Strengthening regional energy infrastructure: Enhancing the interconnectedness of Europe’s energy grid is vital for energy security. Building robust cross-border energy infrastructure, such as gas interconnectors, electric grids, and LNG terminals, will enable more efficient energy sharing among EU countries. This infrastructure will help mitigate the impact of local disruptions by distributing resources across the region more flexibly.
- Enhancing energy efficiency: Improving energy efficiency across industries and households is a key strategy to reduce overall energy demand. Lower consumption not only lessens the pressure on energy imports but also contributes to achieving decarbonization goals. Energy efficiency measures, including modernizing industrial processes, building renovations, and promoting energy-saving technologies, are fundamental to sustainable development.
- Policy and regulatory measures: Strong and coordinated policy frameworks are essential to drive the energy transition and ensure long-term energy security. The European Union’s Green Deal and Fit for 55 initiatives are examples of policy efforts aimed at reducing greenhouse gas emissions while boosting renewable energy adoption. Regulatory measures should also focus on encouraging private investment in clean energy technologies and setting clear targets for reducing dependency on imported fossil fuels.
- Geopolitical alliances and partnerships: Forming strategic alliances with energy-exporting nations that are politically stable and environmentally conscious is crucial for enhancing Europe’s energy security. Diversifying natural gas imports through LNG partnerships with countries like the United States, Qatar, and Australia, alongside fostering stronger ties with renewable energy leaders, will reduce Europe’s exposure to geopolitical risks.
The transformation of primary energy production in Europe from 1990 to 2022 marks a significant shift towards sustainability and cleaner energy sources. However, this transition also underscores the complexities of ensuring energy security in a changing geopolitical and technological reality. The need for a balanced approach that incorporates renewable energy while addressing its limitations, along with investments in diversified and resilient energy infrastructure, is more critical than ever. Europe’s ability to navigate these challenges will determine its success in achieving a secure, sustainable, and sovereign energy future.
Funding
This research received no external funding.
Data Availability Statement
Only publicly available data were used in this article.
Conflicts of Interest
The authors declare no conflict of interest.
Abbreviations
The following abbreviations are used in this manuscript:
| SIEC | Standard International Energy Product Classification |
| IDE | Integrated Developmnet Environment |
| APERC | Asia Pacific Energy Research Centre |
| IEA | International Energy Agency |
| EU | European Union |
| EJ | Exajoule |
| TJ | Terajoule |
| PJ | Petajoule |
| WSS | Within-cluster Sum of Squares |
| LNG | Liquefied Natural Gas |
| SMR | Small Modular Reactor |
References
- Kosowski, P.; Kosowska, K.; Janiga, D. Primary Energy Consumption Patterns in Selected European Countries from 1990 to 2021: A Cluster Analysis Approach. Energies 2023, 16, 6941. [Google Scholar] [CrossRef]
- Energy Balances - Table nrg_bal_s, 2024.
- R Foundation for Statistical Computing, Vienna, Austria. R: A Language and Environment for Statistical Computing, 2024.
- RStudio, PBC, Boston, MA. RStudio: Integrated Development Environment for R, 2024.
- Wickham, H.; Averick, M.; Bryan, J.; Chang, W.; McGowan, L.D.; François, R.; Grolemund, G.; Hayes, A.; Henry, L.; Hester, J.; Kuhn, M.; Pedersen, T.L.; Miller, E.; Bache, S.M.; Müller, K.; Ooms, J.; Robinson, D.; Seidel, D.P.; Spinu, V.; Takahashi, K.; Vaughan, D.; Wilke, C.; Woo, K.; Yutani, H. Welcome to the tidyverse. Journal of Open Source Software 2019, 4, 1686. [Google Scholar] [CrossRef]
- Pang, L.; Liu, L.; Zhou, X.; Hafeez, M.; Ullah, S.; Sohail, M.T. How does natural resource depletion affect energy security risk? New insights from major energy-consuming countries. Energy Strategy Reviews 2024, 54, 101460. [Google Scholar] [CrossRef]
- Palonkorpi, M., The security complex theory and the energy security. In Pieces from peripheries and centres; University of Lapland Reoprts in Education, University of Lapland, 2006; pp. 302–313.
- Stern, D. Energy and Economic Growth: The Stylized Facts; Australian National University, 2011.
- Mazur, A.; Rosa, E. Energy and Life-Style. Science 1974, 186, 607–610. [Google Scholar] [CrossRef] [PubMed]
- Özcan, S. Securitization of Energy Through the Lenses of Copenhagen School. In The 2013 WEI International Academic Conference Proceedings; The West East Institute, 2013; p. 10.
- Flaherty, C.; Filho, W.L. Energy Security as a Subset of National Security. In Global Energy Policy and Security; Springer London, 2013; pp. 11–25.
- Roberts, P. The End of Oil. On the Edge of Perilous New World; Houghton Mifflin Harcourt, 2004.
- Kemp, G. Scarcity and Strategy. Foreign Affairs 1978, 56, 396. [Google Scholar] [CrossRef]
- Bahgat, G. Oil Security at the Turn of the Century: Economic and Strategic Implications. International Relations 1999, 14, 41–52. [Google Scholar] [CrossRef]
- Cocklin, C. Anatomy of a future energy crisis Restructuring and the energy sector in New Zealand. Energy Policy 1993, 21, 881–892. [Google Scholar] [CrossRef]
- Coates, J.F. Technological change and future growth: Issues and opportunities. Technological Forecasting and Social Change 1977, 11, 49–74. [Google Scholar] [CrossRef]
- Cherp, A.; Jewell, J. The three perspectives on energy security: intellectual history, disciplinary roots and the potential for integration. Current Opinion in Environmental Sustainability 2011, 3, 202–212. [Google Scholar] [CrossRef]
- LaBelle, M.C. Breaking the era of energy interdependence in Europe: A multidimensional reframing of energy security, sovereignty, and solidarity. Energy Strategy Reviews 2024, 52, 101314. [Google Scholar] [CrossRef]
- Iyke, B.N. Climate change, energy security risk, and clean energy investment. Energy Economics 2024, 129, 107225. [Google Scholar] [CrossRef]
- Khan, K.; Khurshid, A.; Cifuentes-Faura, J.; Xianjun, D. Does renewable energy development enhance energy security? Utilities Policy 2024, 87, 101725. [Google Scholar] [CrossRef]
- Yergin, D. Ensuring Energy Security. Foreign Affairs 2006, 85, 69. [Google Scholar] [CrossRef]
- Williams P.D., M.M., Ed. Energy Security; Routledge, 2018; pp. 483–496.
- A Quest for Energy Security in the 21st Century Resources and Constraints. APERC, 2007.
- Ren, J.; Sovacool, B.K. Quantifying, measuring, and strategizing energy security: Determining the most meaningful dimensions and metrics. Energy 2014, 76, 838–849. [Google Scholar] [CrossRef]
- Winzer, C. Conceptualizing energy security. Energy Policy 2012, 46, 36–48. [Google Scholar] [CrossRef]
- Energy Security: Reliable, affordable access to all fuels and energy sources, 2020.
- Study on Energy Supply Security and Geopolitics, 2004.
- Hedenus, F.; Azar, C.; Johansson, D.J. Energy security policies in EU-25—The expected cost of oil supply disruptions. Energy Policy 2010, 38, 1241–1250. [Google Scholar] [CrossRef]
- Kazantsev, A. Policy networks in European–Russian gas relations: Function and dysfunction from a perspective of EU energy security. Communist and Post-Communist Studies 2012, 45, 305–313. [Google Scholar] [CrossRef]
- Directive 2008/92/EC of the European Parliament and of the Council of 22 October 2008 concerning a Community procedure to improve the transparency of gas and electricity prices charged to industrial end-users (Recast) (Text with EEA relevance), 2008.
- Šipkovs, P.; Pelīte, U.; Kashkarova, G.; Lebedeva, K.; Migla, L.; Shipkovs, J. Policy and Strategy Aspects for Renewable Energy Sources Use in Latvia. ECP 2011. [Google Scholar]
- Erkök, B.; Kütük, Y. Dependency on Imported Energy in Turkey: Input-Output Analysis. Marmara Üniversitesi İktisadi ve İdari Bilimler Dergisi 2023, 45, 47–70. [Google Scholar] [CrossRef]
- Gutmann, J.; Pitlik, H.; Fronaschütz, A. Has the Russian invasion of Ukraine reinforced anti-globalization sentiment in Austria? Empirica 2023, 50, 289–299. [Google Scholar] [CrossRef]
- Adamczyk, P. Does the Volatility of Oil Price Affect the Structure of Employment? The Role of Exchange Rate Regime and Energy Import Dependency. Energies 2022, 15, 6895. [Google Scholar] [CrossRef]
- Streimikiene, D.; Siksnelyte-Butkiene, I.; Lekavicius, V. Energy Diversification and Security in the EU: Comparative Assessment in Different EU Regions. Economies 2023, 11, 83. [Google Scholar] [CrossRef]
- MacQueen, J.B. Some Methods for Classification and Analysis of MultiVariate Observations. Proc. of the fifth Berkeley Symposium on Mathematical Statistics and Probability; Cam, L.M.L.; Neyman, J., Eds. University of California Press, 1967, Vol. 1, pp. 281–297.
- Jain, A.K.; Dubes, R.C. Algorithms for clustering data; Prentice-Hall, Inc.: Upper Saddle River, NJ, USA, 1988. [Google Scholar]
- Kaufman, L.; Rousseeuw, P.J., Eds. Finding Groups in Data; John Wiley & Sons, Inc., 1990.
- Xu, R.; Wunsch, D. Survey of Clustering Algorithms. IEEE Transactions on Neural Networks 2005, 16, 645–678. [Google Scholar] [CrossRef] [PubMed]
- Mirkin, B. Clustering for Data Mining; Chapman and Hall/CRC, 2005.
- Everitt, B.; Landau, S.; Leese, M. Cluster Analysis, 4th ed.; Arnold, 2001.
- Hennig, C. What are the true clusters? Pattern Recognition Letters 2015, 64, 53–62. [Google Scholar] [CrossRef]
- Jain, A.K. Data clustering: 50 years beyond K-means. Pattern Recognition Letters 2010, 31, 651–666. [Google Scholar] [CrossRef]
- Arthur, D.; Vassilvitskii, S. K-Means++: The Advantages of Careful Seeding. Proceedings of the Eighteenth Annual ACM-SIAM Symposium on Discrete Algorithms; Society for Industrial and Applied Mathematics: USA, 2007. [Google Scholar]
- Tan, P.N.; Steinbach, M.; Kumar, V. Introduction to Data Mining; Addison-Wesley Longman Publishing Co., Inc.: USA, 2005. [Google Scholar]
- Milligan, G.W.; Cooper, M.C. An examination of procedures for determining the number of clusters in a data set. Psychometrika 1985, 50, 159–179. [Google Scholar] [CrossRef]
- Hastie, T.; Tibshirani, R.; Friedman, J. The Elements of Statistical Learning; Springer New York, 2009.
- Rousseeuw, P.J. Silhouettes: A graphical aid to the interpretation and validation of cluster analysis. Journal of Computational and Applied Mathematics 1987, 20, 53–65. [Google Scholar] [CrossRef]
Figure 1.
Annual Primary Energy Production in EU Countries (Data Source: Eurostat - nrg_bal_s table).
Figure 1.
Annual Primary Energy Production in EU Countries (Data Source: Eurostat - nrg_bal_s table).
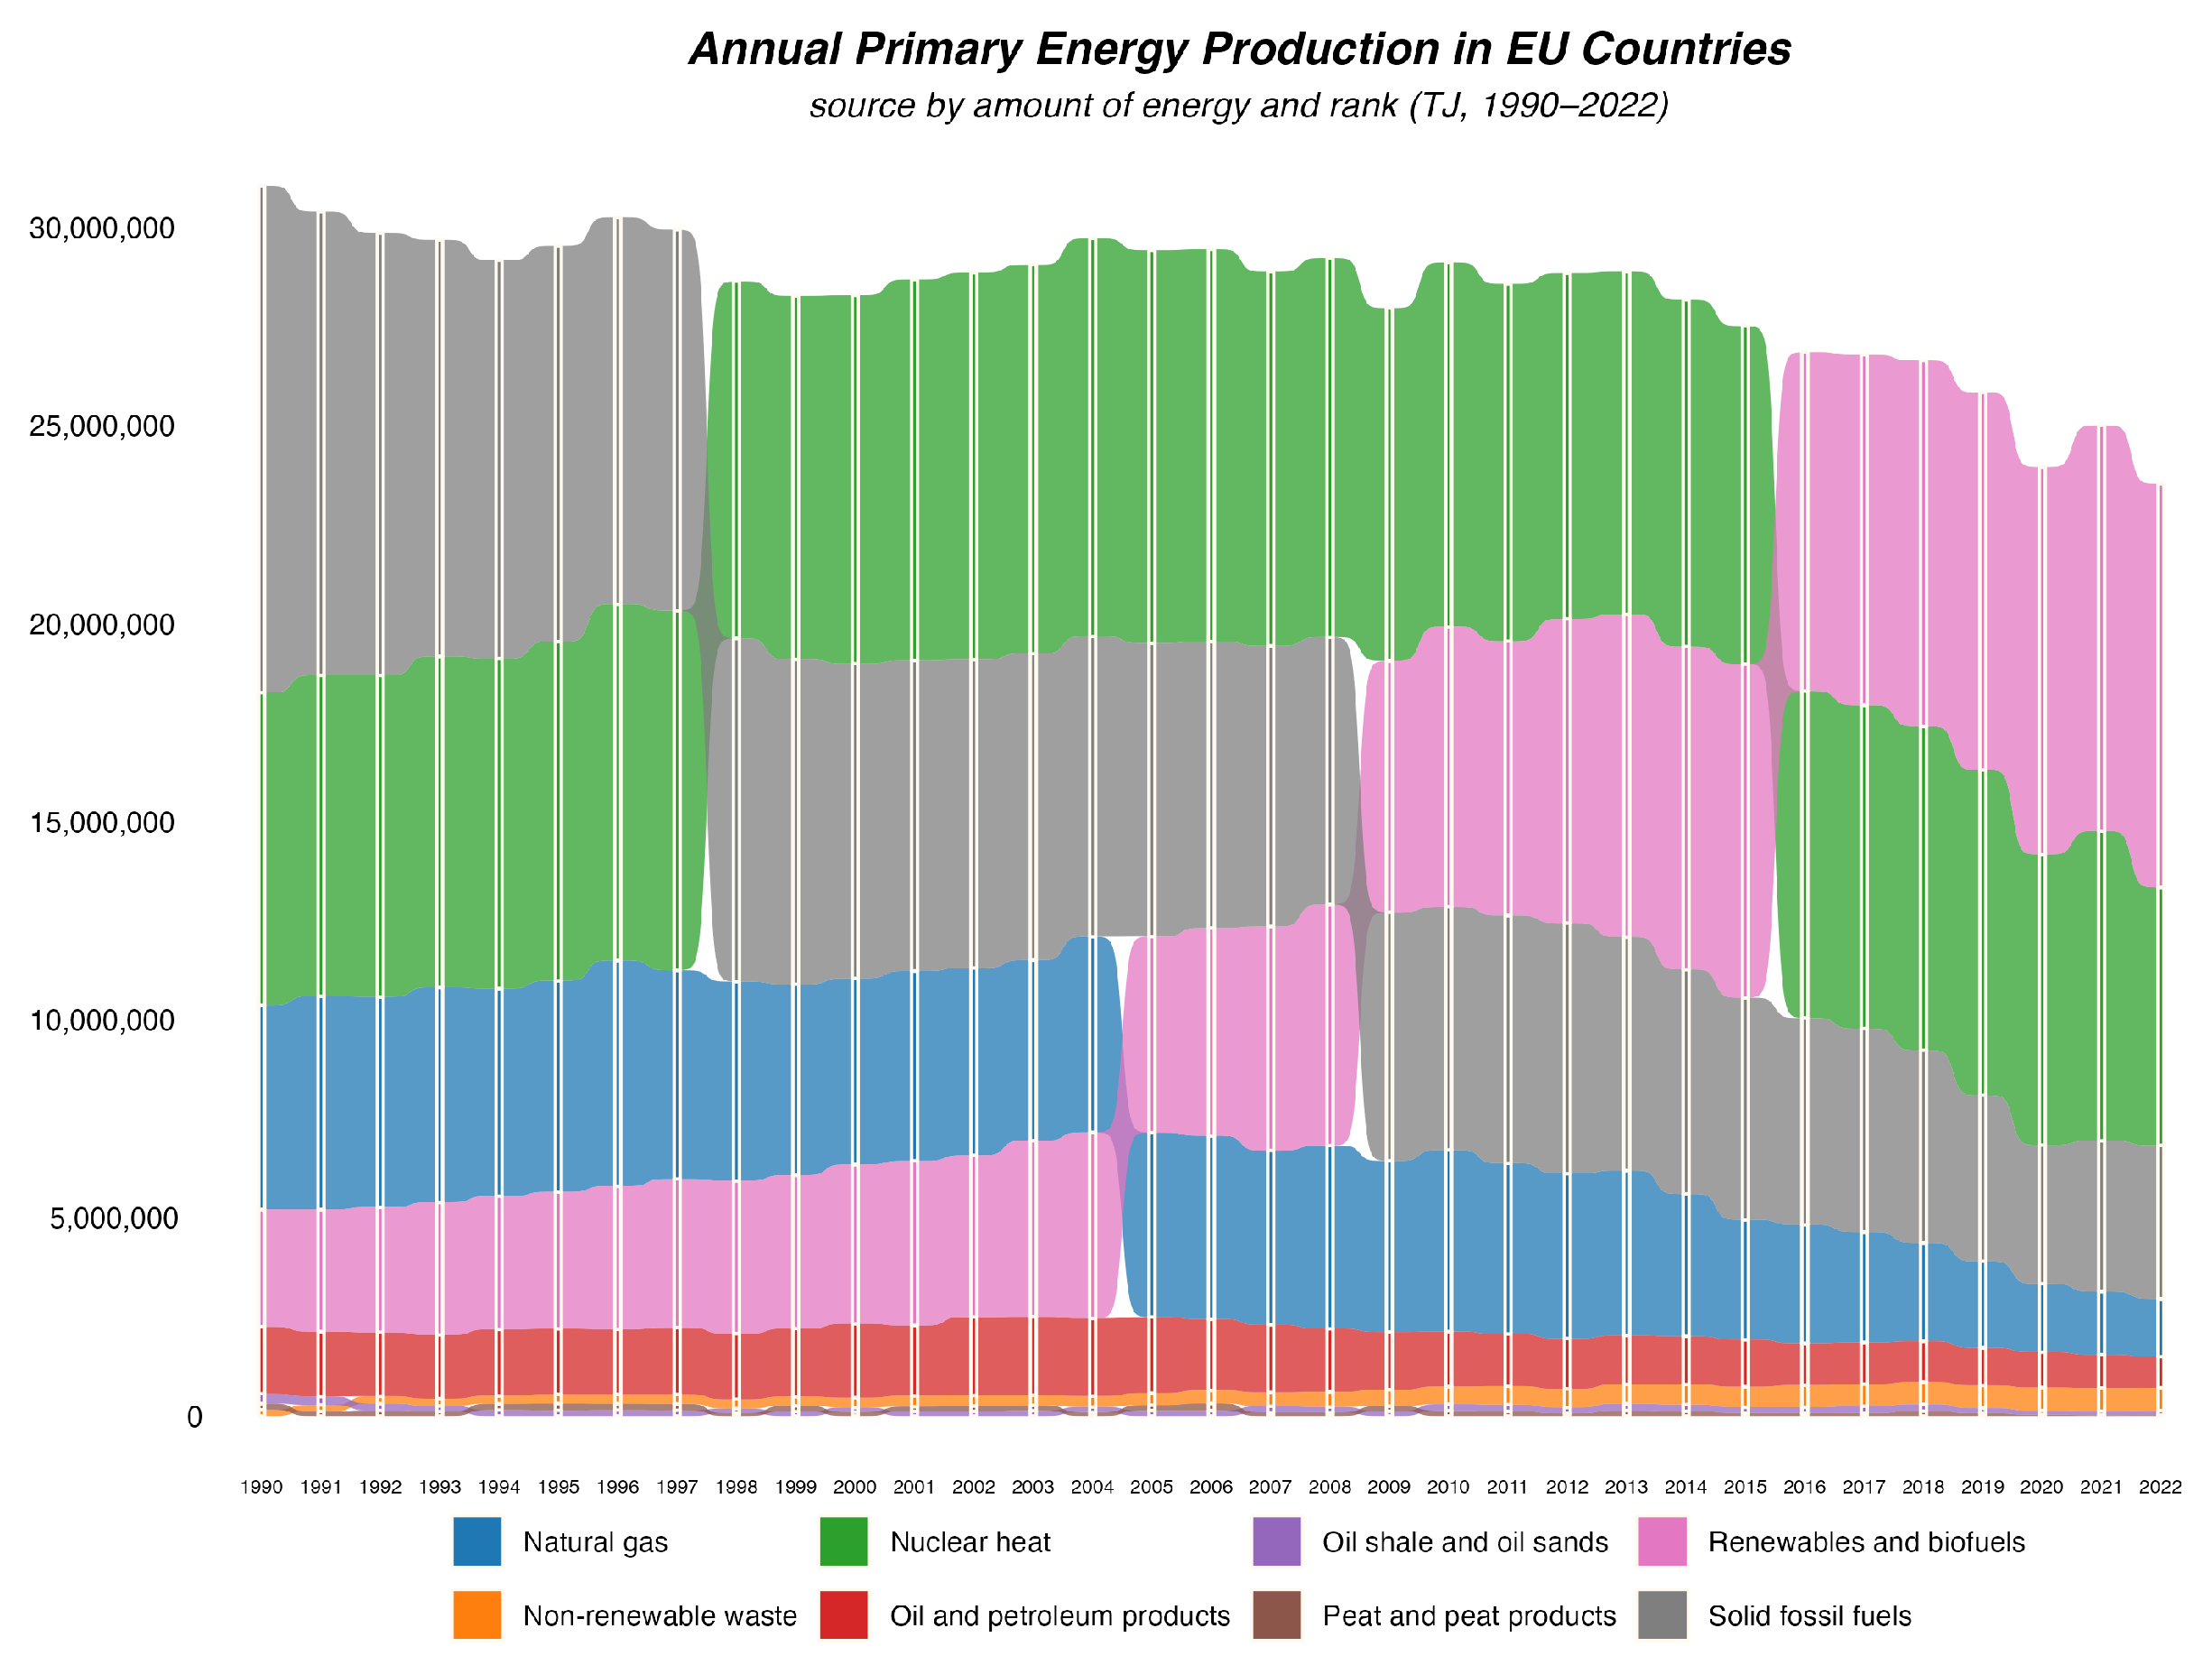
Figure 2.
Annual Primary Energy Consumption in EU Countries (Data Source: Eurostat nrg_bal_s table).
Figure 2.
Annual Primary Energy Consumption in EU Countries (Data Source: Eurostat nrg_bal_s table).
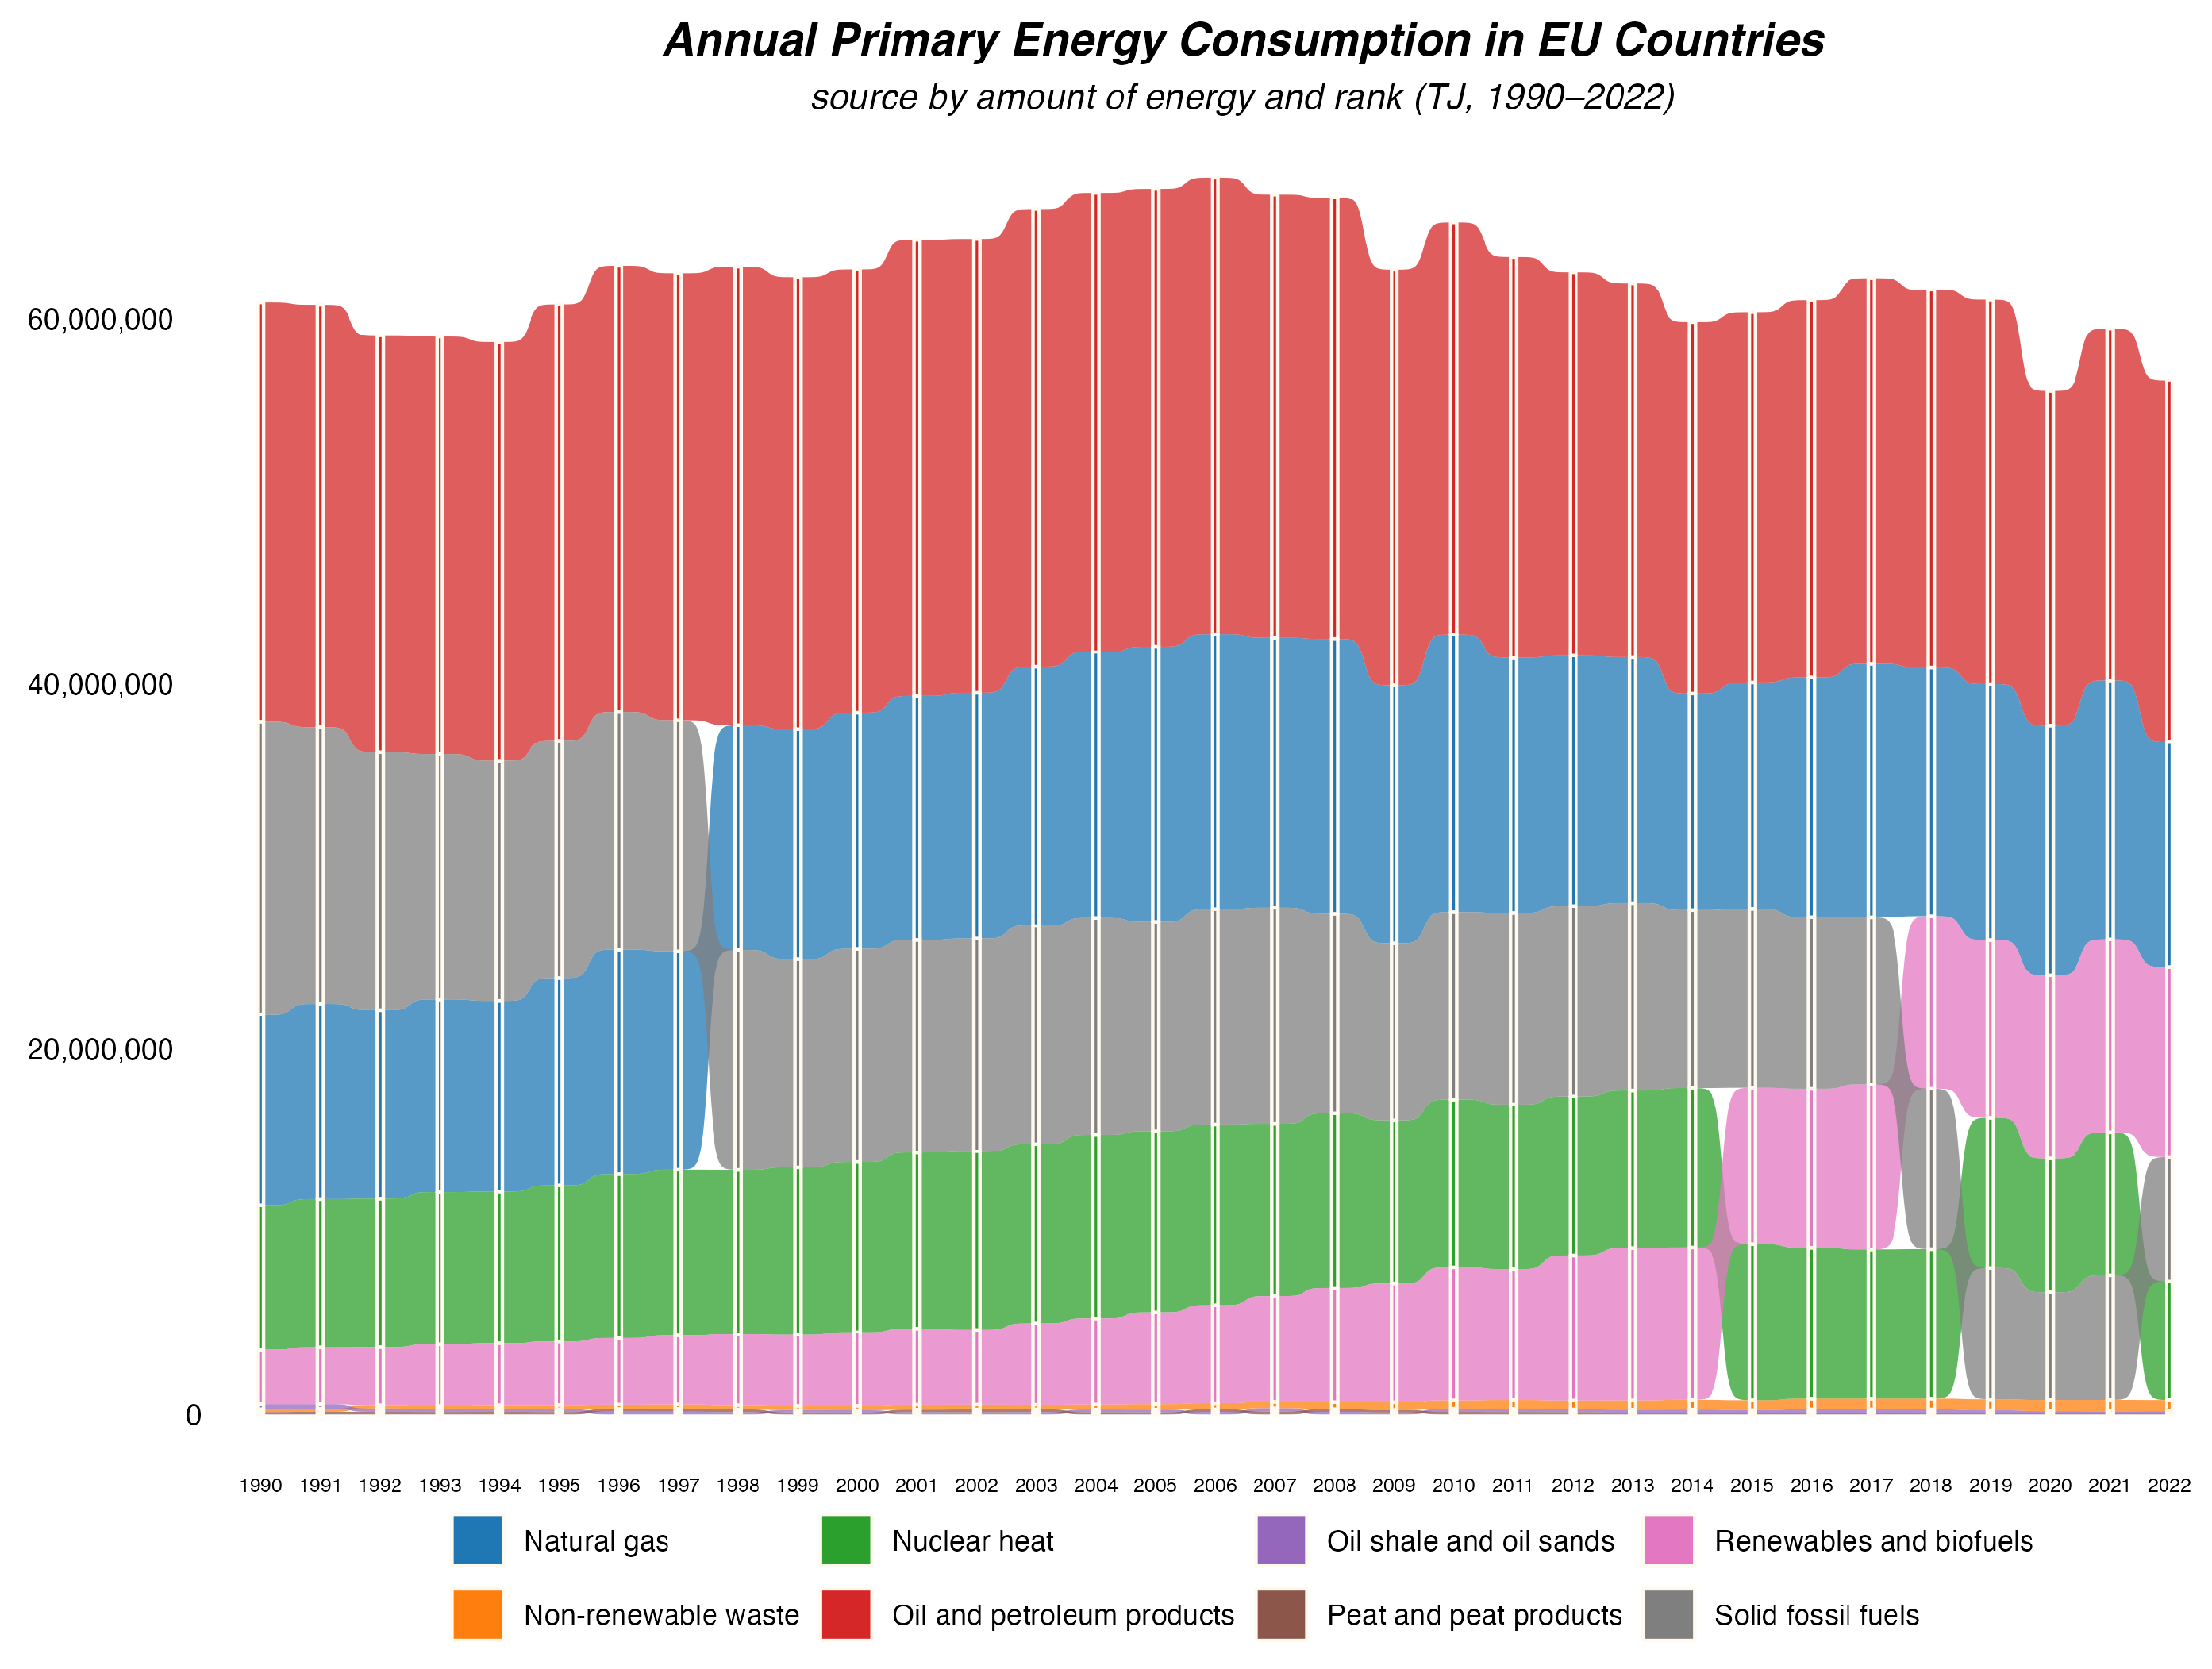
Figure 6.
Percent Change in Annual Primary Energy Production in Selected European Countries (Data Source: Eurostat nrg_bal_s table).
Figure 6.
Percent Change in Annual Primary Energy Production in Selected European Countries (Data Source: Eurostat nrg_bal_s table).
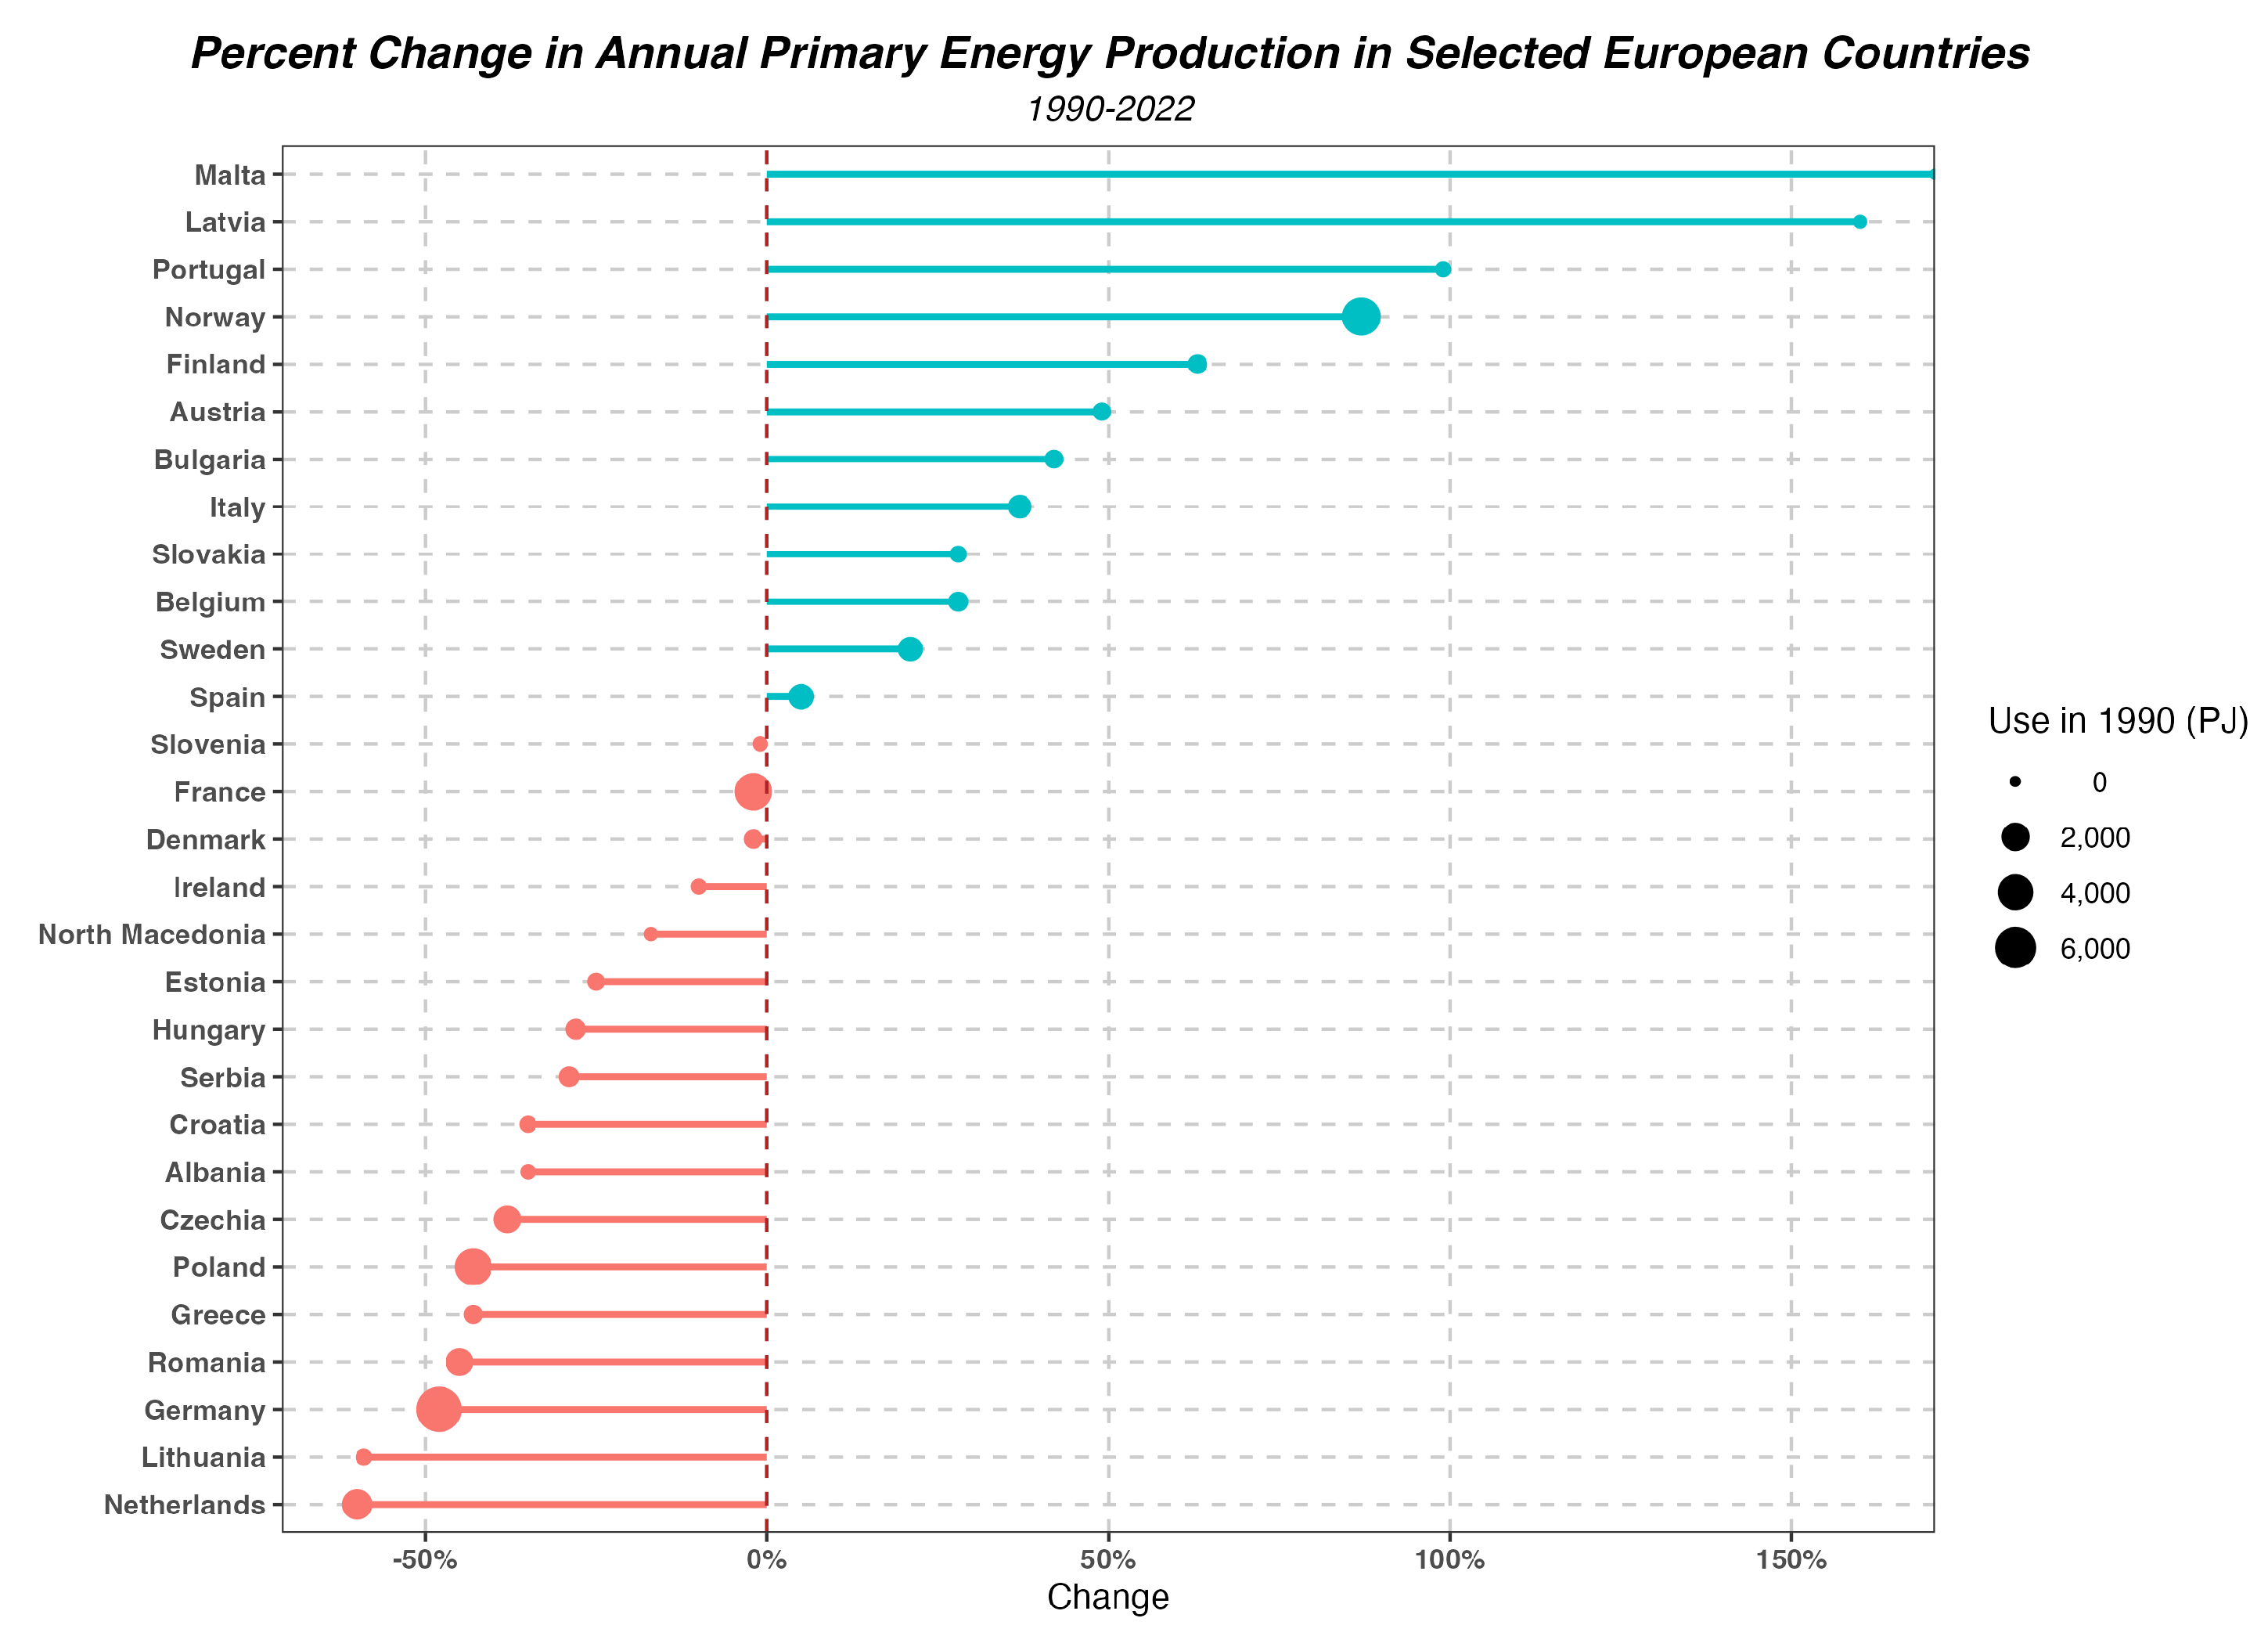
Figure 7.
Proportion of Primary Energy Production in Consumption in the EU (Data Source: Eurostat nrg_bal_s table).
Figure 7.
Proportion of Primary Energy Production in Consumption in the EU (Data Source: Eurostat nrg_bal_s table).
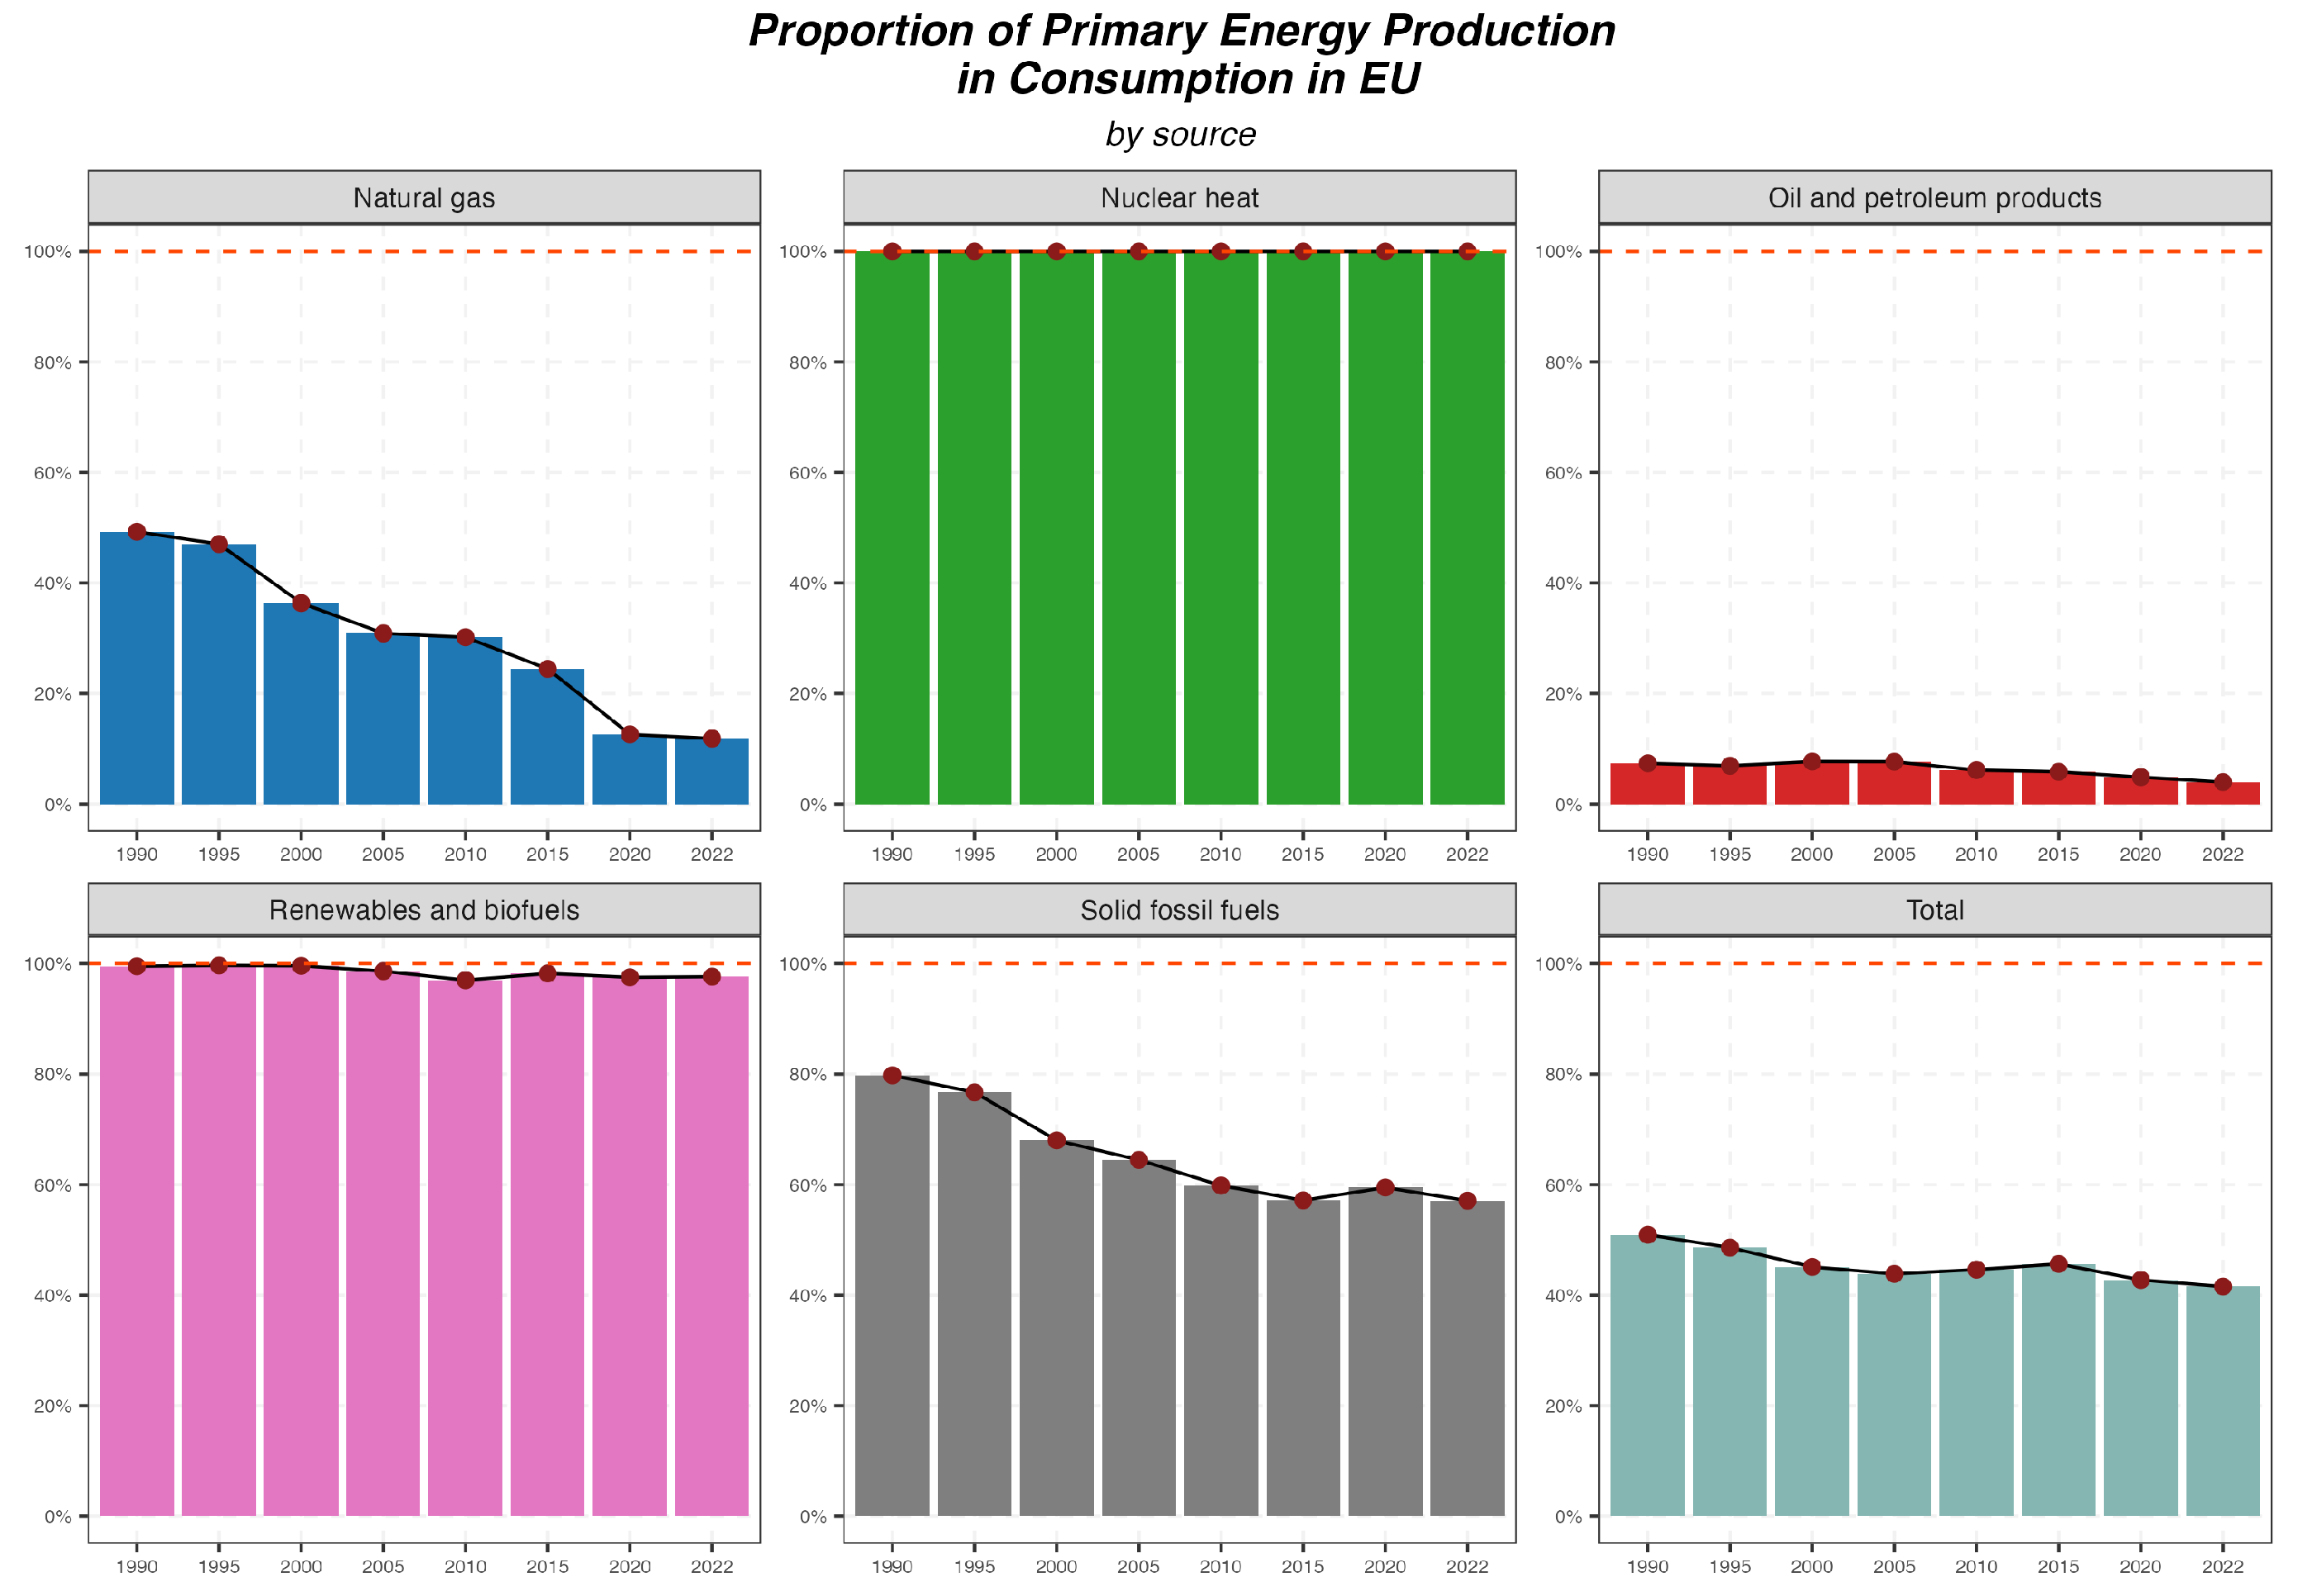
Figure 8.
Average Structure of Primary Energy Production in Analyzed Countries (Data Source: Eurostat nrg_bal_s table).
Figure 8.
Average Structure of Primary Energy Production in Analyzed Countries (Data Source: Eurostat nrg_bal_s table).
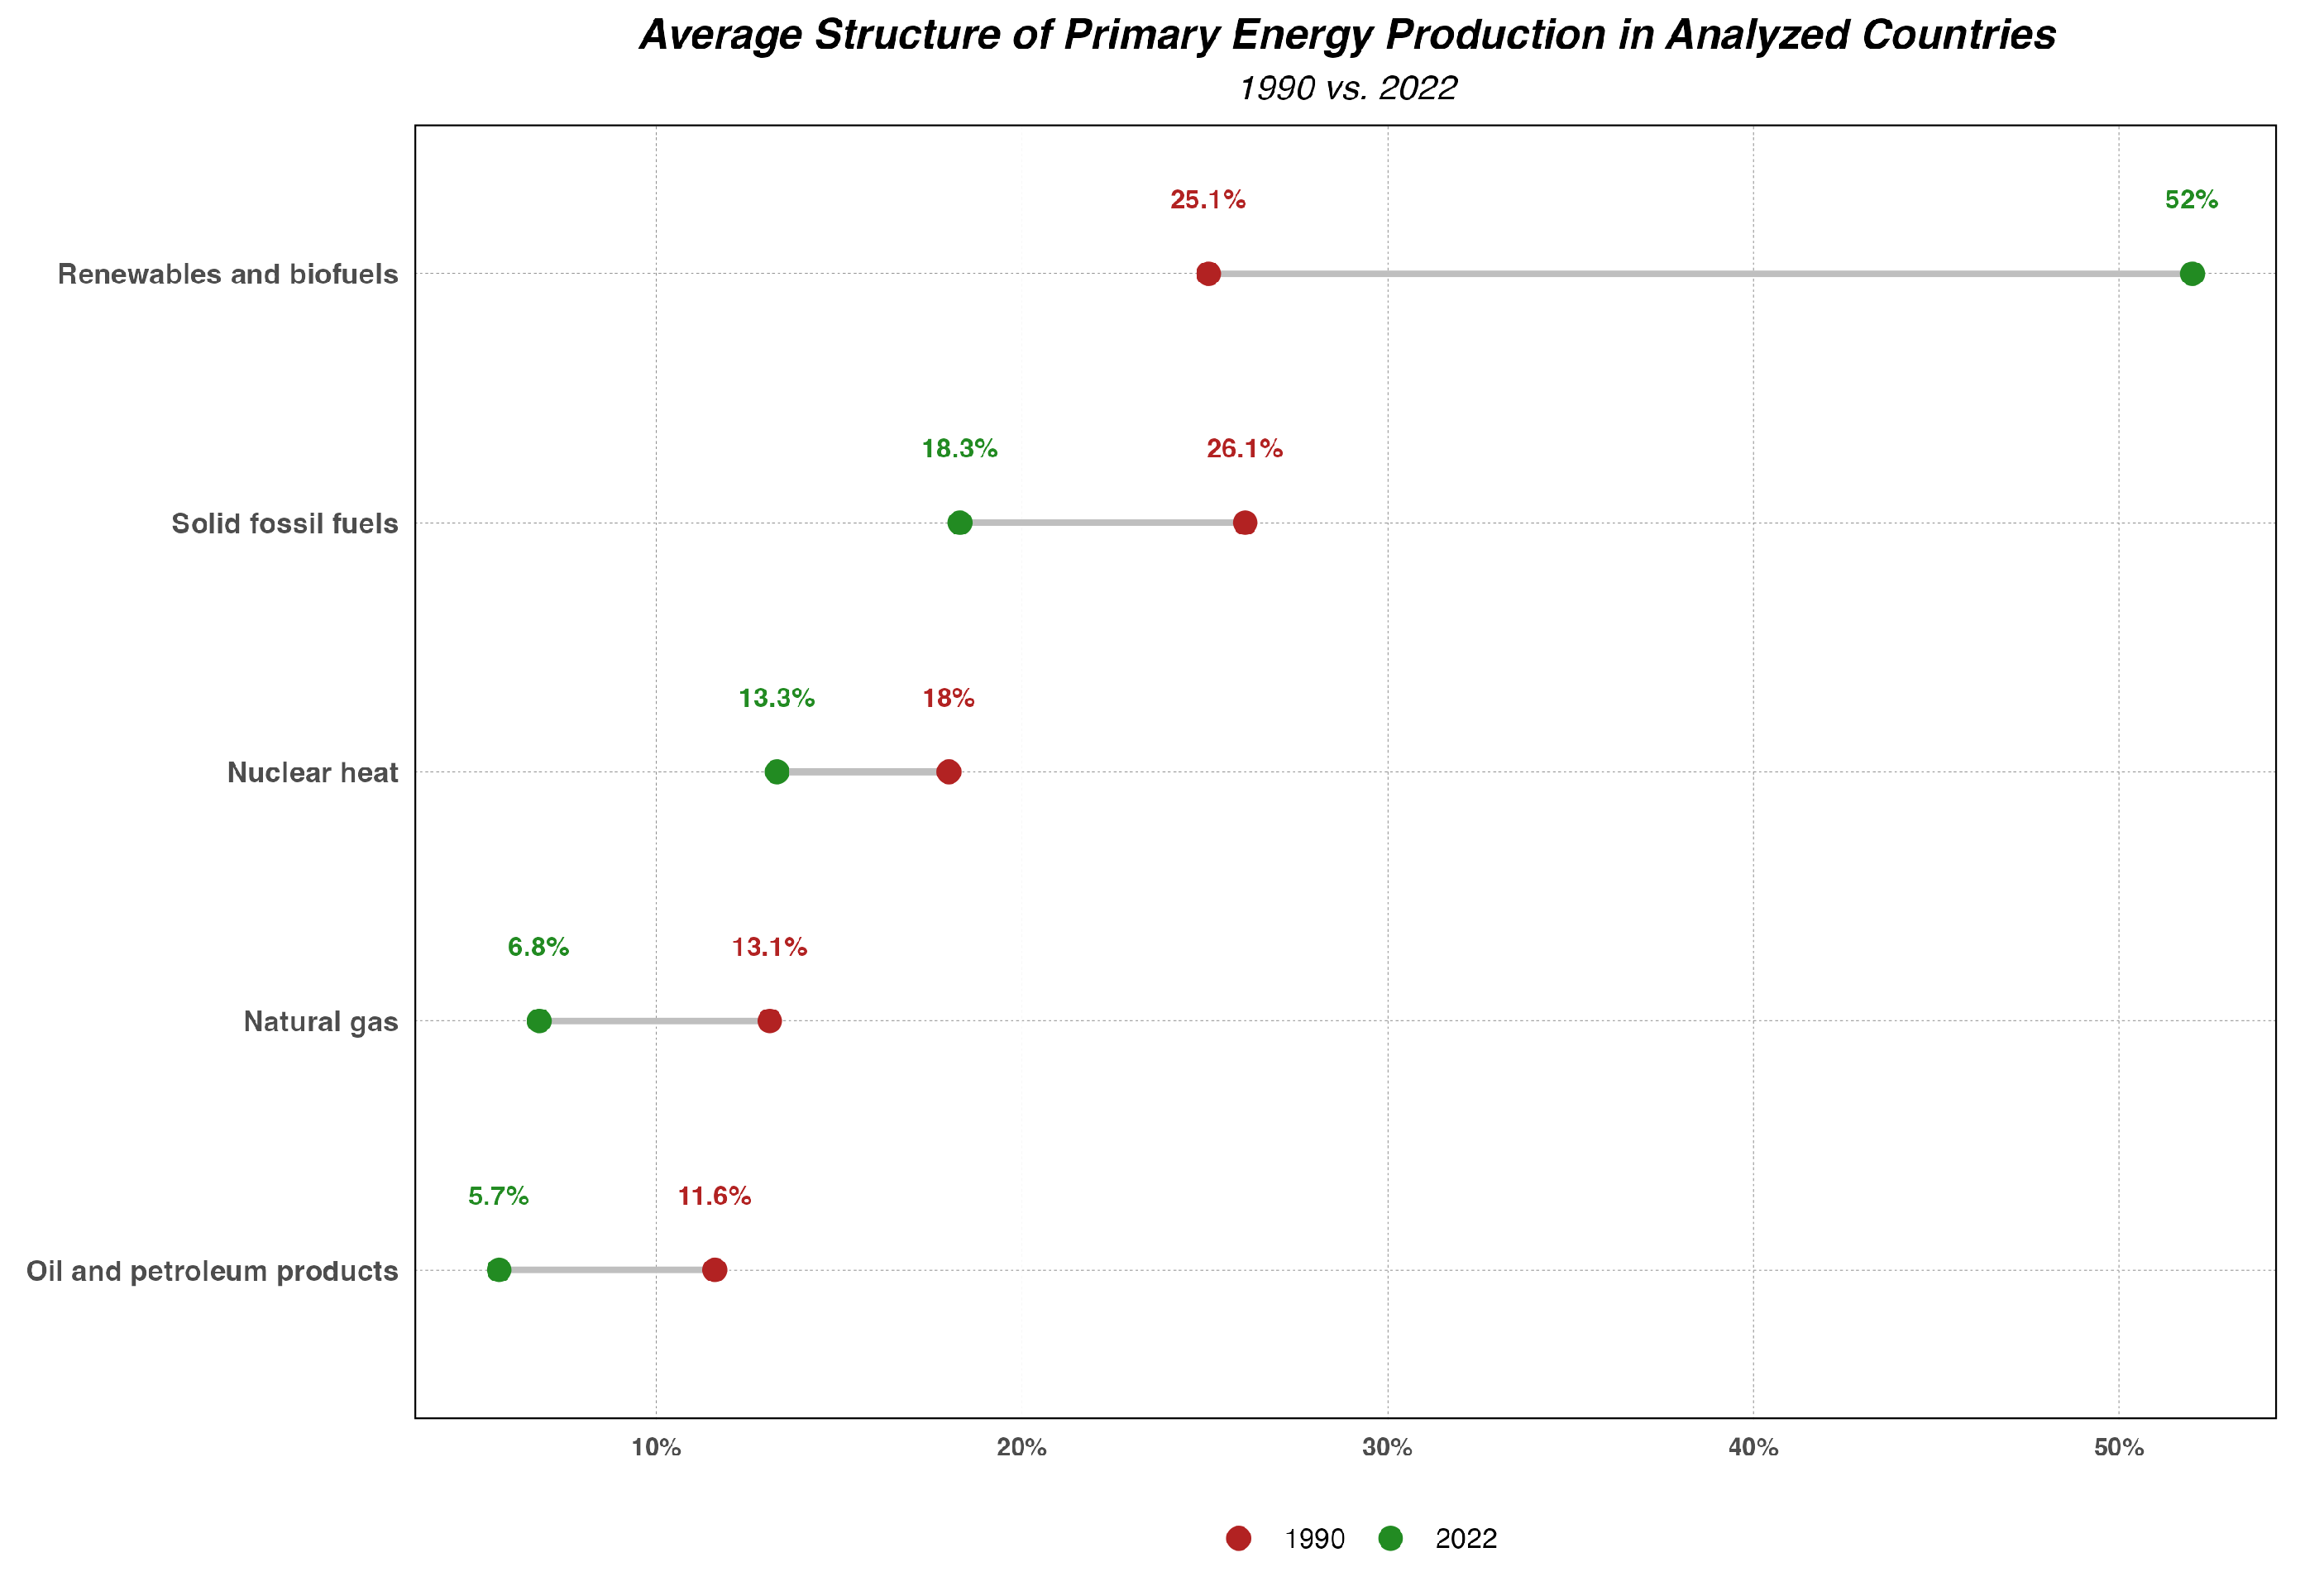
Figure 9.
Proportion of Primary Energy Production in Consumption in Selected European Countries—All Sources. (Data Source: Eurostat nrg_bal_s table).
Figure 9.
Proportion of Primary Energy Production in Consumption in Selected European Countries—All Sources. (Data Source: Eurostat nrg_bal_s table).
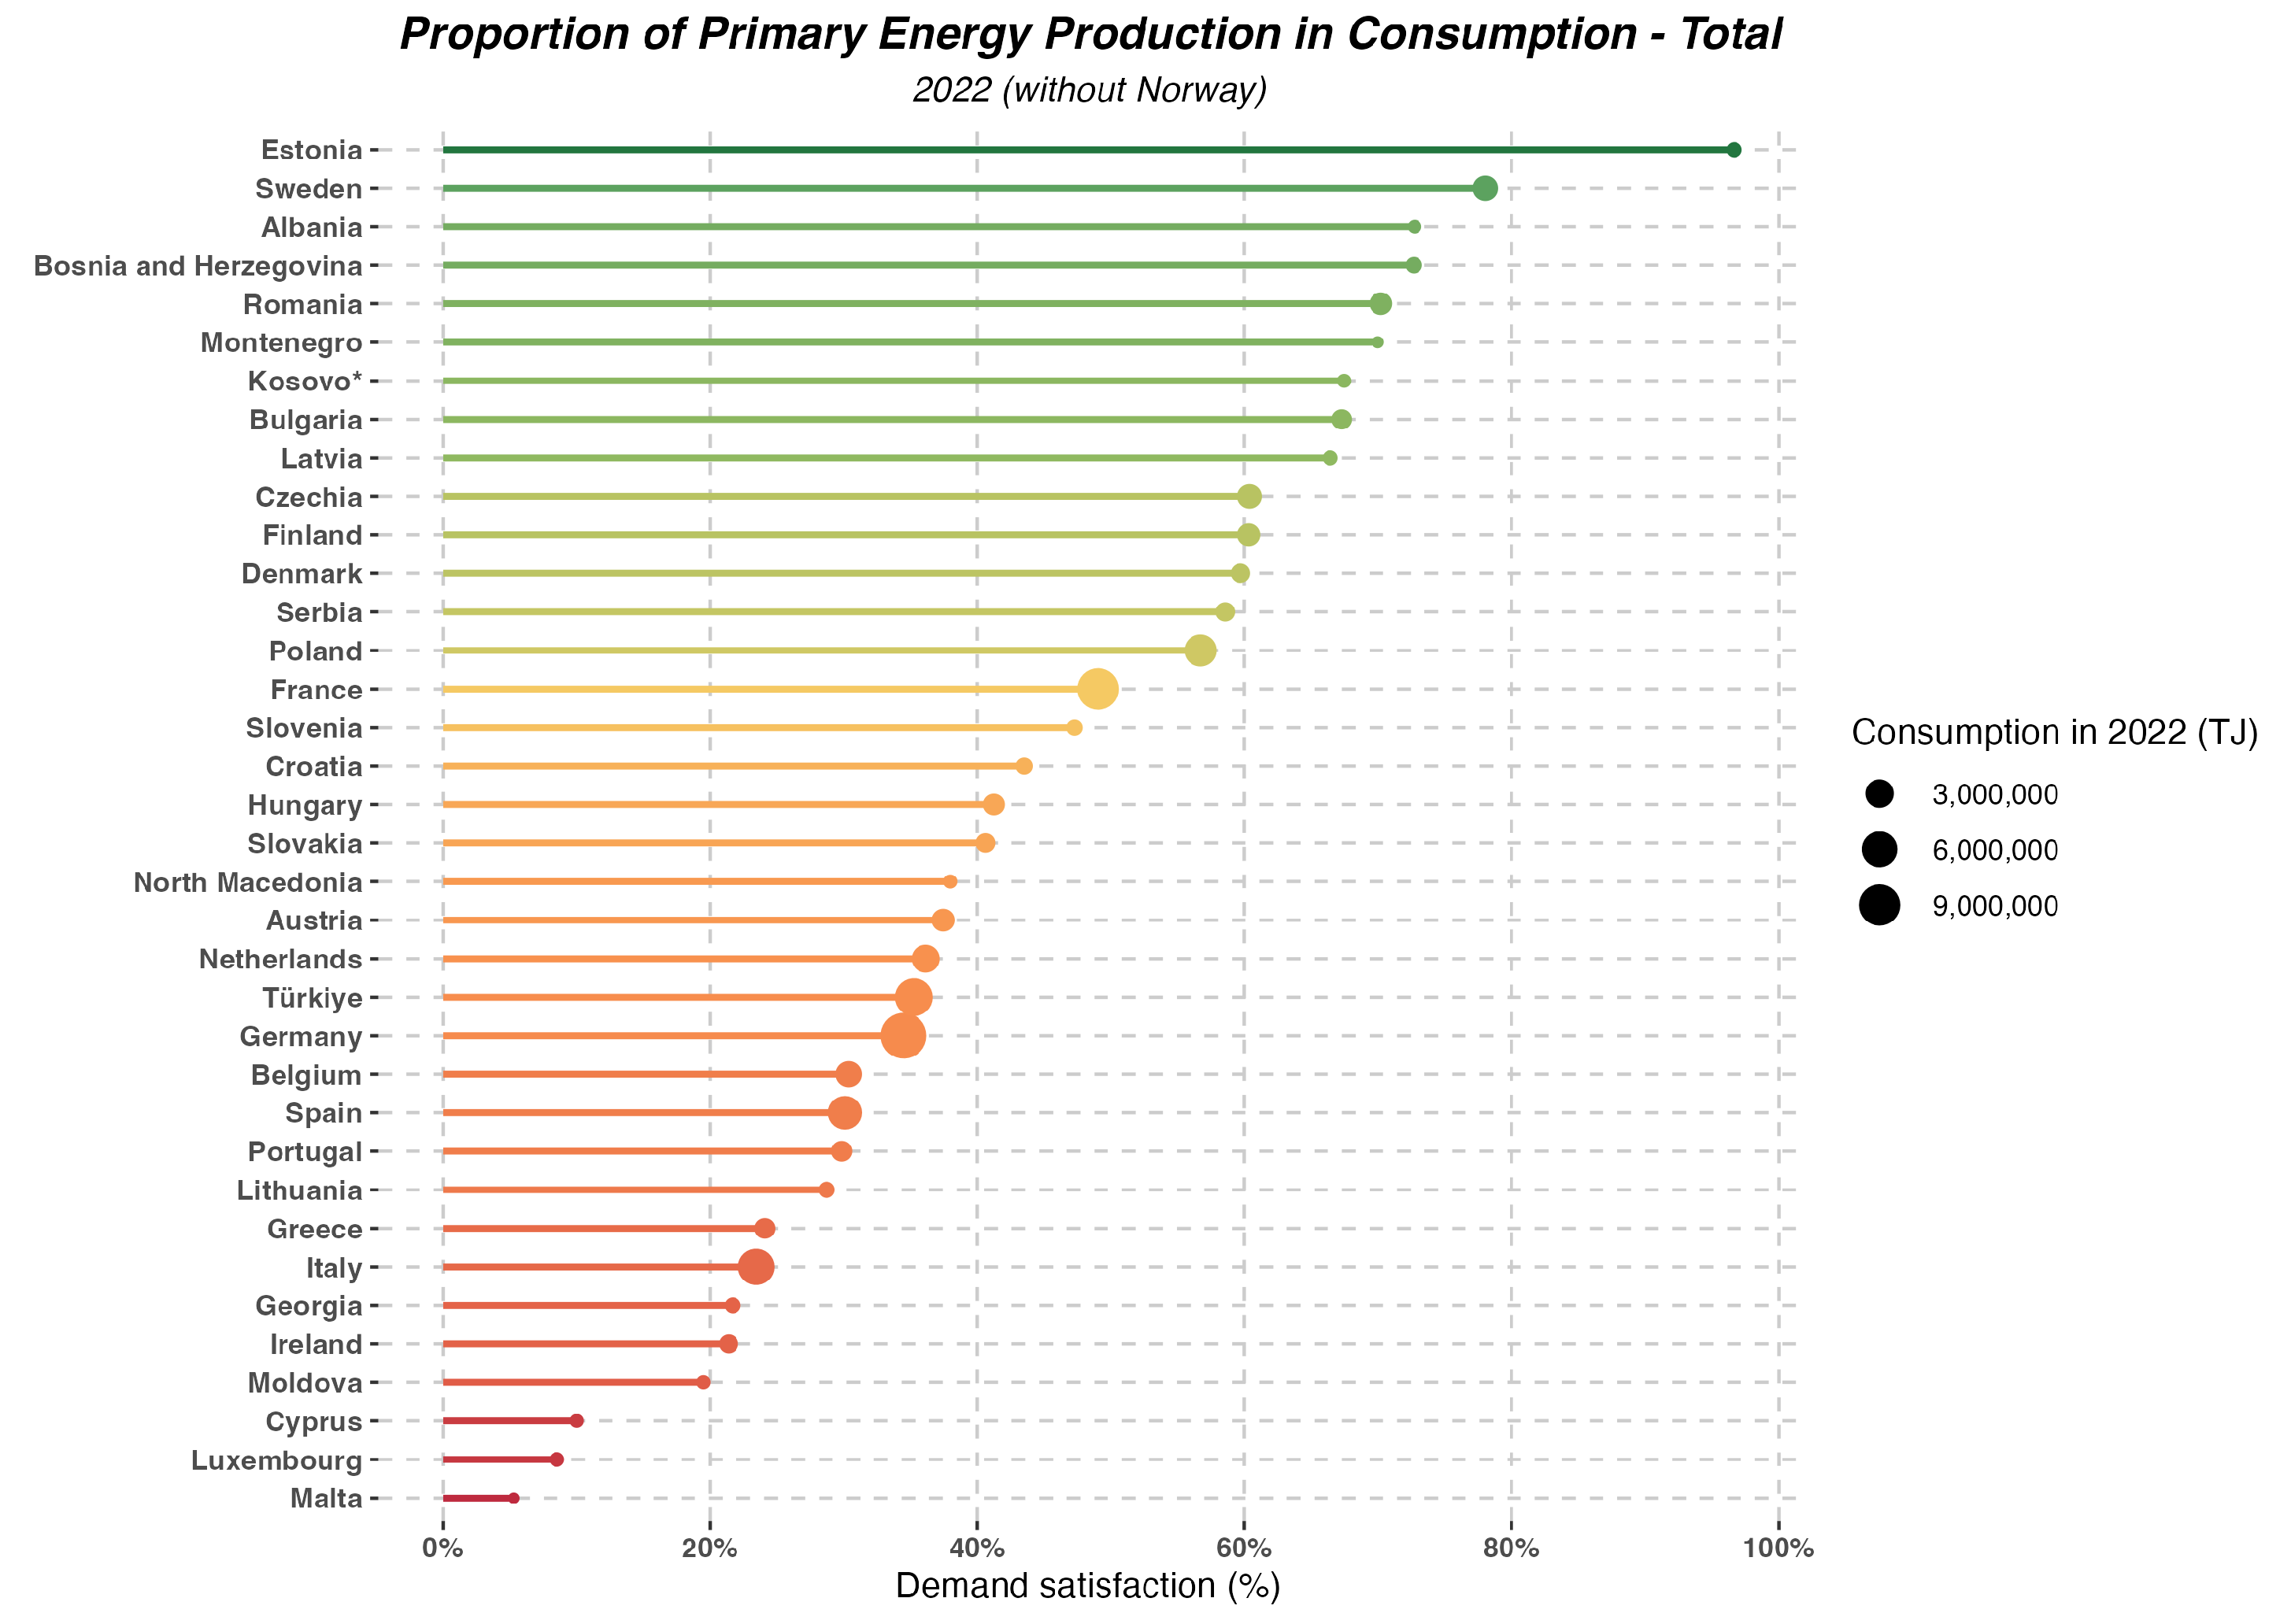
Figure 10.
Optimal Number of Clusters in 1990 According to the Silhouette Method.
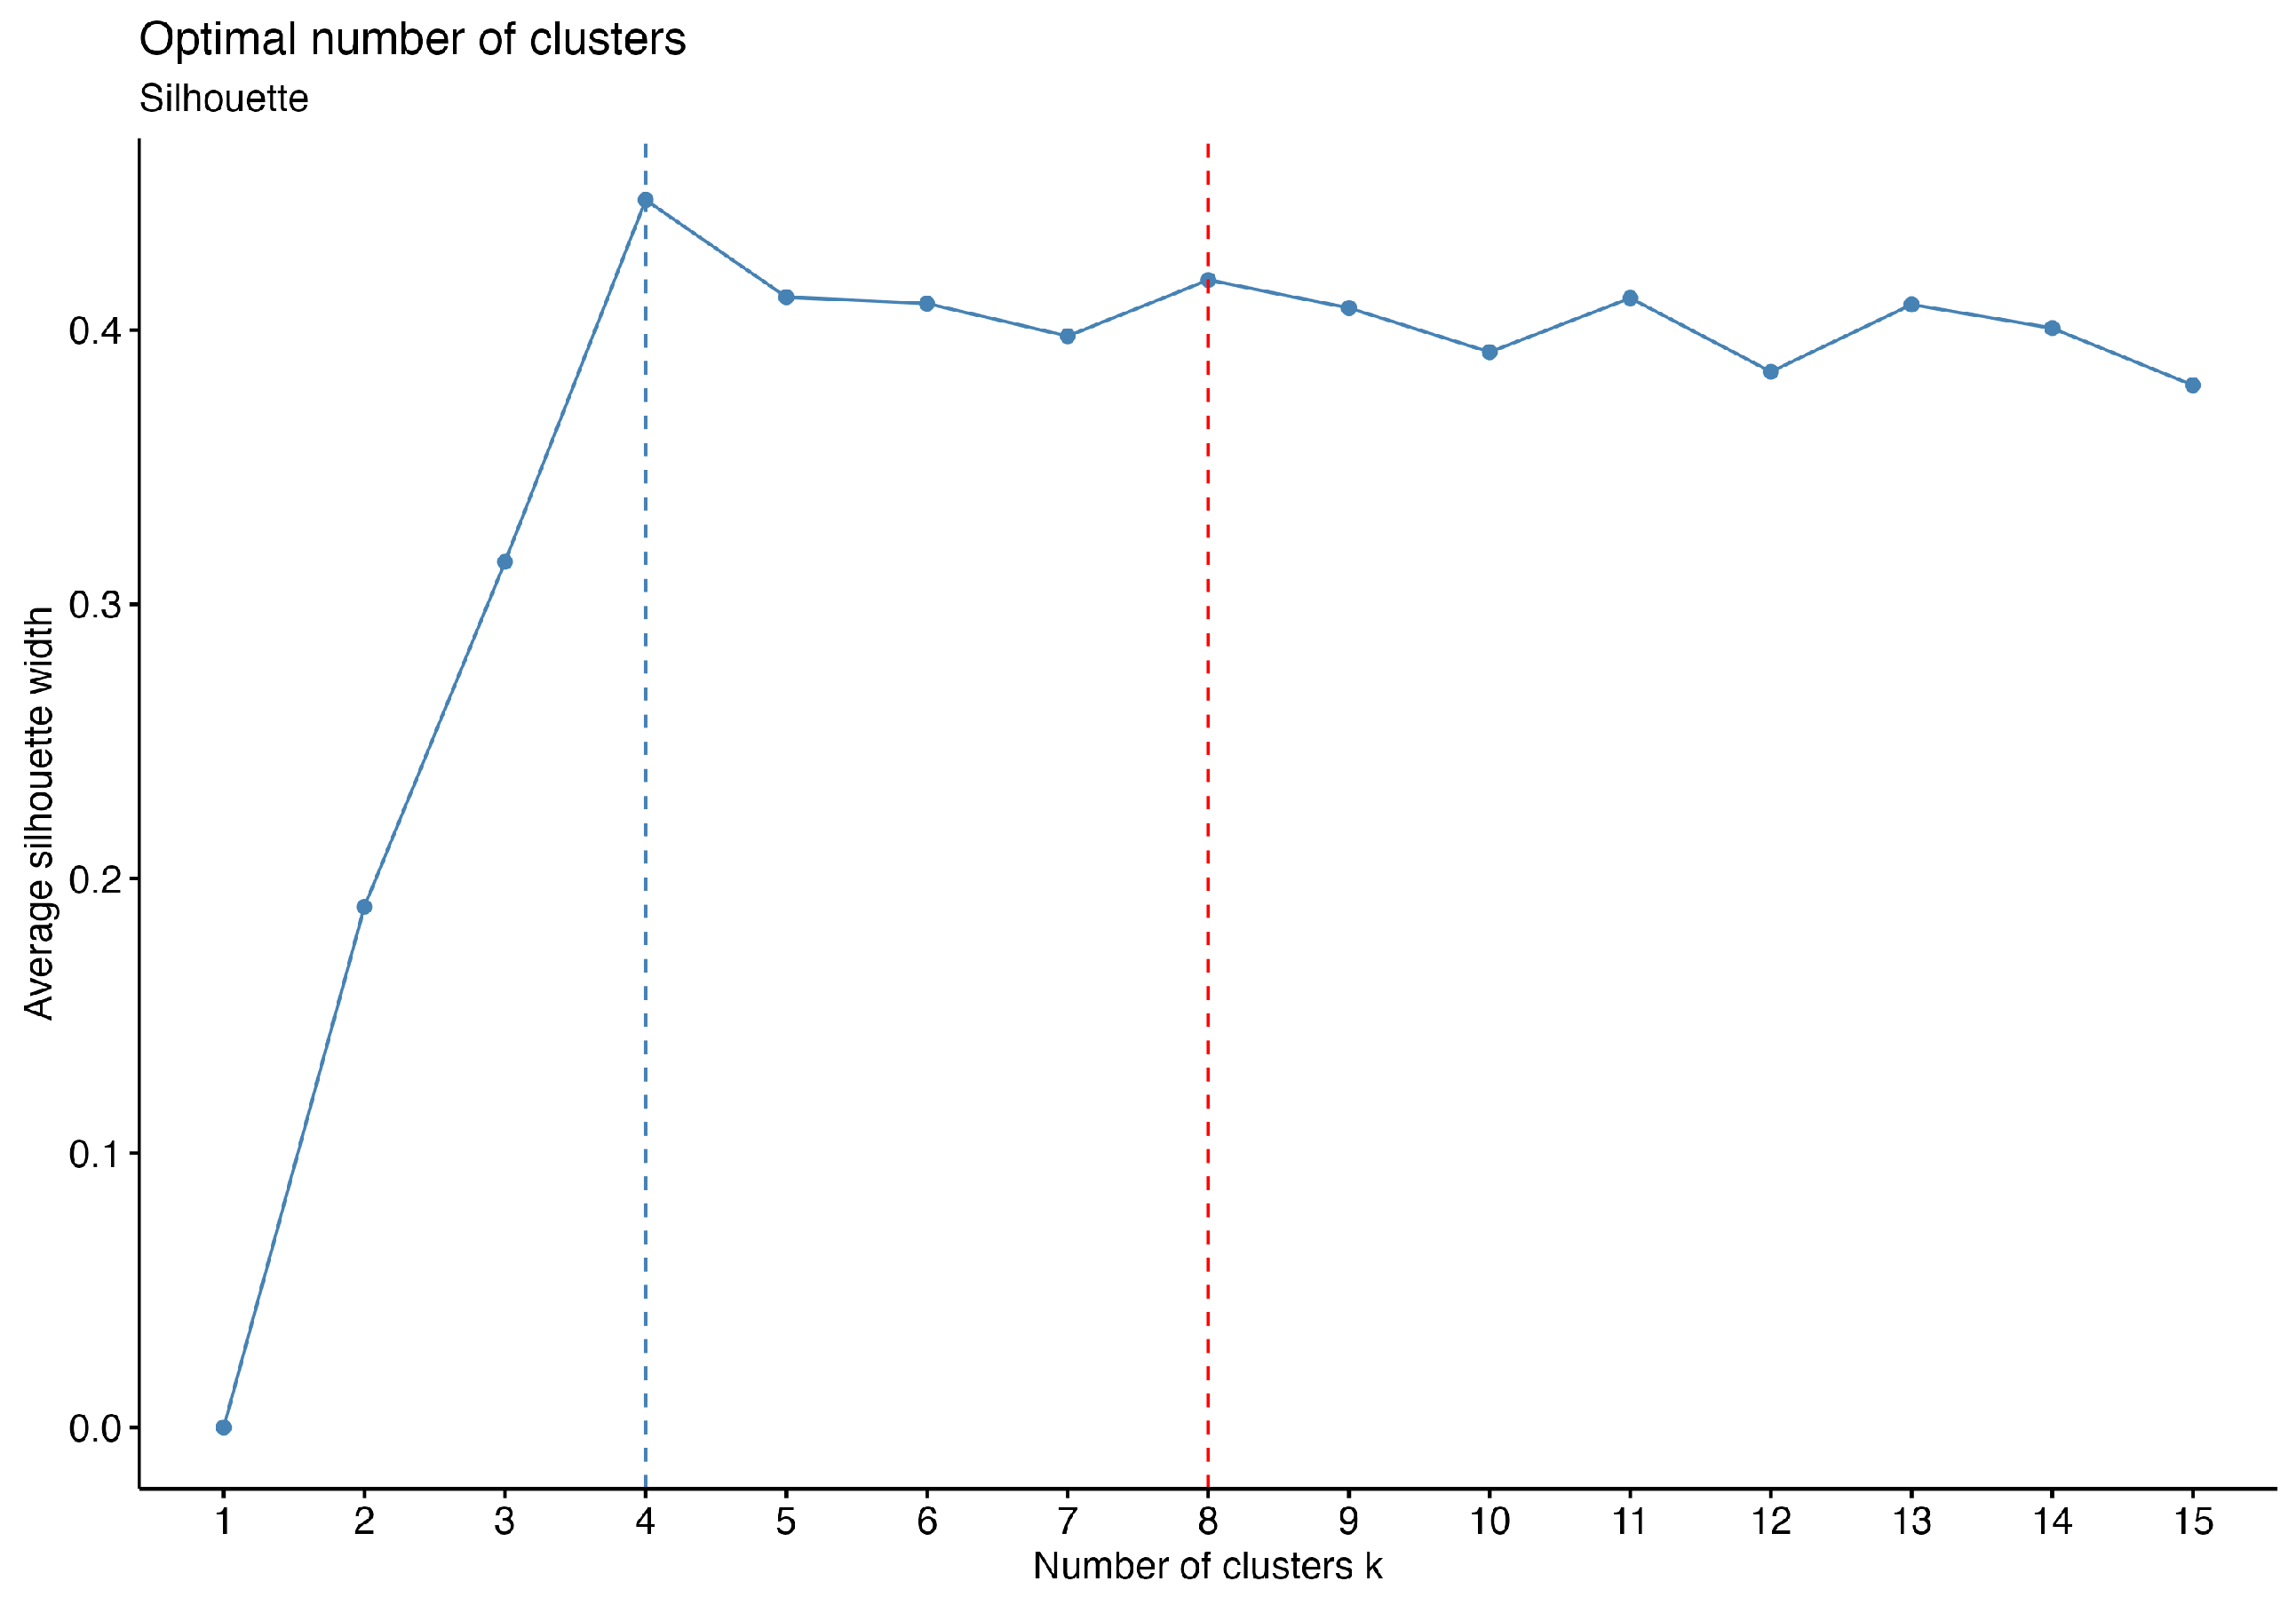
Figure 11.
Average Structure of Primary Energy Production in Clusters for 1990.
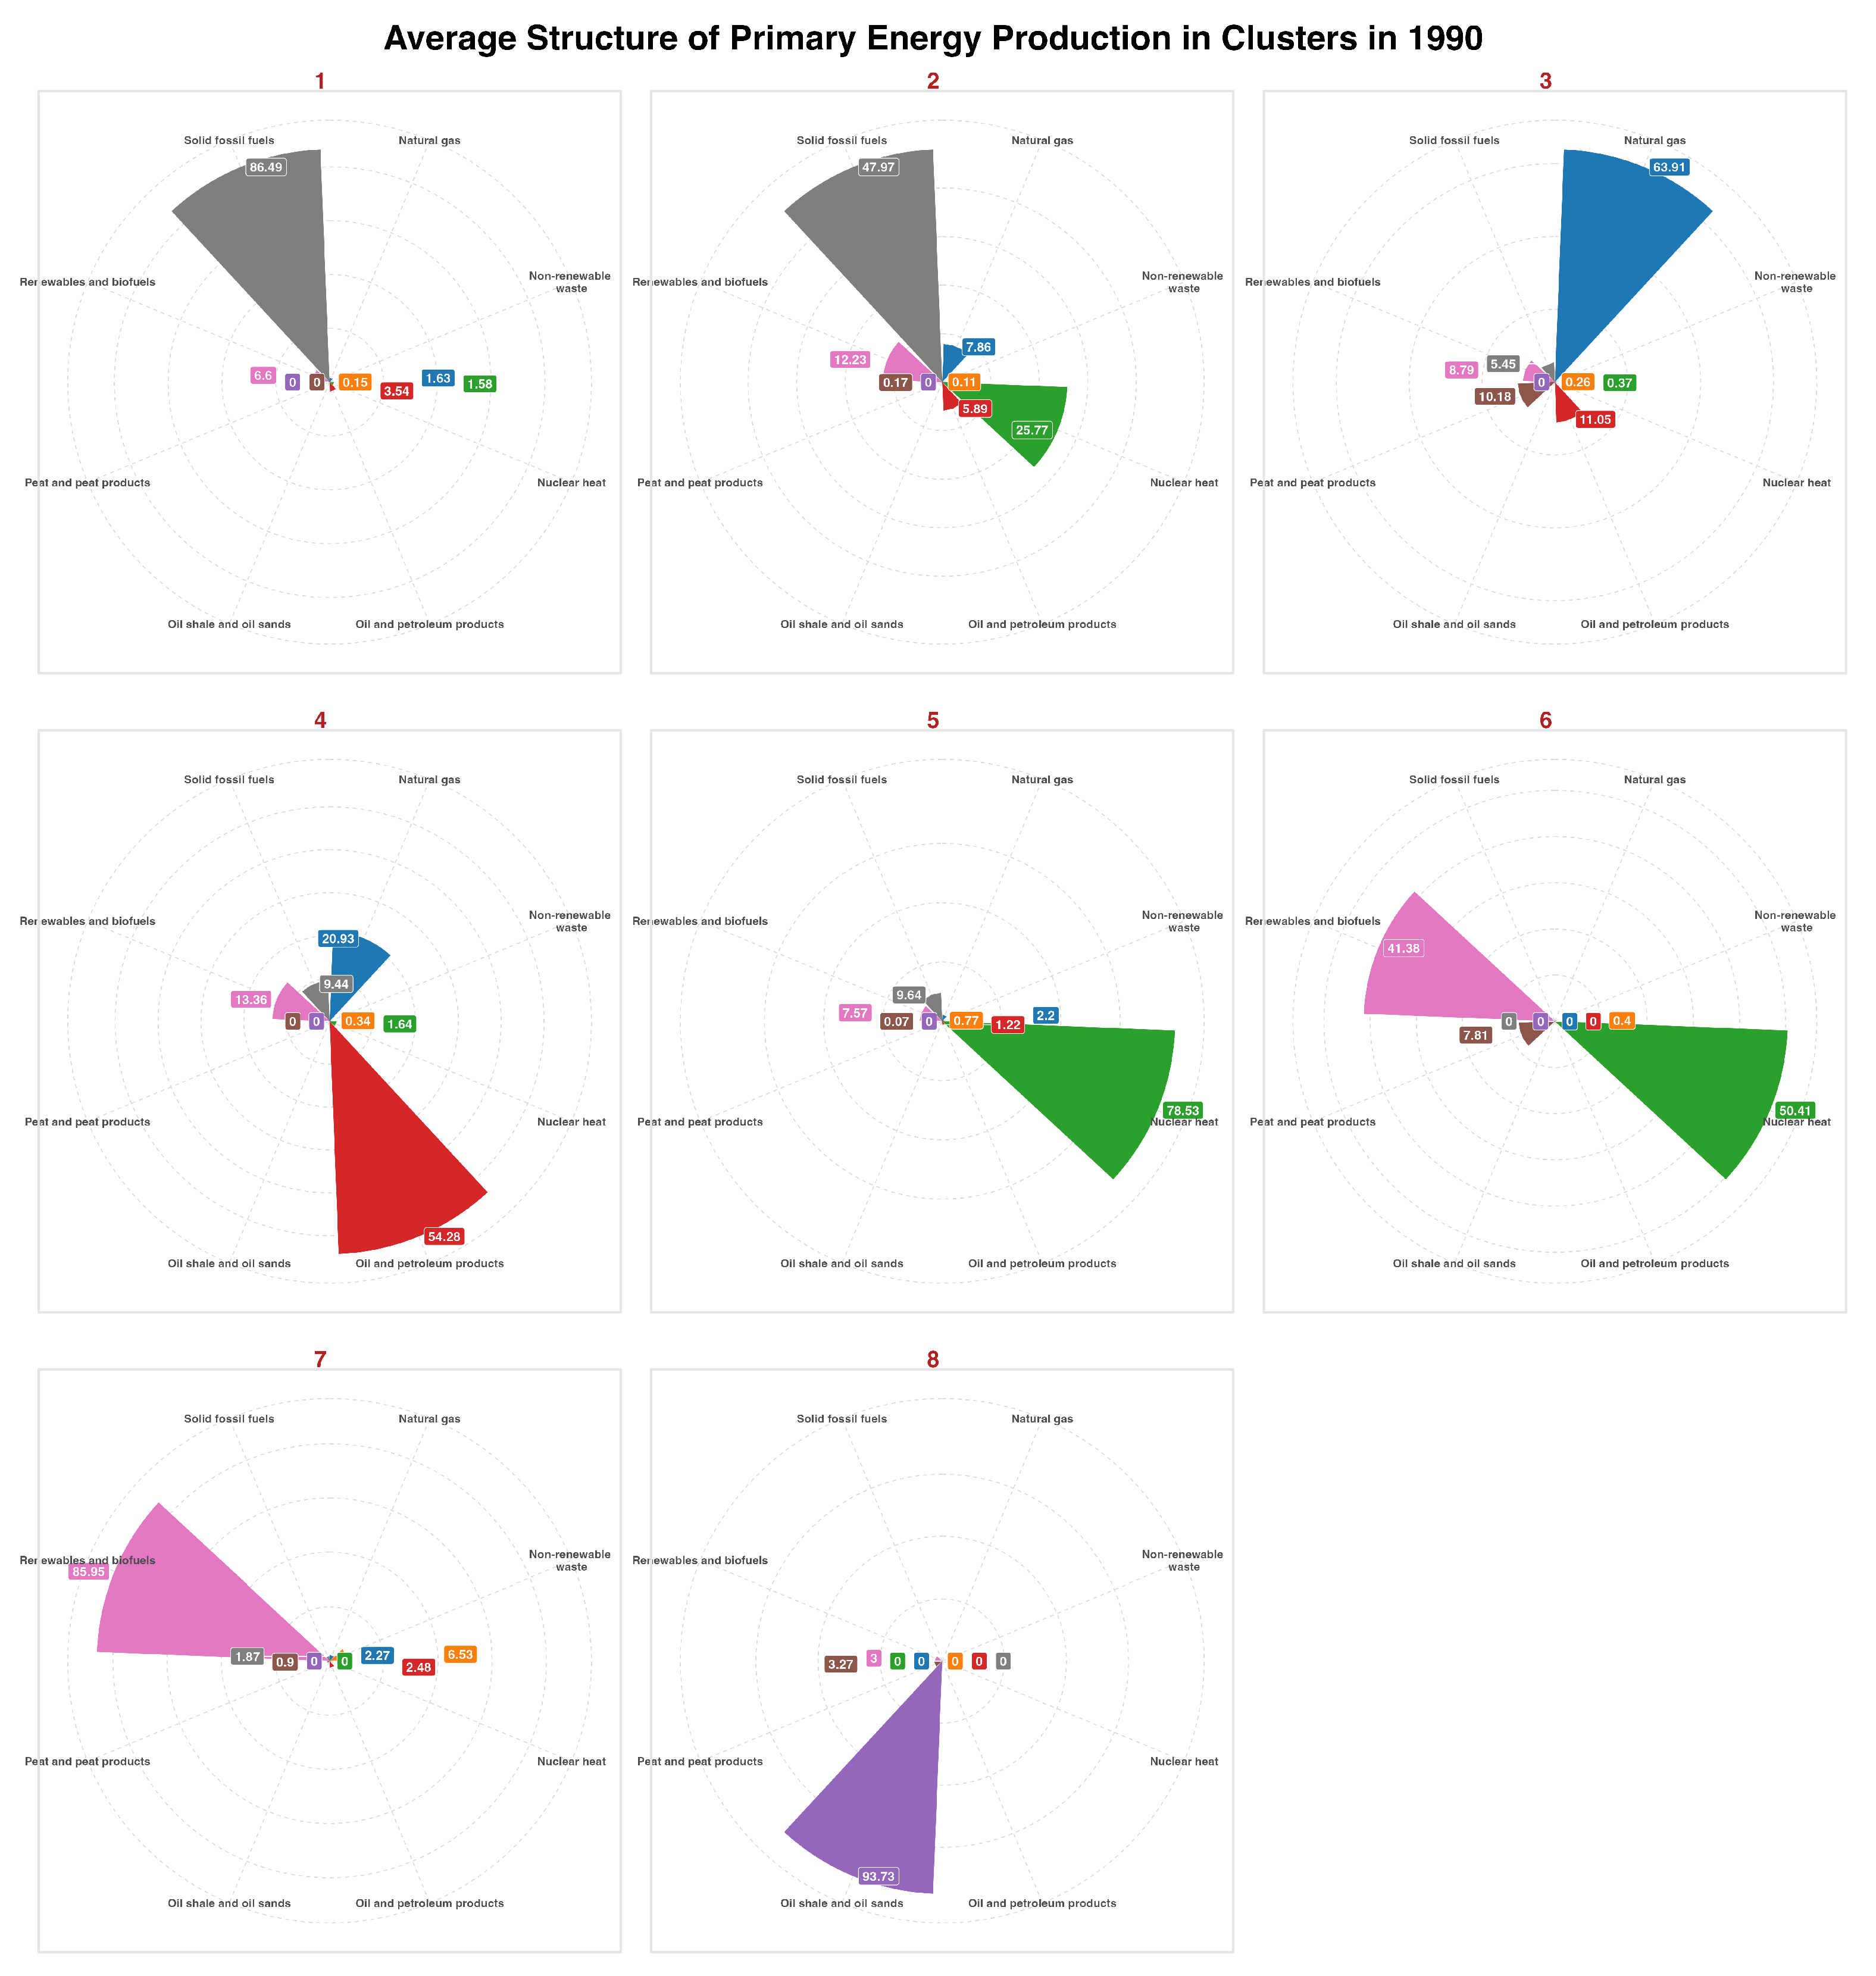
Figure 12.
Map of Clustered Countries in 1990.
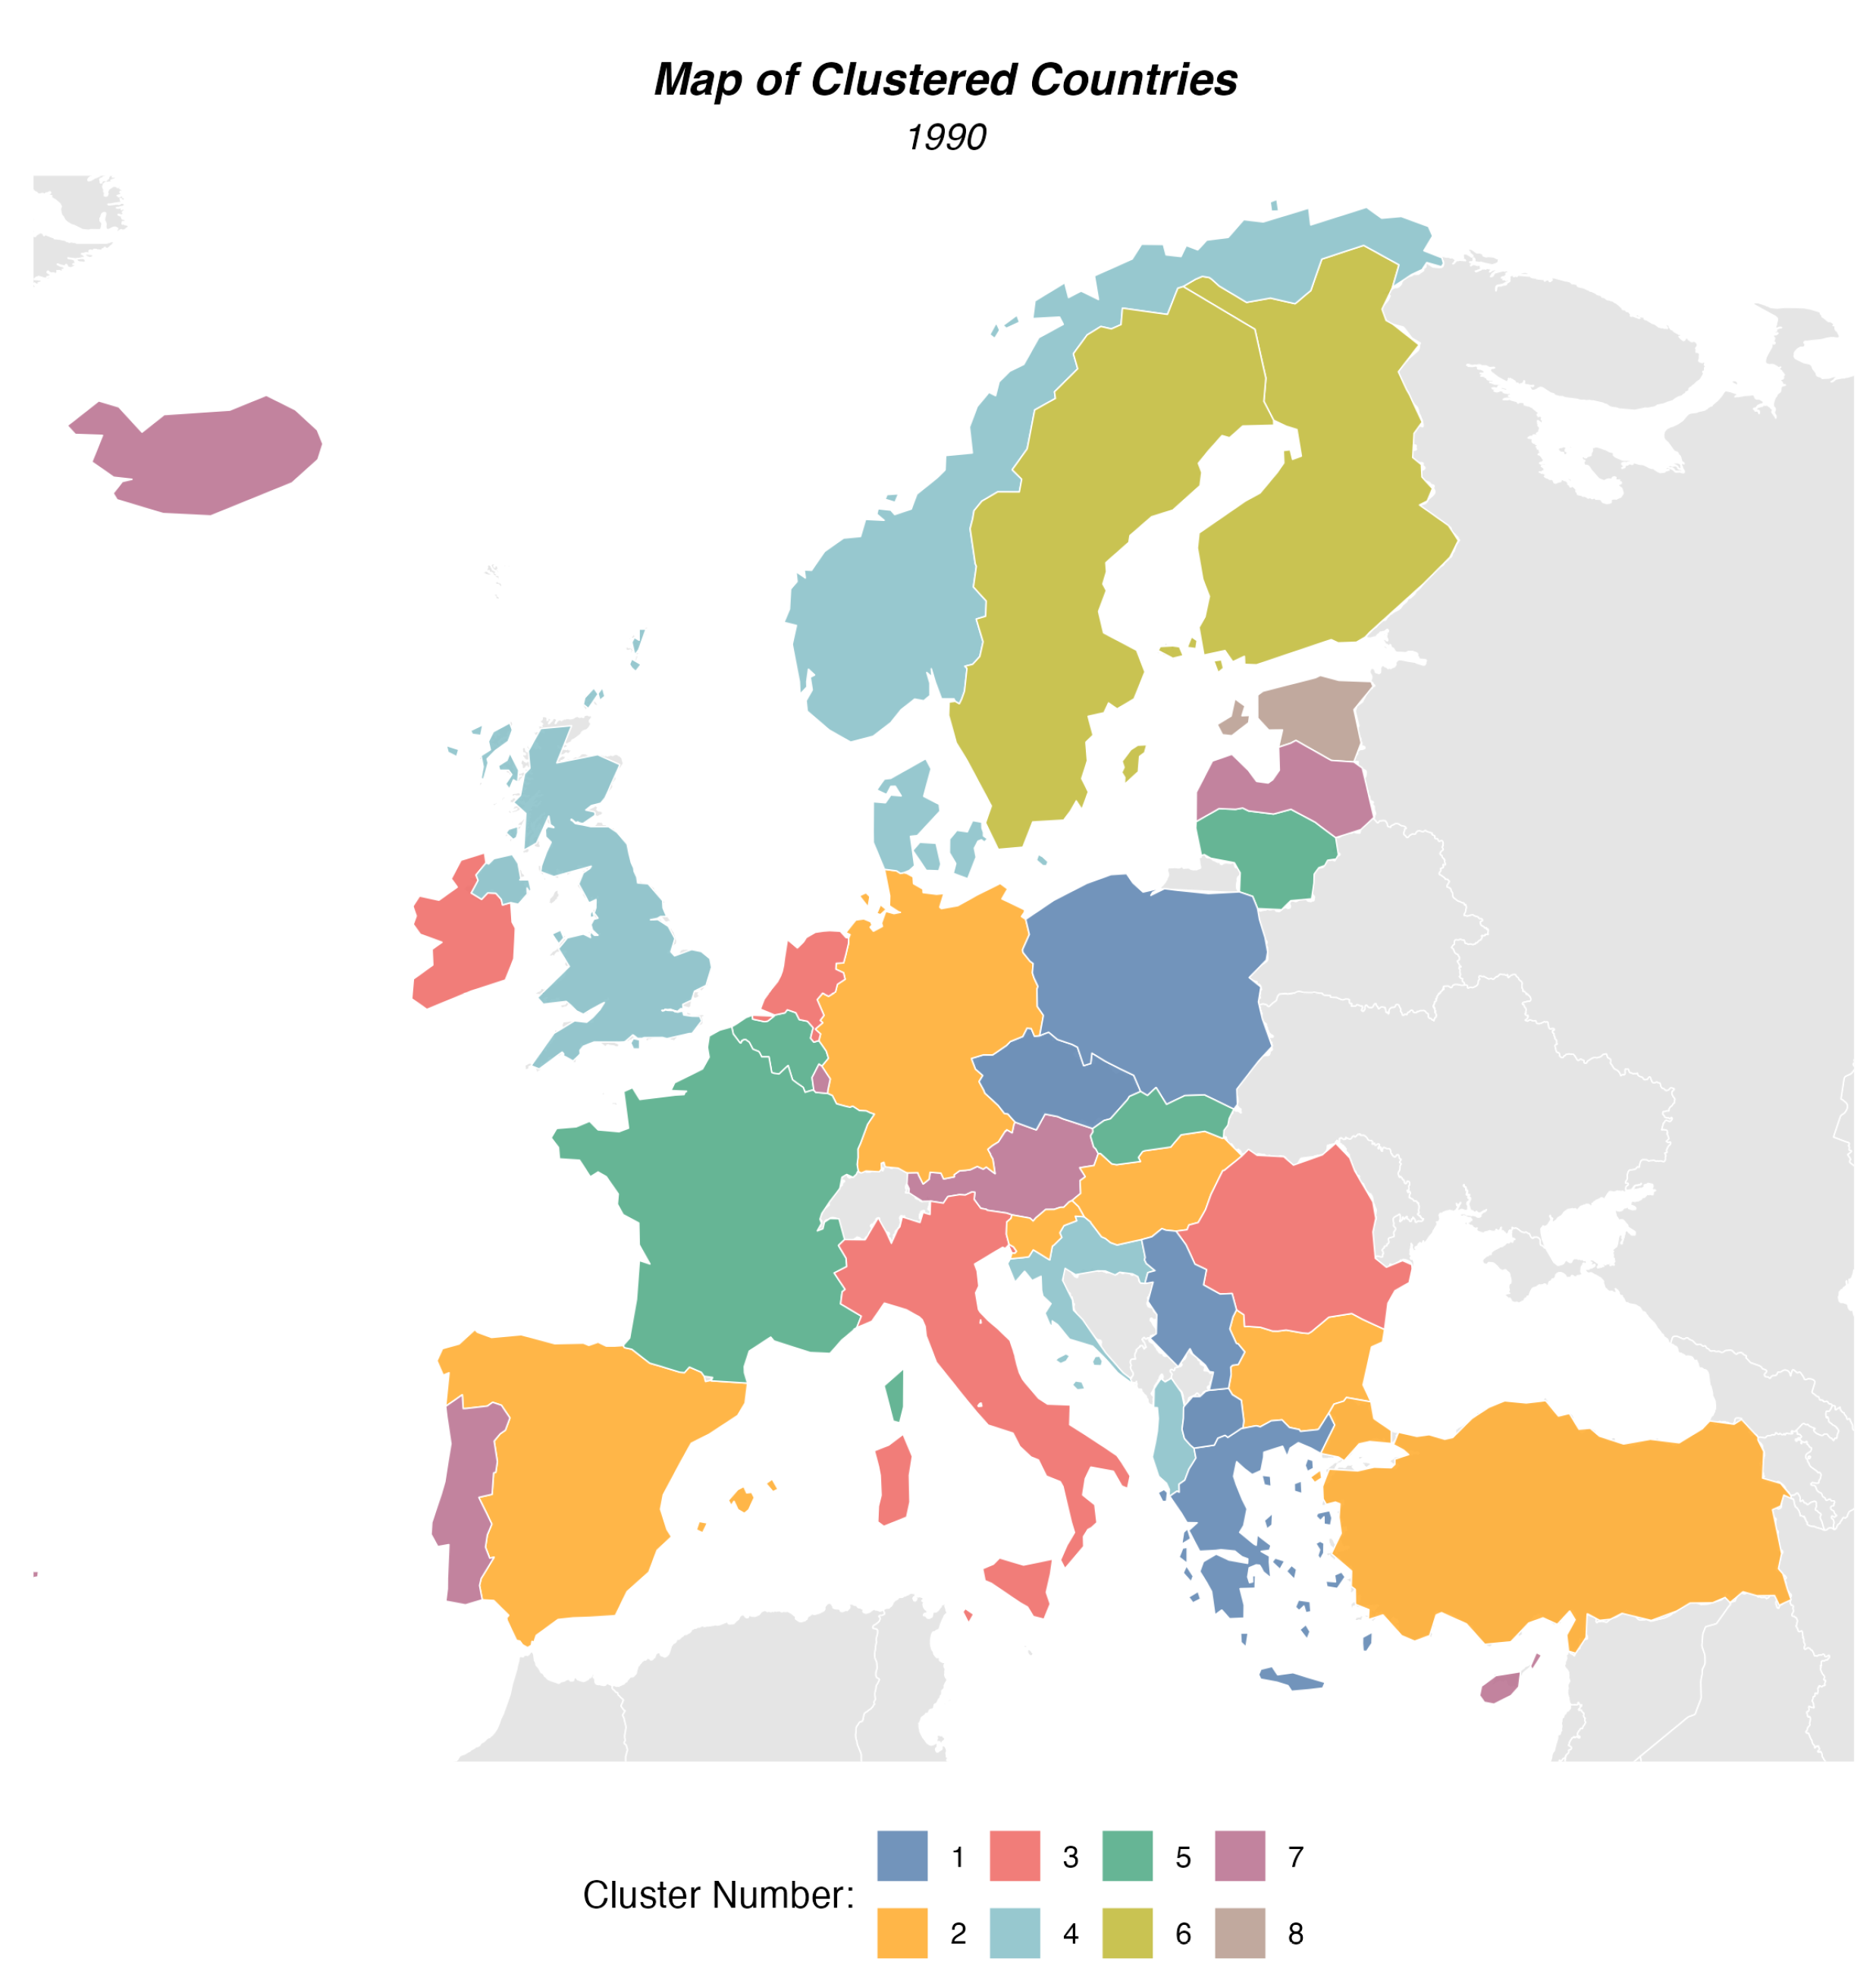
Figure 13.
Optimal Number of Clusters in 2022 According to the Silhouette method.
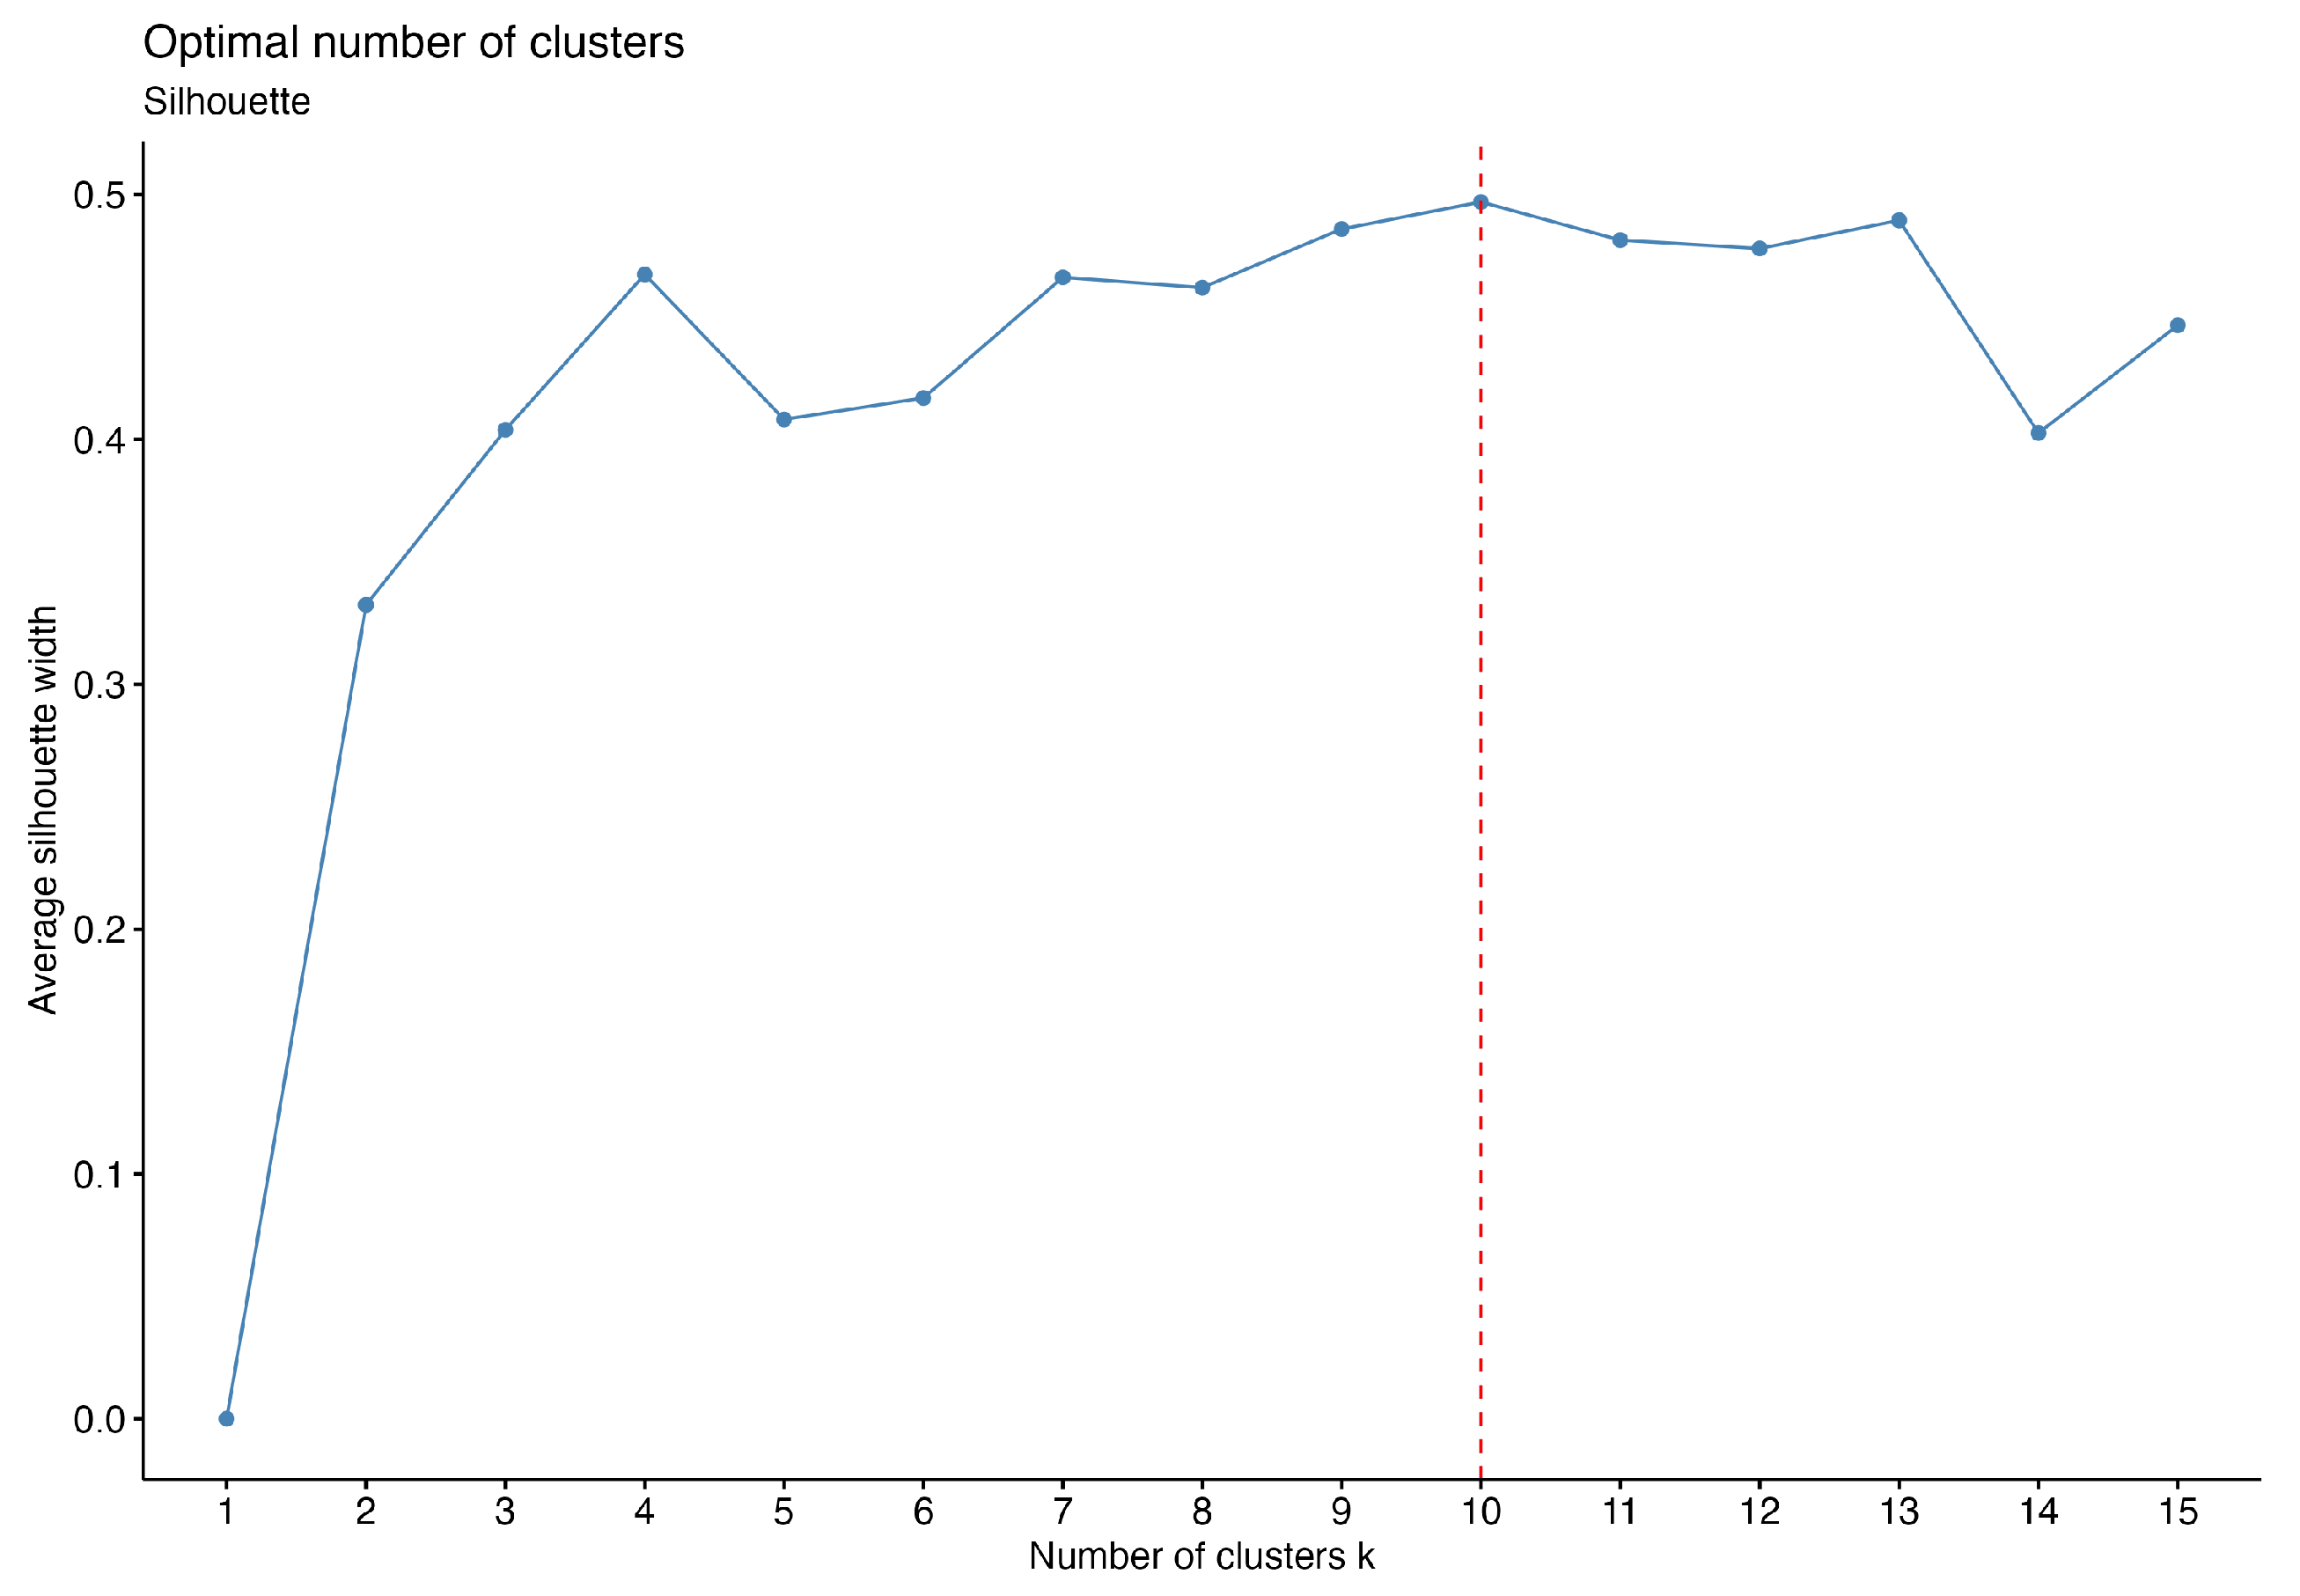
Figure 14.
Average Structure of Primary Energy Production in Clusters for 2022.
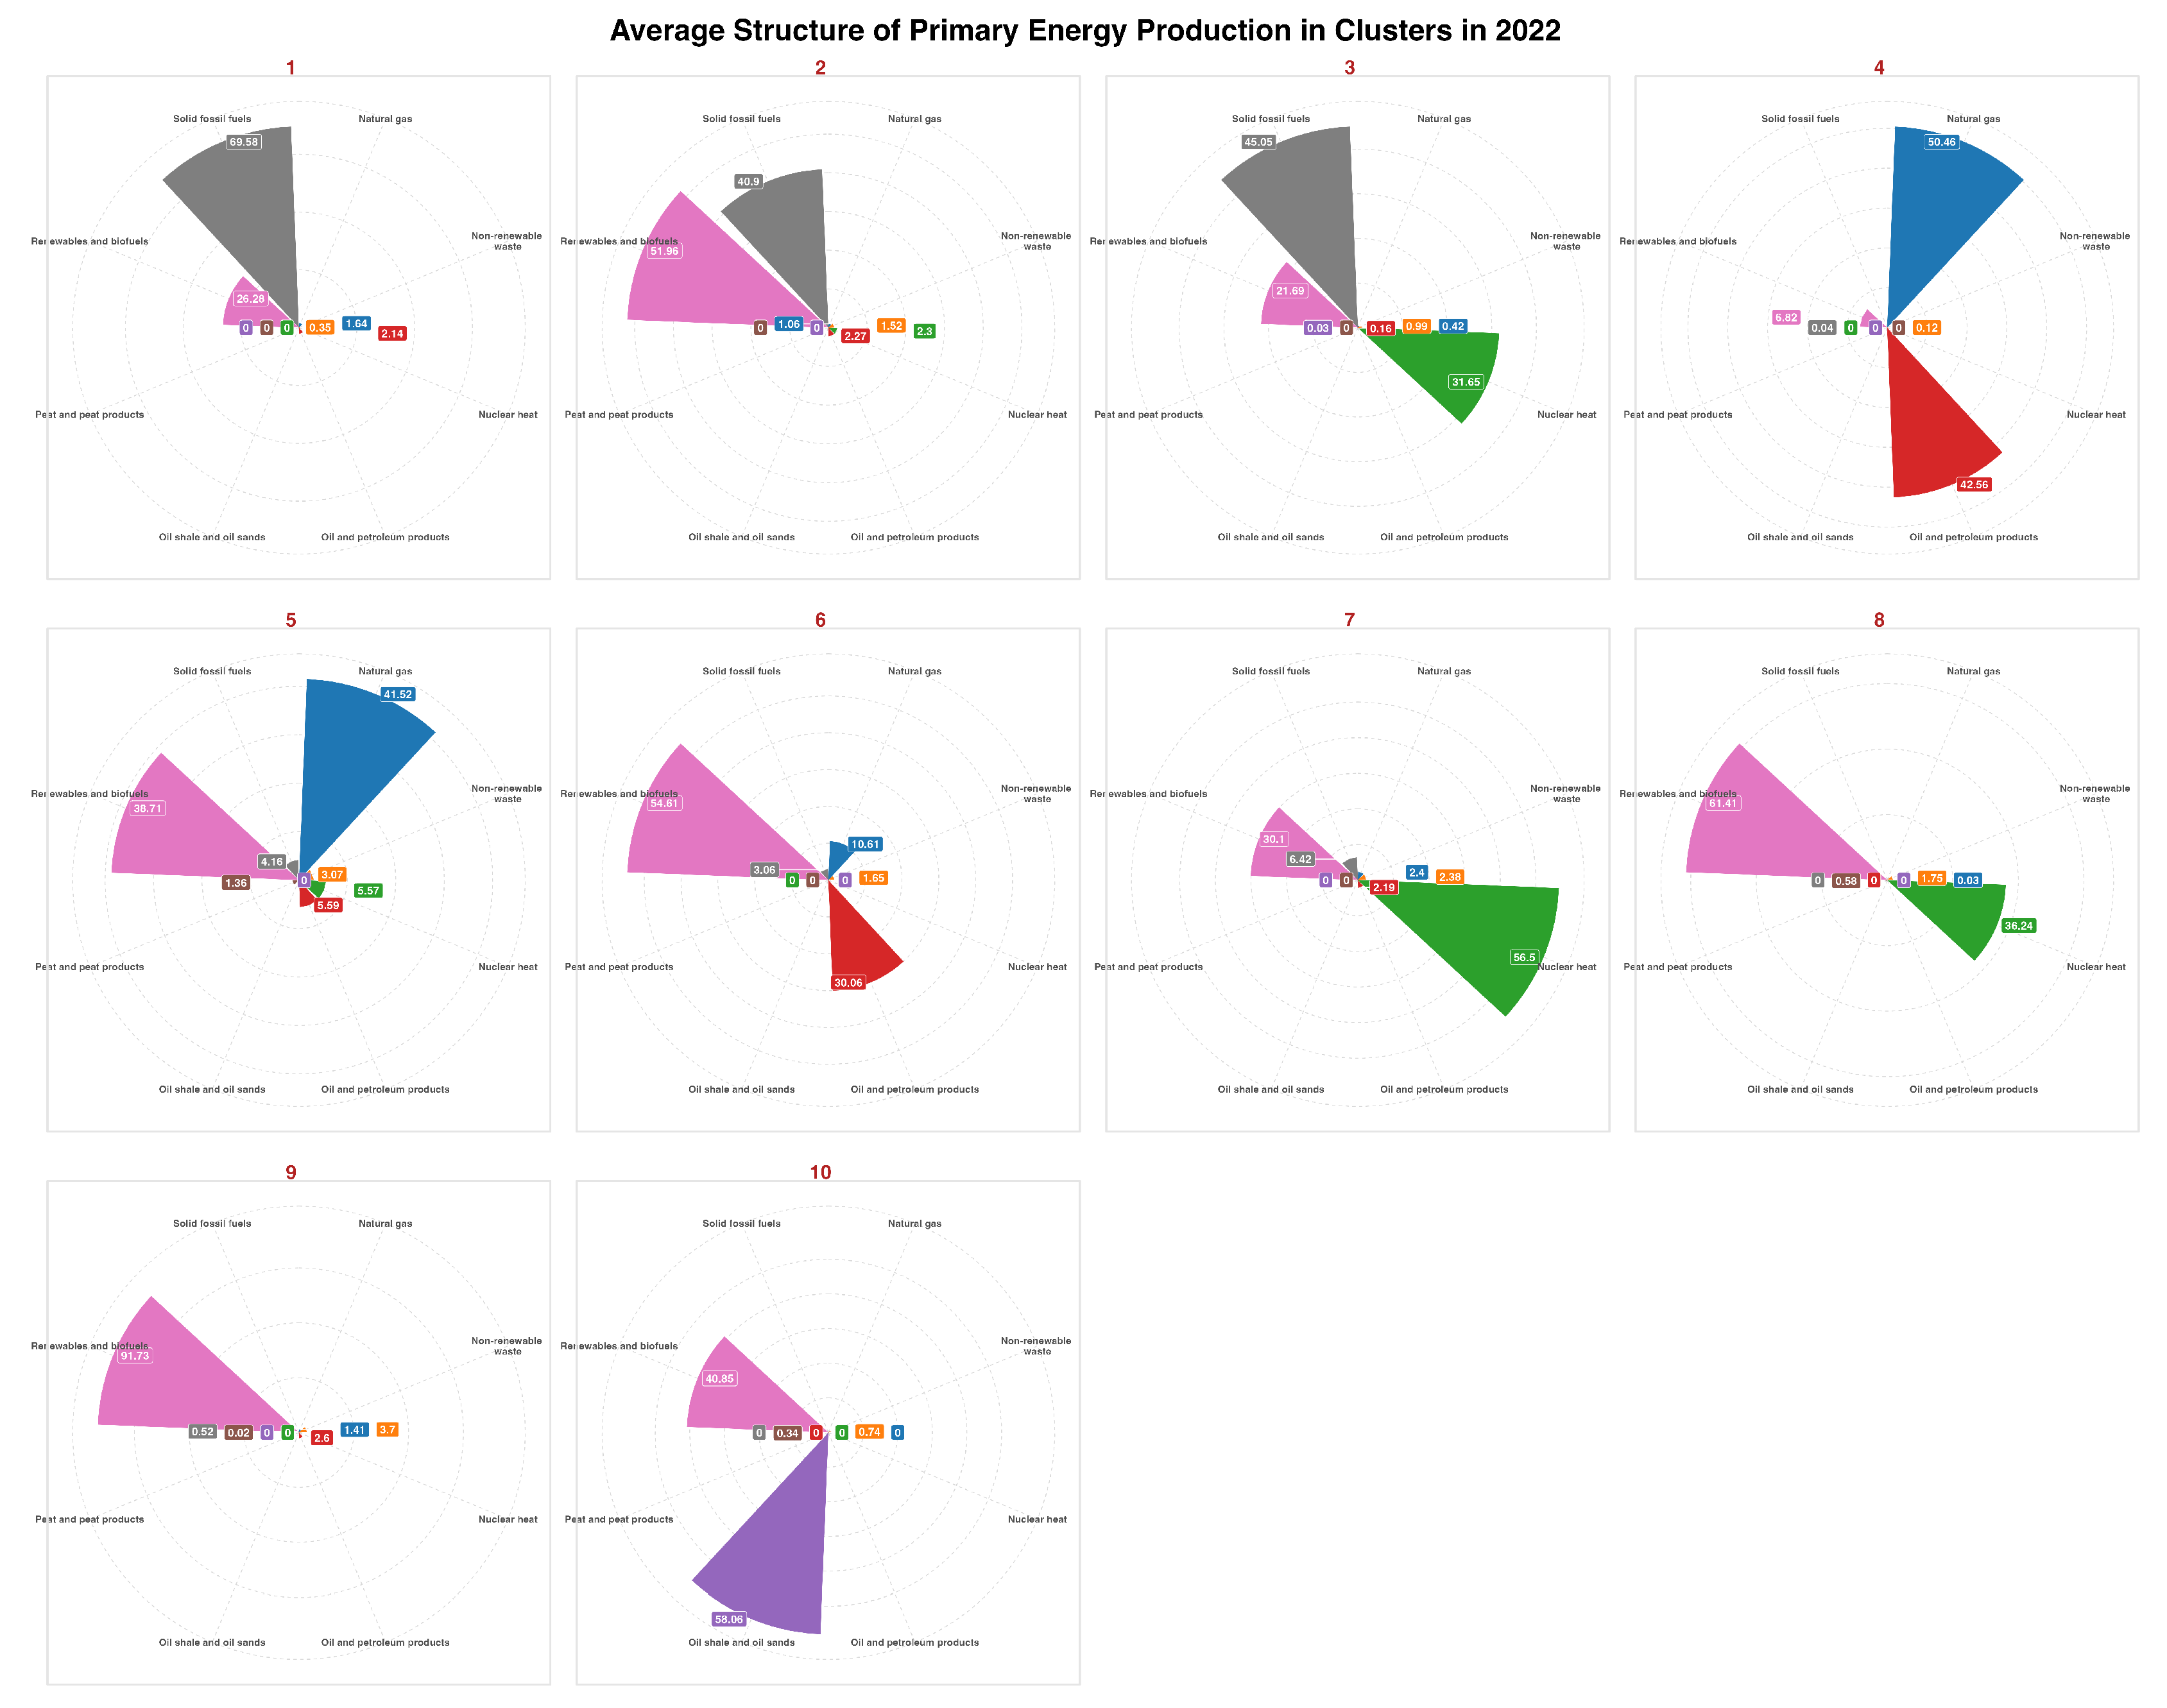
Figure 15.
Map of Clustered Countries in 2022.
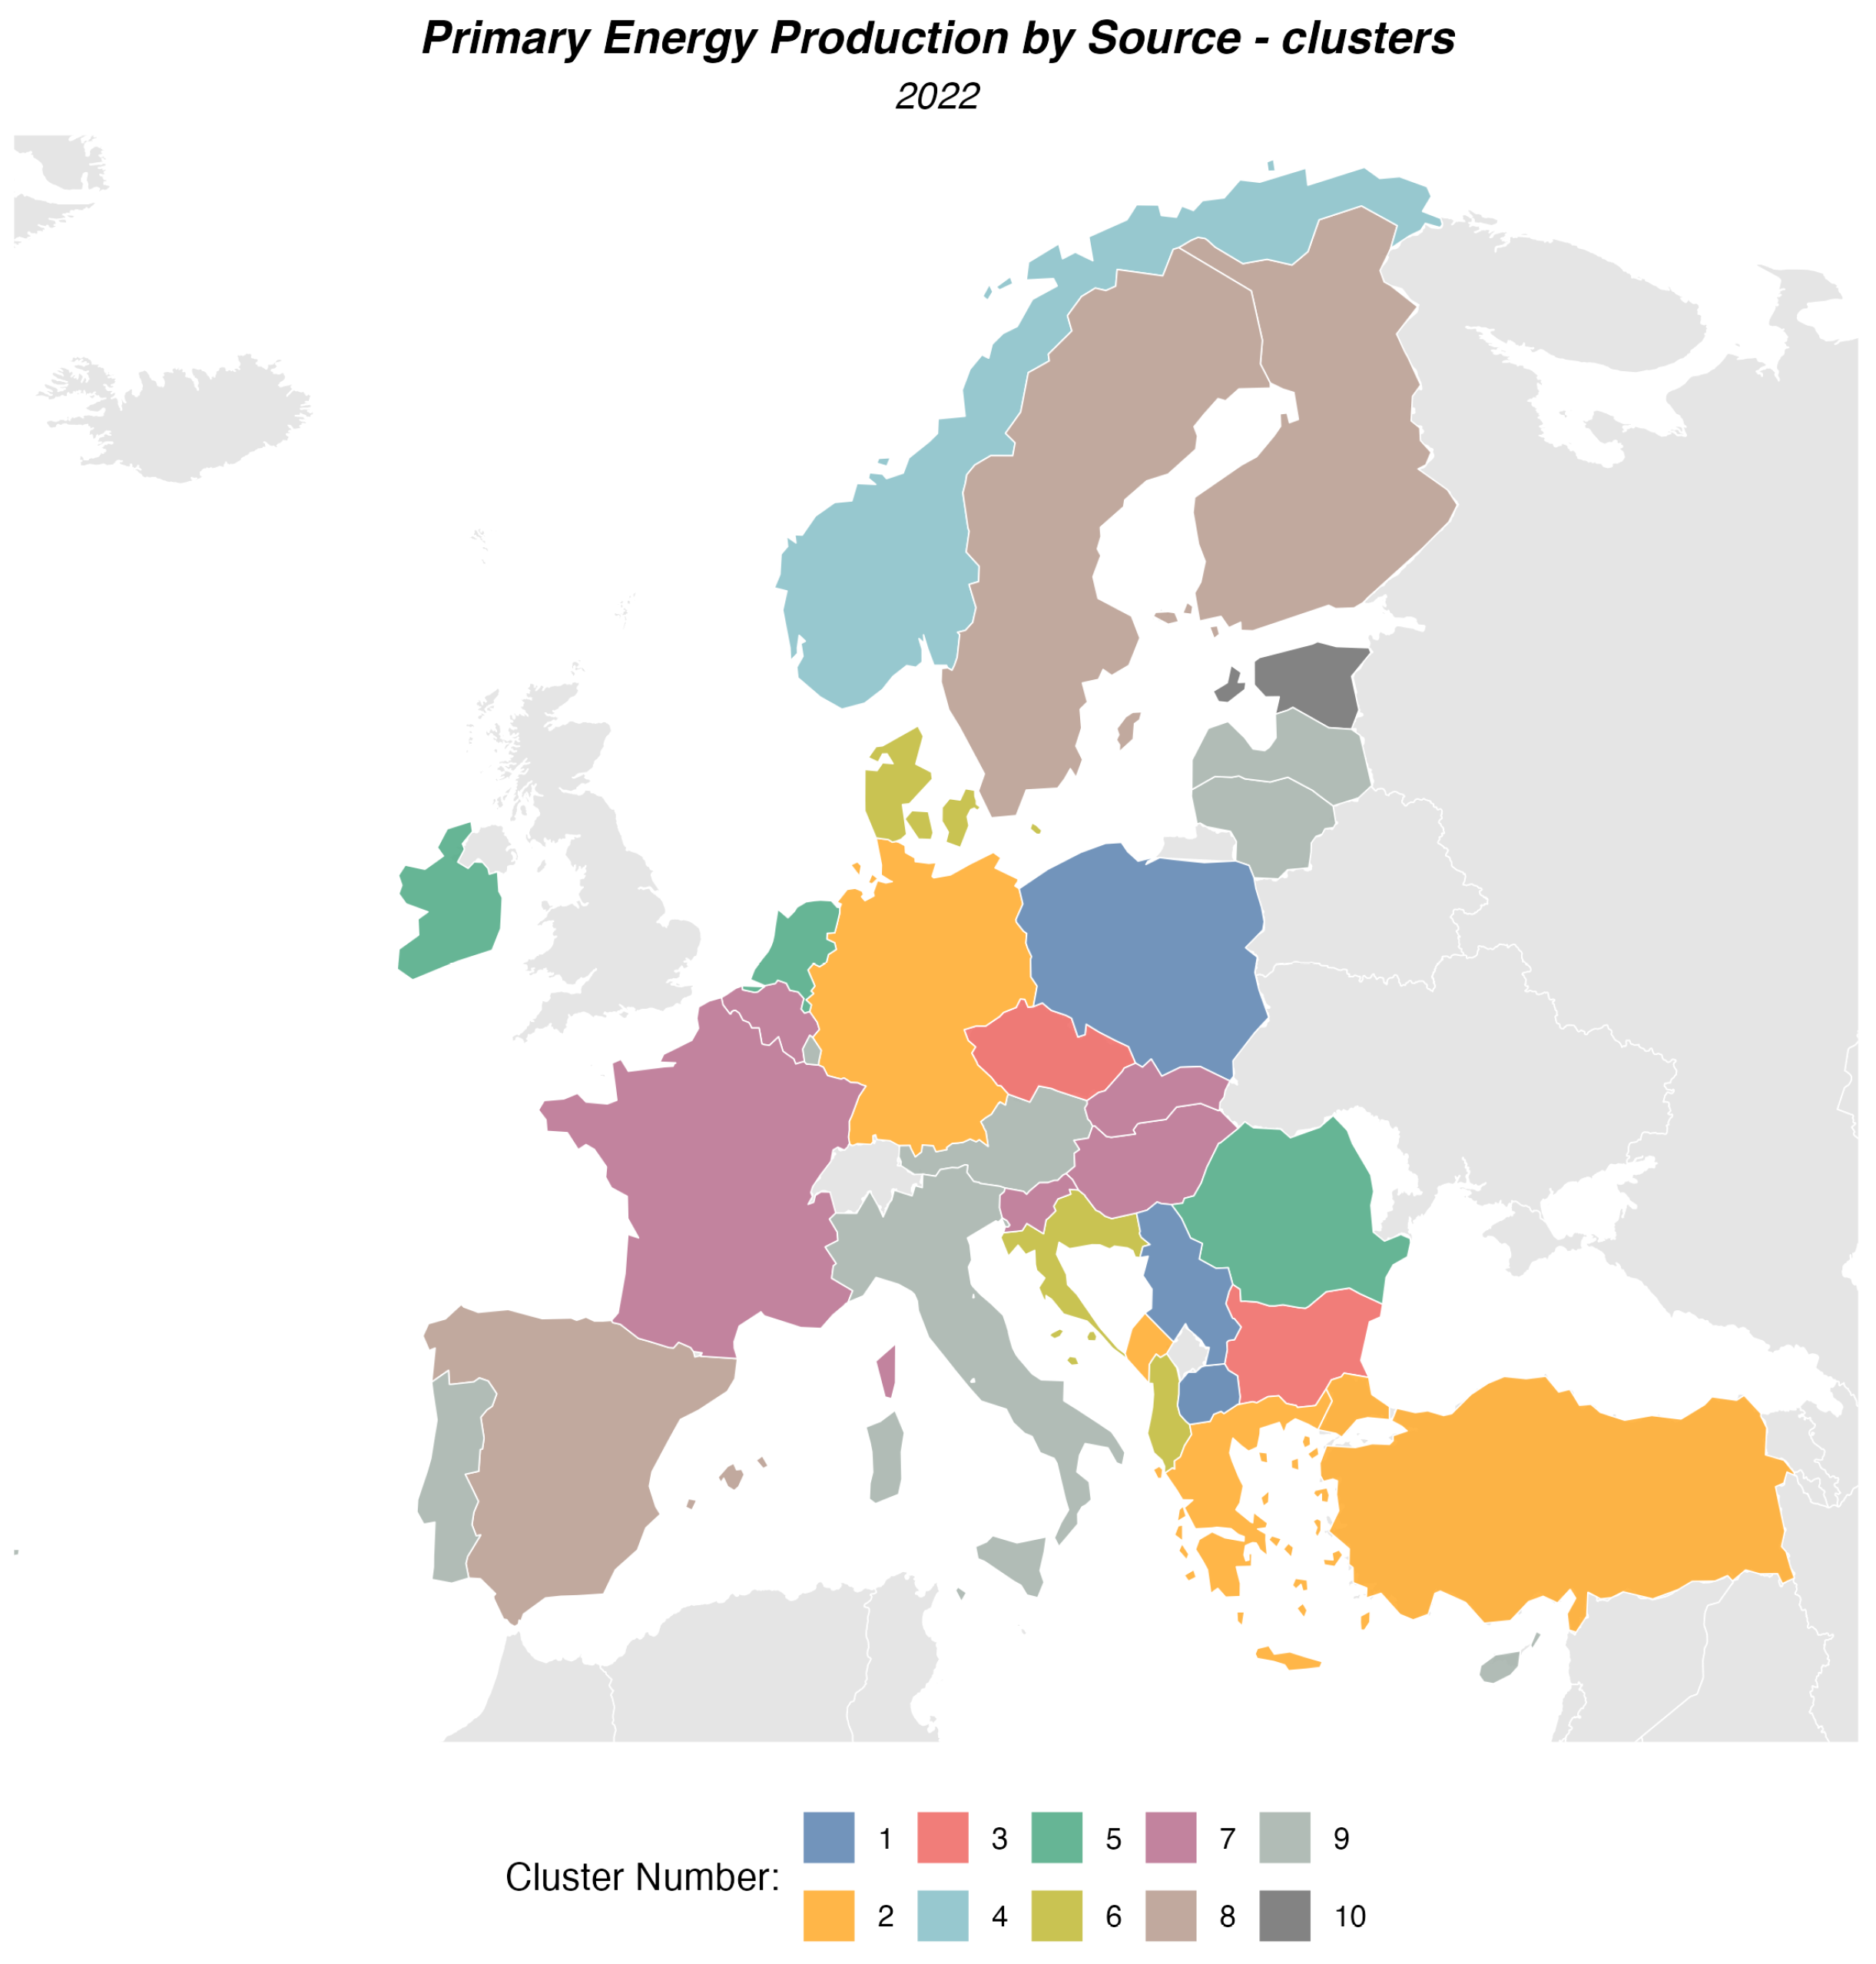

Table 1.
Cluster analysis results for various energy sources and countries in 1990.
| Cluster | Solid Fossil Fuels | Natural Gas | Nuclear Heat | Oil and Petroleum Products | Peat and Peat Products | Renewables and Biofuels | Oil Shale and oil Sands | Non-Renewable Waste | Countries |
|---|---|---|---|---|---|---|---|---|---|
| 1 | 86.49 | 1.63 | 1.58 | 3.54 | 0.00 | 6.60 | 0.00 | 0.15 | Czechia, Greece, North Macedonia, Poland, Serbia |
| 2 | 47.97 | 7.86 | 25.77 | 5.89 | 0.17 | 12.23 | 0.00 | 0.11 | Bulgaria, Germany, Spain, Hungary, Slovenia, Türkiye, Ukraine |
| 3 | 5.45 | 63.91 | 0.37 | 11.05 | 10.18 | 8.79 | 0.00 | 0.26 | Ireland, Italy, Netherlands, Romania |
| 4 | 9.44 | 20.93 | 1.64 | 54.28 | 0.00 | 13.36 | 0.00 | 0.34 | Albania, Denmark, Croatia, Norway, UK |
| 5 | 9.64 | 2.20 | 78.53 | 1.22 | 0.07 | 7.57 | 0.00 | 0.77 | Belgium, France, Lithuania, Slovakia |
| 6 | 0.00 | 0.00 | 50.41 | 0.00 | 7.81 | 41.38 | 0.00 | 0.40 | Finland, Sweden |
| 7 | 1.87 | 2.27 | 0.00 | 2.48 | 0.90 | 85.95 | 0.00 | 6.53 | Austria, Cyprus, Iceland, Luxembourg, Latvia, Portugal |
| 8 | 0.00 | 0.00 | 0.00 | 0.00 | 3.27 | 3.00 | 93.73 | 0.00 | Estonia |
Table 2.
Cluster analysis results for various energy sources and countries.
| Cluster | Solid Fossil Fuels | Natural Gas | Nuclear Heat | Oil and Petroleum Products | Peat and Peat Products | Renewables and Biofuels | Oil Shale and oil Sands | Non-Renewable Waste | Countries |
|---|---|---|---|---|---|---|---|---|---|
| 1 | 69.58 | 1.64 | 0.00 | 2.14 | 0.00 | 26.28 | 0.00 | 0.35 | Bosnia and Herzegovina, North Macedonia, Poland, Serbia, Kosovo |
| 2 | 40.90 | 1.06 | 2.30 | 2.27 | 0.00 | 51.96 | 0.00 | 1.52 | Germany, Greece, Montenegro, Türkiye |
| 3 | 45.05 | 0.42 | 31.65 | 0.16 | 0.00 | 21.69 | 0.03 | 0.99 | Bulgaria, Czechia |
| 4 | 0.04 | 50.46 | 0.00 | 42.56 | 0.00 | 6.82 | 0.00 | 0.12 | Norway |
| 5 | 4.16 | 41.52 | 5.57 | 5.59 | 1.36 | 38.71 | 0.00 | 3.07 | Ireland, Netherlands, Romania |
| 6 | 3.06 | 10.61 | 0.00 | 30.06 | 0.00 | 54.61 | 0.00 | 1.65 | Albania, Denmark, Croatia |
| 7 | 6.42 | 2.40 | 56.50 | 2.19 | 0.00 | 30.10 | 0.00 | 2.38 | Belgium, France, Hungary, Slovenia, Slovakia |
| 8 | 0.00 | 0.33 | 36.24 | 0.00 | 0.58 | 61.41 | 0.00 | 1.75 | Spain, Finland, Sweden |
| 9 | 0.52 | 1.41 | 0.00 | 2.60 | 0.02 | 91.73 | 0.00 | 3.70 | Austria, Cyprus, Georgia, Italy, Lithuania, Luxembourg, Latvia, Moldova, Portugal |
| 10 | 0.00 | 0.00 | 0.00 | 0.00 | 0.00 | 40.85 | 58.06 | 0.74 | Estonia |
Disclaimer/Publisher’s Note: The statements, opinions and data contained in all publications are solely those of the individual author(s) and contributor(s) and not of MDPI and/or the editor(s). MDPI and/or the editor(s) disclaim responsibility for any injury to people or property resulting from any ideas, methods, instructions or products referred to in the content. |
© 2024 by the authors. Licensee MDPI, Basel, Switzerland. This article is an open access article distributed under the terms and conditions of the Creative Commons Attribution (CC BY) license (http://creativecommons.org/licenses/by/4.0/).
Copyright: This open access article is published under a Creative Commons CC BY 4.0 license, which permit the free download, distribution, and reuse, provided that the author and preprint are cited in any reuse.


