
Submitted:
03 October 2024
Posted:
05 October 2024
You are already at the latest version
Abstract
This study investigates the optimal energy mix for industrial complexes by integrating renewable energy systems, decarbonization strategies, and sector coupling technologies, using actual load data from the Balan Industrial Complex in Korea. Five different energy scenarios were analyzed, ranging from a conventional base case (Scenario 1) to progressively more advanced configurations incorporating renewable sources (Scenarios 2 to 5). The findings reveal that Scenario 5, which combines sector coupling, hydrogen-based systems, and decarbonization technologies, is the most cost-effective and environmentally sustainable, achieving the lowest Net Present Cost (NPC) and significantly reducing CO2 emissions. To enhance the study’s relevance, electricity prices and CO2 emission costs from Korea, the United States, and Germany were considered, revealing that regional electricity tariffs and carbon pricing mechanisms greatly influence the economic feasibility of the proposed energy systems. Despite the higher initial investment for renewable-based setups, Scenario 5 proved to be the most economically viable over the long term when factoring in operational costs and emission penalties, underlining the potential for renewable integration to achieve both cost savings and environmental benefits. These results provide valuable insights for policymakers and industry leaders aiming to adopt sustainable, cost-effective energy solutions, highlighting the necessity of tailored strategies to optimize energy systems for industrial applications. This research thus offers a meaningful contribution to the field of sustainable energy transitions, suggesting that sector coupling and renewable integration hold significant promise for enhancing the efficiency and sustainability of energy systems in diverse industrial areas.
Keywords:
Economic Energy Mix
; Industrial Complexes
; Renewable Energy Integration
; Decarbonization strategies
; Sector Coupling
; Sustainable Energy Transitions
; Energy Policy and Economics
1. Introduction
The urgency and significance of achieving carbon neutrality have been highlighted by the increasing visibility of extreme climate phenomena, such as heat and cold waves, resulting from climate change. Carbon neutrality entails balancing greenhouse gas emissions and absorption to reach net-zero emissions. Prioritizing emission reductions in sectors with high greenhouse gas outputs is essential due to their substantial impact. Consequently, decarbonizing the energy sector, which contributes approximately 75% of global greenhouse gas emissions, has become a critical and urgent objective.
Two key strategies are employed to decarbonize the energy sector: improving energy efficiency and demand management to conserve energy, and reducing greenhouse gas emissions during energy use. The latter, known as energy transition, is widely adopted by many countries as an effective means to cut emissions. This has led to various initiatives in both government policies and the private sector. A notable example is the RE100 initiative, where private companies voluntarily commit to increasing their use of renewable energy sources[1].
The RE100 initiative is a global voluntary campaign that aims for companies to use 100% renewable energy for their electricity needs by 2050. This initiative highlights corporate efforts towards carbon neutrality and explores practical ways to increase renewable energy usage. As of April 2024, 428 companies, including major global firms like BMW, Apple, and Google, are participants. In South Korea, participation began with six companies in 2020, growing to 36 by March 2024. However, these Korean companies currently source only 9% of their energy from renewables, significantly lower than the global average[2].
Recently, global manufacturing companies are increasingly transitioning to renewable energy, leading to a steady rise in manufacturing firms joining the RE100 initiative. Customer demand for carbon neutrality, including supply chain requirements, is growing. Consequently, RE100 participants are urging their supply chain partners to adopt renewable energy, making it crucial for export competitiveness. In South Korea, 16.9% of manufacturing and export firms report buyer requests for renewable energy usage, with 41.7% facing immediate pressure to comply. Additionally, 44.7% are required to submit greenhouse gas emission data, necessitating comprehensive responses from exporters[3].
Greenhouse gas (GHG) emissions in South Korea have seen a substantial increase from 1990 to 2017, with a total rise of approximately 143% compared to 1990 levels. The energy sector has been identified as the primary contributor to this growth, encompassing activities such as power and heat generation, commercial operations, residential consumption, industrial energy use, and transport. This sector accounts for the largest share of GHG emissions, emphasizing the significant impact that energy-related activities, particularly within the industrial domain, have had on the country’s overall emissions trajectory. Although there has been a noticeable slowdown in emissions growth since 2013, suggesting some progress in mitigation efforts, the energy sector’s continued dominance in GHG output highlights the urgent need for comprehensive decarbonization strategies. These findings underscore the challenges South Korea faces in achieving sustainable energy transitions and meeting its GHG emission reduction targets, especially within the industrial sector[4].
Domestic industrial complexes account for 53.5% of South Korea’s total energy consumption and 83.1% of the industrial sector’s energy use. This energy consumption heavily relies on fossil fuels, with oil and coal comprising 51.4% and 23.7%, respectively. Consequently, the industrial sector generates 350,486.7 thousand tCO2eq of greenhouse gas emissions, contributing significantly to the country’s overall emissions[5].
To transition to carbon neutrality, many efforts are being made to deploy large-scale renewable energy sources (RES) as power generation sources in industrial complexes. Despite notable progress, achieving this goal remains challenging. Exploring alternative energy sources and innovative solutions to achieve RE100 in industrial complexes is essential to meet current and future demands. Hydrogen emerges as a promising zero-carbon option, offering flexibility as an energy carrier and potential applications across various fields, positioning it as a transformative technology for a sustainable future[6]. Additionally, much research is being conducted on using thermal load controllers (TLC) that cover thermal demand using excessive electricity.
Meanwhile, Germany has pioneered the innovative concept of sector coupling to address the high energy costs, which is now gaining global attention. Sector coupling integrates energy end-use and supply sectors, such as heating, power, and gas, enhancing energy systems’ flexibility, reliability, adequacy, and efficiency. This approach also shows promise in reducing decarbonization costs. Jasmine Ramsebner[7], Gilbert Fridgen[8], and Jianzhnog Wu[9] emphasize the importance of integrating various energy systems and sector coupling to enhance efficiency, reduce carbon emissions, and improve the resilience and flexibility of energy infrastructure. They advocate for a holistic approach that includes the interconnection of energy, transportation, and communication networks to optimize energy flows and support a sustainable energy transition.
The primary aim of this paper is to propose a comprehensive and generic Net-Zero Energy Mix (NZEM) architecture that integrates the electricity, heat, and hydrogen sectors within a single entity to achieve a net-zero energy system. The proposed NZEM will encompass wind energy, solar photovoltaic (PV) panels, Thermal Load Control (TLC), Battery Energy Storage Systems (BESS), and green hydrogen systems including electrolyzers, hydrogen storage tanks, and fuel cells. In addition, this research seeks to determine the economic design of the NZEM for the Balan Industrial Complex, incorporating realistic locational, operational, and economic inputs, as well as techno-economic models of key components such as BESS, TLC, electrolyzers, fuel cells, and renewable energy sources.
As shown in Figure 1, the Balan Industrial Complex is a large-scale industrial area located in the Seoul metropolitan region of Korea (10.9’N, 56.5’E) with approximately 400 companies operating as of the fourth quarter of 2023 [10]. It is also a major industrial complex that primarily deals with chemicals, primary metals, and electronic equipment manufacturing, sectors that are representative of high greenhouse gas emissions in Korea [11]. The complex has a significant demand for electricity and heat energy, making it an ideal candidate to evaluate the potential benefits of optimizing its energy mix. Currently, the Balan Industrial Complex relies heavily on conventional energy sources, with electricity primarily supplied from the national grid and heat energy generated via on-site boilers and diesel generators. This reliance on conventional energy systems results in high carbon emissions and limited efficiency, highlighting the need to explore more sustainable, renewable, and cost-effective energy solutions.
A central aspect of this investigation is the analysis of the combined effects of sector coupling—including electricity, heat, and hydrogen—and decarbonization strategies on the design of the NZEM. Furthermore, a financial feasibility study was conducted by comparing the total CO2 emissions and electricity rates across different scenarios and different countries.
The main contributions of this study are the proposal of a novel, realistic, and forward-looking NZEM architecture that integrates multiple sectors using the sector coupling approach and decarbonization strategies, demonstrating the feasibility of achieving a net-zero energy mix for the Balan industrial complex. Additionally, this research provides a comprehensive policy framework for policymakers, investors, NZEM operators, and planners, offering actionable insights supported by practical case studies to facilitate the transition to a carbon-neutral and economically viable energy system.
The structure of this paper is organized as follows: Section II provides an overview of the NZEM architecture, outlining the integration of various components and their roles within the energy mix system. Section III focuses on system modeling, encompassing the technical specifications and design inputs of each component, along with the methodologies employed for the simulation process. Section IV offers a comprehensive analysis of essential simulation data, including climate conditions, load profiles, specific component attributes, financial parameters, and CO2 emission cost evaluations. Section V delves into the description of scenarios, comparative results analysis, and the re-evaluation of the Levelized Cost of Energy (LCOE), taking into account factors such as CO2 emissions and excess energy. Lastly, Section VI concludes the paper by summarizing the major findings, discussing policy implications, and suggesting recommendations for future research and practical applications.
2. Literature Review
The necessity of the RE100 initiative is driven by the growing recognition of climate change’s impact and the pressing need to transition to renewable energy sources. As Zenghelis and Stern (2016)[12] suggest, the business sector plays a pivotal role in this energy transition, with initiatives like RE100 providing a structured framework for companies to commit to 100% renewable electricity. This commitment not only benefits the environment but also offers long-term economic advantages, particularly by mitigating the risks associated with fossil fuel price volatility and regulatory changes. Furthermore, Jones and Henderson (2019)[13] argue that the RE100 initiative serves as a catalyst for accelerating the renewable energy transition, particularly within energy-intensive industries that contribute significantly to global carbon emissions. Their research highlights that when large corporations commit to RE100, it creates a ripple effect, encouraging smaller businesses and suppliers to adopt similar sustainability goals. This “trickle-down” effect substantially increases renewable energy adoption rates across various sectors, establishing the RE100 initiative as a key driver in meeting global climate targets.
However, achieving RE100 goals requires more than just technological solutions; policy support and collaboration among stakeholders are essential. Jenkins et al. (2018)[14] underscore that government intervention through supportive policies, such as tax incentives and subsidies for renewable energy projects, is crucial for enabling industries to meet RE100 targets. Without such measures, the transition to 100% renewable energy could be delayed, thereby reducing the effectiveness of the RE100 initiative in driving sustainable energy transitions.
In the context of Korean industrial complexes, the pursuit of RE100 goals has gained increasing momentum as part of the nation’s broader efforts to transition toward sustainable energy systems. Ahn et al. (2021)[15] conducted an in-depth study on the feasibility of RE100 implementation within Korean industrial complexes, emphasizing that integrating renewable energy sources such as solar photovoltaic (PV) systems and wind power can significantly reduce dependence on conventional fossil fuels. Their findings suggest that, with the integration of renewable energy technologies, up to 30% of the electricity demand in specific industrial complexes could be met sustainably, highlighting the potential for achieving RE100 in Korea. Similarly, research by Kim and Lee (2020)[16] underscores the importance of adopting energy storage systems (ESS) and smart grid technologies to facilitate RE100 achievement in industrial settings. Their study demonstrated that combining renewable energy generation with advanced ESS can lead to a more stable energy supply and demand management, effectively addressing the intermittency issues commonly associated with renewable sources.
Additionally, Choi et al. (2019)[17] explored the policy implications of implementing RE100 in Korean industrial complexes. They argued that government support through financial incentives, subsidies, and regulatory frameworks is vital for accelerating renewable energy adoption. Their findings indicate that without robust policy measures, industrial players may face difficulties transitioning to renewable energy due to high upfront costs and technological challenges, underscoring the necessity of a combined approach that integrates technological advancements with supportive policy frameworks.
Sector coupling, another promising approach, has been shown to significantly enhance energy efficiency and facilitate the integration of renewable energy sources into the power grid. Hainsch et al. (2020)[18] analyzed Germany’s energy system using real-world data, demonstrating that sector coupling could result in a 35% reduction in CO2 emissions by 2030. Their study highlighted the potential of power-to-heat (P2H) and power-to-gas (P2G) technologies in optimizing energy usage across electricity, heating, and transportation sectors, thereby advancing the transition to a low-carbon energy system. Similarly, Moser et al. (2019)[19] showed that integrating electricity with heating and transport sectors through technologies like heat pumps and electric vehicles (EVs) could reduce overall energy consumption by 20%, further validating the effectiveness of sector coupling in real-world applications.
In addition to empirical studies, model-based analyses have explored the impact of sector coupling on energy systems. For instance, Bloess, Schill, and Zerrahn (2018)[20] employed an energy system model to assess sector coupling effects in a future European energy scenario. They found that by 2050, sector coupling could enable up to a 40% reduction in CO2 emissions and increase renewable energy utilization by integrating electricity, heating, and transport sectors.
The integration of decarbonization strategies with CO2 emission cost considerations has also been a focus of recent research. Bataille et al. (2020)[21] conducted a comprehensive analysis of decarbonization pathways in industrial sectors, emphasizing that carbon pricing is a critical driver for accelerating the adoption of low-carbon technologies. Their study found that applying a CO2 emission cost of $50 per ton could incentivize a 20% reduction in emissions within the industrial sector by promoting investments in renewable energy and energy-efficient technologies. Similarly, Grubb, Hourcade, and Neuhoff (2014)[22] emphasized that incorporating CO2 emission costs into decarbonization strategies encourages carbon-intensive industries to internalize the environmental impact of their operations. They demonstrated that a CO2 cost of $40 to $60 per ton motivates industries to invest in cleaner technologies, resulting in substantial emission reductions and contributing to climate goals.
Further supporting this, Nykvist et al. (2021)[23] employed a model-based approach to analyze the impact of CO2 emission costs on the viability of renewable energy technologies in the energy sector. They found that incorporating a carbon price of $60 per ton significantly increased the economic attractiveness of renewable energy options such as wind and solar power over fossil fuels. Lastly, Fuss et al. (2018)[24] explored the integration of carbon capture, utilization, and storage (CCUS) with renewable energy, concluding that a carbon price exceeding $100 per ton would be necessary to make CCUS economically feasible on a large scale.
In summary, the literature highlights the importance of renewable energy integration, decarbonization strategies, and sector coupling in advancing towards RE100 and net-zero energy systems. Although many studies have employed hypothetical data, there is a clear need for research based on real-world applications, especially in the context of domestic industrial complexes. To the best of the authors’ knowledge, no prior studies have thoroughly examined the implementation of a net-zero energy mix designed for carbon neutrality within a Korean industrial complex using sector coupling and green hydrogen systems. This research, therefore, aims to address this gap by proposing an economical and sustainable energy mix tailored to an actual Korean industrial complex, leveraging sector coupling and green hydrogen technologies to achieve RE100 targets and decarbonization.
3. Methodology
Software tools such as HOMER®, iHOGA®, Hybrid2®, and RETScreen® have been extensively utilized for the simulation and optimization of isolated hybrid energy systems. In this study, HOMER Pro®-3.18.3, developed by the National Renewable Energy Laboratory (NREL) in the United States, has been selected due to its advanced capabilities in modeling and optimizing complex, multi-sector energy systems. HOMER Pro® is particularly well-suited for simulating NZEM architectures, as it allows for the integration of physical and operational characteristics of a wide range of energy components, including renewable energy sources, energy storage systems, and hydrogen technologies. Furthermore, it supports sector coupling—encompassing electricity, heat, and hydrogen—which is essential for the objectives of this research.
A key strength of HOMER Pro® lies in its robust optimization algorithms, which enable the comprehensive evaluation of both the technical and economic performance of various system configurations. This includes the capacity to conduct sensitivity analyses on parameters such as fuel costs, component pricing, and carbon emissions, providing a holistic assessment of the economic feasibility and sustainability of different NZEM scenarios.
Given these advanced features, HOMER Pro® is particularly well-suited to the goals of this research, which seeks to design an economically viable and technically robust NZEM for the Balan industrial complex. The components of the NZEM are modeled with a high degree of precision, allowing for the simulation of real-world conditions and enabling informed decision-making for future NZEM implementations. The components of the NZEM are modeled as follows:
Figure 2 shows a detailed account of modeling various components within the NZEM. The focus is on configuring and specifying diesel generators, solar PV systems, wind turbines, electrolyzers, hydrogen storage, fuel cells, BESS, Power Conversion Systems (PCS), and TLC.
3.1. Power System Architechture
The power system architecture shown in Figure 3 represents the typical energy supply configuration found in many industrial complexes across South Korea. In this system, electrical and thermal loads are managed through a combination of grid electricity and on-site generation. The grid serves as the primary source of electrical power for industrial operations, while the on-site generator supplements the electrical load and provides additional capacity when necessary. Additionally, thermal energy needs are addressed by utilizing excess heat from the on-site generator, which is directed to a boiler for heating purposes. This conventional setup, commonly employed in industrial facilities, relies heavily on fossil fuels for generation and has limited integration of renewable energy sources, leading to both grid dependency and significant carbon emissions. As such, it reflects the need for energy system improvements to enhance sustainability and efficiency within the industrial sector.
Figure 4 represents the optimal configuration for integrating renewable energy technologies with sector coupling and decarbonization efforts, illustrating a comprehensive energy system design. It incorporates wind energy (WD), PV systems, BESS, and fuel cells alongside hydrogen production via electrolyzers. The system seamlessly manages both electric and thermal loads, with the use of TLC enhancing energy efficiency. By connecting AC and DC circuits through a converter, this architecture enables greater flexibility in energy usage and storage. The inclusion of a hydrogen tank allows for long-term energy storage, further decoupling production and demand. This scenario aims to produce the most economical energy mix through a strategic balance of renewable energy sources and advanced technologies, striving to maximize efficiency while minimizing CO2 emissions. The goal of this study is to demonstrate how sector coupling and decarbonization, when combined with renewables, can lead to the most cost-effective and sustainable energy solution.
3.2. Diesel Generators
Diesel generators are essential for backup power and ensuring system reliability. In HOMER Pro®, generators are modeled by specifying their size, fuel type, and cost parameters. The size of the generators is defined by entering the range of generator sizes to be considered in the simulation. Cost parameters include the initial capital cost, replacement cost, and annual operation and maintenance (O&M) costs. The fuel consumption is characterized by input parameters for the fuel curve, which includes the intercept coefficient (no-load fuel consumption divided by rated capacity) and the slope (marginal fuel consumption). Emission factors for pollutants such as carbon dioxide, carbon monoxide, unburned hydrocarbons, particulate matter, and nitrogen oxides are specified to account for environmental impacts. Maintenance intervals, downtime, and associated costs are set to ensure proper upkeep of the generator. Additionally, an operating schedule is defined, which indicates how long the generator should operate, how long it should not operate, and how long this can be determined based on economic considerations.
3.3. Solar PV and Wind Turbines
Renewable energy sources, particularly solar photovoltaic (PV) and wind turbines, play a crucial role in achieving a net-zero energy mix (NZEM). In assessing the performance of these renewable sources, key parameters such as system specifications, including the type of solar PV system (flat panel or concentrating PV systems), maintenance factors, and wind turbine characteristics are considered[27].
The power output of the solar PV array can be estimated using the equation [28]:
where (kW) represents the rated capacity of the PV array, (%) denotes the PV derating factor, (kW/) is the solar radiation incident on the PV array, (kW/) corresponds to the incident radiation under standard test conditions (STC), (%/°C) is the temperature coefficient of power, (°C) signifies the PV cell temperature, and (°C) denotes the PV cell temperature under standard conditions.
The solar PV output is influenced by variations in solar irradiance, temperature, and panel efficiency, which are adjusted for using this equation to provide a more accurate estimation of the energy output under different environmental conditions.
Wind turbine performance is defined by several factors, including power curves, downtime, maintenance tasks, hub height, and cost parameters. The wind speed variation with altitude is crucial in determining wind turbine output, which is calculated using the formula [29]:
In this equation, (m/s) and (m/s) represent wind speeds at the hub height and base height, respectively. (m) and are the respective heights, while (m) indicates the surface roughness length. This relationship is crucial for adjusting wind speed to the hub height, where wind turbines typically operate, to estimate potential power output accurately.
The wind power output (kW) is given by:
(kW) denotes the rated wind turbine power output, is the air density at operational conditions, and is the air density under standard temperature and pressure (1.225 kg/). This equation accounts for changes in air density due to temperature and altitude, which directly affect the energy yield from wind turbines.
Wind turbines stop generating power above the cutoff speed when the wind picks up and also at low wind speeds. The power of wind turbines is obtained by Dufo-Lopez (2008) [30]:
In this equation, is the air density (1.225 kg/), V is the wind speed (m/s), and A is the cross-sectional area of the wind turbine."
3.4. Electrolyzers and Hydrogen Stroage
Electrolyzers and hydrogen storage systems enable the use of hydrogen as a clean energy source. Electrolyzers are specified by their capacity, efficiency, lifetime, minimum load ratio, schedule, and costs. Hydrogen storage systems are defined by the initial tank level, capacities, and associated costs.
3.5. Fuel Cells
Fuel cells, which convert stored hydrogen into electricity, are modeled to enhance system flexibility. The capacity of fuel cells is customizable, with the default HOMER Pro® model being 250 kW. The cost and operational parameters include the capital cost, replacement cost, O&M costs, fuel type, and efficiency.
3.6. Power Conversion Systems (PCS)
PCS is essential for coupling DC and AC elements within the NZEM. The design parameters for PCS include the lifetime, efficiencies for inverter and rectifier modes, capacities, and costs.
3.7. Battery Energy Storage Systems (BESS)
BESS is modeled to store excess energy and provide it during periods of high demand or low generation. The battery models use a modified kinetic storage model representing Li-Ion-type batteries, accounting for temperature dependency, calendar degradation, and cycling lifetime. The design inputs for BESS include the initial state-of-charge (SOC), minimum SOC, and degradation limits. The differential equations governing the maximum power that the BESS can charge and discharge are given in Mohammad Reza Akhtari[31].
3.8. Thermal Load Controllers (TLC)
TLC facilitates the conversion of excess electrical output into thermal energy, thereby enhancing the integration of renewable sources within the energy system. These controllers are typically modeled as electric boilers that handle thermal loads. However, it is important to note that the HOMER Pro software does not support detailed modeling of TLCs; the only adjustable parameters available are costs and losses, which should be carefully considered for optimizing system performance[32].
3.9. Net Present Cost (NPC) and Levelized Cost of Energy (LCOE)
The Net Present Cost (NPC) of a power system represents the total present value of all costs incurred over the system’s entire lifespan, minus the present value of all revenues generated during the same period. These costs encompass capital expenses, replacement costs, operation and maintenance (O&M) expenses, fuel costs, emission penalties, and expenses associated with purchasing power from the grid. On the revenue side, factors such as salvage value and grid sales revenues are included. In the context of this study, HOMER software calculates the overall NPC by aggregating the discounted cash flow for each year of the project’s lifetime[33].
The Levelized Cost of Energy (LCOE) serves as a key metric for evaluating the average cost per kilowatt-hour (kWh) of electricity produced by a power system over its entire operational life. This metric is crucial in assessing the overall cost-effectiveness of energy projects, as it incorporates both capital and operational expenses. HOMER calculates the LCOE by dividing the total annualized cost of electricity generation (after subtracting the portion allocated to serving the thermal load) by the total electrical load served. This calculation is represented by the following equation:
In this equation, ($/yr) denotes the total annualized cost of the power system, while ($/kWh) represents the boiler’s marginal cost. (kWh/yr) refers to the total thermal load served, and (kWh/yr) is the total electrical load served by the system.
The term in the numerator accounts for the portion of the annualized cost attributed to serving the thermal load. In systems where no thermal load is provided (), this term is excluded from the calculation. This approach ensures that the LCOE calculation accurately reflects the capital and operational expenses of the energy system, providing a comprehensive evaluation of its cost-effectiveness [34].
4. System Modelling and Analysis
4.1. Climate Statistics
The Temperature Resource used in this study utilized data provided by NASA Prediction Worldwide Energy Resource (Power), which is the average of monthly average air temperature from January 1984 to December 2013[35]. The monthly average temperature data analysis, as depicted in Figure 5, reveals significant seasonal variations throughout the year. The temperature profile indicates a distinct peak during the summer, with the highest average temperatures occurring in July and August, reaching approximately 24.62°C. The winter months, particularly January and February, exhibit the lowest temperatures, averaging around -2.32°C and -0.46°C, respectively. The annual average temperature is calculated to be 11.36°C, marked by a dashed line on the graph. This data underscores the seasonal temperature fluctuations that can significantly impact energy demand, particularly for heating and cooling, thus influencing the design and operation of energy systems in this region.
The Wind Resource used in this study utilized data provided by NASA Prediction Worldwide Energy Resource (Power), which is the average of the Monthly average wind speed at 50 m above the surface of the earth from January 1984 to December 2013[36]. Figure 6 illustrates the monthly average wind speed data, demonstrating a relatively stable wind profile throughout the year. The wind speeds range from approximately 4.38 m/s in June to 6.17 m/s in January and December, with an annual average wind speed of 5.43 m/s. This consistent wind speed, particularly in the colder months, highlights the potential for wind energy as a reliable renewable resource. The relatively higher wind speeds during the winter months can compensate for the lower solar irradiance, contributing to a balanced renewable energy generation portfolio. The data suggests that wind energy systems could provide a stable and continuous power supply, essential for mitigating seasonal variability in other renewable resources like solar power.
The Solar GHI Resource used in this study utilized the National Solar Radiation data provided by the National Renewable Energy Laboratory Database[37]. Figure 7 presents the monthly average solar Global Horizontal Irradiance (GHI) data, along with the clearness index, which measures the clarity of the atmosphere. The solar radiation peaks during the summer months, particularly in May and June, with daily radiation values reaching up to 5.777 kWh/m²/day. In contrast, the winter months, specifically December and January, experience the lowest solar radiation, averaging around 2.056 kWh/m²/day. The clearness index fluctuates throughout the year, with the highest values in the summer, indicating clearer skies and higher solar energy potential. The annual average radiation is noted as 4.06 kWh/m²/day.
4.2. Load Profiles
Electric loads can be simulated in HOMER Pro® by defining peak month, load profile (residential, commercial, industrial, community, or user-defined), scaling factor, etc. In this work, total daily average electricity demand and peak power data obtained from Korea Electric Power Corporation (KEPCO) are considered. The load profile simulated in this paper for the Balan industrial complex is set as an industrial type. Several studies support the assumption that thermal load constitutes a significant portion of industrial energy demand. Denholm et al. (2022)[38] conducted an analysis of an industrial virtual power plant (IVPP) model, revealing that thermal load accounted for approximately 40% of electrical load in heavy industrial settings. Similarly, Sandberg and Avelin (2020)[39] found a strong correlation between electricity and thermal energy consumption, indicating substantial heat requirements in industrial processes. Given Korea’s heat-intensive sectors such as chemical (33.7%), primary metal (25.4%), and oil refining (22.7%), the thermal load is reasonably assumed to be 50% of the electricity demand in the Balan Industrial Park[40].
In Table 1, the electric load profile shows an average daily consumption of 386,011.92 kWh, translating to an average power demand of 16,083.83 kW. The peak electric load, which occurs during periods of highest demand, reaches 31,465.59 kW. The monthly variations, as illustrated in Figure 8, demonstrate a consistent load pattern with minimal fluctuations, indicating a stable and predictable demand for electricity throughout the year. This stability is beneficial for the efficient planning and operation of the energy system, as it allows for better integration of renewable energy sources and more reliable forecasting of energy needs.
In parallel, the thermal load profile in Figure 9, which has been simplified to represent approximately half of the electric load, displays similar characteristics. Table 1 indicates that the thermal load has an average daily consumption of 193,005.94 kWh, with an average power demand of 8,041.91 kW and a peak demand of 15,732.79 kW.
4.3. Components
Table 2 provides a detailed overview of the technical specifications and operational parameters for the various components included in the energy system under study.
Diesel generators are typically utilized to meet peak electricity demand when photovoltaic (PV) panels are not generating power[41]. In consideration of this function and accounting for a 10% uncertainty in peak load, the minimum operational load ratio for the generator was established at 25%. Additionally, to address the thermal load requirements, a diesel-based boiler is capable of producing thermal energy whenever excess electricity is insufficient.
HOMER software provides a comprehensive library of components with diverse technical input data, which has been widely referenced in numerous studies[42][43]. However, users also have the option to define customized components with specific details. In this research, most of the component data were sourced from the HOMER library, except for certain financial data, which will be presented in Table 3.
Table 3 provides a comprehensive breakdown of the capital, replacement, and operational costs associated with various components of the energy system. Additionally, it outlines the expected lifetime of each. In addition, in order to improve the reliability of this study and reflect the latest component prices, it was written based on price data from each component catalog, market price, and related papers published after 2023.
4.4. Financial Statistics
Table 4 outlines the key financial parameters utilized in the economic analysis of the energy system. These factors are critical for evaluating the long-term financial viability and cost-effectiveness of the project. The project lifetime is set at 20 years, providing a time horizon for assessing the costs and benefits associated with the system’s components and operations. An inflation rate of 3% is applied, accounting for the expected rise in costs over the project’s duration due to economic conditions. The discount rate, set at 6%, reflects the time value of money and the risk associated with the investment, impacting the present value of future cash flows. The diesel price is assumed to be $1.19 per liter, while the hydrogen price is set at $1.58 per liter. Diesel and hydrogen prices were modeled based on 2024 price data for Korea, sourced from Global Petrol Prices[51].
4.5. Emission Costs
Using diesel fuel, in generators and boilers, means that there would be pollutants such as carbon monoxide, unburned hydrocarbons, and nitrogen oxides. HOMER Pro determines the emissions factor for each pollutant. After the simulation, the annual emissions of that pollutant are calculated by multiplying the emissions factor by the total annual fuel consumption.
In this research, carbon emission pricing data from the World Bank’s Carbon Price Dashboard[52] for the year 2024 was used, which offers detailed information on emissions trading systems (ETS) and carbon pricing frameworks implemented in different countries. According to the data presented in Table 5, the European Union (EU) has implemented a carbon price of $61.3 per ton of CO2, supported by stringent emission reduction targets and robust market frameworks. Similarly, the United Kingdom (UK) has established a carbon price of $45.06 per ton of CO2, following its post-Brexit ETS alignment. In the United States, there is significant variation in carbon prices across states, with California’s prominent cap-and-trade system setting a cost of $38.59 per ton. Japan, one of the leading Asian nations in carbon pricing, has set a rate of $36.91 per ton of CO2. Meanwhile, South Korea’s ETS, though operational, currently features a comparatively low carbon price of $6.3 per ton, reflecting a more conservative approach to carbon market implementation.
4.6. Electricity Price
Table 6 provides a comparative analysis of electricity prices across three key regions: Germany, the United States, and South Korea. The table distinguishes between residential and industrial electricity prices, expressed in USD per kilowatt-hour (kWh). Notably, the electricity price for industrial sectors is significantly lower than that for residential users in all regions. In the case of Germany, the industrial electricity price stands at $0.275/kWh, which is considerably lower than the residential rate of $0.368/kWh. Similarly, the industrial electricity price in the United States is $0.137/kWh, compared to $0.162/kWh for residential consumers. South Korea also reflects this trend, with industrial electricity priced at $0.115/kWh versus $0.131/kWh for residential consumption. As my research focuses heavily on the industrial sector, the industrial electricity prices from this table will serve as critical data inputs for cost analysis in energy mix configurations.
5. Simulation Results Analysis
The models are simulated in HOMER Pro®[56] and Python simulation works. The performances are tested on the net-zero energy mix of the Balan industrial complex. Different scenarios are developed to determine the economic design of the proposed NZEM and to examine the effect of sector-coupling and decarbonization strategy.
5.1. Development of Scenarios
Table 7 provides a comprehensive breakdown of the five energy system scenarios modeled in this study, each representing distinct configurations of energy generation technologies, sector-coupling mechanisms, and decarbonization pathways. These scenarios were developed to evaluate the economic, environmental, and operational implications of different energy system configurations in the context of net-zero energy transition efforts.
Scenario 1 serves as the baseline and represents a traditional energy system that relies on grid-connected electricity (On-Grid) and a boiler (BL) to meet energy demands. This scenario assumes no integration of renewable energy sources, decarbonization strategies, or sector-coupling mechanisms. The electricity rates in this scenario are calculated based on country-specific grid power prices, making it representative of the current industrial energy framework in regions like the EU, the US, and South Korea.
Scenario 2 introduces a significant shift toward renewable energy by incorporating wind turbines, PV panels, and BESS. It also includes a diesel generator (DG) to supplement energy production. However, this scenario does not include decarbonization or sector-coupling strategies. The configuration of Scenario 2 simulates the partial integration of renewable energy technologies without fully transitioning to a low-carbon or sector-coupled system, which serves as an intermediate step toward deeper decarbonization.
Scenario 3 builds upon Scenario 2 by adding sector-coupling technologies, specifically the integration of hydrogen systems and TLC. In this scenario, the diesel generator remains in use alongside renewable energy systems, but there is no inclusion of fuel cells (FC). Sector-coupling in this context refers to the alignment of energy production and consumption across different sectors, such as electricity, heating, and hydrogen, which enables more efficient utilization of renewable energy. This scenario examines the potential benefits of sector-coupling in reducing emissions and enhancing energy system flexibility, though it does not fully achieve a zero-emissions outcome.
Scenario 4 represents a decarbonization-focused configuration. It eliminates the diesel generator and thermal load controllers while introducing fuel cells to the renewable energy mix. This scenario is designed to test the impact of decarbonizing the energy system by completely removing reliance on fossil fuel-based energy generation and moving toward a fully renewable-powered system. The integration of fuel cells facilitates the storage and conversion of renewable energy into electricity, further advancing the decarbonization efforts.
Scenario 5 is the most advanced configuration, combining both decarbonization and sector-coupling strategies. This scenario integrates wind turbines, solar PV, battery storage, hydrogen systems, fuel cells, and thermal load controllers into the energy mix, while entirely eliminating the diesel generator. By incorporating all sectors and focusing on a fully renewable and sector-coupled system, Scenario 5 represents a comprehensive approach to achieving a net-zero energy system. The elimination of the diesel generator underscores the focus on transitioning to clean energy sources, while the inclusion of sector-coupling technologies demonstrates the potential for optimizing energy usage across different sectors, further reducing emissions and enhancing system resilience.
5.2. Effect of Sector Coupling
The comparison between Scenario 2 and Scenario 3, as illustrated in Figure 10, highlights the impact of sector coupling on both the NPC and LCOE. Scenario 2, which integrates renewable energy sources without sector-coupling, results in an NPC of approximately $515 million. In contrast, Scenario 3, which introduces sector-coupling by adding systems such as hydrogen storage and thermal load controllers, increases the NPC to over $580 million. This suggests that while sector coupling can enhance energy system flexibility and sustainability, it also incurs higher upfront capital and operational costs due to the complexity of the integrated systems.
The LCOE comparison further supports this observation. In Scenario 2, the LCOE stands at around $0.176/kWh, while in Scenario 3, the LCOE rises to $0.201/kWh. The higher LCOE in Scenario 3 reflects the additional costs associated with implementing sector-coupling technologies. However, the potential long-term benefits of sector-coupling, such as improved system resilience and more efficient use of renewable energy across sectors, may justify the initial cost increase. This comparison demonstrates the trade-off between investment in more advanced energy configurations and their corresponding economic outcomes.
Table 8 presents a detailed analysis of the impact of thermal load control (TLC) across five scenarios, examining the distribution of thermal load, boiler consumption, diesel generation, fuel cell usage, and excess thermal energy production. In Scenario 1, the full thermal demand of 71,038 MWh/year is met entirely by the boiler, with no TLC integration, resulting in zero excess thermal energy. Similarly, in Scenario 2, all thermal load is supplied by the boiler, with no other energy sources involved and no excess thermal energy produced. Scenario 3 introduces TLC, which supplies 21,192 MWh/year, reducing the boiler’s contribution to 32,518 MWh/year and supplementing it with 25,995 MWh/year from diesel generation. This scenario also shows the generation of 8,438 MWh/year of excess thermal energy, indicating a surplus that could potentially be optimized. Scenario 4, while not utilizing TLC, sees a slight reduction in boiler reliance (71,059 MWh/year) and a small contribution from the fuel cell (-20 MWh/year), with no excess thermal energy produced. Finally, Scenario 5 demonstrates the most significant impact of TLC, supplying 145,203 MWh/year, significantly reducing boiler usage to 41,872 MWh/year and generating a substantial 116,037 MWh/year of excess thermal energy. This table underscores the critical role of TLC in reducing boiler dependency and managing energy efficiency, although excess thermal generation remains a key consideration for optimization.
5.3. Effect of Decarbonization
The comparison between Scenario 2 and Scenario 4 in Figure 10 reveals the economic implications of decarbonization strategies. Scenario 2, which includes renewable energy sources such as wind, solar, and battery energy storage without decarbonization, shows an NPC of approximately $515 million. Conversely, Scenario 4, which incorporates decarbonization by eliminating the diesel generator and introducing fuel cells, results in a slightly lower NPC of $509 million. This modest reduction in NPC suggests that decarbonization can be implemented with only a marginal increase in capital and operational efficiency, potentially due to the long-term cost savings from reduced reliance on fossil fuels.
In terms of the LCOE, Scenario 2 shows a value of $0.176/kWh, while Scenario 4 achieves a lower LCOE of $0.173/kWh. The reduction in LCOE demonstrates that decarbonization can lead to a more cost-effective energy system over the long term, as the system transitions to cleaner, renewable energy sources and minimizes the operational costs associated with fossil fuel consumption. This comparison highlights the financial viability of decarbonization, suggesting that it can be achieved without significant cost burdens, while also offering environmental and sustainability benefits.
5.4. Energy Mix Comparison: BAU vs Economic NZEM
Figure 11 and Figure 12 illustrate the total energy production by source in Scenario 1 and Scenario 5, offering a comparison between a conventional energy system and an advanced system with extensive renewable integration and sector coupling. In Scenario 1, the energy production is primarily dominated by grid power (blue), with a significant portion also being met by boiler systems (orange) throughout the year. This reliance on grid and boiler energy reflects a traditional energy system with minimal integration of renewable energy technologies. The monthly production in Scenario 1 remains relatively stable, with grid power consistently providing the majority of the energy supply.
Conversely, Scenario 5 demonstrates a more complex and diversified energy mix, incorporating wind turbines (purple), solar PV (green), thermal load controllers (TLC, red), and a reduced reliance on the boiler system. This scenario shows a substantial shift toward renewable energy, with wind turbines contributing the largest share of energy production each month. The solar PV output, while smaller than wind, also makes a steady contribution throughout the year. The boiler system’s role is significantly diminished in Scenario 5, indicating a transition from fossil fuel reliance. Additionally, the integration of TLC further optimizes energy distribution. This comparison highlights the potential of Scenario 5 to significantly enhance renewable energy penetration, reduce dependency on traditional energy sources, and create a more sustainable and resilient energy system.
Table 9 shows the results obtained for all five scenarios.
Table 9 provides a detailed breakdown of the system capacities for different energy components across the five scenarios. Scenario 1, representing the baseline system, relies entirely on grid power, with a grid capacity of 999,999 kW and no integration of renewable energy sources or other advanced technologies such as BESS, electrolyzers, or TLC.
In Scenario 2, the system transitions to renewable energy sources, incorporating 66,385 kW of PV capacity and 63,000 kW of wind energy. This scenario also includes 246,000 kWh of BESS for energy storage but lacks advanced hydrogen or fuel cell technologies, highlighting a focus on renewable energy without sector coupling or decarbonization.
Scenario 3 introduces a diesel generator with a capacity of 35,000 kW and include es 11,864 kW of PV and 30,000 kW of wind capacity. This scenario also integrates 32,000 kWh of BESS and introduces a 3,000 kW electrolyzer and a 30,000 kW TLC, alongside 18,316 kW of converters and 30,000 kW of fuel cells, demonstrating a system with sector coupling and hybrid energy sources.
In Scenario 4, renewable energy sources are further expanded, with 77,040 kW of PV and 48,000 kW of wind capacity. This scenario also features the largest BESS capacity at 269,000 kWh and introduces a small electrolyzer (250 kW). It eliminates the diesel generator and emphasizes decarbonization through a more extensive reliance on renewables and energy storage.
Finally, Scenario 5 represents the most advanced system, with 75,571 kW of PV, 61,500 kW of wind, and 234,000 kWh of BESS. It also includes a 29,142 kW converter and 150,000 kW TLC, showcasing a system optimized for sector coupling and decarbonization without reliance on diesel generators.
5.5. Effect of CO2 Emissions
Table 10 presents a comparative analysis of CO2 emissions and the associated emission costs across different scenarios, illustrating the environmental and economic impacts of various energy system configurations. In Scenario 1, which relies primarily on conventional energy sources, CO2 emissions reach a high of 112,265 ton per year. As the scenarios progressively incorporate renewable energy technologies, emissions decrease substantially. Scenario 2 reduces emissions to 30,923 ton per year, while Scenario 5, which integrates extensive decarbonization and sector coupling, achieves the lowest emissions at 13,492 ton per year.
Table 10 also outlines the annual CO2 emission costs, calculated according to the carbon pricing schemes in the EU, US, and Korea, highlighting regional differences in carbon pricing. In Scenario 1, the EU bears the highest cost, with emissions priced at $6,881,873 per year, followed by the US at $4,332,325 and Korea at $707,272. As emissions decrease in the later scenarios, so too do the associated costs. For instance, in Scenario 5, the EU’s emission cost falls to $827,110, the US to $520,688, and Korea to $85,005.
5.6. NPC and LCOE comparison reflecting CO2 Emission Cost and Electricity Rates
For Korea, Figure 13 shows a moderate difference between NPC and LCOE when CO2 emission costs are considered. The NPC ranges from $397M to $581M, depending on the scenario, with the inclusion of CO2 costs marginally increasing these figures. The LCOE follows a similar pattern, with values rising from $0.115/kWh to $0.203/kWh when emission costs are factored in. The cost differences indicate the significance of emission pricing in reducing reliance on carbon-intensive energy sources.
In Germany, Figure 14 reveals a more pronounced impact of CO2 emission costs on both NPC and LCOE. Without CO2 costs, the NPC ranges from $515M to $738M, but rises significantly when emission costs are included, particularly in Scenario 1, which shows a sharp increase to $841M. The LCOE is also notably higher in the presence of carbon pricing, with values rising from $0.275/kWh to $0.314/kWh in Scenario 1. This trend highlights Germany’s strong regulatory framework around emissions and its commitment to transitioning towards cleaner energy sources.
In the United States, the impact of CO2 emission costs is more moderate compared to Germany. NPC values increase from $444M to $602M with CO2 costs, reflecting the lower price of carbon in the US. Similarly, LCOE increases from $0.137/kWh to $0.205/kWh across scenarios when emission costs are included in Figure 15.
Comparing the three countries, Germany shows the highest sensitivity to CO2 emission costs, reflecting the country’s ambitious climate policies and higher carbon pricing. Korea, with the lowest CO2 prices, exhibits smaller changes in NPC and LCOE, indicating that emission costs have less impact on the overall energy economics. The US falls between the two, with moderate cost increases driven by regional carbon policies. Overall, these results suggest that countries with stricter emissions regulations and higher carbon prices see more significant financial impacts from carbon pricing mechanisms.
As Table 11 shows, the variation in NPC across the different countries can indeed be attributed to both the inclusion of CO2 emission costs and the differing electricity prices in each region. While CO2 costs are an important factor, the electricity price in each country plays a significant role in shaping the overall NPC results.
For Korea, the relatively low industrial electricity price ($0.115/kWh) helps mitigate the increase in NPC even when CO2 costs are included. In Scenario 1, the NPC increases from $397M to $407M, and in Scenario 5, from $483M to $484M. This modest change is partly due to Korea’s lower electricity rates, which reduce the financial burden associated with higher energy consumption and CO2 emissions. As a result, Korea experiences relatively stable NPC values when transitioning to the optimal energy mix (Scenario 5), indicating that renewable integration is economically favorable in this context.
In contrast, Germany’s significantly higher industrial electricity price ($0.275/kWh) contributes to a more pronounced increase in NPC when CO2 costs are factored in. In Scenario 1, the NPC jumps from $738M to $841M, while in Scenario 5, it increases from $483M to $500M. The higher electricity prices in Germany amplify the cost impact, particularly in scenarios without renewable energy, where fossil fuel reliance leads to greater energy consumption costs. However, even with Germany’s higher electricity prices, Scenario 5 remains economically advantageous compared to Scenario 1, showcasing the financial benefits of a renewable energy-dominated system.
In the US, the industrial electricity price ($0.137/kWh) sits between those of Korea and Germany, resulting in a moderate impact on NPC. In Scenario 1, the NPC rises from $444M to $509M with CO2 costs, while in Scenario 5, it increases from $483M to $494M. Although the increase in NPC is noticeable, it is less drastic than in Germany, reflecting the balance between the US’s relatively moderate electricity prices and CO2 emission costs.
Ultimately, while CO2 costs are a significant factor in the analysis, the varying electricity prices across Korea, Germany, and the US play a crucial role in determining the NPC for each scenario. The lower electricity prices in Korea lead to a more favorable NPC outcome, even with CO2 costs included, while higher prices in Germany emphasize the importance of shifting to renewable energy. The US, with its intermediate electricity costs, demonstrates a balance between the two extremes. This analysis underscores the importance of both energy pricing and CO2 cost considerations in determining the overall economic viability of energy systems, with Scenario 5 consistently offering the most economically sound option across all regions.
6. Discussion
Figure 11 illustrates the Net Present Cost (NPC) and Levelized Cost of Energy (LCOE) for various scenarios in South Korea before accounting for CO2 emission costs. The analysis reveals an interesting outcome: Scenario 5—despite incorporating the most comprehensive mix of renewable energy, sector coupling, and hydrogen-based systems—exhibits a relatively higher NPC and LCOE compared to the baseline Scenario 1. Specifically, the NPC of Scenario 5 is approximately 10–15% greater than that of Scenario 1. This indicates that without the influence of CO2 costs, the additional investments required for renewable energy technologies, hydrogen infrastructure, and sector coupling result in higher initial capital expenditures, which in turn lead to an elevated overall NPC. The substantial upfront costs associated with installing and maintaining these advanced systems appear to outweigh the operational savings, rendering Scenario 5 less economically attractive at this stage.
Similarly, the LCOE for Scenario 5 is higher than that of Scenario 1, suggesting that the cost per unit of energy generated increases with greater integration of renewable energy and sector coupling. This implies that in the absence of CO2 pricing mechanisms, the conventional energy mix in Scenario 1 remains more cost-effective due to lower initial investments and the well-established infrastructure for conventional energy generation. These findings highlight a critical insight: while Scenario 5 offers clear environmental and sustainability benefits, its economic feasibility is less convincing without the incorporation of CO2 costs. This underscores the importance of implementing carbon pricing policies or providing government subsidies to make renewable energy systems financially competitive with conventional energy sources. Without considering CO2 emission costs, there is limited financial incentive for industrial complexes to adopt the more sustainable, yet initially more costly, energy mix presented by Scenario 5. This observation paves the way for further analysis on how the inclusion of CO2 costs and electricity rates can influence the overall economic viability of these energy scenarios.
Table 11 provides a comprehensive comparison of NPC across different scenarios for South Korea, the United States, and Germany, incorporating both CO2 emission costs and the industrial electricity rates outlined in Table 6. The analysis reveals that the combined effect of these factors significantly impacts the economic feasibility of each energy mix, especially when comparing Scenarios 1 and 5. In South Korea, the relatively low industrial electricity rate of $0.115/kWh, coupled with a modest CO2 cost of around $6.3 per ton, makes Scenario 5 increasingly competitive compared to Scenario 1 when both factors are taken into account. Although Scenario 5 initially appeared less economically viable without CO2 costs, the introduction of carbon pricing shifts the balance in its favor, owing to its lower emissions and more efficient use of renewable energy.
In Germany, the effect is even more pronounced. The high industrial electricity rate of $0.275/kWh, along with a CO2 emission cost exceeding $60 per ton, results in a substantial increase in NPC for Scenario 1, which relies predominantly on conventional energy sources. Consequently, Scenario 5 becomes the more economically attractive option, despite its higher initial investment, due to reduced dependence on fossil fuels and a significant decrease in CO2 emissions. This outcome emphasizes that in countries with high electricity rates and carbon pricing, renewable energy integration and sector coupling technologies are crucial for achieving long-term cost savings and sustainability.
The United States, with its moderate industrial electricity rate of $0.137/kWh and a CO2 cost of around $38.59 per ton, exhibits a similar trend where the economic comparison shifts in favor of Scenario 5. The inclusion of CO2 costs diminishes the competitiveness of Scenario 1, while the moderate electricity rate enhances the cost-effectiveness of renewable energy technologies and sector coupling, as seen in Scenario 5. Overall, this analysis demonstrates that both CO2 emission costs and industrial electricity rates significantly influence the NPC and LCOE across different scenarios. The data suggest that when these factors are considered, Scenario 5 emerges as the most economically viable option across all three countries. This underscores the importance of integrating CO2 pricing and electricity tariffs into the evaluation of energy system costs, highlighting the potential for substantial economic benefits from transitioning to renewable energy systems, particularly in regions with high electricity costs or stringent carbon pricing policies.
The findings from this study provide valuable insights into achieving a cost-effective and sustainable energy transition in industrial complexes, particularly when incorporating renewable energy, sector coupling, and decarbonization strategies. The comparative analysis of NPC and LCOE across different scenarios suggests that while transitioning to renewable energy systems may seem less economically favorable without CO2 costs, the inclusion of carbon pricing and electricity rates significantly shifts the economic landscape in favor of more sustainable energy mixes.
For industrial complexes in South Korea, the relatively low electricity rates and modest CO2 emission costs offer an ideal opportunity to transition toward renewable energy systems and sector coupling. Given that Scenario 5 demonstrated notable economic advantages when both CO2 costs and electricity rates were considered, policymakers should leverage this by providing incentives, subsidies, or regulatory support to facilitate the integration of renewable technologies in the industrial sector. Such support could include financial incentives for investments in renewable infrastructure, tax credits for energy-efficient technologies, or subsidies for adopting hydrogen-based systems and energy storage solutions.
In conclusion, this study underscores the necessity of implementing supportive policies and regulatory frameworks to accelerate the shift towards a sustainable energy mix in industrial complexes. Policymakers should consider the unique economic conditions of each country, including electricity rates and CO2 emission costs, to develop tailored strategies that encourage the adoption of renewable energy technologies, sector coupling, and decarbonization initiatives.
7. Conclusion
This study aimed to investigate the optimal energy mix for industrial complexes by integrating renewable energy systems, sector coupling technologies, and decarbonization strategies. Using South Korea’s Balan Industrial Complex as a case study, the research evaluated five different scenarios to determine the most cost-effective and environmentally sustainable energy solution. The analysis incorporated factors such as CO2 emission costs and varying electricity rates from South Korea, the United States, and Germany to assess the financial viability of transitioning to renewable energy.
The results of the study indicate that Scenario 5, which integrates sector coupling, hydrogen-based systems, and a high level of renewable energy penetration, emerges as the most sustainable and economically viable option when CO2 costs and electricity rates are considered. This scenario demonstrated significant reductions in both Net Present Cost (NPC) and CO2 emissions across all evaluated countries, underscoring the potential of renewable energy integration and sector coupling to achieve a sustainable energy transition in industrial settings. However, the analysis also revealed that without the inclusion of CO2 costs, Scenario 1—representing a conventional energy mix—appeared to be more economically favorable, emphasizing the importance of carbon pricing mechanisms in promoting the adoption of cleaner energy technologies.
The comparative analysis across the three countries highlighted that industrial electricity rates and CO2 emission costs play a crucial role in influencing the economic feasibility of different energy scenarios. In regions like South Korea, with relatively low electricity rates and moderate CO2 costs, there is a strong incentive to adopt renewable energy and sector coupling strategies. Conversely, in countries with higher electricity rates and stringent carbon pricing, such as Germany, the transition to renewable energy becomes even more imperative for achieving cost savings and sustainability.
This study contributes to the growing body of knowledge on sustainable energy transitions by demonstrating the economic and environmental benefits of integrating renewable energy, sector coupling, and decarbonization strategies in industrial complexes. The findings suggest that policymakers should consider implementing supportive policies, such as carbon pricing, financial incentives, and subsidies, to facilitate the adoption of these technologies in industrial sectors.
In conclusion, this research provides valuable insights into the potential pathways for achieving a sustainable energy mix in industrial complexes. Future studies should explore the applicability of these strategies in other regions and industries, refine sector coupling models, and consider additional factors such as energy storage and grid integration to further enhance the economic feasibility of renewable energy systems. By addressing these challenges, industrial complexes can move closer to achieving carbon neutrality while maintaining economic competitiveness in the energy market.
Author Contributions
Conceptualization, M.K. and S.P.; methodology, M.K.; software, M.K.; validation, M.K., S.P. and K.C.; formal analysis, M.K.; investigation, M.K.; resources, M.K.; writing—original draft preparation, M.K.; writing—review and editing, M.K.; visualization, M.K.; supervision, S.P. and K.C.; project administration, M.K.; All authors have read and agreed to the published version of the manuscript.
Funding
This research received no external funding.
Data Availability Statement
Data will be available upon request.
Acknowledgments
This research was supported by the 2024 Research Fund of the KEPCO International Nuclear Graduate School (KINGS), the Republic of Korea.
Conflicts of Interest
The authors declare no conflicts of interest.
Abbreviations
The following abbreviations are used in this manuscript:
| AC | Alternating Current |
| BESS | Battery Energy Storage Systems |
| BL | Boiler |
| CO2 | Carbon Dioxide |
| CV | Converter |
| DC | Direct Current |
| DG | Diesel Generator |
| ET | Electrolyzer |
| ETS | Emissions Trading System |
| FC | Fuel Cell |
| GHG | Greenhouse Gas |
| GHI | Global Horizontal Irradiance |
| H2 | Hydrogen |
| HT | Hydrogen Tank |
| LCOE | Levelized Cost of Energy |
| NPC | Net Present Cost |
| NZEM | Net-Zero Energy Mix |
| NREL | National Renewable Energy Laboratory |
| O&M | Operation and Maintenance |
| On-Grid | On-grid-connected electricity |
| PV | Solar Photovoltaic |
| PCS | Power Conversion Systems |
| RES | Renewable Energy Sources |
| SOC | State-of-charge |
| TLC | Thermal Load Controllers |
| WD | Wind Energy (Turbine) |
References
- Soo-min Lee, and Chang-hoon Kim. "A study on the implications of Korea’s energy transition policy through comparative comparison of major countries." Korea Energy Economics Institute Regular Research Report 2021; pp 1-88.
- Hyun-sook Jang, “Current status and challenges of RE100 response by manufacturing export companies” Korea International Trade Association International Trade Research Institute(2024): 1-45.
- Ibid., 1-45.
- Greenhouse Gas Inventory & Research Center of Korea. National Greenhouse Gas Inventory Report of Korea (1990-2017). Seoul: Greenhouse Gas Inventory & Research Center of Korea, 2019. Accessed September 23, 2024. http://www.gir.go.kr/eng/.
- Kang Ho-je, "Basic plan for industrial complex 4.0 in preparation for carbon neutrality and RE100" Korea Research Institute for Human Settlements (2023): 1-16.
- International Energy Agency. Technology Roadmap: Hydrogen and Fuel Cells. Paris: OECD/IEA, 2015.
- Ramsebner, Jasmine, et al. "The sector coupling concept: A critical review." Wiley interdisciplinary reviews: energy and environment 10.4 (2021): e396. [CrossRef]
- Fridgen, Gilbert, et al. "A holistic view on sector coupling." Energy Policy 147 (2020): 111913. [CrossRef]
- Wu, Jianzhnog, et al. "Integrated energy systems." Applied Energy 167 (2016): 155-157.
- Hwasung Industrial Complex Information Center. “Current Status of Industrial Complexes in Hwaseong City.” Accessed June 10, 2024. https://hsidc.hsuco.or.kr/lmth/02_industry/industry01_03.asp#n.
- Korea Energy Agency. 2022 Industry Sector Energy and GHG Emission Statistics. Korea Energy Agency, 2022.
- Zenghelis, D., and N. Stern. “The Importance of the Business Sector in Tackling Climate Change.” Economics of Energy & Environmental Policy 5, no. 1 (2016): 5-27.
- Jones, A., and H. Henderson. “The Ripple Effect: How RE100 is Influencing Global Renewable Energy Adoption.” Energy Policy 134 (2019): 110875.
- Jenkins, J. D., M. Luke, and S. Thernstrom. “Getting to Zero: A U.S. Climate Agenda.” Energy Futures Initiative 25 (2018): 12-39.
- Ahn, J. H., Y. S. Park, and S. H. Kim. “Feasibility Analysis of Renewable Energy Integration in Korean Industrial Complexes for RE100 Achievement.” Journal of Industrial Energy Efficiency 5, no. 2 (2021): 132-145.
- Kim, S. W., and K. J. Lee. “The Role of Energy Storage Systems in Achieving RE100 in Korean Industrial Areas.” Renewable Energy Research 15, no. 3 (2020): 200-213.
- Choi, B. H., J. H. Kim, and S. H. Park. “Policy Measures for Facilitating RE100 in Korean Industrial Complexes.” Energy Policy and Management 12, no. 4 (2019): 355-368.
- Hainsch, K., L. Burandt, T. Löffler, and P. Viebahn. “The Role of Sector Coupling in Future German Energy Scenarios.” Energy Strategy Reviews 30 (2020): 100464.
- Moser, A., T. Harder, and G. Andersson. “Decarbonizing Switzerland’s Energy System: The Role of Sector Coupling Technologies.” Applied Energy 250 (2019): 589-602.
- Bloess, A., W.-P. Schill, and A. Zerrahn. “Power-to-Heat for Renewable Energy Integration: A Review of Flexibility Potentials and Impacts.” Renewable and Sustainable Energy Reviews 82 (2018): 161-172.
- Bataille, C., R. Waisman, M. Colombier, L. Segafredo, J. Williams, and F. Jotzo. “The Need for National Deep Decarbonization Pathways for Effective Climate Policy.” 2018 20, no. 8 (2020): 964-979. [CrossRef]
- Grubb, M., J.-C. Hourcade, and K. Neuhoff. The Economics of the Low Carbon Transition: Pathways to Decarbonization. Cambridge: Cambridge University Press, 2014.
- Nykvist, B., L. Taljegard, and M. Nilsson. “Decarbonizing the Energy System with Carbon Pricing and Renewables Integration.” Energy Policy 152 (2021): 112280.
- Fuss, S., W. F. Lamb, M. W. Callaghan, and J. Minx. “Negative Emissions—Part 2: Costs, Potentials and Side Effects.” Environmental Research Letters 13, no. 6 (2018): 063002. [CrossRef]
- Goyal, Anshul, and Kankar Bhattacharya. "Optimal design of a decarbonized sector-coupled microgrid: electricity-heat-hydrogen-transport sectors." IEEE Access (2024). [CrossRef]
- Ibid.
- Akhtari, Mohammad Reza, and Mehdi Baneshi. "Techno-economic assessment and optimization of a hybrid renewable co-supply of electricity, heat and hydrogen system to enhance performance by recovering excess electricity for a large energy consumer." Energy Conversion and Management 188 (2019): 131-141. [CrossRef]
- Baneshi, Mehdi, and Farhad Hadianfard. "Techno-economic feasibility of hybrid diesel/PV/wind/battery electricity generation systems for non-residential large electricity consumers under southern Iran climate conditions." Energy Conversion and Management 127 (2016): 233-244. [CrossRef]
- Gualtieri, Giovanni, and Sauro Secci. "Methods to extrapolate wind resource to the turbine hub height based on power law: A 1-h wind speed vs. Weibull distribution extrapolation comparison." Renewable Energy 43 (2012): 183-200. [CrossRef]
- Dufo-Lopez, Rodolfo, and José L. Bernal-Agustín. "Multi-objective design of PV–wind–diesel–hydrogen–battery systems." Renewable energy 33, no. 12 (2008): 2559-2572. [CrossRef]
- Akhtari, Mohammad Reza, and Mehdi Baneshi. "Techno-economic assessment and optimization of a hybrid renewable co-supply of electricity, heat and hydrogen system to enhance performance by recovering excess electricity for a large energy consumer." Energy Conversion and Management 188 (2019): 131-141. [CrossRef]
- Ibid., 131-141.
- Net Present Cost.” HOMER Pro Manuals. Accessed September 13, 2024. https://support.ul-renewables.com/homer-manuals-pro/net_present_cost.html.
- Levelized Cost of Energy.” HOMER Pro Manuals. Accessed September 13, 2024. https://support.ul-renewables.com/homer-manuals-pro/levelized_cost_of_energy.html.
- NASA Langley Research Center (LaRC) POWER Project. NASA POWER Data Access Viewer. Accessed [June 18, 2024]. https://power.larc.nasa.gov/data-access-viewer/.
- Ibid.
- National Renewable Energy Laboratory (NREL). National Solar Radiation Database (NSRDB). Accessed June 18, 2024. https://nsrdb.nrel.gov/.
- Denholm, Paul, Wesley Cole, A. Will Frazier, and Yinong Sun. Assessment of the Cost and Performance of Industrial Virtual Power Plants. National Renewable Energy Laboratory (NREL), 2022.
- Sandberg, Elin, and Andreas Avelin. Heat Load Profiles and Implications for Future Heat Networks: Analysis of the Swedish Industry and Tertiary Sector. Energy Research Centre of the Netherlands, 2020.
- Korea Energy Agency. 2022 Industrial Sector Energy Consumption and Greenhouse Gas Emission Statistics. 2022.
- Nfah, E. M., and J. M. Ngundam. "Modelling of wind/Diesel/battery hybrid power systems for far North Cameroon." Energy Conversion and Management 49, no. 6 (2008): 1295-1301. [CrossRef]
- Halabi, Laith M., Saad Mekhilef, Lanre Olatomiwa, and James Hazelton. "Performance analysis of hybrid PV/diesel/battery system using HOMER: A case study Sabah, Malaysia." Energy conversion and management 144 (2017): 322-339. [CrossRef]
- Baneshi, Mehdi, and Farhad Hadianfard. "Techno-economic feasibility of hybrid diesel/PV/wind/battery electricity generation systems for non-residential large electricity consumers under southern Iran climate conditions." Energy Conversion and Management 127 (2016): 233-244. [CrossRef]
- Cole, Wesley, and Akash Karmakar. Cost Projections for Utility-Scale Battery Storage: 2023 Update. Golden, CO: National Renewable Energy Laboratory, 2023. NREL/TP-6A40-85332. Accessed July 26, 2024. https://www.nrel.gov/docs/fy23osti/85332.pdf.
- Eyer, James M., and Garth P. Corey. Cost Projections for Utility-Scale Battery Storage 2023 Update. 2023. Accessed [specific date]. Available: https://www.homerenergy.com/.
- IRENA. Green Hydrogen Cost Reduction: Scaling up Electrolysers to Meet the 1.5°C Climate Goal. International Renewable Energy Agency, Abu Dhabi, 2020. Accessed July 26, 2024. https://www.irena.org/publications.
- Wei, Max, and Garth P. Corey. Reversible Fuel Cell Cost Analysis and Megawatt PEM Cost Analysis for H2 Grid Storage Systems. DOE HFCTO 2022 AMR Poster. Berkeley, CA: Lawrence Berkeley National Laboratory, 2022. Accessed July 26, 2024. https://www.energy.gov/eere/fuelcells/2022-amr-poster.
- Houchins, Cassidy, Jacob H. Prosser, Max Graham, Zachary Watts, and Brian D. James. Hydrogen Storage Cost Analysis. National Renewable Energy Laboratory, 2023. Project ID: ST235, Award No. DE-EE0009630. Accessed July 26, 2024. https://www.hydrogen.energy.gov/pdfs/review22/st235_houchins_2022_p.pdf.
- International Renewable Energy Agency (IRENA). 2023. Renewable Power Generation Costs in 2022. Abu Dhabi: IRENA. ISBN 978-92-9260-544-5. Available at: www.irena.org/publications.
- Stehly, Tyler, Patrick Duffy, and Daniel Mulas Hernando. 2022 Cost of Wind Energy Review. National Renewable Energy Laboratory, 2022. Accessed July 25, 2024. https://www.nrel.gov/docs/fy23osti/81209.pdf.
- Global Petrol Prices. 2024. “Korea Diesel and Hydrogen Price Data.” Accessed [insert date]. https://www.globalpetrolprices.com.
- World Bank. State and Trends of Carbon Pricing 2024. Accessed September 12, 2024. https://carbonpricingdashboard.worldbank.org/.
- Global Petrol Prices. “Germany Electricity Prices, December 2023.” GlobalPetrolPrices.com. Accessed September 12, 2024. https://www.globalpetrolprices.com/Germany/electricity_prices/.
- Global Petrol Prices. “USA Electricity Prices, December 2023.” GlobalPetrolPrices.com. Accessed September 12, 2024. https://www.globalpetrolprices.com/USA/electricity_prices/.
- Global Petrol Prices. “South Korea Electricity Prices, December 2023.” GlobalPetrolPrices.com. Accessed September 12, 2024. https://www.globalpetrolprices.com/South-Korea/electricity_prices/.
- HOMER Energy by UL. Hybrid Renewable and Distributed Generation System Design Software. 2024. Accessed July 26, 2024. https://www.homerenergy.com/.
Figure 1.
Location of Balan Industrial Complex.

Figure 2.
System Architecture of Net-Zero Energy Mix(NZEM).
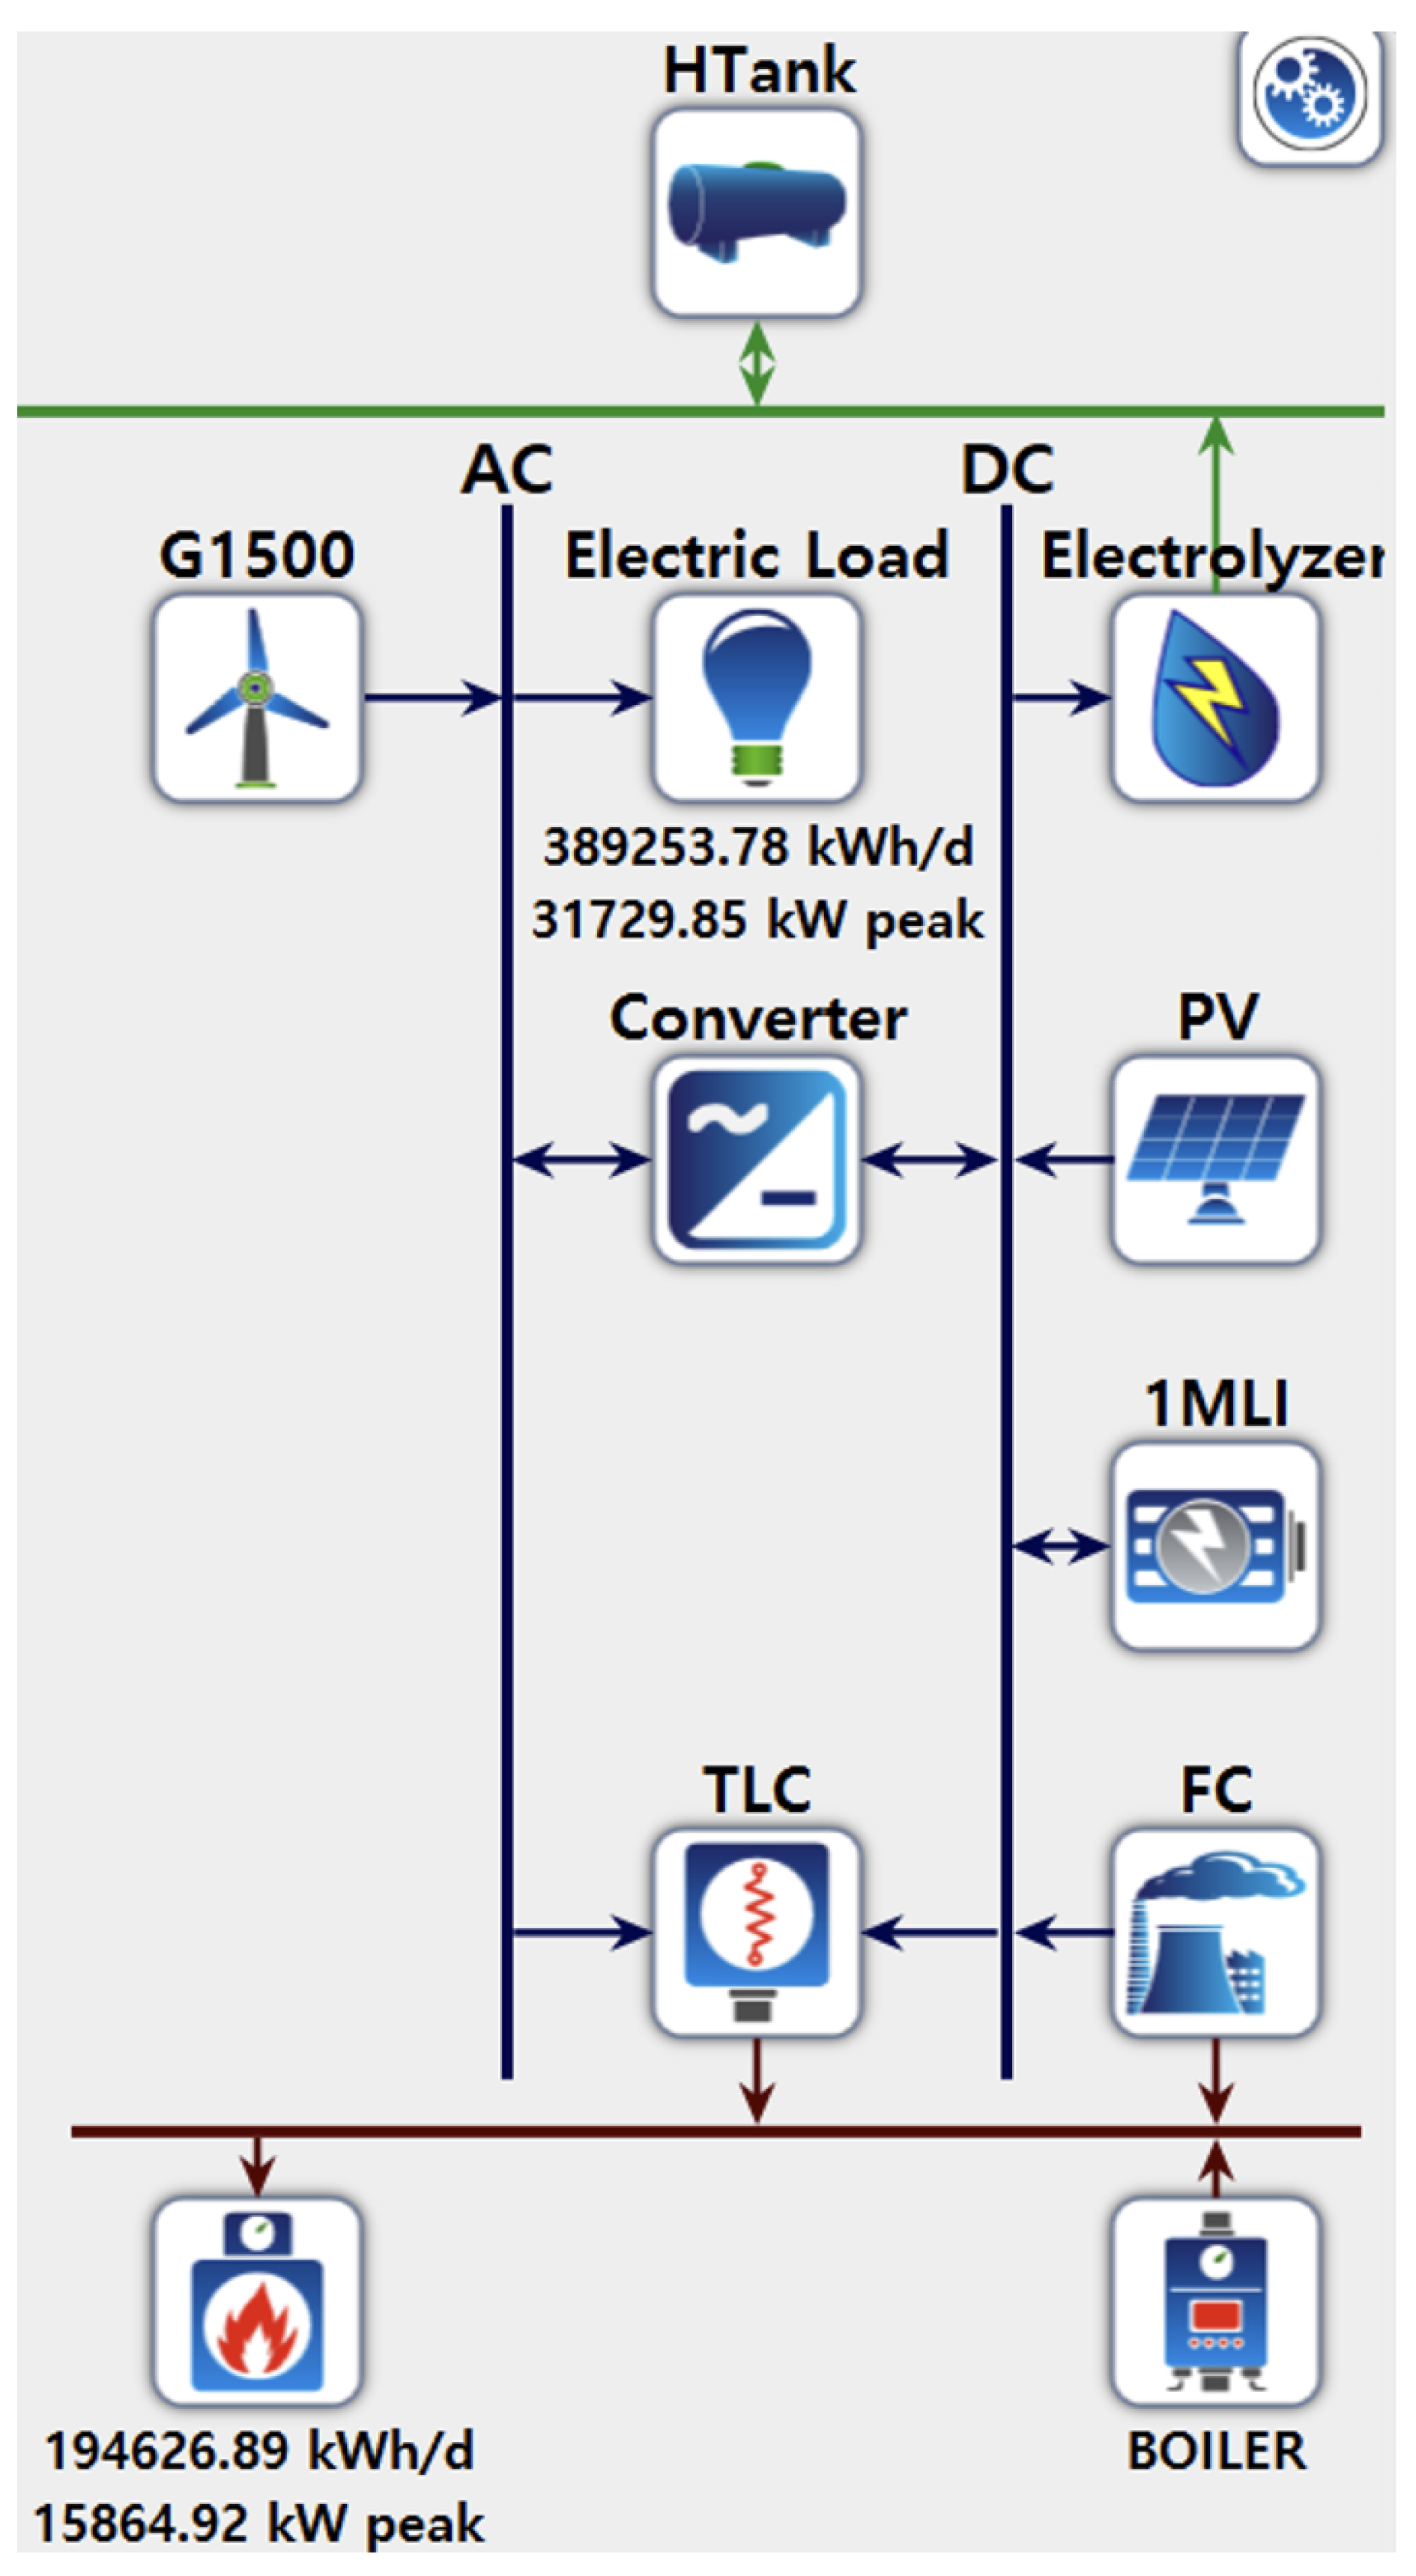
Figure 3.
Conventional Power and Thermal Energy System Configuration in South Korean Industrial Complexes[25].
Figure 3.
Conventional Power and Thermal Energy System Configuration in South Korean Industrial Complexes[25].
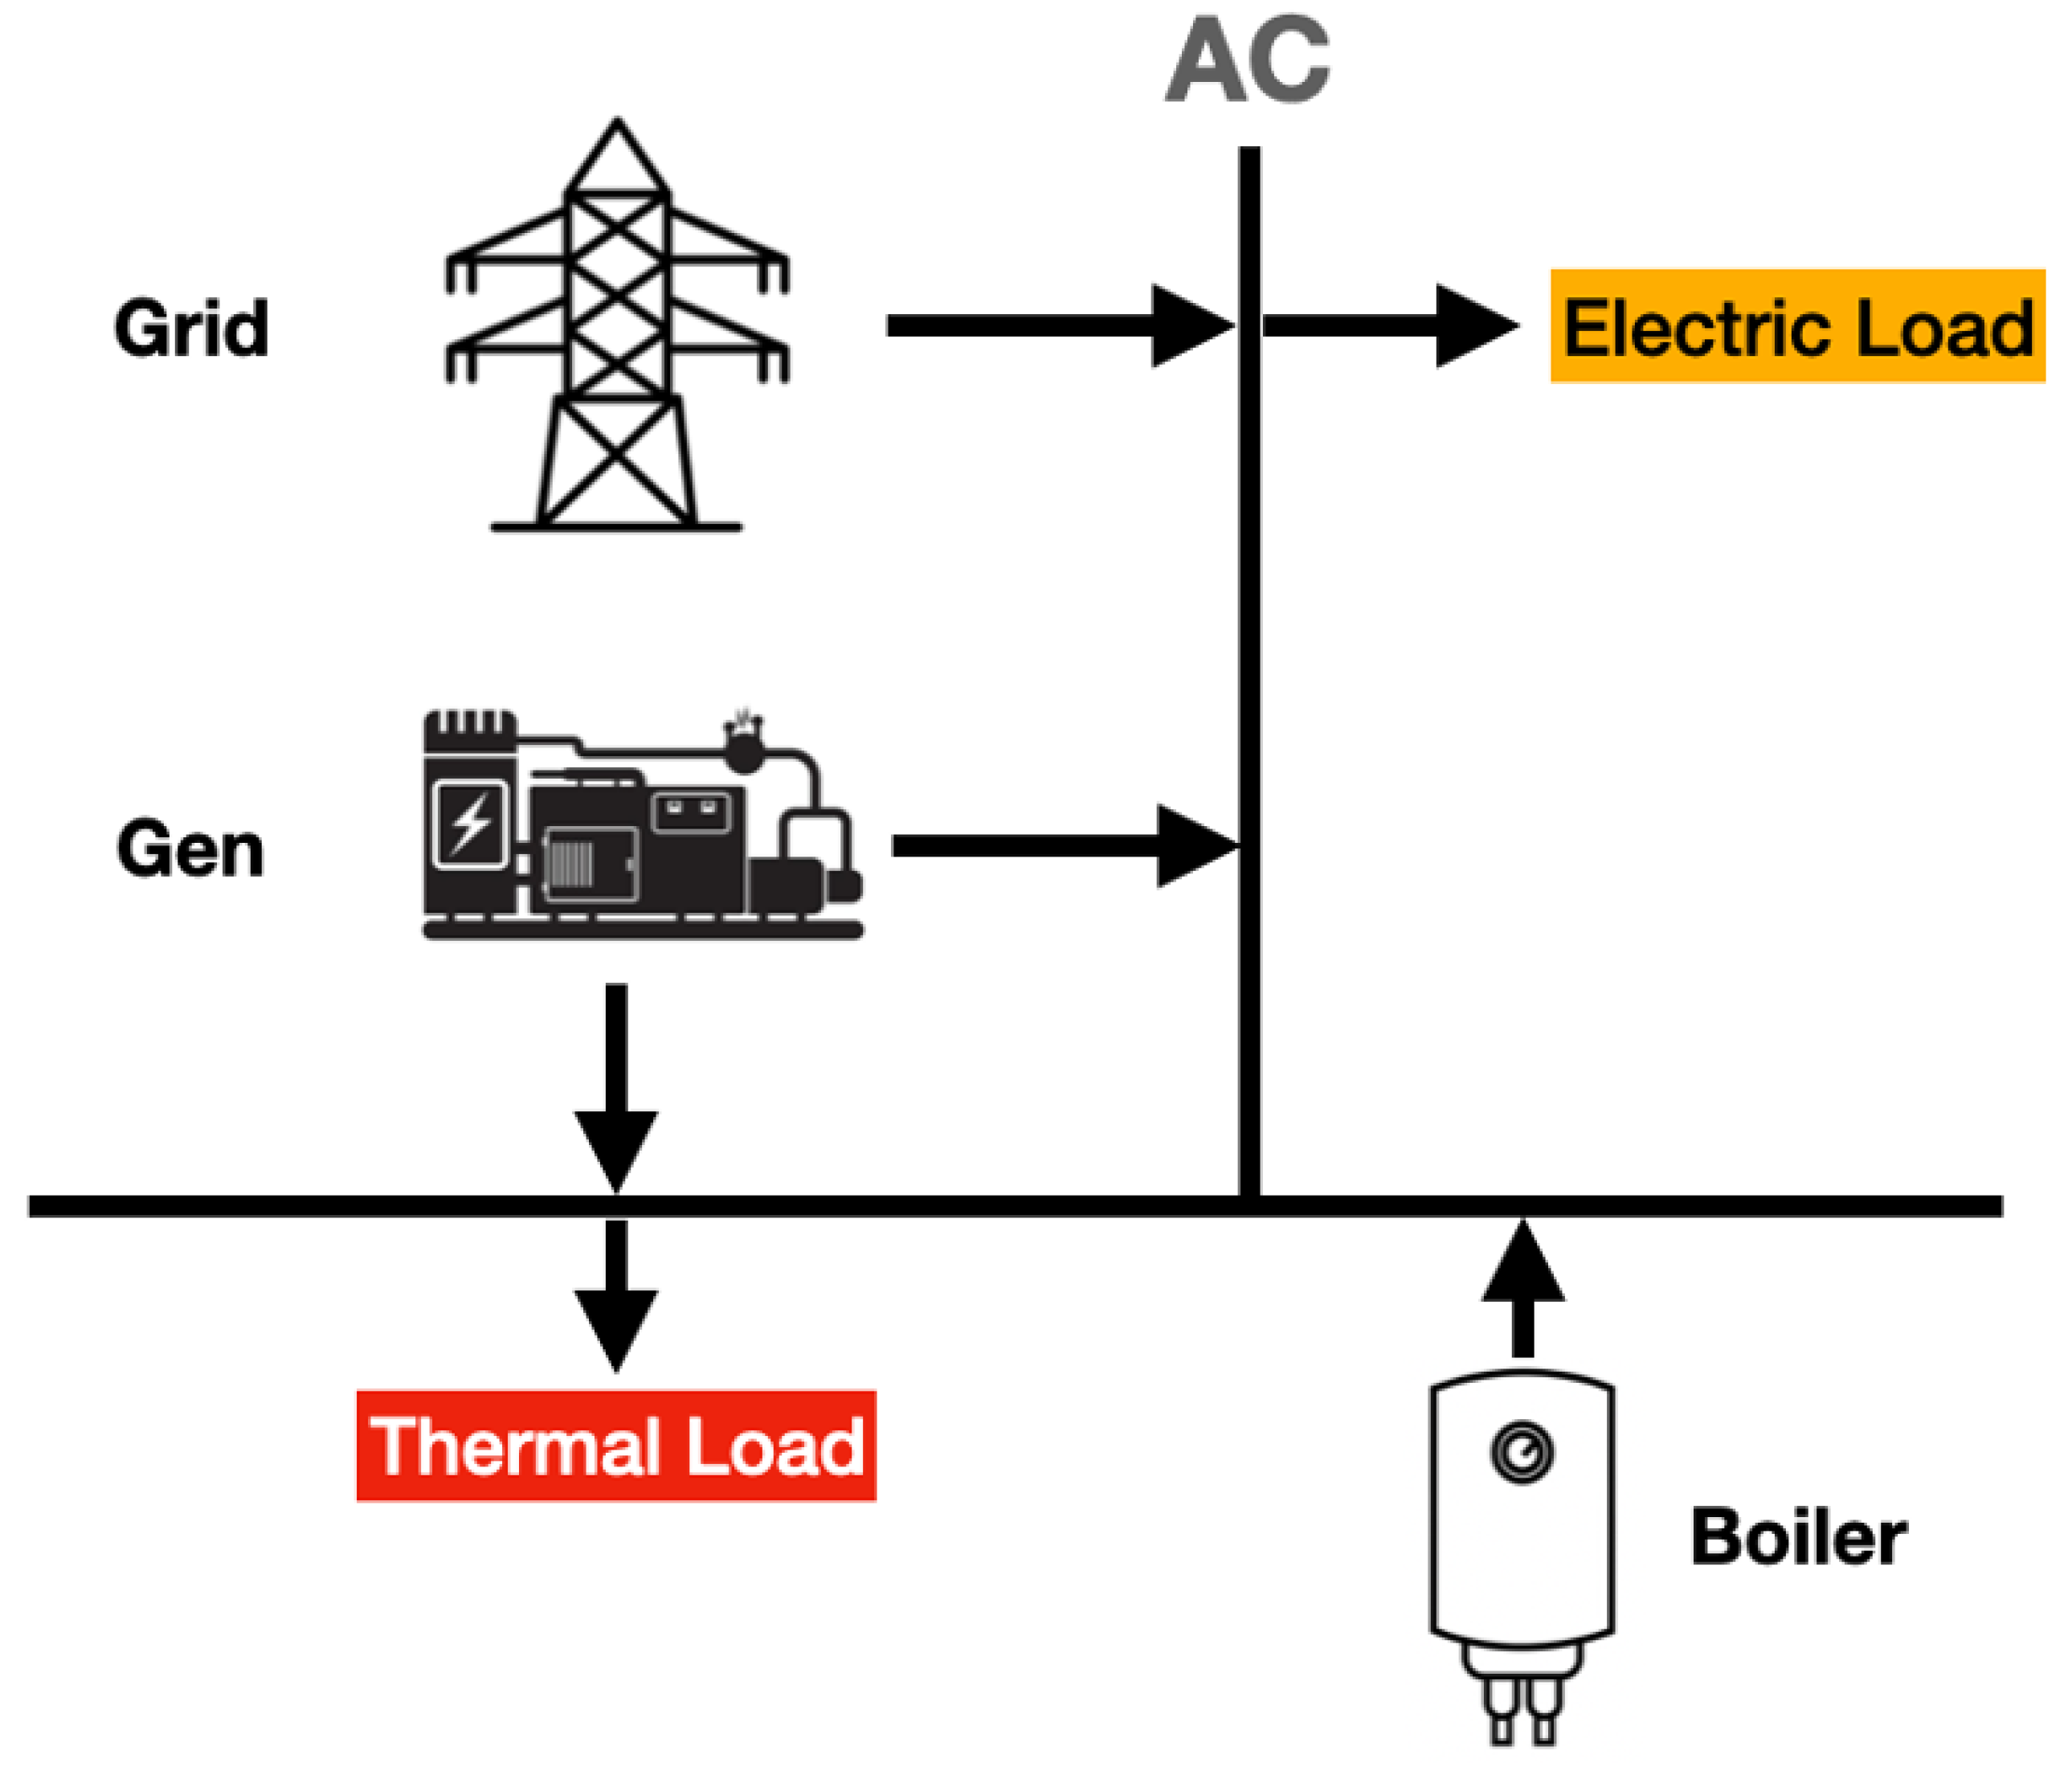
Figure 4.
Economic Energy System Architecture with Sector Coupling and Decarbonization[26].
Figure 4.
Economic Energy System Architecture with Sector Coupling and Decarbonization[26].
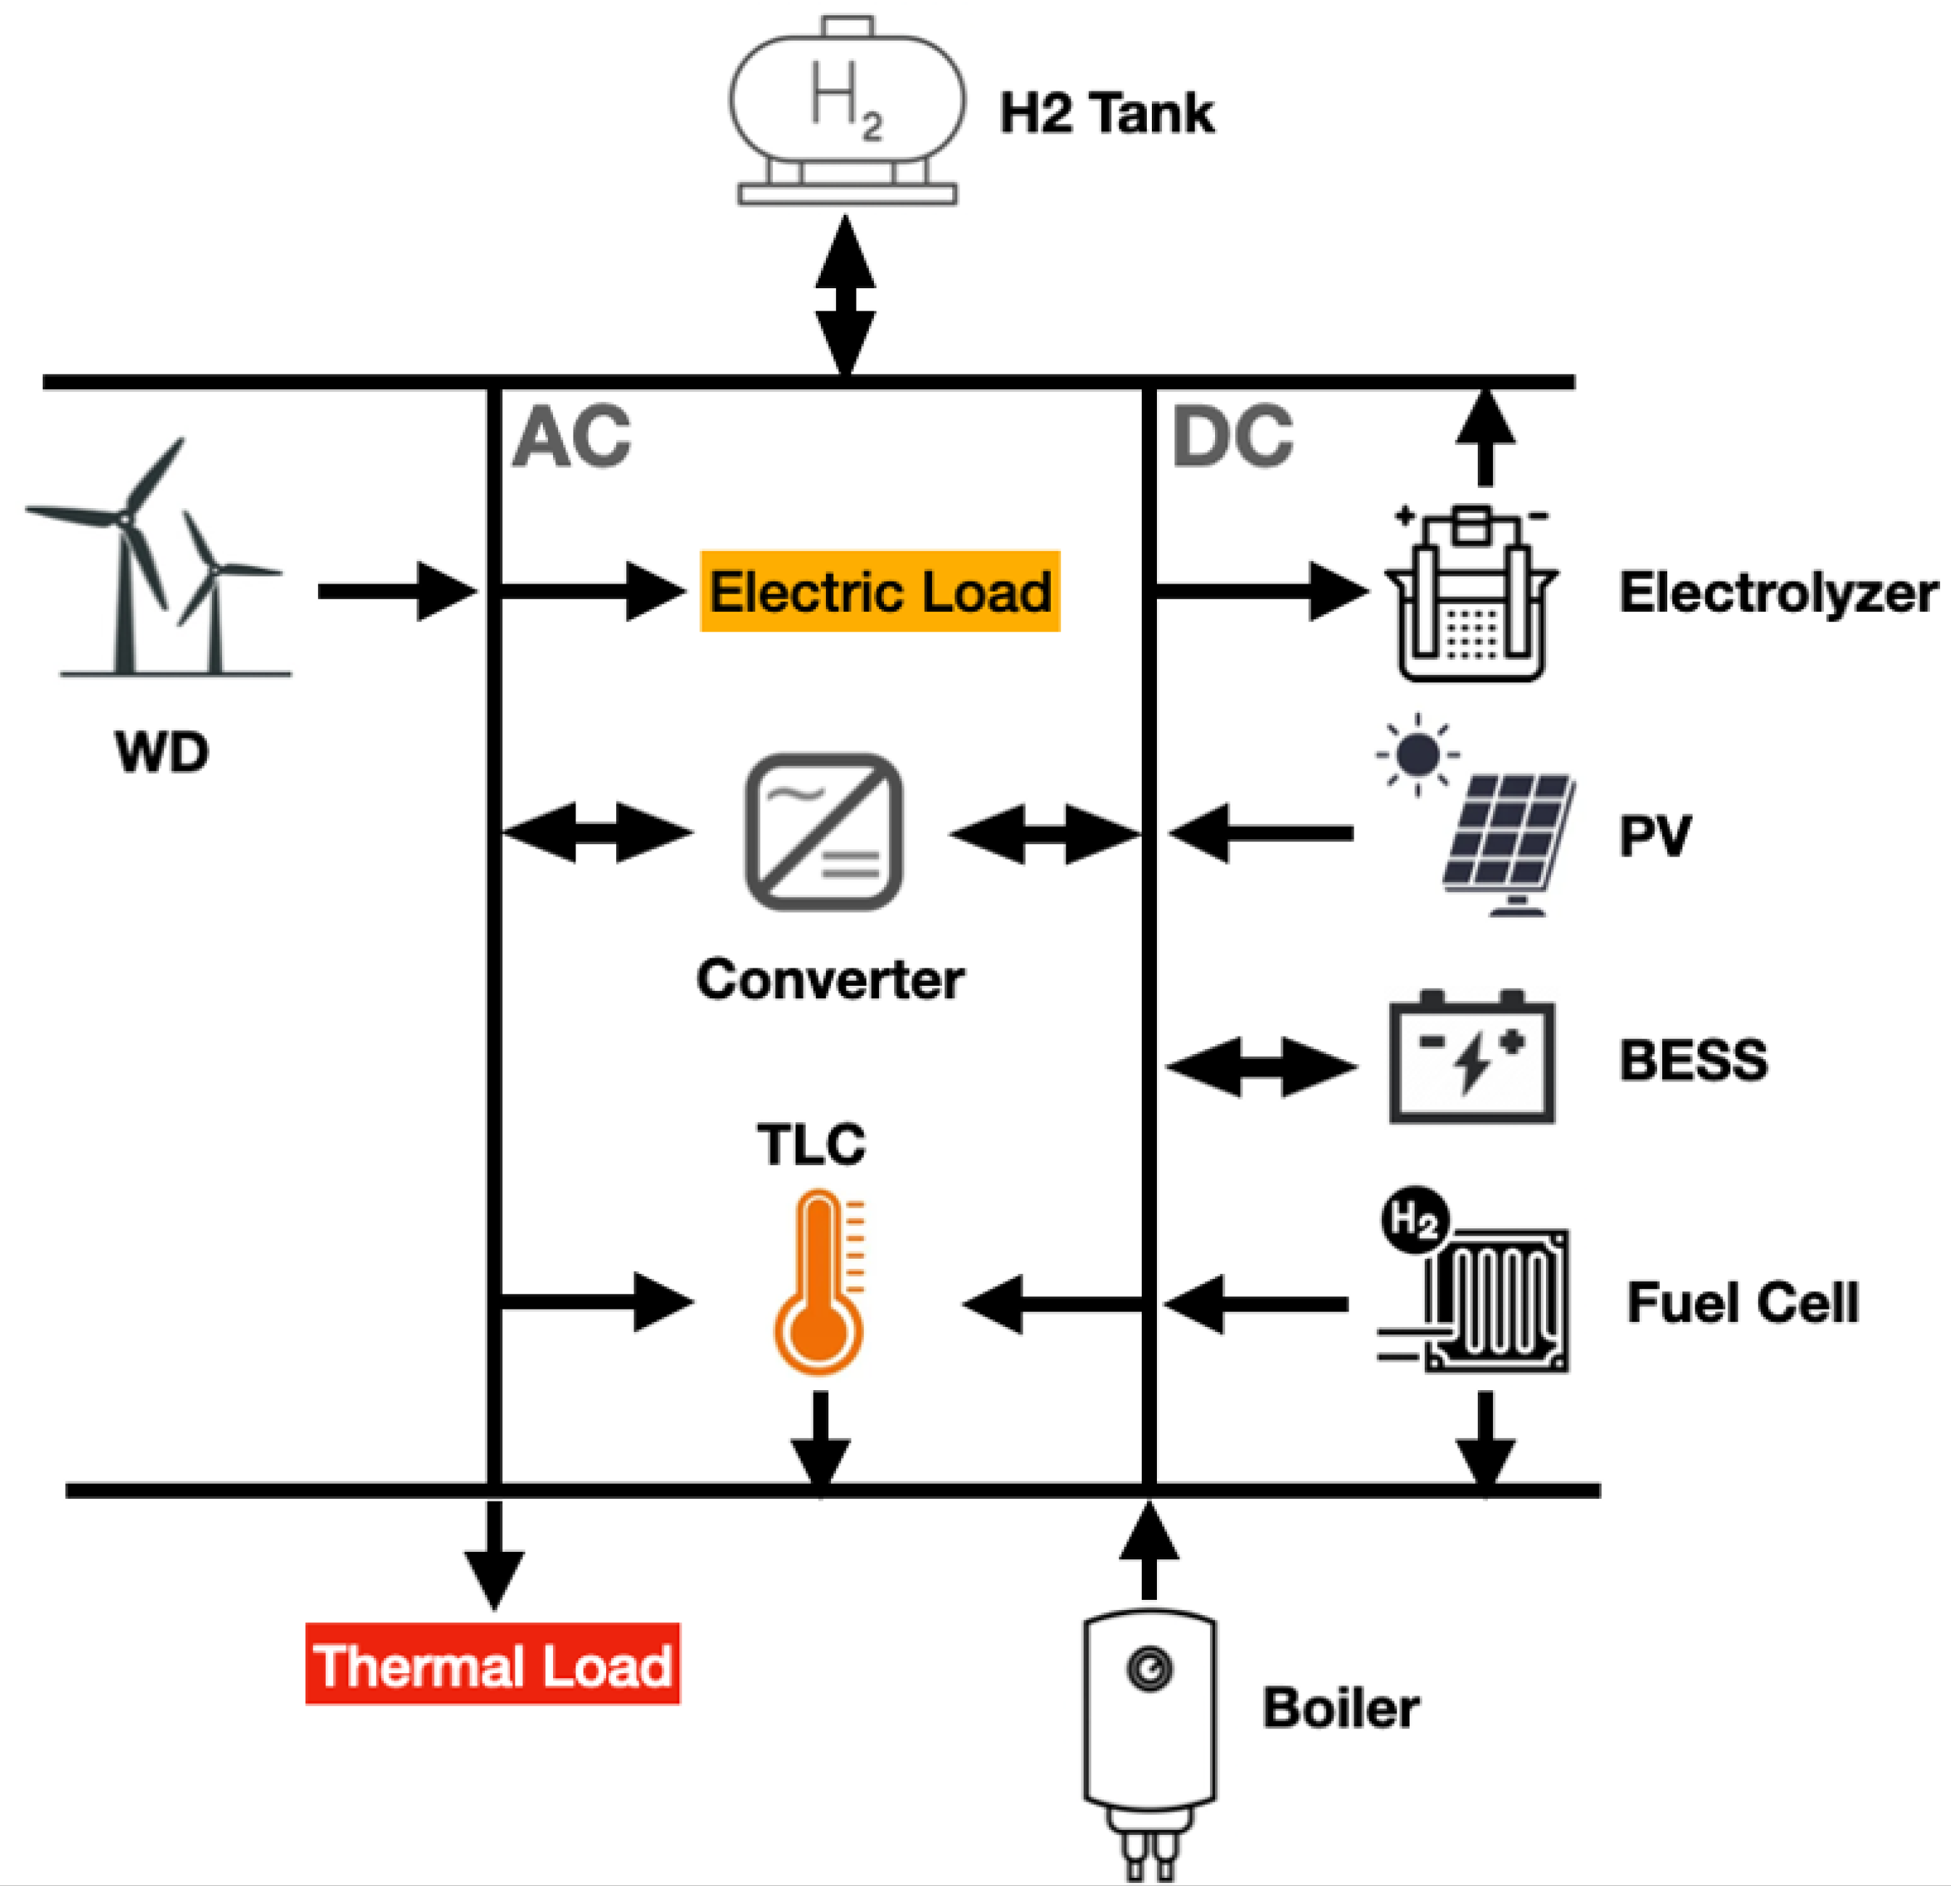
Figure 5.
Monthly Average Temperature Profile of Balan Industrial Area.
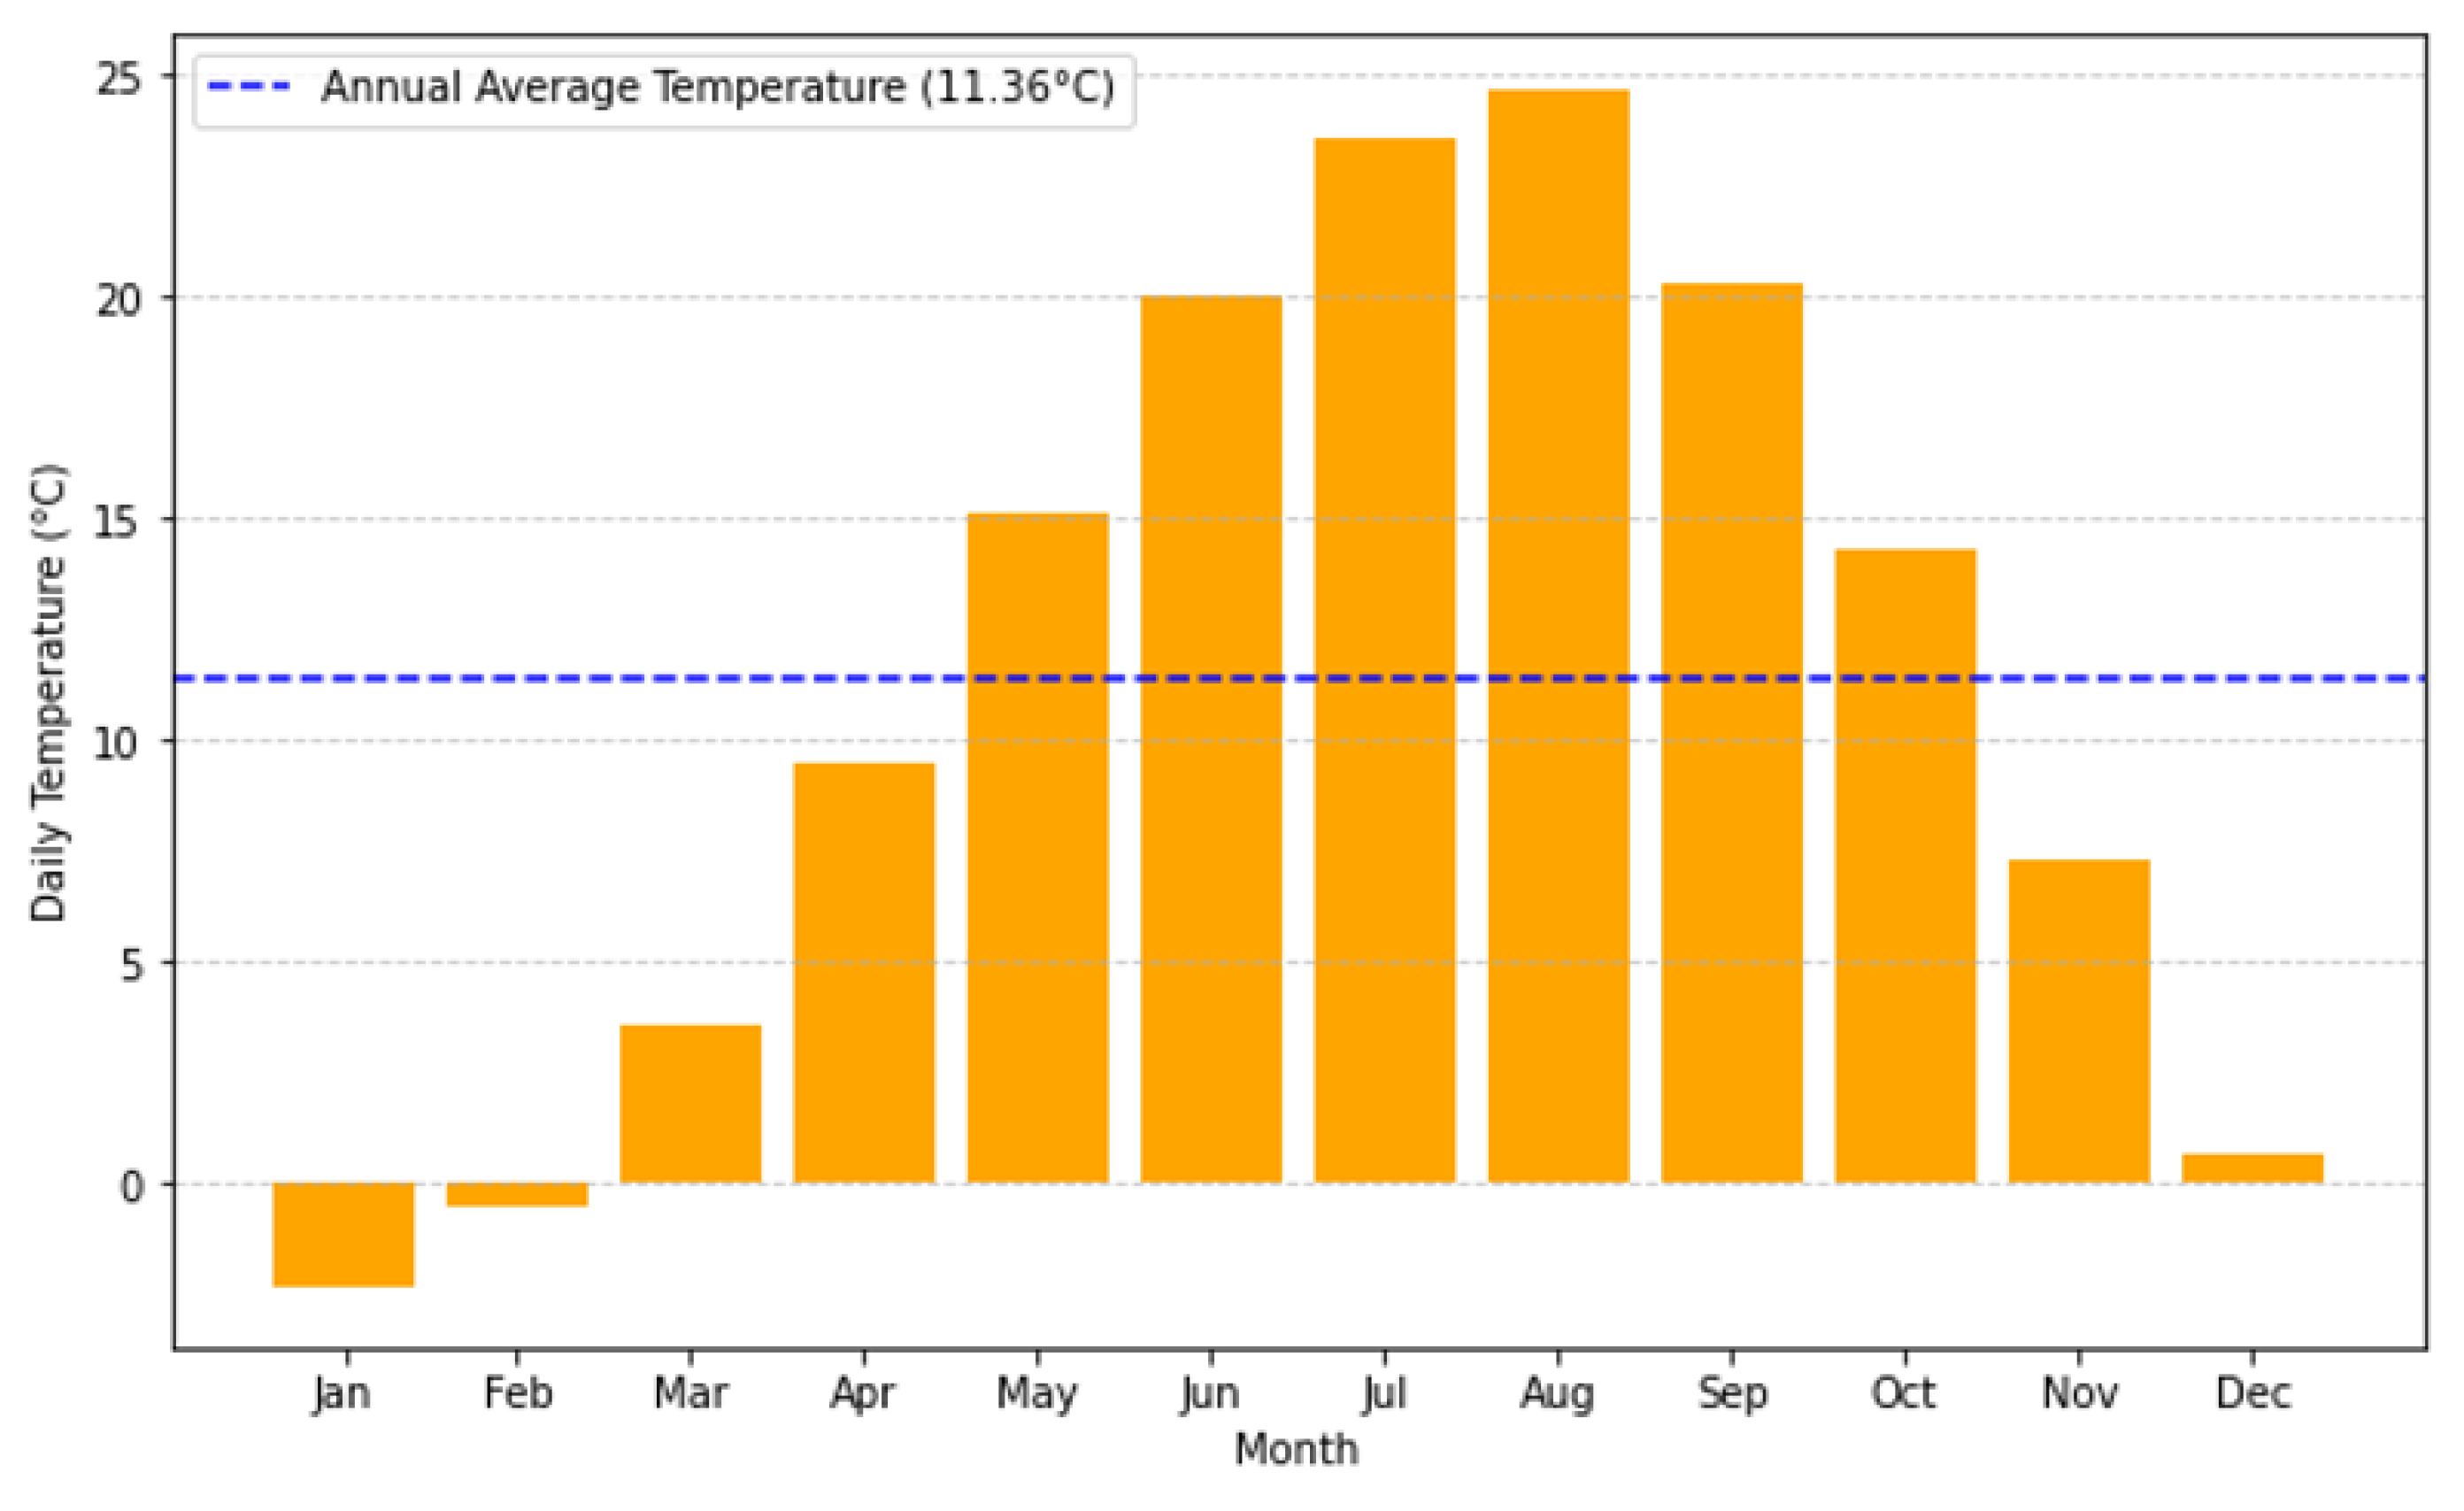
Figure 6.
Monthly Average Wind Speed Profile of Balan Industrial Area.
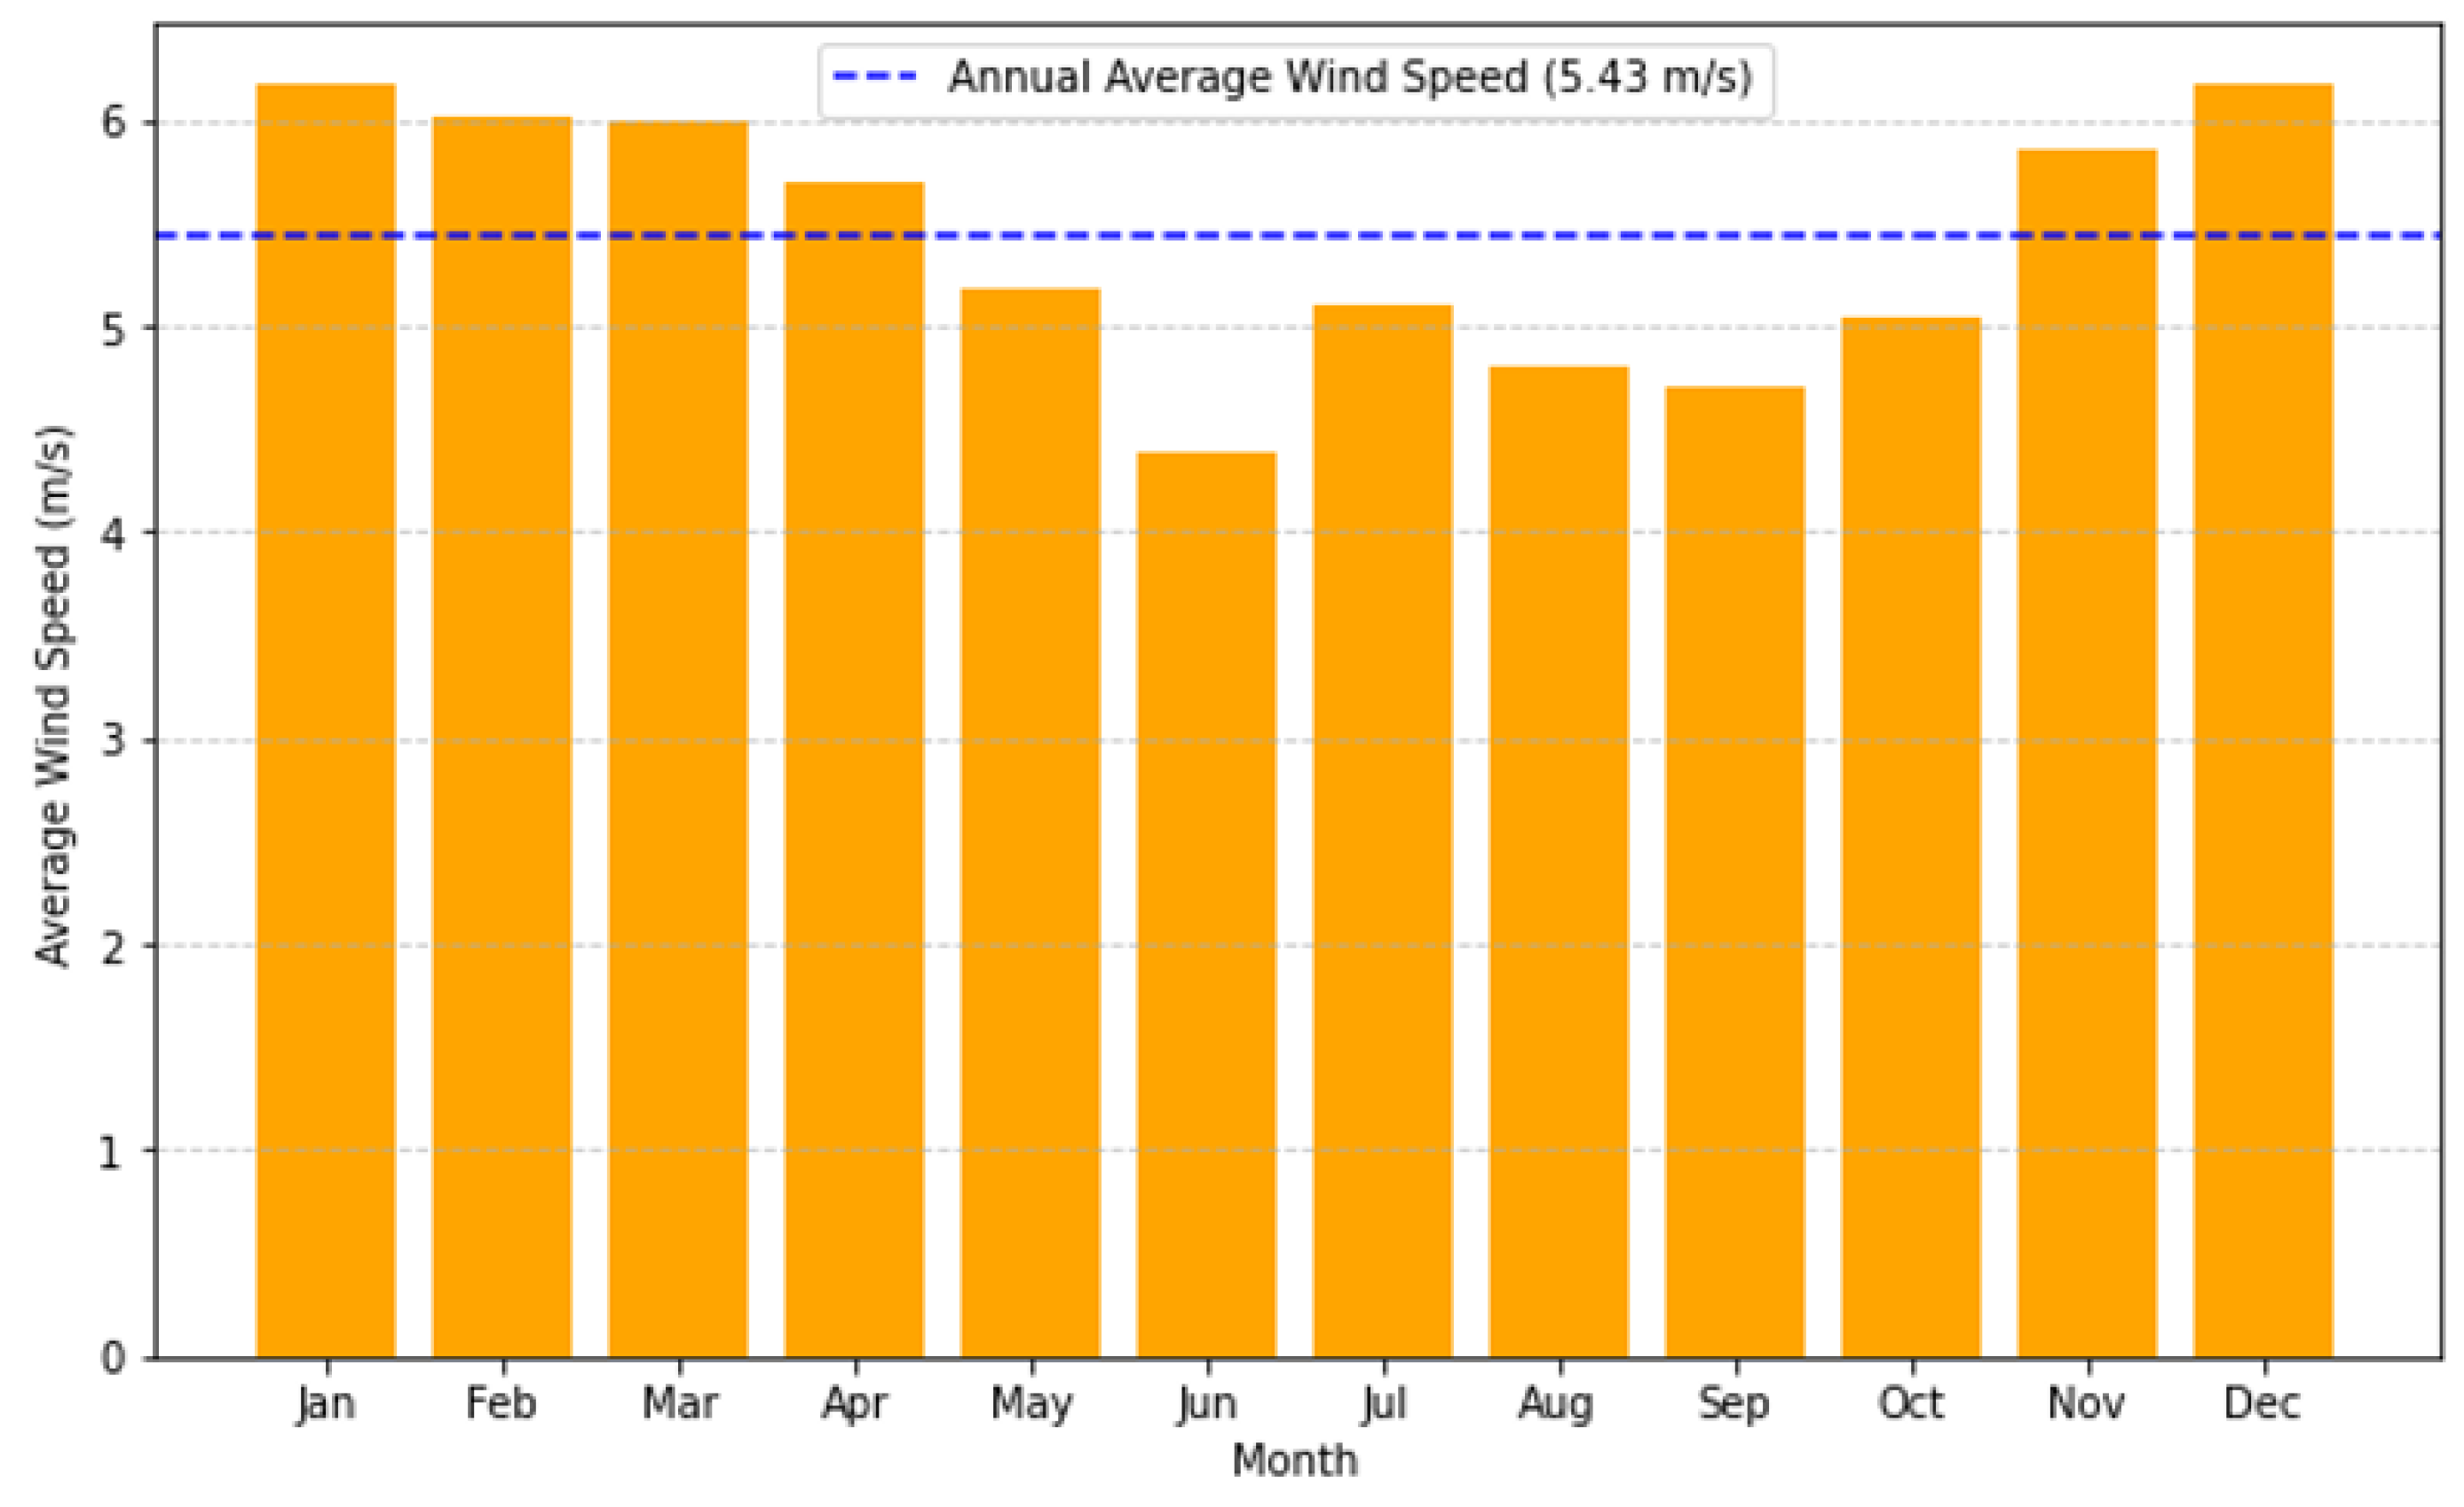
Figure 7.
Monthly Average Solar Global Horizontal Irradiance (GHI) Profile of Balan Industrial Area.
Figure 7.
Monthly Average Solar Global Horizontal Irradiance (GHI) Profile of Balan Industrial Area.
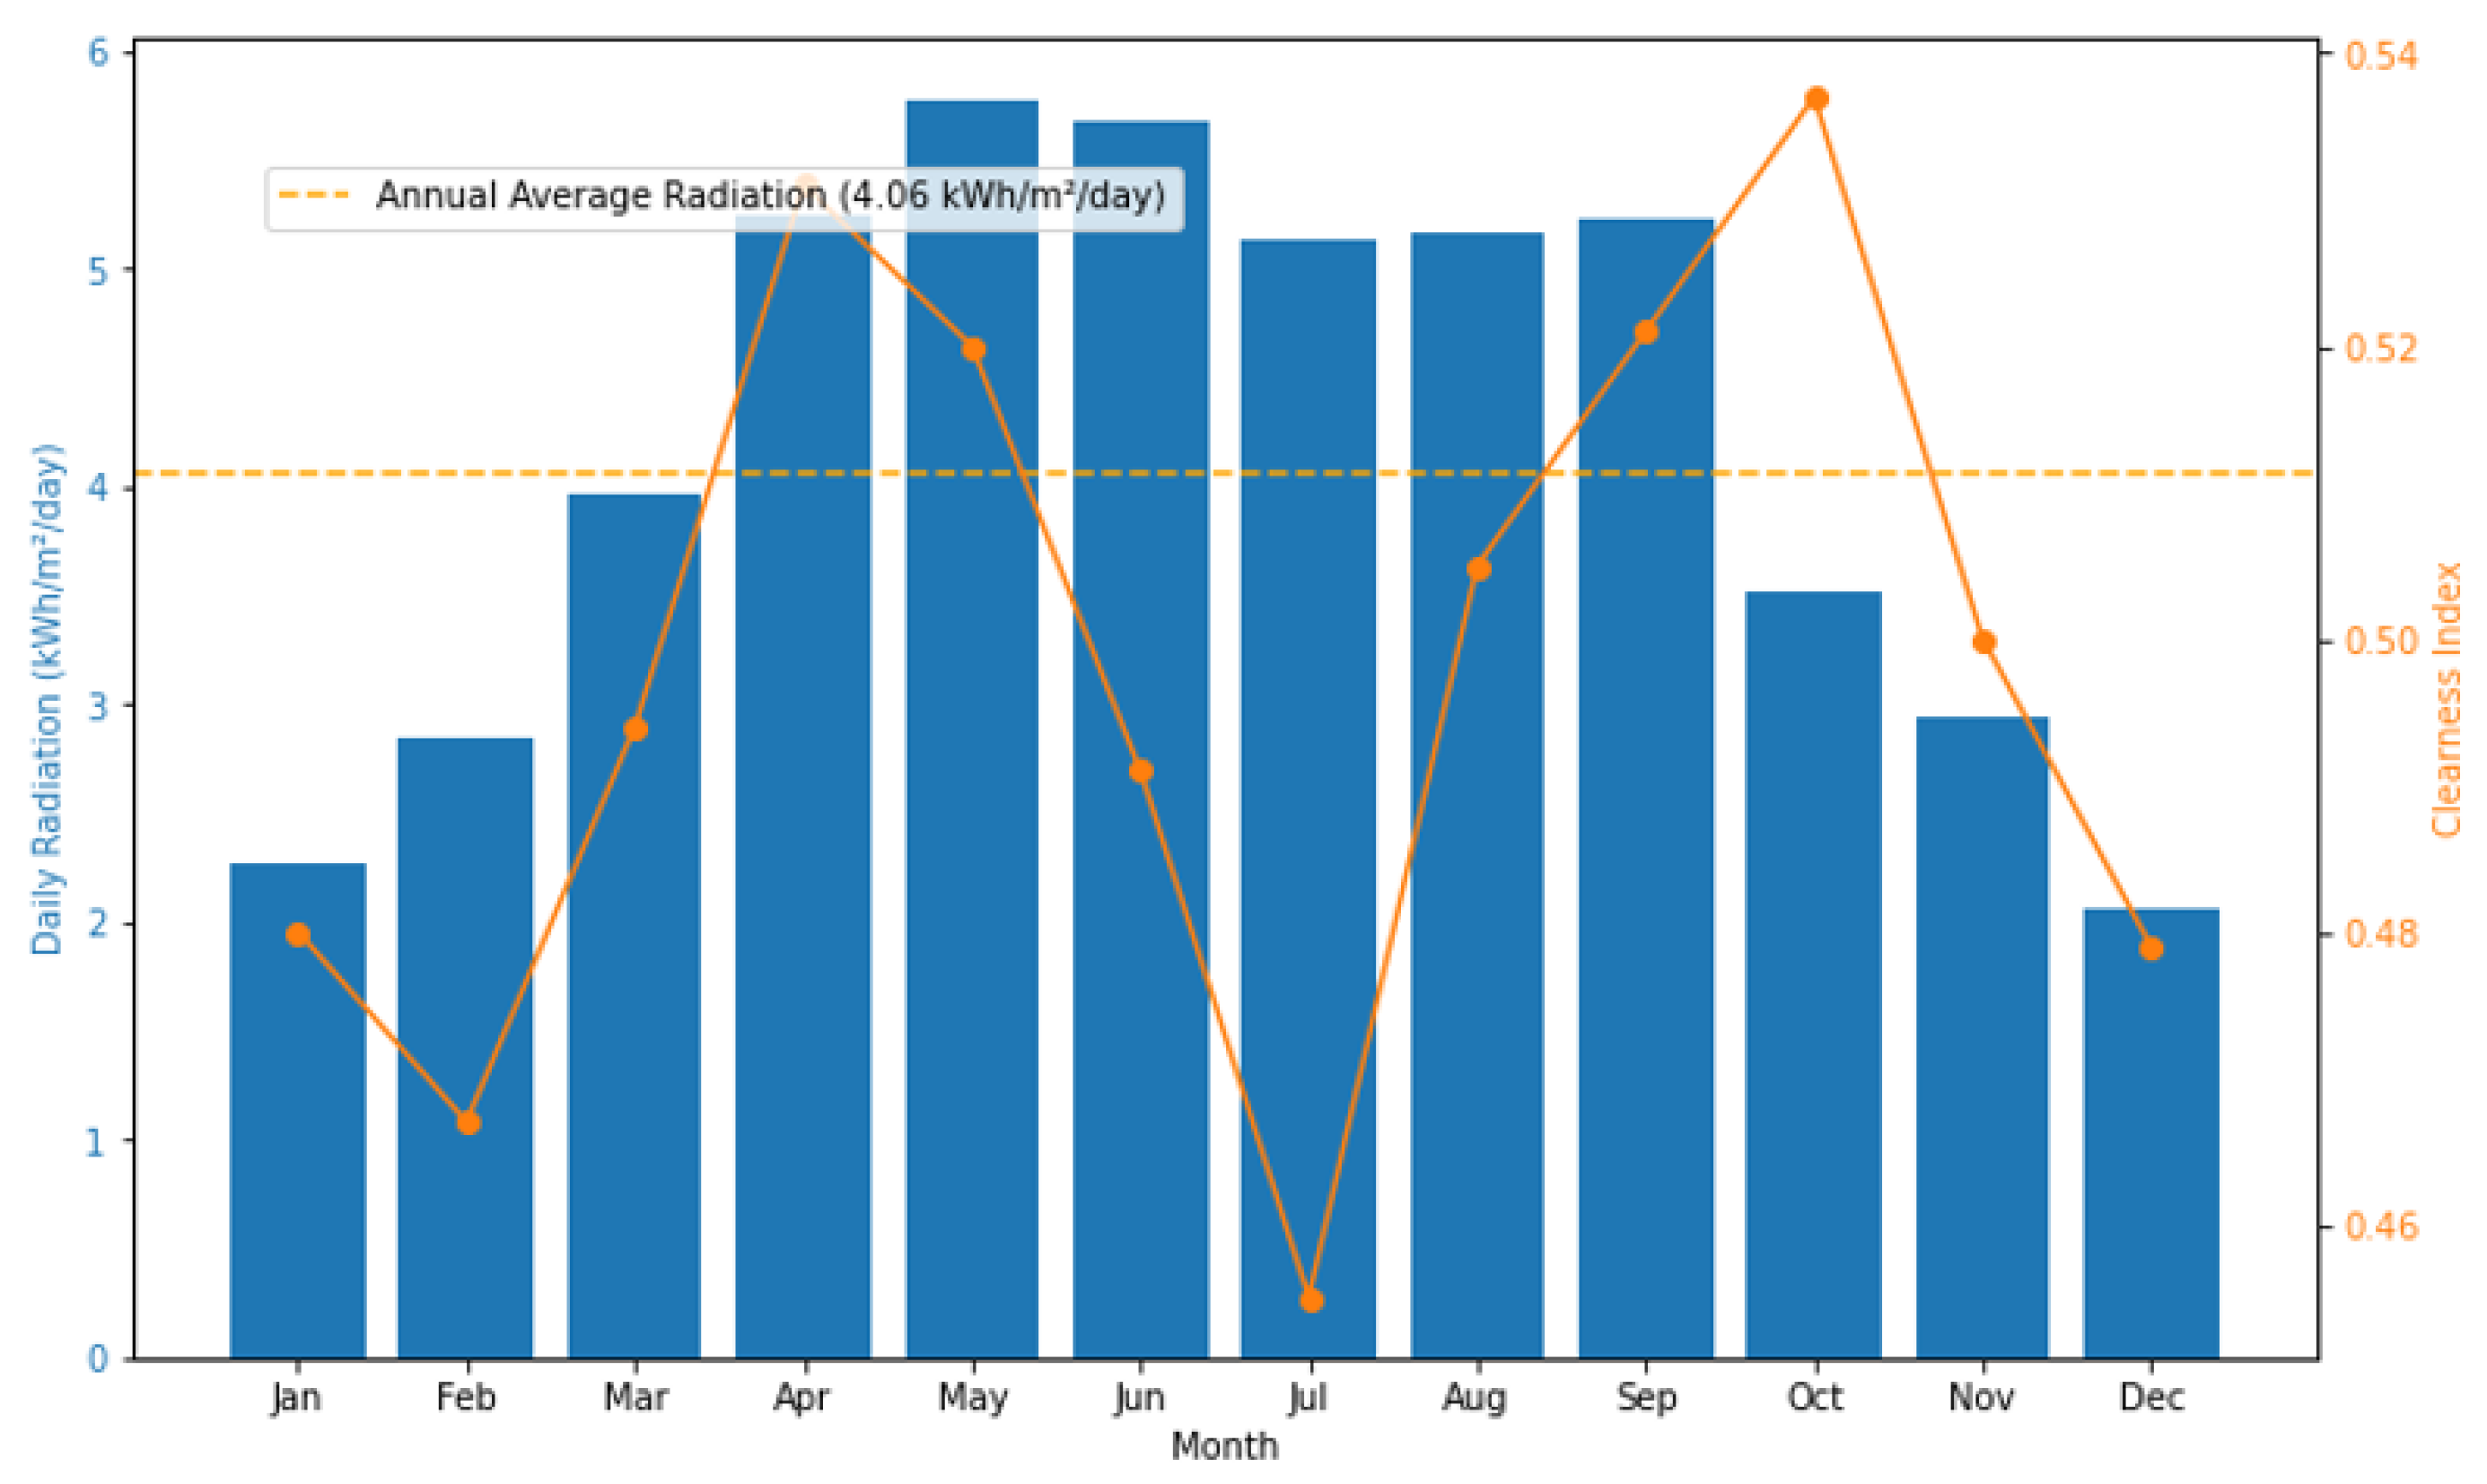
Figure 8.
Monthly Electric Load Profile.
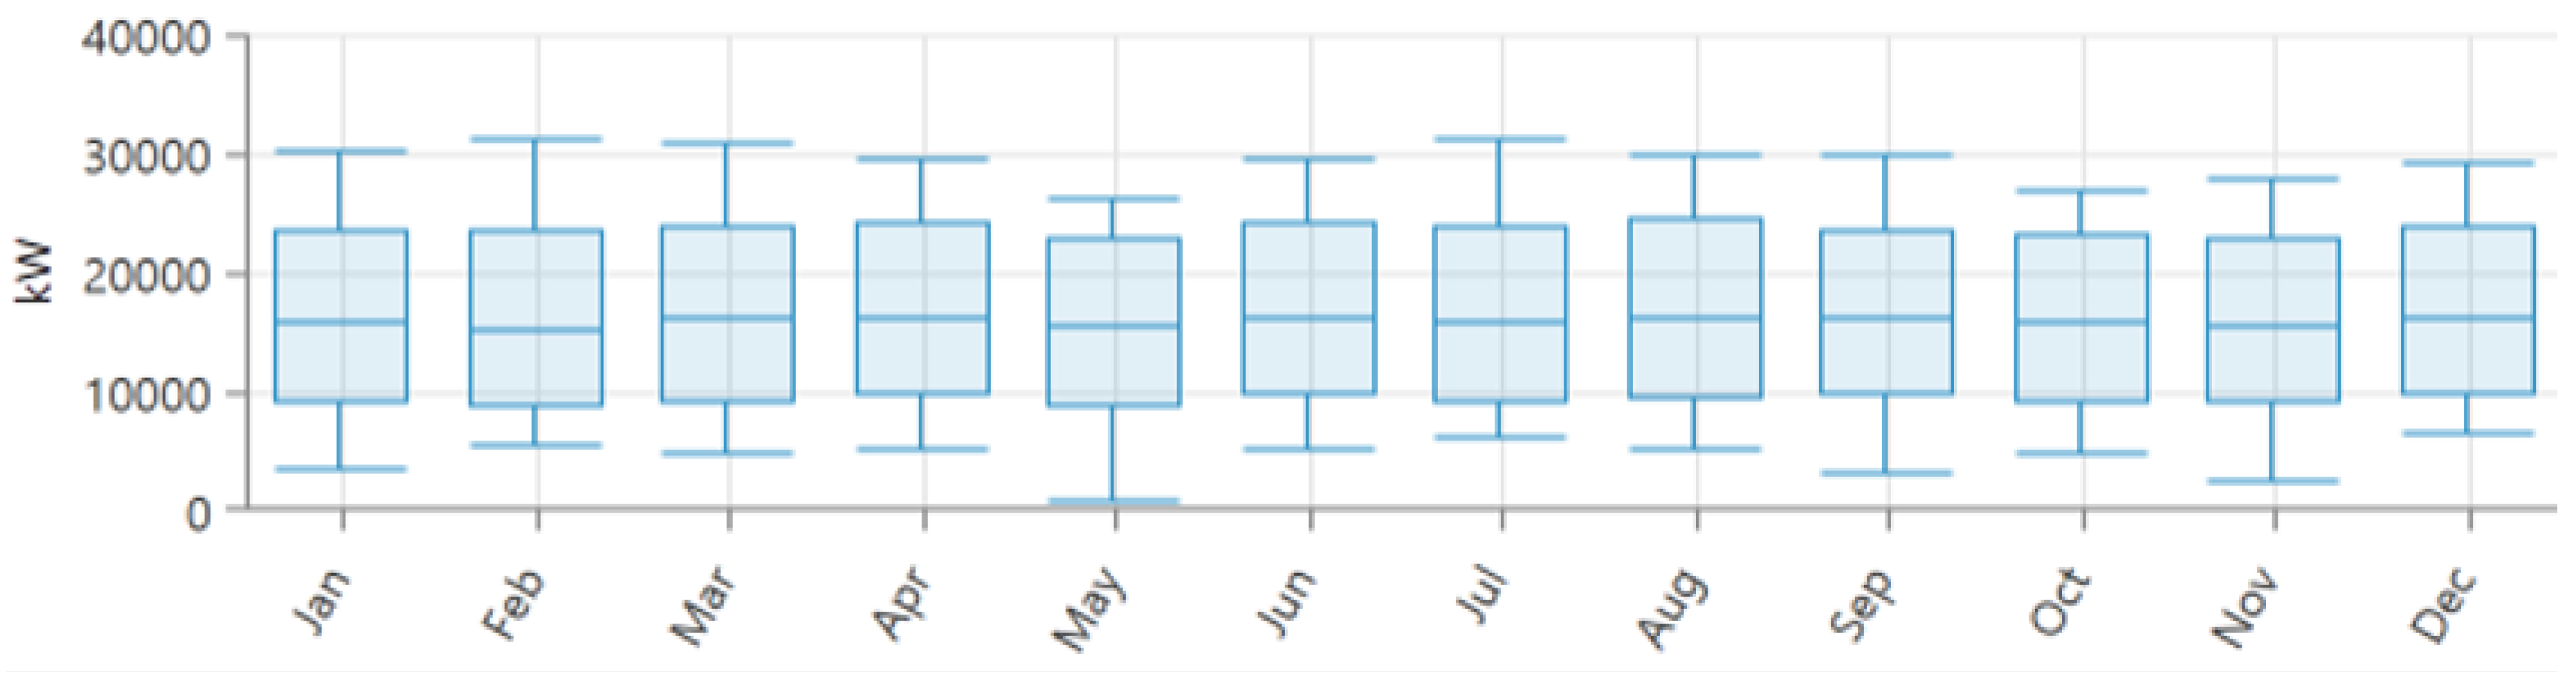
Figure 9.
Monthly Thermal Load Profile.
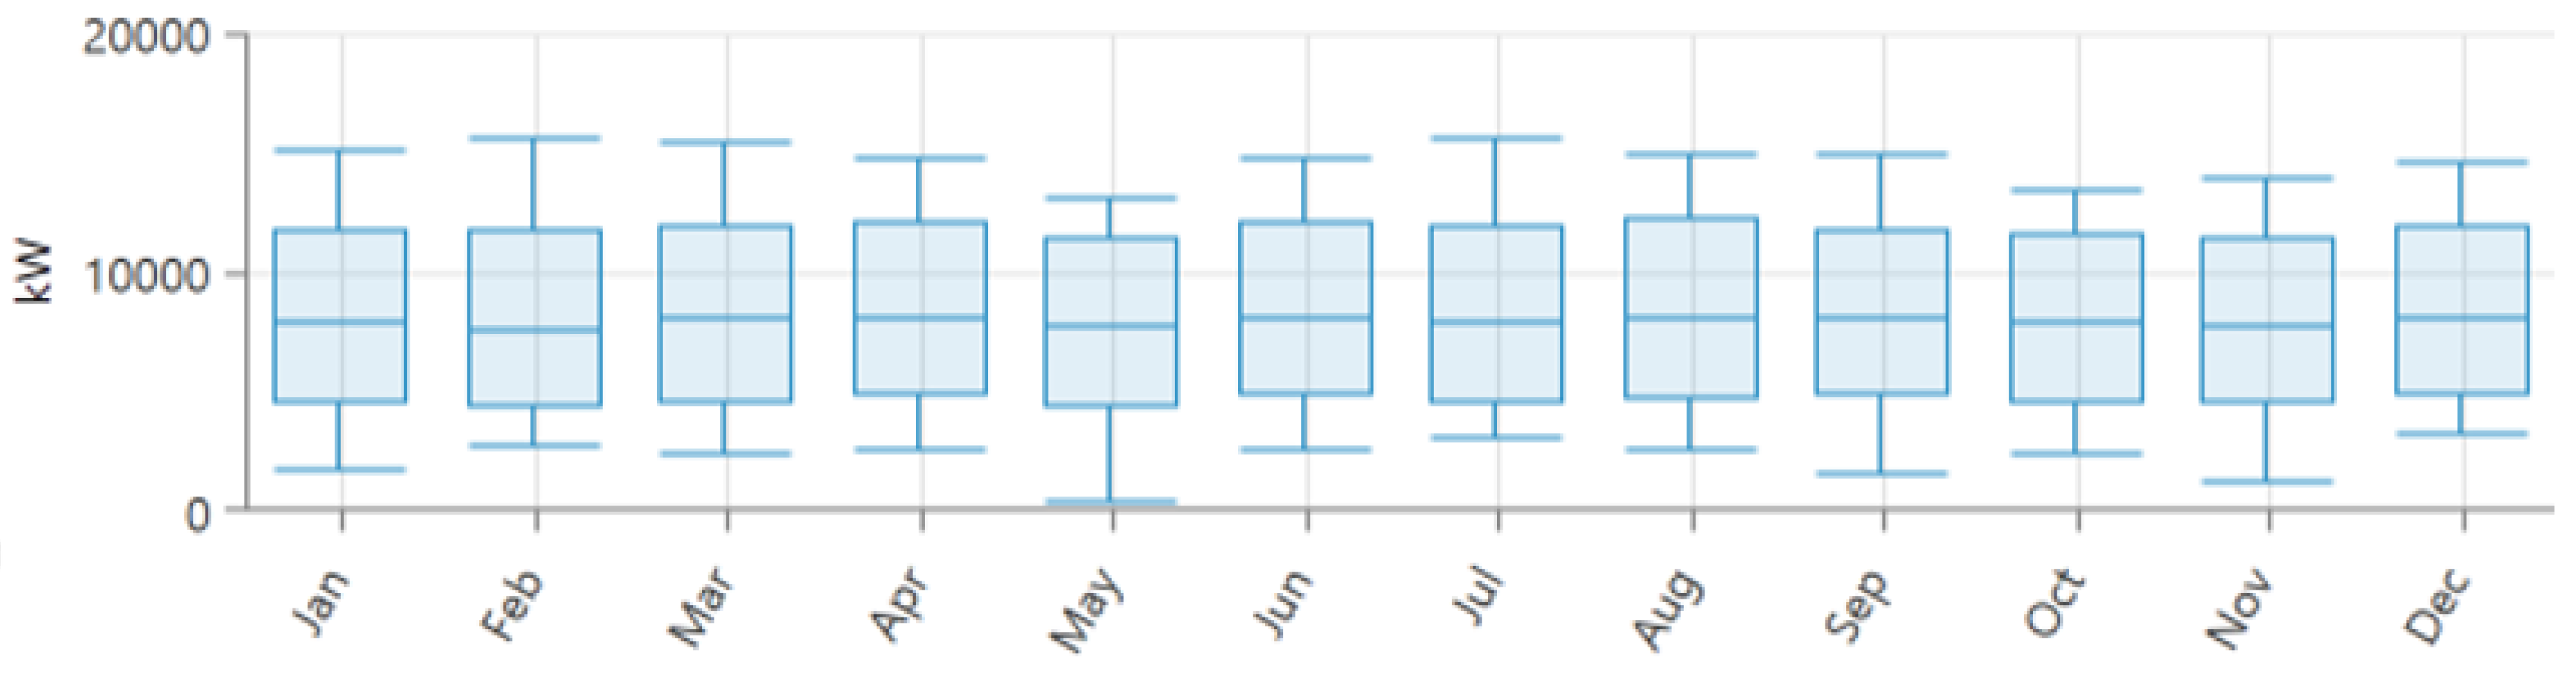
Figure 10.
Comparison of NPC and LCOE across Scenarios.
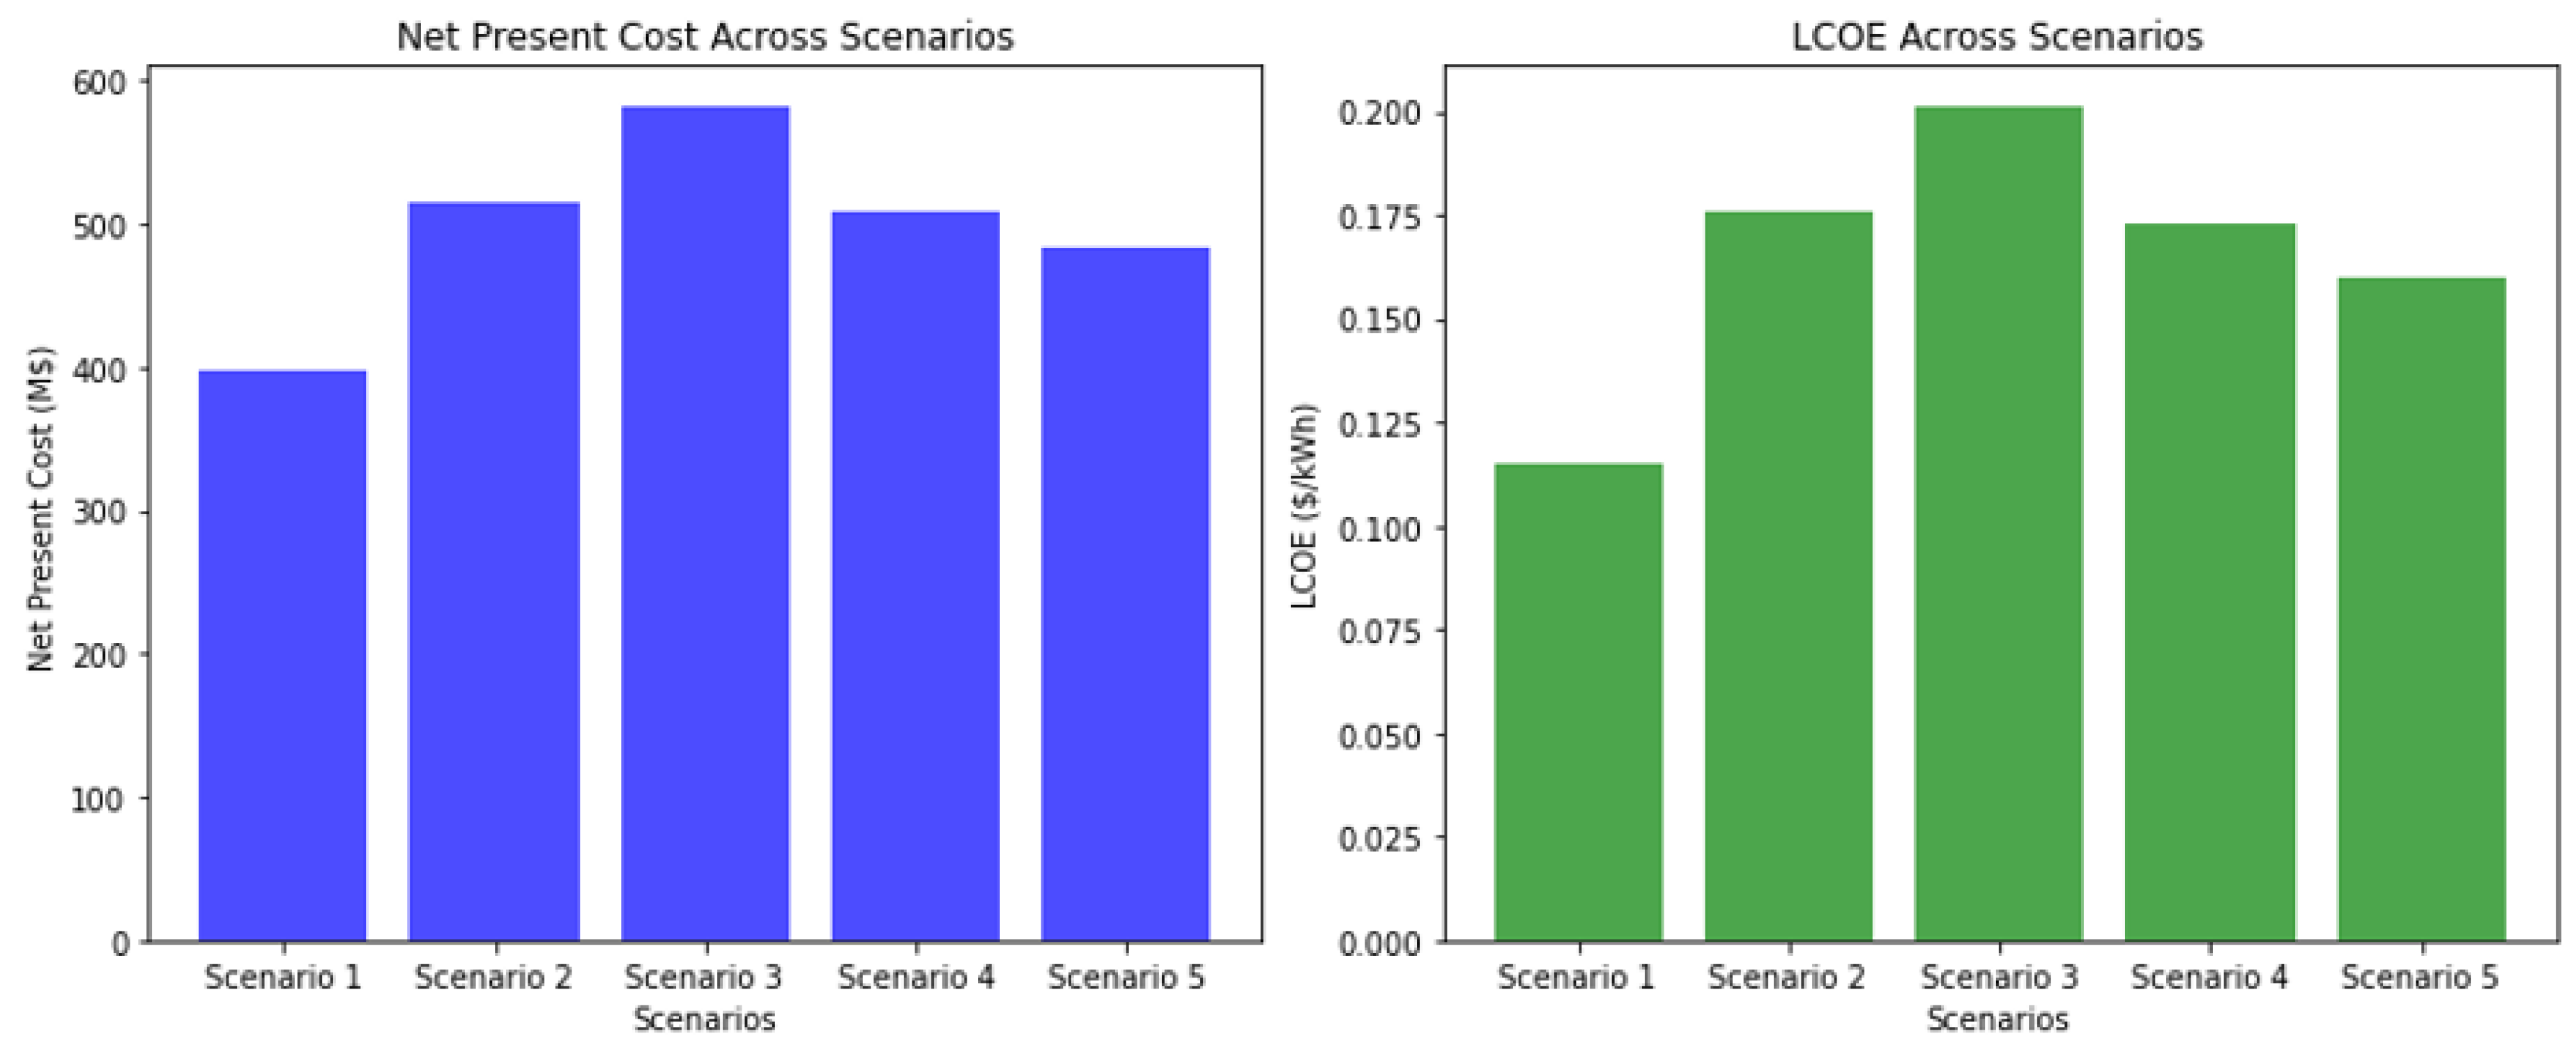
Figure 11.
Monthly Energy Production Distribution for Scenario 1 (Grid and Boiler).
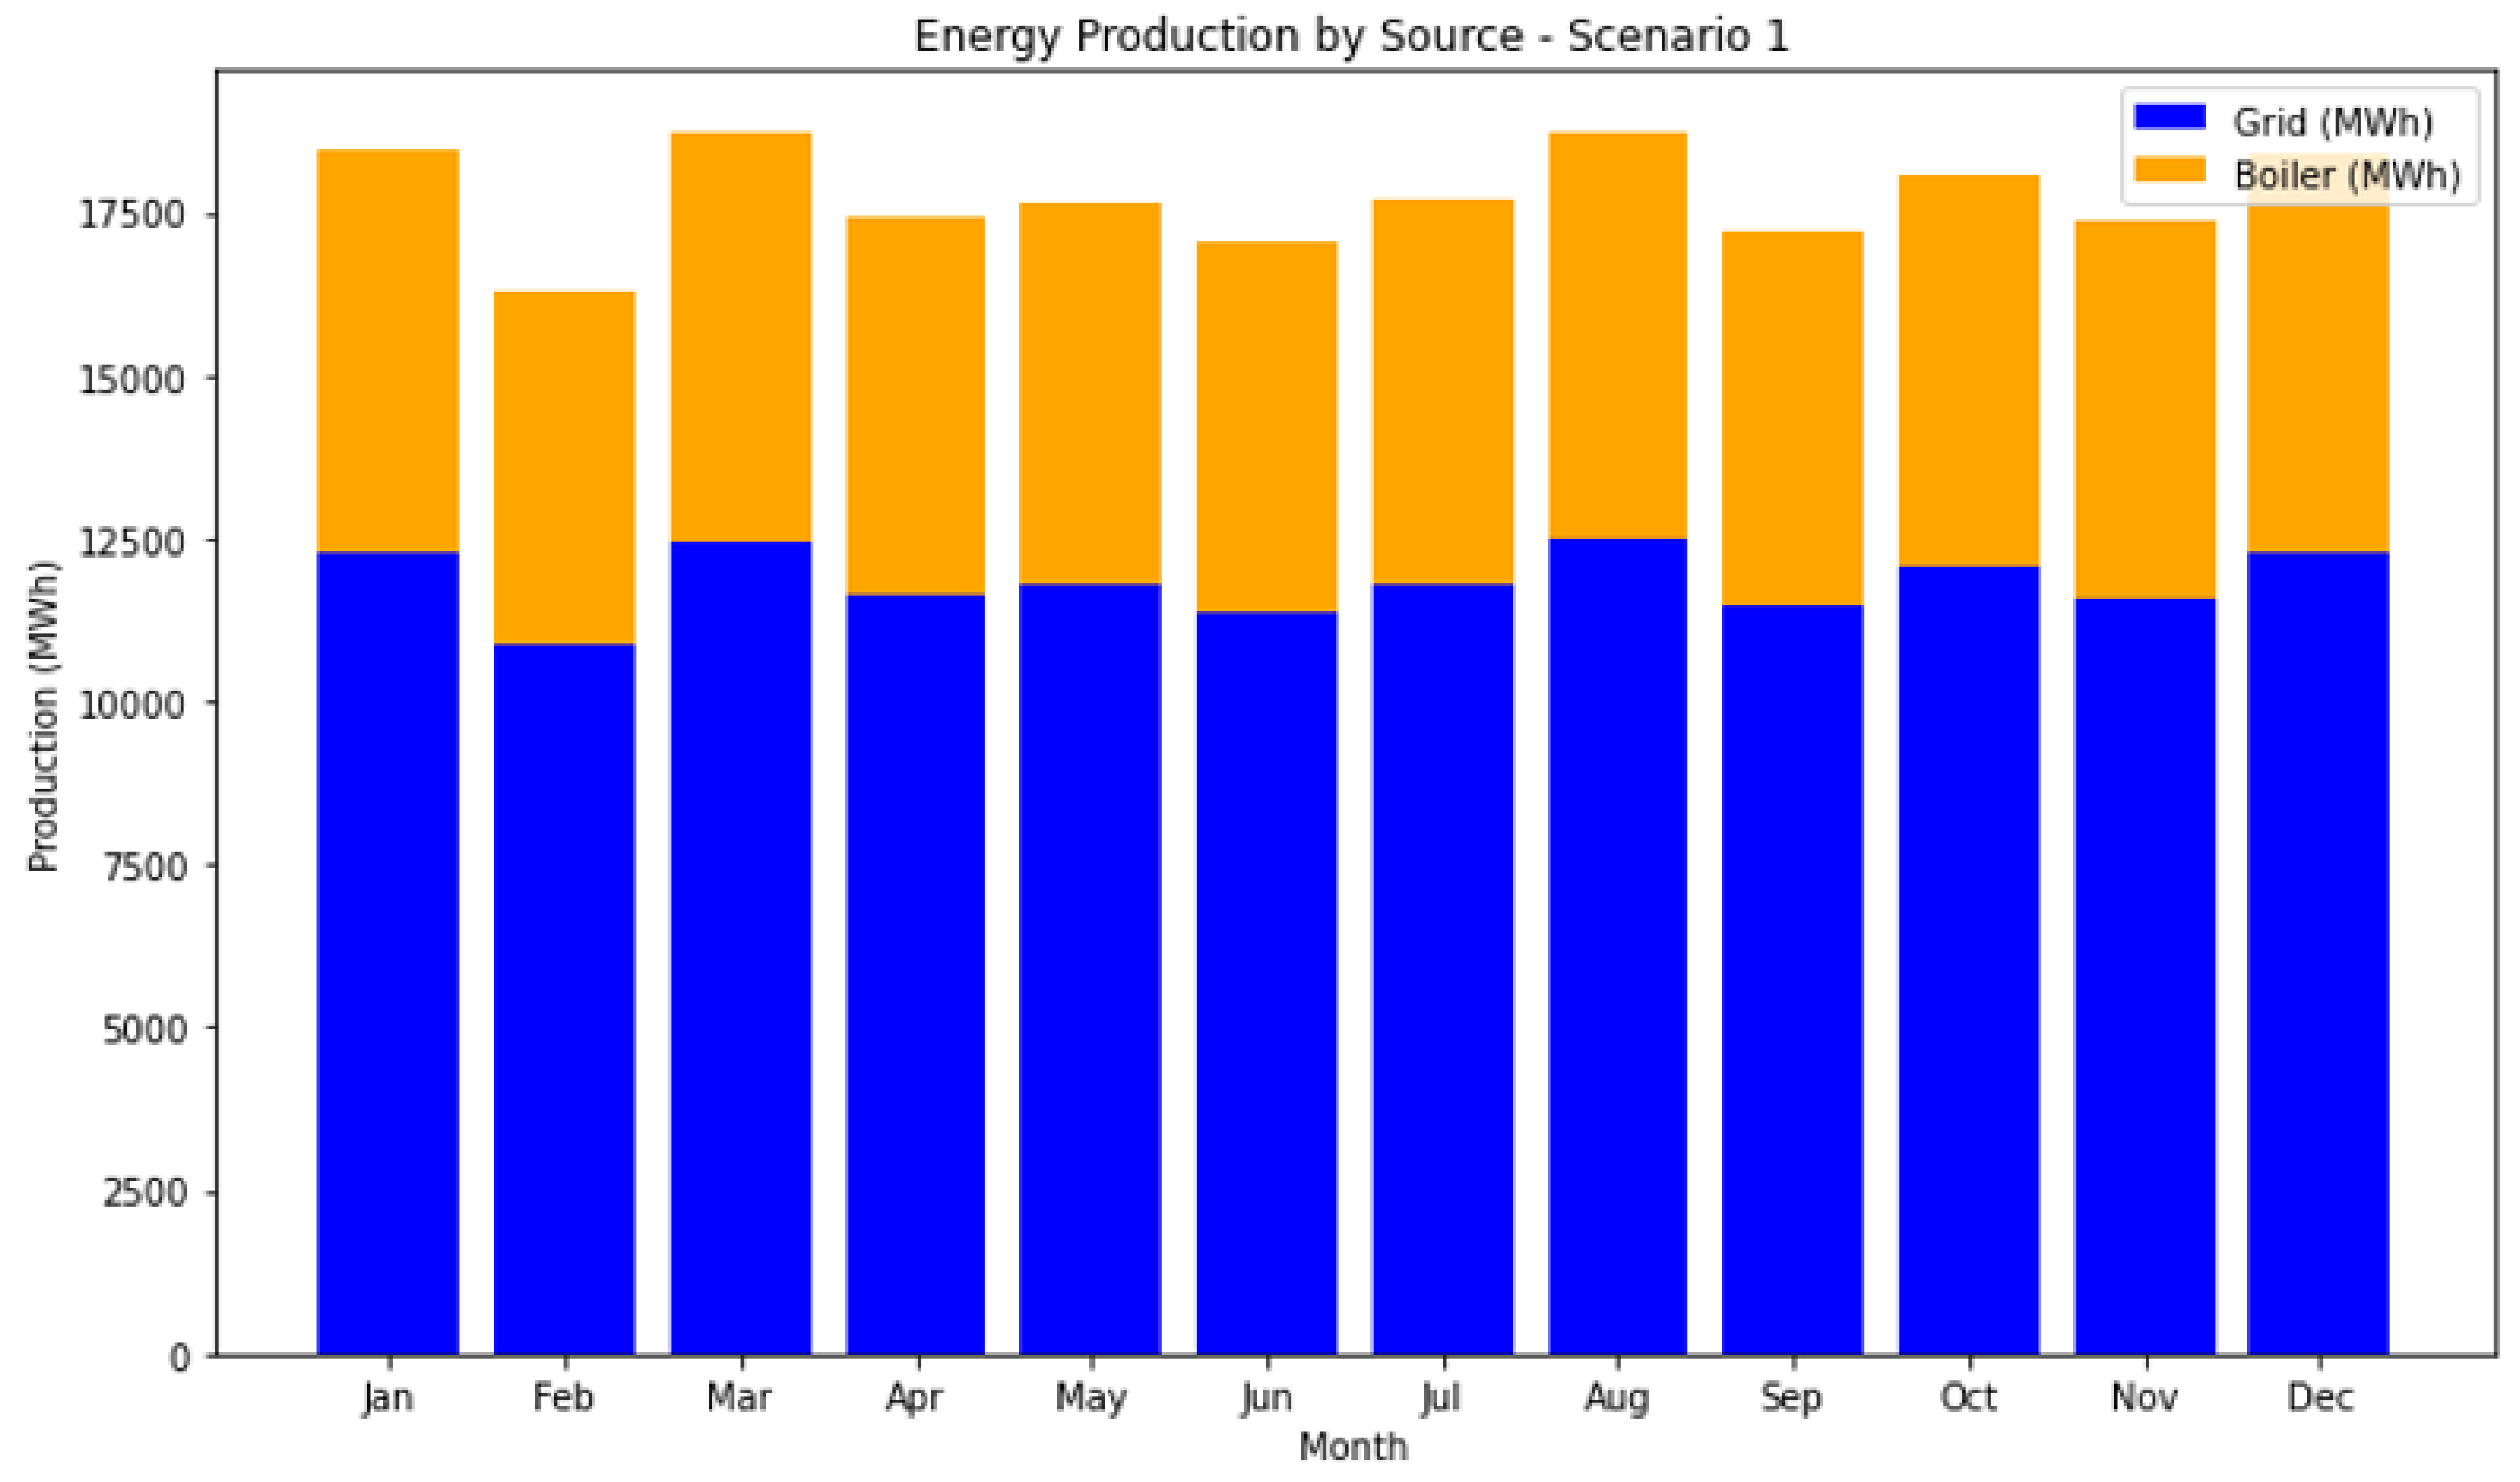
Figure 12.
Monthly Energy Production Distribution for Scenario 5 (including WD, PV, BL and TLC).
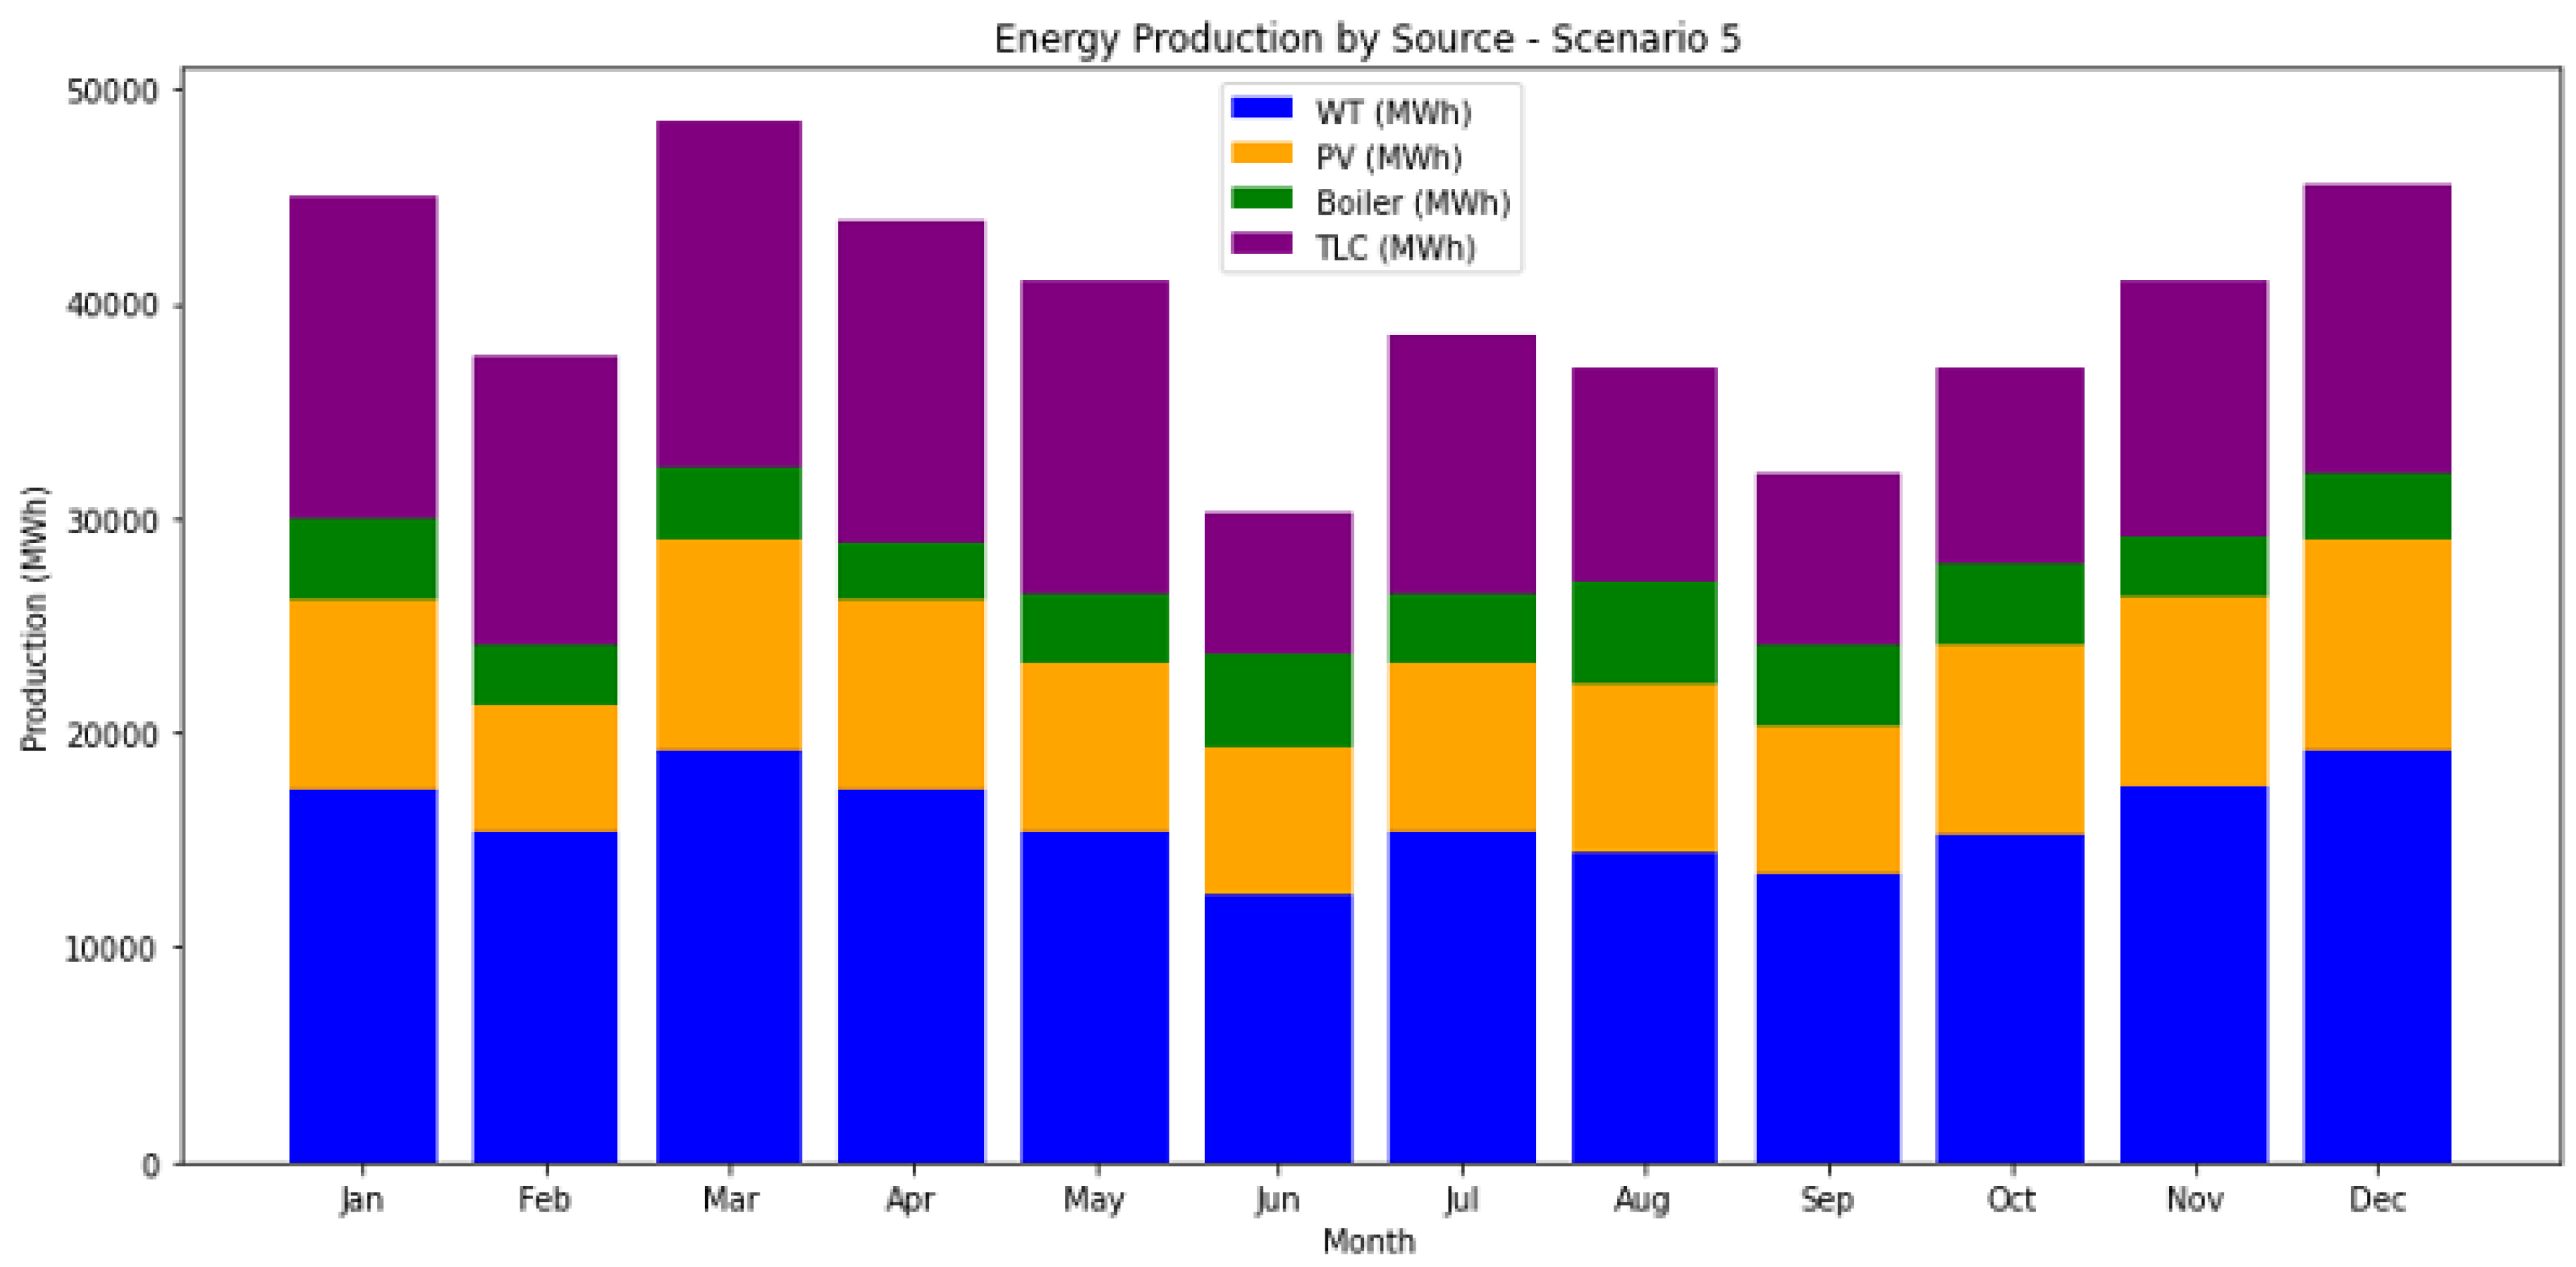
Figure 13.
Comparison of NPC and LCOE with and without CO2 Cost inclusion for Korea.
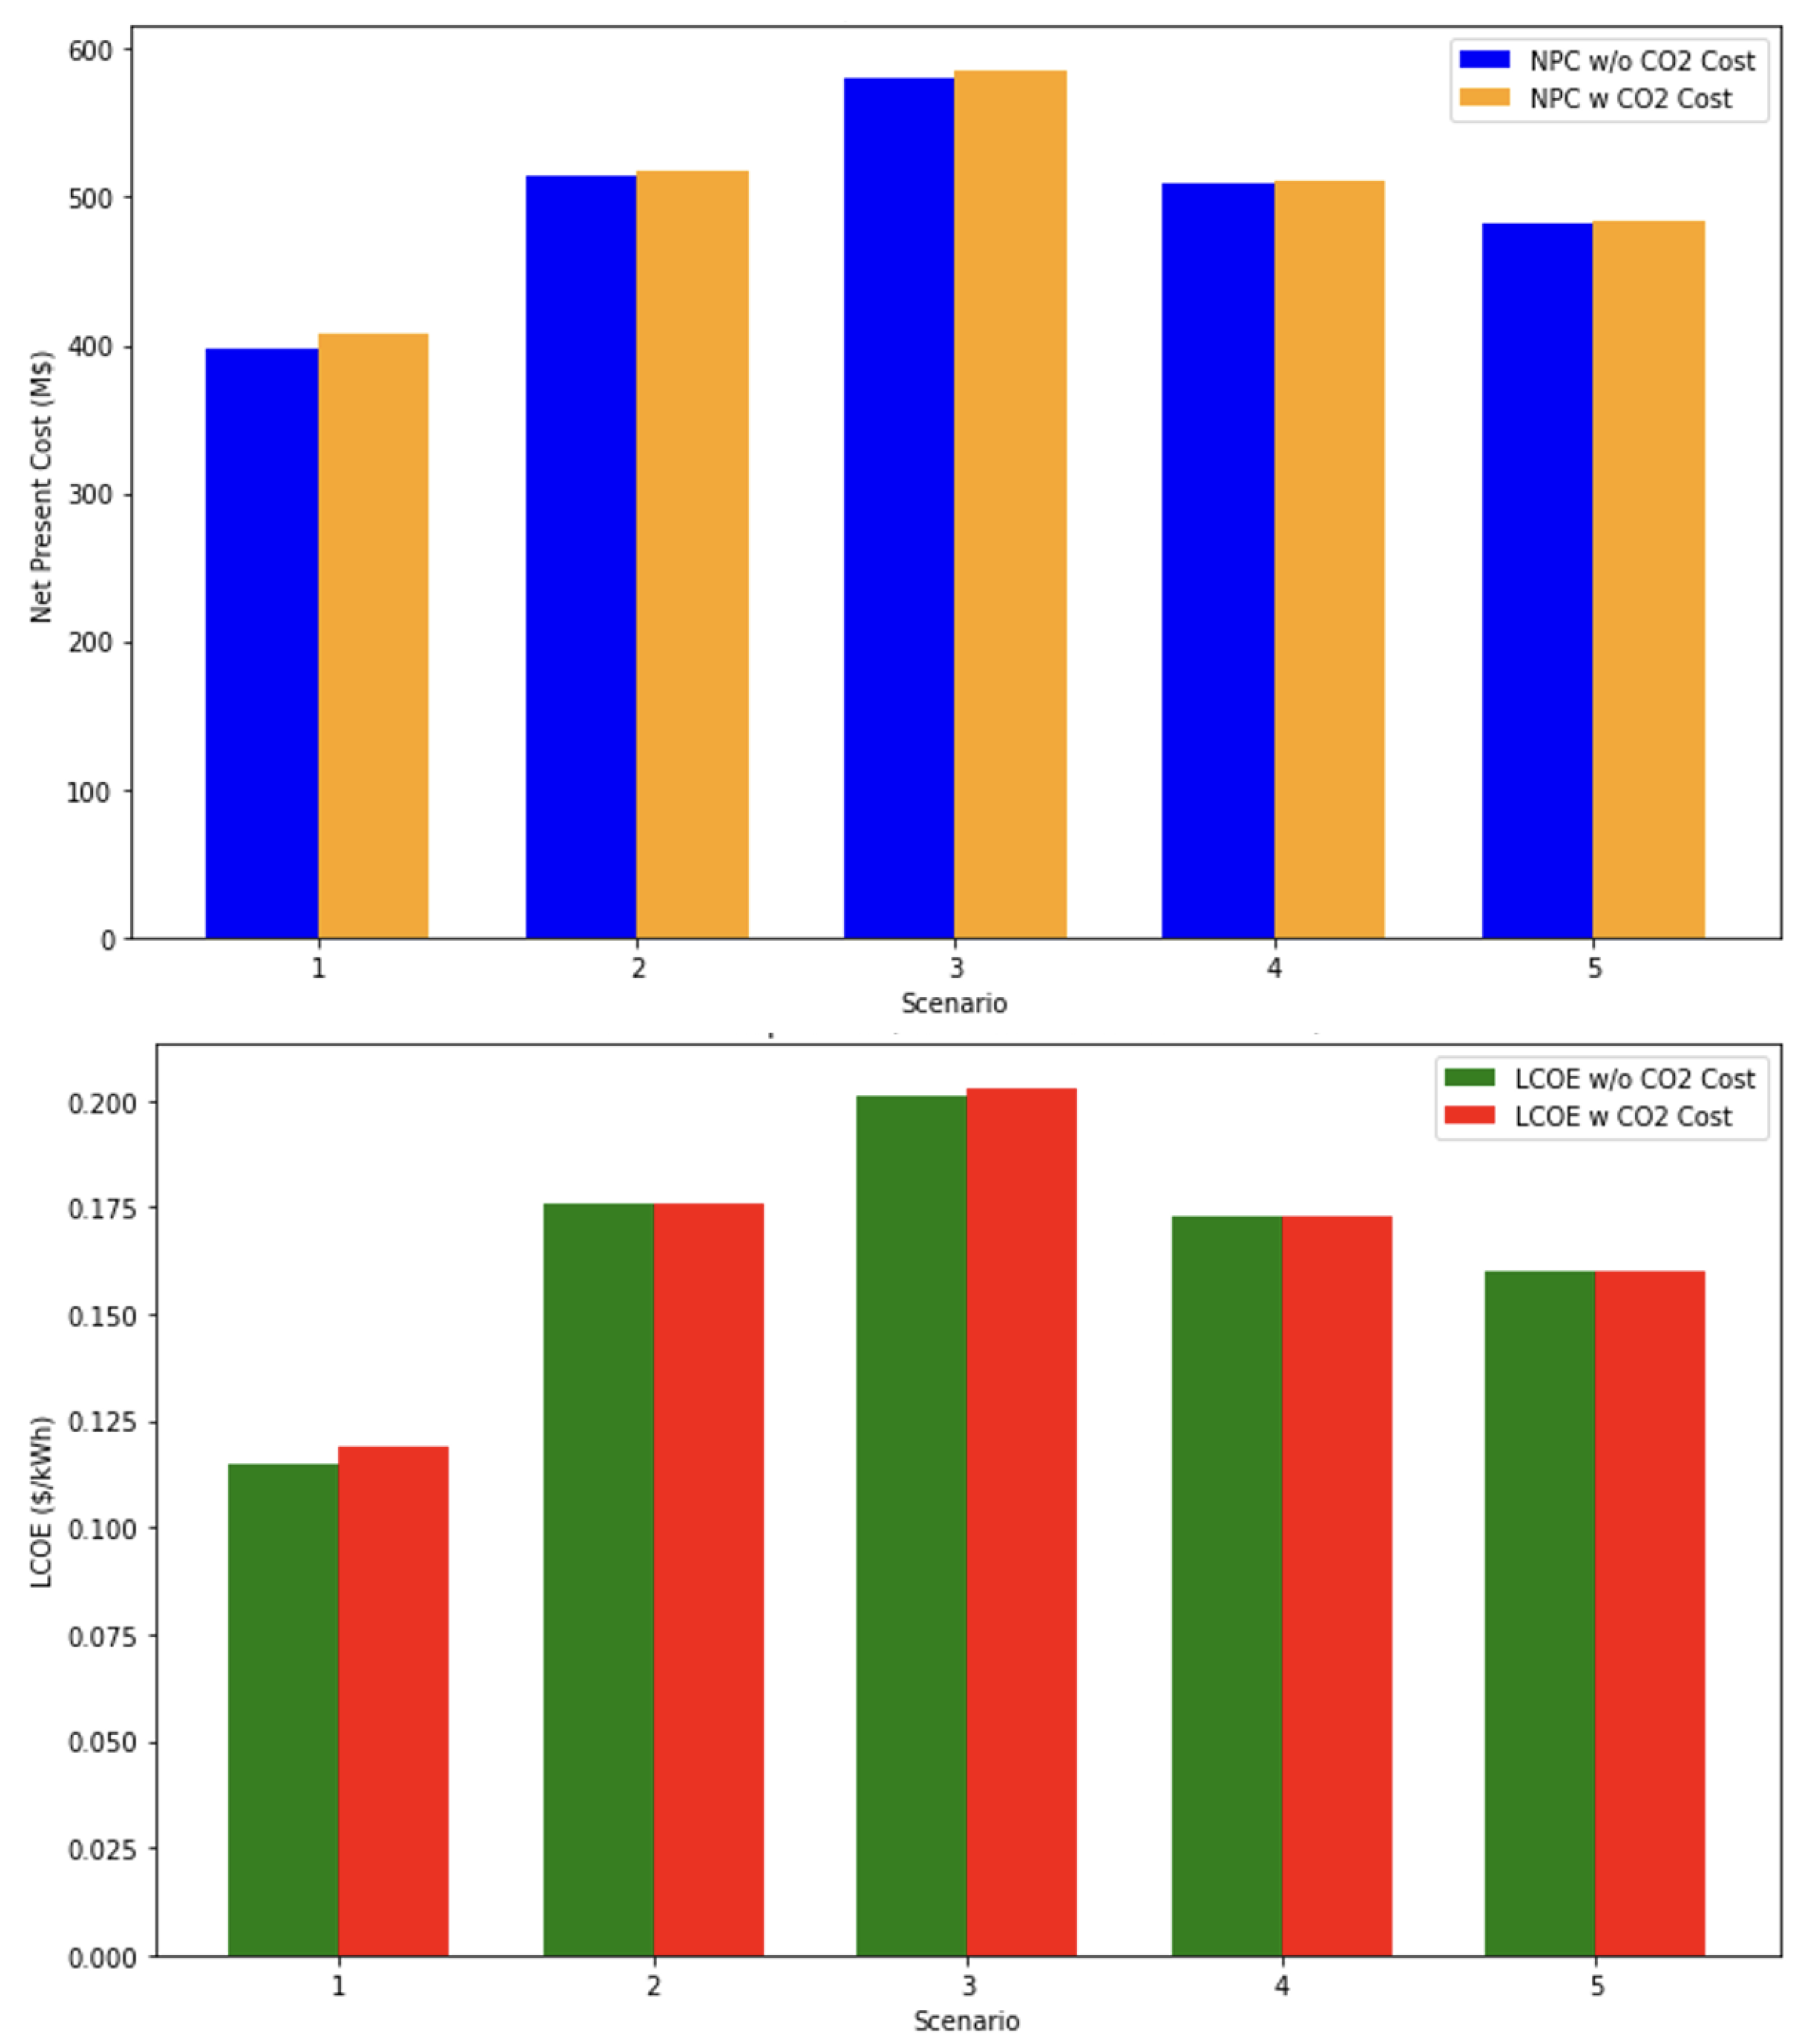
Figure 14.
Comparison of NPC and LCOE with and without CO2 Cost inclusion for Germany.
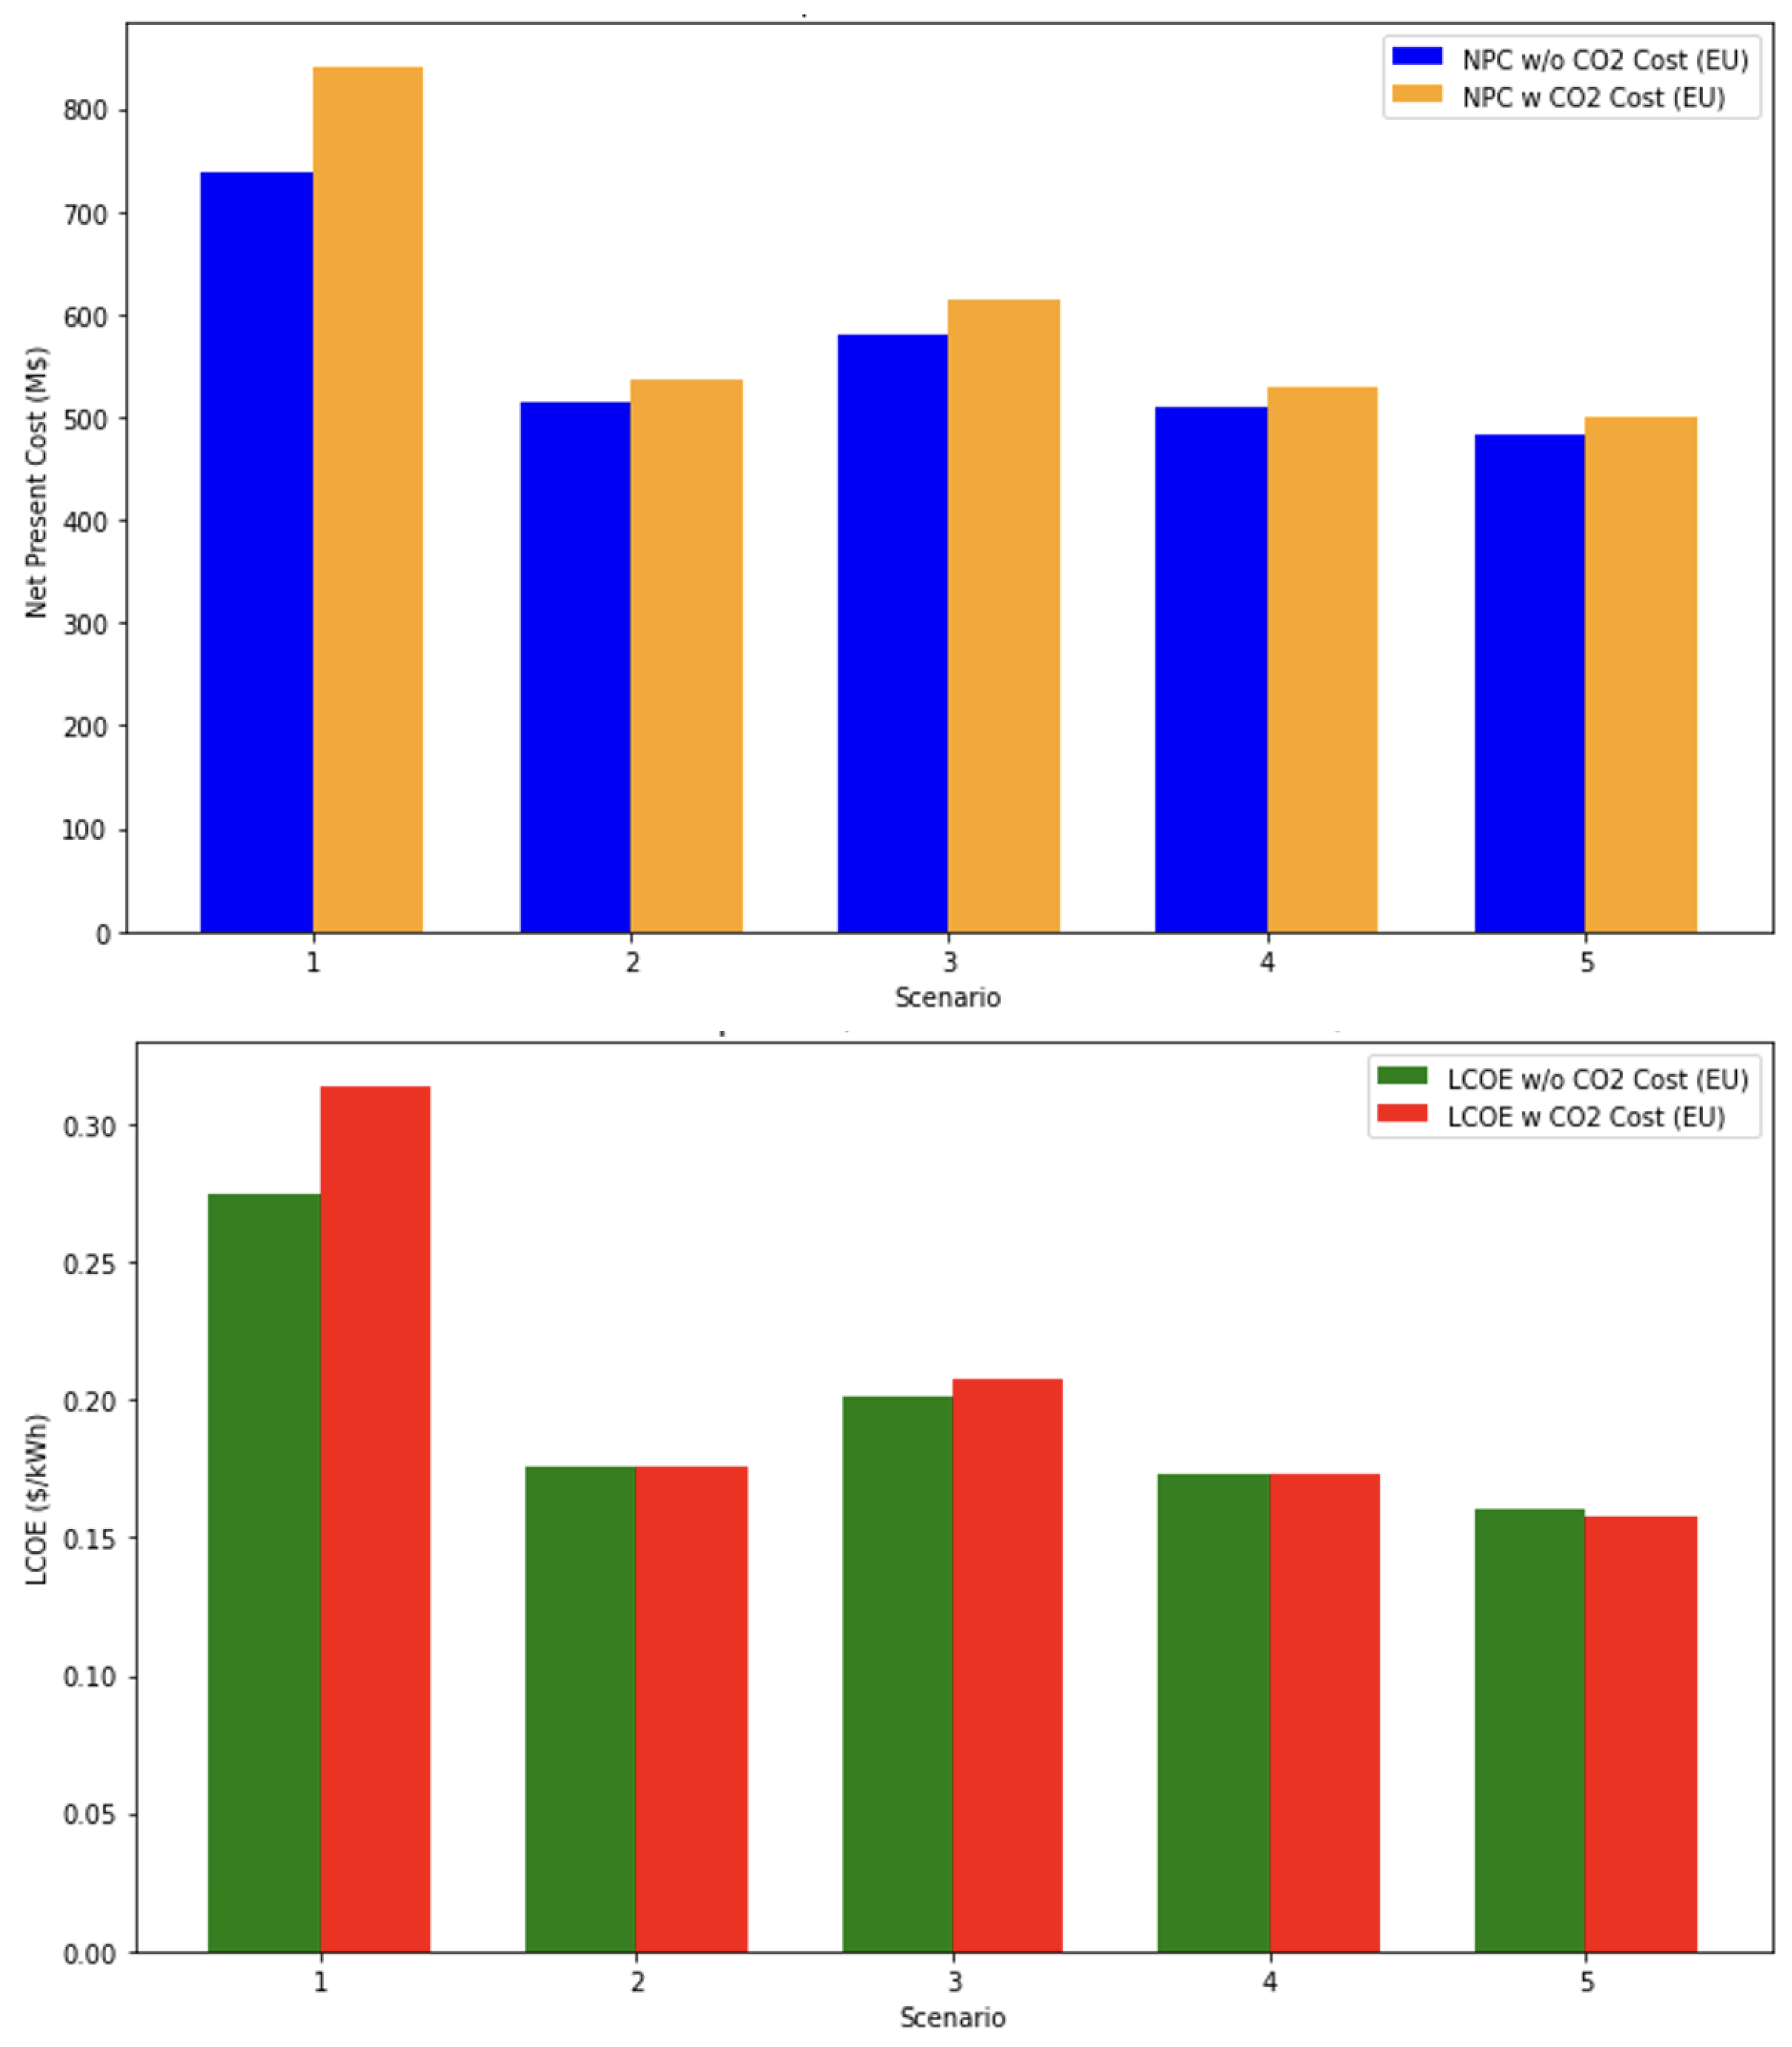
Figure 15.
Comparison of NPC and LCOE with and without CO2 Cost inclusion for US.
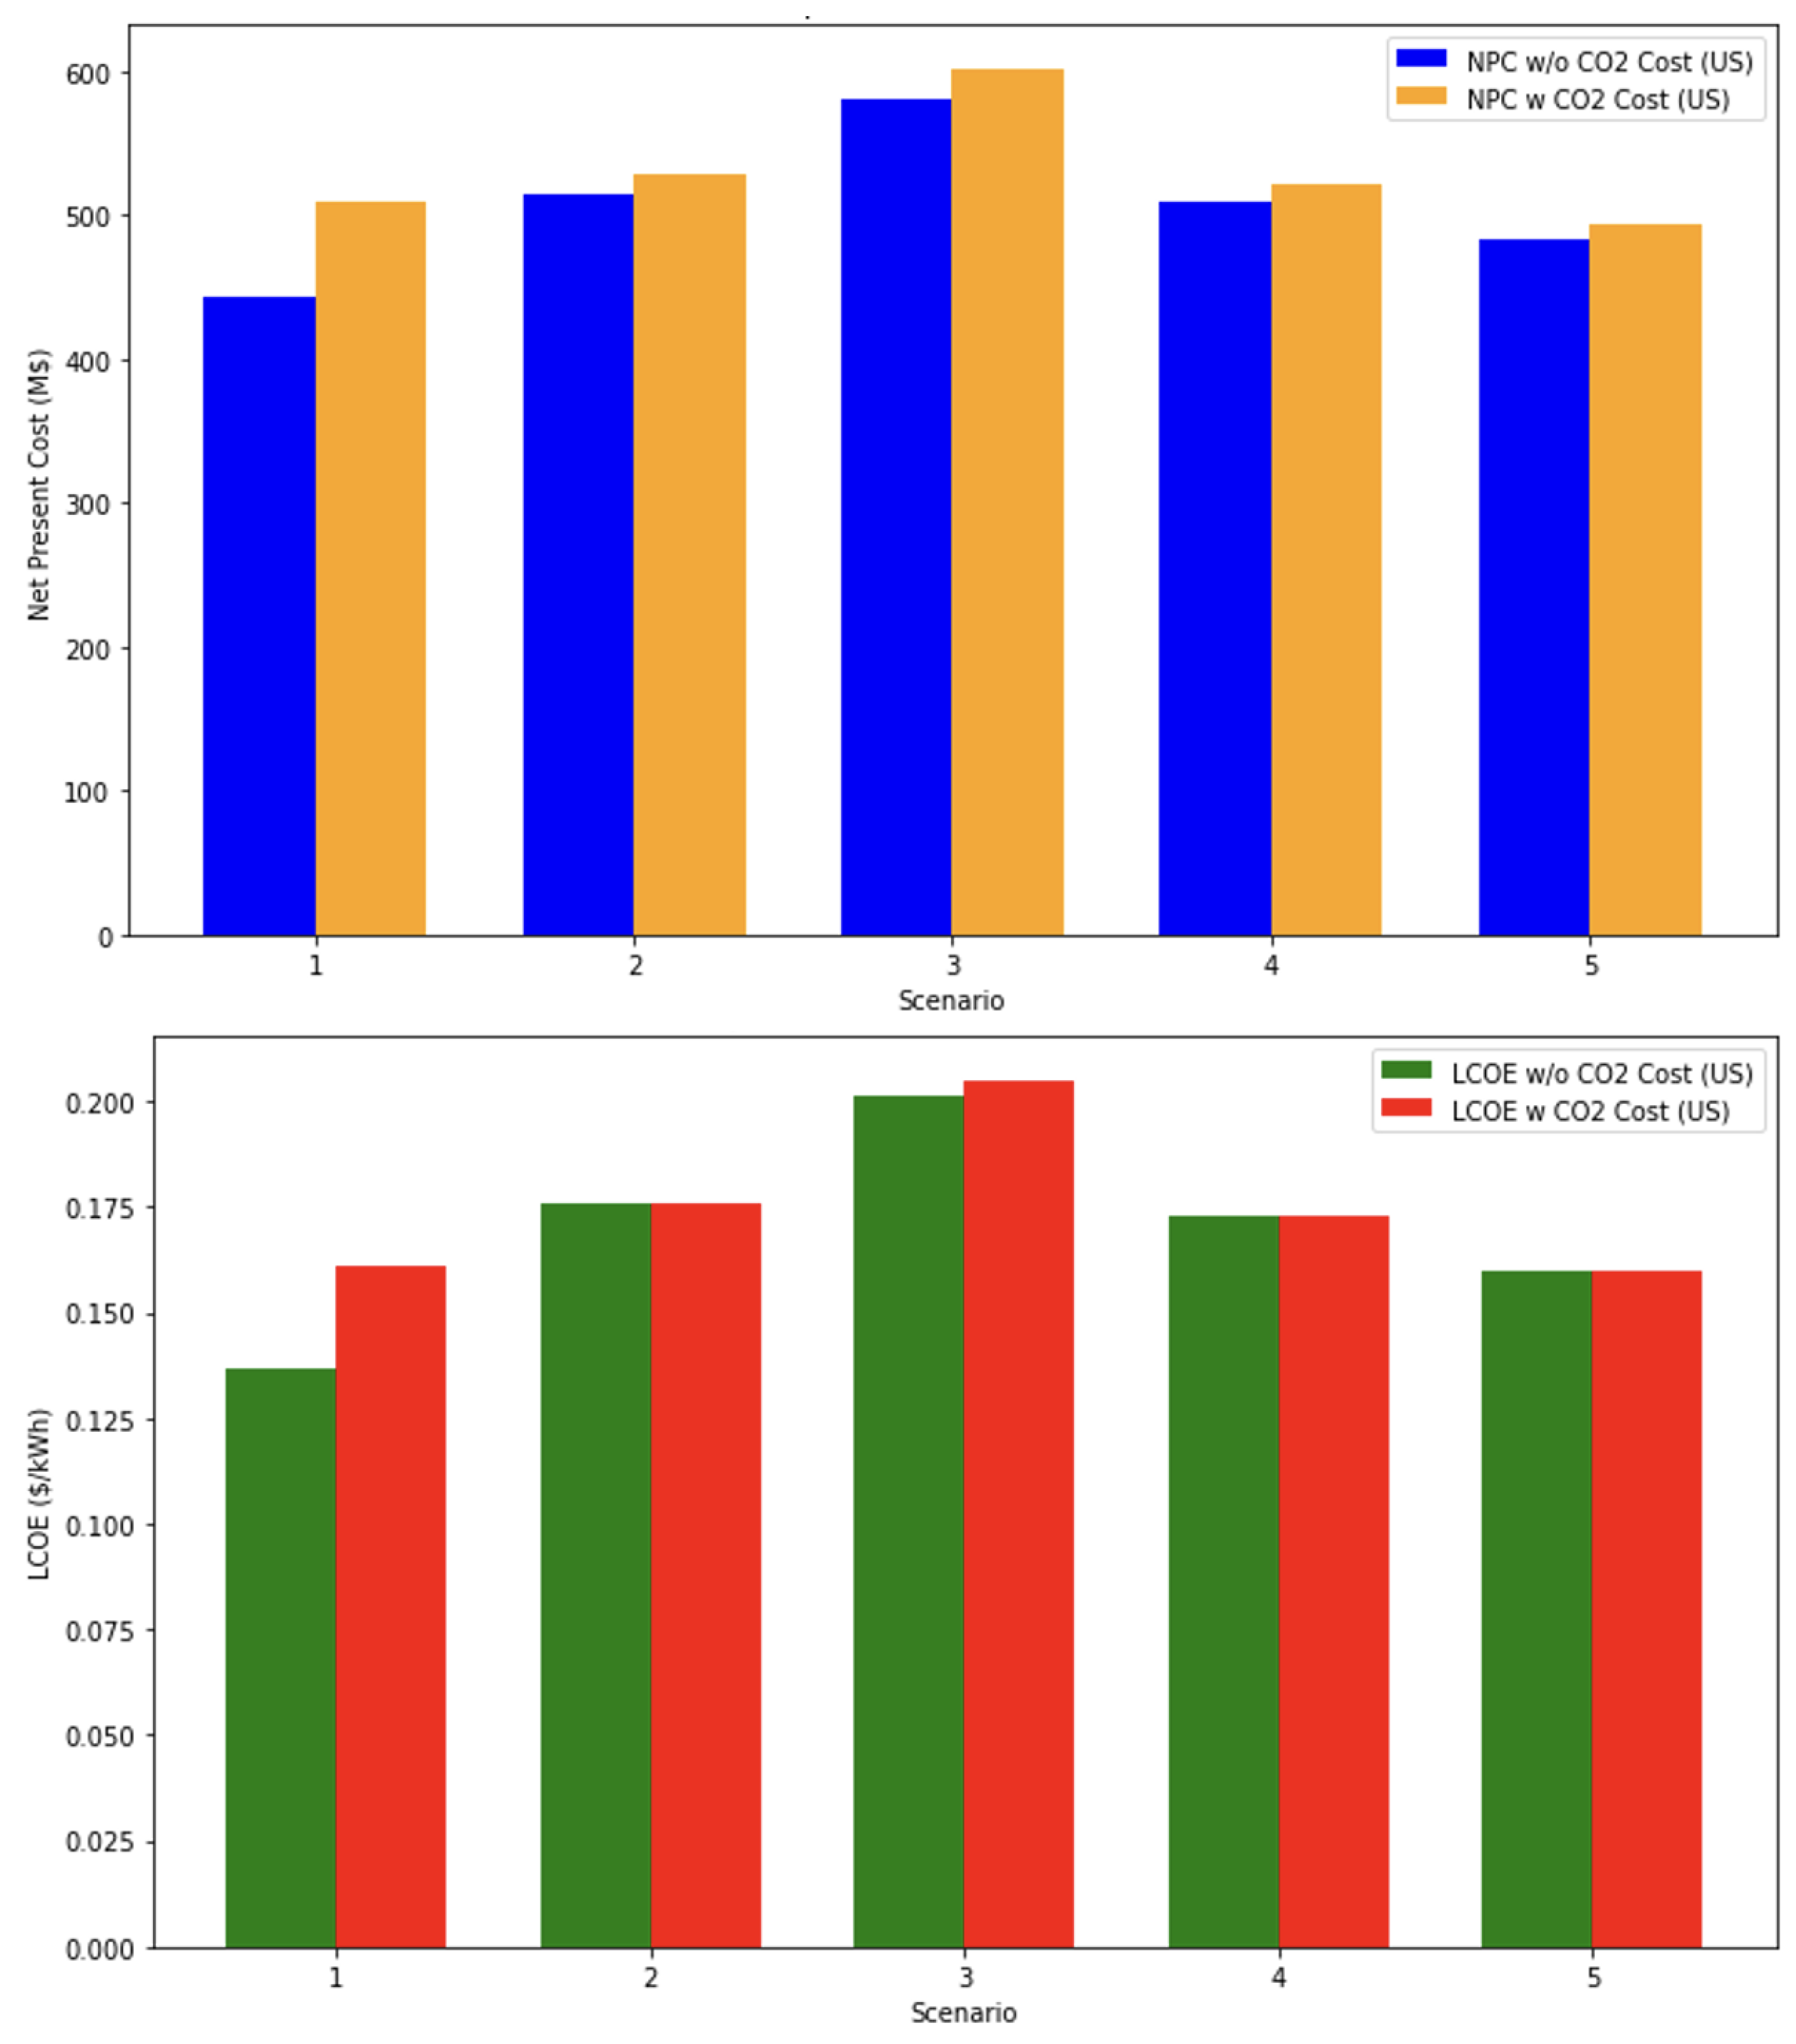

Table 1.
Summary of ELectric and Thermal Load Characteristics.
| Component | Average(kWh/day) | Average(kW) | Peak(kW) |
|---|---|---|---|
| Electric Load | 386,011.92 | 16,083.83 | 31,465.59 |
| Thermal Load | 193,005.94 | 8,041.91 | 15,732.79 |
Table 2.
Technical Specifications of Energy System Components.
| Component | Abbreviation | Details |
|---|---|---|
| BESS | BE | Initial SOC=40%, Minimum SOC=20% |
| Converter | CV | Efficiency=95% |
| Diesel Generator | DG | CHP Heat Recovery Ratio=25%, Min. Load Ratio=25%, Min. Runtime=30 min, Fuel=1.19$/L |
| Electric Load | - | Average=389,253.78kWh/day, Peak 31729.85kW, Load Factor=0.51, Industrial Type |
| Generic Electrolyzer | ET | Efficiency=85%, Minimum Load ratio=0% |
| Fuel Cell | FC | CHP Heat Recovery Ratio=60%, Min. Load Ratio=25%, Min. Runtime=0min, H2 Fuel= 1.58$/L |
| Hydrogen Tank | HT | Initial Tank Level=20% |
| Solar PV | PV | Derating Factor=80% |
| Wind Turbine | WT | Hub Height=80m |
| Thermal Load | - | Average=194,626.89kWh/day, Peak 15,864.92kW, Load Factor=0.51 |
| Boiler | BL | Boiler Efficiency=85% |
Table 3.
Cost, Operational Parameters, and CO2 Emissions of Energy System Components.
| Component | Capital Cost | Replacement Cost | O&M Cost | Lifetime |
|---|---|---|---|---|
| BESS[44] | $482/kWh | $482/kWh | $12/kWh/year | 365 cycles/year for 20 years |
| Converter | $300/kW | $300/kW | $0/kW/year | 20years |
| Diesel Generator | $500/kW | $500/kW | $0.03/kW/operating hour | 90,000hr |
| Electrolyzer[45][46] | $1,000/kW | $1,000/kW | $50/kW/year | 20 years |
| Fuel Cell[47] | $1,000/kW | $1,000/kW | $3.5/kW/operating hour | 80,000hr |
| Hydrogen Tank[48] | $507/kg | $507/kg | $60/kg/year | 20 years |
| Thermal Load Controller | $200/kg | $200/kg | $0/kg/year | 20years |
| Solar PV[49] | $876/kW | $876/kW | $7.7/kW/year | 20years |
| Wind Turbine[50] | $1,274/kW | $1,274/kW | $55/kW/year | 20years |
Table 4.
Financial Factors for the Energy System Analysis.
| Component | Content |
|---|---|
| Project lifetime | 20 years |
| Inflation rate | 3% |
| Discount rate | 6% |
| Diesel price | $1.19/L |
| Hydrogen price | $1.58/L |
Table 5.
Carbon Emission Trading System (ETS) Prices by Country.
| Country | Price in ETSs($/ton) |
|---|---|
| EU | 61.3 |
| UK | 45.06 |
| US | 38.59 |
| Japan | 36.91 |
| Korea | 6.3 |
Table 6.
Residential and Industrial Electricity Prices by Country.
| Country | Residential Price($/kWh) | Industrial Price($/kWh) |
|---|---|---|
| Germany[53] | 0.368 | 0.275 |
| US[54] | 0.162 | 0.137 |
| Korea[55] | 0.131 | 0.115 |
Table 7.
Description of Energy System Scenarios.
| Scenarios | Scenario Configuration | Description |
|---|---|---|
| Scenario 1 | On-Grid + BL | Base System (On Grid + Boiler) [The electricity rates for each country were calculated by reflecting them in On-Grid’s Power Grid Price.] |
| Scenario 2 | DG + WD + PV + BE | Diesel Generator + Renewable Energy System(Wind, Solar PV and BESS) without Decarbonization/Sector Coupling |
| Scenario 3 | DG + WD + PV + BE + HT + EL + TLC | Scenario 2 + Sector Coupling [Diesel Generator + Renewable Energy System(Wind, Solar PV and BESS) + Hydrogen System + TLC, but no Fuel Cell] |
| Scenario 4 | WD + PV + BE + HT + EL + FC | Scenario 2 + Decarbonization [Renewable Energy System + Hydrogen System + Fuel Cells, but no Diesel Generator and TLC] |
| Scenario 5 | WD + PV + BE + HT + EL + FC + TLC | Scenario 2 + Decarbonization + Sector-Coupling [All sectors included, but no Diesel Generator] |
Table 8.
Thermal Load Management and Energy Source Contribution Across Different Scenarios.
| Scenario | Thermal Load (MWh/yr) | BL (MWh/yr) | TLC(MWh/yr) | DG (MWh/yr) | FC (MWh/yr) | Excess Thermal (MWh/yr) |
|---|---|---|---|---|---|---|
| 1 | 71,038 | 71,038 | - | - | - | - |
| 2 | 71,038 | 71,038 | - | - | - | - |
| 3 | 71,038 | 32,518 | 21,192 | 25,995 | - | 8,438 |
| 4 | 71,038 | 71,059 | - | - | -20 | - |
| 5 | 71,038 | 41,872 | 145,203 | - | - | 116,037 |
Table 9.
Economic System Component Capacity Across Different Scenarios.
| Scenario | DG(kW) | PV(kW) | WD(kW) | BE(kWh) | ET(kW) | HT(kg) | CV(kW) | FC(kW) | TLC(kW) | Grid(kW) |
|---|---|---|---|---|---|---|---|---|---|---|
| 1 | - | - | - | - | - | - | - | - | - | 999,999 |
| 2 | - | 66,385 | 63,000 | 246,000 | - | - | 30,000 | - | - | - |
| 3 | 35,000 | 11,864 | 30,000 | 32,000 | 3,000 | - | 18,316 | - | 30,000 | - |
| 4 | - | 77,040 | 48,000 | 269,000 | - | - | 29,251 | 250 | - | - |
| 5 | - | 75,571 | 61,500 | 234,000 | - | - | 29.142 | - | 150,000 | - |
Table 10.
CO2 Emissions and Associated Costs.
| Section | Area | Scenario 1 | Scenario 2 | Scenario 3 | Scenario 4 | Scenario 5 |
|---|---|---|---|---|---|---|
| CO2 Emissions (ton/year) | - | 112,265 | 30,923 | 55,179 | 22,479 | 13,492 |
| CO2 | EU | 6,881,873 | 1,895,588 | 3,382,483 | 1,377,964 | 827,110 |
| Emission | US | 4,332,325 | 1,193,324 | 2,129,364 | 867,465 | 520,688 |
| Cost ($/year) | Korea | 707,272 | 194,816 | 347,629 | 141,618 | 85,005 |
Table 11.
NPC comparison reflecting electricity rates and CO2 Emission Cost.
| Country | CO2 Cost Inclusion | Scenario 1(M$) | Scenario 2(M$) | Scenario 3(M$) | Scenario 4(M$) | Scenario 5(M$) |
|---|---|---|---|---|---|---|
| Korea | X | 397 | 515 | 581 | 509 | 483 |
| O | 397 | 515 | 581 | 509 | 483 | |
| EU(Germany | X | 738 | 515 | 581 | 509 | 483 |
| O | 841 | 536 | 615 | 529 | 500 | |
| Korea | X | 444 | 515 | 581 | 509 | 483 |
| O | 509 | 528 | 602 | 522 | 494 |
Disclaimer/Publisher’s Note: The statements, opinions and data contained in all publications are solely those of the individual author(s) and contributor(s) and not of MDPI and/or the editor(s). MDPI and/or the editor(s) disclaim responsibility for any injury to people or property resulting from any ideas, methods, instructions or products referred to in the content. |
© 2024 by the authors. Licensee MDPI, Basel, Switzerland. This article is an open access article distributed under the terms and conditions of the Creative Commons Attribution (CC BY) license (http://creativecommons.org/licenses/by/4.0/).
Copyright: This open access article is published under a Creative Commons CC BY 4.0 license, which permit the free download, distribution, and reuse, provided that the author and preprint are cited in any reuse.


